Embed Size (px)
Citation preview

I
Strategic Management Accounting
Practices in Palestinian Companies:
Application of Contingency Theory
Perspective
Jafar Ojra
A thesis submitted for the degree of Doctor of Philosophy at the Norwich
Business School, University of East Anglia, United Kingdom
July 2014
©This copy of the thesis has been supplied on condition that anyone who consults it is understood to recognise
that its copyright rests with the author and that use of any information derived there from must be in accordance
with current UK Copyright Law. In addition, any quotation or extract must include full attribution.

II
To Palestine My Beloved Homeland
To My Parents for their endless love, support and encouragement
To My Wife for Her Love, Care and Support

III
“We know too well that our freedom is incomplete without the freedom of the
Palestinians.”
Nelson Mandela
“We (the Palestinians) are the people who experienced all types of death with all
methods of killing...even the most sophisticated of weapons were used on us
but.........we are the miracle that never dies...we are the miracle that cannot die”
Mahmoud Darwish

IV
‘In the name of Allah, the Entirely Merciful, the Especially Merciful.
All praise is due to Allah, Lord of the worlds
The Entirely Merciful, the Especially Merciful,
The Only Owner of the Day of Recompense.
It is You we worship and You we ask for help.
Guide us to the straight path
The path of those upon whom You have bestowed favour, not of those who have evoked Your
anger or of those who are astray’.
(Qur’an 1:1-7)

V
Acknowledgement
In the name of Allah (God), the Most Gracious and the Most Merciful. Praise be to Allah,
Lord of the Universe and to His Messenger, Muhammad PBUH.
First and foremost, I am very grateful to Allah, the Almighty for giving me the strength,
courage, peace and blessings to complete this study successfully.
With this dissertation, the long journey of my doctorate studies in the United Kingdom has
come to an end. All successes, challenges, and frustrations I’ve gone through were part of this
journey that required patience and self-determination.
My research project could not have been accomplished without the help and support of people
and institutions, which contributed to many parts of this research.
First of all, I would like to warmly thank Professor Michael Tayles to act as an external
examiner for my PhD viva examination and Mr Peter Russell to act as an internal examiner.
Thank you for your time and your valuable comments.
I would like to extend my heartfelt thanks to my academic supervisors Dr Pinar Guven Uslu
and Professor Ian Dewing for their encouragements, time, patience and guidance. Without
their endeavours, this research is not a reality.
I owe special thanks to Professor Fiona Lettice, Professor Naresh Pandit, Dr Yossi
Lichtenstein, Dr Simon Cadez, Dr Fadi Kattan, Dr Roula Dik and Dr Awadh Al-mamari for
their extremely helpful comments and their assistance at various stages of this research.
Additionally, I am sincerely indebted to the respondents who had participated in the survey
and the interviews. I am indebted to their cooperation, time and support.
I would also like to express my appreciation to the University of East Anglia and Norwich
Business School for funding my PhD study. Moreover, I would like to thank all staff at INTO
UEA for their encouragements and constant support.

VI
I am thankful to my lovely friends: Dr Mohannad Kafri, Dr Fabiola Gomez, Dr Samina
Walimohamed, Richard Carter, Mahmoud Nabahin, Qais Najjar, Ben Reynolds, Adrian
Leeder, Basma Hakim, Helen Christopher, Simon Barne, Catherine Baker, John Armstrong
and his partner Ruth and all my other friends for listening, offering me advice, and supporting
me through this entire process.
Last but not least, all my profound gratitude is also addressed to my family. Without their
encouragements, patience and love, this long and abroad study would not be possible.
I am especially grateful to my parents, who supported me emotionally and financially. I
always knew that you believed in me and wanted the best for me. Thanks for your constant
prayers for my success and health. I certainly would not be where I am today without your
nurture, guidance, love and care throughout my childhood, my teenage years, and young adult
years. You are, and continue to be, one of my life's biggest blessings. Thanks, Mama and
Papa.
In addition, I am indebted to all my brothers and sisters Mahmoud, Hamza, Yousef, Amar,
Ahmed, Khaled, Hala and Salam for their love and support. I would also like to thank my
father in law Dr Taher Faroun for his constant support and my mother in law for her trust in
me and her prayers for my success.
Most of all, my special thanks and love to my dear wife, Dr Mai Faroun for her endless and
tremendous support, sacrifice and understanding throughout my studies.
I am deeply grateful for your love and unstinting care and support. You have inspired me to
complete this study, thanks for everything you’ve done for me ‘Habibi’.
Once again, to all who have contributed directly and indirectly to the completion of this
research, thank you very much.

VII
Abstract
This study uses a quantitative methodology to explore the impact of contingency factors on
use of strategic management accounting techniques (SMA), and combined impact of SMA
Usage and contingency factors on organisational performance in a less developed country
(LDC) context.
The exploratory framework included two main dependent variables, namely SMA Usage and
organisational performance. For the former, this study gauged the impact of perceived
environmental uncertainty (competitive intensity and market turbulence), business strategy
(prospector /defender), organisational structure (formalisation and decentralisation),
organisational size and organisational technology on SMA Usage. For the latter, this study
explored two dimensions of organisational performance (financial and non-financial) and how
the conceptualised dimension(s) of organisational structure, SMA Usage, perceived
environmental uncertainty and organisational strategy impact on performance.
Data were collected from Palestinian large companies (cross sectors); was used to test the
conceptualised framework. The analysis was based on 175 responses, representing a response
rate of 43.75%. The SPSS package was used to confirm the reliability and validity of factors
and also statistically estimated the association coefficients of the conceptualised relationships
in the framework.
The findings from this study suggest that the usage of SMA techniques is influenced by a
number of factors. These are perceived environmental uncertainty (Market Turbulence) and
organisational technology. Also, larger organisations tend to use more SMA techniques than
smaller.

VIII
There is also evidence from this study that suggests defender or prospector type strategy
would influence the usage of strategic management accounting techniques.
This study also suggests that SMA usage has a direct positive association with non-financial
performance. Perceived Environmental Uncertainty (Competitive Intensity) has a positive
influence on non-financial performance but not on financial performance. From the overall
evidence it appears that large Palestinian companies give more importance to non-financial
element of organisational performance.
The conclusion to this study pinpointed the core empirical points from this research. This
study underlines the central importance of SMA usage to achieving strategic goals and
enhancing performance in organisations. To maximize strategic alignment however,
organisations must ensure that the right steps are taken to manage the internal and external
factors and achieve a fit. Essentially too, for this strategic alignment target, and the goal of
improving performance, organisations must also bear in mind the national culture and Islamic
Sharia regulations driven expectations.

IX
Table of Contents 1. Introduction to the Study .................................................................................................................. 1
1.1 Introduction ....................................................................................................................................... 1
1.2 Background of the Study ................................................................................................................... 1
1.3 Research Rationale and Importance .................................................................................................. 2
1.4 Research Aim and Objectives ........................................................................................................... 5
1.5 Research Methodology ...................................................................................................................... 7
1.6 Structure of the Thesis ....................................................................................................................... 8
2. Explaining the LDCs and Palestinian Context of the Study ........................................................ 10
2.1 Introduction ..................................................................................................................................... 10
2.2 Why Explore the Less Developed Countries (LDCs) Context? ...................................................... 10
2.3 Why Explore the Palestinian Context? ............................................................................................ 11
2.4 Background of the Palestinian Economy ........................................................................................ 13
2.4.1 Israel's Occupying Influence on Palestine................................................................................ 13
2.4.2 The Palestinian Economy under Uncertainty ........................................................................... 16
2.5 Conclusion to the Chapter ............................................................................................................... 23
3. Literature Review - Contingency Theory and Strategic Management Accounting Techniques
............................................................................................................................................................... 24
3.1 Introduction ..................................................................................................................................... 24
3.2 The Relevant Literature for this Study ............................................................................................ 24
3.2.1 The Contingency Theory Lens of Managerial Accounting Research & Conceptualisation for
this Study .......................................................................................................................................... 24
3.2.2 The Contingency Perspective of Managerial Accounting Research: The Core Variables ....... 29
3.3 Strategic Management Accounting (SMA) Techniques .................................................................. 33
3.4 Organisational Environment ............................................................................................................ 45
3.5 Organisational Strategy ................................................................................................................... 67
3.6 Organisational Performance ............................................................................................................ 72
3.7 Conclusion to the Chapter ............................................................................................................... 76
4. Research Framework and Specification of Research Hypotheses .............................................. 78
4.1 Introduction ..................................................................................................................................... 78
4.2 The Research Framework and Justification .................................................................................... 78
4.3 Specifying the hypotheses ............................................................................................................... 83
4.3.1 Perceived Environmental Uncertainty (PEU) Related Hypotheses (H1 – H4) ........................ 84
4.3.2 Internal Environment/Organisational Factors related Hypotheses (H5 – H8) ......................... 90
4.3.3 Business/Organisational Strategy related Hypotheses (H9 – H11) .......................................... 96
4.3.4 Strategic Management Accounting Technique Usage related Hypothesis (H12) .................... 99
4.4 Conclusion to the Chapter ............................................................................................................. 102
5. Research Methodology .................................................................................................................. 104
5.1 Introduction ................................................................................................................................... 104
5.2 The Research Design ..................................................................................................................... 105

X
5.3 Research Paradigms and Assumptions .......................................................................................... 106
5.4 The Philosophical Position of this Study and Why? ..................................................................... 110
5.5 The Quantitative Tool for this Study ............................................................................................. 112
5.5.1 Quantitative Research Method ............................................................................................... 112
5.5.2 Justifying use of Quantitative Approach in the Study............................................................ 113
5.6 The Data Collection Process ......................................................................................................... 117
5.6.1 Data Collection Method: The Survey Instrument .................................................................. 117
5.6.2 The Questionnaire Design Process and Study Sample........................................................... 117
5.6.2.1 Designing the Questionnaire ............................................................................................... 117
5.7 The Research Instrument ............................................................................................................... 129
5.8 The Multivariate Steps for this Study ............................................................................................ 139
5.8.1 Reliability and Validity in a Quantitative Research ............................................................... 139
5.8.2 Data Analysis in this Study .................................................................................................... 143
5.9 Conclusion to the Chapter ............................................................................................................. 149
6. Data Analyses: Descriptive Statistics, Reliability and Validity of Factors ............................... 150
6.1 Introduction to the Chapter ............................................................................................................ 150
6.2 Normality of Data Distribution ..................................................................................................... 151
6.3 Reliability Statistics of Variables .................................................................................................. 152
6.3.1 Reliability Statistics for the Dependent Variables ................................................................. 153
6.3.2 Reliability Statistics for the Other Contingency (Independent) Variables ............................. 156
6.4 Validity of Variables: Factor Analyses ......................................................................................... 161
6.4.1 Correlation Analyses .............................................................................................................. 161
6.4.2 Descriptive Findings for all Variables in the Conceptualised Framework ............................ 162
6.5 Factor Analyses ............................................................................................................................. 172
6.5.1 Factor Analysis of the Strategic Management Accounting Techniques Usage ..................... 172
6.5.2 Factor Analysis of the other Contingency Variables in the Framework ................................ 175
6.6 Conclusion to the Chapter ............................................................................................................. 182
7. Regression Analyses, Statistical Assessment of Hypotheses and Discussion of Findings ........ 184
7.1 Introduction to the Chapter ............................................................................................................ 184
7.2 Sectoral Analysis ........................................................................................................................... 184
7.2.1 The Cross-Industry Comparative Evidence: Strategic Management Accounting Usage (SMAU)
......................................................................................................................................................... 185
7.2.2 The Cross-Industry Comparative Evidence: Other Contingency Variables .......................... 186
7.2.3 Evaluating the Similarities between the Sectors .................................................................... 187
7.3 The Regression Results from this Study ....................................................................................... 188
7.3.1 Regression Analysis Results: Dependent Variable – Strategic Management Accounting
Techniques Usage (SMAU) ............................................................................................................ 192
7.3.2 Regression Analysis Results: Dependent Variable – Organisational Performance (OP) ....... 194
7.3.3 Regression Analysis Results: Dependent Variable – Organisational Structure (OSTR) ....... 196
7.3.4 The Relationship between Perceived Environmental Uncertainty (PEU) and Organisational
Strategy (OS) .................................................................................................................................. 199

XI
7.4 Discussion of Findings .................................................................................................................. 200
7.4.1 Culture and Islamic Influence on Contingency Dynamics..................................................... 205
7.4.2 The association between Perceived Environmental Uncertainty and Organisational/Business
Strategy ........................................................................................................................................... 207
7.4.3 The association between Perceived Environmental Uncertainty and Organisational Structure
......................................................................................................................................................... 209
7.4.4 The association between Perceived Environmental Uncertainty and Organisational
Performance .................................................................................................................................... 212
7.4.5 The association between Perceived Environmental Uncertainty and Strategic Management
Accounting Usage ........................................................................................................................... 215
7.4.6 The association between Organisational Technology and Strategic Management Accounting
Usage ............................................................................................................................................... 218
7.4.7 The association between Organisational Size and Strategic Management Accounting Usage
......................................................................................................................................................... 221
7.4.8 The association between Organisational Structure and Strategic Management Accounting
Usage ............................................................................................................................................... 223
7.4.9 The association between Organisational Structure and Organisational Performance ............ 226
7.4.10 The association between Organisational/Business Strategy and Strategic Management
Accounting Usage ........................................................................................................................... 229
7.4.11 The association between Organisational/Business Strategy and Organisational Structure.. 232
7.4.12 The association between Organisational/Business Strategy and Organisational Performance
......................................................................................................................................................... 234
7.4.13 The association between Strategic Management Accounting Usage and Organisational
Performance .................................................................................................................................... 236
7.5 Conclusion to the Chapter ............................................................................................................. 239
8. The study Conclusions, Contributions, Limitations and Future Research Directions ........... 242
8.1 Introduction ................................................................................................................................... 242
8.2 The Study Conclusions .................................................................................................................. 242
8.3 The Contributions of the Study ..................................................................................................... 246
8.3.1 The Theoretical Contributions ............................................................................................... 246
8.3.2 The Managerial Contributions ............................................................................................... 250
8.4 The Study Limitations ................................................................................................................... 252
8.5 The Directions for Future Research .............................................................................................. 254
References .......................................................................................................................................... 256
Appendices ......................................................................................................................................... 294
Appendix 1: English Version of the Questionnaire ........................................................................ 294
Appendix 2: Arabic Version of the Questionnaire .......................................................................... 300
Appendix 3: Covering Letter of the Survey Questionnaire in English ........................................... 305
Appendix 4: Covering Letter of the Survey Questionnaire in Arabic ............................................. 306
Appendix 5: Glossary of terms which provided to respondents ..................................................... 307

XII
Index of Tables
Table 2.1: Number of Establishments and Employment by Economic Activity 2009.......................19
Table 2.2: Company Size based on Employment Size……………………………………………....21
Table 2.3: Definition of the main Sectors in the Palestinian Economy………………………...…...22
Table 3.1: Some selected studies on Contingency Approach and the Explored Variables…………30
Table 4.1: A Summary of the Hypotheses for this study…………………………………………..103
Table 5.1: Four categories of Scientific Paradigms and their Elements…………………………...108
Table 5.2: The Strengths of Quantitative Research………………………………………………..113
Table 5.3: Methodological Precedence in past studies on SMA & other Contingency
Perspectives………………………………………………………………………………………...115
Table 5.4: The Population for this Study…………………………………………………………..119
Table 5.5: The Pilot-Testing Demographics……………………………………………………….123
Table 5.6: The Sample of this Survey……………………………………………………………...125
Table 5.7: Sector by Sector Responses and Percentage of Total Response………………………..127
Table 5.8: The Variables for Measuring the Framework, and their Sources……………………....137
Table 5.9: The Indicators of Reliability of Research Measures…………………………………....140
Table 5.10: The Indicators of Validity of Research Measures……………………………………..141
Table 5.11: Methodological Steps Taken to Ensure Reliability & Validity in this Study………....142
Table 6.1a: Demographics of Respondents and Companies that participated in the Study.............150
Table 6.1b: Reliability Statistics of SMA Factors………………………………………………....154
Table 6.2: Reliability Statistics for the other Contingency Factors in the Framework…………....159
Table 6.3: Disturbing Effect of PEU-COMPINT (item 5) on other Items & Constructs………....162
Table 6.4: Measures of Perceived Environmental Uncertainty (PEU)…………………………....164
Table 6.5: Measures of Organisational Strategy (OS)…………………………………………….165
Table 6.6: Measures of Organisational Size (OSZ)……………………………………………….165
Table 6.7: Measures of Organisational Technology (OT)………………………………………...166
Table 6.8: Measures of Organisational Structure (OSTR)………………………………………..167
Table 6.9: Measures of Organisational Performance (OP)……………………………………….169
Table 6.10: Measures of Strategic Management Accounting Usage (SMAU)....………………...171
Table 6.11: Validity Statistics of SMAU Factors………………………………………………...173
Table 6.12: Inter-Item Correlation Matrix for SMAU Factors…………………………………...174
Table 6.13: Validity Statistics for the other Contingency Factors in the Framework……………178
Table 6.14: Component Correlation Matrix……………………………………………………...181
Table 7.1: ANOVA Scores of Variables within Industry Groups for SMAU ..............…………185
Table 7.2: ANOVA Scores of Variables within Industry Groups for other Contingency
Variables………………………………………………………………………………………….186

XIII
Table 7.3: Collinearity Diagnostics for Dependent Variable SMAU……………………………190
Table 7.4: Collinearity Diagnostics for Dependent Variable Organisational Performance……..190
Table 7.5: Inter-Constructs Correlation for Dependent Variable SMAU………………………..191
Table 7.6: Inter-Construct Correlation for Dependent Variable Organisational Performance-Non-
Financial…………………………………………………………………………………………..191
Table 7.7: Inter-Construct Correlation for Dependent Variable Organisational Performance-
Financial…………………………………………………………………………………………..191
Table 7.8: Bivariate Correlation of Perceived Environmental Uncertainty (Competitive Intensity &
Market Turbulence) and Organisational Structure (Formalisation & Decentralisation)…………198
Table 7.9: Multivariable Regression: Coefficients and Significance Level: SMAU (Dimensions &
Summation) .................……………………………………………………………………………202
Table 7.10: Multivariable Regression: Coefficients and Significance Level: Organisational
Performance (Financial & Non-Financial)………………………………………………………..203
Table 7.11: A Summary of the Results of the Hypotheses Testing………………………………204

XIV
Index of Figures
Figure 4.1: The Conceptual Framework of the Research………………………………………... 80
Figure 5.1: Questionnaire Development Process…………………………………………………118
Figure 5.2: The Guide for Principal Component Analysis in this Study…………………………147
Figure 7.1: The Regression Results for SMAU…………………………………………………..192
Figure 7.2: The Regression Results for Organisational Performance-Financial…………………195
Figure 7.3: The Regression results for Organisational Performance-Non-Financial…………….195
Figure 7.4: The Regression Results for Organisational Structure (Formalisation &
Decentralisation)…………………………………………………………………………………..197
Figure 7.5: The Association between Perceived Environmental Uncertainty (PEU) and Organisational
Strategy……………………………………………………………………………………………199
Figure 7.6: Graphical Presentation of Contingency Perspective of Strategic Management Accounting
Usage and Organisational Performance in Palestinian Companies……………………………….241
XV
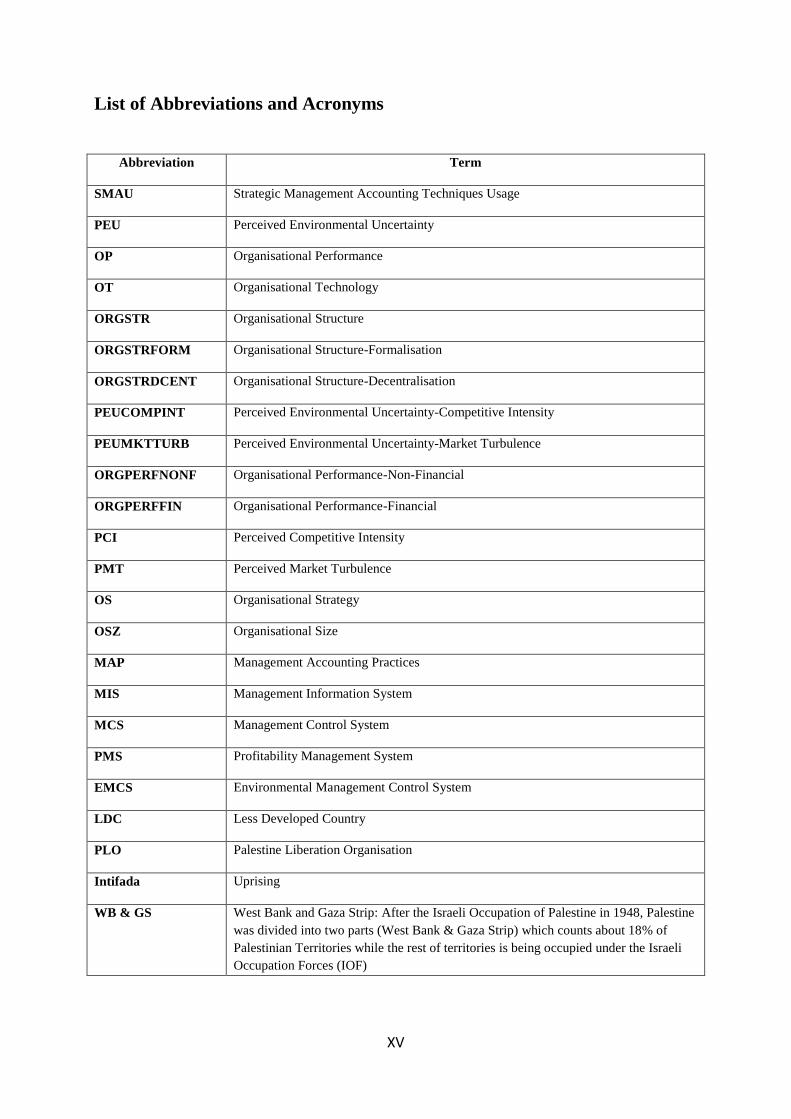
List of Abbreviations and Acronyms
Abbreviation Term
SMAU Strategic Management Accounting Techniques Usage
PEU Perceived Environmental Uncertainty
OP Organisational Performance
OT Organisational Technology
ORGSTR Organisational Structure
ORGSTRFORM Organisational Structure-Formalisation
ORGSTRDCENT Organisational Structure-Decentralisation
PEUCOMPINT Perceived Environmental Uncertainty-Competitive Intensity
PEUMKTTURB Perceived Environmental Uncertainty-Market Turbulence
ORGPERFNONF Organisational Performance-Non-Financial
ORGPERFFIN Organisational Performance-Financial
PCI Perceived Competitive Intensity
PMT Perceived Market Turbulence
OS Organisational Strategy
OSZ Organisational Size
MAP Management Accounting Practices
MIS Management Information System
MCS Management Control System
PMS Profitability Management System
EMCS Environmental Management Control System
LDC Less Developed Country
PLO Palestine Liberation Organisation
Intifada Uprising
WB & GS
West Bank and Gaza Strip: After the Israeli Occupation of Palestine in 1948, Palestine
was divided into two parts (West Bank & Gaza Strip) which counts about 18% of
Palestinian Territories while the rest of territories is being occupied under the Israeli
Occupation Forces (IOF)

Chapter 1: Introduction to the Study
Jafar Ojra - 1 -
1. Introduction to the Study
1.1 Introduction
The focus in this chapter is to provide a general introduction to this thesis. In
doing this, six central contexts are addressed, namely the background of the
study (Section 1.2), the research rationale and importance, which justifies the
need for this research and the theoretical perspectives guiding the framework
(Section 1.3), the research aim and objectives (Section 1.4), the research
methodology and brief justification (Section 1.5), and the structure of the thesis
(Section 1.6).
1.2 Background of the Study
Contingency literature underlines the need for organisations to ensure appropriate strategic
approach that allows them to effectively adapt their internal and external environmental
factors to enable them compete favourably in the marketplace (e.g., Pratt, 2004; Miles, 2003).
A critical organisational activity in this strategic drive and the goal of competing favourably
in the marketplace is effective decision making. In this effective decision making regard,
scholars not only emphasise the important role that strategic management accounting (SMA)
plays, but also underline the need to enhance the understanding of the contingency
perspective.
Successful managerial decisions improve overall organisational profitability (Raaij et al.,
2003; Lee & Park, 2006). Accounting is relevant to management (Roslender & Hart, 2002),
and the history of management accounting reflects “significant scholarly and practitioner”
effort (Roslender & Hart, 2002, p. 255) geared towards enhanced managerial decisions for
strategic positioning (e.g., Roslender, 1995, 1996; Roslender & Hart, 2002) and overall
organisational performance (e.g., Bromwich, 1990; Cadez & Guilding, 2008; Roslender &

Chapter 1: Introduction to the Study
Jafar Ojra - 2 -
Hart, 2002; Sidhu & Roberts, 2008). This management accounting perspective builds on the
strategic management accounting foundation (Simonds, 1981).
A core feature of modern-day business environment is fast evolving customer demands
(Cadez & Guilding, 2008). To survive in such circumstance, organisations must embrace
market orientation. Organisations that do that will profitably satisfy customers (Roslender &
Hart, 2003; Opute, 2009), consolidate competitive advantage (Perera et al., 1997), and
achieve enhanced performance (Slater & Narver, 1994; Henri, 2006).
Therefore, SMA advocates contend that, for a more market oriented focus, strategically
tailored accounting is pertinent. Put in accounting literature terms, “to survive, a firm must
continue to offer the cheapest way for consumers to obtain the desired bundle of attributes”
(Langfield-Smith, 2008, p.209), and organisations must align their management accounting
activities towards this target (Bromwich, 1990).
1.3 Research Rationale and Importance
"Today virtually no one in business makes a decision without acquiring
information of some kind. The quality of the decision depends on the quality of
the information and how it is used." (Lewis & Chambers, 1989, p. 505).
Strategic management accounting (SMA), which was first mentioned by Simmonds (1981) in
the UK professional magazine, Management Accounting (p.12), would aid quality decision
making if management accounting information is appropriately supplied. Given its
importance to quality decision making, scholars have increasingly argued in favour of SMA
or strategic cost management (SCM) (across the Atlantic) (e.g., Bromwich, 1990; Bromwich
& Bhimani, 1994; Johnson & Kaplan, 1987; Miller & O’Leary, 1994; Roslender, 1996;
Kaplan & Norton, 1992, 1996; Roslender & Hart, 2002a, 2002b, 2003; Shank, 2007;
Anderson, 2007; Cadez & Guilding, 2007; Langfield-Smith, 2008).
Chapter 1: Introduction to the Study
Jafar Ojra - 3 -
Knowledge about strategic management accounting is however still evolving as both
academics and management practitioners search for ways to ensure the maximisation of
strategic and organisational performance impact of SMA. For example, Woods et al (2012)
comment that while strategic management accounting continues to be of considerable interest
to academic accountants, it still suffers from a relative dearth of empirically based research. A
major shortcoming in the knowledge about SMA is that the majority of the studies (as evident
above) reflect Western world contexts. Therefore, one core knowledge evolvement direction
is the less developed countries (LDC) context (e.g., Alrawi & Thomas, 2007; Leftesi, 2008;
Tuan Mat, 2010; Islam & Hu, 2012).
Furthermore, there are increasing comments about SMA and role in improving organisational
performance that need to be enhanced through further research. For example, SMA studies
suggest that some accounting officers within organisations play a growing role in the
provision of information for strategic decision making (e.g., Bhimani & Keshtvartz, 1999)
and that they are increasingly engaged in strategic corporate activities (e.g., Guilding et al.,
2000; Guilding & Mcmanus, 2002). Other SMA literature (Palmer, 1992; Simonds, 1981,
1982; Bromwich, 1990) view strategy development and implementation as formal endeavours
to which strategically oriented management accounting practices can contribute.
According to further strategy context literature (e.g., Shank & Govindarajan, 1988, 1989 &
1992; Shank, 1996), if strategic management accounting tools (for example cost management
approach, value chain analysis, cost driver analysis and competitive advantage analysis) are
used this will aid comprehensive and balanced assessment of strategic issues. Another
spectrum of management accounting literature which relates to the strategic context includes
life-cycle based strategic accounting (Wilson, 1995), target and Kaizen costing (Cooper &
Slagmulder, 1997), interactive management controls (Simons, 1995), the balanced scorecard
(Kaplan & Norton, 1992, 1996 & 2001), activity-based management systems (Kaplan &

Chapter 1: Introduction to the Study
Jafar Ojra - 4 -
Cooper, 1998), quality costing (Tayles at al., 1996), inter-organisational cost management
(Cooper & Slagmulder, 2004), customer accounting (Donelan & Kaplan, 1998; Foster &
Gupta, 1994; Ryals & Payne, 2001; Ryals & Knox, 2004; Ryals, 2008) and customer life-
value accounting (Jain & Singh, 2002; Gupta & Lehman, 2003; Vogel et al., 2008; Ambler &
Roberts, 2005).
Relationship management context literature (e.g., Bromwich & Bhimani, 1994; Roslender &
Hart, 2002; Opute et al., 2013) also pinpoints SMA backgrounds that would aid the target of
profitably satisfying customers (Roslender & Hart, 2002). According to Opute et al (2013), if
the accounting role is effectively performed, the marketing function will be supplied with
quality information that would aid strategic marketing decision making and implementation,
integration perspective that reinforce previous work by Roslender &Hart (2002). To optimize
those outcomes, attention must be given to the contingency factors that shape this relation,
Opute et al (2013) further note.
According to organisational performance perspective, while there is notable quantum of
attention given to market orientation by strategy and marketing researchers (Hult et al., 2005)
this has not been matched by management accounting researchers (Guilding & McManus,
2002). Numerous researches underline the need to explore SMA (or MAPs/MCS) modus,
process and effectiveness. Especially on this tripartite (modus, process and effectiveness)
contexts, it is important to explain how the internal and external dynamics of an organisation
would shape the importance and use of SMA and its interplay to organisational performance
(e.g., Leftesi, 2008; Chenhall, 2007; Cinquini & Tenucci, 2010; Cadez & Guilding, 2008;
Hwang, 2005; Jusoh, 2010; McManus, 2012), hence the focus in this present study. The core
argument in this study is that organisations that are more able to manage these contingency
dynamics would achieve a better fit for SMA usage and organisational performance (See
Chapter 8).

Chapter 1: Introduction to the Study
Jafar Ojra - 5 -
1.4 Research Aim and Objectives
While interest in SMA is growing (See Roslender & Hart, 2003; Cadez & Guilding, 2009,
2008; Bhimani & Langfield-Smith, 2007; Langfield-Smith, 2008), there is still no consensus
as to what constitutes SMA (e.g., Cadez & Guilding, 2008; Roslender & Hart, 2003;
Langfield-Smith, 2008). More research therefore is needed to illuminate “the adoption of
strategically-oriented management accounting techniques” (op. cit.). Other SMA literature
(e.g., Ryals & Payne, 2001; Ryals & Knox, 2004; Ryals, 2008) also flags the need for further
examination of the customer accounting, competitor accounting and value chain contexts of
SMA.
In trying to understand SMA (including MAPs and MCS), researchers have used a variety of
exploratory frameworks, including contingency theory, agency theory and other theories. Of
central relevance to this present research is the contingency theory which posits that
organisational structures and systems are a function of environmental and firm-specific
factors (Chenhall, 2003; Gerdin, 2005; Haldma & Lääts, 2002; Cadez & Guilding, 2008); a
viewpoint that underlines the importance of ensuring a fit in the use of strategic management
accounting techniques, in order to maximize the performance benefits.
In this contingency perspective, researchers have attempted to investigate the factors that
influence the adoption of the SMA techniques, by trying to answer questions on how the types
of Organisational Strategy (e.g., Hoque, 2004; Leftesi, 2008; Guilding & McManus, 2002;
Hwang, 2005; Dent, 1990; Chenhall, 2003; Langfield-Smith, 2007; Shank & Govindarajan,
1992; Chenhall & Langfield-Smith, 1998; Cinquini & Tenucci, 2010; Cadez & Guilding,
2008), Organisational Technology (e.g., Granlund, 2011; Hald & Mouritsen, 2013; Dechow &
Mouritsen, 2005; Haldma & Lääts, 2002), Environmental Uncertainty (e.g., Hoque, 2004;
Govindarajan & Shank, 1992; Hope & Hope, 1995; Leftesi, 2008; Foster & Gupta, 1994;
Simons, 1990; Libby & Waterhouse, 1996; Guilding & McManus, 2002; Hwang, 2005),

Chapter 1: Introduction to the Study
Jafar Ojra - 6 -
Organisational Structure (e.g., Hwang, 2005; Leftesi, 2008) and Organisational Size (e.g.,
Leftesi, 2008; Cadez & Guilding, 2008; Cinquini & Tenucci, 2010).
Furthermore, contingency logic suggests that the extent and priority given to the nature of
organisational performance are shaped by Organisational Structure (e.g., Miles & Snow,
1994; Hwang, 2005), Organisational Strategy type (e.g., Hoque, 2004; Ittner et al., 1997;
Hwang, 2005), Environmental Uncertainty (e.g., Hoque, 2004; Govindarajan, 1984; Chenhall
& Morris, 1986; Chong & Chong, 1997; Gul & Chia, 1994; Hoque & Hopper, 1997; Mia,
1993; Mia & Chenhall, 1994; Kohli & Jaworski, 1990; Hwang, 2005 ) and the SMA
techniques in use (e.g., Ittner et al., 1997; Miles & Snow, 1978; Simons, 1990; McManus,
2012; Cadez & Guilding, 2008; Baines & Langfield-Smith, 2003; Cravens & Guilding, 2001;
Mahama, 2006; Mia & Chenhall, 1994; Ittner et al., 2003). Finally, the contingency
perspective suggests association between the Organisational Strategy type and the
environmental uncertainty of the organisation (e.g., Hwang, 2005).
To contribute to the understanding of SMA practices in Palestinian companies, contingency
factors and performance implications, this study draws upon the three realms of contingency
perspective mentioned above to conceptualise a framework (See Figure 4.1) that has been
theoretically justified in chapter three. Two more contingency variables named Organisational
Technology and Organisational Size are explored in the study (See Figure 4.1).
The aim of this study is to explain the extent to which Palestinian companies adopt
strategically-oriented management accounting techniques, and the contingency factors that
influence their adoption and performance of the explored companies (See Chapter 8). To
achieve the above specified aim, the objectives of this study are to answer the below research
questions:

Chapter 1: Introduction to the Study
Jafar Ojra - 7 -
1. What SMA-techniques do Palestinian Companies use and how do these influence their
organisational performance?
2. What influence do the contingency factors have on the choice of these SMA-
techniques?
3. What contingency factors influence the organisational performance of Palestinian
Companies?
4. What influence does organisational strategy have on organisational structure and
organisational performance?
5. What influence does perceived environmental uncertainty have on organisational
structure, organisational performance and organisation strategy?
6. What influence does organisation structure have on SMA techniques and
organisational performance?
In answering the above questions this LDC-context research will contribute to the knowledge
about SMA techniques usage in organisations and the contingencies surrounding the nature
and extent of use. Also, this study will contribute to the understanding of the
conceptualisation SMA techniques and contingency variables that would influence
organisational performance.
1.5 Research Methodology
The unit of analysis for this study is Palestinian companies that meet the defined criteria for
the study. Following the tradition in previous studies that examined the contingency
perspective of SMA (and MAPs and MCS) usage, positivist research methodology was
applied in the study. A questionnaire was used in this study. To ensure appropriateness of the
instrument for this study, a pilot study was undertaken, and subsequently the questionnaire

Chapter 1: Introduction to the Study
Jafar Ojra - 8 -
was revised taking into consideration the constructive feedbacks from respondents and
finalised for the study. The finalised questionnaire was sent (along with a letter explaining the
study) to the Chief Accountant or Chief Controller or Chief Financial Officer (as applicable
for the respective companies) of the companies, as (1) these were considered appropriate for a
study of this nature (Baines & Langfield-Smith, 2003), and (2) organisations in less developed
countries (LDCs) may not have a separate management accounting unit (Smith et al., 2008).
The sample for this study included 400 largest Palestinian companies. The total number of
completed questionnaires upon which this study is based is 175, representing a response rate
of 43.75%.
Descriptive statistics in terms of means and standard deviation were estimated to achieve the
descriptive objectives. Factor analysis and then multiple regression analysis were undertaken
to test the research hypotheses (See Chapter 5).
1.6 Structure of the Thesis
This thesis comprises of eight chapters. First, this present Chapter (One) introduces the study
explaining the need and purpose of the study. Also, this chapter summarises the
methodological approach used to explore the research questions.
Chapter Two focuses on the Palestinian economy, which is the context in which this study is
positioned. Chapter two summarises the core features of the economy, explaining concisely
which part of the country and what industrial sectors are covered in the study.
Chapter Three reviews relevant literature pinpointing the theoretical foundations for this
study. Three core areas of literature are reviewed in this chapter. First, the theoretical
foundations concerning strategic management accounting techniques and dimensions were
presented. Also, literature about organisational performance was reviewed, and distinguishing
in the process the financial and non-financial dimensions. Finally, chapter three also reviewed

Chapter 1: Introduction to the Study
Jafar Ojra - 9 -
literature concerning the contingencies of strategic management accounting techniques usage
and organisational performance.
Chapter Four introduces the framework and specifies its underlining hypotheses for the
study while chapter Five explains the paradigmatic position of this study as well as reviews
relevant methodological literature. Finally, this chapter explains the population and sample of
the study, as well as the survey tool used.
Chapter Six presents the descriptive findings. Also, this chapter presents the statistical results
for each factor captured in the factor analyses. Overall, the core focus of this chapter was to
justify the reliability and validity of factors.
Following that, regression analyses were conducted to test the hypotheses for this study, and
the results are presented in chapter Seven. The discussion of the findings from this study is
also presented in chapter 7.
Finally, chapter Eight, which is the last chapter, presents the main conclusions from this
study. Chapter eight also pinpoints the theoretical and managerial implications, as well as the
limitations of the study. Chapter eight is concluded with a specification of directions for
future research.

Chapter 2: Explaining the LDCs and Palestinian Context of the Study
Jafar Ojra - 10 -
2. Explaining the LDCs and Palestinian Context of the Study
2.1 Introduction
In chapter one the need for and purpose of this study was explained. The purpose of
chapter two is to explain further the justification for this study by outlining why it is
important to explore the less developed countries (LDCs) and Palestinian context. Next,
the LDC focus in this study is justified (See Section 2.2) and following that Section 2.3
explains why it is necessary to explore the Palestinian context. Finally, Section 2.4 gives
a short background of the Palestinian economy.
2.2 Why Explore the Less Developed Countries (LDCs) Context?
A number of reasons justify the focus of the study to explore the contingency perspective
of strategic management accounting techniques usage and performance in a less
developed countries (LDCs) setting, namely;
1. While the importance of management accounting information to planning,
decision making and control in organisational dynamics is well documented, very
little research has been conducted on the less developed countries (LDCs)
context (Alattar et al., 2009; van Triest & Elshahat, 2007),
2. The studying of the role of novel management accounting practices within
contemporary settings is necessary to ensure that management accounting research is
relevant (Ittner & Larcker, 2001; Chenhall, 2003; Leftesi, 2008),
3. Culture is a major factor affecting the structure of business and society (e.g.,
Alawattage et al., 2007) and also accounting practices. While this logic is
important, knowledge development in the area of strategic management
accounting and contingency features largely reflects western context. Therefore,

Chapter 2: Explaining the LDCs and Palestinian Context of the Study
Jafar Ojra - 11 -
researchers (e.g., Kantor et al., 1995; Lybaert, 1998; Alawattage et al., 2007) call
for researches that illuminate accounting practices in less developed and Arab
economies. This study therefore explores the Palestinian context of the
contingency perspective strategic management accounting practices, as well as
performance contingencies.
2.3 Why Explore the Palestinian Context?
The competitive global environment in which companies operate is increasingly becoming
more challenging (Johnson & Kaplan, 1987). In the past three decades, conventional costs and
management accounting practices have come under extensive criticisms for failure to support
change and to tailor accounting practices to cope well with changing environment (Hajjawi,
2012). Previous studies justify the importance of exploring the contingency perspective of
strategic management accounting techniques usage and performance in Palestinian
companies. A number of reasons found in the literature include the following:
1. Combining the views expressed above by Johnson & Kaplan (1987) and Hajjawi
(2012), there is a justified need to explore the Palestinian context of strategic
management accounting techniques usage, especially given the argument that major
acquisitions in Palestine have increased the need for more sophisticated and advance
management accounting information towards coping with external market pressures
(Hajjawi, 2012),
2. There is need to explore strategic management accounting practices in Arab
countries (Dik, 2011, Kattan et al., 2007; van Triest & Elshahat, 2007),
3. There is lack of research about management accounting in less developed countries
(LDCs) and Arab countries (Alatter et al., 2009; Lybaert, 1998; Alawattage et al.,
2007; Kattan et al., 2007; Leftesi, 2008; Hopper & Hoque, 2004),

Chapter 2: Explaining the LDCs and Palestinian Context of the Study
Jafar Ojra - 12 -
4. Exploring the strategic management context in Palestine is necessary (Alatter, 2009;
Alawattage et al., 2007; Kattan et al., 2007),
5. While numerous researches have explored management accounting practice in
advanced countries (Joshi et al., 2003), it is important to highlight the Arab world
and less developed countries contexts because culture (Hofstede, 1980; Alawattage et
al., 2007) and governance issues (Alawattage et al., 2007) may shape SMA practices.
In their study of management accounting practices in LDCs, van Triest and Elshahat
(2007) argue that non-western cultures reflect different norms of reciprocity and
interaction. Kattan et al. (2007) also note that “there is enormous diversity among
organisations” (p.229),
6. Less developed countries (LDCs) have been marginalised in the drive to enhance
knowledge about the use of management accounting tools, although "the bulk of the
world's population lives outside locations prominent in mainstream research,"
(Alawattage et al., 2007, p.183). The accounting needs and concerns of these
countries are as pressing and considering the wave of globalisation "they form an
essential part of the mosaic of world trade." (Alawattage et al., 2007, p.183),
7. Studying of the role of novel management accounting practices within contemporary
settings is necessary to ensure that management accounting research is relevant
(Ittner & Larcker, 2001; Chenhall, 2003),
8. Point (1) of Section 2.2 above underlines the importance of management accounting
information to planning, decision making and control in organisational dynamics and
the need for more research on the less developed countries (LDCs) context (Alattar
et al., 2009). This logic also holds for Palestinian companies,
Chapter 2: Explaining the LDCs and Palestinian Context of the Study
Jafar Ojra - 13 -
9. Palestinian companies need to cope regularly with various determinants of
accounting standards and to focus on the ways management accounting is being used
in the prevailing economic conditions where Israeli occupation plays a major role
(Hajjawi, 2012). In this connection, contingency theories offer a good empirical base
to enhance the understanding of the factors that explain how Palestinian companies
use management accounting practices to cope (Hajjawi, 2012).
10. The Palestinian business environment provides a perfect ground for study of
management accounting under conditions of environmental uncertainty (Kattan et al.,
2007). The business environment has experienced in the last century different
periods each with varying degree of uncertainty. In Palestine, the level of
'uncertainty' is high so it’s a special case.
Overall, the significance of this study originates from the fact that Palestinian case provides
an excellent field for testing of contingency variables for application of SMA practices.
2.4 Background of the Palestinian Economy
This Section is presented with a focus to highlight two core points, namely the occupying
influence of Israel in the Palestine nation (Section 2.4.1) and the Palestinian economy
under uncertainty (Section 2.4.2).
2.4.1 Israel's Occupying Influence on Palestine
This Section highlights core features of the Palestinian economy and the role Israeli
occupation plays in that connection. Highlighting these features is important for the
context of this study because these features influence the degree of economic activity in
the nation, and this study explores the contingency perspective.

Chapter 2: Explaining the LDCs and Palestinian Context of the Study
Jafar Ojra - 14 -
As the Arabs did not accept the 1947 UN partitioning of Palestine into Arab and Israel
states a war broke out (Gilbert, 2008). Since winning that war decisively in 1967, Israel
has occupied all the land from the Jordan River to the Mediterranean Sea, bounded by
Syria and Lebanon in the north, Egypt in the south and Jordan in the east (Bregman,
2002). With no other alternative, Palestinians had to accept the Oslo Peace Accord of
1993, which was believed to be a good option towards achieving peaceful resolution of
the conflict (Halliday, 2005).
Unfortunately, the much desired peaceful resolution is far from being achieved; rather the
conflict escalates daily, and is intensively fuelled by Israeli army occupation of Palestine
and continual building and expansion of illegal Israeli settlements, a move that was not
welcomed by the local population (Cleveland & Bunton, 2008). The direct outcome of
these developments, as Cleveland & Bunton (2008) further note, are re-generation cycle
of violence, incitement, frustration, hopelessness, serious financial problems, and
fragmentation of the Palestinian politics and society.
In retaliation for the outbursts on the part of the Palestinians, Israeli army imposed
economic blockade and restrictions on Palestinians movement (UN Office for the
Coordination of Humanities Affairs, 2007). The direct consequence of this movement
restriction for Palestinians is that (1) trade routes are significantly affected due to sheer
number of 648 Israeli checkpoints and other physical limitations in the occupied territory
(UN Office for the Coordination of Humanities Affairs, 2007) and (2) therefore have no
access to external world by land, air or sea, and are enslaved within Israel the occupies
78% of the land (Pappé, 2004).
In these prevailing circumstances, the Israeli-occupied territories of Palestine continue to
face harsh multi-faceted problems and suffer serious imbalances despite economic and

Chapter 2: Explaining the LDCs and Palestinian Context of the Study
Jafar Ojra - 15 -
institutional reforms (Arnon, 2002). The World Bank estimates show a gross domestic
product (GDP) level of US$1,036 for Palestine per year comparative to US$22,563 for
Israel. While some degree of aids have been given to the Palestinian nation, this has not
been sufficient to alter the worsening long-term development prospects that has been
triggered by continued loss and erosion of productive base, fragmentation of domestic
markets, the construction of a separation wall in Palestine and isolation of Arab
Jerusalem, land and natural resources (UN Office for the Coordination of Humanities
Affairs, 2007).
The Palestinian economy is completely isolated from neighbouring Arab markets, and the
end to this plight would remain elusive as long as Israel's continued occupation,
expansion of illegal settlement and control over access to global markets is not put to an
end (Siam, 2009). As Ravid (2012) notes, the Palestinian fiscal position is precarious
despite efforts made to achieve fiscal sustainability, a circumstance that is driven by
dependence on the Israeli economy.
Several interventions have been initiated to support Palestinians and alleviate their
economic hardship due to Israeli occupation. Amongst these are the UN Conference on
Trade and Development (2009, August) intervention and the integration of Palestine with
its Arab hinterland, which "has been interrupted by two generations of war and Israeli
occupation", (Hajjawi, 2012, p.31). The direct effect of these interruptions is that there is
no substantial boost to the Palestinian economy (Sherwood, 2011), a problem that is also
compounded by Paris Protocol (1994) that does not permit needed policy instruments to
implement corrective measures for promoting Palestinian socio-economic development
(Hajjawi, 2012).

Chapter 2: Explaining the LDCs and Palestinian Context of the Study
Jafar Ojra - 16 -
Consequently, the Palestinian macroeconomic state reflects Israel economic policy
orientation and political imperatives (Hajjawi, 2012). Thus, as Daud (2011) argued, the
Paris Protocol which shaped the Palestinian trade regime and defined the economic and
trade relations between Israel and the occupied Palestinian territories was a major
constraint on Palestinian development and the trade and industrial policies open to the
Palestinians.
The combined effects of the generic factors of the Palestinian environment did not only
affect the viability of existing businesses but also discouraged potential domestic and
foreign investments (Hajjawi, 2012). The productive base of the Palestinians was
relatively deformed as a result of the constraints imposed by Israeli occupation (Cottier &
Pannatier, 2000). A further consequence of the restrictions on the movement of
Palestinian goods and people is the inflation of business transaction cost (Hajjawi, 2011;
UN General Assembly).
2.4.2 The Palestinian Economy under Uncertainty
The Palestinian economy is centred on two Palestinian controlled territories, West Bank
and Gaza strip, with West Bank being the larger of the two territories. The two regions
are generally low income with nominal per capita income estimated to be less than $2000
(World Bank, 2004).
The economy is largely dependent on direct foreign aid and remittance from Palestinians
living abroad (World Bank, 2004). The country is not endowed with vast oil reserves like
most of its Arab neighbours and there are no major foreign exchange earners to spur
growth of local industries and investments in infrastructure (World Bank, 2004). Most of
its foreign earnings other than remittances and aid are from export of soaps and textiles.

Chapter 2: Explaining the LDCs and Palestinian Context of the Study
Jafar Ojra - 17 -
The Palestinian economy has experienced uncertainty in both the political and business
environment over the years and has never had continuous period of economic stability in
the last two centuries (World Bank, 2004, Kattan et al., 2007). The unending disputes
with Israel over territorial boundaries and right for self-determination have placed the
Palestinian territories under perpetual political uncertainty that has kept away foreign
direct investors thereby denying the region the much needed economic growth (Kattan, et.
al, 2007).
However, the political shift that ended the first uprising (Intifada) in 1993, led to a period
of relative calm during which the Palestinian territory experienced many economic
activities. In the recent past, the economy has experienced a long period of relative calm
that has seen the territory’s Gross Domestic Product (GDP) grow by up to seven percent
in 2009.
There is evidence of application of management accounting among Palestinian
organisations (Kattan et al., 2007). The high level of uncertainty in the business
environment may have informed Palestinian business managers to incorporate aspects of
management accounts information in to their established performance reporting systems.
According to Alawattage et al. (2007), the study of MA in developing countries, such as
Palestine, should also focus on the implications of such issues as poverty, political
instability and uncertanty, business culture and ethics, corruption and such other ills that
affect business (Alawattage et al., 2007).
The Palestinian business environment provides a perfect ground for study of management
accounting under conditions of environmental uncertainty (Kattan et al., 2007). The
business environment has experienced different periods each with varying degree of
uncertainty. The period before the signing of the Oslo Accord in 1993, was one such

Chapter 2: Explaining the LDCs and Palestinian Context of the Study
Jafar Ojra - 18 -
period when the country experienced many political activities and turmoil that was not
conducive for business (Kattan et al., 2007). With heightened media attention, negative
political pronouncements, political demonstrations and military blockades, the country
was literally a war zone with aid agencies playing a significant role in meeting the
demand for essential commodities. However, the reliance of local businesses has seen the
region’s economy survive such uncertain period with remarkable success (Kattan et al.,
2007).
The seven-year period after the signing of the Oslo Accord was characterised by relative
calm and certainty that led many businesses to grow and expand their operations into
Palestinian territories (Kattan et al., 2007). The easing of military blockades by the Israeli
government ensured free flow of goods and work force in and out of the two Palestinian
territories (Kattan et al., 2007). This period experienced high economic growth and
political stability that enabled businesses to flourish and grow their value considerably
(Kattan et al., 2007). This period also experienced a lot of inflow of donor funds that
greatly supported the economy that has little exports to boosts its foreign exchange
reserves. Equally significant was the increase in remittances from Palestinians living
abroad, some of whom relocated to the country to take advantage of the peaceful
environment to invest their earnings and savings at home (Kattan et al., 2007).
This period was short-lived as subsequently followed by the second Intifada in 2000,
which marked the beginning of renewed violent protests and military activities in all the
two Palestinian territories (Kattan et al., 2007). The uprising seriously affected business
and led to another uncertain period of slow business activities in the decade that followed
(Kattan et al., 2007). The negative impacts of uncertainty such as capital flights, reduced
foreign direct investments, and insecurity occasioned by lack of employment for the

Chapter 2: Explaining the LDCs and Palestinian Context of the Study
Jafar Ojra - 19 -
youthful population meant that Palestinian companies had to endure hard economic times
unless innovative ways were sought to cushion them against such problems.
The Palestinian territory does not have its own currency and uses other regional and
international currencies to facilitate trade. The currencies predominantly used include the
US Dollar, Euro, Jordanian Dinar and Israeli Shekel for savings and commercial
exchanges (PIC, 2008). Transactions such as salaries especially in the private sector are
quoted in Jordanian Dinar for local firms while multinational organisations, aid agencies
mostly conduct their transactions in the US Dollar (PIC, 2008).
As mentioned earlier, the Palestinian economy is centred on two Palestinian controlled
territories: West Bank and Gaza Strip with West Bank being the larger of the two
territories. The West Bank and Gaza is a small and open economy (The World Bank
Report, 2012). According to macro economic data, there is relatively little private sector
investment in the West Bank and Gaza Strip, a circumstance that is largely influenced by
Israeli restrictions (The World Bank Report, 2012). Table 2.1 below shows the statistics
(number of establishments and employments) in the Palestinian Private Sector as at 2009.
Table2.1: Number of Establishments and Employment by Economic Activity 2009
WB & GS West Bank Gaza Strip
No. of
Establish-
ments
Employ No. of
Establish-
ments
Employ No. of
Establish-
ments
Employ
Industrial
Activities
15,322 67,052 11,791 54,064 3,531 12,988
Construction 508 5,200 301 4,558 207 642
Internal Trade 61,340 125,033 42,508 82,090 18,832 42,943
Service
Activities
24,114 85,756 17,406 61,407 6,738 24,349
Transport,
Storage &
Communicatio
ns Activities
1,169
9,568
718
8,107
451
1,461
Total 102,483 292,609 72,724 210,226 29,759 82,383
Source: Palestinian Central Bureau of Statistics (2009)
Chapter 2: Explaining the LDCs and Palestinian Context of the Study
Jafar Ojra - 20 -
The research was conducted in the West Bank as this area is the base for the largest
companies and moreover, the companies were willing to participate in this research. Also, due
to relative ease of access and the convenience it accords the research. Consequently, Gaza
Strip was excluded from the study.
According to Mintzberg (1979), organisation size can be measured by the number of
employees, the amount of sales, the size of the budget, the size of the capital investment, and
other factors.
Palestinian Central Bureau of Statistics (PCBS) defined Palestinian companies’ size based on
employment size group. For the purpose of this study therefore, the focus was on large
companies with the capacity as defined in Table 2.2 below. Furthermore, Federation of
Palestinian Chamber of Commerce, Industry & agriculture defined Palestinian companies’
size based on capital. For the purpose of this study therefore, the focus was on large
companies with the capital outlay standard of $1,500,000 and more (Federation of Palestine
Chamber of Commerce, Industry & agriculture, 2013)3:
Consequently, the companies of interest in this study are Palestinian large companies with
capital level of more than $1,500,000 and moreover must have at least 50 employees for the
following reasons:
1. Strategic management accounting (SMA) consists of tools that are usually expected to
be used by larger companies (Cadez & Guilding, 2008, Kattan, et al., 2007),
2. Companies with capital less than $ 1,500,000 or with employees less than 50 might
have a struggle to survive rather than thinking of adopting SMA techniques,
3. Finally, it makes sense to assume that higher capital companies and higher
employment size are more likely to have higher revenue, a reasoning which further
justifies the use of total revenue to measure company size in this study.

Chapter 2: Explaining the LDCs and Palestinian Context of the Study
Jafar Ojra - 21 -
Table 2.2: Company Size based on Employment Size
Company Category Number of Employees
Micro 1-4
Small 5-19
Medium-sized 20-49
Large 50 or more
Source: Palestinian Central Bureau of Statistics, 20072.
To determine the sectors of the economy to explore, this study followed existing literature
about the Palestinian economy. The main sectors within Palestinian context includes
(Palestine stock exchange, 2013)1:
1. Investment Sector,
2. Industry Sector,
3. Banking and Financial services sector,
4. Insurance Sector, and
5. Service Sector.
In Table 2.3 below the activities of each sector are defined.
1 See http://www.pex.ps/marketwatch/English/SectorsMarketWatch.aspx
2See http://www.pcbs.gov.ps/Portals/_Rainbow/Documents/est_07a.htm
3 See http://www.pal-chambers.org/en-us/

Chapter 2: Explaining the LDCs and Palestinian Context of the Study
Jafar Ojra - 22 -
Table 2.3: Definition of the main Sectors in the Palestinian Economy
Sectors Activities
Investment Real Estate
Industry pharmaceutical and medical industries, chemical industries,
paper and cardboard industries, printing and packaging,
food and beverages, tobacco and cigarette, mining and
extraction industries, engineering and construction,
electrical industries, textiles, leathers and clothing, Glass
and ceramic industries.
Banking and Financial Services banks and diversified financial services
Insurance Insurance companies
Services health care services, educational services, hotels and
tourism, transportation, technology and communication,
media, utilities and energy, and commercial services
Source: (Palestine Stock Exchange, 2013)2:
The research has been conducted on all sectors in the West Bank in Palestine of exceptional
high level of environmental uncertainty. In a sense, this extremely difficult situation is a
unique strength of this study as this research can test a high uncertainty environment.

Chapter 2: Explaining the LDCs and Palestinian Context of the Study
Jafar Ojra - 23 -
2.5 Conclusion to the Chapter
This Chapter has completed the justification of this study which was commenced in Chapter
one. In doing this, Chapter two explained the justification for the LDCs and Palestinian focus
in this study. Also, Chapter two explained the economic environment in Palestine flagging
difficulties faced due to Israeli occupation.
Next, Chapter three explains the theoretical foundations relevant for this study.
Chapter 3: Literature Review – Contingency Theory and Strategic Management Accounting Techniques
Jafar Ojra - 24 -
3. Literature Review - Contingency Theory and Strategic Management Accounting
Techniques
3.1 Introduction
Chapter one laid the foundation for, and justified this study. Following that, chapter two
explained the geographical and industrial context of this study. In this present chapter (3) a
literature review of relevant foundations for this study is undertaken.
In determining the theoretical foundations relevant for this study, three core factors are taken
into consideration, namely:
(1) Research gap;
(2) Precedence in previous research, and
(3) Relevance to the geographical and industrial context of this study.
3.2 The Relevant Literature for this Study
This review of relevant literature is done in two stages. First, a review of the definition, and
contextualisation of the contingency perspective in literature relating to accounting and
strategic management accounting contexts is undertaken in Section 3.2.1. To conclude that
section, the conceptualisation, and context of the contingency perspective of this study is
summarised. Following that, Section 3.2.2 introduces Table 3.1 which summarises some
selected previous studies, pinpointing the contingency variables explored in those studies, as a
way of justifying the validity of this present study.
3.2.1 The Contingency Theory Lens of Managerial Accounting Research &
Conceptualisation for this Study
Organisational science literature underlines that successful managerial decisions would
enhance overall organisational profitability (e.g., Raaij et al., 2003; Lee & Park, 2006).
Accounting is core to management (Roslender & Hart, 2002), and this study focuses on the

Chapter 3: Literature Review – Contingency Theory and Strategic Management Accounting Techniques
Jafar Ojra - 25 -
use of strategic management accounting as a tool towards enhanced managerial decisions for
overall organisational performance (Bromwich, 1990; Cadez & Guilding, 2008; Sidhu &
Roberts, 2008; Roslender & Hart, 2002). A core argument in this study, thus, is that
organisations that carefully employ appropriate strategic management accounting practices
would ensure successful managerial decisions leading to better organisational performance.
This strategic management accounting foundation (Simmonds, 1981), rephrased also as
accounting for strategic positioning (Roslender, 1995; 1996) is grounded on the logic that a
more market oriented and strategically tailored accounting is critical for organisational well-
being (Langfield-Smith, 2008).
More research is needed to illuminate “the adoption of strategically-oriented management
accounting techniques and accountant’s participation in strategic management processes”
(Roslender & Hart, 2003, p.4). Towards enhancing knowledge on this strategically-oriented
management accounting realm, numerous researchers also emphasise the importance of
exploring the contingency context of SMA (e.g., Chenhall & Langfield-Smith, 1998;
Chenhall, 2003; Ittner & Lacker, 1997; Cravens & Guilding, 2001; Gerdin, 2005; Guilding &
McManus, 2002; O’Connor et al., 2006; Hwang, 2005; Cadez & Guilding, 2008; Alrawi &
Thomas, 2007). Illuminating this realm would enhance SMA understanding, and
organisational performance impacts.
As pinpointed in the objectives of this study (Section 1.4), a contingency perspective (Hwang,
2005; Cadez & Guilding, 2008; Chenhall, 2003) is followed in this study of strategic
management accounting practices in Palestinian companies. The contingency perspective of
management accounting research is an important area for research (Harrison, 1992, 1993;
O’Connor, 1995; Taylor, 1996; Chenhall, 2006; Islam & Hu, 2012).

Chapter 3: Literature Review – Contingency Theory and Strategic Management Accounting Techniques
Jafar Ojra - 26 -
The first major contingency approach in management accounting research was Hofstede’s
(1967) classic field work. The contingency theory and its relationship concerning organisation
control and accounting structure gained increasing attention in the accounting literature since
the 1970’s (e.g., Waterhouse & Tiessen, 1978; Gordon & Miller, 1976; Watson, 1975; Dik,
2011).
Initiating contingency-based research on management accounting systems, Waterhouse and
Tiessen (1978) developed a model for comparative analysis of organisations to identify
organisation control mechanisms aligned with management accounting system design issues.
On their part, Widener (2004) and Gerdin & Greeve (2004), integrating transaction cost
economics and contingency theory, explored forms of contingency fit in management
accounting research. Hartmann & Moers (2003) tested contingency hypotheses in budgetary
research using moderated regression analysis.
In the strategic management accounting context, the contingency approach is based on the
premise that there is no universally appropriate accounting system that fits all organisations in
all circumstances (Otley, 1980, Emmanuel et al., 1990; Islam & Hu, 2012). Thus, there is no
universal control system that is “best”; rather the appropriateness of the control system is
determined by the circumstances and context of the organisation (Waterhouse & Tiessen,
1978; Fisher, 1995; Alrawi & Thomas, 2007). So, the selection proposition of contingency
theory (Horngren, 1982) proposes association between an organisation’s context and control
system used (Selto et al., 1995; Alrawi & Thomas, 2007; Islam & Hu, 2012).
So, as captured in contingency theory, organisational structures and systems are a function of
environmental and firm-specific factors (Anderson & Lanen, 1999; Chenhall, 2003; Gerdin,
2005; Gerdin & Greve, 2004; Haldma & Laats, 2002, Cadez & Guilding, 2008; Hwang, 2005;
Dik, 2011; Islam & Hu, 2012). The contingency perspective is based on the organisational

Chapter 3: Literature Review – Contingency Theory and Strategic Management Accounting Techniques
Jafar Ojra - 27 -
theory concept “that an organisation maximizes its efficiency by matching between structure
and environment” (Dik, 2011, p.49). Otley (1980) commented thus:
The contingency approach to management is based on the premise that there is no
universally appropriate accounting system that applies equally to all
organisations in all circumstances. Rather, it is suggested that particular features
of an appropriate accounting system will depend on the specific circumstances in
which an organisation finds itself. Thus, a contingency theory must identify
specific aspects of an accounting system which are associated with certain
defined circumstances and demonstrate an appropriate matching” (p.413).
Towards contributing to filling identified research gaps (See Chapter 1), it is important to
review existing literature, and thereby pinpoint theoretical foundations upon which this study
is based. Also, doing this is necessary to have a basis upon which the findings from this study
can be compared against.
Numerous researchers have pinpointed key factors that are essential in the exploration of the
contingency view and a number of these are pinpointed next. Cadez &Guilding (2008)
suggest four factors that potentially have significant implications for SMA system design: (1)
business strategy, (2) degree to which adopted strategy is deliberately formulated, (3) market
orientation, and (4) firm size.
In a review of literature on contingency theory of managerial accounting, Islam &Hu (2012)
comment that “organisational effectiveness is dependent on a fit or match between the type of
technology, environmental volatility, the size of the organisation, the features of the
organisational structure, and its information system” (p.5159).

Chapter 3: Literature Review – Contingency Theory and Strategic Management Accounting Techniques
Jafar Ojra - 28 -
In a much earlier study, Merchant (1985) explored the contingent relationships between (1)
size of the firm, (2) product diversity, (3) extent of decentralisation, and (4) the use of
budgetary information. Aver & Cadez (2009) propose a sociological lens of contingency
theory and argue that sociological developments associate to accountants’ participation in
strategic decision making process.
Offering a comprehensive framework for the design of accounting information system,
Gordon & Miller (1976) analysed variables critical to organisational performance. Their
contingency lens suggests (1) environment, (2) organisational characteristics, and (3)
managerial decision making style as core contingent variables. Similar to Gordon & Miller
(1976), Gordon & Narayanan (1984) also explored accounting information systems context,
but considered (1) perceived environmental uncertainty, (2) organisational structure and (3)
characteristics of information perceived to be important by decision makers, as core
contingent variables.
“Contingency theory studies postulate that organisational outcomes are the consequences of
fit or match between two or more contingent factors” (Islam & Hu, 2012, p.5159). For the
purpose of achieving the goals of this study, a summary of the key variables that have been
explored in selected previous studies is presented in Table 3.1 below. To address the research
questions for this study, this study borrows from the insight in previous studies concerning the
core variables in the contingency perspective. To avoid repetition, only the basic information
concerning explored factors is specified, the relevant empirical factors for each factor would
be pinpointed in the sectional review of respective variables.
The concept of fit in the contingency perspective has been defined by Van de Ven & Drazin
(1985) in three approaches – selection, interaction, and systems approach. In the ‘selection
approach’ fit view, if an organisation wants to be effective, it must adapt to its organisational

Chapter 3: Literature Review – Contingency Theory and Strategic Management Accounting Techniques
Jafar Ojra - 29 -
context characteristics. For the second (interaction), fit is interpreted as an interaction effect of
organisational structure and performance context (Khandwalla, 1977; Van de Ven & Ferry,
1980). In the third case (systems approach), better understanding of organisational design is
gained by simultaneously investigating the contingencies, structural alternatives and
performance criteria existing in an organisation. This study follows this latter fit lens because
it enables the understanding of the effectiveness of the interactions between context and
design (Islam & Hu, 2012).
On the other hand, contingency theory has also been criticised for several reasons. For
instance, Reid &Smith (2000) argue that contingency theory of MA has limited ways of
explaining how particular peculiarities or contingencies shape the adoption of MAS within
organisations. This view is contradicted by findings by other researchers that argued that
MAS can both influence and be influenced by contingencies (Chenhall, 2003). Moreover,
contingency theory lacks clarity and specificity (eg. Variables are ill defined) (Fisher, 1995).
3.2.2 The Contingency Perspective of Managerial Accounting Research: The Core
Variables
There are increasing ‘persuasive arguments in favour’ (Langfield-Smith, 2008, p.209) (e.g.,
Bromwich, 1990; Bromwich & Bhimani, 1994; Cadez & Guilding, 2007; inter alia3); of SMA
or SCM (across the Atlantic). This contingency approach borrows from previous research
(See Table 3.1) concerning the critical variables, their cross interaction and influence on
organisational performance.
3 e.g., Johnson & Kaplan, 1987; Miller & O’Leary, 1994; Roslender, 1996; Kaplan & Norton, 1992, 1996;
Roslender & Hart, 2002a, 2002b, 2003; Shank, 2007; Anderson, 2007; Langfield-Smith, 2008

Chapter 3: Literature Review – Contingency Theory and Strategic Management Accounting Techniques
Jafar Ojra - 30 -
Table 3.1: Some selected Studies on Contingency Approach and the Explored Variables
S/Nr. Studies Context (National &
Industrial
MA/SMA/
Other
Explored Contingency Variables
1 Guilding &
McManus (2002)
Australian companies SMA SMA (Customer Accounting), Market
Orientation, Intensity of competition
2 Cinquini & Tenucci
(2010)
Italian manufacturing
companies
SMA Business Strategy, Strategic Management
Accounting, Company Size
3 McManus (2012) Australian Hotel
industry
CA (SMA)
& MP
Customer Accounting & Marketing Performance.
Factors explored included competition intensity,
environmental uncertainty, organisational factors
(strategy, structure, market orientation, size),
customer measures, Performance (financial and
non-financial
4 Alrawi & Thomas
(2007)
UAE Commercial
Banks
MAIS Management accounting, financial accounting,
evaluation of banks accounting system, etc.
5 Kholeif et al. (2007) Egyptian companies IAP
Enterprise Resource Planning (ERP)
6 Cadez & Guilding,
(2008)
Slovenian companies,
Multi-industry
SMA Strategic Management Accounting Variables,
Market Orientation, Business Strategy, Company
Size, and Organisational Performance.
7 Huang et al. (2010) Malaysian companies Intellectual
Capital
Environmental Uncertainty, Business Strategy,
Technological advancement, market to book ratio,
Organisational size, Profitability, industry type
8 Soobaroyen &
Sannassee (2007)
Mauritius’ Voluntary
Organisation
FP & CP Financial planning, Management accounting
(MA) control Techniques
9 Hwang (2005) South Korean
retailing industry
SMI Environmental uncertainty, Business strategy,
market orientation, organisational structure,
organisational performance
10 Waweru (2008)
Canadian
Manufacturing firms
MACS Management Accounting Systems, Organisational
structure, Organisational size, Intensity of
competition, Technology, Competition strategy,
Management Accounting Change
11 Dik (2011) Arab Countries Sharia
compliant companies
MAS Cultural dimensions, Organisational structure,
Management accounting instruments, and
Environmental circumstances

Chapter 3: Literature Review – Contingency Theory and Strategic Management Accounting Techniques
Jafar Ojra - 31 -
12 Kattan et al. (2007) Palestinian Company MAPs External Environmental Uncertainties and
Management Accounting and Control Systems
13 Waweru et al.
(2004)
South African retail
companies
MAPs Management Accounting Practices,Organisational
Performance, Environmental uncertainty
14 Guilding et al.
(2005)
UK and Australian
companies
SMA (cost-
plus pricing)
Cost-plus pricing (SMA), Competition intensity,
company size, Industry type
15 Cravens & Guilding
(2001)
New Zealand, UK &
US strongly branded
companies
SMA
(BVA)
Brand value accounting, Internal Management
decision making and control
16 Cadez & Guilding
(2007)
Slovenian and
Australian Companies
SMA Strategic Management Accounting techniques
17 Abdul Rasid et al.
(2011)
Malaysian Financial
institutions
MAS Technology, Organisational Structure, Innovation,
Management Accounting System, and
Organisational performance
18 Löfsten & Lindelöf
(2005)
Swedish Technology-
based firms
MAPs
(SMA)
Environmental hostilities, Strategic orientation,
Technology, Management accounting techniques,
and performance
19 Govindarajan &
Gupta (1985)
US firms (multi-
industry
MCS Strategy, incentive bonus systems, firm control
systems, and organisational performance
20 Merchant (1985)
AIS Company Size, Product Diversity, Strategy,
Decentralisation and use of Budgetary
Information, and performance
21 Abdul-Kader &
Luther (2006)
UK food and drinks
industry
SMA Strategic management accounting practices,
Strategy, organisational performance, decision
making information
22 Hyvönen (2008) Manufacturing firms
in Finland
MAS Technology, Strategy, management accounting
system, and organisational performance
23 Bhimani &
Langfield-Smith
(2007)
UK firms (large) SMA Structure, formality, financial & non-financial
information, strategy implementation and
strategic management accounting
24 Haldma & Lääts
(2002)
Estonian
Manufacturing firms
MAPs Environmental factors, technology, organisational
factors, strategy, management accounting
systems, and performance

Chapter 3: Literature Review – Contingency Theory and Strategic Management Accounting Techniques
Jafar Ojra - 32 -
25 Tuan Mat (2010) Malaysian
Manufacturing
industry
MAPs Strategy, organisational structure, environment,
technology, organisation size, management
accounting practices and organisational change,
and performance
26 Chenhall (2003) Critical review of past
studies
MCS Management control systems, organisational
performance
27 Guilding (1999) New Zealand
Companies
SMA Strategic management accounting techniques,
company size, competitive strategy and strategic
mission
28 Hoque (2004) New Zealand
Manufacturing
Companies
SMA Strategic management accounting, Business
Strategy, Environmental Uncertainty, and
Organisational Performance
29 Nimtrakoon &
Tayles (2010)
Thailand
manufacturing and
non-manufacturing
companies
MAPs Management accounting practices, perceived
environmental uncertainty, company size,
competitive strategy
30 Guilding et al.
(2000)
New Zealand, UK and
US companies
SMA Strategic Management Accounting Techniques,
Company size
31 Anderson & Lanen
(1999)
Indian firms MAPs Competitive strategy, management accounting
practices, firm specific factors and performance
Key: MA/SMA = Management Accounting/Strategic Management Accounting; MAI = Management Accounting
Information; MAPs = Management Accounting Practices; MA & PC = Management Accounting & Political Control; MAS
= Managerial Accounting Systems; IAP = Institutionalised Accounting Practices; FP & CP = Financial Planning & Control
Practices; SMI = Strategic Management Implementation; MAIS= Management Accounting Information Systems; CA(SMA)
& MP = Customer Accounting & Marketing Performance; BVA = Brand Value Accounting; MACS = Management
Accounting and Control Systems
Source: Facts Collated by the author from past Studies

Chapter 3: Literature Review – Contingency Theory and Strategic Management Accounting Techniques
Jafar Ojra - 33 -
Justified by the focus defined in the research objectives (See Section 1.4), the strategy and
organisational environment (external and internal) contexts are explored, in relation to
strategic management accounting usage and organisational performance. Next, the theoretical
foundations concerning these realms are reviewed in the following order:
1. Strategic Management Accounting (SMA) Techniques (Section 3.3);
2. Organisational Environment (Section 3.4);
3. Organisational Strategy (section 3.5)
4. Organisational Performance (Section 3.6)
3.3 Strategic Management Accounting (SMA) Techniques
“During the last decade, both academics and practitioners have started to question prevailing
traditional management accounting thinking” (Joshi, 2001, p.86). With ever increasing
competition and changes in production environment, cost structures, and rapidly developing
technologies, a change in management accounting practices is pertinent (Joshi, 2001). These
comments underline the logic behind the strategic management accounting (SMA) view.
The transformation of management accounting (Roslender & Hart, 2003) is grounded on the
need for accounting for strategic positioning (Roslender, 1995, 1996), a perspective that
builds on the strategic management accounting foundation which was first introduced by
Simmonds (1981) and subsequently positioned by Bromwich (1990).
Essentially, SMA advocates contend that, for a more market oriented focus, strategically
tailored accounting is pertinent (Langfield-Smith, 2008). Since its first mention by Simmonds
(1981) in the UK professional magazine, Management Accounting (p.12), there are increasing
‘persuasive arguments in favour’ (Langfield-Smith, 2008, p.209) (e.g., Bromwich, 1990;

Chapter 3: Literature Review – Contingency Theory and Strategic Management Accounting Techniques
Jafar Ojra - 34 -
Bromwich & Bhimani, 1994; Cadez & Guilding, 2007; inter alia4); of SMA or SCM (across
the Atlantic).
According to the strategic management accounting logic, “to survive, a firm must continue to
offer the cheapest way for consumers to obtain the desired bundle of attributes” (Langfield-
Smith, 2008, p. 209), and organisations must align their management accounting activities
towards this target (Bromwich, 1990). In the words of Joshi (2001), if management
accounting is to maintain its relevance in today’s increasing level of globalisation, it needs to
meet the changing needs of managers” (p.86).
That management accounting view matches the contingency perspective, which proposes that
flexibility and adaptability are important for the survival of organisations, and the system
needs to be designed to support such adaptability (e.g., Gordon & Miller, 1976; Waterhouse
& Tiessen, 1978; Kattan et al., 2007). In the view of Khandwalla (1977) the contingency
theory emphasises the need to examine the interface between the organisation and its
environment.
The management accounting tools used in the organisation must therefore be strategically
designed and implemented to fit the circumstances of the organisation. Undoubtedly, interest
in SMA is growing (see Roslender & Hart, 2003; Cadez & Guilding, 2009, 2008; Bhimani &
Langfield-Smith, 2007; Langfield-Smith, 2008; inter alia). However, there is still no
consensus as to what constitutes SMA (Cadez & Guilding, 2008; Roslender & Hart, 2003;
Tomkins & Carr, 1996; Nyamori et al., 2001). More research therefore is needed to illuminate
“the adoption of strategically-oriented management accounting techniques and accountant’s
participation in strategic management processes” (op. cit.). More so, further research will
enable the understanding of how accountants fit into the strategic management process.
4 e.g., Kaplan & Johnson, 1987; Miller & O’Leary, 1994; Roslender, 1996; Kaplan & Norton, 1992, 1996;
Roslender & Hart, 2002a, 2002b, 2003; Shank, 2007; Anderson, 2007; Langfield-Smith, 2008

Chapter 3: Literature Review – Contingency Theory and Strategic Management Accounting Techniques
Jafar Ojra - 35 -
A review of literature identifies two perspectives of SMA (Cadez & Guilding, 2008, p.838).
First, SMA is conceived as a set of strategically oriented accounting techniques. Secondly,
SMA is viewed as concerned with the involvement of accountants in the strategic decision
making process. In this study, the interest is to capture the use of SMA in Palestinian
companies; therefore the first conceptualisation of SMA is used in this study. It is important
to explore the use of SMA techniques (Cinquini & Tenucci, 2010; Cadez & Guilding, 2008;
Cravens & Guilding, 2001).
In their 2008 study, Cadez & Guilding asked the question “what is strategic management
accounting?” (p.838). A number of studies have examined the contingency context and
strategic management accounting tools as evident in Table 3.1 above shows. While there is
increasing research interest in SMA, “due to the increasing importance to managers”
(Cinquini & Tenucci, 2010, p.230), the area is still under defined and no universally accepted
SMA framework exists (Coad, 1996; Nyamori et al., 2001; Roslender & Hart, 2003; Tomkins
& Carr, 1996; Cadez & Guilding, 2008; Langfield-Smith, 2008; Cinquini & Tenucci, 2010).
Offering a strategic management perspective, Brouthers & Roozen (1999) specified core
“strategic functions” that information provided by a strategic accounting system should
support, namely environment analysis, strategic alternative generation, strategic alternative
selection, planning the strategic implementation, implementing the strategic plan, and
controlling the strategic management process.
“Even though the “external orientation” of SMA is well established, it can be interpreted in
different ways” (Cinquinin & Tenucci, 2010, p.231). This “external orientation” of SMA
(Guilding et al., 2000) can be explained as underlining the importance of accounting
information about competitors, suppliers and customers. Simmonds (1981, 1982, and 1986)
conceptual framework stressed this competitor information (related to costs, prices, market

Chapter 3: Literature Review – Contingency Theory and Strategic Management Accounting Techniques
Jafar Ojra - 36 -
share, etc.) importance in developing and monitoring business strategy. Several other authors
also reinforced the competitor information importance to competitive advantage (e.g., Jones,
1988; Bromwich, 1990; Ward, 1992; Moon & Bates, 1993). Several accounting approaches,
financial and non-financial can aid this effort: competitive benchmarking, financial statement
competitive analysis and position monitoring (Cinquini & Tenucci, 2010).
Essentially, such “external orientation” drive should focus on the product offer that can satisfy
customers’ needs, as well as take into consideration the product attributes costs (Bromwich,
1990), the satisfaction of customers’ needs and the achievement of a desired target profit/cost
(Monden & Hamada, 1991; Morgan, 1993; Ewert & Ernst, 1999) or performance (Narver &
Slater, 1990). In a more recent study, Anderson (2007) developed an approach based on value
chain analysis, introducing a core distinction between structural cost management, which aims
to build cost structures coherent with strategy by means of organisational, product and process
design tools, and execution cost management, which focuses on effective measurement tools
for cost performance evaluation.
Further on the external orientation, a core consideration is that most SMA techniques are
“cost-based” (Hoque, 2001). Given the advances in cost management over the last decades
that have enabled accounting information to support strategic decision making, this is not
surprising (Cinquini & Tenucci, 2010). As the activity-based costing (ABC) approach
(Johnson & Kaplan, 1987; Cooper & Kaplan, 1988) spread, the dimensions of cost analysis
have been expanded, leading to the refinement in cost information of yet unexplored cost
objects, such as activities, customers, product attributes and unused capacity. These
developments aid decision making and enhance competitive advantage in an increasingly
competitive business environment (Cinquini & Tenucci, 2010).

Chapter 3: Literature Review – Contingency Theory and Strategic Management Accounting Techniques
Jafar Ojra - 37 -
Additional to cost, the relevance of non-financial information has been increasingly
emphasized, as it provides predictive trends in the performance of the overall organisation
(Nanni et al., 1992; Ittner & Larcker, 1998).
Guilding et al. (2000) distilled SMA techniques and also provides criteria for viewing a
particular accounting technique as strategic. In their view, accounting techniques that qualify
as SMA must demonstrate degrees of the following orientations: environmental (outward-
looking) and/or long-term (forward-looking). Using these criteria, Guilding et al. (2000)
identified 12 SMA techniques from the literature. In a subsequent development, Cravens &
Guilding (2001) added another three techniques.
The context of the strategic management accounting technique to be measured in this study is
justified on methodological precedence (Cadez & Guilding, 2008), which utilised and
extended the distillation of SMA techniques in Guilding et al. (2000) and Cravens &Guilding
(2001). Combining Guilding et al. (2000), Cravens & Guilding (2001) and Cadez & Guilding
(2008) five categories of SMA techniques are explored in this study. In this study, using the
approach in Cadez & Guilding (2008) is appropriate for a number of reasons:
1. Cadez & Guilding (2008) expands on the works of Guilding et al. (2000) and Cravens
and Guilding (2001),
2. These techniques demonstrate degrees of the following orientations (Guilding et al.,
2000; Cravens & Guilding, 2001; Cadez & Guilding, 2008; Cinquini & Tenucci,
2010): environmental (outward-looking) and/or long-term (forward-looking),
3. This fits the need for multi-dimensionality and measurement typologies
(financial/non-financial) (Cadez & Guilding, 2008; Cinquini & Tenucci, 2010),
4. These criteria have been numerously validated in past studies.

Chapter 3: Literature Review – Contingency Theory and Strategic Management Accounting Techniques
Jafar Ojra - 38 -
Out of the five categories covered in this study, three correspond to management accounting
themes acknowledged in many management accounting texts: (1) costing, (2) Planning,
control and performance measurement, and (3) Strategic decision making. The last two are
“customer accounting” and “competitor accounting”. Next, the theoretical foundations for the
five categories of strategic management accounting techniques explored in this study are
summarised, namely; Costing (Section 3.3.1), Planning, Control and Performance
Measurement (Section 3.3.2), Strategic Decision Making (Section 3.3.3), Competitor
Accounting (Section 3.3.4), and Customer Accounting (Section 3.3.5).
3.3.1 Costing
Organisations can develop and identify superior strategies that would generate a sustainable
competitive advantage by using cost data based on strategic and marketing information
(Cadez & Guilding, 2008). Following the trend in past studies, costing is conceptualised to
include five core techniques, namely, attribute costing (e.g., Bromwich, 1990; Roslender &
Hart, 2003), life-cycle costing (e.g., Cadez & Guilding, 2008; Cinquini & Tenucci, 2010;
Dunk, 2004), quality costing (e.g., Heagy, 1991; Cinquini & Tenucci, 2010), target costing
(e.g., Monden & Hamada, 1991; Cadez & Guilding, 2008; Cinquini & Tenucci, 2010), and
value chain costing (e.g., Cadez & Guilding, 2008; Shank & Govindarajan, 1992).
Attribute Costing
According to Lancaster (1979), products are made up of a package of attributes which
constitute commodities that appeal to consumers. Attributes, which include operating
performance variables, reliability and warranty arrangements, the degree of finish and trim as
well as service factors, differentiate products and the matching of a product’s attribute with
the consumers tastes determines a firm’s market share (Guilding et al., 2000).

Chapter 3: Literature Review – Contingency Theory and Strategic Management Accounting Techniques
Jafar Ojra - 39 -
Life-Cycle Costing
Several commentaries exist in the literature concerning the life-cycle costing (e.g., Shields &
Young, 1991; Wilson, 1995; Cinquinin & Tenucci, 2010). Explaining the strategic
implications connected to this perspective, Wilson (1995) notes that, rather than appraising
costs on an annual basis, the relevant time frame in life cycle costing depends on the stages in
a product’s life.
Quality Costing
One other strategically oriented approach to costing is quality costing analysis. Whether
perceived or real, product or service quality can be a source of competitive advantage
(Guilding et al., 2000). Heagy (1991) classifies quality costs as prevention, appraisal and
failure costs. Management may monitor these costs to secure an optimal level of relativities
(Guilding et al., 2000).
Target Costing
This refers to the process where a product is designed to satisfy a customer need and a target
cost is determined for the product (Guilding et al., 2000). This target costing philosophy can
be categorised as strategic management accounting as it moves costing away from a quest for
accurate monitoring towards forward-looking costing philosophy aimed for competitive
advantage (Guilding et al., 2000).
Value Chain Costing
Building on Porter’s (1985) value chain analysis, Shank & Govindarajan (1992) proposed a
costing approach. According to Porter (1985), marketplace competitive advantage is derived
from providing better customer value for equivalent cost, or equivalent customer value for
lower cost. Porter describes the series of activities occurring between a product’s design and
distribution as links in a chain, a thinking upon which the value chain analysis is based. Thus

Chapter 3: Literature Review – Contingency Theory and Strategic Management Accounting Techniques
Jafar Ojra - 40 -
the value chain analysis concerns identifying how customer value can be enhanced or costs
lowered in a firm’s relevant segment of the value chain (Guilding et al., 2000). According to
Shank & Govindarajan (1992), value chain costing provides (1) a useful extension to
conventional cost analysis, and (2) insights for make/buy and forward/backward integration
decision making.
3.3.2 Planning, Control and Performance Measurement
The planning, control and performance element of strategic management accounting
conceptualisation in this study includes benchmarking (e.g., Elnathan et al., 1996; Brownlie,
1999) and integrated performance measurement (e.g., Chenhall, 2005; Ittner et al., 2003;
Kaplan & Norton, 1996; Cadez & Guilding, 2008).
Benchmarking
This technique involves identifying the best practices and comparing the organisation’s
performance to an ideal standard (Cadez & Guilding, 2008; Cinquini & Tenucci, 2010) with
the goal of improvement. While there are many benchmarking typologies (Miller et al., 1992;
Mcnair & Leibfried, 1992), they generally underline the external strategic orientation toward
competitors (Cinquini & Tenucci, 2010).
Integrated Performance Measurement (Balanced Scorecard)
According to Cinquini & Tenucci (2010), the consideration of both financial and non-
financial measures defines an integrated performance measurement system (Cross & Lynch,
1989; Nanni et al., 1992). Cadez & Guilding (2008) note that this system focuses mainly on
acquiring performance knowledge based on customer requirements. This measure, they
further note, involves departments monitoring the factors critical to securing customer
satisfaction.

Chapter 3: Literature Review – Contingency Theory and Strategic Management Accounting Techniques
Jafar Ojra - 41 -
3.3.3 Strategic Decision Making
The strategic decision making SMA techniques for this study include strategic costing
(strategic cost management (e.g., Shank, 1996; Shank & Govindarajan, 1993), strategic
pricing (e.g., Rickwood et al., 1990) and brand valuation (e.g., Cravens & Guilding, 1999;
Guilding, 1992).
Strategic Costing (Strategic Cost Management)
A number of studies have explored strategic costing (e.g., Shank & Govindarajan, 1991, 1992,
1993). They maintain that to effectively support the pursuit of competitive advantage, the cost
analysis must explicitly consider strategic issues. In the words of Cadez & Guilding (2008),
this involves “the use of cost data based on strategic and marketing information to develop
and identify superior strategies that will produce a sustainable competitive advantage.
Strategic Pricing
It is important to explore strategic pricing as a subset of strategic management accounting
(Jones, 1988; Simmonds, 1982; Cadez & Gilding, 2008). Simmonds (1982): strategic pricing
which uses competitively-oriented analysis will result in a better-informed pricing decision.
Core factors that might be appraised in such an analysis are competitor price reaction, price
elasticity, projected market growth, and economies of scale and experience (Guilding et al.,
2000; Cadez & Guilding, 2008).
Brand Valuation
As an accounting technique, brand valuation has been the subject of considerable accounting
debate (Power, 1990). Taking the management accounting perspective of brand valuation, its
potential as a measure of marketing achievements in a strongly branded company becomes
apparent (Guilding & Moorhouse, 1992; Guilding & Pike, 1994).

Chapter 3: Literature Review – Contingency Theory and Strategic Management Accounting Techniques
Jafar Ojra - 42 -
The strategic impact of brand valuation, might, amongst others, be dependent on the valuation
method used (Guilding et al., 2000). Guilding & Pike (1994): when the valuation method used
is similar to that developed by Interbrand, strategic implications are manifest. Cadez &
Guilding (2008) suggest that financial valuation of a brand through the assessment of a brand
strength should include factors like leadership, stability, market, internationality, trend,
support, and protection combined with historical brand profits.
3.3.4 Competitor Accounting
Three competitor accounting techniques of strategic management accounting are explored in
this study, namely, competitor cost assessment (e.g., Bromwich, 1990; Jones, 1988; Cinquini
& Tenucci, 2010), competitor position monitoring (e.g., Rangone, 1997; Guilding, 1999), and
competitor performance appraisal (e.g., Moon & Bates, 1993; Cinquini & Tenucci, 2010).
Competitor Cost Assessment
Researches have examined competitor cost assessment in contingency studies (e.g.,
Bromwich, 1990; Jones, 1988; Ward, 1992; Guilding et al., 2000; Cadez & Guilding, 2008;
Cinquinin & Tenucci, 2010). Competitor cost assessment has been widely discussed in SMA
practice (Guilding et al., 2000); a fact that may be attributed partially to the increased level of
technologically advanced investments (Guilding et al., 2000).
Competitor cost assessment concentrates mainly on cost structures of competitors (Simmonds,
1981). There are different sources of competitor cost information (Cinquini & Tenucci, 2010).
Jones (1988) outlines a competitor cost assessment approach that involves, amongst others,
appraising competitors’ manufacturing facilities, economies of scale, governmental
relationships and technology-products design. Further to these, Ward (1992) pinpoints
indirect sources of competitor information, namely, physical observation, mutual suppliers,
mutual customers, and employees (including ex-employees of competitors).

Chapter 3: Literature Review – Contingency Theory and Strategic Management Accounting Techniques
Jafar Ojra - 43 -
Competitor Position Monitoring
Advocated by Simmonds (1986), competitor position monitoring represents a more holistic
approach to competitor appraisal. This SMA technique focuses on the provision of competitor
information like sales, market share, volume and unit costs (Simmonds, 1981, 1986; Guilding
et al., 2000; Cadez & Guilding, 2008; Cinquin & Tenucci, 2010). Based on these SMA
information types, a company is able to assess its position relative to major competitors and,
as a consequence, control or formulate its strategy (Guilding et al., 2000; Cinquini & Tenucci,
2010).
Competitor Performance Appraisal
According to literature, a good source for obtaining competitor performance
appraisal/evaluation information is public financial statements (e.g., Moon & Bates, 1993;
Cinquini & Tenucci, 2010). As Moon & Bates (1993) note, these information types are key
sources of competitive advantage, and include monitoring trends in sales and profit levels, and
assets and liability movements. Strategically significant insights can be derived from carefully
conducted analysis of a competitor published statements.
3.3.5 Customer Accounting
This technique considers customers or group of customers as a unit of accounting analysis
(Bellis-Jones, 1989; Guilding & McManus, 2002; McManus, 2012). Customer accounting
includes all practices designed to appraise profit, sales or costs deriving from customers or
customer segments. This accounting approach is classified as SMA technique, because it is
widely related with relational marketing (Cinquini & Tenucci, 2010). The customer
accounting conceptualisation includes customer profitability analysis (e.g., Zeithaml, 2000;
Guilding & McManus, 2002), lifetime customer profitability analysis (e.g., Foster & Gupta,
1994; Jacob, 1994), and valuation of customers as assets (e.g., Foster et al., 1996; Zeithaml,
2000; Guilding & McManus, 2002).

Chapter 3: Literature Review – Contingency Theory and Strategic Management Accounting Techniques
Jafar Ojra - 44 -
Customer Profitability Analysis (CPA)
According to literature (Cadez & Guilding, 2008; Guilding & McManus, 2002; McManus,
2012), this involves calculating the profit earned from a specific customer. The profit
calculation is based on costs and sales that are traceable to a specific customer (Cadez &
Guilding, 2008). This technique is also referred to as “customer account profitability” (Cadez
& Guilding, 2008).
Lifetime Customer Profitability Analysis
This is an important customer accounting element of SMA technique (Cadez & Guilding,
2008; McManus, 2012). This technique involves extending the time horizon for customer
profitability analysis to include future years (Cadez & Guilding, 2008). It focuses on all
anticipated future revenue streams and costs involved in servicing a particular customer
(Cadez & Guilding, 2008).
Valuation of Customers as Assets
This technique refers to the calculation of the value of customers to the company (Cadez &
Guilding, 2008). This could be done by computing the present value of all future streams
attributable to a particular customer.

Chapter 3: Literature Review – Contingency Theory and Strategic Management Accounting Techniques
Jafar Ojra - 45 -
3.4 Organisational Environment
In this section, a review of literature on organisational environment is undertaken. After the
introduction (section 3.4.1), the external environment (section 3.4.2) and internal environment
(section 3.4.3) foundations are presented.
3.4.1 Introduction
In management accounting and control literature, environment is a key factor that determines
the management accounting and control systems design used by the organisation (Ezzamel,
1990; Gordon & Miller, 1976; Jusoh, 2010). “Environment is an important aspect of
contingency theory” (Dik, 2011, p.52). An organisation environment includes all factors and
dimensions that surround the organisation. These include all factors that may have potential or
actual influence on the organisation (Macy & Arunachalam, 1995, p.67). To profitably satisfy
customers in their market, organisations must effectively adapt to the factors and dimensions
in their environment (Hwang, 2005; Kattan et al., 2007; Dik, 2011). Many studies call for this
factor to be explored because of its association to SMA usage and organisational performance
and other contingency factors.
“Environments are viewed as a complex system of interrelated economic, market,
technological, social and political variables” (Kattan et al., 2007, p.229). According to
Chenhall (2007, p.172) environment refers to “particular attributes such as intense price
competition from existing or potential competitors”. Based on literature (e.g., Hwang, 2005;
Kattan et al., 2007; Dik, 2011; Tuan Mat, 2010), both internal and external environment
factors need to be explored.
Next, the external environment and internal environment literature are reviewed
Chapter 3: Literature Review – Contingency Theory and Strategic Management Accounting Techniques
Jafar Ojra - 46 -
3.4.2 External Environment of Organisation
The external environment of an organisation includes factors like law, politics, economics,
culture and demographics (Tuan Mat, 2010). Researches that explored the external
environment factors in the contingency perspective relative to management accounting
practices identify two core factors, namely external environment (e.g., Khandwalla, 1977;
Merchant, 1990; Chapman, 1997; Hartmann, 2000; Haldma & Lääts, 2002) and culture (e.g.,
Hofstede, 1984; Harrison, 1992; O’Connor, 1995).
In the strategy decision making (e.g., Elbanna & Child, 2007; Elbanna, 2006; Fredrickson,
1984; Goll & Rasheed, 1997) and contingency (e.g., Haldma & Lääts, 2002; Hwang, 2005;
Dik, 2011) literature, the most widely researched aspects are environmental uncertainty and
hostility. Reviewing the literature in both realms, a contextualisation difference was evident.
While strategy literature largely examines environment uncertainty and hostility differently,
contingency perspective tends to embrace both in the conceptualisation of environmental
uncertainty.
This present study follows a contingency tradition and examines both as elements of
environmental uncertainty. Also, this study explores a single country (Palestine) context, and
since the researcher does not expect culture driven differences, the culture element of external
factors is not explored in this study. Moreover, in the existing literature in leading
management accounting academic journals; despite indicating that culture is influential, did
not suggest to include culture in current SMA and performance management literature. It
might be that those studies were carried on in western capitalist economies where national
culture does not have a direct impact; hence it does not appear as a contingency variable.

Chapter 3: Literature Review – Contingency Theory and Strategic Management Accounting Techniques
Jafar Ojra - 47 -
In the literature, the concept of uncertainty has been defined in a variety of ways (Hwang,
2005). Decision theorists (Knight, 1921; Luce & Raiffa, 1957) define uncertainty “as those
situations where the probability of the outcome of events is unknown, as opposed to risk
situations where each outcome has a known probability” (cited in Hwang, 2005, p.19). Miller
(1993) defined uncertainty as “the unpredictability of environmental or organisational
variables that have impact on corporate performance” (p.694).
Kahneman & Tversky (1982) suggest that a more insightful approach to uncertainty is to
equate it with unpredictability, the incapability to predict future events. Cited in Dik (2011,
p.52), “environment uncertainty is defined as a lack of information regarding the
environmental factors associated within a given decision making situation, not knowing the
outcome of a specific decision” (Fisher, 1998). This lens is also supported by Alkaraan &
Northcott (2006) who comment that in uncertain environments executives neither have access
to all relevant information nor are they are able to anticipate all the consequences.
Thus, environmental uncertainty is the gap between the information which one has and the
information that one needs to perform a task (Galbraith, 1977). On the other hand,
environmental hostility munificence concerns the ability of the environment to support the
sustained organisational growth (Dess & Beard, 1984) and/or the degree of resource
abundance (Hodge et al., 2003).
The above contextualisation of environmental uncertainty are also emphasised by Milliken
(1987) who categorises three facets of uncertainty, namely; (1) lack of clarity about cause-
effect of relations; (2) inability to predict the probability of future event that may favour one
alternative or another; and (3) the unpredictability of outcomes. Uncertain environment,
which is impacted by high competition, is an important contextual variable in contingency-
based research (Tuan Mat, 2010).

Chapter 3: Literature Review – Contingency Theory and Strategic Management Accounting Techniques
Jafar Ojra - 48 -
Complexity and rate of change are two features that characterise environment uncertainty
(Duncan, 1972; Tung, 1979). According to Child (1972), complexity is caused by the
heterogeneity of relevant environmental events. Rate of change involves the frequency of
changes that occur in the external environment (Daft et al., 1988).
Two levels of uncertainty continuum apply to the aforementioned variables, namely ‘low’ and
‘high’. In low environmental uncertainty conditions, the variables and rules of the
environment are generally understood (Kattan et al., 2007; Smart & Vertinsky, 1984). On the
other hand, dynamism, highly unpredictable changes, variables and rules that are not easily
understood, characterise high environmental uncertainty (Kattan et al., 2007; Hwang, 2005).
From reviewed literature, the core elements of external environment factors, also called
external environment uncertainty, include market and competitive pressures (e.g., Greenwood
& Hinings, 1996; Powell, 1991; Kholeif et al., 2007; Hwang, 2005; Guilding & McManus,
2002). Other studies also classify socio-political factors as elements of perceived
environmental uncertainty of an organisation (e.g., Dik, 2011; Tuan Mat, 2010). In their
definition of external environmental attributes, Hickson et al. (2001) include governmental
agencies, customers, suppliers, competitors and unions.
The environment creates opportunities and threats to organisations (Hwang, 2005) and shapes
organisational structure, processes, and managerial decision making (Duncan, 1972; Keats &
Hitt, 1988). In the contingency literature related to strategic management accounting context,
environmental uncertainty impacts on organisational structure, performance evaluation,
budgeting and budgetary control, and are associated with more open and externally focused
accounting systems (Haldma & Lääts, 2002; Astley & Van de Ven, 1983; Hwang, 2005).

Chapter 3: Literature Review – Contingency Theory and Strategic Management Accounting Techniques
Jafar Ojra - 49 -
Research efforts on environmental uncertainty have mainly examined perceived
environmental uncertainty, thus focusing on management’s perceptions of uncertainty in the
business environment (e.g., Hwang, 2005; Dik, 2011; Jusoh, 2010), and this is the approach in
this study.
3.4.2.1 Perceived Environmental Uncertainty (PEU)
The perceptual lens of environmental uncertainty suggests that the environment could be
considered certain or uncertain only to the extent that decision makers perceive it to be so
(Achrol & Stern, 1988; Duncan, 1972; Pfeffer & Salancik, 1978). According to Daft et al
(1988), perceived environmental uncertainty is the absence of information with regard to
organisations, activities, and events in the environment. As observed by Ebrahimi (2000)
researches largely emphasise perceived environmental uncertainty and the subjective, rather
than the objective data produced and used by strategic decision makers.
Empirical results suggest that individuals in decision units facing dynamic, complex
environments experience the greatest amount of uncertainty in decision making (Hwang,
2005, p.24). When the marketing environment changes companies face uncertainty, threats
and opportunities (Dibb, 1996). Organisations must therefore recognise changes in the
environmental factors and respond effectively. Following the pattern shown in previous
studies (e.g., Guilding & McManus, 2002; Hwang, 2005; Dik, 2011), the conceptualisation of
perceived environmental uncertainty in this study includes market turbulence and competitive
intensity. These two attributes are of core research interest in the strategic management field
(Baum & Wally, 2003; Alkaraan & Northcott, 2006).
Chapter 3: Literature Review – Contingency Theory and Strategic Management Accounting Techniques
Jafar Ojra - 50 -
3.4.2.1.1 Market Turbulence
Organisations face dramatic and sudden twists in their environment. When the environment
becomes very dynamic, challenging and complex, traditional managerial orientations become
inadequate (Hwang, 2005). In such environmental possibilities organisations face the threat of
losing market position, declining profits or outright business failure (Cooper, 1979; Covin &
Slevin, 1989; Hayes & Abernathy, 1980; Waterman, 1987; Hwang, 2005; Chakravarthy,
1997). “The more hostile and turbulent the external environment, the greater the reliance on
formal controls and emphasis on traditional budgets” (Chenhall, 2007, p.173).
According to Smart & Vertinsky (1984) market turbulence is the change that occurs in the
factors or components of an organisation’s environment. There are two continuums of a
turbulent market situation, they explained: at one end is no change, and at the other is a
turbulent or dynamic environmental state where all factors are constantly changing. In highly
turbulent environments, unpredictability and uncertainty characterise factors, and variables
and their importance levels move in unpredictable manner (Smart & Vertinsky, 1984).
Other literature on market turbulence (e.g., Emery & Trist, 1965; Terreberry, 1968;
Thompson, 1967) pinpoints two core characteristics of market turbulence, namely, complexity
and dynamism. In their study that discussed the characteristics of information in a turbulent
environment, Wang & Chan (1995) defined complexity as “the number and diversity of
external factors facing the firm”; and dynamism as “the degree of change exhibited in those
factors (p.34). As noted by Wang & Chan (1995), changes in a turbulent environment are
characterised by one or more of high complexity, high dynamism, high novelty, and low
visibility.
According to Wang & Chan (1995, p.34), “high complexity requires top managers to consider
a large number of factors from various environmental segment (e.g., competitive, economic,

Chapter 3: Literature Review – Contingency Theory and Strategic Management Accounting Techniques
Jafar Ojra - 51 -
political, technological, global) to make decisions. High novelty means that relevant events
and trends are discontinuous and unfamiliar to top managers. High dynamism indicates that
relevant environmental factors are in a continuous process of change. Low visibility means
that, by the time top managers must make decisions, the content of available information is
very vague and ambiguous”.
In their notion of environmental turbulence, Ansoff & McDonnell (1990) share similarity with
Wang &Chan (1995). They suggest complexity, novelty, rapidity of change, and visibility of
the future as four environmental turbulence characteristics. Explaining the four contexts,
Ansoff & McDonnell (1990) refers complexity to the variety of factors that management must
consider when making decisions and novelty to the discontinuity of successive challenges
which a firm encounters in its environment.
Further, the rapidity of change concerns the ratio of the speed of the evolution of changes to
the speed of the firm’s response; and the visibility of the future reflects the predictability of
information about the future as at the time of decision making (see also Wang & Chan, 1995).
Kohli & Jaworski (1990) note that market turbulence is a subset of environmental turbulence.
These scholars define market turbulence as the rate of change in the composition of customers
and their preferences (Kohli & Jaworski, 1990; Jaworski & Kohli, 1993). This customer
composition and preference perspective is also reinforced by Kandemir et al. (2006). Further
support to this view (Calantone et al., 2003) defines market turbulence as characterised by
continuous changes in customers’ preference/demands, in price/cost structures, and in the
composition of competitors. In a more turbulent market, a firm has to modify its products and
approaches to the market more frequently (Kandemir et al., 2006).
Egeren & O’Connor (1998) also support earlier mentioned notion (Kohli & Jaworski, 1990;
Jaworski & Kohli, 1993) and argue that market instability or dynamism could be driven by

Chapter 3: Literature Review – Contingency Theory and Strategic Management Accounting Techniques
Jafar Ojra - 52 -
changes in customers and in consumer preference. They explain that for environments with
unchanged consumers’ preference, organisations would rarely need to adjust their marketing
mix. On the other hand, for environments with constantly changing consumers and consumer
preferences, there is greater possibility that the organisation’s offerings will differ from
consumer needs.
Diverse views exist concerning the impact of market turbulence on the relationship and
behaviour of firms (Trkman & McCormack, 2009). On the one hand, when there is a fast
changing market, firms would drive to co-ordinate their efforts to reduce uncertainty and
respond to changes in demand. On the other hand, a firm might respond more swiftly to such
customers’ preferences changes, if the firm is operating on its own. For this second option,
there might be communication delays, especially where joint decision making is involved,
thus limiting the chance for pro-active measures (Chatterjee, 2004).
In line with the contingency theory, both of these views might be correct (Trkman &
McCormack, 2009, p.250): a focal firm with a flawed strategy and structure can survive in a
less turbulent environment, given low likelihood of potential risks; to the contrary, a focal
firm in a turbulent market must have in place a clear strategy for dealing with turbulence,
though the strategies may vary based on the organisation type.
Supporting this latter logic, Koo et al. (2007) argue that market turbulence positively
influences the adoption level of different generic strategies (cost leadership, market
differentiation, innovation differentiation, focus), while it does not have a direct impact on
firm performance.

Chapter 3: Literature Review – Contingency Theory and Strategic Management Accounting Techniques
Jafar Ojra - 53 -
3.4.2 1.2 Competitive Intensity
A number of studies have emphasised the need to explore competitive intensity in the
contingency literature (e.g., Hwang, 2005; Huang et al., 2010). Organisations compete for a
number of resources, for example, raw materials, selling and distribution channels, quality
and variety of products, and product price (Khandwalla, 1977; Gordon & Narayanan, 1984).
Due to intense competition, organisations are increasingly recognising the strategic
importance of providing an important source of competitive advantage (Kalagnanam &
Lindsey, 1998). Connecting to this logic, other literature (e.g., Yasai-Ardekani & Haug, 1997)
maintain that in highly competitive environments, advanced environmental signals must be
detected, and timely communication of environmental information is essential in such
circumstances. In such circumstances too, to achieve organisation-environment alignment, the
speed of decision making in the implementation of strategic decisions is critical (Yasai-
Ardekani & Haug, 1997).
Highly competitive environments are those with intense price and non-price competition
(Eisenhardt, 1989). The modern day marketplace is characterised by increased focus on
quality and better customer service (Hoque, 2004). To compete favourably in such conditions,
organisations must maintain an efficient and effective management accounting system
(Cooper, 1995).
This logic is supported by further literature: to respond rapidly and effectively, organisations
must embrace organisational integration and coordination (Khandwalla, 1972) and
organisations need management accounting and controls systems that track both financial and
non-financial performance (price, market share, marketing and product competition, number
of competitors and competitors’ actions) (Kaplan & Norton, 1996; Hoque et al., 2001; Baines
& Langfield-Smith, 2003; Cavalluzo & Ittner, 2004).

Chapter 3: Literature Review – Contingency Theory and Strategic Management Accounting Techniques
Jafar Ojra - 54 -
Competitors’ actions and reactions may be very unpredictable, and the speed of adjustment to
market becomes a critical survival factor to participants in such environment (Eisenhardt,
1989). Firms must become more flexible in responding to external environment changes
characterised by intense competition (Douglas, 1999).
“As competition becomes stronger, the choices available for consumers increase” (Hwang,
2005, p.27). Organisations must therefore find a means to discover customers’ wants and
build superior customer value than the competitor (Kohli & Jaworski, 1990). The
management accounting and control system plays a significant role in this means to achieving
a competitive edge. Therefore, as an organisation’s competitive environment becomes intense,
a more sophisticated management accounting and control system is needed to facilitate
improved managerial decision making (Libby & Waterhouse, 1996).
3.4.3 Internal Factors of Organisation
The internal factors of an organisation have also been classified as organisational factors (e.g.,
Khandwalla, 1972; Cadez & Guilding, 2008; Cinquini & Tennucci, 2010; Waweru, 2008).
The core internal factors include organisational structure (formalisation and decentralisation)
(Dik, 2011; Hwang, 2005; Waweru, 2008), organisational size (Cadez & Guilding, 2008;
Cinquini & Tennucci, 2010; Tuan Mat, 2010), and technology (Cadez & Guilding, 2008;
Haldma & Lääts, 2002; Waweru, 2008). Following this categorisation, these internal factors
are reviewed next under organisational factors (section 3.4.5).
3.4.4 Conclusion to the Environment of Organisation
Changes in environmental factors, additional to causing changes in the management
accounting and control systems implemented, also influence the role that management
accountants play within an organisation (Burns & Vaivio, 2001; Kattan et al., 2007). Other
studies that reinforce this logic (e.g., Fisher, 1995; Hartmann, 2000; Chenhall, 2003) argue

Chapter 3: Literature Review – Contingency Theory and Strategic Management Accounting Techniques
Jafar Ojra - 55 -
that environmental uncertainty is a major explanatory variable concerning the appropriateness
of accounting data in evaluating the performance of business units.
Heading research calls (e.g., Dik, 2011; Hwang, 2005; Cadez & Guilding, 2008), this study
seeks to contribute to knowledge on this contingency context of organisational environment
and management accounting decision system, namely strategic management accounting
(SMA), and examines the contexts of environmental uncertainty, organisational structure, and
organisational size.
For that target, this study follows the general view of environmental uncertainty (Baum &
Wally, 2003) and taps on the views in past studies (e.g., Elbanna, 2007; Elbanna & Child,
2007; Dik, 2011; Hwang, 2005).
This multidimensional exploration of environment uncertainty is necessary because (e.g.,
Elbanna, 2007; Lewis & Harvey, 2001; Werner et al., 1996; Miller, 1993) each dimension
may have different implications for managerial practices and organisational outcomes.
Similarly, this methodological and theoretical logic justifies the multidimensional exploration
of organisational structure. While the contextualisation of environmental uncertainty for this
study has been specified in section 3.4.2, the contextualisation for the internal factors, also
called organisational factors, is explained in section 3.4.5

Chapter 3: Literature Review – Contingency Theory and Strategic Management Accounting Techniques
Jafar Ojra - 56 -
3.4.5 Organisational Factors
According to relevant literature concerning the contingency theory of organisations,
organisational characteristics shape the best management accounting practices that fit for a
certain organisation. Haldma & Lääts (2002, p.383) note: “the most common internal factors
that have been examined in relation to management accounting are organisational size
(Khandwalla, 1972; Bruns & Waterhouse, 1975; Merchant, 1981), technology (Khandwalla,
1977; Merchant, 1984; Dunk, 1992), and companies’ strategy (Miles & Snow, 1978; Gupta &
Govindarajan, 1984; Simons, 1987; Chenhall & Morris, 1995)”.
Overall internal factors context of contingency literature however underlines three core
characteristics (factors) (e.g., Dik, 2011; Luft & Shield, 2007; Waweru, 2008), namely;
organisational structure, organisational size and technology. Following that foundation, these
organisational factors (organisational structure, organisational size and organisational
technology) are embraced in this study and therefore reviewed in this section. The review of
relevant literature concerning these contexts is presented in the following order:
1. General background literature (section 3.4.5.1),
2. Organisational structure (section 3.4.5.2),
3. Organisational size (section 3.4.5.3), and
4. Organisational technology (section 3.4.5.4).
3.4.5.1 General Background Literature
It is important to explore the internal contingency factors in organisational operations (e.g.,
Waweru, 2008; Hwang, 2005; Tuan Mat, 2010; Joshi, 2001). The internal (organisational)
contingencies (e.g., Hwang, 2005; Dik, 2011) include organisational size, organisational
structure, technology, and competitive strategy (Libby & Waterhouse, 1996; Hyvönen, 2007;
Waweru, 2008; Hwang, 2005; Tuan Mat, 2010).

Chapter 3: Literature Review – Contingency Theory and Strategic Management Accounting Techniques
Jafar Ojra - 57 -
As argued by literature (e.g., Haldma & Lääts, 2002; Seal, 2001), cited in Waweru, 2008
(p.27), “the list of contingencies and relations in a theoretical framework cannot be considered
exhaustive, since it is not possible to identify and include all the factors and impact”.
For this study of the contingency perspective of the use of strategic management accounting
techniques in Palestinian companies, three internal factors are explored, namely
organisational structure, organisational size, and organisational technology, and the relevant
theoretical foundations concerning these contexts are reviewed next. Following these,
organisational strategy literature is reviewed in section 3.5.
3.4.5.2 Organisational Structure
Organisational structure influences the interplay between strategic pursuit and accounting
information production and use (Dent, 1991; Okumus, 2003; Spanos & Prastacos, 2004;
Ezzamel et al., 1997; Mouritsen, 1999; Puolamäki, 2004; Waweru, 2008; Leftesi, 2008).
There is a limited examination of the association between organisational structure and
strategic process in organisations (Hwang, 2005). Apart from the research by Chandler (1962)
and followers, which are rather specialised (Hwang, 2005); researches have systematically
failed to relate strategic content to process, structure and environment. In these contexts, this
study aims to contribute to knowledge by examining the association between organisational
strategy, strategic management accounting (SMA) usage, organisational structure and
organisational environment.
Organisational structure has been defined in different ways in the literature. According to
Macy & Arunachalam (1995, p.69), organisational structure represents the patterns and
relationships that exist among organisation and work unit elements. Scott (2005, p.468) notes,
“organisation structures are the product not only of coordinative demands imposed by

Chapter 3: Literature Review – Contingency Theory and Strategic Management Accounting Techniques
Jafar Ojra - 58 -
complex technologies, but also of rationalised norm legitimising adoption of appropriate
structural models”.
Miller & Dröge (1986) define organisational structure as capturing centralisation of authority,
formalisation, complexity and integration. On their part, Organ & Battement (1986, p.607)
define organisational structure as “the formal, systematic arrangement of the operations to one
another”. Offering a more comprehensive view, Daft (1989) defined organisational structure
to consist of formal reporting relationships, which includes the number of levels in the
hierarchy, the span of control of managers and supervisors, and the cross-communication
between the organisational departments.
A change in structure can be of organisation structure, departmentalisation, decentralisation,
centralisation and size (Tuan Mat, 2010; Burns & Scapens, 2000; Smith et al., 2005; Waweru
et al., 2004). Other researchers have also tried to dimensionalise and explain the diversity and
variety in the structure of organisation (e.g., Burns & Stalker, 1961; Lawrence & Lorsch,
1967; Woodward, 1965) and provide arguments that connect to the aforementioned structure
change directions. In their efforts, these scholars draw a principal contrast between
mechanistic or bureaucratic and organic structures.
A mechanistic structure, they emphasised, would be characterised by vertical hierarchies,
numerous departments, limited decentralisation and many rules and procedures. That structure
favours centralised authority at the top of the system, standardisation and formalisation, and
tight specification of duties and vertical interaction (Bantel, 1993; Marsden et al., 1994). On
the other hand, an organic structure tends to be open, less structurally complex, fewer rules,
extensive decentralisation, and less rigid definition of methods, duties, and powers, and
favours horizontal interaction (Bantel, 1993; Johnson & Scholes, 1993; Marsden et al., 1994).

Chapter 3: Literature Review – Contingency Theory and Strategic Management Accounting Techniques
Jafar Ojra - 59 -
The appropriateness of organisational structure can change over time (Özsomer et al., 1997).
Consequently, organisations must manage their structure carefully (Hwang, 2005).
The 1961 study of Burns & Stalker, which investigated 20 manufacturing firms, provides
insights that support this environmental factor influence on the appropriateness of
organisational structure. They concluded that either the mechanistic or organic form of
organisational structure can be successful, depending on the firm’s external environment.
According to Burns & Stalker (1961), the mechanistic organisational form thrives in stable
environment but experience difficulty in rapidly changing and uncertain environments. On the
other hand, the organic form, which is less bureaucratic, performs best in such rapidly
changing and uncertain environments. Further literature suggests that mechanistic
organisations are highly bureaucratic and are characterised by centralisation, many rules,
precise division of labour, narrow span of control and formal coordination (e.g., Peters &
Waterman, 1982; Schermerborn, 1993).
Finally, in their 1984 study, Gordon & Narayanan investigated the relationship between
organisation’s structure and information systems. Empirically, that study suggests that
organisational structure and characteristics of information sought by decision makers are
complementary strategies in response to the perception of the environment. The strategic
management accounting techniques are tools for managing organisational financial
information towards enabling profitable managerial decision making. Thus, this study
supports the view that organisational structure would influence the strategic management
accounting practices.
“Researchers began in the 1940’s to identify the dimensions of firm structure” (Hwang, 2005,
p.45). According to literature (e.g., Hwang, 2005; Johnson & Scholes, 1993; Marsden et al.,
1994; Özsommer, 1997; Tuan Mat, 2010; Waweru et al., 2004; Boyd et al., 1995; Gul & Chia,

Chapter 3: Literature Review – Contingency Theory and Strategic Management Accounting Techniques
Jafar Ojra - 60 -
1994) the core typologies are formalisation, centralisation and specialisation. While the study
of Gosselin (1997) also classified three variables, the variables were specified as
organisational centralisation, formalisation and differentiation. These three structural
variables (formalisation, centralisation and specialisation) are important in shaping the
performance of both a strategic unit and its marketing department within the environment of a
given competitive strategy (Boyd et al., 1995, cited in Hwang, 2005, p.46). For this study,
formalisation and decentralisation are considered, and these are summarised in Sections
3.4.5.2.1 (Formalisation) and 3.4.5.2.2 (Decentralisation).
3.4.5.2.1 Formalisation
Formalisation is a common tool of corporate policy. According to Ruekert et al. (1985),
formalisation is the degree to which decisions and working relationships are guided through
strict rules and standard policies and procedures. Earlier literature (Zaltman et al., 1973),
defined formalisation as “the emphasis placed within the organisation on following specific
rules and procedures in performing one’s job”. Also, Hatch (1997) defined formalisation as
the extent to which explicit rules, regulations, policies and procedures govern organisational
activities. Such rules and procedures serve as guide for work processes and contribute to
coordination by ensuring a structured execution of desired activities (Hatch, 1997).
In a highly structured environment, employees perform standardised responsibilities that are
regulated through strict rules and operating procedures (Zeithaml et al., 1988). Formalisation
might increase the level of certain types of information processing and information use
(Galbraith, 1973; Daft & Lengel, 1986). In the study of the effect of organisational structure
on management accounting innovation, Gosselin (1997) concluded that, while formalisation
correlates positively with the implementation of ABC, it did not for the adoption of ABC.

Chapter 3: Literature Review – Contingency Theory and Strategic Management Accounting Techniques
Jafar Ojra - 61 -
3.4.5.2.2 Decentralisation
Decentralisation, or its opposite centralisation (Otley, 1980; Williams & Seaman, 2001), form
a significant part of the control package in an organisation. In this section, while the focus in
this study is on decentralisation, both empirical evidence on centralisation and
decentralisation is highlighted, as it is important to mention the opposite views.
Centralisation is an important contingent variable in designing management accounting
system (Watson, 1975), and as a supportive mechanism should be consistent with the intent of
the formal structural arrangements (Chenhall & Morris, 1986).
Centralisation is probably the most prominent structural factor in previous researches
exploring MAS design and changes (e.g., Chenhall & Morris, 1986; Libby & Waterhous,
1996; Tuan Mat, 2010). Centralization refers to the extent to which decision making authority
is concentrated at the top level of the organisation (Schaffer, 1984; Miller & Dröge, 1986;
Sisk & Williams, 1981; Leftesi, 2008). Centralised management systems favour efficiency
over effectiveness and presuppose a stable, constant, and clearly defined external environment
(Spillard, 1985, cited in Hwang, 2005, p.46). Centralization helps to conserve scarce
managerial resources (Athey et al, 1994). However, as Tuan Mat (2010) notes, “in a
centralised structure, the decision making process is less effective and costly because
knowledge has to be transferred to the person that has decision rights” (p.39).
Furthermore, centralised organisations will implement changes in their accounting systems
less often than decentralised ones (Matejka & De Waegenaere, 2000). Chenhall (2008)
supports Matejka & De Waegenaere (2000) and notes that accounting systems are consistent
with horizontal (or decentralized) organisations.

Chapter 3: Literature Review – Contingency Theory and Strategic Management Accounting Techniques
Jafar Ojra - 62 -
This point mentioned by Chenhall (2008) is of critical importance in this study, which has
strategic management accounting as its focus. “Strategic management accounting has
characteristics related to aspects of horizontal organisation as they aim to connect strategy to
the value chain and link activities across the organisation…” (Chenhall, 2008, p.525). A
common approach in horizontal organisation, Chenhall (2008) further notes, is identifying
strategic priorities with a customer-oriented focus and then exploiting process efficiency,
continuous improvements, flattened structures, and team focus and empowerment, to initiate
change. A contrast is however offered by Verbeeten (2010) who found decentralisation to
associate negatively with major changes in the decision-influencing components of MACS.
Delegating more decision making authority to lower levels would broaden the scope of lower
managers and also provide business units significant freedom to make trade-offs (Jensen,
2001; Prendergast, 2002; Moers, 2006). Decentralisation allows the possibility for lower level
managers to change their MACS, as need arises, to meet their local needs (Abernethy &
Bouwens, 2005, Moers, 2006). Further management accounting and control research
supporting the above view suggests that decentralised decision making would be associated to
a strong emphasis on formal management accounting and control system (including financial
and non-financial management accounting) and performance information (e.g., Bruns &
Waterhouse, 1975; Gordon & Narayanan, 1984; Chenhall & Morris, 1986; Moers, 2006).
These and other scholars (e.g., Kimberly & Evanisko, 1981; Damanpour, 1991) argue that, to
manage change effectively, organisations must achieve a balance between allowing
organisational subunits the independence to react to its environment through change and the
need for control and integration of work amongst all units of the organisation.
Literature connecting to performance suggests that a good fit between decentralisation and
management accounting system characteristics is likely to improve managerial performance

Chapter 3: Literature Review – Contingency Theory and Strategic Management Accounting Techniques
Jafar Ojra - 63 -
(e.g., Gordon & Miller, 1976; Waterhouse & Tiessen, 1978; Gul & Chia, 1994). For a higher
managerial performance though, a well structured organisational structure must be
complemented with appropriate management accounting system information (Gul & Chia,
1994).
Further literature relating to performance suggests that decentralisation would likely have a
positive association to organisational performance when managers perceive their environment
to be uncertain (Negandhi & Reimann, 1972). These scholars also argue that centralised
decision making would very likely be effective when uncertainty is perceived to be low. Gul
&Chia (1994) support Negandhi & Reimann (1972) and suggest a contingent relationship
between the degree of decentralisation and organisational performance.
3.4.5.3 Organisational Size
Internal factors are important in the examination of contingency theory. As a result, numerous
research efforts address these in relation to management accounting practices in organisations.
One internal factor that has been examined in this relation is organisational size (Khandwalla,
1972; Merchant, 1978; Cadez & Guilding, 2008; Cinquini & Tennucci, 2010; Tuan Mat,
2010; Huang et al., 2010).
These scholars argue that firm size influences the way organisations design and use
management accounting practices for decision making (see also Bruns & Waterhouse, 1975;
Gordon & Narayanan, 1984; Damanpour, 1992; Burns & Stalker, 1961: Miles & Snow, 1978;
Guilding et al., 2000). For example too, Luther & Longden (2001) determine that the benefits
from management accounting system increases with the size of the entity. Further literature
(Libby & Waterhouse, 1996) suggests a relationship between the size of an organisation and
the management accounting change propensity, as larger firms have greater resources for

Chapter 3: Literature Review – Contingency Theory and Strategic Management Accounting Techniques
Jafar Ojra - 64 -
change. While Luther & Longden (2001) measured firm size by annual turnover, Libby and
Waterhouse measured it by number of employees.
Related literature also suggests that size is an important factor when relating to the adoption
of more complex administration system (Moores & Chenhall, 1994). According to that logic,
larger organisations would generally have more sophisticated management accounting
systems. Also, larger organisations would have greater access to resources to develop
innovative systems compared to smaller organisations. For example, Nguyen & Brooks
(1997) provide empirical evidence in respect of the adoption of ABC system that showed that
the adoption rates are much higher for larger firms than smaller firms. Other research that
enhances the large firm logic suggests that multinational companies’ usage level of both
traditional and new management accounting techniques are usually high.
As organisations grow larger the information requirement of managers increases to a point
where they have to institute controls, such as rules, documentation, and specialisation of roles
and functions (Child & Mansfield, 1972). According to Merchant (1981), large firms are more
decentralised and use more sophisticated budgets in a participative way.
In their 2002 study, Haldma & Laats provide empirical evidence that support Merchant
(1984), and underline that large companies use more sophisticated budgets. They also used
more sophisticated performance measurement systems, they reported. According to them, “the
level of sophistication of cost accounting system tends to increase in line with company size”
(p.395).
According to Mintzberg (1979), organisation size can be measured by the number of
employees, the amount of sales, the size of the budget, the size of the capital investment, and
other factors. In Woodward’s (1965) view, the best indicator of ‘bigness’ is the size of the
management group. A number of other researchers also propose other measures of firm size.
Chapter 3: Literature Review – Contingency Theory and Strategic Management Accounting Techniques
Jafar Ojra - 65 -
For example, while Kettinger et al. (1994) suggest gross sales or gross value of asset, many
others emphasise number of employees (e.g., Aiken et al., 1980; Hoque & James, 2000;
Dewar & Dutton, 1986; Govindarajan, 1984). Hoque et al. (2001) suggest sales turnover. In a
comparative study involving New Zealand, UK and US companies, Guilding et al. (2000)
combined both turnover and assets to measure organisational size.
From overall literature reviewed, in relationship contingency theory of organisation (e.g.,
Smith et al., 1989; Carpenter & Fredrickson, 2001) and contingency context of management
accounting and control (e.g., Jusoh, 2010; Huang et al., 2010; Libby & Waterhouse, 1996;
Hoque & James, 2000; Waweru, 2008), the total revenue of an organisation is a good measure
of the organisation size. Following this foundation, in my study, the organisational size is
measured by the total revenue of the explored Palestinian organisations.
3.4.5.4 Technology
Technology is another important internal organisational factor that needs to be explored in
relation to management accounting practices (e.g., Khandwalla, 1977; Merchant, 1984; Dunk,
1992; Cadez & Guilding, 2008; Haldma & Lääts, 2002; Huang et al., 2010; Waweru &
Uliana, 2005; Waweru, 2008). The production technology a firm uses influences the type of
accounting practices that a firm uses (Otley, 1980), and the investment in technology will
enhance management control systems (Huang et al., 2010).
Past studies have identified two dimensions of technology (e.g., Dewar & Hage, 1978). The
study of Freeman (1973) investigated technology as a contingent factor. According to these
and other literature (e.g., Marsh & Manari, 1981) there is a strong relationship between
various characteristics of technology and structure in the organisation.
Technology advancement is a major trigger for management accounting change (Baines &
Langfield-Smith, 2003; Libby & Waterhouse, 1996; Waweru et al., 2004).

Chapter 3: Literature Review – Contingency Theory and Strategic Management Accounting Techniques
Jafar Ojra - 66 -
In his study of Korean manufacturing companies, Choe (2004) found a significant positive
association between the level of manufacturing technology and the amount of information
generated through the management accounting information system.
According to Emmanuel et al. (1990), technology contingency factors include the nature of
the production process, its degree of routine, and how well the means-end relationships are
understood. Further context literature suggests that when process technologies are
standardised and automated, high budget use (Merchant, 1984), high budgetary controls
(Dunk, 1992) and more traditional formal management control systems with highly developed
process controls (Khandwalla, 1972) are suitable.
Where there is product inter-dependence, there will be a technological constraint on the
design of the accounting system (Haldma & Lääts, 2002). Empirically, new technology will
cause a change in the cost structure, and while the technological process continues, the
accounting system is very likely to become more complex and sophisticated (Haldma &
Lääts, 2002).
It is important for an organisation to have appropriate MAS. For that to aid the company's
competitive prospects, manufacturing technology must be consistent with business strategy
and organisational structure (Tuan Mat, 2010). An appropriate fit between technologies,
MAS, strategy and structure would enhance competitive advantage, thereby enhancing
organisational performance (Hyvönen, 2007).
Markets have become more competitive, and there is demand for increased quality and
competitively priced products (Tuan Mat, 2010). Organisations must respond to these needs
by re-organising the work processes by adopting organisational designs and strategy that have
stronger customer orientation. Considerable investments in advanced manufacturing
technology such as computer-integrated manufacturing and just-in-time systems are very

Chapter 3: Literature Review – Contingency Theory and Strategic Management Accounting Techniques
Jafar Ojra - 67 -
necessary in this connection (Baines & Langfield-Smith, 2003). Doing this, organisations
would improve quality, productivity and flexibility, as well as reduce costs (Tuan Mat, 2010).
3.5 Organisational Strategy
Company strategy has been identified as a core internal factor to explore in the examination of
the contingency perspective of management accounting (e.g., Miles & Snow, 1978; Gupta &
Govindarajan, 1984; Chenhall & Morris, 1995; Cadez & Guilding, 2008; Chapman, 1997;
Cinquini & Tennucci, 2010; Langfield-Smith, 1997; Leftesi, 2008; Hwang, 2005).
Strategy is defined by Chandler (1962) as:
“The determination of the basic long-term goals and the objectives of an
enterprise, and the adoption of courses of action and the allocation of
resources for carrying out these goals” (p.13).
Further, strategy is defined by Hambrick (1980) as:
“A pattern of important decisions that guides the organisation in its
relationship with its environment; affects the internal structure and processes
of the organisation; and centrally affects the organisation’s performance”
(p.567).
Supporting the importance of this factor in the contingency context, Chapman (1997)
comments that one of the core points in the reflections based on a contingent-based view of
accounting is understanding the relationships between strategy and accounting. In the
examination of this relationship, four different connotations have been used to distinguish the
accounting context in literature, namely; management control systems (MCS) (e.g., Shank &
Govindarajan, 1992; Chenhall & Langfield-Smith, 1998); strategic management accounting
(SMA) (e.g., Cadez & Guilding, 2008; Cravens & Guilding, 2001; Cinquini & Tennucci,
2010); accounting systems design (ASD) (e.g., Dent, 1990; Chapman, 1997; Langfield-Smith,

Chapter 3: Literature Review – Contingency Theory and Strategic Management Accounting Techniques
Jafar Ojra - 68 -
2005); and management accounting systems (MAS) (e.g., Langfield-Smith, 1997; Hyvönen,
2008; Dik, 2011).
Strategy represents a core contingency variable (Hwang, 2005), and MAS which is tailored to
support strategy can enhance competitive advantage and superior performance (Langfield-
Smith, 1997). The fundamental relationship between strategy and management control
systems (MCS) is gaining increasing research attention (Dent, 1990; Chenhall, 2003;
Langfield-Smith, 2007; Miles, 2003).
In one of the earliest comments in literature, Miles & Snow (1978) state that the strategic
choice of a company will influence its MCS, i.e., different types of organisational plans and
strategy are likely to cause different control systems configuration. Since the 1980’s a number
of researchers have investigated the link between particular elements of MCS and the specific
strategy adopted by organisations under the contingency approach (e.g., Govindarajan &
Gupta, 1985; Simons, 1987, 1990; 1991; 1995; Hope & Hope, 1995; Shank & Govindarajan,
1992; Bruggeman & Van der Stede, 1993; Chenhall & Langfield-Smith, 1998).
Other contingency-based studies (e.g., Govindarajan & Fisher, 1990; Chenhall & Langfield-
Smith, 1998) have investigated the relationship between strategy, MCS and performance.
Further MCS perspective (Langfield-Smith, 1997, p.207) states that, “the MCS should be
tailored explicitly to support the strategy of the business”.
Similar investigation of this strategy role has been undertaken by some other researchers in
relation to strategic management accounting techniques (e.g., Cadez & Guilding, 2007, 2008;
Cravens & Guilding, 2001; Cinquini & Tennucci, 2010). Using another accounting
connotation, some other studies (e.g., Langfield-Smith, 2005; Chapman, 1997; Chenhall,
2005) researched the role strategy might play in accounting system design.

Chapter 3: Literature Review – Contingency Theory and Strategic Management Accounting Techniques
Jafar Ojra - 69 -
Overall, the aforementioned studies maintain that there is an important link between MCS
(and SMA) and strategy, and a congruent matching of the two is essential for performance
(see also Govindarajan & Gupta, 1985; Simons, 1987). Performance measurement literature
also reinforces this link: performance management system encourages actions that are
congruent with organisational strategy (Kaplan & Atkinsons, 1998; Kaplan & Norton, 1996;
Simons, 2000). For example, supporting this congruence logic, Chenhall & Langfield-Smith
(1998) suggest that high performing differentiator strategy firms are associated with
management techniques of quality systems, integrated systems, team-based human research
structure, and MAPS incorporating employee-based measures, benchmarking, strategic
planning and activity-based techniques (cited in Hwang, 2005, p.41-42).
Further contemporary viewpoints posit that, as a matter of fact, there may be a two-way
relationship between these two variables, that is, “MAS shapes, and is shaped by strategy”
(Kober et al., 2007, p.425). In their study that underline this reciprocal relationship between
management accounting practices and strategy, Perera et al. (2003) suggest that management
accounting practices may both change as a result and instruments, and vary between the two
in the same organisation. Supporting that notion, Kober et al. (2007) found that the interactive
use of MAS mechanisms facilitate strategic change, and mechanisms change to match change
in strategy.
While Young & Selto (1991, p.270) observe that strategy influences “the choice of accounting
techniques and the manufacturing practices”, Ittner & Larcker (1997, p.295) note that “a key
assumption in the strategic control literature is the need to align specific control practices with
the organisation’s chosen strategy”.
Miles & Snow (1978, 1994) developed four types of strategy typologies: prospector, defender,
analyser and reactor. In 1980, Porter proposed two different types of strategy, namely low

Chapter 3: Literature Review – Contingency Theory and Strategic Management Accounting Techniques
Jafar Ojra - 70 -
cost strategy and product differentiation strategy. Miles & Snow's (1978) developed strategy
typologies, which is based on how companies respond to a changing environment and align
the environment with their companies, is the focus in this study. For the purpose of this study
two of these generic strategies are explained next. These two strategy types are explored in
this study, because they have featured more in the study of contingency perspective of
management accounting practices (e.g., Cadez & Guilding, 2008; Cinquini & Tennucci, 2010;
Guilding, 1999; Anderson & Lanen, 1999).
Prospector type Strategy
Contemporary management accounting systems literature also underlines the need to explore
prospector type strategy. Prospectors are described as dynamic in searching for market
opportunities, capable of meeting consumers’ needs with new product developments and
heavy investments in research and development (Leftesi, 2008).
Prospectors use comprehensive planning and measure performance subjectively (Miles &
Snow, 1978). According to Guilding (1999), prospector firms make greater use of and
perceive greater need for competitor-focused accounting. Further literature (Cadez &
Guilding, 2008): prospector organisations compete through new products and market
development. Thus, product lines change over time and the firms constantly seek new market
opportunities.
Companies facing high uncertainty will utilise their control more intensively (Tushman &
Nadler, 1978). This control viewpoint reinforces earlier study (Khandwalla, 1972) which
suggests that companies engaged in continual product development and search for new
market segments become differentiated and require elaborate controls, e.g., budgeting
techniques, for integration purposes.

Chapter 3: Literature Review – Contingency Theory and Strategic Management Accounting Techniques
Jafar Ojra - 71 -
Defender type Strategy
For the defender strategy type, Miles & Snow (1978) describe the planning and control
systems of defender firms as likely to be very detailed, emphasising uncertainty reduction and
problem solving. These systems do not aim for new product development or locating market
opportunities, and control systems are usually centralised (Hyvönen, 2008; Cadez & Guilding,
2008). Defenders emphasise cost control, trend monitoring and efficiency rather than
scanning for new opportunities in the environment (Miles & Snow, 1978).
Leftesi (2008): defenders have a narrow product range with high production volumes and low
diversity of producers; they emphasise the efficiency of operation rather than innovation
(p.106). Miller & Friesen (1982) comment that defender firms are conservative, and need a
control system that requires innovation. Organisations that are highly structured (stable
environment and repetitive operations) usually favour a cost leadership focus (Porter, 1980), a
view that has been reinforced by other studies, e.g., Langfield-Smith (1997) who comments
that cost control is the priority in firms following the defender strategy.
Anderson & Lanen’s (1999) exploratory study suggests that change in MAPs follow
economic reforms and is contingent on organisational business strategy (cited in Leftesi,
2008, p.107). Strategy type evidence suggests that a prospector strategy is associated with
managers’ decision to adopt ABC (Gosselin, 1997). That study also argues that prospectors
are likely to embrace innovation in accounting, as they are innovation organisations.
Furthermore, Simons (1987) maintains that prospectors are more likely to adapt their cost
management systems to a greater extent than defenders.

Chapter 3: Literature Review – Contingency Theory and Strategic Management Accounting Techniques
Jafar Ojra - 72 -
3.6 Organisational Performance
Strategic management literature underlines the important role that performance measurement
system plays in the operations and business strategy implementation of organisations (e.g.,
Valanciene & Gimzauskiene, 2007; Kloviene & Gimzauskiene, 2009). Organisations must
therefore give due attention to maintaining an effective performance management system, as
this is critical to its survival (Chow & Van der Stede, 2006). Moreover, this performance
focus plays an important role in leading the organisation (Chow & Van der Stede, 2006).
Supporting this ‘leading role’ view, Neely et al. (2002) define performance measurement
system as a balanced and dynamic system that supports the decision making process through
gathering, elaborating and analysing information. This performance measurement lens is of
major importance in this exploration of strategic management accounting, where the aim is to
ensure strategic positioning through effective decision making.
Overall, as Tuan Mat (2010) argues, “performance may be an antecedent or an outcome factor
of management accounting and organisational change (p.43). According to the “performance
as antecedent” view, low financial performance is one of the reasons why firms change their
management accounting and internal organisational factors, in order to improve performance
(Granlund, 2001; Laitinen, 2006). On the other hand, the “performance as outcome factor”
view, which is the contingency theory of management accounting view (Tuan Mat, 2010,
p.43), and the focus in this study, suggests that “if organisations implement management
accounting systems (MAS) that suit their organisational and environmental factors, they are
likely to perform better” (Chenhall, 2003; Otley, 1980).
Contingency-based management accounting research should employ organisational
performance as the dependant variable (Chenhall & Langfield-Smith, 1998; Chenhall, 2003).
According to the contingency theory, company performance is a product of an appropriate fit
between the structure (SMA system) and context (contingency factors) (Cadez & Guilding,

Chapter 3: Literature Review – Contingency Theory and Strategic Management Accounting Techniques
Jafar Ojra - 73 -
2008) or according to Jermias & Gani (2002) performance is dependent on the fit between
MAS and its contextual variables. The assumption therefore is that both high and low
performing companies exist as a result of more or less compatible combinations of context
and structure (Gerdin & Greve, 2004; Ittner & Larcker, 2001; Cadez & Guilding, 2008).
Given the importance of this latter context, over the last two decades several scholars from
diverse disciplines have invested much effort into developing performance management
systems that reflect fast changing business environments (e.g., Bitton, 1990; Kaplan &
Norton, 1993, 1996; Neely et al., 1996, 2000; Olve et al., 1999; Franco-Santos & Bourne,
2005; Franco-Santos et al., 2007) and assessment of their fitness for purpose (e.g., Dixon et
al., 1990; Bititci et al., 1998). For these ‘ever changing business environment’ and ‘fitness for
purpose’ reasons, these scholars generally advice for a shift from the traditional concept of
performance measurement. Thus, scholars call for a comprehensive approach in the
examination of organisational performance.
In business strategy literature, multifaceted characteristics of performance have been
discussed from different perspectives (Hambrick, 1980; Alarco & Bastias, 2000). In one of
these perspectives, strategic decision making literature emphasises the need to examine both
financial and non-financial metrics of performance (e.g., Kloviene & Gimzauskiene, 2009;
Valanciene & Gimzauskiene, 2007; Husted & Allen, 2007; Robbins, 2005). Aligning to that
logic, contingency perspective of performance increasingly advocates for the examination of
financial and non-financial elements of organisational performance (e.g., Jusoh et al., 2006;
Hwang, 2005; Chenhall, 2003; Hyvönen, 2008; Ittner & Lacker, 1998).
Following the evidence in literature (e.g., Hwang, 2005; Hyvönen, 2008), both financial and
non-financial performance, also called ‘traditional and non-traditional performance measures’
(Hyvönen, 2008, p.13) are explored in this study.

Chapter 3: Literature Review – Contingency Theory and Strategic Management Accounting Techniques
Jafar Ojra - 74 -
In their investigation of non-financial elements of organisational performance of organisations
operating in uncertain environment, Hoque (2005) argued that traditional performance
measures do not satisfactorily reflect firm performance affected by today’s changing business
environment. These traditional measures, which highlight only financial criteria like return on
investment or net earnings, are narrow in focus, historical in nature, and incomplete (Hoque et
al., 2001).
Organisations must also use non-financial performance measures, as this will enable them
address environmental change by clearly monitoring organisational process core
competencies, create greater efficiency, help managers to assess change in their business
environment, determine and evaluate progress towards firm’s goals, and enhance overall
performance (Kaplan & Norton, 1996). The findings in Baines & Langfield-Smith (2003)
support this view: organisational performance is significantly associated with increased
reliance on non-financial management accounting information.
In today’s ever dynamic, competitive and computer manufacturing-based environment,
organisations need multi-dimensional performance measurement approach that should
provide continuous signals for identifying the critical clues in their day-to-day activities and
where efforts must be directed (Hoque et al., 2001).
There is need to enhance the understanding of business performance measurement in
organisations (Marr & Schiuma, 2003). In recognition of this need, diverse management
researchers in the fields of strategy management, human resource management, marketing,
operations management, organisational behaviour, information systems, management
accounting and control are contributing to the field of performance management (e.g., Marr &
Schiuma, 2003; Cadez & Guilding, 2008; Franco-Santos & Bourne, 2005). To contribute to

Chapter 3: Literature Review – Contingency Theory and Strategic Management Accounting Techniques
Jafar Ojra - 75 -
the knowledge on organisational performance, this contingency perspective study explores
financial and non-financial performance elements in the Palestinian economic context.
From existing literature, the core measures of financial performance include market share,
return on assets, return on investment, sales margin, profit level, capacity utilisation (e.g.,
Elbanna & Alhwarai, 2012; Boyd, 1991; Pearce et al., 1987; Glaister et al., 2008;
Govindarajan & Gupta, 1985; Brush & Van der Werf, 1990; McDougall et al., 1994; Roth &
Ricks, 1994; Hwang, 2005; Jusoh, 2010; Tuan Mat, 2010; Cadez & Guilding, 2008), while
the core measures of non-financial performance includes employee attitude and moral,
personnel performance, customer satisfaction, product/service quality…… (e.g., Anderson &
Lanen, 1999; Kaplan & Norton, 1992; Mahoney et al., 1963; Brownell & Hirst, 1986;
Govindarajan, 1986; Gul & Chia, 1994; Chenhall & Langfield-Smith, 1998; Chong & Chong,
1997; Hoque, 2004; Jusoh, 2010; Hoque, 2005; Tuan Mat, 2010; Cadez & Guilding, 2008).

Chapter 3: Literature Review – Contingency Theory and Strategic Management Accounting Techniques
Jafar Ojra - 76 -
3.7 Conclusion to the Chapter
This chapter has presented a review of literature that connects to the contingency variables
that are embraced in this study. These include strategic management accounting techniques
usage, external business environment, internal business environment (also called
organisational factors), organisational (or business) strategy, and organisational performance.
Each variable has been explored explaining relevant foundations for this study. It is important
to understand these factors so that organisations can deal with the functional relationships and
design optimal management control system to fit their environment (Bhimani, 1999).
This chapter reviewed literature on strategic management accounting techniques used in
modern organisations. Five categories of strategic management accounting techniques are
embraced in this study and these include costing, planning, control and performance
measurement; strategic decision making; competitor accounting; and customer accounting.
The environment of an organisation was explained, pinpointing the external and internal
elements. The conceptualisation of external environment was discussed pinpointing empirical
research in that connection. In this study, the perception of perceived environmental
uncertainty (PEU), which researches have conceptualised to include market turbulence and
competitive intensity is the focus. The relevant literature relating to these have been discussed
in this chapter.
Also discussed in this chapter is internal environment of an organisation, which has also been
presented in past studies as organisational factors. Three core elements were conceptualised in
this study, namely, organisational size, organisational structure, and organisational
technology. The review of relevant literature for each of these elements focused on
pinpointing the conceptualisation, and flagging empirical support as evident in previous

Chapter 3: Literature Review – Contingency Theory and Strategic Management Accounting Techniques
Jafar Ojra - 77 -
studies. Organisational structure has been conceptualised in this study to include formalisation
and decentralisation.
Business (or organisational) strategy is another core element in the conceptualised model for
this study. The review of literature explained this concept and also showed the evidence in
previous studies that embraced this construct. The “prospector” and “defender” strategies are
included in this study.
Organisational performance has been conceptualised as an outcome factor in this study. The
review of literature focused on conceptualising organisational performance and also showing
empirical support in past studies. Two typologies of organisational performance are embraced
in this study, namely, financial performance and non-financial performance. Organisational
performance is conceptualised to be shaped by perceived environmental uncertainty, business
(or organisational) strategy, strategic management accounting techniques usage, and the
organisational structure.
Furthermore, strategic management accounting techniques usage and organisational structure
are also conceptualised as outcome factors, where strategic management accounting
techniques usage is shaped by perceived environmental uncertainty, business (or
organisational) strategy, and the organisational factors (organisational size, organisational
structure, and organisational technology) on the one hand; and organisational structure is
shaped by perceived environmental uncertainty and business (or organisational) strategy.
The framework for this study and justification are explained next in chapter four. In that
chapter too, the hypotheses that reflect the expected associations between the factors included
in the framework, are also explained.
Chapter 4: Research Framework and Specification of Research Hypotheses
Jafar Ojra - 78 -
4. Research Framework and Specification of Research Hypotheses
4.1 Introduction
Two core steps are taken in this chapter. First, the framework is presented and justified
(Section 4.2): Following that, Section 4.3 defines the hypotheses behind the conceptualised
relationships as pictured in the framework (Figure 4.1). To conclude this chapter, a chapter
conclusion is presented in Section 4.4, where the hypotheses for this study are summarised in
Table 4.1.
4.2 The Research Framework and Justification
Summarising a review of management accounting research using contingency theory, Islam &
Hu (2012) commented that contingency theory has been applied in management accounting
research for the aim of addressing three types of questions about: (1) the fit between
organisational control and structure; (2) the impact of such fits on performance; and (3)
investigation of multiple contingencies and their impact on organisational design. The
conceptualisation for this study covers these contexts. The framework for this study is
summarised in Figure 4.1 below.
Studying the contingency perspective is necessary in this study because explaining the
appropriateness of using advanced management accounting techniques depend on the
circumstances in which these techniques are being used (Abdel-Kader & Luther, 2008).
According to Fisher (1995), the ultimate goal of contingent accounting research should to
develop and test a comprehensive model that contains multiple elements of accounting
systems and multiple contingent variables.
Aligning to this logic, the framework summarised in Figure 4.1 includes five (5) categories of
strategic management accounting elements, and six (5) categories of contingent variables

Chapter 4: Research Framework and Specification of Research Hypotheses
Jafar Ojra - 79 -
(namely; Perceived Environment Uncertainty, Business Strategy, Organisational Size,
Technology and Organisational structure.

Chapter 4: Research Framework and Specification of Research Hypotheses
Jafar Ojra - 80 -
Figure 4.1: Conceptual Framework of the Research
Market Turbulence
Competitive Intensity
Environment
Perceived Environmental
Uncertainty (PEU)
Market Turbulence Competitive
Intensity
Business Strategy
Prospector/Defender
Organisational Size
SMA Usage
Costing Planning, Control and
Performance Strategic Decision Making Competitor Accounting Customer Accounting
Organisational Structure
Formalisation Decentralisation
Organisational Performance
Financial Performance
Non-Financial Performance
Organisational
Technology
H1
H2
H3
H4
H5
H6
H91
H10
H11
H7
H8
H121
Chapter 4: Research Framework and Specification of Research Hypotheses
Jafar Ojra - 81 -
Specifically, to reflect the contexts in the three question types pinpointed above in page 79,
this study suggests a contingency framework that has three outcome factors which are
influenced by several antecedents. Firstly, Figure 4.1 proposes that organisational
performance is shaped by strategic management accounting technique usage, perceived
environmental uncertainty (PEU), business/organisational strategy and organisational
structure. Secondly, strategic management accounting technique usage is proposed as an
outcome factor of perceived environmental uncertainty, business/organisation strategy, and
the organisational factors (organisational size, organisational technology, and organisational
structure). Third and finally, Figure 4.1 proposes that organisational structure is influenced by
perceived environmental uncertainty and business/organisational strategy. It is proposed too
that the business/organisational strategy adopted by a firm would depend on the perceived
environmental uncertainty.
External factors indicate the features of the external environment at the level of business and
accounting (Haldma & Lääts, 2002). Figure 4.1 thus proposes that external environmental
factors impact both on the organisation’s internal characteristics and management accounting
practice. For example, perceived environmental uncertainty influences the organisational
structure, choice of strategy, and application of strategic management accounting techniques.
Figure 4.1 also proposes that the internal environment / organisational factors (organisational
size, organisational technology, and organisational structure) influence the application of the
strategic management accounting techniques.
While the combination and relations pictured in Figure 4.1 is comprehensive, the framework
cannot be considered exhaustive, as no single study is all exhaustive. Contingency-based
studies assume the existing link between nature and the use of SMA5 and subsequently
enhanced performance (Haldma & Lääts, 2002). Behavioural and organisation perspectives
5MAS (Management Accounting Systems) was used in Haldma and Lääts (2002).

Chapter 4: Research Framework and Specification of Research Hypotheses
Jafar Ojra - 82 -
also pinpoint other core factors for enhancing organisational performance (e.g., job
satisfaction, cross-functional integration, conflict management, and formal and informal
control). In this study, the researcher focuses on the following categories of contingencies:
1. External Environment (Perceived Environmental Uncertainty), subdivided into:
a. Market Turbulence, and
b. Competitive Intensity.
2. Internal Environment (Organisational factors), subdivided into:
a. Organisational Size,
b. Organisational Technology, and
c. Organisational Structure, involving two constructs:
i. Formalisation, and
ii. Decentralisation.
3. Business/Organisational Strategy (prospector / defender),
4. Organisational Performance, subdivided into:
a. Financial Performance, involving:
i. Return on Investment,
ii. Sales Margin,
iii. Capacity Utilisation, and
iv. Market Share.
b. Non-Financial Performance, involving:
i. Customer Satisfaction,
ii. Product/service quality, and
iii. Development of new products/services.

Chapter 4: Research Framework and Specification of Research Hypotheses
Jafar Ojra - 83 -
5. Strategic Management Accounting Techniques, involving five categories:
a. Costing,
b. Planning Control and Performance Measurement,
c. Strategic Decision Making,
d. Competitor Accounting, and
e. Customer Accounting.
4.3 Specifying the hypotheses
Management accounting literature (e.g., Shields & McEwen, 1996; Foster & Swenson, 1997;
Libby & Waterhouse, 1996; Williams & Seaman, 2001; Baines & Langfield-Smith, 2003;
Abernethy & Bouwnes, 2005; Emsley et al., 2006; Cadez & Guilding, 2008; Cinquini &
Tenicci, 2010) suggests that organisations need modern accounting systems to adapt to
rapidly changing organisational and social environment. This contingency study of
Palestinian companies follows this management accounting view.
In this study, conditional association between several independent variables and dependent
variables is hypothesised (Drazin & Van den Ven, 1985; Cadez & Guilding, 2008), and the
hypotheses relating to these associations are defined next. To ensure that the numerical order
for hypotheses as shown in the framework is followed, the hypotheses for this study are
explained in the following order:
1. Perceived Environmental Uncertainty related hypotheses (H1 – H4) (section 4.3.1),
2. Internal Environment/Organisational Factors related Hypotheses (H5 – H8) (section
4.3.2), subdivided into:
i. Organisational Technology related Hypothesis (H5) (section 4.3.2.1),
ii. Organisational Size related hypothesis (H6) (section 4.3.2.2),
iii. Organisational Structure related hypotheses (H7 – H8) (section 4.3.2.3),

Chapter 4: Research Framework and Specification of Research Hypotheses
Jafar Ojra - 84 -
3. Business/Organisational Strategy related hypotheses (H9 – H11) (section 4.3.3) and
4. Strategic Management Accounting Usage related hypothesis (H12) (section 4.3.4).
4.3.1 Perceived Environmental Uncertainty (PEU) Related Hypotheses (H1 – H4)
In this section four (4) hypothetical associations are specified. First, the researcher proposes
an association between the perceived environmental uncertainty (PEU) and organisational
strategy (OS) (H1) in section 4.3.1.1, and after that the proposition concerning perceived
environmental uncertainty (PEU) and organisational structure (OSTR) is defined in section
4.3.1.2. In the final part of section 4.3.1, the proposition concerning the association between
perceived environmental uncertainty (PEU) and organisational performance (OP) (H3) on the
one hand (See Section 4.3.1.3), and strategic management accounting techniques usage
(SMAU) (H4) (see section 4.3.1.4) on the other hand, are explained. Tapping from existing
literature (See Section 3.4.2), two categories of environmental uncertainty, namely market
turbulence and competitive intensity, are covered in this study.
4.3.1.1The Association between Perceived Environmental Uncertainty (PEU) and
Business/Organisational Strategy (OS) (H1)
Researchers have shown interest in the association between business environment and
strategy formulation and processes (e.g., Bourgeois, 1978; Harrington et al., 2004, Mador,
2000; Shrivastava & Grant, 1985). An organisation must be aware of and respond to the
external environment in order to formulate strategy (Kwock, 1999).
Similar view (Hwang, 2005) suggests that top managers’ perception of environmental
uncertainty and their willingness to adapt to a changing market are assumed to affect the
component of strategic management. This view aligns with earlier research (e.g., Hambrick,
1980; Jemison, 1984) which suggests that managers must cope with uncertainty by

Chapter 4: Research Framework and Specification of Research Hypotheses
Jafar Ojra - 85 -
identifying opportunities, recognising threats and implementing strategic adaptations. Fuchs
et al (2000): successful firms aligned core strategic elements with the environment.
According to strategy literature (e.g., Miles & Snow, 1978; Miles et al., 1978), the approach a
company takes would seemingly be influenced by the nature of problem that it faces, a
foundation that has been elaborated in section 3.5. Also, section 3.5 states: (1) the business
strategy realm for this study to include the ‘prospector’ and ‘defender’ typologies, and (2)
while a ‘prospector’ type company is dynamic in searching for market opportunities, and
capably meet consumers’ needs with new product developments and heavy investments in
research and development (Leftesi, 2008; Cadez & Guilding, 2008), a ‘defender’ type
company aims for cost control, trend monitoring and efficiency rather than scanning for new
opportunities in the environment (Miles & Snow, 1978; Hyvönen, 2008; Cadez & Guilding,
2008).
Since the prospector strategy will be highly influenced by environment dynamism, this study
follows existing literature (Cadez & Guilding, 2008) and proposes that:
H1 - Perceived environmental uncertainty would be greater in prospector-strategy than
defender-strategy among Palestinian Companies.
4.3.1.2 The Association between Perceived Environmental Uncertainty (PEU) and
Organisational Structure (OSTR) (H2)
There is a long tradition of support for the notion that the environment moderates the
effectiveness of organisational structure (Hwang, 2005). The practical beginning of this
stream of contention was made in 1967 when Lawrence & Lorsch explored the influence of a
business’s technological, market and economic setting on the pattern of organisations and
administration.
According to contingency theory, as pinpointed in sections (3.4.2, 3.4.2.1, 3.4.2.1.1 and
3.4.2.1.2) differences in the organisational structure relate significantly to the level of

Chapter 4: Research Framework and Specification of Research Hypotheses
Jafar Ojra - 86 -
uncertainty and complexity that an organisation faces. Therefore, whether mechanistic or
organic, the environmental circumstances of an organisation shape the structural reactions.
Noting this logic, Özsomer et al (1997) proposed that firms should not only adapt their
strategic posture to the environment but also their organisational structure. Researches that
link to this view (e.g., Bourgeois, 1985; Porter, 1980, 1985) explain that a firm, through its
strategic posture, selects and interprets its environment, responds to those elements it
considers fixed, and adapts its strategy to the requirements of the environment.
More recent literature (Hwang, 2005) adds that top managers’ perception of environmental
uncertainty and their willingness to adapt to a changing market affects the organisational
structure. Organisational structure is “the way in which the various parts of an organisation
are arranged” (Kwock, 1999, p.17) and “a system of communication and authority that links
people and groups together to accomplish tasks that serve an organisational purpose” (Kwock,
1999, cited in Hwang, 2005, p.10). Typical tools for such arrangement include formalisation
and decentralisation (Hwang, 2005; Dik, 2011). Whether an organisation formalises or
decentralises depends on the extent of environmental uncertainty that the organisation faces.
Thus, when the dynamisms in the environment are high, better management of the
organisational structure is required to enable wise decisions to be made. How the organisation
uses the dimensions of formalisation and decentralisation would be of importance, in finding
suitable response to the environment (Hwang, 2005; Dik, 2011). When the decision making
process is decentralised, speedy decision making becomes possible, and this will allow the
organisation respond swiftly to its environment. Based on this logic, it is proposed in this
study that:
H2 - Perceived higher environmental uncertainty leads to a more decentralized structure in
Palestinian Companies.

Chapter 4: Research Framework and Specification of Research Hypotheses
Jafar Ojra - 87 -
4.3.1.3 The Association between Perceived Environmental Uncertainty (PEU) and
Organisational Performance (OP) (H3)
Contingency literature suggests that managers’ perceived environmental uncertainty
influences the organisational performance (e.g., Kwock, 1999; Hwang, 2005).
According to Ittner et al (2003), “managerial accounting is evolving to encompass more
strategic techniques that emphasises the identification, measurement, and management of key
financial and non-financial performance drivers of strategic success”(p.715). Consequently,
many firms have adopted strategic performance measurement to enable them identify the
strategies that are likely to yield the highest performance results and align the organisational
processes and procedures with the attainment of the set strategic objectives (Ittner et al., 2003;
McManus, 2012). Of great interest to firms would be the ability to obtain accurate
measurement of performance for purposes of evaluation and control.
While financial performance evidence is easy to obtain due to their historical and quantitative
nature, non-financial performance pose more difficulty to accurately determine. However,
there has been a noted correlation between the quantity and quality of measures collected by
an organisation and performance (Ittner et al., 2003). Ittner et al (2003), in their study
conducted on the US financial sector prior to the crisis, aptly put it, “our results indicate that
greater measurement emphasis and diversity than predicted by our benchmark model is
associated with higher satisfaction and stock market performance” (p.716). Many
organisations still lag behind in this front with majority preferring to base their strategies on
financial performance.
Studies have also suggested reliance on non-financial performance as one of the main
contributors to higher stock returns of firms (Ittner et al., 2003). Furthermore, firms that focus
on non-financial performance alongside financial performance such as return on assets and
sales growth have been found to respond more appropriately to the dynamics of the business

Chapter 4: Research Framework and Specification of Research Hypotheses
Jafar Ojra - 88 -
environment and consequently record better performance than those that focused largely on
financial performance only (Ittner et al., 2003; Hall, 2011). The study of Chenhall & Morris
(1986) provides evidence that seem to support this logic. They, supported by McManus
(2012), argue that amongst other targets, managers need information that is related to the
external environment, is future orientated and non-financial.
Some of the non-financial measures are represented by contingent factors in the business
environment that form part of this study includes performance of the economy, changing
tastes and preferences of consumers, customer satisfaction, approval or ratings from the
general public, brand image and level of satisfaction of other stakeholders in the business
such as suppliers. Based on the overall analysis, it is logical to believe that organisations give
attention to non-financial performance as a means of responding adequately to the
environment of the organisation. It is therefore posited that:
H3 - Perceived higher environmental uncertainty would lead to increased use of non-
financial performance by Palestinian Companies.
4.3.1.4 The Association between Perceived Environmental Uncertainty (PEU) and
Strategic Management Accounting Technique Usage (SMAU) (H4)
An organisation’s environment is important in the conceptualisation of contingency theory
(Dik, 2011; McManus, 2012). In management accounting and control literature, environment
is one of the factors that determine the management accounting and control systems used by
an organisation (Ezzamel, 1990; Gordon & Miller, 1976; Baines & Langfield-Smith, 2003;
Hoque & James, 2000; Libby & Waterhouse, 1996; Waweru et al., 2004; Tuan Mat, 2010)
and management accounting systems differ from one setting to another (e.g., Otley, 1980;
Briers & Hirst, 1990; Cadez & Guilding, 2008). Further, the external control model suggests
that environment is the most influential factor of organisational actions (Romanelli &
Tushman, 1986).

Chapter 4: Research Framework and Specification of Research Hypotheses
Jafar Ojra - 89 -
According to relevant literature (Anastas, 1997; Cooper, 1996; Gordon & Miller, 1976)
changes in the environment and its associated information needs considerably shape the role
of management accountants in organisations. Chenhall & Morris (1986): PEU has a profound
effect on a company’s information needs. In their positive relationship view of environmental
uncertainty, they argue that in highly uncertain environments managers need information that
is presented on request, is current, provides rapid feedback on decisions and is frequent, but
managers also need information that is related to the external environment, is future orientated
(cited in McManus, 2012, p.3).
While there is the belief that the best way to implement a management accounting technique
would be shaped by the external features of the organisation (Cadez & Guilding, 2008;
Cinquini & Tenucci, 2010), there is still much debate about the influence of external
environmental factors on SMA usage and performance (Kattan et al., 2007; Kholeif et al.,
2007). It is essential for contingency theory to identify the specific aspects of accounting
systems that associate to certain defined circumstances and demonstrate appropriate matching
(Kattan et al., 2007).
With the above need in mind, this study aims to enhance the understanding of the influence of
environmental uncertainty on strategic management accounting techniques design and
implementation.
Based on the foundations pinpointed above, this study argues that changes in environmental
factors would cause changes in the management accounting and control systems implemented
within an organisation (Burns & Vaivio, 2001; Katten et al., 2007; Cadez & Guilding, 2008;
Cinquini & Tenucci, 2010; McManus, 2012). When the perceived environmental uncertainty
is high, the use of SMA would seemingly be intensified to generate relevant facts to enable

Chapter 4: Research Framework and Specification of Research Hypotheses
Jafar Ojra - 90 -
wise decisions to meet the demands of the environment. Based on these logics, this study
follows existing literature (Cadez & Guilding, 2008; McManus, 2012) and proposes that:
H4 – The perceived higher environmental uncertainty will lead to higher SMA-techniques
usage in Palestinian Companies.
4.3.2 Internal Environment/Organisational Factors related Hypotheses (H5 – H8)
In chapter three, section 3.4 specified external and internal organisational environmental
factors. According to environment perspective of strategic management accounting design
and implementation, these external and internal factors explain why management accounting
systems differ from one setting to another (Briers & Hirst, 1990; Cadez & Guilding, 2008;
McManus, 2012). While the hypotheses concerning the former were explained in section
4.3.1 above, this section (4.3.2) explains the internal organisational environment factors (also
called organisational factors).
According to relevant literature, a firm’s internal characteristics would influence the variation
in their management accounting systems. Therefore, the best way to implement a
management accounting technique would be influenced by these internal and external features
of the organisation (Cadez & Guilding, 2008; Cinquini & Tenucci, 2010). According to
contingency theory of organisations, “organisational characteristics such as size, structure,
and technology shape the best management accounting practices that fit for a certain
organisation” (Dik, 2011, p.50; Luft & Shields, 2007; McManus, 2012).
In the literature, there is still much debate about the influence of internal environmental
factors on SMA usage and performance (Kattan et al., 2007; Kholeif et al., 2007). It is
essential for contingency theory to identify the specific aspects of accounting systems that
associate to certain defined circumstances and demonstrate appropriate matching (Kattan et
al., 2007). To enhance knowledge, this study explores the effect of the aforementioned

Chapter 4: Research Framework and Specification of Research Hypotheses
Jafar Ojra - 91 -
internal (organisational) factors on the design and implementation of management accounting
systems in Palestinian Companies.
The hypotheses concerning these organisational factors are explained next in the following
order:
1. Organisational Technology related hypothesis (H5) (section 4.3.2.1),
2. Organisational Size related hypothesis (H6) (section 4.3.2.2), and
3. Organisational Structure related hypotheses (H7 – H8) (section 4.3.2.3).
4.3.2.1 Organisational Technology related hypothesis: The Association between
Organisational Technology (OT) and Strategic Management Accounting
Technique Usage (SMAU) (H5)
Contingency literature posits that a combination of situational and structural variables may be
associated with the strategic management accounting technique fit in an organisation (See
Section 3.4.5), and technology is one of these variables (Khandwalla, 1977; Merchant, 1984;
Dunk, 1992; Tuan Mat, 2010; Cadez & Guilding, 2008; Haldma & Lääts, 2002; Huang et al.,
2010; Baines & Langfield-Smith, 2003; Libby & Waterhouse, 1996; Waweru et al., 2004).
There is need to study the influence of technology in a strategic management context (e.g.
Mahmood & Mann 1993, Kaplan & Norton 1996). Information technology aids a firm’s
ability to develop management accounting systems and strategy (Hyvönen, 2008).
Consequently, firms are faced with the challenge of integrating information technology into
accounting practices (Olsen & Cooney, 2000).
Researchers argue that there is a link between management accounting systems and
information technology (Chapman & Chua 2000, Ittner & Larcker 2001, Chenhall, 2003).
Also, it is argued that production technique and the complexity of the process impact the
internal cost accounting and information system (Otley, 1980). Advancements in information
and communication technology (ICT) are core aspects of technology development in the

Chapter 4: Research Framework and Specification of Research Hypotheses
Jafar Ojra - 92 -
global banking sector, and overall modern day marketplace structure, leading to developments
as business process automation (Grabski et al., 2009).
Empirically, organisations have changed their MAS to a more efficient and effective systems
to enable them compete well in the market (e.g., Baines & Langfield-Smith, 2003; Haldma &
Lääts, 2002; Hoque et al., 2001). In his study of Korean manufacturing companies, Choe
(2004) found a significant positive relationship between the level of manufacturing
technology and the amount of information produced by the management accounting
information system. Palestinian companies have been keeping pace with development in
technology, and accounting as a provider of information to aid managerial decisions, would
fit its strategic management accounting practices to meet the change level. Thus, it is expected
that:
H5 – Perceived higher level of information and communication technology would lead to
higher SMA usage in Palestinian Companies.
4.3.2.2 Organisational Size related hypothesis: The Association between Organisational
Size (OSZ) and Strategic Management Accounting Technique Usage (SMAU) (H6)
Contingency literature suggests that firm size influences the way organisations design and use
management accounting practices for decision making (e.g., Bruns & Waterhouse, 1975;
Gordon &Narayanan, 1984; Burns & Stalker, 1961: Miles & Snow, 1978; Guilding et al.,
2000; Cadez & Guilding, 2008; Cinquini & Tennucci, 2010; Tuan Mat, 2010; Huang et al.,
2010). The theoretical foundations connecting to organisational size have been elaborated in
section 3.4.5.3.
This study argues that since the activities and interactions in an organisation would increase
along with company size, SMA usage in the explored companies would vary. Following past
studies (e.g., Guilding, 1999; Libby & Waterhouse, 1996; Merchant, 1981; Cadez & Guiding,
2008; Hwang, 2005; Cinquini & Tenucci, 2010), this study proposes that:
H6 - SMA Usage will be greater in larger than in smaller Palestinian Companies.

Chapter 4: Research Framework and Specification of Research Hypotheses
Jafar Ojra - 93 -
4.3.2.3 Organisational Structure related hypotheses (H7 – H8)
The theoretical foundations concerning organisational structure have been pinpointed in
section 3.4.5.2. Organisational structure comprises the parameters that define the way an
organisation is assembled (Chandler, 1962), and when the dimensions of the organisation’s
structure are well coordinated to allow the organisation to complete its purpose and meet its
goals and objectives, it has established structural effectiveness (Schaffer, 1984; Hwang,
2005).
As pinpointed in section 3.4.5.2, organisational structure has been conceptualised in this study
in terms of formalisation and decentralisation (Bruns & Waterhouse, 1975; Chenhall &
Morris, 1986; Libby & Waterhouse, 1996; McManus, 2012). Following context literature, two
hypotheses concerning organisational structure are used in this study: the first connects to
strategic management accounting technique usage (See Section 4.3.2.3.1), while the second
connects to organisational performance (See Section 4.3.2.3.2).
4.3.2.3.1The Association between Organisational Structure (OSTR) and Strategic
Management Accounting Technique Usage (SMAU) H7
Organisational structure is a core variable in the exploration of the contingency perspective of
strategic management accounting (e.g., Chenhall, 2008; Libby & Waterhouse, 1996; Tuan
Mat, 2010). Based on that logic, this study investigates the association between organisational
structure and SMAU. According to MAS literature, MAS forms an important part of the
information and control systems that support the basic intent of formal structure (Moores &
Mula, 1993), and firms that face high uncertainty require a decentralised structure and more
sophisticated MAS (Abdel-Kader & Luther, 2008).
Further literature: management accounting in an organisation is both an element of
organisational structure and an outcome of chosen organisational structure (Luther &
Longden, 2001; Gerdin, 2005). The outcome context is the focus in this study.

Chapter 4: Research Framework and Specification of Research Hypotheses
Jafar Ojra - 94 -
Literature (See Section 3.4.5.2.2) has explained theoretical foundations concerning
decentralisation (and its opposite “centralisation”). That section also underlines the core
connection between strategic management accounting and overall organisational strategy:
“Strategic management accounting has characteristics related to aspects of horizontal
organisation as they aim to connect strategy to the value chain and link activities across the
organisation…” (Chenhall, 2008, p.525).
This study supports the logic that decentralisation (delegating decision making authority to
lower levels) would enable organisations adapt the strategic management accounting practices
as need arises (Abernethy & Bouwens, 2005, Moers, 2006¸ Matejka & De Waegenaere, 2000)
towards identifying strategic priorities with a customer-oriented focus (Chenhall, 2008).
Organisations that keep a decentralised structure tend to implement changes in their
management accounting systems to enable them link various activities across the organisation
(Matejka & De Waegenaere, 2000; Chenhall, 2008).
Similarly, organisational structure literature suggests that the level of formalisation in an
organisation influences the strategic management accounting practices in an organisation
(e.g., Hwang, 2005). Formalisation concerns the degree to which decisions and working
relationships are managed by strict rules and standard policies and procedures (Ruekert et al.,
1985). In highly structured environment where responsibilities are regulated by strict rules
and operating procedures, employees are less likely to act swiftly to exploit opportunities,
which will adversely affect the organisation’s customer orientation ability.
This study argues that such a trend will influence the strategic management accounting
practices of an organisation.
Combining above highlighted decentralisation and formalisation foundations, it is proposed:
H7: The perceived organisational structure (less formalisation, more decentralisation) would
lead to a higher level of SMA-techniques usage in Palestinian Companies.

Chapter 4: Research Framework and Specification of Research Hypotheses
Jafar Ojra - 95 -
4.3.2.3.2 The Association between Organisational Structure (OSTR) and Organisational
Performance (OP) H8
A firm’s performance is usually a result of its organisational structure (Kwock, 1999; Tuan
Mat, 2010), a view that reinforces Pennings’ (1975) study that reported a fit between
organisational structure and performance. Section 4.3.2.3.1 above pinpointed that
decentralisation would aid wise decision making for strategy prioritisation towards a
customer-oriented focus.
Further literature connecting to this logic suggests that decentralisation would broaden the
scope of lower managers and also provide business units significant freedom to make trade-
offs (Jensen, 2001; Prendergast, 2002; Moers, 2006). Also, management accounting and
control research suggests that decentralised decision making would be associated to a strong
emphasis on formal management accounting and control system (including financial and non-
financial management accounting) and performance information (e.g., Bruns & Waterhouse,
1975; Gordon & Narayanan, 1984; Chenhall & Morris, 1986; Moers, 2006). These
foundations suggest that decentralisation would enhance organisational performance.
“With the increasing use of team based structures and need for customer orientation6, there is
need for easily accessible and relevant information, ……. for top management to evaluate the
options of the firm” (Tuan Mat, 2010, p.46). Insights concerning the relationship between
organisational design and performance, for example, Pratt (2004) found that increasing
employees’ involvement in work groups as part of the mission and strategy will increase
organisational performance. Decentralisation, explained above, is one organisational structure
tool that fits into this team based structure foundation. Another factor is whether the
organisational structure should be formalised or not.
6 Italics added

Chapter 4: Research Framework and Specification of Research Hypotheses
Jafar Ojra - 96 -
Following the foundation highlighted in section 4.3.2.3.1, this study posits that organisations
characterised by less formalisation would be more capable to act swiftly and respond to
market demands. Thus, such organisations would achieve higher organisation performance.
Based on the insights highlighted above, this study proposes that:
H8 - The perceived organisational structure (less formalisation, more decentralisation)
would lead to a higher level of performance in Palestinian Companies.
4.3.3 Business/Organisational Strategy related Hypotheses (H9 – H11)
In chapter three, section 3.5 presented the theoretical foundation concerning strategy for this
study. Contingency-based studies suggest a relationship between the specific strategy adopted
and organisational performance (e.g., Kwock, 1999). Organisational theorists provide
arguments that help explain how the effectiveness of SMA depends on the nature of the
contemporary setting. Commenting in this connection, Chenhall (2003, p.128) notes: “perhaps
the most important new stream of literature has been that related to the role of strategy”.
Section 3.5 pinpoints connections of organisational strategy to strategic management
accounting (SMA) usage, organisational structure, and organisational performance.
In this section, the hypotheses that connect business/organisational strategy and strategic
management accounting techniques usage (section 4.3.3.1) on the one hand, and
business/organisational strategy and organisational structure (section 4.3.3.2) are specified. A
further hypothesis explained in this section relates to the association between
business/organisational strategy and organisational performance (section 4.3.3.3).
Supporting the view that strategy represents a very important contingency variable (e.g.,
Langfield-Smith, 1997; Simons 1995; Miles & Snow, 1978; Cadez & Guilding, 2008), this
study explores the contingency influence of organisational strategy and proposes the
following hypotheses, as specified in sections 4.3.3.1, 4.3.3.2, and 4.3.3.3.

Chapter 4: Research Framework and Specification of Research Hypotheses
Jafar Ojra - 97 -
4.3.3.1 The Association between Business/Organisational Strategy (OS) and Strategic
Management Accounting Technique Usage (SMAU) (H9)
Reviewed literature (See Section 3.5) suggests a relationship between an organisation’s
strategic approach and strategic management accounting (and management control systems –
MCS). A number of researchers have investigated the link between particular elements of
MCS and the specific strategy adopted by organisations under the contingency approach since
the 1980’s (e.g., Simons, 1990; Shank & Govindarajan, 1992; Bruggeman & Van der Stede,
1993; Chenhall & Langfield-Smith, 1998).
Literature on strategy typology (e.g., Cadez & Guilding, 2008; Cinquini & Tenucci, 2010)
suggests the type of strategy an organisation uses may also influence the nature of SMA usage
and the organisational performance. This notion of association between business strategy and
strategic management accounting (SMA) techniques is also supported by other studies (e.g.,
Cadez & Guilding, 2007; Cravens & Guilding, 2001; Langfield-Smith, 1997). Further
literature even suggests that MAS which is tailored to support strategy can generate
competitive advantage and superior performance (Kaplan & Norton, 1996; Govindarajan &
Gupta, 1985; Simons, 1987; Samson et al., 1991).
According to Chenhall & Langfield-Smith (1998), high performing product differentiator
firms are associated with management techniques of quality systems, team-based human
research structure, and MAPs incorporating employee-based measure, benchmarking,
strategic planning and activity-based techniques. High performing low-cost strategy firms, on
the other hand, they explain, are associated with management techniques of improving
existing processes, integrating systems, innovating manufacturing systems and activity-based
techniques. The recent research by Verbeeten (2010) reports that prospector strategies appear
to be positively associated with major changes in MAS.

Chapter 4: Research Framework and Specification of Research Hypotheses
Jafar Ojra - 98 -
As Tuan Mat (2010) comments; “it can be concluded that strategy is an important factor in the
design and use of MAS” (p.42), a conclusion that reinforces Simons (1987) where MAS was
modified in accordance with the strategy of a company. In this study, it is expected that SMA
usage will be high in prospector companies, therefore, it is posited that:
H9 - SMA Techniques would be more widely adopted in prospector than defender Palestinian
Companies
4.3.3.2 The Association between Business/Organisational Strategy (OS) and
Organisational Structure (OSTR) (H10)
Organisational strategy priorities should not only be supported by management information
system, but also by organisational structure (Chenhall & Langfield-Smith). Achieving
appropriate match between organisational strategy and organisational structure enables
enhanced organisational performance (Jermias & Gani, 2002).
For H1, the logic was presented that a prospector approach is often used when there is high
environmental dynamism. Connected to that logic, H9 posits that more SMA use will be
necessary to meet the requirements for a prospector approach. Following these combined
logic, this study suggests that such circumstances would be better served if the decision
making process is decentralised. Thus, it is argued that:
H10- Prospector -strategy would lead to more decentralised structure than defender-strategy
among Palestinian Companies.
4.3.3.3 The Association between Business/Organisational Strategy (OS) and
Organisational Performance (OP) (H11)
According to contingency literature, successful organisational performance depends on
effective implementation of the strategic elements (Stonich, 1982). Strategic implementation
involves establishing policies and annual objectives and allocating resources towards
accomplishment of formulated strategy (Hwang, 2005). A firm’s performance is usually a
result of its strategic choice (Kwock, 1999).

Chapter 4: Research Framework and Specification of Research Hypotheses
Jafar Ojra - 99 -
There is the argument that for firms to support and evaluate the achievement of strategic
advantages, reliance on financial performance measures alone will not necessarily improve
financial results, as financial measures only reveal the outcome of past activities which offer
no clue for improving future performance (Choe, 2004). Greater use of non-financial
information for business units that follow a customer-focused or prospector strategy
positively impact organisational performance (Davila, 2000; Chong & Chong, 1997).
Furthermore, tapping from the combined logic supporting H10, there is a further rationale to
believe that if organisations are prospector oriented, they will be more able to respond
adequately to the environment, given their dispensation to take advantage of the decentralised
decision making process. Logically, therefore, it seems right to suggest that organisations
which behave in this form would perform better than those behaving differently. Thus, it is
proposed here that:
H11 – Prospector strategy will lead to higher performance than defender strategy in
Palestinian Companies.
4.3.4 Strategic Management Accounting Technique Usage related Hypothesis (H12)
Since the 1980’s there is increasing call for management accounting practices that are tailored
to react to changes in the market environment (e.g., Johnson & Kaplan, 1987; Wilson, 1999).
These should include management accounting techniques which provide information for
strategic decision making, e.g., activity-based costing (Cooper et al., 1992), product attribute
costing (Bromwich, 1990), strategic cost accounting (Shank & Govindarajan, 1993) and
balanced scorecard (Kaplan& Norton, 2001). Other studies also advocate for management
accounting that aid strategic process (Simons, 1990).
A firm’s strategic management process includes amongst others, strategic management
accounting process and strategic choice (Kwock, 1999). This study follows existing literature
and aligns to the notion that strategically aligned management accounting practices would

Chapter 4: Research Framework and Specification of Research Hypotheses
Jafar Ojra - 100 -
enhance organisational performance e.g., (Kwock, 1999; Langfield-Smith, 1997), hence the
hypothesis explained in section 4.3.4.1 below.
4.3.4.1 The Association between Strategic Management Accounting Technique Usage
(SMAU) and Organisational Performance (OP) (H12)
Alarcon & Bastias (2000): company performance can be an affected by both the ongoing
industry changes and competition strength between companies in the same field. Such
ongoing industry changes and competition strength influence the need and use of SMA
practices. Consequently, the strategic management accounting practices used by an
organisation would influence organisational performance, this study argues. A firm’s strategic
management process (including, amongst others, strategic management accounting process,
strategic choice) shapes organisational performance (Kwock, 1999).
According to literature, MCS are tailored explicitly to support the strategy of the business
towards competitive advantage and enhanced performance (e.g., Dent, 1990; Langfield-
Smith, 1997; Simons, 1990; Samson et al., 1991). Further literature suggests that MCS
contributes to the operation and profitability of the company (Merchant & Simons, 1986).
Other context evidence (e.g., Govindarajan, 1988; Govindarajan & Gupta, 1985) argue that
organisations that appropriately match their organisation’s environment, strategy and internal
structure and system would achieve higher organisational performance.
In literature, when organisations implement MAS that fit organisational and environmental
factors, they are likely to perform better (Chenhall, 2003; Otley, 1983), and the most critical
performance factor is the fit between MAS and contextual variables (Jermias& Gani, 2002).
While the relationship between SMA usage and performance has been extensively explored,
there are big contrasts in the findings (Cadez & Guilding, 2008): most studies suggest positive

Chapter 4: Research Framework and Specification of Research Hypotheses
Jafar Ojra - 101 -
association (e.g., Baines & Langfield-Smith, 2003; Cravens & Guilding, 2001; Ittner et al.,
2003; Mahama, 2006; Mia & Chenhall, 1994), but others suggest inconclusive relationship
(e.g., Scott & Tiessen, 1999; Ittner et al., 2003; Abernethy & Bouwens, 2005). It is important
to investigate whether MAS actually helps firms improve performance (Tuan Mat, 2010). In
my study, I follow Cadez & Guilding (2008) and propose:
H12 - Greater SMA usage is positively associated with performance in Palestinian
Companies.
Chapter 4: Research Framework and Specification of Research Hypotheses
Jafar Ojra - 102 -
4.4 Conclusion to the Chapter
With the ever increasing wind of globalisation, the environment surrounding organisations
operating in less developed countries (LDC) witnesses immense increase in uncertainty,
competition in the industry, and technological advancement. To be successful, sustain or
improve performance, in these circumstances, a market orientated focus is essential.
Organisations must therefore ensure that their organisational designs and strategies match
their environmental circumstances. This is the core argument of this study.
Advancing the steps taken in chapter 3 which presented the theoretical foundations, this
chapter (4) explained the framework for this study, as well as summarising the hypotheses
that underline the conceptualised associations between the variables in Figure 4.1.
The hypotheses for this study are summarised in Table 4.1 below. In the next chapter (5), the
methodological approach for undertaking this study is explained.
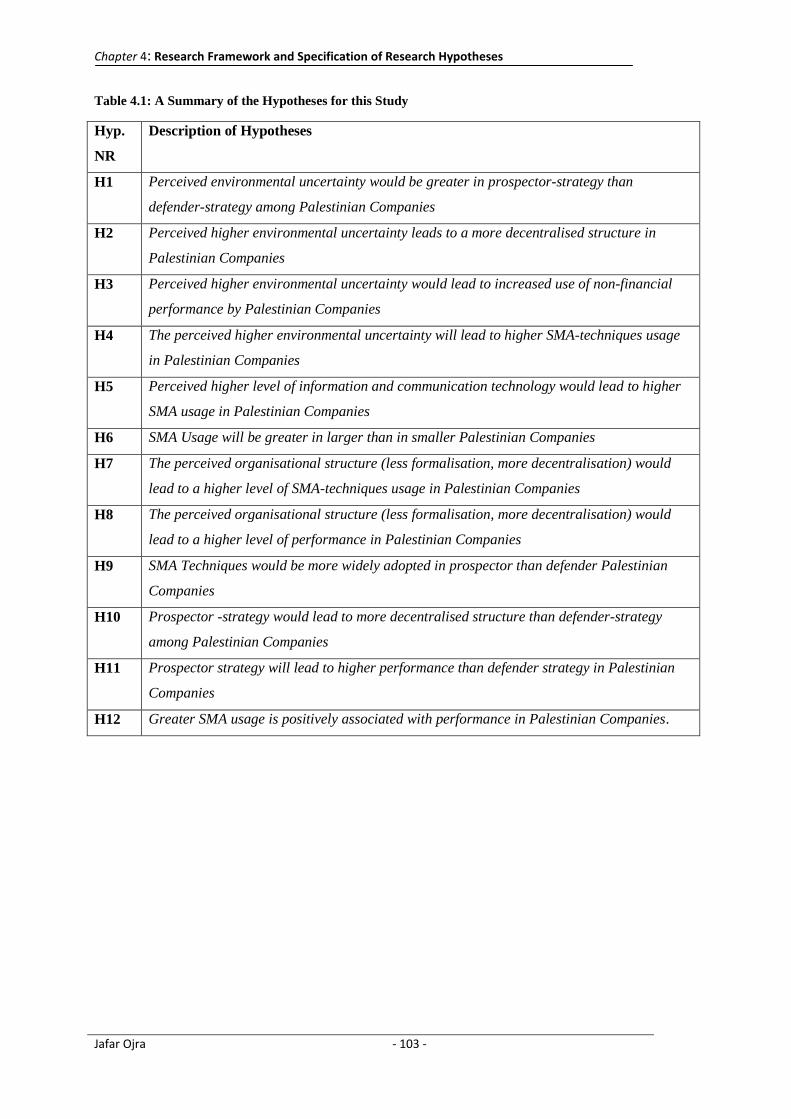
Chapter 4: Research Framework and Specification of Research Hypotheses
Jafar Ojra - 103 -
Table 4.1: A Summary of the Hypotheses for this Study
Hyp.
NR
Description of Hypotheses
H1 Perceived environmental uncertainty would be greater in prospector-strategy than
defender-strategy among Palestinian Companies
H2 Perceived higher environmental uncertainty leads to a more decentralised structure in
Palestinian Companies
H3 Perceived higher environmental uncertainty would lead to increased use of non-financial
performance by Palestinian Companies
H4 The perceived higher environmental uncertainty will lead to higher SMA-techniques usage
in Palestinian Companies
H5 Perceived higher level of information and communication technology would lead to higher
SMA usage in Palestinian Companies
H6 SMA Usage will be greater in larger than in smaller Palestinian Companies
H7 The perceived organisational structure (less formalisation, more decentralisation) would
lead to a higher level of SMA-techniques usage in Palestinian Companies
H8 The perceived organisational structure (less formalisation, more decentralisation) would
lead to a higher level of performance in Palestinian Companies
H9 SMA Techniques would be more widely adopted in prospector than defender Palestinian
Companies
H10 Prospector -strategy would lead to more decentralised structure than defender-strategy
among Palestinian Companies
H11 Prospector strategy will lead to higher performance than defender strategy in Palestinian
Companies
H12 Greater SMA usage is positively associated with performance in Palestinian Companies.
Chapter 5: Research Methodology
Jafar Ojra - 104 -
5. Research Methodology
5.1 Introduction
Following the review of relevant literature in chapter 3, chapter four explained the framework
for this study specifying the underlying hypotheses. In this chapter (5), the methodological
approach for exploring the framework and relationships pictured in Figure 4.1 of Chapter four
is presented. For that goal, first, a reminder of the research objectives is stated. Thereafter, the
researcher explains the research design for this study. In that connection, relevant
methodological literature to position this study in the philosophy of research is presented.
After that, the data collection process (including sampling issues) is described, stating also
and validating the survey instrument used. To conclude this chapter, the process of analysis is
explained to show the process of ensuring reliability and validity in the research.
At this point, it is important to remind ourselves of the objectives of this thesis, which
includes:
1. To identify whether and how Palestinian companies used strategic management
accounting practices,
2. To identify, in that connection, the contingency factors that play a role in this their
practices, and
3. To identify the degree of association between the conceptualised contingency factors.
To explore the above three research objectives, the study follows the positivism paradigm and
uses quantitative tools for data collection, as these fit the research focus. Pre-testing of
questionnaire and refining of quantitative mechanism were enhanced through some qualitative
metrics.
Chapter 5: Research Methodology
Jafar Ojra - 105 -
The methodological approach for this thesis is further explained in the following order:
The Research Design,
The Positioning of the Study within Philosophical Paradigms,
The Methodological Approach (including Population and Respondents), and
The Validity and Reliability of the Research.
5.2 The Research Design
The purpose of a research design is to ensure that the empirical evidence obtained answers to
the research questions in a convincing way (Vaus, 2001; Nachmias & Nachmias, 2008).
Research design is “a master plan specifying the methods and procedures for collecting and
analysing the needed information” and as a “framework of the research plan of action”
(Zikmund, 1997, p. 40). Social science literature identifies three core research designs (Ghauri
et al., 1995), namely “Exploratory”, “Descriptive” and “Causal”. Other social scientists that
support this research design categorisation include e.g., Oppenheim (1992) and Chisnall
(2005).
“Exploratory designs are concerned with identifying the real nature of research problems, and,
perhaps, of formulating relevant hypotheses for later tests” (Chisnall, 2005, p.37), a position
that lends support to the view that exploratory design is suited to situations where initial ideas
and insights to a research problem are required (Ghauri et al., 1995). Given the objectives of
this research (See Section 5.1 above), exploratory research is appropriate. This exploratory
approach will fit the aim of adequately obtaining the evidence that answers the defined
research questions (Vaus, 2001; Chisnall, 2005). This exploratory research uses hypotheses
and is quantitatively based.

Chapter 5: Research Methodology
Jafar Ojra - 106 -
Towards explaining the exploratory quantitative focus of this research, section 5.3 highlights
next the literature on research paradigms and assumptions, specifying also the positioning of
this study in the research paradigm context.
5.3 Research Paradigms and Assumptions
In conducting research it is important to construct a philosophical position (Dainty, 2007). It
is essential to ensuring the quality of research (Amaratunga & Baldry, 2001). Also, scholars
note that a review of research philosophy minimizes methodological errors (Hughes &
Sharrock, 1997; Kvale, 1996). According to (Healy & Perry, 2000, p.118) “scientific research
paradigms are overall conceptual frameworks within which some researchers work” (see also
Myers, 1997).
Prior literature (Deshpande, 1983, p.101) defines paradigms as “a set of linked assumptions
about the world which is shared by a community of scientists investigating the world”. On
their part, Guba & Lincoln (1994, p.105) define research paradigm as “the basic belief system
or world view that guides the investigator, not only in choices of method but in ontologically
and epistemologically fundamental ways.” Thus, a scientist normally works within a
paradigm – that determines the problems that are regarded as crucial, the ways the problems
are conceptualised, the ideal methods of enquiry, the relevant standards of judgment, etc
(Philips, 1987, p.205; Kuhn, 1962).
There are four research paradigms (Healy & Perry, 2000; Guba & Lincoln, 1994):
1. Positivism;
2. Critical theory;
3. Constructivism; and
4. Realism.

Chapter 5: Research Methodology
Jafar Ojra - 107 -
Each of these paradigms is comprised of ontology, epistemology and methodology (Guba &
Lincoln, 1994; Myers, 1997; Perry et al., 1997). Ontology is "the study of being. It is
concerned with ‘what is’, with the nature of existence, with the structure of reality as such”
(Crotty, 1998, p. 10). It asks the question: what is there that can be known about it? (Guba &
Lincoln, 1994). Epistemology, which “derives from two Greek words: ‘episteme’ which
means ‘knowledge’ or ‘science’; and ‘logos’, means ‘knowledge’, ‘information’, ‘theory’ or
‘account’” (Johnson & Duberley, 2000, p. 2). Thus, epistemology asks the question: what is
the nature of relationship between the inquirer and the external world? (Guba & Lincoln,
1994). Finally, Methodology “is the technique used by the researcher to investigate reality”
(Healy & Perry, 2000, p.119) i.e., a procedure by which knowledge (reality) is to be
generated. The methodological question asks: how can the researcher approach whatever can
be known about reality?(Guba & Lincoln, 1994).
Next, a summary of the philosophical assumptions concerning these three elements of
ontology, epistemology and methodology in the research paradigms (Guba & Lincoln, 1994)
is presented (See Table 5.1) , and following that a summary of the four research paradigms is
presented (Sections of 5.3.1 to 5.3.4), prior to clearly specifying the paradigmatic positioning
of this research (Section 5.4).

Chapter 5: Research Methodology
Jafar Ojra - 108 -
Table 5.1: Four Categories of Scientific Paradigms and their Elements
Paradigms
Elements Positivism Critical theory Constructivism Realism
Ontology Reality is real and
apprehensible
‘Virtual reality’ shaped by
social, economic, ethnic,
political, cultural, and
gender beliefs crystallised
over time
Multiple local and
specific
‘constructed’
realities
Reality is ‘real’ but only
imperfectly and
probabilistically
apprehensible
Epistemology
Objectivist: Findings
true
Subjectivist: value
mediated findings
Subjectivist: created
findings
Modified Objectivist:
Findings probably true
Common
Methodologies
Experiments/Surveys:
Verification of
hypothesis
Quantitative methods
Dialogical/Dialectical:
researcher is a
‘transformative
intellectual’
who changes the social
world within which
participants live
Hermeneutical/Dial
ectical:
researcher is
‘passionate
participant within
the world being
investigated
Case Studies/
Convergent
Interviewing:
triangulation,
interpretation of
research issues by
qualitative methods
Source: Healy & Perry (2000, p.119) based on Guba & Lincoln (1994).
5.3.1 The Positivism Paradigm
Fundamentally, positivism is concerned with explaining human behaviour (Amaratunga &
Baldry, 2001, p.96). Supporting this human behaviour point, scholars define positivism as an
approach which uses scientific methods of natural science to study human activity in an
objective manner (e.g., Hollis, 1994; Delanty, 2005).
Positivism, which “predominates in science” (Healy & Perry, 2000, p.119) assumes a
quantitative approach to measuring independent facts about a single apprehensible reality
(Guba & Lincoln, 1994; Tsoukas, 1989). It assumes that scientific knowledge is positively
verifiable and foundation of knowledge is built on the discovery of general laws (Delanty,
2005).

Chapter 5: Research Methodology
Jafar Ojra - 109 -
In positivism the data and its analysis is value free and it does not change because it is
observed (Healy & Perry, 2000). Positivism is based on quantitative data while the other three
paradigms are mainly linked to qualitative research (Healy and Perry, 2000). Positivism suits
the exploration of hypotheses (Hassard, 1999). Primarily, the data collection techniques in this
paradigm include controlled experiments and sample surveys, and the research enquiry mode
being theory testing or deduction (Perry et al, 1997).
5.3.2 The Constructive Paradigm
In this philosophical realm, “truth is a particular belief system held in a particular context”
(Healy & Perry, 2000, p.120). According to Guba & Lincoln (1994, p.112), the study of
reality depends on the interaction between the researcher and the respondent, i.e. the
researcher has to be a ‘passionate participant’ in the fieldwork. Constructivism may be
suitable for social sciences and consumer behaviour researches, particularly studies
incorporating notions of religion, beauty, or prejudice (Healy & Perry, 2000) but is rarely
considered for management studies as the constructivist perspective excludes concerns about
the economic and technological dimensions of business (Hunt, 1991).
5.3.3 The Critical Theory Paradigm
The “critical theory paradigm emphasises socials realities incorporating historically situated
structures” (Healy & Perry, 2000, p.120). Critical theory researchers aim at critiquing and
transforming the social, economic, political, cultural, and gender aspects of the reality (Perry
et al., 1997). Critical theory assumptions are essentially subjective; therefore knowledge is
grounded in social and historical routines and is value-dependent (Guba & Lincoln, 1994).
Though critical theory acknowledges the complexity of reality, it is not very suitable for this
study (Guba & Lincoln, 1994).

Chapter 5: Research Methodology
Jafar Ojra - 110 -
5.3.4 The Realism Paradigm
The realism paradigm is based on the view that while there is a ‘real’ world to discover it may
not be perfectly apprehensible (Healy & Perry, 2000; Marsh & Smith, 2001; Godfrey & Hill,
1995). This philosophy believes that there are deep structures which cannot be directly
observed through scientific methods (Marsh & Smith, 2001). According to Marsh & Furlong
(2002), realists view the reality world as socially constructed, therefore value and bias from
the researcher to the observed object cannot be detached. “Realism is a relevant paradigm for
many qualitative researchers” (Healy & Perry, 2000, p.120).
Having explained the four research paradigms, the appropriate paradigm for this study is
specified in Section 5.4 while the quantitative tool is explained (Section 5.5)
5.4 The Philosophical Position of this Study and Why?
Scholars should endeavour to examine ontological and epistemological issues, and
subsequently address the defined research problems with appropriate methodology (Carson et
al., 2001). Choices of methods and techniques depend on ontological and epistemological
assumptions (Hughes & Sharrock, 1997).
This study is positioned in the positivism realm. In positivism, things can be studied as hard
facts, and the relationship between these facts can be established (Hughes & Sharrock, 1997).
This study draws on this methodological foundation in the exploration of the contingency
factors in the strategic management accounting practices of Palestinian companies. The
positivism paradigm is applicable for this study for a number of reasons:

Chapter 5: Research Methodology
Jafar Ojra - 111 -
1. Positivism is best served by survey and mathematical analysis tools (Healy & Perry,
2000) and this is the suitable approach in this study, as it suits the need to address the
nature of questions in this study. This study focuses on addressing the questions of
‘what’ and ‘how’ of contingency relationships in the strategic management accounting
practices in Palestinian companies,
2. Primarily, the mode of research enquiry for positivism is theory-testing based on
deduction (Layder, 1993). This study, based on foundations generated from past
studies, tests theory concerning the relationship between factors in the strategic
management accounting theory in Palestinian companies,
3. In connection to the above theory-testing point, this study tests hypotheses. Positivism
aids the aim of generating findings and hypotheses testing (Schiffman & Kanuck,
1997; Hassard, 1999; Easterby-Smith et al., 2002), and
4. Also, authors (e.g. Easterby-Smith, 1991) pinpoint implications of the elements of the
positivist philosophy, which also justify the positivist paradigm grounding of this
study:
a) Value-freedom: the choice of what to study, and how to study it, should be
determined by objective criteria rather than human beliefs and interests;
b) Causality: the aim should be to pinpoint causal explanations and fundamental
laws that explain human behaviour;
c) Operationalisation: concepts need be operationalised in a way that enables facts to
be measured quantitatively;
d) Interdependence: the role of the researcher is independent of the researched
subject; and
e) Reductionism: problems are understood if they are reduced to the simplest
possible elements.
Next, the quantitative tool for this study is explained.

Chapter 5: Research Methodology
Jafar Ojra - 112 -
5.5 The Quantitative Tool for this Study
The focus in this section is to review literature on quantitative method (section 5.5.1) and
thereafter present the justification for the use of quantitative method in this study (section
5.5.2). Following that, the data collection process and tool for the study are explained (Section
5.6).
5.5.1 Quantitative Research Method
Creswell (1994) defines quantitative research as a research that explains phenomena by
collecting numerical data that are analysed by using statistical techniques (See also Bryman,
2004). Being deductive (Frankfort-Nachmias & Nachmias, 1992), this study’s quantitative
approach is based upon formulating research hypotheses and verifying them empirically on a
set of data.
According to Johnson & Onwuegbuzie (2004, p.18), “the major characteristics of traditional
quantitative research are a focus on deduction, confirmation, theory/hypotheses testing,
explanation, prediction, standardised data collection, and statistical analysis”. As summarised
in that study, the strengths of quantitative research are shown in Table 5.2 below.

Chapter 5: Research Methodology
Jafar Ojra - 113 -
Table 5.2: The Strengths of Quantitative Research
1 “Testing and validating already constructed theories about how (and to a lesser degree,
why) phenomena occur.
2 Testing hypotheses that are constructed before the data are collected. Can generalise
research when data are based on random samples of sufficient size.
3 Can generalise a research finding when it has been replicated on many different
populations and sub-populations.
4 Useful for obtaining data that allow quantitative predictions to be made.
5 The researcher may construct a situation that eliminates the confounding influence of
many variables, allowing one to more credibly assess cause-and-effect relationships.
6 Data collection using some quantitative methods is relatively quick (e.g., telephone
interviews.
7 Provides precise, quantitative, numerical data.
8 Data analysis is relatively less time consuming (using statistical software).
9 The research results are relatively independent of the researcher (e.g., effect size,
statistical significance).
10 It is useful for studying large numbers of people.”
Source: Adopted from Johnson & Onwuegbuzie (2004, p.19).
5.5.2 Justifying use of Quantitative Approach in the Study
Quantitative research methods are suitable for positivist research (Healy & Perry, 2000;
Easterby-Smith et al., 2002) and this is the logic followed in this study. The exploratory
nature of the current study requires a quantitative method, as this study assesses phenomena in
a new light (Robson, 1993).
Table 5.3 pinpoints the data collection approaches used in past studies that explored the
contingency context of SMA and other MA contexts. In this study, quantitative method is
appropriate because of a number of reasons:
1. The most important factor for deciding the appropriate research approach for a study
is the nature of the research topic (Creswell, 2003; Saundrs et al., 2007). “The reason
for this is that for a literature-rich topic, the deductive approach would be more
appropriate, whereas for a new topic with little or no existing literature, it may be
more suitable to use an inductive approach” (Leftesi, 2008, p.119). For the research

Chapter 5: Research Methodology
Jafar Ojra - 114 -
focus in this study (the contingency perspective of strategic management accounting
practices), the topic is not new and reasonable literature exists. Therefore a deductive
(quantitative) approach is suitable for this study.
2. According to Collis & Hussey (2003), the positive approach is the dominant
paradigm in business and management research. It is usually ideal to follow the
research methodology that has been adopted by previous studies in a research
disciple, they advised. The quantitative method has been used by previous studies
that explored the contingency context of SMA (See Table 5.3). In that connection
relevant measures have been tested in the past.
3. This study tests specified hypotheses, which suggests relationship between variables.
Quantitative tools fit hypotheses testing (Merriam, 1988). Quantitative methods as a
deductive approach enable the testing of theory and prove generalisations about a
phenomenon (Deshpande, 1983).
4. This study aims to answer the ‘What’ questions, and the ‘What’ nature of research
questions are better answered using a quantitative approach (Robson, 1993). This
study also addresses the ‘how’ type of questions. Quantitative method is also
appropriate for this study because it enables a scientific examination of this nature of
questions.

Chapter 5: Research Methodology
Jafar Ojra - 115 -
Table 5.3: Methodological Precedence in past studies on SMA, and other contingency Perspectives
S/Nr. Studies MA/SMA/Othe
r
Context (Industry &
National)
Methodological Approach
1 Cadez & Guilding
(2008)
SMA Slovenia, multi-
industry.
Questionnaire Survey with 193 samples. Also
used interviews
2 Cinquini & Tennucci
(2010)
SMA Italian Manufacturing
companies
Questionnaire survey with a sample of 215
companies
3 Guilding et al. (2005) SMA (cost-
plus pricing)
UK & Australian
companies
Questionnaire survey
4 Alrawi & Thomas
(2007)
MAIS UAE Commercial
Banks
Quantitative survey involving 133 managers
5 McManus (2012) CA (SMA) &
MP
Australian Hotel
Industry
Quantitative survey involving 165 hotel
managers.
6 Kattan et al. (2007) MAI Palestinian Company Case study Interviews & archival data in a
company over a 10-years period
7 Waweru et al. (2004) MAPs
South African retail
companies
Interviews and questionnaire
8 Bhimani &
Langfield-Smith
(2007)
SMA UK firms (large) Questionnaire and interviews
9 Hwang (2005) SMI South Korean retailing
industry
Questionnaires
10 Guilding &
McManus (2002)
SMA Australian Companies Questionnaires survey involving 124
companies
11 Ghosh & Chan
(1997)
MAPs Singapore companies
(multi)
Questionnaires
12 Anderson & Lanen
(1999)
MAPs Indian firms Questionnaire survey and interviews involving
14 firms
13 Luther & Longden
(2001)
MAPs South African firms Questionnaire survey involving 139 responses
14 Joshi (2001)
MAPs Indian companies Questionnaires
15 Haldma & Laats
(2002)
MAPs (cost
syst.)
Estonian Manufacturing
firms
Questionnaires survey involving 62 responses
16 Firth (1996)
MAPs Chinese firms Questionnaires
17 Kholeif et al. (2007) IAP Egyptian companies Questionnaires, documentary evidence, direct
observation and face-to-face interviews
18 Soobaroyen &
Sannassee (2007)
FP & CP Mauritius’ Voluntary
organisations
Questionnaire supplemented by interviews
19 Chenhall (2003) MCS Past literature
Critical review of past studies

Chapter 5: Research Methodology
Jafar Ojra - 116 -
20 Chenhall &
Langfield-Smith,
(1998)
Traditional
Accounting &
SMA
Australian
Manufacturing firms
Questionnaire Survey
21 Szychta (2002) Cost Syst. Polish enterprises Survey, interviews and observations and
documentation involving 60 enterprises
22 O’Connor et al.
(2004)
MAPs China’s State Owned
Enterprises (SOE)
Interviews followed by Questionnaires
23 Nimtrakoon & Tayles
(2010)
MAPs Thailand manufacturing
& non-manufacturing
firms
Questionnaire survey involving 135 responses
from accounting managers
24 Löfsten & Lindelöf
(2005)
MAPs (SMA) Swedish Technology-
based firms
Questionnaire survey involving 183 NTBFs
25 Govindarajan &
Gupta (1985)
MCS US firms (multi-
industry)
Quantitative survey involving 58SBUs
26 Waweru (2008) MACS Canadian
Manufacturing firms
Questionnaire survey involving 31 companies
27 Wu et al. (2007) MAPs 64 joint ventures (JVs)
and State Owned
Enterprises (SOE)
Questionnaires
28 Van Triest &
Elshahat
(2007)
Cost Syst. Egyptian firms (multi) At first Questionnaires. Subsequently,
Questionnaires and interviews
29 Leftesi (2008) MAPs Libyan firms
Questionnaires followed by interviews
30 Hyvönen (2008) MAS Manufacturing firms in
Finland
Questionnaire for the first three essays, and
case study for the last essay
31 Tuan Mat (2010) MAPs Malaysian
Manufacturing industry
Questionnaire survey
32 Guilding (1999) SMA New Zealand
Companies
Questionnaire survey involving 217 companies
33 Hoque (2004) SMA New Zealand
Manufacturing firms
Questionnaire Survey involving 100 firms
34 Abdul-Kader &
Luther (2006)
SMA UK food & drinks
industry
Questionnaire survey and interviews
35 Huang et al. (2010) Intellectual
Capital
Malaysian companies Questionnaire survey involving 88/520
responses from companies
36 Guilding et al. (2000) SMA New Zealand, UK and
US companies
Questionnaire survey
Key: MA/SMA = Management Accounting/Strategic Management Accounting; MAI = Management Accounting
Information; MAPs = Management Accounting Practices; MA & PC = Management Accounting & Political Control; MAS =
Managerial Accounting Systems; IAP = Institutionalised Accounting Practices; FP & CP = Financial Planning & Control
Practices; SMI = Strategic Management Implementation; MAIS= Management Accounting Information Systems; CA(SMA)
& MP = Customer Accounting & Marketing Performance; BVA = Brand Value Accounting; MACS = Management
Accounting and Control Systems.
Source: Facts Collated by the author from past studies.

Chapter 5: Research Methodology
Jafar Ojra - 117 -
5.6 The Data Collection Process
A research design “details the most suitable methods of investigation, the nature of the
research instrument, the sampling plan and the types of data” (Chisnall, 2005, p.36). A
reminder of the research objectives was stated earlier. Following that, the positioning of this
study in the paradigmatic context was specified. In the following sections, the sampling
process is explained. Also, the quantitative data collection method is explained, justifying its
appropriateness, and also detailing out the instrument validation process. Subsequent to that,
the actual survey is explained, giving full details on how the research instrument was
generated.
5.6.1 Data Collection Method: The Survey Instrument
Survey and multivariate techniques suit the positivism philosophy of research (Healy & Perry,
2000; Guba & Lincoln, 1994). This is thus the approach used in this study. There is need to
ensure content validity in research (Fitzpatrick, 1983). For that reason, the survey process and
instrument for this study is explained next (Section 5.6.2) detailing out questionnaire design
process, and the study sample. The research instrument is presented in section 5.7, and
following that, the multivariate steps for this study are explained in Section 5.8.
5.6.2 The Questionnaire Design Process and Study Sample
The questionnaire design for this study is explained in section 5.6.2.1, while the sample for
this study is explained in section 5.6.2.2.
5.6.2.1 Designing the Questionnaire
Authors (e.g., Chisnall, 2001; Churchill & Iacobucci, 2002) have offered numerous
questionnaire development steps, which researchers need to follow to maximize the quality of
the questionnaire. According to Oppenheim (2000), questionnaire design processes involve
aspects such as item wording or phrasing and the ordering of questions.

Chapter 5: Research Methodology
Jafar Ojra - 118 -
Following Churchill & Iacobucci (2002), the questionnaire design process for this study
involves a 9 step-by-step procedure as shown in Figure 5.1 below.
Step 1: Specify what information would be sought
Step 2: Determine the types of questionnaire and methods for administration
Step 4: Determine form of response
Step 3: Content of individual items
Step 5: Determine wording of each question
Step 6: Determine sequence of question
Step 7: Determine layout and physical characteristics of the question
Step 8: Re-examine steps 1-7 and revision, if necessary
Step 9: Pre-test questionnaire
Figure 5.1: Questionnaire Development Process
Figure 5.1: Questionnaire Development Process
Source: Based on Churchill and Iacobucci (2002, p.315)

Chapter 5: Research Methodology
Jafar Ojra - 119 -
5.6.2.2The Study Sample
In this section, the population and sample for this study are explained. Also, the pilot-testing
of the questionnaire and the actual survey are detailed out in this section. This section is
concluded by explaining the steps taken in this study to meet ethical standards of research
(See Section 5.6.2.2.4).
5.6.2.2.1The Population for this Study
As stated in Chapter two, the context of this study is the West Bank area of Palestine. The
population for this study included all Palestinian companies that met the specified criteria. For
the categorisation of industries, to ensure that the categorisation for this study matches the
categorisation understood by the respondents, this study used the categorisation specified by
the Palestine Stock Exchange, 20137 and also evidenced in the records of Federation of
Palestinian Chamber of Commerce, Industry & agriculture, 2013. For that reason, the
industrial sectors covered in this study included investment sector, industry sector, banking
and financial services sector, insurance sector and service sector. The total population
included 476 largest companies in the West Bank area. Each of these companies has a capital
outlay of 1,000,000 Jordanian Dinar (about $1,500,000) or more. The sector by sector
demographics are displayed in Table 5.4 below.
Table 5.4: The Population for this Study
Industry Sector Number of
Companies
%age of Population
Investment Sector 21 4.41
Industry Sector 244 51.26
Banking & Financial Services
Sector
41 8.61
Insurance Sector 22 4.62
Service Sector 148 31.09
Total Population 476 100
7 See http://www.pex.ps/marketwatch/English/SectorsMarketWatch.aspx).

Chapter 5: Research Methodology
Jafar Ojra - 120 -
The investment sector includes Real Estate. The industry sector includes pharmaceutical and
medical companies, chemical companies, paper and cardboard companies, printing and
packaging, food and beverages, tobacco and cigarette, mining and extraction companies,
engineering and construction, electrical companies, textiles, leathers and clothing, Glass and
ceramic companies. Banking and financial services sector includes banks and diversified
financial services. Insurance sector includes all insurance companies. And finally, the service
sector includes health care services, educational services, hotels and tourism, transportation,
technology and communication, media, utilities and energy, and commercial services.
From the population for this study specified above, 400 companies were sampled out for the
data collection purpose for this study. The criteria for selecting these large companies
included the following:
1. The company is listed in the Federation of Palestinian Chamber of Commerce,
Industry & Agriculture register,
2. The company must have at least 50 employees. Palestinian Central Bureau of Statistics
report (2007) classified companies with 50 or more employees to be large companies,
and
3. The company must meet the capital outlay standard of $1.5 million or more as defined
by in the Federation of Palestinian Chamber of Commerce, Industry & Agriculture
disclosure.

Chapter 5: Research Methodology
Jafar Ojra - 121 -
5.6.2.2.2 Pilot-Testing of Questionnaire
The questionnaire for this study, which was generated as explained in section 5.7 (The
Research Instrument) was pilot-tested to ensure that wordings, language and general content
are suitable (Pressey, 2000; Van der Stede et al., 2007) for the study of strategic management
accounting practices in the Palestinian context. Pilot-testing is important in management
accounting research to improve the reliability and validity of individual questions (Van der
Stede et al., 2007; Tuan Mat, 2010). Furthermore, since the variables for measuring the
conceptualised framework (See Section 5.7) were adopted from past studies in developed
countries, pilot-testing the instrument for this study was also an important approach towards
checking the applicability of these variables in the Palestinian environment.
Before the pilot-testing took place, the questionnaire was translated from English to Arabic
and later from Arabic to English through two independent scholars who are based in Palestine
and have obtained their PhDs in accounting from western countries where the first language is
English. This translation process was necessary as most of the sampled companies are
indigenous Palestinian companies and the mother tongue is Arabic. The process of the
translation is shown below:
1. First, the original English version of the questionnaire was translated to Arabic by the
researcher,
2. Secondly, the researcher (a) sent the questionnaire (English version) to a scholar to
translate to Arabic, and (b) sent the questionnaire (Arabic version) to another scholar
to translate to English.
3. Finally, differences in translations were assessed and consensus was reached to make a
preliminary Arabic version of the questionnaire.

Chapter 5: Research Methodology
Jafar Ojra - 122 -
In this study, pilot-testing followed the recommendation of Dillman (1978) and participants in
the pilot-testing included colleagues and prospective respondents. Thus, academic piloting
and field work piloting were used in this study.
For the Academic Piloting, the questionnaire was piloted in both languages (English and
Arabic) with prominent accounting scholars. The participants in this pilot-testing were six
accounting scholars who are located in Britain, Australia and Slovenia who have published on
the SMA context, and two accounting scholars who are located in the West Bank in Palestine
and have also published on the management accounting context.
These participants were asked to review the questionnaire in terms of structure, format, length
and content clarity and appropriateness. The pilot resulted in minor amendments being made
to the draft. The areas of comments included the scales of the questions (the need to ensure
uniformity), proofreading the draft, adding a ‘Glossary’…etc.
For the Field Work Piloting, out of the 400 companies, 26 were chosen for the pilot study.
These companies were randomly selected. For four reasons, the Chief Accountant or Chief
Controller or Chief Financial Officer was identified as the appropriate respondents for this
fieldwork piloting and the subsequent survey:
1- The personnel in this capacity are employed at a high managerial level and have got a
wide range of experience at that position,
2- A phone call made with 26 companies to identify the best person to fill the survey after
explaining the aim of the research over the phone identified these contact persons as
appropriate for the pilot-testing and survey,
3- Organisations in less developed countries (LDCs) may not have a separate management
accounting unit (Smith et al., 2008), and

Chapter 5: Research Methodology
Jafar Ojra - 123 -
4- Finally, those respondents are identified by previous studies which have explored the
contingency perspective of SMA (e.g., Cadez & Gulding 2007; Cadez & Gulding 2008;
Cinquini & Tenucci 2010).
The respondents were asked to complete the questionnaire in Arabic and provide comments
relating to appropriateness of questions, comprehension, wording, time to complete it and
content. This is a very important step to ensure that some SMA techniques are applied.
A total of 26 questionnaires were sent for piloting covering all sectors. 14 questionnaires were
sent to companies under Industry sector, 4 to Banking and Financial services sector, 4 to
Service sector, 3 to Insurance sector and 1 to Investment sector. Table 5.5 below elaborates
further the fieldwork pilot-testing demographics. A total of 12 questionnaires were returned
representing a 46.15% response rate. None of the questionnaires collected from the pilot
testing were included in the final sample due to changes in the structure and wording in some
items of the questionnaire.
Overall, the comments from the respondents concerned mainly contents for measuring the
variables. After the pilot testing, the researcher conducted interviews with three respondents,
for more clarifications and also to understand clearly if all the concepts in the survey are
understood by them. All their comments were taken into account and consequently the
questionnaire was revised.
Table 5.5:The Pilot-Testing Demographics
Sectors Number of Firms %age of pilot-testing sample
Investment sector 1 3.85
Industry sector 14 53.85
Banking and Financial
service sector
4 15.38
Insurance sector 3 11.53
Service sector 4 15.38
Total 26 100

Chapter 5: Research Methodology
Jafar Ojra - 124 -
After the pilot-testing, the questionnaire was revised to reflect the input from the academic
and fieldwork pilot studies. The final version of the questionnaire [see Appendix 1 for the
English version and Appendix 2 for the Arabic version] was then used for the main study.
5.6.2.2.3 The Actual Survey: The Sample and Respondents
The population for this study, as shown in Table 5.4 above includes a mix of industries. For a
number of reasons management accounting change is likely to occur in these industries
because of dynamism in the modern-day marketplace, for example operational environmental
changes like changes in production cost structure (Innes & Mitchell, 1990) and new high
technology techniques (Kaplan, 1989). Consequently, organisations would embrace
innovative management accounting techniques (Smith et al., 2008; Tuan Mat, 2010). While
most prior studies have explored the manufacturing industry (e.g., Abdel-Kader & Luther,
2008; Baines & Langfield-Smith, 2003; Gerdin, 2005; Laitinen, 2006; Tuan Mat, 2010), this
multi industry study, in addition to offering LDC insights, might offer previously unavailable
multi-industry insights that would enhance knowledge.
According to Baines & Langfield-Smith (2003, p.684), managers’ perceptions are considered
appropriate for a study of this nature, because:
1. It is managers’ perception of the environment which are of interest, as it is these
perceptions that influence decisions with respect to strategic choice and changes in
other organisational and management accounting variables,
2. It is difficult to objectively measure variables such as the extent of change in the
environment, or change in strategic emphasis, and
3. It is understood that individuals have sufficient understanding of their decision process
and can give relatively reliable information.

Chapter 5: Research Methodology
Jafar Ojra - 125 -
Taking these backgrounds into consideration, the Chief Accountant or Chief Controller or
Chief Financial Officer of the sampled organisations were chosen as respondents for this
study, as organisations in less developed countries (LDCs) may not have a separate
management accounting unit (Smith et al., 2008).
Data were collected using a mailed questionnaire survey as well as a drop and collect method
of a questionnaire survey. The sample for this study included 400 largest Palestinian
companies drawn from the Federation of Palestinian Chamber of Commerce, Industry &
Agriculture disclosure that met the criteria defined in Section 5.6.2.2.1. Questionnaires were
distributed to the sampled companies in the proportion displayed in Table 5.6 below.
Table 5.6: The Sample for this Survey
Sector Number of Firms %age of Survey Sample
Investment sector 17 4.25
Industry sector 207 51.75
Banking and Financial service
sector
41 10.25
Insurance sector 22 5.5
Service sector 113 28.25
Total 400 100
To enhance the response rate for this study, several steps were taken:
1. Telephone calls or letter of study introduction was made/ sent to the prospective
participating companies and responding personnel, and also to obtain the relevant
email addresses,
2. The questionnaire was emailed or hand delivered along with a cover letter, explaining
the purpose of the study,
3. The respondents were assured in the questionnaire that all information about their
individual companies would be kept highly confidential,

Chapter 5: Research Methodology
Jafar Ojra - 126 -
4. Respondents were promised that a summary of the finding from the study would be
provided to their individual companies, if they wished, and
5. Reminder letters or telephone calls were sent (or made) to the companies.
After three weeks of sending the reminder letter and/or making telephone calls, the researcher
personally visited the companies reminding them of the importance of their participation in
the study.
In this study, the data collection process lasted four months (July – November, 2012). A total
of 88 questionnaires were returned after four weeks of sending the questionnaires. A reminder
letter was sent by email to the companies that had not yet completed and returned the
questionnaire. This led to 29 additional responses after about four weeks of sending the
reminder letters. To further enhance the response rate, the researcher personally visited a
number of companies to remind them of the importance of their participation to the research.
Through this visit and collect approach, which lasted over two months, additional 118
questionnaires were collected. Overall, 235 questionnaires were returned from respondents.
To determine which responses are suitable for the purpose of further analysis for this study,
two steps were taken. First, missing data analysis was conducted, leading to 9 questionnaires
with incomplete information being excluded. Secondly, since it was not possible to confirm
through desk research which companies satisfied the criteria 2 in Section 5.6.2.2.1, these data
were collected through the questionnaire. Consequently, the emergent data were analysed and
51 questionnaires were excluded as the companies had less than 50 employees.
Thus, the total number of questionnaires suitable for analysis in this study is 175, yielding a
response rate of 43.75%. This is a good response rate compared to the evidence in past studies,
for example, the response rate(s) of 12.3% in Jusoh (2010), 25.8% in Waweru (2008), 30.54%
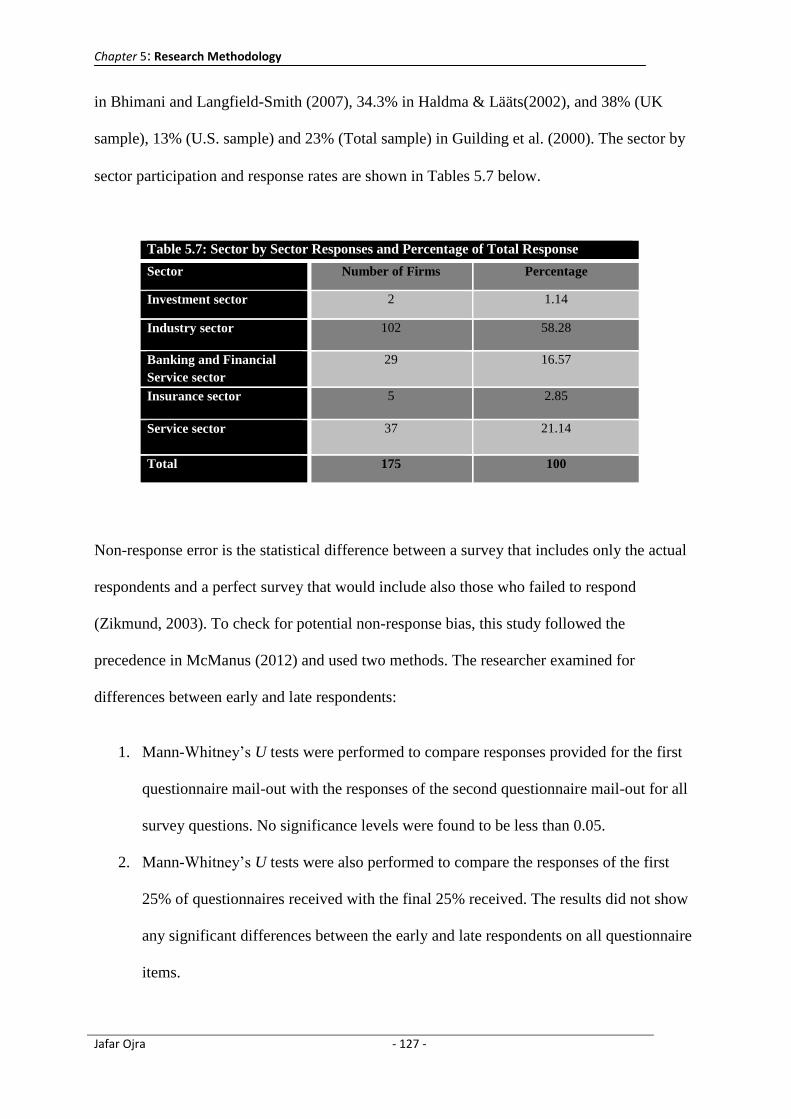
Chapter 5: Research Methodology
Jafar Ojra - 127 -
in Bhimani and Langfield-Smith (2007), 34.3% in Haldma & Lääts(2002), and 38% (UK
sample), 13% (U.S. sample) and 23% (Total sample) in Guilding et al. (2000). The sector by
sector participation and response rates are shown in Tables 5.7 below.
Table 5.7: Sector by Sector Responses and Percentage of Total Response
Sector Number of Firms Percentage
Investment sector 2 1.14
Industry sector 102 58.28
Banking and Financial
Service sector
29 16.57
Insurance sector 5 2.85
Service sector 37 21.14
Total 175 100
Non-response error is the statistical difference between a survey that includes only the actual
respondents and a perfect survey that would include also those who failed to respond
(Zikmund, 2003). To check for potential non-response bias, this study followed the
precedence in McManus (2012) and used two methods. The researcher examined for
differences between early and late respondents:
1. Mann-Whitney’s U tests were performed to compare responses provided for the first
questionnaire mail-out with the responses of the second questionnaire mail-out for all
survey questions. No significance levels were found to be less than 0.05.
2. Mann-Whitney’s U tests were also performed to compare the responses of the first
25% of questionnaires received with the final 25% received. The results did not show
any significant differences between the early and late respondents on all questionnaire
items.

Chapter 5: Research Methodology
Jafar Ojra - 128 -
5.6.2.2.4 Ethical Issues
According to Cooper & Schindler (2001, p.112), ethics are norms or standards of behaviour
that guide moral choices about behaviour and relationship with others. The ethics of research
ensures that researchers conduct their researches in a way that no one suffers adverse
consequences from research activities (Tuan Mat, 2010). According to ethical requirements,
the privacy of participants must not be invaded (Nardi, 2006). To conform to ethical
requirements, the following steps were taken in this study:
1. A letter was written, or telephone calls made to the sampled companies to explain the
research and request their kindness to participate in the study,
2. A formal permission was obtained from the participating companies before the
questionnaires were sent to them,
3. A cover letter was sent along with the questionnaire to the respondents explaining the
purpose of the research and instructions of how to respond,
4. In the cover letter, respondents were assured that any information provided about their
companies would be kept strictly confidential, and
5. The questionnaire and cover letter used in this study were approved by the
University’s Research Ethics Committee.

Chapter 5: Research Methodology
Jafar Ojra - 129 -
5.7 The Research Instrument
Following the pattern shown in majority of previous studies on the contingency perspective of
strategic management accounting practices in companies (See Table 5.3), questionnaire
(structured) is used for this study. To generate the questionnaire for this study (See Appendix
1), the research instrument was collated from past studies (to enhance the reliability and
validity of the measures (e.g., Askarany & Smith, 2008; Baines & Langfield-Smith, 2003,
Hyvönen, 2007). Additional to the demographic information (See Appendix 1), the other
sections in the questionnaire covered all the 7 main construct blocks as conceptualised in the
framework, namely:
1. Perceived Environmental Uncertainty (PEU),
2. Organisational Strategy (OS),
3. Organisational Size (OSZ),
4. Organisational Technology (OT),
5. Organisational Structure (OSTR),
6. Organisational Performance (OP), and
7. Strategic Management Accounting Techniques Usage (SMAU).
When using Likert scale, it is important to ensure the inclusion of at least 5 response
categories (Allen & Seaman, 2007). Further relevant literature suggests that, as general rule, it
is best to use as wide a scale as possible (Gibbons, 1993). Combining these logics, this study
follows past studies (e.g., Cravens & Guilding, 2001; Guilding and McManus, 2002; Cadez &
Guilding, 2008) and used a 7-point Likert scale to measure all variables. The research
instrument for this study is explained next (See Sections 5.7.1 to 5.7.7), explaining the
variables for measuring each of the above outlined constructs and their sources, and
summarised in Table 5.8.
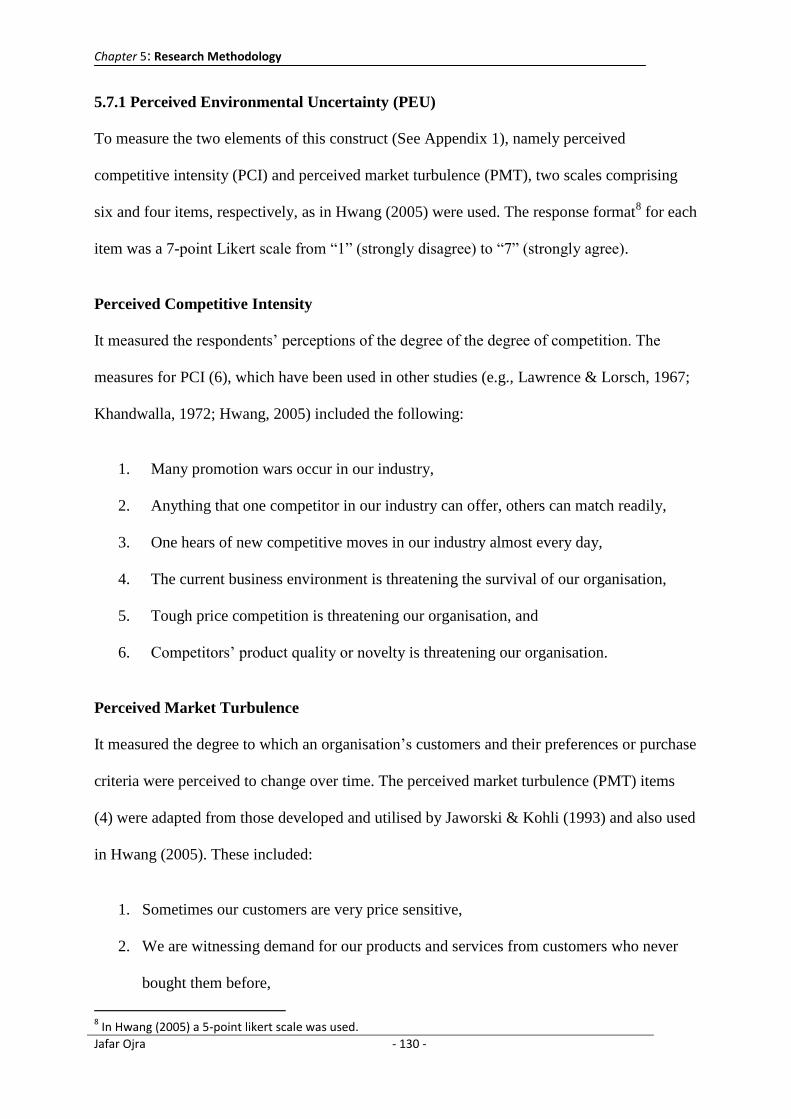
Chapter 5: Research Methodology
Jafar Ojra - 130 -
5.7.1 Perceived Environmental Uncertainty (PEU)
To measure the two elements of this construct (See Appendix 1), namely perceived
competitive intensity (PCI) and perceived market turbulence (PMT), two scales comprising
six and four items, respectively, as in Hwang (2005) were used. The response format8 for each
item was a 7-point Likert scale from “1” (strongly disagree) to “7” (strongly agree).
Perceived Competitive Intensity
It measured the respondents’ perceptions of the degree of the degree of competition. The
measures for PCI (6), which have been used in other studies (e.g., Lawrence & Lorsch, 1967;
Khandwalla, 1972; Hwang, 2005) included the following:
1. Many promotion wars occur in our industry,
2. Anything that one competitor in our industry can offer, others can match readily,
3. One hears of new competitive moves in our industry almost every day,
4. The current business environment is threatening the survival of our organisation,
5. Tough price competition is threatening our organisation, and
6. Competitors’ product quality or novelty is threatening our organisation.
Perceived Market Turbulence
It measured the degree to which an organisation’s customers and their preferences or purchase
criteria were perceived to change over time. The perceived market turbulence (PMT) items
(4) were adapted from those developed and utilised by Jaworski & Kohli (1993) and also used
in Hwang (2005). These included:
1. Sometimes our customers are very price sensitive,
2. We are witnessing demand for our products and services from customers who never
bought them before,
8 In Hwang (2005) a 5-point likert scale was used.

Chapter 5: Research Methodology
Jafar Ojra - 131 -
3. New customers tend to have product-related needs that are different from those of our
existing customers, and
4. Our customers tend to look for new products all the time.
5.7.2 Organisational/Business Strategy
This construct is designed to capture the extent to which the explored companies are
prospector or defender in their strategic orientation. To measure organisational strategy, this
study used the measure developed by Shortell & Zajac (1990) and also used by Cadez &
Guilding (2008). Other studies that also used these measures include Cinquini & Tenucci
(2010) and Hwang (2005).
Drawing from these past studies, the instrument for this study assesses organisation’s overall
strategic orientation on a seven-point scale. Respondents were asked to read the
characteristics below and assess which one describes their organisations best. Then place their
organisation on the scale provided by circling one of the 7 numbers, whereby a (1) is a perfect
representation of organisation A (Defender strategy), and a (7) represents organisation B
(Prospector strategy).
1. Stable/diverse products and services,
2. Constant/Dynamic competition,
3. Ignore/Respond to changes in market needs, and
4. Focus on efficiency or Cost control/or not.
5.7.3 Organisational Size
This construct measures the extent to which the size of an organisation shapes its strategic
management accounting practices. Strategic management accounting perspectives (e.g.,
Cadez & Guilding,) uses total revenue of the company, while marketing perspective (e.g.,

Chapter 5: Research Methodology
Jafar Ojra - 132 -
Kahn, 2001; Opute, 2009) uses number of employees of the company, to reflect company
size. This present study used total revenue of company to measure organisational size.
In the questionnaire for this study, respondents were not asked to score this item on a scale of
1 to 7. Rather, information about this item was collected under the section concerning the
demographics of the explored companies. Respondents were asked open ended question,
“What is the total revenue of your organisation for the last financial year (US Dollar)?”
To enable appropriate analyses, the responses from the participants were structured in a 7-
point scale in the dataset.
5.7.4 Organisational Technology
Organisational technology describes the technological environment of explored organisations
As Appendix 1 shows, organisational technology is measured using 4-items outlined below,
which were adapted based on the insights gained from past studies (e.g., Verdu et al., 2012;
McChlery et al., 2005; Dik, 2011). A 7-point Likert scale, like in Verdu et al (2012)9, was
used in this study, and respondents were asked to record their perceived understanding of the
level of technology in their organisations. These measures were applied on a scale range of
‘‘1” (not at all) to ‘‘7” (to a great extent):
1. Technology is a core element of the operating system of this organisation,
2. Our production/services techniques are technology based,
3. The accounting information system is computer based, and
4. We invest in software packages to aid our accounting and other operational system.
5.7.5 Organisational Structure
Organisational structure is conceptualised in this study as both exogenous and endogenous
factor and is composed of two elements. For Organisational Structure, two constructs
9 In Verdu et al. (2012), (1= totally disagree, 7 = totally agree) was used.

Chapter 5: Research Methodology
Jafar Ojra - 133 -
(formalisation and decentralisation) are measured (See Appendix 1). These two organisational
structure dimensions have been most commonly examined in past researches (Hwang, 2005).
The Formalisation construct is measured with a 3-item instrument (Hwang, 200510
). These
items have also been used in previous studies (Aiken & Hage, 1968; Ferrell & Skinner, 1988;
Khandwalla, 1976) though in different combinations. Respondents would be asked to indicate
on a scale of “1” (Strongly Disagree) to “7” (Strongly Agree) the extent to which the below
features describe their organisations:
1. Employees in our organisation are allowed to make their own decisions without
checking with anybody else,
2. My usual experience with our organisation involves doing things “by the rule book”,
and
3. Many activities in our organisation are not covered by formal procedures.
To measure Decentralisation, this study followed Hwang (2005)11
and used three items. These
items have also been used in previous studies (e.g., Pugh & Hickson, 1976; Khandwalla,
1974; Song & Thieme, 2006; Opute, 2009). On a scale of “1” (Strongly Disagree) to “7”
(Strongly Agree), respondents were asked to indicate the extent to which the below features
describe their organisations:
1. Even small matters in our organisation must be referred to someone higher up for a
final answer,
2. Any major decisions that employees make must have the approval of top managers,
and
3. Employees who want to make their own decisions would be quickly discouraged.
10
In Hwang 2005, a scale of “1” (Strongly Disagree) to “5” (Strongly Agree) was used. 11
The information in 2 above applies here too.

Chapter 5: Research Methodology
Jafar Ojra - 134 -
5.7.6 Organisational Performance
Organisational performance, the ultimate endogenous construct in the explored model, is a
two element construct that includes financial performance and non-financial performance, as
a dependent construct. To measure the 7-dimensions of performance (See Appendix 1), this
study followed Cadez & Guilding (2008) and respondents were asked to indicate their
company’s performance relative to their competitors on a scale ranging from ‘‘1” (below
average) to ‘‘7” (above average). In this study, the measures of organisational performance,
which have been used in previous studies (e.g., Woodridge & Floyd, 1990; Cadez & Guilding,
2007, 2008; Hoque & James, 2000; Guilding & McManus, 2002; Hwang, 2005) include:
Financial Measures:
1. Return on investment,
2. Sales margin,
3. Capacity utilisation,
4. Market share
Non-Financial Measures:
5. Customer satisfaction,
6. Product/service quality,
7. Development of new products/services, and
5.7.7 Strategic Management Accounting Techniques Usage (SMAU)
Strategic Management Accounting Techniques Usage is conceptualised as both exogenous
and endogenous construct in the explored model. Following relevant literature (e.g., Cadez &
Guilding, 2008; Cinquini & Tennucci, Guilding et al., 2000) five core elements of Strategic
Management Accounting Techniques are explored in my study, namely ‘Costing’, ‘Planning,
Control, and Performance Measurement’, Strategic Decision Making’, Competitor

Chapter 5: Research Methodology
Jafar Ojra - 135 -
Accounting’, and ‘Customer Accounting’. In addition to the aforementioned studies, these
elements have also been considered in several other studies as evidenced in Table 5.7.
To measure the 5-categories (See Appendix 1), this study follows past studies (Guilding,
1999; Cinquini & Tenucci, 2010; Guilding et al., 2000; Cravens & Guilding, 2001; Cadez &
Guilding, 2007, 2008) and uses the following question: “To what extent does your
organisation use the following accounting techniques?” for each item of the techniques. To
ascertain the intensity of use of the SMA techniques, this study follows past studies (Guilding
et al., 2000; Cravens & Guilding, 2001; Cadez & Guilding, 2007, 2008) and uses Likert scale
ranging from 1 (“not at all”) to 7 (“to a great extent”).
The measures used for each of the categories are outlined below (the respective sources are
shown in Table 5.7):
1. Costing:
a. Attribute costing
b. Life-cycle costing
c. Quality costing
d. Target costing
e. Value-chain costing
2. Planning, Control, and Performance Measurement:
a. Benchmarking
b. Integrated performance measurement (Balanced Scorecard)
3. Strategic Decision Making:
a. Strategic costing (strategic cost management)
b. Strategic pricing
c. Brand valuation

Chapter 5: Research Methodology
Jafar Ojra - 136 -
4. Competitor Accounting:
a. Competitor cost assessment
b. Competitive position monitoring
c. Competitor performance appraisal
5. Customer Accounting:
a. Customer profitability analysis
b. Lifetime customer profitability analysis
c. Valuation of customers as assets

Chapter 5: Research Methodology
Jafar Ojra - 137 -
Table 5.8: The Variables for measuring the Framework, and their sources
Construct
Nr.
Variables to Explore Source of item
1
Organisational Technology
Past studies that explored this variable (e.g., (Kattan
et al, 2007; Dik, 2011; Hwang, 2005; Hyvönen,
2008).
The measures for this study were adapted from
Verdu et al. (2012)
2
SMA Techniques *
Costing
1. Attribute costing
2. Life-cycle costing
3. Quality costing
4. Target costing
5. Value-chain costing
Planning, control and performance measurement
1. Benchmarking
2. Integrated performance measurement
Strategic decision making
1. Strategic costing (strategic cost management)
2. Strategic pricing
3. Brand valuation
Competitor accounting
1. Competitor cost assessment
2. Competitive position monitoring
3. Competitor performance appraisal
Customer accounting
1. Customer profitability analysis
2. Lifetime customer profitability analysis
3. Valuation of customers as assets
(Bromwich, 1990; Roslender & Hart, 2003)
(Czyzewski & Hull, 1991; Dunk, 2004; Shields &
Young, 1991; Cadez & Guilding, 2008; Cinquini &
Tenucci, 2010)
(Belohlav, 1993; Heagy, 1991; Cinquini & Tenucci,
2010)
(Cooper & Slagmulder, 1999; Monden & Hamada,
1991; Cadez & Guilding, 2008; Cinquini &
Tenucci, 2010)
(Dekker, 2003; Hergert & Morris, 1989; Shank &
Govindarajan, 1992; Cadez & Guilding, 2008)
(Elnathan et al.; 1996; Brownlie, 1999)
(Chenhall, 2005; Ittner et al., 2003; Kaplan &
Norton, 1992; Kaplan & Norton, 1996; Libby et al.,
2004; Cadez & Guilding, 2008)
(Shank, 1996; Shank & Govindarajan, 1988, 1993)
(Rickwood et al., 1990; Simmonds, 1982)
(Cravens & Guilding, 1999; Guilding, 1992)
(Bromwich, 1990; Jones, 1988; Simmonds, 1981;
Ward, 1992; Cinquini & Tenucci, 2010)
(Rangone, 1997; Simmonds, 1986; Guilding, 1999)
(Moon & Bates, 1993; Cinquini & Tenucci, 2010)
(Bellis- Jones, 1989; Ward, 1992; Zeithaml, 2000;
Guilding & McManus, 2002)
(Foster & Gupta, 1994; Jacob, 1994)
(Foster, Gupta, & Sjoblom, 1996; Slater
& Narver, 1994; Zeithaml, 2000; Guilding &
McManus, 2002)
3
Organisational Performance
The performance dimensions to be explored in this
study include:
These measures have been used in past studies (e.g.,
Woodridge & Floyd, 1990; Cadez & Guilding,
2007, 2008; Hoque & James, 2000; Guilding

Chapter 5: Research Methodology
Jafar Ojra - 138 -
(1) Return on investment,
(2) Sales margin,
(3) Capacity utilisation,
(4) Market share
(5) Customer satisfaction,
(6) Product/service quality,
(7) Development of new products/services
&McManus, 2002; Hwang, 2005)
Woodridge & Floyd (1990) and Hoque & James
(2000) only used the first 5-measures
4
Perceived Environmental Uncertainty
Perceived competitive intensity
Perceived market turbulence
The measures for this study have been used in
previous studies as shown below.
(Bellis-Jones, 1989; Foster & Gupta, 1994;
Guilding & McManus, 2002; Lawrence & Lorsch,
1967; Khanwalla, 1972)
(Jaworski & Kohli, 1993; Hwang , 2005)
5
Organisational Structure
Formalisation
Decentralisation
(Hwang, 2005; Aiken & Hage, 1968; Ferrell &
Skinner, 1988; Khandwalla, 1976); Opute, 2009)
(Hwang, 2005; Dik, 2011; Aiken & Hage, 1968;
Ferrell & Skinner, 1988; Opute, 2009).
6
Organisational/Business Strategy:
Prospector
Defender
(Cinquini & Tenucci, 2010; Cadez & Guilding,
2008; Hwang, 2005; Shortell & Zajac, 1990)
(Cinquini & Tenucci, 2010; Cadez & Guilding,
2008; Hwang, 2005; Shortell & Zajac, 1990)
7
Organisational Size
Total Revenue of the company
(Cadez & Guilding, 2008; Hwang, 2005; Dik, 2011)
SMA Technique * = All variables listed in the Table were also used in Cadez & Guilding (2008)

Chapter 5: Research Methodology
Jafar Ojra - 139 -
5.8 The Multivariate Steps for this Study
In explaining the multivariate steps for this study, two steps are taken. First, a review of
relevant methodological literature on ‘Reliability’ and ‘Validity’ of a Quantitative Research is
undertaken, and concluded with an explanation of how these core methodological interest
have been ensured in this study. While that is done in section 5.8.1, section 5.8.2 will present
the theoretical backgrounds concerning multivariate steps, with the statistical results presented
in Chapter 6.
5.8.1 Reliability and Validity in a Quantitative Research
“Empirical research relies on scientific procedures and uses a systematic approach to find
answers to research problems” (Khalid et al., 2012, p.15). Reliability and validity are two core
concerns in ensuring appropriate scientific procedures for a research (Hwang, 2005; Tuan
Mat, 2010; Dik, 2011).
Reliability refers to the consistency of measurement, while validity reflects the accuracy of
the measures (Khalid et al., 2012). Reliability is the degree to which a measure is free from
random error and reflects the internal consistency of a measurement device (Khalid et al.,
2012; Zikmund, 2003). Further literature: reliability refers to the accuracy and precision of the
measurement procedure (Thorndike et al., 1991) and can be expressed in terms of stability,
equivalence and internal consistency (Cooper & Schindler, 2003). According to literature
(Khalid et al., 2012) the indicators of reliability of research measures include those shown in
Table 5.9 below

Chapter 5: Research Methodology
Jafar Ojra - 140 -
Table 5.9: The indicators of Reliability of Research Measures
S/Nr. Indicators Explanation
1 Stability The extent to which the results obtained using the measurement
instrument can be reproduced. Stability is assessed by administering
the same measurement device to the same respondents at two separate
points in time (Zikmund, 2000). There are however problems
associated with this method (Zikmund, 2000)
2 Equivalence This shows the degree to which alternative forms of the same
measures are used to produce the same or similar results (Cooper &
Schindler, 2003)
3 Internal
Consistency
This is the extent to which items in a measurement device are
homogeneous and reflect the same underlying construct (Cooper &
Schindler, 2003). The most commonly used method to assess internal
consistency is Cronbach’s Alpha (Cronbach, 1951). If one does not
report Cronbach’s Alpha, the reliability of the items is considered to be
low (Khalid, 2012). The higher the Cronbach’s Alpha score (usually
between 0 and 1), the more reliable is the generated scale (Delafrooz et
al., 2009). According to Nunnaly (1978), Cronbach’s alpha score of 0.7
or above is considered to be acceptable reliability coefficient.
Source: The contents were collated from Khalid et al. (2012, p.22)
Similarly, a research must ensure validity of its approach (Khalid et al., 2012; Saunders et al.,
2009). “Validity is the extent to which a score truthfully represents a concept” (Khalid et al.,
2012, p.22). Other researchers (e.g., Cooper & Emory, 1994; Zikmund, 2000) underline that
validity reflects the accuracy of measurement device and represents the ability of a scale to
measure what it is intended to measure. Validity has two types, namely external and internal
validity (Saunders et al., 2009). External validity is about generalisation and internal validity
ensures that a researcher’s research design follows applicable principles.
The core indicators of validity of research (Khalid et al., 2012, p.22, 23; Neuman, 2005) are
as shown in Table 5.10 below.

Chapter 5: Research Methodology
Jafar Ojra - 141 -
Table 5.10: The Indicators of Validity of Research Measures
S/Nr. Indicators Explanation
1 Face validity This is the extent to which a measure reflects the content of the
concept in the question. Ensuring face validity is highly critical if
an instrument is being developed for the first time. Face validity
can be ensured by obtaining subjective judgements by the experts
of the concerned field (Bryman & Bell, 2003)
2 Content validity Content validity is closely related to face validity. The focus in
content validity is that a measure should include adequate and
representative set of items to cover a concept. This can also be
ensured by experts agreement (Sekaran, 2003)
3 Construct validity This is the degree to which a measure/scale confirms a network
of related hypotheses generated from theory based on the
concepts (Zikmund, 2000). There are two types of construct
validity, namely convergent validity and discriminant validity.
Convergent validity: This is confirmed when two or more
variables measuring the same construct highly correlate (Straub
et al, 2004)
Discriminant validity: A device has discriminant validity if by
using measures for researching different constructs results in
relatively low inter correlations (Cooper & Schindler, 2003)
Source: The contents were collated from Khalid et al. (2012, p.22Table
In this study, reliability and validity were ensured through a number of steps (See Table 5.11).
Reliability was assessed by checking the internal consistency of the measurement device. To
do this, the Cronbach’s alpha values were estimated (See Chapter 6). Also, the sample means
and standard deviation values for each measurement item were estimated.
For validity, Exploratory Factor Analysis (EFA) was conducted to check the connectedness
between the items for measurement and confirm the factors for this study, towards
appropriately gauging the association between the various factors as conceptualised in the
framework (See Figure 4.1). Further details to the reliability and validity steps taken in this
study are elaborated under data analysis (Section 5.8.2).
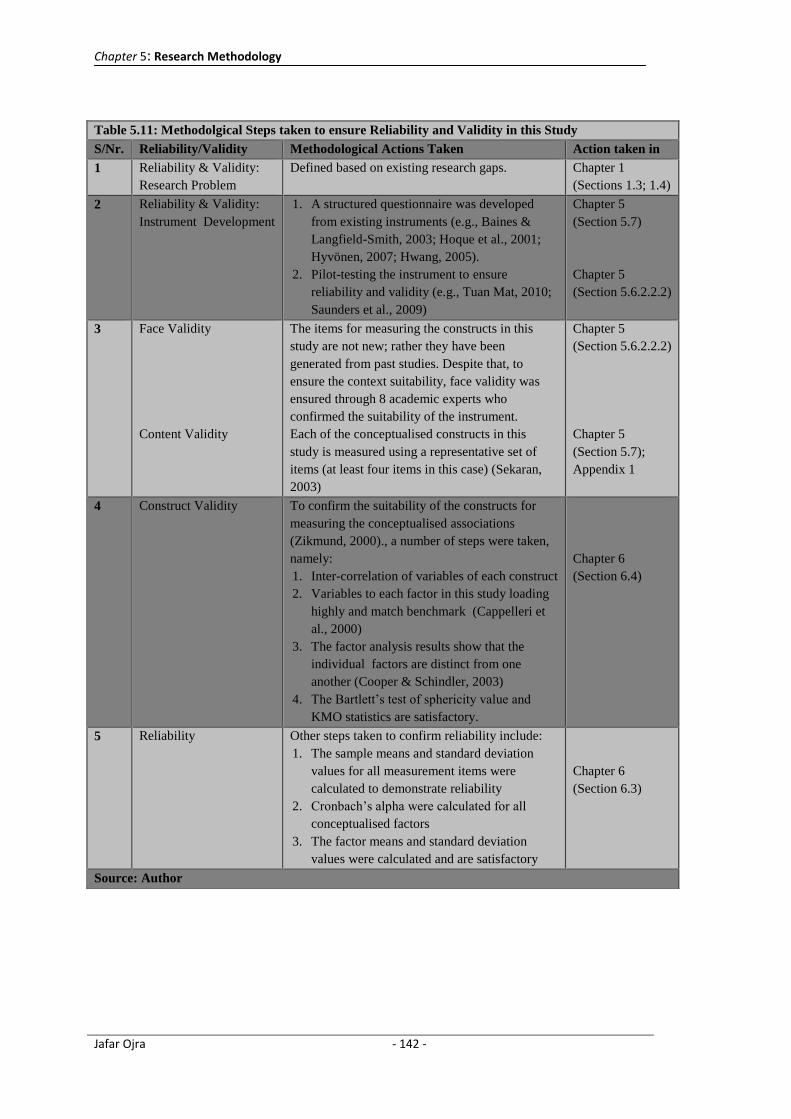
Chapter 5: Research Methodology
Jafar Ojra - 142 -
Table 5.11: Methodolgical Steps taken to ensure Reliability and Validity in this Study
S/Nr. Reliability/Validity Methodological Actions Taken Action taken in
1 Reliability & Validity:
Research Problem
Defined based on existing research gaps. Chapter 1
(Sections 1.3; 1.4)
2 Reliability & Validity:
Instrument Development
1. A structured questionnaire was developed
from existing instruments (e.g., Baines &
Langfield-Smith, 2003; Hoque et al., 2001;
Hyvönen, 2007; Hwang, 2005).
2. Pilot-testing the instrument to ensure
reliability and validity (e.g., Tuan Mat, 2010;
Saunders et al., 2009)
Chapter 5
(Section 5.7)
Chapter 5
(Section 5.6.2.2.2)
3 Face Validity
Content Validity
The items for measuring the constructs in this
study are not new; rather they have been
generated from past studies. Despite that, to
ensure the context suitability, face validity was
ensured through 8 academic experts who
confirmed the suitability of the instrument.
Each of the conceptualised constructs in this
study is measured using a representative set of
items (at least four items in this case) (Sekaran,
2003)
Chapter 5
(Section 5.6.2.2.2)
Chapter 5
(Section 5.7);
Appendix 1
4 Construct Validity To confirm the suitability of the constructs for
measuring the conceptualised associations
(Zikmund, 2000)., a number of steps were taken,
namely:
1. Inter-correlation of variables of each construct
2. Variables to each factor in this study loading
highly and match benchmark (Cappelleri et
al., 2000)
3. The factor analysis results show that the
individual factors are distinct from one
another (Cooper & Schindler, 2003)
4. The Bartlett’s test of sphericity value and
KMO statistics are satisfactory.
Chapter 6
(Section 6.4)
5 Reliability Other steps taken to confirm reliability include:
1. The sample means and standard deviation
values for all measurement items were
calculated to demonstrate reliability
2. Cronbach’s alpha were calculated for all
conceptualised factors
3. The factor means and standard deviation
values were calculated and are satisfactory
Chapter 6
(Section 6.3)
Source: Author

Chapter 5: Research Methodology
Jafar Ojra - 143 -
5.8.2 Data Analysis in this Study
Tables 5.9 and 5.10 above have pinpointed core reliability and validity criteria that a
quantitative study has to satisfy. Following that, Table 5.11 summarised the steps taken in this
study to satisfy these criteria. Chapter six presents the statistical results that confirm the
reliability and validity for this study. Prior to chapter six, the multivariate steps for this study
are explained here. In this section, the main aim is to highlight the analytical process that was
followed to ensure that emerging data are appropriately analysed towards exploring the
conceptualised relationships.
There are two main ways of analysing quantitative data, namely parametric and non-
parametric (Field, 2005). The most critical element for deciding whether parametric or non-
parametric is appropriate is based on the type of data. In this study, parametric analysis is
appropriate for three reasons:
1. The variables in this study were measured through ordinal Likert scaling (e.g., Hair et
al., 2003; Sekaran, 2003; Bryman & Cramer, 2004),
2. Most studies in business and management accounting have used parametric tests (e.g.,
regression) to analyse ordinal data (e.g., Williams & Seaman, 2001; Al-Omiri &
Drury, 2007; Brown et al., 2004; O’Connor et al., 2004), and
3. Parametric analysis was also used this study because the fundamental assumption of
normality of data distribution was satisfied (Field, 2005; Field et al., 2006; Hair et al.,
1998). The normality of data distribution is confirmed in chapter 6.
The core statistical techniques used in this study are summarised next, namely descriptive
statistics (Section 5.8.2.1), correlation (Section 5.8.2.2), factor analyses (Section 5.8.2.3) and
regression analyses (Section 5.8.2.4).

Chapter 5: Research Methodology
Jafar Ojra - 144 -
5.8.2.1 Descriptive Statistics
Following Field (2005), descriptive statistics for all variables used in this study were
calculated. Descriptive statistics such as means, frequency and percentages were estimated to
show the sample characteristics in terms of the respondents and responding companies. Also,
calculating the statistics was necessary to give insights into the sample distribution and
research variables that are formulated in the conceptualised hypotheses. Calculating the mean
values was aimed at ranking the items and factors according to their relative importance in the
decision to adopt SMA techniques. These statistics are presented in Chapter six.
In addition to the above specified descriptive statistics, standard deviation and Cronbachs
alpha estimates were also calculated (See Chapter six) to ensure reliability of the measures for
this study.
5.8.2.2 Correlation
It is important to examine statistical data to confirm correlation before conducting factor
analysis (Rietveld & Van Hout, 1993; Lee & Scott, 2004). Following that logic, construct
validity (correlation of variables) estimates were calculated before the factor analysis.
Correlation analysis is used to ascertain if, and the overall strength of a relationship that exists
between pairs of variables (Field, 2005). The Pearson’s product-moment coefficient is used in
this study. The Pearson correlation is +1 in the case of a perfect positive (increasing) linear
relationship (correlation), -1 in the case of a perfect decreasing (negative) relationship
(anticorrelation) (Dowdy & Weardin, 1983). Correlation, it must be noted, does not imply
causation; therefore, correlation cannot be used to infer a causal relationship between
variables (John, 1995). For the purpose of checking causes and effects relationships, a
regression analysis is used in this study (See Section 5.8.2.4).

Chapter 5: Research Methodology
Jafar Ojra - 145 -
To interpret correlation coefficient, one needs to examine the coefficient of correlation (r²),
which explains the variance proportion in one variable that is attributable to another (i.e., the
amount of commonality between the two variables (Field 2005).
5.8.2.3 Factor Analysis
The main applications of factor analysis techniques are (StatSoft, online12
) to:
1. Reduce the number of variables, and
2. Detect structure in the relationships between variables; that is to classify variables.
Thus, factor analysis, which was first introduced by Thurstone (1931), is applied as a data
reduction or structure detection method, so that the output can be used in further analysis
(Field, 2005). Factor analysis reduces a set of data from a group of interrelated variables into
a smaller set of factors (Field, 2005).
There are two factor analysis models (Hair et al., 1998; Hair et al., 2003): principal
component analysis (PCA) and common factor analysis (also called exploratory factor
analysis). Principal component analysis is appropriate when the aim is to reduce the original
set of variables into smaller sets of combined variables, while exploratory factor analysis
(EFA) fits the concern of identifying the underlying common dimensions in the original
variables (Hair et al., 1998; Hair et al., 2003).
In literature, there is considerable debate as to which of these approaches is more appropriate.
Some authors favour EFA (e.g., Bentler & Kano, 1990; Floyd & Widaman, 1995; Gorsuch,
1990; MacCallum & Tucker, 1991; Costello & Osborne, 2005), while others argue that PCA
is preferable (e.g., Schoenmann, 1990; Steiger, 1990; Velicer & Jackson, 1990; Guadagnoli&
Velicer, 1988). However literature also argues that, empirically both approaches produce
similar results and solutions (e.g., Hair et al., 1998; Field, 2005). Field (2005): the differences
12
http://www.statsoft.com/textbook/principal-components-factor-analysis/

Chapter 5: Research Methodology
Jafar Ojra - 146 -
between principal component analysis and exploratory factor analysis arise mainly from the
calculation and may be difficult to conceptualise to non-statisticians. Since principal
component analysis tends to be more stable and is also the most commonly used model in
business research (Hair et al., 2003), this study uses principal component analysis. This study
follows the seven steps guide for appropriate principal component analysis (See Figure 5.2) as
defined by Rietveld & Van (1993).
Using the guide defined in Figure 5.2, the data for this study were examined to identify the
latent variables (Field, 2005), identify the factors to retain by weighing the factor loadings and
scores, towards further analysis (regression analysis). While the correlation and factors
retained and the factor loadings are presented in Chapter 6, the regression results are
presented in Chapter 7.

Chapter 5: Research Methodology
Jafar Ojra - 147 -
There are two main rotation strategies used in factors analysis to ensure a clear pattern of
loadings of factors (Gorsuch, 1990; Field, 2005; Costello & Osborne, 2005), namely
orthogonal and oblique rotation. As Costello & Osborne (2005) note, “rotation cannot
improve the basic aspects of the analysis, such as the amount of variance extracted from the
items” (p.3).
Commonly used orthogonal methods include varimax, quartimax and equamax (Costello &
Osborne, 2005; Field, 2005). Orthogonal rotation will produce factors that are uncorrelated
(Costello & Osborne, 2005). On the other hand, oblique rotation method includes direct
oblimin, quartimin and promax. In the oblique method, factors are allowed to correlate.
Reliable measurements – Identify the indicators/items
Calculate a correlation matrix – Pearson Moment Correlation
YES
Examine the correlation matrix
Principal Component Analysis: unities in diagonal
of correlation matrix
How many factors to be retained?
Factor rotation? Orthogonal/oblique
Results: Factor Loadings and Factor Scores
Use in subsequent analysis, like multiple regression
Interpretation by the Researcher
Figure 5.2: The guide for Principal Component Analysis in this study. Adapted from Rietved & Van
(1993:291)

Chapter 5: Research Methodology
Jafar Ojra - 148 -
In this study, oblique rotation method is used because it “should theoretically render a more
accurate, and perhaps more reproducible, solution” (Costello & Osborne, 2005, p.3). This
reasoning is drawn from social science logic that some correlation is generally expected
among factors, “since behaviour is rarely partitioned into neatly packaged units that function
independently of one another” (Costello & Osborne, 2005, p.3). According to literature
(Fabriger et al., 1999), there is no widely preferred oblique rotation method, as all tend to
produce similar results. In this study, the direct oblimin method is used. The results for the
PCA for this study are presented in Chapter 6.
5.8.2.4 Regression Analyses
To measure the conceptualised independent and dependent relationships as pictured in Figure
4.1, regression analysis (Field, 2005) was used. In this study, since Figure 4.1 conceptualised
a situation where several independent variables predict a single dependent variable, a multiple
regression analysis is used (Field, 2005). This approach has been identified in literature as the
most widely applied technique for assessing the relationship between two or more variables
(Hair et al., 1998). This multiple regression analysis was used to explain the variance in the
dependent variable that is accounted for by each individual independent variable.
In the regression analysis, core statistical estimates that are calculated include R², Adjusted
R², and Regression F-Value. Also, the β coefficients for each independent variable, t-value
and significance levels are estimated. The regression results are presented in Chapter 7.

Chapter 5: Research Methodology
Jafar Ojra - 149 -
5.9 Conclusion to the Chapter
This chapter has explained the methodological design for exploring the conceptualised
research framework (Figure 4.1). In doing that, the philosophical positioning of this study was
first explained, and subsequently the appropriate methodological strategy was defined.
Following that, the research instrument, justification and validation were explained,
pinpointing also the industry context, population and sample for the study.
In this chapter too, the steps taken to ensure reliability and validity of research were
explained. Using insights from methodological literature, the core steps that are applicable to
this research were flagged. This included defining the core reliability measures and factor
analysis strategy and justification for this study. Also, the final section of this chapter
described the regression analysis approach that is followed to examine the conceptualised
independent – dependent relationships.
In the next chapters, the methodological backgrounds defined here would be transported and
applied to the data of this study. Chapter six therefore presents the statistical evidence that
underlines the reliability and validity of this research, while Chapter seven presents the results
of the regression analyses.

Chapter 6: Data Analyses: Descriptive Statistics, Reliability and Validity of Factors
Jafar Ojra - 150 -
6. Data Analyses: Descriptive Statistics, Reliability and Validity of Factors
6.1 Introduction to the Chapter
Table 5.11 in Chapter 5 summarised the methodological steps taken towards examining the
hypothesised relationships between the ‘exogenous’ and ‘endogenous’ variables as
conceptualised in the framework (Figure 4.1). Following Table 5.11 therefore, the data for
this study were screened to confirm, reliability and validity of measures of scales and
constructs.
In this Chapter (six) therefore, the focus is to present the statistical evidence that justifies the
reliability and validity of this research. Before doing that, the demographics of respondents
and companies that participated in the study are summarised in Table 6.1a below. Following
that, the justification of normality of data distribution is explained in Section 6.2 and the
reliability and validity statistics are presented in Sections 6.3 and 6.4 (and 6.5) respectively.
In Section 6.6, a conclusion to this Chapter is presented.
Table 6.1a: The Demographics of Respondents and Companies that participated in the Study
Participating company Sectors*
Average Inv. Sec Ind. Sec B & F Sec Ins. Sec Svcs. Sec
Total Revenue - Last year (in US$m) 5.516 15.117 14.723 8.932 12.018
Capital Outlay (in US$m) 4.956 10.435 7.110 5.312 6.652
Years in Operation (Companies) 7.5 7.3 8.5 8.6 8.5
Total Number of Employees 65 73 55 60 62
Age of Respondents 37 41 39 33 44
Total work experience (Years) 8 9.5 8.5 8 10
Work experience in present role 6.5 6.5 5.5 6. 7.25
Respondents with Bachelors Degree (%) 100% 76.56% 82.76% 60% 89.19%
Respondents with Masters Degree (%) 50% 39.21% 17.24% None 13.51%
Respondents with PhD Degree (%) None 2.94% None None 5.41%
Respondents with Prof. Qualification (%) None None 6.90% None 5.41%
* Participating Company Sectors: Inv. = Investment; Ind. = Industry; B & F = Banking and Financial Services; Ins. =
Insurance; and Svcs. = Service.

Chapter 6: Data Analyses: Descriptive Statistics, Reliability and Validity of Factors
Jafar Ojra - 151 -
Demographically, the average capital outlay of explored sectors falls between US$4.956 and
US$10.435. Comparative to other sectors, the industrial sector achieved a higher average
revenue (US$15.117) and also shows a higher average number of employees (73). The
average age of respondents for all sectors range from 33 to 44.
Additional to a higher age level, the services sectors seems to have employees with longer
years of experience, generally and on their present jobs. The academic demographics show
that majority of the employees hold a Bachelor’s degree across all sectors. Having said that,
the services sector shows a high level of employees with broad academic grounding, with
employees holding Bachelor’s degree (89.19%), Master’s degree (13.51%), PhD degree
(5.1%) and professional qualifications (5.1%).
6.2 Normality of Data Distribution
As evident in Section 6.3.1, 15 variables are used in this study. The variables
"business/organisational strategy" and "organisational size" are categorical, and are shown
only for the purpose of descriptive statistics as one variable, but when testing the hypotheses,
these variables will be dealt with as two variables.
For the purpose of generalising the findings from regression analysis, some assumptions must
be met. One of these assumptions relates to the variable type (Field et al., 2006). All variables
must be metric or categorical (two categories). In this study, all the variables are metric,
except for business/organisational strategy and organisational size which are categorical.
The most fundamental assumption in multivariate analysis is the normality of distribution
(Field, 2005; Field et al., 2006; Hair et al., 1998). To ensure the appropriateness of parametric
analysis (Field, 2005), data was examined for normality of distribution.
Normality is the degree to which the distribution of the sample data corresponds to a normal
distribution (Hair et al., 1998, p.38). This study followed the methodological logic that

Chapter 6: Data Analyses: Descriptive Statistics, Reliability and Validity of Factors
Jafar Ojra - 152 -
suggests that normality should only be checked for the dependent variable (e.g. Field et al.,
2006). According to them, not all predictors need to be normally distributed, as some of them
could be categorical (which is the case in this research with business/organisational strategy
and organisational size), where normality of distribution cannot be measured.
To check for normality of data distribution, this study followed Diamantopoulos &
Schlegelmilch (1997, p.98), and used the median and mean values in conjunction with the
frequency distribution, histogram plots and the kurtosis values. If a distribution is skewed,
comparing the mean and median values could be helpful in explaining normal distribution
(Diamantopoulos & Schlegelmilch, 1997, p.100); and the bell-shaped curve implies that the
majority of scores lie around the centre of the distribution (so the largest bars on the
histogram are all around the central value, evidence that supports normal distribution
assumption tendency (Field, 2005, p.8).
The mean values for the variables in this study (See Reliability Statistics Tables in Section
6.3.1) support a normal distribution conclusion. Also, the histogram plots, and the frequency
distribution show normal distribution evidence. The histogram plots show a bell-shaped curve.
As Hair et al. (1998, 2003) note, Skewness values within the range of –1 to +1 and Kurtosis
values within the range of –3 to +3 are acceptable. The Skewness and Kurtosis statistics
obtained for this study fall within these defined acceptable ranges, therefore the assumption
of normality distribution is justified.
6.3 Reliability Statistics of Variables
Having confirmed normality of distribution of data, the reliability statistics of the variables in
the framework were estimated. To justify the reliability of this study, Section 6.3 reports the
standard deviation, mean values, and Cronbachs alphas for the variables in the conceptualised
framework. These statistics are presented in three subsections. First, sub-section 6.3.1

Chapter 6: Data Analyses: Descriptive Statistics, Reliability and Validity of Factors
Jafar Ojra - 153 -
presents the reliability results for the dependent variables. Subsequently, the results for
independent variables in the contingency framework are presented and explained in sub-
section 6.3.2.
6.3.1 Reliability Statistics for the Dependent Variables
As shown in Figure 4.1 there are three core dependent constructs in this study, namely
‘Strategic Management Accounting Techniques Usage (SMAU), ‘Organisational Structure’
and ‘Organisational Performance’. The reliability statistics, which are summarised in Table
6.1b for the former and Table 6.2 for the latter (organisational structure and organisational
performance) are explained in Sections 6.3.1.1, 6.3.1.2 and 6.3.1.3 respectively.
6.3.1.1 Reliability Statistics for the Strategic Management Accounting Techniques
Usage (SMAU) Variables
The reliability results presented in this Section relates to Strategic Management Accounting
Techniques Usage (SMAU) constructs. As a reminder, the Strategic Management Accounting
Techniques Usage (SMAU) is a higher-order construct containing five lower-order constructs.
Therefore, higher-order and lower-order estimates were calculated to ensure the reliability for
the conceptualised constructs.
Mean values, standard deviation and cronbach’s alpha estimates were calculated to check for
reliability of the instrument for SMAU. Table 6.1b shows the results for the SMAU construct
which included sixteen (16) variables categorised into five (5) groups. From the sixteen
variables, five were used to measure SMAU-Costing, two for SMAU-Planning, Control and
Performance Measurement while three variables were used to measure SMAU-Strategic
Decision Making. Also, three variables were used to measure SMAU-Competitor Accounting
and SMAU-Customer Accounting respectively.
The higher-order construct (SMAU) shows satisfactory Cronbach alpha (α) of .77. The
Cronbach alpha for the SMAU dimensions (See Table 6.1b) were 0.90 (SMAU-Costing),

Chapter 6: Data Analyses: Descriptive Statistics, Reliability and Validity of Factors
Jafar Ojra - 154 -
0.85 (SMAU-Planning, Control and Performance Measurement), 0.85 (SMAU-Strategic
Decision Making), 0.91 (SMAU-Competitor Accounting) and 0.92 (SMAU-Customer
Accounting), values that suggest that the constructs were acceptably reliable for the purpose
of this study (Cadez & Guilding, 2008; Cinquini & Tenucci, 2010). The values for all the five
dimensions, as shown in Table 6.1b show satisfactory mean and standard deviation values
that also support the conclusion of satisfactory reliability. Therefore, the use of these five
dimensions as subsets of SMAU is legitimate.
Table 6.1b: Reliability Statistics of Strategic Management Accounting Techniques Usage (SMAU) Factors
(n=175)
Factors No. of
Items
Item
Mean
Item Std.
dev.
Factor
Mean
Cronb.
Alpha
SMAU-Costing:
Attribute Costing
Life-Cycle Costing
Quality Costing
Target Costing
Value chain Costing
5
4.177
4.360
4.726
4.891
4.469
1.578
1.482
1.440
1.448
1.405
4.556 .90
SMAU- Planning, Control&Performance Measurement
Benchmarking
Integrated Performance Measurement (Balanced
Scorecard)
2
4.657
4.291
1.596
1.554
4.474 .85
SMAU-StrategicDecisionMaking
Strategic Costing (Strategic Cost Management)
Strategic Pricing
Brand Valuation
3
4.674
4.994
4.394
1.357
1.399
1.454
4.688 .85
SMAU-CompetitorAccounting
Competitor Cost Assessment
Competitive Position Monitoring
Competitor Performance Appraisal
3
4.537
4.720
4.543
1.445
1.677
1.628
4.600 .91
SMAU-CustomerAccounting
Customer Profitability Analysis
Life Customer Profitability Analysis
Value of Customer as Assets
3
3.623
3.560
3.406
1.911
1.849
1.675
3.529 .92
SMAU Summation 5 .77

Chapter 6: Data Analyses: Descriptive Statistics, Reliability and Validity of Factors
Jafar Ojra - 155 -
6.3.1.2 Reliability Statistics for Organisational Structure
The second core dependent variable in the conceptualised framework (See Figure 4.1) is
Organisational Structure, which is composed of two elements, namely Formalisation and
Decentralisation. Satisfactory reliability results were achieved for both constructs, which
were measured by three items respectively.
Formalisation achieved a high Cronbachs alpha value of 0.91 and a factor mean of 4.627. As
evident in Table 6.2, satisfactory reliability results is supported by item mean values ranging
from 4.520 to 4.806 and item standard deviation ranging from 1.368 to 1.603. For
Decentralisation, which was measured by three items, the Cronbachs alpha was 0.78 while
the factor mean was 5.482. Satisfactory item means ranging from 5.183 to 5.954 and item
standard deviation ranging from 1.082 to 1.107 were also achieved. The Cronbachs alpha
results achieved in this study compare favourably with relevant studies (e.g. Song & Thieme,
2006; Opute, 2009; Hwang, 2005).
6.3.1.3 Reliability Statistics for Organisational Performance
Organisational Performance is the third dependent variable in the conceptualised
framework. Two dimensions are conceptualised in this study, namely Organisational
Performance Financial and Organisational Performance Non-Financial. The reliability
statistics for this construct are shown in Table 6.2. As evident in that Table, satisfactory
reliability results were achieved for both financial and non-financial dimensions of
Organisational Performance.
The Cronbach statistics for Organisational Performance (Financial) was 0.87 and the items
means values range from 4.537 to 4.914. Ranging from 1.087 to 1.272, the standard deviation
values for the measurement items are also satisfactory. The mean value for this factor, at
4.714, also confirms the reliability of this factor.

Chapter 6: Data Analyses: Descriptive Statistics, Reliability and Validity of Factors
Jafar Ojra - 156 -
The reliability results for the Non-financial element of Organisational Performance are also
satisfactory at Cronbachs alpha value of 0.92 and factor mean of 5.202. These statistics are
supported by item means ranging from 5.011 to 5.274 and standard deviation values for items
ranging from 1.472 to 1.516. Overall, the internal consistency statistics for the Organisational
Performance construct are very satisfactory when compared to other studies in this field (e.g.
Cadez & Guilding, 2007, 2008; Guilding & McManus, 2002; Hwang, 2005).
6.3.2 Reliability Statistics for the Other Contingency (Independent) Variables
The framework for this study summarised in Figure 4.1, shows that there are six (6)
independent constructs in this study. These include Perceived Environmental Uncertainty
(PEU), Business/Organisational Strategy, Organisational Size, and Organisational
Technology. Also, Strategic Management Accounting Techniques Usage (SMAU), and
Organisational Structure, which were already mentioned as dependent constructs, are also
independent constructs. In this Section therefore, the reliability statistics are presented in the
following order: Dependent cum Independent Variables (Section 6.3.2.1), Perceived
Environmental Uncertainty (Section 6.3.2.2), Business/Organisational Strategy (Section
6.3.2.3), Organisational Size (Section 6.3.2.4) and Organisational Technology (Section
6.3.2.5).
6.3.2.1 Reliability Statistics for the Dependent cum Independent Variables
In this study, SMAU and Organisational Structure are not only dependent variables to some
variables, but are also independent variables to some other variables. The reliability statistics
for these two groups of variables were summarised in Tables 6.1b and 6.2 respectively and
also explained in Sections 6.3.1.1 and 6.3.1.2, and would therefore not be repeated here.

Chapter 6: Data Analyses: Descriptive Statistics, Reliability and Validity of Factors
Jafar Ojra - 157 -
6.3.2.2 Reliability Statistics for Perceived Environmental Uncertainty (PEU)
In the conceptualisation of this study, Perceived Environmental Uncertainty (PEU) is a two (2)
element construct that includes Competitive Intensity (COMPINT) and Market Turbulence
(MARKTURB). While the measurement instrument for the former contained six items (6), 1
Item 5 of this construct was removed as it had a disturbing effect on this construct and other
constructs (See Section 6.4.1 and Table 6.3). The latter (MARKTURB) contained four (4)
items. As Table 6.2 shows, satisfactory reliability statistics were achieved for the Perceived
Environmental Uncertainty variables.
The Cronbachs alpha of 0.86 (COMPINT) and 0.85 (MARKTURB) are satisfactory
(Nunnaly, 1978) and compare favourably with past studies (e.g. Hwang, 2005). The factor
mean for COMPINT is 4.434 while that of MARKTURB is 4.381. At the range of 4.320 to
4.674 for COMPINT and 4.109 to 4.686 for MARKTURB, the item means show satisfactory
evidence. Furthermore, the item standard deviation statistics show good results at 1.281 to
1.489 (COMPINT) and 1.254 to 1.384 (MARKTURB).
6.3.2.3 Reliability Statistics for Business/Organisational Strategy
Organisational Strategy is measured by one (1) item on a 7-point scale that reflects
"defender" type organisations on the left and "prospector" type organisations on the right.
The item mean was 2.714 while the item standard deviation value was 1.674 for the construct.
6.3.2.4 Reliability Statistics for Organisational Size
Like organisational strategy, Organisational Size is a construct measured by one (1) item on
a 7-point scale. The reliability statistics are satisfactory for the purpose of this study: the item
mean was 2.914 while the item standard deviation value was 1.902

Chapter 6: Data Analyses: Descriptive Statistics, Reliability and Validity of Factors
Jafar Ojra - 158 -
6.3.2.5 Reliability Statistics for Organisational Technology
As evident in Table 6.2, Organisational Technology is a construct measured by 4 items.The
Cronbachs alpha achieved in this study show a good level of internal consistency (McChlery
et al., 2005; Dik, 2011). The Cronbachs alpha for this construct was 0.78 while the factor
mean was 4.457. The item mean and standard deviation values also showed a satisfactory
level for this construct. While the former ranges from 5.400 to 6.051, the latter ranges from
1.039 to 1.391.
Next, the validity statistics for this study are presented and explained in Section 6.4.

Chapter 6: Data Analyses: Descriptive Statistics, Reliability and Validity of Factors
Jafar Ojra - 159 -
Table 6.2: Reliability Statistics for the other Contingency Factors in the Framework(n=175)
Factors No. of
Items
Item
Mean
Item Std.
dev.
Factor
Mean
Cronb.
Alpha
Organisational Technology
-Technology is a core element of the operating system of this
organisation
-Our production/services techniques are technology based
-The accounting information system is computer based
-We invest in software packages to aid our accounting and
other operational system
4
6.023
5.400
6.051
5.669
1.039
1.159
1.391
1.281
4.457 .78
Perc. Environmental Uncertainty - Comp. Intensity *1
-Many promotions wars occur in our industry
-Anything that one competitor in our industry can offer,
others can match readily
-One hears of new competitive moves in our industry almost
every day
-The current business environment is threatening the survival
of our organisation
-Competitors' product quality or novelty is threatening our
organisation
5
4.520
4.674
4.320
4.348
4.309
1.281
1.318
1.326
1.489
1.392
4.434 .86
Perc. Environmental Uncertainty - Market Turbulence
-Sometimes our customers are very price sensitive
-We are witnessing demand for our products and services
from customers who never bought them before
-New customers tend to have product-related needs that are
different from those of our existing customers
-Our customers tend to look for new products and services all
the time
4
4.686
4.480
4.109
4.251
1.359
1.254
1.279
1.384
4.381 .85
Organisational Structure - Formalisation
-Employees in our organisation are allowed to make their own
decisions without checking with anybody else
-My usual experience with our organisation involves doing
things 'by the rule book'
-Many activities in our organisation are not covered by formal
procedures
3
4.520
4.806
4.554
1.538
1.368
1.603
4.627 .91
Organisational Structure - Decentralisation *2
-Even small matters in our organisation must be referred to
someone higher up for a final answer
3
5.183
1.099
5.482 .78

Chapter 6: Data Analyses: Descriptive Statistics, Reliability and Validity of Factors
Jafar Ojra - 160 -
-Any major decisions that employees make must have the
approval of top managers
-Employees who want to make their own decisions would be
quickly discouraged
5.954
5.309
1.082
1.107
Organisational Performance - Financial
-Return on investment
-Sales margin
-Capacity utilisation
-Market share
4
4.611
4.914
4.537
4.794
1.128
1.087
1.272
1.190
4.714 .87
Organisational Performance – Non-Financial
-Customer satisfaction
-Product/service quality
-Development of new products/services
3
5.274
5.320
5.011
1.472
1.486
1.516
5.202 .92
Organisational Strategy - Defender/Prospector
1 2.714 1.674 NE NE
Organisational Size
1 2.914 1.902 NE NE
Note: *1 Item 5 of this construct was removed as it had a disturbing effect on this construct and other constructs.
NE: Organisational Strategy (Defender/Prospector) and Organisational Size were measured each by one item.
Therefore, the factor mean and Cronbachs Alpha, as displayed in this Table could not be estimated. *2 To
achieve the scores for decentralisation, the scores for the parameters shown above were reversed.

Chapter 6: Data Analyses: Descriptive Statistics, Reliability and Validity of Factors
Jafar Ojra - 161 -
6.4 Validity of Variables: Factor Analyses
To ensure appropriate demarcation of factors (Field, 2005), the researcher conducted factor
analysis. Before undertaking the factor analysis, correlation analysis was conducted to
prepare data for factor analysis (Lee & Scott, 2004). In doing this, the researcher checked if
there was any significant inter-correlation between the items for all the constructs. If a
correlation is statistically significant, it is indicative of an actual relationship rather than one
due entirely to chance (Hair et al., 1992).
Apart from one case, the results did not capture any significant cross construct correlation of
items, and this evidence is also supported by the inter-construct correlation evidence
presented in Table 6.14. The correlation analysis, supported with the descriptive statistics of
variables in the framework, is explained in Section 6.4.1, while the factor analysis results are
presented in Section 6.5. The descriptive results are presented in Section 6.4.2.
6.4.1 Correlation Analyses
To determine if factor analysis is appropriate in this study, the researcher first carried out a
correlation analysis of all constructs in the conceptualised framework (Hair et al., 1992), to
check if the constructs inter-correlated and if the variables for each construct correlated well
enough to represent the individual constructs. The item correlation for each construct justify
that these items are harmonious for measuring the constructs (Field, 2005). The Pearson
Correlation coefficients for the constructs indicate that:
1. The constructs do not share significant correlation between them (See Table 6.14),
that is these factors are unique (Lee & Scott, 2004),
2. Item 5 of the Perceived Environmental Uncertainty (COMPINT) construct is
removed. The inter-correlation examination of all items in the instrument showed that

Chapter 6: Data Analyses: Descriptive Statistics, Reliability and Validity of Factors
Jafar Ojra - 162 -
item 5 of Perceived Environment Uncertainty (competitive intensity) had a disturbing
effect not only on the other items for the construct but also on other conceptualised
constructs. The key disturbing effects of this variable (Tough price competition is
threatening our organisation) are shown in Table 6.3 below,
Table 6.3: Disturbing Effect of PEU-COMPINT (item 5) on other items and constructs
Items Organisational Performance
-Financial
Organisational
Technology
Organisational Structure
(Decentralisation)
Item 1 .370 .390
Item 2 .469 .399 .435
Item 3 .376 .488
Item 4 .415
3. Some item inter-correlation existed amongst the five elements of SMAU, but all were
less than the .800 margin (Field, 2005) (See Table 6.12 - SMAU Factors
intercorrelation) and this, as conceptualised in this study, is expected. They are all
components of the higher-order construct SMAU.
6.4.2 Descriptive Findings for all Variables in the Conceptualised Framework
In this section, the descriptive analysis results for all items in the conceptualised framework
are presented, depicting how the respondents scored the variables for each construct. Doing
this is important, to highlight the level of importance that the respondents attach to the
variables, and also enable better understanding of the correlation between the individual
variables for each construct. The descriptive statistics are displayed in Sections 6.4.2.1
(Perceived Environmental Uncertainty), 6.4.2.2 (Organisational Strategy), 6.4.2.3
(Organisational Size), 6.4.2.4 (Organisational Technology), 6.4.2.5 (Organisational Structure),
6.4.2.6 (Organisational Performance) and 6.4.2.7 (Strategic Management Accounting
Technique Usage).

Chapter 6: Data Analyses: Descriptive Statistics, Reliability and Validity of Factors
Jafar Ojra - 163 -
6.4.2.1 The Descriptive Findings for Perceived Environmental Uncertainty (PEU)
In the conceptualisation for this study, Perceived Environmental Uncertainty is a main
construct and captures two dimensions, namely perceived market turbulence (PMT) and
perceived competitive intensity (PCI). PEU is measured by 10 items as depicted in Table 6.4.
Items 1 to 6 reflect competitive intensity, while items 7 to 10 reflect market turbulence.
For the Competitive Intensity element of Perceived Environmental Uncertainty (items 1 to
6), the respondents perceive the 4 measures typify Competitive Intensity in their
organisations. Majority of the respondents believe that item 1 (many promotion wars occur in
our industry) is common feature of competitive intensity, scoring this item at 5 (38.9%), 6
(14.9%) and 7 (4.0%). Similarly, a majority of the respondents scored items 2 (anything that
one competitor in our industry can offer others can match readily) and 3 (one hears of new
competitive moves in our industry almost every day) highly at {5 (32.0%), 6 (21.7%) and 7
(5.7%)} for the former and {5 (30.9%), 6 (10.9%) and 7 (5.1%)} for the latter.
As Table 6.4 shows too, the descriptive evidence for items 4 (the current business
environment is threatening the survival of our organisation) and 6 (competitors’ product
quality or novelty is threatening our organisation) are very similar to the other items in the
measurement instrument for competitive intensity. 50.3% of the respondents agree that item 4
is a feature of their competitive intensity, while 53.7% agree for item 6. Interestingly,
between 24.6% and 31.4% of the respondents scored each of these items at 4 (undecided).
For the Market Turbulence element, while 10.3% and 22.9% respondents slightly disagree
and are undecided respectively, majority of the respondents (60%) believe that item 7
(sometimes our customers are very price sensitive) is a core feature of their market turbulence.
The respondents scored items 8 and 10 very similar to item 7. 54.3% respondents agree that
item 8 (we are witnessing demand for our products and services from customers who never

Chapter 6: Data Analyses: Descriptive Statistics, Reliability and Validity of Factors
Jafar Ojra - 164 -
bought them before) is a feature of their market turbulence while 50.8% agree for item 10
(our customers tend to look for new products and services all the time). Finally, item 9 (new
customers tend to have product-related needs that are different from those of our existing
customers), which reflects market turbulence, is scored more heavily at 3 (11.4%), 4 (33.1%)
and 5 (32.6).
* Respondents were asked to mark on a scale of 1 (Strongly Disagree) to 7 (Strongly Agree) their perception of the
Environmental Uncertainty in their Organisations.
** Perceived Environmental Uncertainty (item 5 - (Tough price competition is threatening our organisation) was
removed from the variables for further analysis, as explained in Section 6.4.1, due to its disturbing influence on other
items and factors.
6.4.2.2 The Descriptive Findings for Organisational Strategy (OS)
As defined in Section 3.5, organisational strategy reflects the extent to which organisation
respond to a changing environment and align the environment with their companies. For this
focus, this study explores the extent to which the explored organisations reflect prospector or
defender type strategies. Strategy is therefore measured as a continuum (defender –
prospector) and Table 6.5 below shows how the respondents ranked their companies in the
Defender - Prospector continuum. Statistically, the majority of the explored companies are
defender type companies. 26.9% are High Defender type Companies while 33.7% and 9.7%
are Medium Defender type Companies and Average Defender type Companies respectively.
Table 6.4: Measures of Perceived Environmental Uncertainty (PEU)* (n=175)
Perceived Environmental
Uncertainty Variables**
Strongly
Disagree 1
Disagree
2
Slightly
Disagree 3
Undecided
4
Slightly
Agree 5
Agree
6
Strongly
Agree 7
PEU1 2.3% 6.9% 8.0% 25.1% 38.9% 14.9% 4.0%
PEU2 2.3% 4.6% 9.1% 24.6% 32.0% 21.7% 5.7%
PEU3 1.7% 9.1% 12.6% 29.7% 30.9% 10.9% 5.1%
PEU4 8.0% 5.7% 4.6% 31.4% 30.3% 15.4% 4.6%
PEU5
PEU6 6.3% 6.9% 7.4% 25.7% 39.4% 11.4% 2.9%
PEU7 2.3% 4.6% 10.3% 22.9% 33.7% 17.7% 8.6%
PEU8 2.9% 4.0% 10.9% 28.0% 37.7% 12.0% 4.6%
PEU9 3.4% 10.3% 11.4% 33.1% 32.6% 6.9% 2.3%
PEU10 5.7% 7.4% 10.9% 25.1% 35.4% 13.7% 1.7%
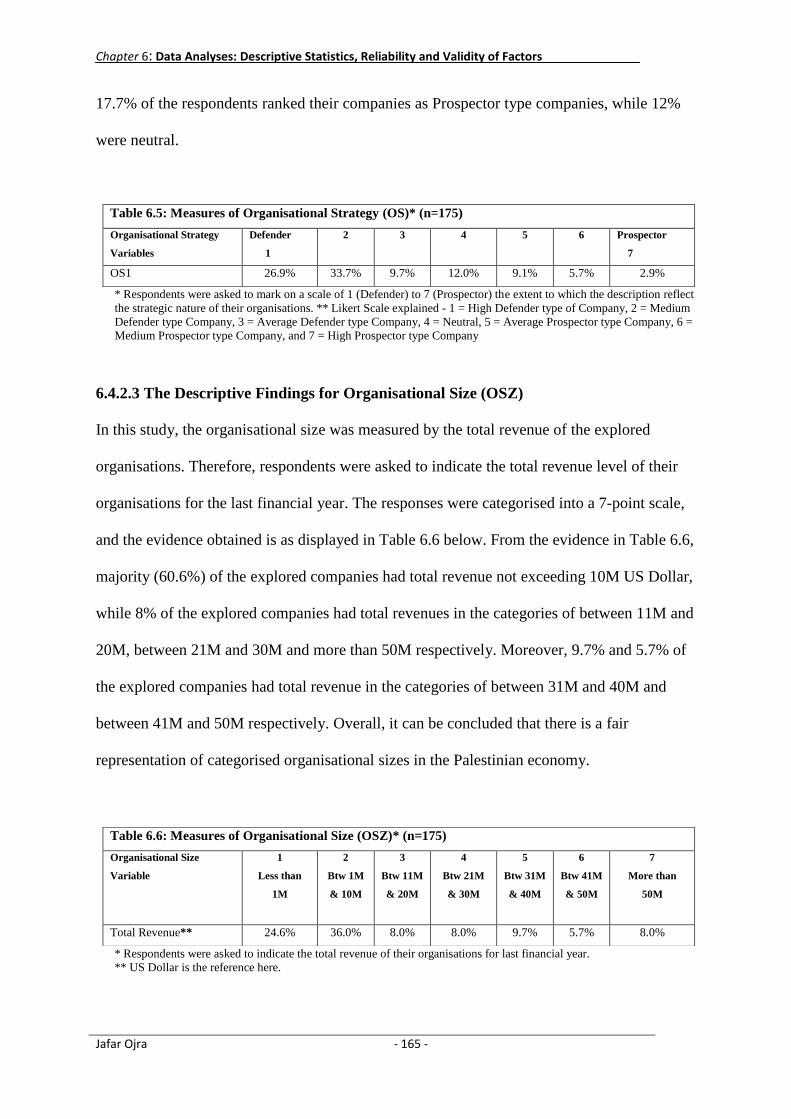
Chapter 6: Data Analyses: Descriptive Statistics, Reliability and Validity of Factors
Jafar Ojra - 165 -
17.7% of the respondents ranked their companies as Prospector type companies, while 12%
were neutral.
* Respondents were asked to mark on a scale of 1 (Defender) to 7 (Prospector) the extent to which the description reflect
the strategic nature of their organisations. ** Likert Scale explained - 1 = High Defender type of Company, 2 = Medium
Defender type Company, 3 = Average Defender type Company, 4 = Neutral, 5 = Average Prospector type Company, 6 =
Medium Prospector type Company, and 7 = High Prospector type Company
6.4.2.3 The Descriptive Findings for Organisational Size (OSZ)
In this study, the organisational size was measured by the total revenue of the explored
organisations. Therefore, respondents were asked to indicate the total revenue level of their
organisations for the last financial year. The responses were categorised into a 7-point scale,
and the evidence obtained is as displayed in Table 6.6 below. From the evidence in Table 6.6,
majority (60.6%) of the explored companies had total revenue not exceeding 10M US Dollar,
while 8% of the explored companies had total revenues in the categories of between 11M and
20M, between 21M and 30M and more than 50M respectively. Moreover, 9.7% and 5.7% of
the explored companies had total revenue in the categories of between 31M and 40M and
between 41M and 50M respectively. Overall, it can be concluded that there is a fair
representation of categorised organisational sizes in the Palestinian economy.
* Respondents were asked to indicate the total revenue of their organisations for last financial year.
** US Dollar is the reference here.
Table 6.5: Measures of Organisational Strategy (OS)* (n=175)
Organisational Strategy
Variables
Defender
1
2 3 4 5 6 Prospector
7
OS1 26.9% 33.7% 9.7% 12.0% 9.1% 5.7% 2.9%
Table 6.6: Measures of Organisational Size (OSZ)* (n=175)
Organisational Size
Variable
1
Less than
1M
2
Btw 1M
& 10M
3
Btw 11M
& 20M
4
Btw 21M
& 30M
5
Btw 31M
& 40M
6
Btw 41M
& 50M
7
More than
50M
Total Revenue** 24.6% 36.0% 8.0% 8.0% 9.7% 5.7% 8.0%

Chapter 6: Data Analyses: Descriptive Statistics, Reliability and Validity of Factors
Jafar Ojra - 166 -
6.4.2.4 The Descriptive Findings for Organisational Technology (OT)
Organisational Technology reflects the extent to which the explored companies value the
importance of, and invest in technology devices to enhance their accounting practices. As
Table 6.7 shows, four (4) items were used to measure this construct. Statistically, the majority
of the explored companies feel their companies’ value and invest in such technological
devices. For the majority of the respondents (84.3%), item 1 (Technology is a core element of
the operating system) is a core feature of their organisations. A similar trend is evident for the
other items of this construct, with majority of respondents indicating that item 2 (our
production/services techniques are technology based) (87.7%), item 3 (the accounting
information system is computer based) (96.6%), and item 4 (we invest in software packages
to aid our accounting and other operational systems) (85.2%) are core features of their
organisations.
* Respondents were asked to mark on a scale of 1 (not at all) to 7 (to a great extent) the extent to which the four items
reflect the technological environment of their organisations.** Likert scale further explained - 2 = to a very limited
extent, 3 = to a limited extent, 4 = to a moderate extent, 5 = to a considerable extent, 6 = to a great extent, and 7 = to a
very great extent.
6.4.2.5 The Descriptive Findings for Organisational Structure (OSTR)
Organisational structure (OSTR), which reflects the organisational structure of the explored
organisations, is a two dimension construct. As shown in Table 6.8 below, organisational
structure is measured by six items. The items 1 to 3 measure the extent of Formalisation
(OSTR-FORM) while items 4 to 6 measure the extent of Decentralisation (OSTR-DCENT)
Table 6.7: Measures of Organisational Technology (OT)* (n=175)
Organisational Technology
Variables**
Not at all
1
2 3 4 5 6 To avery great
Extent 7
OT1 0.6% 1.1% 0.6% 3.4% 18.9% 38.3% 37.1%
OT2 1.1% 2.9% 0.0% 10.3% 38.3% 31.4% 16.0%
OT3 0.6% 0.0% 0.6% 2.3% 26.9% 28.6% 41.1%
OT4 1.7% 2.9% 3.4% 6/9% 22.9% 28.6% 33.7%
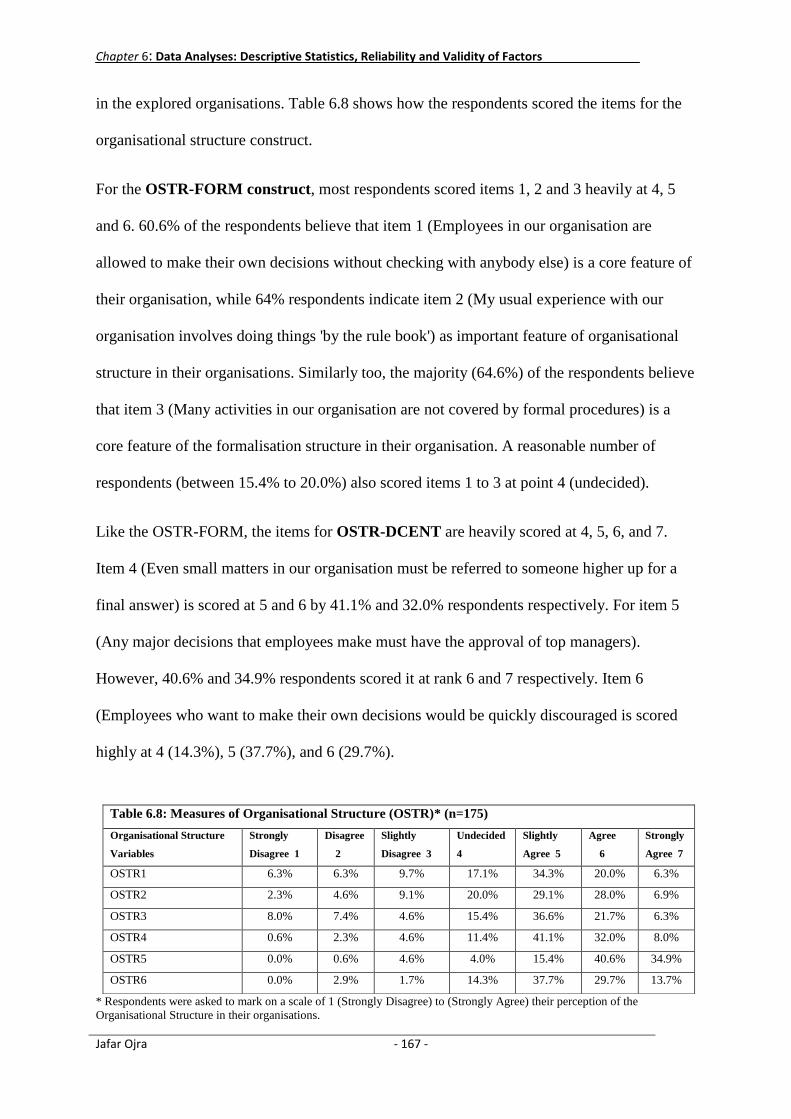
Chapter 6: Data Analyses: Descriptive Statistics, Reliability and Validity of Factors
Jafar Ojra - 167 -
in the explored organisations. Table 6.8 shows how the respondents scored the items for the
organisational structure construct.
For the OSTR-FORM construct, most respondents scored items 1, 2 and 3 heavily at 4, 5
and 6. 60.6% of the respondents believe that item 1 (Employees in our organisation are
allowed to make their own decisions without checking with anybody else) is a core feature of
their organisation, while 64% respondents indicate item 2 (My usual experience with our
organisation involves doing things 'by the rule book') as important feature of organisational
structure in their organisations. Similarly too, the majority (64.6%) of the respondents believe
that item 3 (Many activities in our organisation are not covered by formal procedures) is a
core feature of the formalisation structure in their organisation. A reasonable number of
respondents (between 15.4% to 20.0%) also scored items 1 to 3 at point 4 (undecided).
Like the OSTR-FORM, the items for OSTR-DCENT are heavily scored at 4, 5, 6, and 7.
Item 4 (Even small matters in our organisation must be referred to someone higher up for a
final answer) is scored at 5 and 6 by 41.1% and 32.0% respondents respectively. For item 5
(Any major decisions that employees make must have the approval of top managers).
However, 40.6% and 34.9% respondents scored it at rank 6 and 7 respectively. Item 6
(Employees who want to make their own decisions would be quickly discouraged is scored
highly at 4 (14.3%), 5 (37.7%), and 6 (29.7%).
* Respondents were asked to mark on a scale of 1 (Strongly Disagree) to (Strongly Agree) their perception of the
Organisational Structure in their organisations.
Table 6.8: Measures of Organisational Structure (OSTR)* (n=175)
Organisational Structure
Variables
Strongly
Disagree 1
Disagree
2
Slightly
Disagree 3
Undecided
4
Slightly
Agree 5
Agree
6
Strongly
Agree 7
OSTR1 6.3% 6.3% 9.7% 17.1% 34.3% 20.0% 6.3%
OSTR2 2.3% 4.6% 9.1% 20.0% 29.1% 28.0% 6.9%
OSTR3 8.0% 7.4% 4.6% 15.4% 36.6% 21.7% 6.3%
OSTR4 0.6% 2.3% 4.6% 11.4% 41.1% 32.0% 8.0%
OSTR5 0.0% 0.6% 4.6% 4.0% 15.4% 40.6% 34.9%
OSTR6 0.0% 2.9% 1.7% 14.3% 37.7% 29.7% 13.7%

Chapter 6: Data Analyses: Descriptive Statistics, Reliability and Validity of Factors
Jafar Ojra - 168 -
6.4.2.6 The Descriptive Findings for Organisational Performance (OP)
The Organisational Performance construct (OP) is measured by seven items (see Table 6.9
below) that capture the extent of organisational performance in the explored organisations.
The OP construct contains both financial and non-financial performance elements, that is two
performance constructs are conceptualised in this study. The first performance construct is
the financial element (OP-FP) is measured by items 1 to 4, while the non-financial element
of performance (OP-NFP) is measured by items 5 to 7), as in Table 6.9 below.
The descriptive statistics for Organisational Performance-Financial indicate that the
respondents scored items 1, 3 and 4 highly, evidence that suggests that the respondents
perceive these items as core Performance (Financial) features in their organisations. Most
respondents ranked item 1 (Return on investment) at 4(30.9%) and at 5(40%), and item 3
(Capacity utilisation) at 4 (25.7%), 5 (37.7%) and 6 (16.6%). Also scored highly were items 2
(Sales margin) at 5 (46.9%) and 6 (20.6), and item 4 (Market share) at 4 (25.7%), 5 (37.1%)
and 6 (20.0%). Overall, based on the evidenced statistics, the respondents believe that their
organisations performed better than their competitors using the 4-metrics.
For the Non-Financial Performance elements, the respondents score the measurement items
highly too, an indication that these non-financial elements are weighed heavily in the
operations of the organisations. The three items for the Organisational Performance Non-
Financial construct were scored heavily at points 4, 5, 6 and 7. 74.3% (for item 5), 65.1%
(for item 6) and 71.3% (for item 7) believe that their organisations performed better than their
competitors.

Chapter 6: Data Analyses: Descriptive Statistics, Reliability and Validity of Factors
Jafar Ojra - 169 -
* Respondents were asked to mark on a scale of 1 (Below Average) to 7 (Above Average) their perception of their
Organisation’s performance relative to their competitors.
6.4.2.7 The Descriptive Findings for Strategic Management Accounting Techniques
Usage (SMAU)
The distribution of responses for the measures of Strategic Management Accounting
Technique Usage is reported in Table 6.10. All the measures of the SMAU were scored at all
levels of the scale. The most highly scored were point 5 (25.7%) - SMAU1-Attribute Costing,
point 4 (29.1%) - SMAU2-Life Cycle Costing, point 5 (31.4%) - SMAU3-Quality Costing,
point 5 (27.4%) - SMAU4-Target Costing, and point 5 (30.9%) - SMAU5-Value Chain
Costing).
An inspection of the descriptive statistics for the measure of SMAU –Planning, Control and
Performance Measurement indicates that SMAU6 was scored highest at 5 (33.7%) and
SMAU7 at 5 (37.7%). The next highest scores for these items are point 6 (18.3%) and point 4
(21.1%). For the Strategic Decision Making elements of SMAU, SMAU8 (Strategic Cost
Management) is scored highly at points 4 (26.3%), 5 (31.4%) and 6 (22.3%) and SMAU9
(Strategic Pricing) at points 5 (30.3%) and 6 (25.7%). SMAU10 (Brand Valuation) is scored
highly at points 4 (25.7%) and 5 (34.9%).
The descriptive results for the Competitor Accounting element of SMAU shows that
SMAU11 (Competitor Cost Assessment) was scored highly at 4 (21.7%), 5 (35.4%) and 6
Table 6.9: Measures of Organisational Performance (OP)* (n=175)
Organisational
Performance
Variables
Extremely
poor 1
Well Bel.
Average 2
Below
Average 3
Average
4
Above
Average 5
Well . Ab.
Average 6
Extremely
good 7
OP1 1.7% 4.0% 5.1% 30.9% 40% 15.4% 2.9%
OP2 0.0% 3.4% 6.9% 16.6% 46.9% 20.6% 5.7%
OP3 2.9% 5.1% 8.6% 25.7% 37.7% 16.6% 3.4%
OP4 1.1% 3.4% 6.3% 25.7% 37.1% 20.0% 6.3%
OP5 1.1% 4.0% 9.1% 11.4% 24.0% 26.9% 23.4%
OP6 2.3 % 2.9% 8.0% 12.0% 20.0% 32.0% 22.9%
OP7 2.3% 8.0% 5.7% 12.6% 26.3% 32.0% 13.1%

Chapter 6: Data Analyses: Descriptive Statistics, Reliability and Validity of Factors
Jafar Ojra - 170 -
(18.3%), SMAU12 (Competitive Position Monitoring) at 5 and 6 (28.0%), and SMAU13
(Competitor Performance Appraisal) at 5 (27.4%) and 6 (25.7%). For the Customer
Accounting element of SMAU, the descriptive statistics for SMAU14 (Customer
Profitability Analysis), SMAU15 (Life Customer Profitability Analysis), SMAU16 (Value of
Customers as Assets) show that the respondents scored these items reasonably at all points on
the scale, evidence which suggests that these SMA tools may not be commonly used in the
explored organisations. As a matter of fact, a reasonable percentage of respondents (48.5%
for SMAU14, 51.0% for SMAU15, and 55.4% for SMAU16) disagree that these tools are
features of their SMAU practices.

Chapter 6: Data Analyses: Descriptive Statistics, Reliability and Validity of Factors
Jafar Ojra - 171 -
* Respondents were asked to mark on a scale of 1 (Strongly Disagree) to 7 (Strongly Agree) their perception of the
Strategic Management Accounting Techniques Usage in their Organisations.
** Strategic Management Accounting Techniques Usage (items 1 to 5 reflect Costing Element, items 6 to 7 reflect
Planning, Control and Performance Measurement Element, items 8 to 10 reflect Strategic Decision Making
Element, items 11 to 13 reflect Competitor Accounting Element, and items 14 to 16 reflect Customer Accounting
Element.
Table 6.10: Measures of Strategic Management Accounting Techniques Usage (SMAU)* (n=175)
SMAU Variables** 1 2 3 4 5 6 7
SMAU1-Costing1 6.9% 9.1% 15.4% 22.9% 25.7% 13.7% 6.3%
SMAU2-Costing2 4.6% 7.4% 11.4% 29.1% 26.9% 12.6% 8.0%
SMAU3-Costing3 1.7% 7.4% 10.9% 17.1% 31.4% 22.3% 9.1%
SMAU4-Costing4 2.3% 3.4% 12.0% 17.7% 27.4% 24.0% 13.1%
SMAU5-Costing5 2.3% 7.4% 13.7% 23.4% 30.9% 15.4% 6.9%
SMAU6-PlanContr1 5.7% 6.9% 8.0% 16.0% 33.7% 18.3% 11.4%
SMAU7-PlanContr2 8.0% 8.6% 7.4% 21.1% 37.7% 11.4% 5.7%
SMAU8-StratDecMkg1 4.0% 3.4% 6.9% 26.3% 31.4% 22.3% 5.7%
SMAU9-StratDecMkg2 2.3% 3.4% 8.0% 17.1% 30.3% 25.7% 13.1%
SMAU10-StratDecMkg3 4.6% 8.6% 8.0% 25.7% 34.9% 11.4% 6.9%
SMAU11-CompAcctg1 4.0% 8.6% 6.3% 21.7% 35.4% 18.3% 5.7%
SMAU12-CompAcctg2 6.9% 7.4% 7.4% 12.0% 28.0% 28.0% 10.3%
SMAU13-CompAcctg3 5.1% 12.6% 4.6% 17.7% 27.4% 25.7% 6.9%
SMAU14-CustAcctg1 17.7% 17.1% 13.7% 16.0% 15.4% 12.0% 8.0%
SMAU15-CustAcctg2 16.0% 17.1% 18.9% 18.9% 8.6% 13.1% 7.4%
SMAU16-CustAcctg3 13.7% 20.6% 21.1% 1.7% 14.3% 8.0% 4.6%

Chapter 6: Data Analyses: Descriptive Statistics, Reliability and Validity of Factors
Jafar Ojra - 172 -
6.5 Factor Analyses
To achieve a clear demarcation of the factors for this study, the conceptualised constructs
were examined in a two way approach. In the first approach, the strategic management
accounting techniques were examined to identify if the measurement items load into the
conceptualised themes of strategic management accounting techniques. In the second
approach, the other contingency constructs were examined together to identify the core
factors, towards further analysis. The factor analysis for the strategic management accounting
techniques constructs are explained in Section and subsections of 6.5.1, while the factor
analysis for the contingency constructs are explained in Section and subsections of 6.5.2.
6.5.1 Factor Analysis of the Strategic Management Accounting Techniques Usage
In this Section, the factor analysis results for the Strategic Management Accounting Usage
factors are presented, displaying the factor loadings for each item and the percentage of
variance explained by each factor. The Strategic Management Accounting constructs were
factor analysed separately from the other constructs in the contingency framework.
Before the factor analysis was run, a correlation examination of the variables was conducted
to ensure that the variables fit well within their individual conceptualised constructs, and also
for the purpose of being used as dimensional elements of the main construct SMAU (Field,
2005). The variables correlate well and the inter-construct-correlation is shown in Table 6.12.
Using Principal Component Analysis (PCA), as specified in Chapter 5, a higher-order and
lower-order analysis was done on the SMAU constructs. Both approach achieved satisfactory
validity evidence as Table 6.11 shows below.

Chapter 6: Data Analyses: Descriptive Statistics, Reliability and Validity of Factors
Jafar Ojra - 173 -
Table 6.11: Validity Statistics of Strategic Management Accounting Techniques Usage (SMAU)
Factors(n=175)*
Factors %age
Var.
expl.*1
Eige-
value
KMO
*2
Bart.
Spher.
Sig.*3
Principal Component Analysis
Factor Loadings
F1 F2 F3 F4 F5
SMAU-Costing (F1)
Attribute Costing
Life-Cycle Costing
Quality Costing
Target Costing
Value chain Costing
72.6%
3.631 .88
.000
.
.868
.860
.824
.842
.866
SMAU-PlanContPerf (F2)
Benchmarking
Integrated Performance
Measurement (balanced Scorecard)
86.89% 1.738 .50 .000
.932
.932
SMAU-StrategicDec.Making (F3)
Strategic Costing (Strategic Cost
Management)
Strategic Pricing
Brand Valuation
77.29% 2.319 .72 .000
.902
.866
.869
SMAU-CompetitorAccting (F4)
Competitor Cost Assessment
Competitive Position Monitoring
Competitor Performance Appraisal
84.96% 2.549 .74 .000
.897
.943
.924
SMAU-CustomerAccounting (F5)
Customer Profitability Analysis
Life Customer Profitability Analysis
Value of Customer as Assets
86.84% 2.605 .72 .000
.927
.960
.908
SMAU Summation *4 52.93% 26.46 .79 .000 .789 .838 .668 .689 .633
Note: * = All SMAU factors were analysed separately. *1 = percentage of variance explained by factor. *2 =
(KMO) Kaiser-Meyer-Olkin Measure of Sampling Adequacy. *3 = Bartlett's Test of Sphericity. *4 (SMAU
Summation) is the analysis of SMAU F1, F2, F3, F4 and F5.
This study conceptualised 5-elements of Strategic Management Accounting Techniques Usage, as shown in the
Table above. By that conceptualisation, a degree of intercorrelation between the 5-elements is necessary (Field,
2005). To ensure methodological appropriateness, the intercorrelation statistics for the 5-elements were
examined. The Table below shows that the 5-elements are well intercorrelated and below the .8 benchmark
(Field, 2005).

Chapter 6: Data Analyses: Descriptive Statistics, Reliability and Validity of Factors
Jafar Ojra - 174 -
Table 6.12: Inter-Item Correlation Matrix for the SMAU Factors
F-Score
SMAUCosti
ng
F-Score
SMAUPlan
ContrPer
F-Score
SMAUStrat
DecMaking
F-Score
SMAUCom
petitorAcctg
F-Score
SMAUCusto
merAcctg
F-Score SMAUCosting 1.000 .644 .426 .386 .331
F-Score SMAUPlanContrPer .644 1.000 .431 .456 .426
F-Score SMAUStratDecMaking .426 .431 1.000 .335 .269
F-Score SMAUCompetitorAcctg .386 .456 .335 1.000 .354
F-Score SMAUCustomerAcctg .331 .426 .269 .354 1.000
The SMAU-Summation statistics show that all the factors loaded well on the higher-order
factor SMAU-Summation. 52.93% variance was explained by this factor, a result which is
satisfactory for a single factor extraction (Field, 2005). SMAU-Summation factor also
achieved satisfactory Eigenvalue (26.46), KMO (.79) and Bartletts Sphericity significance
(.000). The factor results, as shown in Table 6.11 above, are based on separate analysis of
each of the five elements of the SMAU construct.
SMAU-Costing (F1) has an explained variance of 72.6%, Eigenvalue of 3.631, KMO-value
of .88, and a Bartletts Sphericity significance of .000. All the items of this construct loaded
well between .824 and .868.
At 86.89% explained variance, 1.738 Eigenvalue, .50 Kaiser-Meyer Olkin (KMO) value
and .000 Bartletts Sphericity value, SMAU-Planning, Control and Performance
Measurement factor achieved satisfactory statistics. As Table 6.11 shows, both items for
this factor load reasonably well at .932.
F3 - SMAU-Strategic Decision Making has explained variance of 77.29% and Eigenvalue
of 2.319. The KMO of .72 and Bartletts Sphericity significance of .000 also support the
satisfactory results for this factor. The three items used to measure this factor load reasonably
well on this factor at .902, .866 and .869 respectively.

Chapter 6: Data Analyses: Descriptive Statistics, Reliability and Validity of Factors
Jafar Ojra - 175 -
The fourth element of the SMAU Construct reflects Competitor Accounting (F4). F4 has
explained variance of 84.96%, Eigenvalue of 2.549, KMO of .74 and Bartletts Sphericity
significance of .000. Three items load onto this factor at .897, .943 and .924 respectively.
The final element of SMAU reflects Customer Accounting (F5). Customer Accounting has
explained variance of 86.84% and Eigenvalue of 2.605. The KMO of .72 and Bartletts
Sphericity significance of .000 also the validity of this factor. The three items for this factor
load at .927, .960 and .908 onto the factor and also justify the validity of the Customer
Accounting factor.
As Table 6.12 shows there is a reasonable association between F1 to F5, evidence which
justifies the appropriateness of using F1 to F5 as lower-order factors of SMAU.
Next, the validity results for the other contingency variables are explained (Section 6.5.2).
6.5.2 Factor Analysis of the other Contingency Variables in the Framework
In this Section, the factor analysis results for the non-SMAU factors are presented, displaying
the factor loadings for each item and the percentage of variance explained by each factor. As
reported in Section 6.4.1, supported by the evidence in Table 6.3, item 5 of the Perceived
Environmental Uncertainty (competitive intensity) construct had disturbing effects on several
items and other constructs. Therefore, this item was excluded before the factor analysis was
conducted. To ensure that the factors are distinct, the other constructs in the contingency
framework were factor analysed jointly. Thus, factor analysis was programmed to extract 7
factors. There were two categorically scaled factors in this study, namely Organisational
Strategy and Organisational Size, and these were not included in the joint factor analysis.
Table 6.13 summarises the factor analysis results for the seven (7) factors, and the core
statistics are highlighted next.

Chapter 6: Data Analyses: Descriptive Statistics, Reliability and Validity of Factors
Jafar Ojra - 176 -
The summary of the factor analysis results (See Table 6.13) shows 72.69% explained
variance, .77 KMO and .000 Bartletts Sphericity significance. This explained variance
therefore meets the 70% benchmark for multi-variable factor analysis (Field, 2005). FI
reflects Organisational Performance (Non-Financial). This factor has explained variance
of 16.58% and Eigenvalue of 4.310. The measurement items (customer satisfaction,
product/service quality and development of new products/services) load well onto this factor
at .907, .926 and .921 respectively. The Financial dimension of Organisational
Performance (F4) has explained variance of 9.81% and Eigenvalue of 2.551. Four items
were used to measure this construct and these load well onto the factor at .818, .870, .853
and .841 respectively.
For F2 (Perceived Environment Uncertainty - Competitive Intensity) the explained
variance is 15.18% and Eigenvalue of 3.947. Five items used to measure this factor load well
on this factor at .847, .789, .664, .856, and .851. The second element of Perceived
Environmental Uncertainty – Market Turbulence (F5) had explained variance of 8.79%
and Eigenvalue of 2.286. Four items were used to measure Market Turbulence and each
loaded at .857, .803, .818 and .844 respectively. The overall statistical evidence for this factor
satisfies relevant benchmarks.
Organisational Structure – Decentralisation was captured as F6 in the factor analysis,
while Formalisation, the second element of Organisational Structure was F3. As shown in
Table 6.13, the former has explained variance of 6.09% and Eigenvalue of 1.584. The items
for this factor loaded at .833, .880 and .776 respectively on the factor. On the other hand, F3
has explained variance of 11.04% while the Eigenvalue is 2.870. Also three items were used
to measure this factor, and these loaded at .921, .895 and .835 respectively on the factor.

Chapter 6: Data Analyses: Descriptive Statistics, Reliability and Validity of Factors
Jafar Ojra - 177 -
Finally, F7, which reflects Organisational Technology, has explained variance of 5.20%
and Eigenvalue of 1.352. All four items for measuring this factor loaded reasonably well on
to this factor at .819, .778, .692, and .661 respectively.
To confirm if the factors (F1 to F7) were distinct, a cross factor examination was conducted.
The results confirm that the extracted factors are distinct (See Table 6.14).

Chapter 6:Data Analyses: Descriptive Statistics, Reliability and Validity of Factors
Jafar Ojra - 178 -
Table 6.13: Validity Statistics for the other Contingency Factors in the Framework(n=175)*
Factors %age
Var.
expl.*1
Eige-
value
KMO
*2
Bart.
Spher
Sig.*3
Principal Component Analysis
Factor Loadings
F1 F2 F3 F4 F5 F6 F7
Organisational Performance – Non-Financial (F1)
-Customer satisfaction
-Product/service quality
-Development of new products/services
16.58%
4.310
.
.907
.926
.921
Perceived Environmental Uncertainty -
Competitive Intensity (F2)*4
-Many promotions wars occur in our industry
-Anything that one competitor in our industry can
offer, others can match readily
-One hears of new competitive moves in our industry
almost every day
-The current business environment is threatening the
survival of our organisation
-Competitors' product quality or novelty is threatening
our organisation
15.18%
3.947
.847
.789
.664
.856
.851
Organisational Structure - Formalisation (F3)
-Employees in our organisation are allowed to make
their own decisions without checking with anybody
else
-My usual experience with our organisation involves
11.04% 2.870
.921

Chapter 6:Data Analyses: Descriptive Statistics, Reliability and Validity of Factors
Jafar Ojra - 179 -
doing things 'by the rule book'
-Many activities in our organisation are not covered by
formal procedures
.895
.935
Organisational Performance - Financial (F4)
-Return on investment
-Sales margin
-Capacity utilisation
-Market share
9.81% 2.551
.818
.870
.853
.841
Perceived Environmental Uncertainty - Market
Turbulence (F5)
-Sometimes our customers are very price sensitive
-We are witnessing demand for our products and
services from customers who never bought thembefore
-New customers tend to have product-related needs
that are different from those of our existing customers
-Our customers tend to look for new products and
services all the time
8.79%
2.286
.857
.803
.818
.844
Organisational Structure - Decentralisation (F6)
-Even small matters in our organisation must be
referred to someone higher up for a final answer
-Any major decisions that employees make must have
the approval of top managers
-Employees who want to make their own decisions
would be quickly discouraged
6.09% 1.584
.833
.880
.776

Chapter 6:Data Analyses: Descriptive Statistics, Reliability and Validity of Factors
Jafar Ojra - 180 -
Organisational Technology (F7)
-Technology is a core element of the operating system
of this organisation
-Our production/services techniques are technology
based
-The accounting information system is computer based
-We invest in software packages to aid our accounting
and other operational system
5.20% 1.352
.819
.778
.692
.661
Summation of Principal Component Analysis for
Factors F1 to F7
72.69%
.77
.000
Note: * = A multi-construct principal component analysis produced 7 factors (F1 - F7), the inter-component correlation matrix (See Table below) show that F1
to F7 are distinct. *1 = percentage of variance explained by factor. *2 = (KMO) Kaiser-Meyer-Olkin Measure of Sampling Adequacy. *3 = Bartlett's Test of
Sphericity. *4 = Item 5 of this construct was removed as it had a disturbing effect on this construct and other constructs.
The component correlation matrix (See Table below) shows that the contingency factors shown in the Table above are distinct.

Chapter 6:Data Analyses: Descriptive Statistics, Reliability and Validity of Factors
Jafar Ojra - 181 -
Table 6.14: Component Correlation Matrix
Components 1 2 3 4 5 6 7
1 1.000 .096 -.105 .044 -.201 -.043 .317
2 .096 1.000 -.013 -.125 -.142 .158 -.042
3 -.105 -.013 1.000 .010 .035 .151 .107
4 .044 -.125 .010 1.000 -.070 -.141 .128
5 -.201 -.142 .035 -.070 1.000 -.132 -.112
6 -.043 .158 .151 -.141 -.132 1.000 -.058
7 .317 -.042 .107 .128 -.112 -.058 1.000
Extraction Method: Principal Component Analysis.
Rotation Method: Oblimin with Kaiser Normalisation.

Chapter 6:Data Analyses: Descriptive Statistics, Reliability and Validity of Factors
Jafar Ojra - 182 -
6.6 Conclusion to the Chapter
As stated in Section 6.1, the purpose of this chapter was to justify the reliability and validity
of the variables in this study. As a prelude to doing that, the normality of data distribution, for
the purpose of multivariate regression analysis, was justified in Section 6.2.
After that, the reliability statistics for all variables in the framework were presented and
explained. Three core statistics were highlighted in this connection, namely Cronbachs alpha,
factor mean value and standard deviation value for all items in each construct. Also, the item
mean values were presented. First, the reliability results for the Strategic Management
Accounting Techniques Usage (SMAU) were presented, and thereafter the results for the
other constructs in the contingency framework were presented.
The third core Section of this Chapter concerns validity of the instrument for this study. This
Section commenced with an explanation of how item correlation examination amongst all
conceptualised constructs was conducted to ensure that no cross-correlation existed. After that,
the descriptive findings for all constructs were presented, showing clearly how the
respondents scored the various measurement items on the defined scales. In the final section
of explaining the validity of the measurement instrument for this study, the principal analysis
results were presented and explained. First, the principal component analysis approach was
explained. The statistical results for the SMAU factors were presented and explained first, and
then followed by the other factors in the conceptualised framework. The core validity indices
presented included variance explained, Eigenvalue, KMO value, Bartletts Sphericity
significance and the loadings of each item on the respective factors.
Having confirmed the reliability and validity of the instrument for this study, the next Chapter
(7) details out the statistical results of subsequent analysis, namely the regression analysis

Chapter 6:Data Analyses: Descriptive Statistics, Reliability and Validity of Factors
Jafar Ojra - 183 -
conducted to test the defined hypotheses for this study. In Chapter 7 too, the discussion of the
findings will be undertaken.

Chapter 7: Regression Analyses, Statistical Assessment of Hypothesesand Discussion of Findings
Jafar Ojra - 184 -
7. Regression Analyses, Statistical Assessment of Hypotheses and Discussion of Findings
7.1 Introduction to the Chapter
Chapter six (6) has confirmed the reliability and validity of the instrument for this study.
Chapter seven (7) therefore has two main objectives. First, it presents and explains the
regression analysis results for testing the hypotheses for this study. The second main objective
of this Chapter is to discuss the findings from this study.
The regression analysis (first main objective) and the discussion of findings (second main
objective) are based on the overall sample results. As a reminder, five main industrial sectors
were explored in this study. Therefore, before attending to the above mentioned main
objectives, Section 7.2 presents some comparative results of the variables for this study, based
on the sectors explored. After that, Sections 7.3 presents the regression analysis results, while
Section 7.4 presents the discussion of findings from this study. Section 7.5 presents the
conclusion to this chapter.
7.2 Sectoral Analysis
Prior research on Strategic Management Accounting Usage (e.g., Cadez, 2006) underlined
that statistical differences exist for variables across groups. According to further literature
(Hair et al., 1998), F-test assesses the hypothesis of equal means but does not address the
question of which means are different. Therefore, to test the cross-industry differences and
ascertain statistical significance, this study follows Cadez (2006) and uses the analysis of
variance (ANOVA) procedure. The results are presented in subsections 7.2.1 (Strategic
Management Accounting Techniques Usage – SMAU variables) and 7.2.2 (other contingency
variables in the framework), while subsection 7.2.3 explains the methodological approach
followed to investigate and explain the results for a number of factors that showed similarities
across the groups (sectors) explored. In presenting the ANOVA results, Tables 7.1 and 7.2

Chapter 7: Regression Analyses, Statistical Assessment of Hypothesesand Discussion of Findings
Jafar Ojra - 185 -
display the sum of Squares, and Mean Squares for ‘Between Groups’ and ‘Within Groups’.
Also, the F-value, and Significance level are reported for each factor. The comparative
analysis is based on the samples for each sector, namely investment sector (n = 2), industry
sector (n = 102), banking and financial services sector (n = 29), insurance sector (n = 5) and
service sector (n = 37).
7.2.1 The Cross-Industry Comparative Evidence: Strategic Management Accounting
Usage (SMAU)
The analysis of variance (ANOVA) results (See Table 7.1) shows that there is a significant
difference between mean values between the groups (sectors.) for SMAU (Total), SMAU
Planning, Control and Performance Measurement, SMAUStrategic Decision Making,
SMAUCompetitorAccounting, and SMAU Customer Accounting.
At the significance level of (.217) and F-value of 1.458, there is no significant difference
between the groups (sectors) for the SMAU Costing variable.
Table 7.1: ANOVA Scores of Variables within Industry Groups for SMAU
Sum of Squares Mean Square F Sig.
SMAUCosting Between Groups 5.773 1.443 1.458 .217
Within Groups 168.227 .990
SMAUPlanContrPer Between Groups 18.064 4.516 4.923 .001
Within Groups 155.936 .917
SMAUStratDecMaking Between Groups 9.224 2.306 2.379 .054
Within Groups 164.776 .969
SMAUCompetitorAccounting Between Groups 22.178 5.544 6.208 .000
Within Groups 151.822 .893
SMAUCustomerAccounting Between Groups 17.260 4.315 4.680 .001
Within Groups 156.740 .922
SMAUTotal Between Groups 15.220 3.805 4.074 .004
Within Groups 158.780 .934
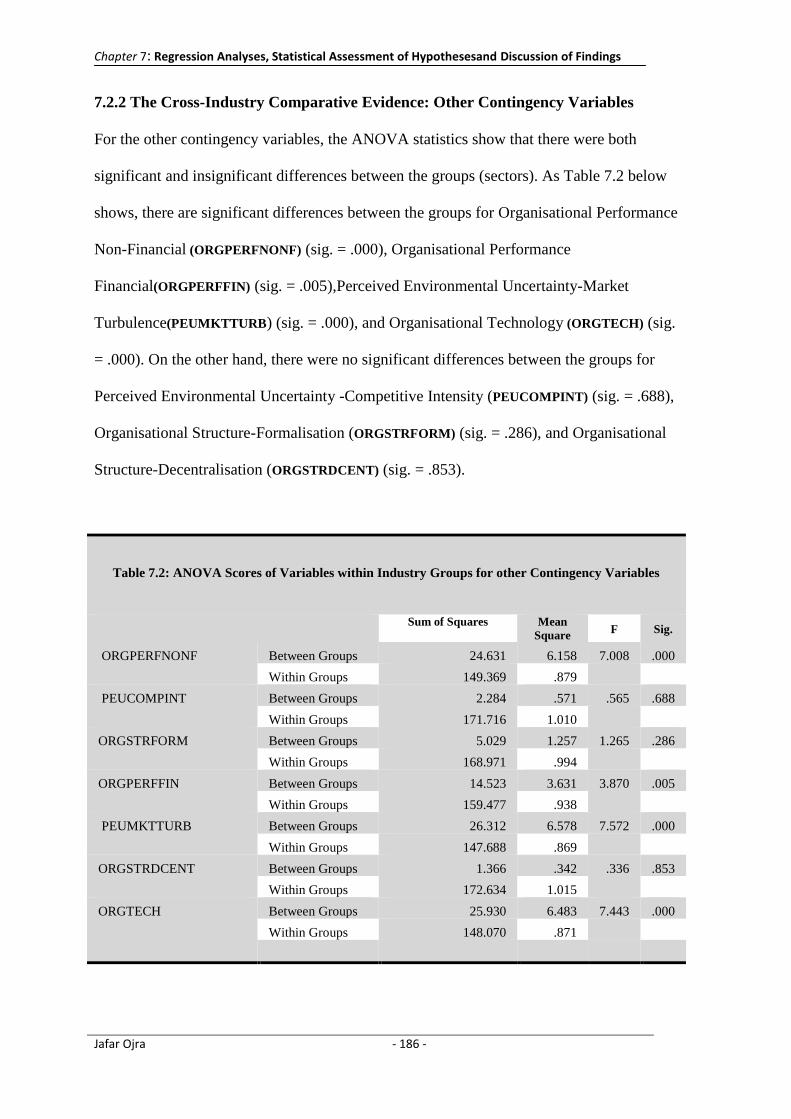
Chapter 7: Regression Analyses, Statistical Assessment of Hypothesesand Discussion of Findings
Jafar Ojra - 186 -
7.2.2 The Cross-Industry Comparative Evidence: Other Contingency Variables
For the other contingency variables, the ANOVA statistics show that there were both
significant and insignificant differences between the groups (sectors). As Table 7.2 below
shows, there are significant differences between the groups for Organisational Performance
Non-Financial (ORGPERFNONF) (sig. = .000), Organisational Performance
Financial(ORGPERFFIN) (sig. = .005),Perceived Environmental Uncertainty-Market
Turbulence(PEUMKTTURB) (sig. = .000), and Organisational Technology (ORGTECH) (sig.
= .000). On the other hand, there were no significant differences between the groups for
Perceived Environmental Uncertainty -Competitive Intensity (PEUCOMPINT) (sig. = .688),
Organisational Structure-Formalisation (ORGSTRFORM) (sig. = .286), and Organisational
Structure-Decentralisation (ORGSTRDCENT) (sig. = .853).
Table 7.2: ANOVA Scores of Variables within Industry Groups for other Contingency Variables
Sum of Squares Mean
Square F Sig.
ORGPERFNONF Between Groups 24.631 6.158 7.008 .000
Within Groups 149.369 .879
PEUCOMPINT Between Groups 2.284 .571 .565 .688
Within Groups 171.716 1.010
ORGSTRFORM Between Groups 5.029 1.257 1.265 .286
Within Groups 168.971 .994
ORGPERFFIN Between Groups 14.523 3.631 3.870 .005
Within Groups 159.477 .938
PEUMKTTURB Between Groups 26.312 6.578 7.572 .000
Within Groups 147.688 .869
ORGSTRDCENT Between Groups 1.366 .342 .336 .853
Within Groups 172.634 1.015
ORGTECH Between Groups 25.930 6.483 7.443 .000
Within Groups 148.070 .871
Chapter 7: Regression Analyses, Statistical Assessment of Hypothesesand Discussion of Findings
Jafar Ojra - 187 -
7.2.3 Evaluating the Similarities between the Sectors
Sections 7.2.1 and 7.2.2 and their respective Tables evidence significant differences but also
close similarities between the statistics for the sectors. This evidence of similarities is a
contrast to the researcher’s expectation. To identify the reasons for the similarities across the
sectors, a 15-minutes interview with 4 respondents (2 from industry sector, and 1 each from
service sector, and banking and financial service sector), randomly selected from the survey
respondents, was conducted.
In the interviews, the researcher first summarised the findings of the study to the interviewees,
pinpointing the key findings concerning the factors that influence the usage of SMAU, and
Organisations Performance (Financial and Nonfinancial). Following that, the researcher
communicated the findings of the variables for each sector to the respondents to confirm that
the results reflect their perception. After confirming this, the researcher tried to understand
from the respondents what they think might be the reason why other sectors might perceive
these variables the same way. Specifically, attention was drawn to the fact that there were no
significant differences between the groups (sectors) for the SMAU-Costing, Perceived
Environmental Uncertainty-Competitive Intensity, Organisational Structure-Formalisation
and Organisational Structure-Decentralisation variables.
From the evidence gathered from the interviews, the interviewees were surprised that the
responses for the four (4) variables were similar across the sectors. Three of the interviewees
(2 from industry sector, and 1 from service sector) suggested that national culture and
influence of Islamic norms might be influencing the operational dynamics in the explored
sectors. It seems therefore right to conclude that these two factors might play a
moderating/mediating role on how the contingency dynamics play out in the explored
geographical context (See Section 7.4.1) for more clarifications.

Chapter 7: Regression Analyses, Statistical Assessment of Hypothesesand Discussion of Findings
Jafar Ojra - 188 -
7.3 The Regression Results from this Study
In Chapter four (4), Table 4.1 outlined the twelve (12) hypotheses for this study. To examine
conceptualised relationships, regression analyses were undertaken. As reminded in Section
6.3.1, Figure 4.1 reflects three core dependent constructs, namely ‘Strategic Management
Accounting Techniques Usage (SMAU)’, ‘Organisational Structure (OSTR)’ and
‘Organisational Performance (OP)’. Therefore, the regression (linear) analyses were
conducted to estimate the association between conceptualised constructs and these dependent
variables.
The linear regression analyses were undertaken to check the estimates, confidence intervals,
model fit, R² change, colinearity diagnostics, and case wise diagnostics (outliers). The
regression statistics for the three dependent variable models are presented in Sections 7.3.1
Strategic Management Accounting Techniques Usage (SMAU), 7.3.2 Organisational
Performance (OP) and 7.3.3 Organisational Structure (OSTR).
To ensure the appropriateness of the linear regression coefficients, several diagnostic tests
were conducted. The influence diagnostics show that the coefficient estimates reported in
Figures 7.1 (Strategic Management Accounting Techniques Usage), 7.2 (Organisational
Performance-Financial), 7.3 (Organisational Performance-non-Financial) and 7.4
(Organisational Structure-Formalisation and Decentralisation) were not affected by outliers
(Cook, 1979; 1984). Based on the residual plots, the conclusions of normality and linearity are
appropriate (Draper & Smith, 1981; Field, 2005).
According to methodological tradition, all predictors in a model must be examined to ensure
that there is no multicollinearity threat. Field (2005) notes: “There should be no perfect linear
relationship between two or more of the predictors; i.e. the predictor variables should not
correlate too highly” (p.170). When there is a perfect collinearity (inter-correlation coefficient

Chapter 7: Regression Analyses, Statistical Assessment of Hypothesesand Discussion of Findings
Jafar Ojra - 189 -
of 1) between predictors, then there is no chance to obtain unique estimates of regression
coefficients (Field, 2005).
Therefore, this study followed Field (2005) and several multicollinearity checks were
conducted. As a first step, the correlation matrix was examined to find out the relationships
between predictors. No substantial correlations (R above .8 or .9) existed between the
predictors (Field, p 185) in this study (See Tables 6.12 and 6.14). Even for the SMAU
construct which contains five (5) first-order constructs (where expectedly close association
existed between these constructs), the highest correlation was .644 (between SMAU-Planning,
Control and Performance Measurement and SMAU-Costing). Based on these facts, it is right
to conclude that there is neither multicollinearity threat nor a threat of the validity of the
multiple regression analysis.
Also, to check for multicollinearity, sensitivity analysis was conducted to investigate the
significance of influence of the inter-construct-correlation in the multi-variable regression
analysis. According to Belsley et al. (1980), there exists a multicolinearity threat if an
estimated coefficient with a condition index higher than 20 contributes strongly to the
variances of two or more variables. This is not the case in this study: as Tables 7.3
(Dependent variable – SMAU), and 7.4 (Dependent variable – Organisational Performance
OP) show, the condition index achieved for all independent variables in the multivariate
regression analysis was far less than the aforementioned benchmark.
The third and final step taken to ensure that the regression results are free from
multicolinearity threat included: (a) examination of the Variance inflation factor (VIF) to
identify possible strong linear relationship between predictors, the results (See Table 7.10 and
7.11) showed that no relationship had a value close to 10 (Myers, 1990), thus that was no

Chapter 7: Regression Analyses, Statistical Assessment of Hypothesesand Discussion of Findings
Jafar Ojra - 190 -
multicollinearity threat; also, (b) the tolerance statistics (1/VIF) measure above .2 (Menard,
1995), evidence that further supports non-collinearity.
Finally, the inter-construct correlation evidence support the collinearity diagnostics reported
in Tables 7.3 and 7.4. The inter-construct correlation results for all dependent variables,
namely SMAU (Table 7.5), ORGPERFNONFIN (Table 7.6) and ORGPERFFIN (Table 7.7)
are uniform.
Table 7.3: Collinearity Diagnostics For Dependent Variable (SMAU)
Dimension Eigen-
value
Cond.
Index
Variance Proportion of the Estimate accounted for by the variable
PEUCOMPINT ORGSTRFOR
M
PEUMKTTUR
B
ORGSTRDCE
NT
ORGTEC
H
1 1.304 1.000 .21 .05 .20 .27 .01
2 1.120 1.079 .11 .33 .00 .00 .42
3 1.054 1.112 .00 .25 .29 .14 .22
4 1.000 1.142 .00 .00 .00 .00 .00
5 .821 1.260 .67 .02 .23 .17 .07
6 .701 1.364 .00 .35 .29 .43 .29
Table 7.4: Collinearity Diagnostics For Dependent Variable (OP)
Dimensi
on
Eigen-
value
Cond.
Index
Variance Proportion of the Estimate accounted for by the variable
PEUCOMPIN
T
ORGSTRFORM PEUMKTTUR
B
ORGSTRDCEN
T
SMAU
Total
1 1.509 1.000 .00
.28
.15
.00
.42
.00
.14
.01 .20 .02 .16
2 1.259 1.095 .05 .02 .30 .06
3 1.069 1.188 .61 .07 .05 .01
4 1.000 1.228 .00 .00 .00 .00
5 .778 1.392 .22 .01 .45 .10
6 .747 1.421 .04 .01 .10 .63
7 .638 1.537 .08 .69 .08 .05

Chapter 7: Regression Analyses, Statistical Assessment of Hypothesesand Discussion of Findings
Jafar Ojra - 191 -
Table 7.5: Inter-Constructs Correlation For Dependent Variable (SMAU)
Constructs SMAUTotal PEUCOMPINT ORGSTRFORM PEUMKTTURB ORGSTRDCENT ORGTECH
SMAUTotal 1.000
PEUCOMPINT -.082 1.000
ORGSTRFORM .032 -.013 1.000
PEUMKTTURB -.214 -.142 .035 1.000
ORGSTRDCENT -.027 .158 .151 -.132 1.000
ORGTECH .365 -.042 .107 -.112 -.058 1.000
SMAU=strategic management accounting techniques usage. PEUCOMPINT=perceived environmental uncertainty-
competitive intensity. ORGSTRFORM=organisational structure-formalisation. PEUMKTTURB=perceived environmental
uncertainty-market turbulence. ORGSTRDCENT=organisational structure-decentralisation. ORGTECH= organisational
Technology.
Table 7.6: Inter-Construct Correlation For Dependent Variable (ORGPERFNONFIN)
Constructs ORGPERFNONF PEUCOMPINT ORGSTRFORM PEUMKTTURB ORGSTRDCEN
T
SMAUTotal
ORGPERFNONF 1.000
PEUCOMPINT .096 1.000
ORGSTRFORM -.105 -.013 1.000
PEUMKTTURB -.201 -.142 .035 1.000
ORGSTRDCENT -.043 .158 .151 -.132 1.000
SMAUTotal .538 -.082 .032 -.214 -.027 1.000
ORGPERFNONF=organisational performance-non-financial. PEUCOMPINT=perceived environmental uncertainty-
competitive intensity. ORGSTRFORM=organisational structure-formalisation. PEUMKTTURB=perceived environmental
uncertainty-market turbulence. ORGSTRDCENT=organisational structure-decentralisation. SMAU=strategic management
accounting techniques usage.
Table 7.7:Inter-Construct Correlation For Dependent Variable (ORGPERFFIN)
Constructs ORGPERFFI
N
PEUCOMPINT ORGSTRFORM PEUMKTTURB ORGSTRDCEN
T
SMAUTotal
ORGPERFFIN 1.000
PEUCOMPINT -.125 1.000
ORGSTRFORM .010 -.013 1.000
PEUMKTTURB -.070 -.142 .035 1.000
ORGSTRDCENT -.141 .158 .151 -.132 1.000
SMAUTotal .029 -.082 .032 -.214 -.027 1.000
ORGPERFFIN=organisational performance-financial. PEUCOMPINT=perceived environmental uncertainty-competitive
intensity. ORGSTRFORM=organisational structure-formalisation. PEUMKTTURB=perceived environmental uncertainty-
market turbulence. ORGSTRDCENT=organisational structure-decentralisation. SMAU=strategic management accounting
techniques usage.

Chapter 7: Regression Analyses, Statistical Assessment of Hypothesesand Discussion of Findings
Jafar Ojra - 192 -
7.3.1 Regression Analysis Results: Dependent Variable – Strategic Management
Accounting Techniques Usage (SMAU)
The regression results are summarised in Figures 7.1 (SMAU) below. The results show the R²,
Adjusted R², and Regression F-Value. Also, the regression coefficient (β), significance level
(.000), and t- statistics (t-value) for all independent factors are presented below.
As evident in Figure 7.1 above, two significant predictors of Strategic Management
Accounting Technique Usage in the explored companies were captured. While the statistical
results suggest that Perceived Environmental Uncertainty(PEU) has a negative influence on
the usage of these techniques, only the market turbulence (MARKTURB) dimension is
significant at (β = -.192; Sig. = .008; t-value = -2.675). Also, Organisational Technology
(ORGTECH) has a positive influence on the usage of SMAU. At (β = .338; Sig. = .000; t-
value = 4.759), this study suggests that high technological development associate favours the
*1 = Organisational Strategy (Defender/Prospector) and Organisational Size, which were measured each by one item, were not included in the multivariate regression analysis. These two predictors are categorical; therefore their predicting influence on SMAU was estimated differently, as explained below. a. Correlation is significant at the 0.001 level (2-tailed), b. Correlation is significant at the 0.01 level (2-tailed).
Figure 7.1: The Regression Results for Strategic Management Accounting Techniques Usage (SMAU)
SMAU α = .77 R² Adj. R² Reg. F-Val. .172.1487.086(.000)
PEU-COMPINT
α = .86 β = -.091; Sig. = (.201); t-value = -1.283
PEU-MARKTURB
α = .85 β = -.192b; Sig. = (.008); t-value = -2.675
OSTR-FORM
α = .91 β = .005; Sig. = (.948); t-value = .066
OSTR-DCENT
α = .78 β = -.019; Sig. = (.788); t-value = -.269
ORGTECH
α = .70 β = .338a; Sig. = (.000); t-value = 4.759
ORGSTRAT See*1
ORGSIZE See *1

Chapter 7: Regression Analyses, Statistical Assessment of Hypothesesand Discussion of Findings
Jafar Ojra - 193 -
usage of strategic management accounting tools. Though not significant, the statistics for
Organisational Structure-Decentralisation (OSTR-DCENT) suggests that decentralisation
might have a negative influence on the usage of SMAU.
The results of the examination of the influence of these independent factors on the five first-
order constructs of SMAU are summarised in Table 7.9. The results show that Organisational
Technology (ORGTECH) is a highly predicting factor of the usage of the individual SMAU
models. ORGTECH has a highly positive association to the five SMAU factors. On the other
hand, Market Turbulence (MARKTTURB) has a significant negative influence on three
SMAU dimensions (SMAU-Costing, SMAU-Planning, Control and Performance
Measurement, and SMAU-Strategic Decision Making) but not on SMAU-Competitor
Accounting and SMAU-Customer Accounting. Competitive Intensity (COMPINT) has a
significant negative association to only SMAU-Planning, Control and Performance
Measurement, and SMAU-Strategic Decision Making.
The influence of the two categorical factors organisational size (ORGSIZE) and
organisational strategy (ORGSTRAT) on strategic management accounting usage
(SMAUtotal) was also examined. The results show significant coefficients for both ORGSIZE
and ORGSTRAT.
Empirically, this study suggests that larger organisations tend to use more strategic
management accounting techniques than smaller ones. Also, the evidence from this study
suggests that organisations that favour prospector type strategies would have more need for
strategic management accounting techniques than defender type organisations.
,

Chapter 7: Regression Analyses, Statistical Assessment of Hypothesesand Discussion of Findings
Jafar Ojra - 194 -
7.3.2 Regression Analysis Results: Dependent Variable – Organisational Performance
(OP)
As reminded in Section 6.3.1.3, two dimensions of organisational performance were
examined in this study. Therefore, regression analyses were undertaken for Organisational
Performance (Financial) and Organisational Performance (Non-Financial). The
regression results are summarised in Figures 7.2 (for the former) and 7.3 (for the latter). The
results show the R², Adjusted R², and Regression F-Value. Also, the regression coefficient (β),
significance level (.000), and t- statistics (t-value) for all independent factors are presented.
Statistically, no significant predictor of organisational performance-financial
(ORGPERFFIN) was found in the data for the study. One marginally insignificant predictor
was captured in the data: a marginally insignificant association was also found for
*1 = Organisational Strategy (Defender/Prospector), which was measured by one item, was not included in the multivariate regression analysis. This predictor is categorical; therefore its predicting influence on ORGPERFFIN was estimated differently, as explained below. a. Correlation is significant at the 0.001 level (2-tailed), b. Correlation is significant at the 0.01 level (2-tailed).
Figure 7.2: The Regression Results for Organisational Performance-Financial (ORGPERFFIN)
ORGPERFFIN α = .87 R² Adj. R² Reg. F-Val. .061.0271.809(.100)
PEU-COMPINT
α = .86 β = -.107; Sig. = (.169); t-value = -1.382
PEU-MARKTURB
α = .85 β = -.073; Sig. = (.370); t-value = -.898
OSTR-FORM
α = .91 β = .027; Sig. = (.724); t-value = .354
OSTR-DCENT
α = .78 β = -.139; Sig. = (.074); t-value = -1.799
SMAU
α = .77 β = .036; Sig. = (.645); t-value = -.462
ORGSTRAT See*1

Chapter 7: Regression Analyses, Statistical Assessment of Hypothesesand Discussion of Findings
Jafar Ojra - 195 -
organisational structure-decentralisation (OSTR-DCENT) at (β = -.139; Sig. = .074; t-value
= -1.799). There is however need to be very cautious in interpreting these statistical results,
considering the very low regression statistics of R² =.061, adjusted R² = .027 and regression
F-value = 1.809 (.100).
The results for the categorical factor show that organisational strategy (ORGSTRAT), that is
whether a company is a defender or prospector type, does not shape the financial element of
organisational performance. So, this study did not find any evidence to suggest that prospector
type companies will perform better financially than defender type companies or vice versa.
The regression results for the organisational performance (non-financial) are summarised in
Figure 7.3 below.
*1 = Organisational Strategy (Defender/Prospector), which was measured by one item, was not included in the multivariate regression analysis. This predictor is categorical; therefore its predicting influence on ORGPERFNONFIN was estimated differently, as explained below. a. Correlation is significant at the 0.001 level (2-tailed), b. Correlation is significant at the 0.01 level (2-tailed).
Figure 7.3: The Regression Results for Organisational Peformance Non-Financial (ORGPERFNONFIN)
ORGPERFNONFIN α = .92 R² Adj. R² Reg. F-Val. .333.30913.998(.000)
PEU-COMPINT
α = .86 β = .129b; Sig. = (.049); t-value = 1.985
PEU-MARKTURB
α = .85 β = -.087;Sig. = (.203); t-value = -1.278
OSTR-FORM
α = .91 β = -.109; Sig. = (.092); t-value = -1.696
OSTR-DCENT
α = .78 β = -.043; Sig. = (.509); t-value = -.662
SMAU
α = .77 β = .550a; Sig. = (.000); t-value = 8.298
ORGSTRAT See*1

Chapter 7: Regression Analyses, Statistical Assessment of Hypothesesand Discussion of Findings
Jafar Ojra - 196 -
The regression analysis summary evidence strong statistical estimates (R² = .333, adjusted
R²= .309, and Regression F-value of 13.998 (.000)) for this model. From the regression
analysis, two significant coefficients were found. Perceived environmental uncertainty-
competitive intensity (COMPINT) has a positive influence on organisational performance-
non-financial (ORGPERFNONFIN) at (β = .129; Sig. = .049; t-value = 1.985).
Also, SMAU has a positive association to organisational performance-non-financial
(ORGPERFNONFIN) at (β = .550; Sig. = .000; t-value = 8.298). At (β = - .109; Sig. = .092;
t-value = -1.696), organisational structure-formalisation (OSTR-FORM) has a marginally
insignificant negative influence on organisational performance-non-financial
(ORGPERFNONFIN).
The examination of the descriptive evidence for organisational strategy (ORGSTRAT) in
connection with organisational performance-non-financial (ORGPERFNONFIN) indicates
that prospector type companies would achieve higher levels of organisational performance-
non-financial (ORGPERFNONFIN) than defender type companies.
7.3.3 Regression Analysis Results: Dependent Variable – Organisational Structure
(OSTR)
The conceptualised relationships in relation to the dependent variable (Organisational
Structure) are summarised in Figure 7.4. That Figure contains two parts reflecting the two
dimensions of Organisational Structure, as conceptualised in this study. A correlation analysis
was used to identify the relationship between the Perceived Environmental Uncertainty
(PEU) predictors and the Organisational Structure dependent variables. In checking this
relationship between the independent and dependent variables emphasis was placed on
identifying the correlation coefficient (R), and significance level (.000).

Chapter 7: Regression Analyses, Statistical Assessment of Hypothesesand Discussion of Findings
Jafar Ojra - 197 -
The results of the 2-tailed correlation analysis conducted to examine Figure 7.4 are
summarised in Table 7.8. As that Table shows, the correlation influence of the two
dimensions of perceived environmental uncertainty varies. Perceived environmental
uncertainty-competitive intensity (PEUCOMPINT) does not have a significant influence on
organisational structure-formalisation (ORGSTR-FORM); neither does perceived
environmental uncertainty-market turbulence (PEUMARKTURB) have a significant
influence on organisational structure-formalisation (ORGSTR-FORM). On the other hand,
Perceived environmental uncertainty-competitive intensity (PEUCOMPINT) has a highly
significant correlation to organisational structure-decentralisation (ORGSTR-DCENT), and
perceived environmental uncertainty-market turbulence (PEUMARKTURB) has a
marginally insignificant correlation toorganisational structure-decentralisation (ORGSTR-
DCENT).
*1 = Organisational Strategy (Defender/Prospector), which was measured by one item, was not included in the multivariate regression analysis. This predictor is categorical; therefore its predicting influence on ORGSTR- FORM &DCENT was estimated differently.
Figure 7.4: The Regression Results for Organisational Structure (ORGSTR-FORM & DCENT)
ORGSTRFORM α = .91
PEU-COMPINT α = .86 β =-.013; Sig. = (.866)
PEU-MARKTURB
α = .85 β =.035; Sig. = (.643)
ORGSTRAT See *1
PEU-COMPINT
α = .86 β = .158a; Sig. = (.037)
PEU-MKTTURB
α = .85 β = - .132b; Sig. = (.083)
ORGSTRAT See*1
ORGSTRDCENT α = .78
Part 1 Part 2

Chapter 7: Regression Analyses, Statistical Assessment of Hypothesesand Discussion of Findings
Jafar Ojra - 198 -
Table 7.8: Bivariate Correlation of PEU (PEU-COMPINT & PEU-MARTURB) and ORGSTR
(ORGSTR-FORM & ORGSTR-DCENT) (n = 175)
Correlation Stats for ORGSTR-FORM Correlation Stats for ORGSTR-DCENT
PEU Variables
Pearson
Correlation
Sig. (2-tailed) Sum of Sqrs. &
Crossprdts
Pearson
Correlation
Sig. (2-tailed) Sum of Sqrs. &
Crossprdts
PEUCOMPINT
-.013 .866 -24.674 .158a .037 27.455
PEUMARKTURB .035 .643 6.138 -.132 .083 -22.896
a. Correlation is significant at the 0.05 level (2-tailed). b. Correlation is marginally insignificant at the 0.05 level
(2-tailed).
PEUCOMPINT=perceived environmental uncertainty-competitive intensity. ORGSTRFORM=organisational structure-
formalisation. PEUMKTTURB=perceived environmental uncertainty-market turbulence. ORGSTRDCENT=organisational
structure-decentralisation.
To determine the correlation coefficient and significance level for both organisational
structure-formalisation (ORGSTRFORM) and organisational structure-decentralisation
(ORGSTRDCENT), the data for both organisational structures were examined in tandem
with the data for organisational strategy (ORGSTRAT). From the emerging evidence,
prospector type companies tend to be less centralised in their decision making process, and
are less formalistic in their organisational patterns. On the other hand, defender type
companies favour centralised decision making and formalised organisational patterns.

Chapter 7: Regression Analyses, Statistical Assessment of Hypothesesand Discussion of Findings
Jafar Ojra - 199 -
7.3.4 The Relationship between Perceived Environmental Uncertainty (PEU) and
Organisational Strategy (OS)
Figure 7.5 conceptualised that the degree of perceived environmental uncertainty will
influence the extent to which organisations might be either defender or prospector in their
strategic approaches.
From the data for this study, organisations that indicated that their perceived competitive
intensity (COMPINT) and market turbulence (MARKTURB) were high showed features of
prospector type strategy. On the other hand, in organisations where perceived competitive
intensity (COMPINT) and market turbulence (MARKTURB) were perceived to be low,
such organisations reflected features of defender type strategy. From the evidence therefore, it
seems right to conclude that when the perceived environmental uncertainty is high,
organisations would follow the prospector strategy type.
In Sections 7.1 to 7.3 the findings from this study have been summarised. Next, the findings
from this study are discussed in Section 7.4.
Organisational Strategy (ORGSTRAT) Defender type Prospector type
Perceived Environmental Uncertainty (PEU) 1. PEU-Competitive Intensity 2. PEU-Market Turbulence
Figure 7.5: The Association between Perceived Environmental Uncertainty & Organisational Strategy

Chapter 7: Regression Analyses, Statistical Assessment of Hypothesesand Discussion of Findings
Jafar Ojra - 200 -
7.4 Discussion of Findings
In this section, the findings from this study are discussed. While the previous sections in this
chapter have shown overall results obtained from all multivariate regression and bivariate
correlation analyses, the discussion of results is focused towards explaining the results for the
conceptualised hypothetical relationships. Towards this target, the regression results for the
core dependent variables are summarised in Tables 7.9 (SMAU) and 7.10 (OP), while Table
7.11 summarises the results from the hypotheses testing, and pinpoints which hypotheses are
supported and which are not supported.
In discussing the findings from this study, three core steps are taken: first, the findings are
flagged; second the results are explained to pinpoint similarities or contrasts with previous
research; and third the theoretical explanation of the findings is undertaken. The discussion of
the findings from this study will be organised along hypothetical definitions for this study, as
mentioned earlier.
Prior to doing that however, one finding of this study (culture and Islamic rules) will be
discussed, as this finding might have a moderating/mediating influence on a number of other
findings. For this reasons, the discussion is undertaken in the following order:
Culture and Islamic influence on Contingency Dynamics (Section 7.4.1), the association
between Perceived Environmental Uncertainty and Organisational/Business Strategy (Section
7.4.2), the association between Perceived Environmental Uncertainty and Organisational
Structure (Section 7.4.3), the association between Perceived Environmental Uncertainty and
Organisational Performance (Section 7.4.4), the association between Perceived Environmental
Uncertainty and Strategic Management Accounting Usage (Section 7.4.5), the association
between Organisational Technology and Strategic Management Accounting Usage (Section

Chapter 7: Regression Analyses, Statistical Assessment of Hypothesesand Discussion of Findings
Jafar Ojra - 201 -
7.4.6), the association between Organisational Size and Strategic Management Accounting
Usage (Section 7.4.7).
Moreover, the association between Organisational Structure and Strategic Management
Accounting Usage (Section 7.4.8), the association between Organisational Structure and
Organisational Performance (Section 7.4.9), the association between Organisational/Business
Strategy and Strategic Management Accounting Usage (Section 7.4.10), the association
between Organisational/Business Strategy and Organisational Structure (Section 7.4.11), the
association between Organisational/Business Strategy and Organisational Performance
(Section 7.4.12), and the association between Strategic Management Accounting Usage and
Organisational Performance (Section 7.4.13

Chapter 7: Regression Analyses, Statistical Assessment of Hypothesesand Discussion of Findings
Jafar Ojra - 202 -
Table 7.9: Multivariable Regression: Coefficients & Significance Level: SMAU [Dimensions & Summation) (N = 175)
Variables SMAUCOSTING SMAUPlanCont SMAUSTRADM SMAUCOMPAC SMAUCUSTAC SMAU (Total) Collinearity Stats
Std. B Sig. Std. B Sig. Std. B Sig. Std. B Sig. Std. B Sig. Std. B Sig. Tolerance VIF
PEUCOMPINT .042 (.555) -.153 (.039) -.182 (.012) .073 (.346) -.121 (.114) -.091 (.201) .957 1.045
ORGSTRFORM .053 (.462) -.027 (.710) .092 .197 -.025 .745 -.080 (.293) .005 (.948) .958 1.044
PEUMKTTURB -.184 (.011) -.160 (.032) -.226 (.002) -.019 .809 -.100 (.191) -.192 (.008) .948 1.055
ORGSTRDCEN
T
-.054 (.460) -.024 (.743) -.004 (.958) .085 .274 -.071 (.359) -.019 (.788) .932 1.073
ORGTECH .331 (.000) .263 (.000) .281 (.000) .179 (.020) .160 (.036) .338 (.000) .965 1.037
R² .167 .125 .183 .045 .065 .172
Adjusted R² .142 .099 .159 .017 .037 .148
Regression F-
Value & Sig.
6.759 (.000) 4.839 (.000) 7.561 (.000) 1.586 (.167) 2.351 (.043) 7.086 (.000)
SMAU=strategic management accounting techniques usage (costing; planning, control and performance measurement; strategic decision making; competitor accounting and customer accounting).
PEUCOMPINT=perceived environmental uncertainty-competitive intensity. ORGSTRFORM=organisational structure-formalisation. PEUMKTTURB=perceived environmental uncertainty-
market turbulence. ORGSTRDCENT=organisational structure-decentralisation. ORGTECH= organisational Technology.

Chapter 7: Regression Analyses, Statistical Assessment of Hypothesesand Discussion of Findings
Jafar Ojra - 203 -
Table 7.10: Multivariable Regression: Coefficients & Significance Level: Organisational Performance (Financial & Non-
Financial) (N = 175)
Variables ORGPERF
(FINANCIAL)
ORGPERF (NON-
FINANCIAL
Collinearity Stats
Std. B Sig. Std. B Sig. Tolerance VIF
SMAU (TOTAL) -.036 (.645) .550 .000 .903 1.108
PEUCOMPINT -.107 (.169) .129 (.049) .941 1.063
ORGSTRFORM .027 (.724) -.109 (.092) .969 1.032
PEUMKTTURB -.073 (.370) -.087 (.203) .856 1.168
ORGSTRDCENT -.139 (.074) -.043 (.509) .936 1.069
R² .061 .333
Adjusted R² .027 .309
Regression F-Value & Sig. 1.809 (.100) 13.998 (.000)

Chapter 7: Regression Analyses, Statistical Assessment of Hypothesesand Discussion of Findings
Jafar Ojra - 204 -
Table 7.11: A Summary of the Results of the Hypotheses Testing
Hyp.
NR
Description of Hypotheses Supported/
Not Supported
H1 Perceived environmental uncertainty would be greater in
prospector-strategy than defender-strategy among Palestinian
Companies
Supported
H2 Perceived higher environmental uncertainty leads to a more
decentralised structure in Palestinian Companies
Partially Supported
Yes for
PEUCOMPINT,
No for
PEUMARKTURB
H3 Perceived higher environmental uncertainty would lead to increased
use of non-financial performance by Palestinian Companies
Partially Supported
Yes for
PEUCOMPINT,
No for
PEUMARKTURB
H4 The perceived higher environmental uncertainty will lead to higher
SMA-techniques usage in Palestinian Companies
Not Supported
Rather higher levels
of
PEUMARKTURB
lead to lower usage of
SMAU&MAU
H5 Perceived higher level of information and communication
technology would lead to higher SMA usage in Palestinian
Companies
Supported
For SMAU&MAU
H6 SMA Usage will be greater in larger than in smaller Palestinian
Companies
Supported
H7 The perceived organisational structure (less formalisation, more
decentralisation) would lead to a higher level of SMA-techniques
usage in Palestinian Companies
Not Supported
H8 The perceived organisational structure (less formalisation, more
decentralisation) would lead to a higher level of performance in
Palestinian Companies
Not Supported
H9 SMA Techniques would be more widely adopted in prospector than
defender Palestinian Companies
Supported
H10 Prospector -strategy would lead to more decentralised structure
than defender-strategy among Palestinian Companies
Supported
H11 Prospector strategy will lead to higher performance than defender
strategy in Palestinian Companies
Partially Supported
No for
ORGPERFFIN,
Yes for
ORGPERFNONFIN
H12 Greater SMA usage is positively associated with performance in
Palestinian Companies.
Partially Supported
No for
ORGPERFFIN,
Yes for
ORGPERFNONFIN

Chapter 7: Regression Analyses, Statistical Assessment of Hypothesesand Discussion of Findings
Jafar Ojra - 205 -
7.4.1 Culture and Islamic Influence on Contingency Dynamics
One core insight that emerged from this study relates to the role of national culture, shaped by
Islamic influence and guidelines, on the way that the contingency dynamics shape out in the
explored geographical context.
As explained in Sections 7.2.1 and 7.2.2, there were some items where there were no
significant differences in the group (sector) responses; evidence that was further explored
using the interview tool. Based on the interview results, it seems right to suggest that national
culture and Islamic Sharia regulations might moderate/mediate the extent of influence of the
contingency factors in explored Palestinian companies, a conclusion that connects to the
notion suggested by Hopper et al. (2009).
In that paper, based on a desk study of existing literature, Hopper et al (2009) argue that there
is an interplay of MASs and cultural, economic and political context. This insight concerning
influence of national culture lends support to the evidence in Kattan et al (2007) study of
Palestinian and less developed countries (LDC) firms that suggest that, among others, cultural
factors shape the contingency about management accounting design and implementation.
On the dual point of culture and regulation, the insights from this present study find support in
Hopper (2000) and Waweru et al (2004): Hopper (2000) underlines the importance of cultural
factors and regulations in understanding the contingency perspective on management
accounting in LDC firms, while Waweru et al (2004) found that reform policy (regulation)
influences management accounting practices in four participating South African organisations.
Secondly, when the statistical results for ORGPERFIN and ORGPERFNONF are compared
(See for example, Figures 7.2 and 7.3) there is the indication that explored companies give

Chapter 7: Regression Analyses, Statistical Assessment of Hypothesesand Discussion of Findings
Jafar Ojra - 206 -
more attention to non-financial organisational performance, a finding that reflects similarity
with the evidence in Köseoglu's (2013) study of Turkish companies.
Strategic decision making process literature (Elbanna, 2003) suggests that the influence of
Arab culture and Islamic guidelines made organisations to be very conscious of non-financial
dimensions of organisational performance. Further on the non-financial performance evidence,
it seems customer satisfaction is a major non-financial performance feature of Arab nations
(See also Köseoglu, 2013). Based on the evidence, it seems logical to conclude that
Palestinian companies are displaying the same organisational performance behaviour, due to
the influence of national culture and Islamic guidelines.

Chapter 7: Regression Analyses, Statistical Assessment of Hypothesesand Discussion of Findings
Jafar Ojra - 207 -
7.4.2 The association between Perceived Environmental Uncertainty and
Organisational/Business Strategy
The first hypothesis of this study is specified below:
H1: Perceived environmental uncertainty would be greater in prospector-strategy than
defender-strategy among Palestinian Companies
According to strategic decision making literature (e.g., Hitt & Tyler, 1991; Rajagopalan et al.,
1993: Brouthers et al., 2000), managers must analyse the external and internal environments
of their organisations, to enable them identify the external opportunities and threats and
internal strengths and weaknesses. Within this foundation, the external control perspective
(e.g., Romanelli & Tushman, 1986, cited in Hitt & Tyler, 1991, p.327) argues that strategic
decisions are largely constrained by external environment.
According to decision complexity viewpoint (e.g., Covin & Slevin, 1991; Gartner et al., 1992),
in highly uncertain environments, organisations tend to show more openness to risk-taking, a
behaviour that fits a prospector strategy of organisations.
The findings from this study of Palestinian companies provide support for the aforementioned
contingency foundations (e.g., Romanelli & Tushman, 1986; Covin & Slevin, 1991; Gartner
et al., 1992): the comparative evidence showed that for companies that reflected prospector
strategy features, their perceived environmental uncertainty was higher than that of the
defender strategy type.
Moreover, this study provides support for Tuan Mat (2010) which founds that environmental
uncertainty (competitive intensity) has a positive association to the strategic orientation of an
organisation. Explained in line with the organic and mechanistic typologies of organisational
structure (Burns & Stalker, 1961), this study also supports Gibbons & O'Connor (2005) who
found that organic structured firms tend to follow a strategic process that is incremental and
emergent, strategic process elements that characterise prospector type of strategy.

Chapter 7: Regression Analyses, Statistical Assessment of Hypothesesand Discussion of Findings
Jafar Ojra - 208 -
For the prospector strategy type of companies, there were evidence of dynamic competition,
need to respond swiftly to market needs, and a wide range of environmental and market
information, evidence that lends support to the notion that organisations would align their
strategic orientation to the environment uncertainty as a way of keeping competitive (Tuan
Mat, 2010).
Analysing the external environment of organisations, Porter (1980) noted that while a firm's
relevant environment includes both social and economic forces, the major aspect of the
environment is the industry(ies) in which a firm competes (cited in Hitt & Tyler, 1991, p. 330).
Porter (1980) underlined further that the industry structure strongly influences the competitive
rules in the industry and therefore firm's strategies. The measurement instrument for
perceived environmental uncertainty in this study included mainly industry structure features,
evidence that supports the literature that pinpoints these measures as core measures of
environmental uncertainty in organisations (e.g., Porter, 1980; Rajagopalan et al., 1993; Hitt
& Tyler, 1991; Brouthers et al., 2000; Tuan Mat, 2010).
Further strategic management research (cited in Brouthers et al., 2000, p.865) suggests that
different levels of strategic aggressiveness are necessary: (1) at different levels of
environmental turbulence; (2) to match different entrepreneurial styles; and (3) to address
differing organisational structures (e.g., Naman & Slevin, 1993; Slevin & Covin, 1997).
These scholars suggest that higher levels of turbulence, entrepreneurial style and
organisational structure will prompt higher levels of strategic aggressiveness from managers.
Explaining the findings from this study in these contexts, the findings from this study that
higher environmental uncertainty leads to prospector strategy approach supports these studies.
Furthermore, taking into consideration the measurement instrument for perceived
environmental uncertainty in this study, this study supports the three dimensional

Chapter 7: Regression Analyses, Statistical Assessment of Hypothesesand Discussion of Findings
Jafar Ojra - 209 -
contextualisation of what Naman & Slevin (1993) call 'Entrepreneurial style', which includes
"the willingness to take business risks, the willingness to be proactive when competing with
other firms and the willingness to innovate" (p.143). Finally, this study supports the notion
that organisations would align their strategic focus to environmental uncertainty changes in
order to remain competitive (Tuan Mat, 2010).
7.4.3 The association between Perceived Environmental Uncertainty and Organisational
Structure
According to strategic literature, the extent to which an organisation achieves strategic
effectiveness will depend upon the amount of fit between structural and environmental
variables (e.g., Shenhar, 2001; Heiens & Pleshko, 2011). In other words, the nature of the
external environment (i.e., whether certain or uncertain) will influence the organisational
structure adopted by the firm. Consistent with that logic, this study expected some association
between perceived environmental uncertainty and organisational structure. Concerning the
association between perceived environmental uncertainty and organisational structure, this
study hypothesised as below:
H2: Perceived higher environmental uncertainty leads to a more decentralised structure in
Palestinian Companies
The findings from this present study suggest a partial support for H2. The regression
coefficients (See Table 7.8) suggest that higher competitive intensity (COMPINT)
contributes to higher decentralised organisational systems, but higher market turbulence
(MARKTURB) does not account for higher decentralised organisational systems. A closer
look at the statistical results for MARKTURB shows that the regression coefficient is only
marginally insignificant at (P = .08), statistical evidence that might suggest that
MARKTURB might actually be a predictor of decentralised organisational systems.
Chapter 7: Regression Analyses, Statistical Assessment of Hypothesesand Discussion of Findings
Jafar Ojra - 210 -
The empirical findings from this study provide support and contrasts to existing literature.
Jusoh (2010) suggests that perceived environmental uncertainty (PEU) has a negative
significant influence on the use of internal processes measures. Jusoh (2010) identified three
types of internal process measures, one of which she described as 'efficiency-related type of
information', a description that fits the conceptual positioning of decentralisation in this study
as a tool for efficient use of information. This present study contrasts with Jusoh (2010) who
found that perceived environment uncertainty has a negative association to internal process
measures.
Furthermore, this present study contrasts with Tuan Mat (2010) who found no significant
association between environmental uncertainty (competitive intensity) and organisational
structure. In other words, this study adds support to Waweru (2008) who found a strong
positive relationship between intensity of competition and organisational structure.
Even for the MARKTURB dimension of perceived environmental uncertainty, which
produced a marginally insignificant statistical evidence, possibly because of the low response
achieved, this study tends to support the notion that in turbulent and dynamic environments
organic structure are more suitable (Pugh et al., 1969; Child, 1972). This finding is in
agreement with Hwang (2005) who argued that market turbulence did not influence
formalisation.
Explaining the findings, this study indicates that when there is intense competition,
organisations would have to embrace appropriate strategies of responding to the prevailing
competition in order to survive in the marketplace. For that target, organisations favour a
decentralised organisational system, as this would allow for swift decision making and
implementation. This finding supports the evidence in Hwang (2005).

Chapter 7: Regression Analyses, Statistical Assessment of Hypothesesand Discussion of Findings
Jafar Ojra - 211 -
Given the evidence that explored companies assign much importance to non-financial
performance (which reflects customer satisfaction, product/service quality, and development
of new product/services), this approach of decentralised organisational system is also rational,
as companies ensure that they keep pace with the level of competition and thereby achieve
their non-financial performance targets.
For the financial performance target, which is also important to the organisations, the
decentralised organisational system would enable the organisations to quickly and effectively
process information and respond appropriately to the competitive developments in the
industry, and thereby ensure that they meet their financial targets. This insight concerning
impact on financial performance adds support to past literature (e.g., Jusoh, 2010) which
suggests that perceived environmental uncertainty (PEU) is significantly associated with the
use of financial measures.
Overall, by this decentralised approach organisations are also able to take advantage of
opportunities. Furthermore, on the combined evidence for competitive intensity (COMPINT)
and market turbulence (MARKTURB) (minimally insignificant), it seems appropriate to
conclude that the state of the external environment of an organisation will exert considerable
influence on the organisational structure that the organisation adopts, a conclusion that is in
agreement with the traditional view of external environment of organisations (Pugh et al.,
1969).

Chapter 7: Regression Analyses, Statistical Assessment of Hypothesesand Discussion of Findings
Jafar Ojra - 212 -
7.4.4 The association between Perceived Environmental Uncertainty and Organisational
Performance
Contingency perspective on organisational performance suggests that the degree of
environmental uncertainty that an organisation experiences will influence its performance (e.g.
Chong & Chong, 1997; Ittner et al., 2003). In this study it was hypothesised that:
H3: Perceived higher environmental uncertainty would lead to increased use of non-
financial performance by Palestinian Companies
According to performance literature, organisations that combine both financial and non-
financial performance indicators would respond more appropriately to the dynamics of the
business environment than those that focus only on financial performance indicators (Ittner et
al., 2003; Hall, 2011). Further related literature (e.g., Chenhall & Morris, 1986; McManus,
2012) adds that managers need information that is related to the external environment, a
future orientation approach that is highly served by non-financial performance information,
they argued.
In this study, H3 hypothesised thus (Perceived higher environmental uncertainty would lead
to increased use of non-financial performance by Palestinian Companies). In discussing the
results concerning the hypothesised association between the variables, it is important to
pinpoint that explored companies accorded more importance to non-financial performance
(with mean values ranging from 5.011 to 5.320) than financial performance (with mean values
ranging from 4.537 to 4.914) (See Table 6.2). The statistical results from regression analyses
(See Table 7.10) reflect a partial support. While H3 is supported for the competitive intensity
(COMPINT) dimension of perceived environmental uncertainty, it is not supported for the
market turbulence (MARKTURB) dimension. To the contrary, statistical evidence in Table
7.10 indicates that although not significant in this study, increased market turbulence might
lead to decreased non-financial performance.
Chapter 7: Regression Analyses, Statistical Assessment of Hypothesesand Discussion of Findings
Jafar Ojra - 213 -
From the statistical regression evidence, this study suggests that the increased emphasis on
non-financial performance is driven by increasing competitive intensity. This finding supports
the view in Jusoh (2010, p.1981) who underlines "the importance of perceived environmental
uncertainty as a proxy for variables external to the organisation in explaining variations in the
choice of and extent of performance measures" (see also Gordon & Narayanan, 1984;
Chenhall & Morris, 1986). Thus, explored organisations are giving more attention to non-
financial performance as a way of responding to competitive pressure.
As Table 6.2 shows, non-financial performance was measured by three variables (customer
satisfaction, product/service quality and development of new products/services). Empirically,
it means the explored companies are paying more attention to the three variables than the
financial variables (return on investment, sales margin, capacity utilisation and market share)
in their drive to address competitive pressure. Based on this non-financial performance
evidence, this study supports the foundation that organisations which operate in conditions of
high environmental uncertainty tend to be more market oriented (Lonial & Raju, 2001).
The insights from this study provide further support (and contrasts) to existing literature. The
evidence of explored companies giving more attention to non-financial performance provides
support to the existening literatre (e.g., Ittner & Larcker, 1998; Govindarajan & Gupta, 1985;
Kaplan & Norton, 1992, 1996; Jusoh, 2010). An additional support to these scholars is the
evidence that customer satisfaction, product/service quality and development of new
products/services are core indicators of non-financial performance.
Furthermore, this study supports the notion that when organisations prioritise non-financial
performance, managers can better recognise changes in the business environment and
effectively deal with them (e.g., Kaplan & Norton, 1996). Furthermore, combining the
statistical evidence (factor and item means, and regression results), this study supports the

Chapter 7: Regression Analyses, Statistical Assessment of Hypothesesand Discussion of Findings
Jafar Ojra - 214 -
increasing notion that managers would better recognise changes in the environment and adopt
effective adapting strategies if they give more attention to non-financial performance
measurement tools (e.g., Kaplan & Norton, 1996; McManus, 2012).
Another support of this study to literature but on the point of financial performance, relates to
Jusoh (2010) which argues that perceived environmental uncertainty is significantly
associated with the use of financial performance. Further on the financial performance
contexts, though not significant in this present study, the negative coefficients for both
COMPINT and MARKTURB dimensions of organisational performance lend support to
past studies that suggest a negative relationship of perceived environmental uncertainty to
financial measure usage (e.g., Jusoh, 2010) which indicates that reliance on accounting
performance measures is low under high environmental uncertainty and vice versa. Thus, as
Govindarajan (1984) explained, organisations that face lower environmental uncertainty rely
heavily on financial data for their performance evaluation.
Finally, the finding in this present study that market turbulence (MARKTURB) would not
lead to increased focus on non-financial performance supports the evidence Köseoglu's (2013)
study of Turkish hospitality industry.

Chapter 7: Regression Analyses, Statistical Assessment of Hypothesesand Discussion of Findings
Jafar Ojra - 215 -
7.4.5 The association between Perceived Environmental Uncertainty and Strategic
Management Accounting Usage
It was proposed in this study that:
H4: The perceived higher environmental uncertainty will lead to higher SMA-techniques
usage in Palestinian Companies
Strategic management literature (Brouthers & Roozen, 1999) identified environmental
analysis as one of several “strategic functions” that can be aided by information provided by
strategic accounting system. Aligning to the evidence in that argument, this study expected
H4 (the perceived higher environmental uncertainty will lead to higher SMA-techniques
usage in Palestinian companies).
Based on the statistical results from this study, H4 is not supported. Therefore, this study
concludes that higher environmental uncertainties do not lead to higher usage of strategic
management accounting techniques in Palestinian companies. To the contrary, statistical
results suggest that higher levels of market turbulence (MARKTURB) would lead to lower
usage of SMAU (β = -.192b; Sig. = (.008); t-value = -2.675) & MAU (β = -.269a; Sig. =
(.000); t-value = -3.652).
The results from this study provide support as well as contrast to literature. This present study
contrasts Mia (1993) who, in a review of literature, suggests that the level of MAS
information would be significantly influenced by the perceived environmental uncertainty.
Further contrast of this present study is found in several other studies (e.g. Hoque & Hopper,
1997; Mia & Chenhall, 1994; Chong &Chong, 1997), who like Mia (1993), did not
distinguish the dimensions of environmental uncertainty.
On the point of support to literature, given the analogy and empirical evidence in Hoque
(2004) concerning the association between environmental uncertainty and organisational
performance and potential indirect influence of SMA techniques, it seems right to conclude

Chapter 7: Regression Analyses, Statistical Assessment of Hypothesesand Discussion of Findings
Jafar Ojra - 216 -
that this present study's findings that environmental uncertainty does not influence SMAU
connects to Hoque (2004). Furthermore, the empirical evidence for the competitive intensity
(COMPINT) dimension of perceived environmental uncertainty tallies with evidence in Tuan
Mat (2010) that reported non-significant results for the association between competitive
intensity and management accounting practices (MAP).
Also, the evidence of significant negative association of perceived environmental uncertainty-
market turbulence (PEUMARKTURB), SMAU supports the literature that managerial
decision making may often fall short of purely rational model (e.g., Haley & Stumpf, 1989,
cited in Busenitz & Barney, 1997, p.13).
To better explain the results of this study and in relation to the body of literature, the
association of the perceived environmental uncertainty to the dimensions of SMAU were
examined. Two positive associations were found. The data for this study suggests that in
organisations with high perceived environmental uncertainty, high competitive
intensity(COMPINT) leads to high Competitor Accounting Techniques Usage and high
Customer Accounting Techniques Usage. Also, the results show that in organisations with
high market turbulence (MARKTURB), the usage of Competitor Accounting Techniques
was high, evidence that high perceived market turbulence associates with high competitor
accounting usage. These dimensional evidences support recent literature in several ways:
(1) organisations are paying due attention to these (customer and competitor) tools as core
tools “for providing information for decision making involving the two main external factors
which influence the strategic success of the firm” (Cinquini & Tenucci, 2010, p.243), and (2)
the mean value for competitor cost assessment, which is above the mid-point of the scale,
supports the notion that competitor information plays a major role in company decisions
(Cinquini & Tenucci, 2010).

Chapter 7: Regression Analyses, Statistical Assessment of Hypothesesand Discussion of Findings
Jafar Ojra - 217 -
Combining the above two dimensional evidences, this study supports the notion of a strong
orientation towards the need for competitor information. In this regard, this study does not
only support Cinquini & Tenucci (2010) which studied Italian companies, but also other
studies, for example, Guilding et al (2000) which explored UK, USA and New Zealand
companies, Cravens & Guilding (2001) which explored USA companies, and Cadez &
Guilding (2007) which explored Slovenian and Australian companies. These studies underline
the importance of competitor position monitoring and performance appraisal.
Finally, both COMPINT and MARKTURB associate negatively to SMAU-Total.
Significance is found only for SMAU -Costing and SMAU-Planning, Control and
Performance Measurement (for COMPINT) and SMAU-Costing, SMAU- Planning, Control
and Performance Measurement and SMAU-Decision Making (for MARKTURB).
Based on the overall evidence (SMAU-Total + SMAU-Dimensions), this study supports
organisational scholars’ view that managerial decision making often falls short of the purely
rational model (e.g., Haley & Stumpf, 1989; Payne et al., 1992; Busenitz & Barney, 1997).
According to this view, under conditions of environmental uncertainty and complexity, more
comprehensive and cautions decision making is not possible; therefore “biases and heuristics
may provide an effective way to approximate the appropriate decisions” (Busenitz & Barney,
1997, p.10). In such conditions of environmental uncertainty and complexity, several factors
prevent purely rational decision making, including (1) high cost of such decision making
efforts (Simon, 1979), (2) information processing limits of decision makers (Abelson & Levy,
1985), (3) differences in decision making procedures adopted by managers (Shafer, 1986),
and (4) differences in the values of decision makers (Payne et al., 1992).

Chapter 7: Regression Analyses, Statistical Assessment of Hypothesesand Discussion of Findings
Jafar Ojra - 218 -
7.4.6 The association between Organisational Technology and Strategic Management
Accounting Usage
In the literature on contingency view of strategic management accounting techniques usage,
there is evidence that the degree of organisational technology influences the extent of strategic
management accounting usage (e.g. Haldma & Laats, 2002; Pondeville et al., 2013). To
contribute to knowledge on this context, this study draws from evidence in existing literature
and hypothesised that:
H5: Perceived higher level of information and communication technology would lead to
higher SMA usage in Palestinian Companies
Empirically, H5 is supported, and this study argues that higher levels of information and
communication technology would lead to higher SMA usage.
The empirical evidence of a positive association between information and communication
technology (ICT) and strategic management accounting usage (SMAU) in this present study
provides support but also contrasts with the existing literature. On the point of support,
evidence from this present study reinforces a contingency theory research of Estonian
companies. In that study of management accounting systems (MAS), Haldma & Lääts (2002)
found some evidence that changes in cost and management accounting practices are
associated with changes in the technology level of explored companies.
When the results from this study were compared against the studies conducted by Hyvönen
(and colleagues), both supportive and contrasting evidence were found. This study supports
Hyvönen et al (2003) which explored profitability management systems (PMS) at the division
headquarters and in one production site in Alfa , one of the world's largest paper producers
which is listed in the New York Stock Exchange(NYSE). Also, this study supports Hyvönen's
(2008) study of management accounting systems (MAS) in six Finnish companies.
Thus, both studies suggest that information technology (and manufacturing technology
(Hyvönen, 2008) positively associate to PMS and MAS respectively. In fact, explaining her

Chapter 7: Regression Analyses, Statistical Assessment of Hypothesesand Discussion of Findings
Jafar Ojra - 219 -
findings, Hyvönen (2008) notes: "information provides a necessary platform for firms to
develop their management accounting systems and strategy" (p.30), while Haldma & Lääts
(2002) comment that as the level of technology progresses, accounting system tends to be
more complex and complicated.
In their study of environmental management context, Pondeville et al (2013) hypothesised
that environmental information system, which collects, processes and stores information for
decision making, coordination and control (Laudon & Laudon, 2002), will be positively
associated with the development of a (formal and informal) environmental management
control system (EMCS). The results in Pondeville et al (2013) support the hypothesis, which
is, there is a strong positive link between the level of environmental information system and
the degree of environmental management control system, results that lend support to the
findings in this present study which combine information and communication technology
elements in its measurement. Finally, the evidence from this study finds support in Waweru et
al (2004) who argue that the degree of technological advancement has a positive impact on
the extent of change in management accounting practices.
Thus, this study contributes to the view that there are important links between information
technology and MAS/MCS/PMS/MAPs/SMAU, a notion that is further supported by other
MAS literature (e.g., Chapman & Chua, 2000; Ittner & Larcker, 2001; Chenhall, 2003) and
also insights on the influence of advanced manufacturing technology (AMT) on management
accounting practices (MAPs) (Tuan Mat, 2010).
However, On the other hand, as indicated earlier, the empirical evidence from this study
provides a contrast to the study of Hyvönen et al (2003) who suggest that this notion of
positive association between information technology and SMAU (PMS in their study) may
not hold in all circumstance. This line of logic is also shared by researchers on management

Chapter 7: Regression Analyses, Statistical Assessment of Hypothesesand Discussion of Findings
Jafar Ojra - 220 -
accounting control (MAC) (e.g. Waweru, 2008; Hyvönen, 2007). They suggest a significant
negative relationship between the level of technology and MAC; that is high reliance on
technology may hinder MAC.
The inspection of the statistical evidence for all four variables used to measure the degree of
information and communication technology showed that for all companies with high SMAU
(between 4 and 7) each of the variables were scored at either of ranks 5, 6 and 7, results that
suggest that this factor has a high positive association to the degree of SMAU. A closer
examination of the variables showed that OT3 (the accounting information system is
computer based) with almost 70% of the score (rank 6 and 7) reflecting SMAU levels of 5, 6
or 7.
To identify if any differences existed for each of the measurement variables based on the
dimensions of SMAU, the statistics for companies with high SMAU (dimensions) (≥4) were
examined. The statistical results showed a high level for each of the four variables for the
SMA-Planning, Control and Performance Measurement, Strategic Decision Making,
Customer Accounting and Competitor Accounting dimensions, thus warranting the
conclusion that higher levels of information and communication technology (ICT) will lead to
higher usage of these SMAU dimensions in explored Palestinian companies. From this
evidence, explored Palestinian companies give much attention to ICT as a way of ensuring
appropriate strategic decision making, customer orientation, competitive balance and costing,
planning and control.
On the overall evidence (SMAU- Total and dimensional), it seems right to conclude that
information technology will positively influence the degree of SMAU, evidence which adds
to financial services industry study (Shanmugam & Guru, 2003) that technology is a core part
of the operational activities of organisations. It is however also suggested that the magnitude

Chapter 7: Regression Analyses, Statistical Assessment of Hypothesesand Discussion of Findings
Jafar Ojra - 221 -
of influence might be influenced by the degree of organisational activity (Hyvönen et al.,
2003) and the contextualisation of information and communication technology.
7.4.7 The association between Organisational Size and Strategic Management
Accounting Usage
In the contingency literature, one factor that has been explored in relation to strategic
management accounting usage is organisational size. Researchers suggest that the extent of
strategic management accounting usage would depend on the organisation's size (e.g.,
Merchant, 1985; Gilding, 1999; Libby & Waterhouse, 1996). In this study, H6 was proposed:
H6: SMA Usage will be greater in larger than in smaller Palestinian Companies
Literature on the association of organisational size and strategic decision making suggests that
"individuals who start their own organisations are somehow different from those that work in
large organisations" (Busenitz & Barney, 1997, p.10). Further literature in this context
describes entrepreneurs as risk-takers (Begley & Boyd, 1987; McGrath et al., 1992) while
managers in large organisations are described as risk-averse (Amihud & Lev, 1981). Decision
complexity literature points two reasons for this risk behaviour difference: (1) decisions made
by entrepreneurs are made in a more uncertain environment than decisions made by managers
in large organisations, and (2) the decision-making context facing entrepreneurs are usually
more complex than that facing managers in large organisations (Covin & Slevin,1991;
Gartner et al.,1992).
Based on the above logic, it seems right to assume that organisations would be more risk-
takers in highly uncertain environments. Strategic management accounting aids strategic
decision making, and it is expected that strategic management accounting usage will be higher
in highly uncertain environments.
Therefore, this study hypothesised as defined earlier: Strategic Management Accounting
Usage will be higher in larger than in smaller Palestinian companies (Guilding, 1999; Libby

Chapter 7: Regression Analyses, Statistical Assessment of Hypothesesand Discussion of Findings
Jafar Ojra - 222 -
& Waterhouse, 1996), a hypothetical argument that found support in this study, as
summarised in Section 7.3.1. Thus, this study suggests that for Palestinian companies that fall
within the population for this study, higher usage of SMA is positively influenced by the size
of the organisation.
Explaining the findings from this study in relation to relevant studies in the domain of
contingency perspective of strategic management accounting, this insight offers support to a
number of studies, for example, Cadez & Guilding (2008) and Waweru (2008) who found
that SMA and MAC (respectively) usage is positively associated with organisational size.
Also, the evidence from this study supports Cinquini & Tenucci (2010) who suggest that
company size is positively related to both SMA performance orientation and positioning
variable of SMA usage. Furthermore, this study supports the evidence in the multinational
organisational context study conducted by Pierce & O'Dea (1998) who explained their finding
thus; multinational and large organisations have greater awareness of the substantial benefits
of these techniques.
On the other hand, the findings from this present study contrasts the evidence in the study of
Ezzamel (1990) which found no support for a positive association between organisational size
measured by the number of employees with budget characteristics. Further contrast to this
present study is found in Gosselin (1997) who argue that organisational size does not
influence the adoption of activity management tool. Finally, this present study also contrasts
the evidence in Hoque et al (2001) that suggests that business unit size (measured by sales
revenue) is not an important predictor of the balanced scorecard usage.
As a reminder, this study also examined this relationship along the various SMAU dimensions.
Section 7.3.1 reported a significant positive association between ORGSIZE and SMAU. The
examination of the association based on the dimensions showed that ORGSIZE has a positive

Chapter 7: Regression Analyses, Statistical Assessment of Hypothesesand Discussion of Findings
Jafar Ojra - 223 -
and significant association to the Strategic Decision Making, Customer Accounting and
Competitor Accounting dimensions of SMAU. These findings suggest that the larger the
ORGSIZE, the higher the level of the SMAU- STRATDECMAKING, CUSTACCTG, and
COMPACCTG. These findings lend support to the notion that as companies grow bigger;
they tend to give increasing attention to strategic success of the firm and with key focus on
customer and competitor information, in their strategic orientation (Cinquini & Tenicci, 2010)
in several ways.
On the overall evidence for this hypothetical relationship, this study argues that larger
organisations would have a higher need and use for strategic management accounting
techniques, a finding that is logical, as organisational dynamics increase as organisation grow
larger (e.g., Guilding, 1999). To effectively manage these increasing dynamics and adapt well
to the environment, the need for effective processing of strategic information increases, a
development that calls for increased use of strategic management accounting tools. The
importance of the usage of SMA to enable larger organisations to meet their increasing
challenges is underlined by the highly significant positive evidence found for SMAU (Total)
but also importantly by the evidence for the Strategic Decision Making, Customer Accounting,
and Competitor Accounting dimensions of SMA.
7.4.8 The association between Organisational Structure and Strategic Management
Accounting Usage
According to management accounting literature, today's organisations need management
accounting tools to enable them strategically adapt to rapidly changing organisational
environment (e.g., Shields & McEwen, 1996; Foster & Swenson, 1997; Libby & Waterhouse,
1996; Baines & Langfield-Smith, 2003; Cavalluzo & Ittner, 2004; Abernethy& Bouwnes,
2005; Emsley et al., 2006). These streams of scholars argue that with the appropriate strategic
management accounting tools, organisations can generate accurate and quality information

Chapter 7: Regression Analyses, Statistical Assessment of Hypothesesand Discussion of Findings
Jafar Ojra - 224 -
that allows decision makers to identify critical signals as to what is most important in their
daily operational activities.
Organisational structure is one primary factor in establishing the overall control system within
an organisation (Tuan Mat, 2010, p.38), and two core variables of organisational structure that
have been identified in organisational theory are formalisation and centralisation. Believing
that structural change is a means to helping organisations evolve (Tuan Mat, 2010).
This study combined relevant insight on these contexts (e.g. Cadez & Guilding, 2008; Hwang,
2005) concerning organisational structure and SMAU, and hypothesised that:
H7: The perceived organisational structure (less formalisation, more decentralisation)
would lead to a higher level of SMA-techniques usage in Palestinian Companies
The statistical evidence from this study indicates that H7 is not supported, meaning that if
organisational structure is less formalised and or more decentralised, this will not necessarily
influence the level of SMAU.
The study conducted by Abdel-Kader & Luther (2008) found that a decentralised
organisational structure will lead to a sophisticated management accounting system (MAS),
empirical evidence that does not find support in this study. The empirical evidence in this
present study concerning the decentralisation factor is surprising, given previous evidence that
firms confronted with high environmental uncertainty (as in this case, with high market
turbulence influence on SMAU) would require a decentralised organisational structure and
also a more sophisticated MAS (Abdel-Kader & Luther, 2008), as such a decentralised
approach would aid quick and effective strategic decision making, a managerial decision
making advantage that is further enhanced by sophisticated reports from MAS (Chong &
Chong, 1997) . A possible explanation of the outcome for this variable in this study might be
that the dual culture and Islamic regulation features of the Palestinian economy are having a
moderating/mediating effect on this relationship.

Chapter 7: Regression Analyses, Statistical Assessment of Hypothesesand Discussion of Findings
Jafar Ojra - 225 -
A further contrast of the findings from this study is found in the studies of Matejka & De
Waegenaere (2000) and Chenhall (2008). Matejka & De Waegenaere (2000) note that
centralised organisations are less likely to implement changes in their accounting systems
than decentralised ones, while Chenhall (2008) comments that accounting systems are
consistent with horizontal (or decentralised) organisations. Both groups of scholars are
supported by evidence from management accounting practices (MAPs) in Estonian
manufacturing companies which argues that MAPs are influenced by changes in the
organisational structure. Further contrast is provided by Waweru's (2008) empirical evidence
that there is a strong positive relationship between organisational structure (decentralisation)
and management accounting control (MAC). The advantage of this decentralised structure is
that it enables organisations identify strategic priorities that are customer-oriented and aid the
target of developing process efficiency and continuous improvement (Chenhall, 2008).
An interesting contrast to this present study is found in the study of Verbeeten (2010) who
found that decentralisation has a negative association with changes in the decision-influencing
components of management accounting control systems (MACS).
On the other hand, Gordon & Narayanan (1984) show a close support for this present study.
That study concludes that organisational structure was not significantly related to
management accounting systems (MAS). Rather, they suggest that MAS and organisational
structure are both functions of environmental uncertainty, a conclusion that found support in
the study conducted by Moores & Mula (1993).
Examining the findings from this study relative to Hwang's (2005) investigation of the
influence of formalisation and centralisation on respondents' satisfaction with store's
performance in Korean context, interesting insights emerged. While the empirical insights in
Hwang (2005) contrast the empirical evidence from this present study, it supports the logic

Chapter 7: Regression Analyses, Statistical Assessment of Hypothesesand Discussion of Findings
Jafar Ojra - 226 -
and conceptualised hypothesis for this present study. Thus, Hwang (2005) argues that less
formalisation and more decentralisation would positively impact on respondents' satisfaction
with store's performance.
As evident in Table 7.9, the statistical results for the dimensions of SMAU did not show any
significance, neither for formalisation nor for decentralisation. Thus, a conclusion that
organisational structure has no significant influence on SMAU in Palestine seems appropriate
(See Gordon & Narayanan, 1984; Moores & Mula, 1993); a conclusion that contrasts with the
view in Tuan Mat's (2010) investigation of management accounting practices (MAPs).
In line with team operations and process of empowerment literature, it seems Palestinian
organisations follow the notion that it is not ideal to delegate responsibilities, as such
empowerment places authority and responsibility at lower levels in the organisation. In
addition to the decentralisation effect, this may harm organisational structure (formalisation)
(Tuan Mat, 2010) and change employer and employee expectations, as well as increase access
to relevant information (Scott & Tiessen, 1999), particularly management accounting
information (Tuan Mat, 2010, p.40).
7.4.9 The association between Organisational Structure and Organisational
Performance
To enhance their performance, organisations must embrace appropriate organisational
structure (Hwang, 2005; Chenhall, 2008; Tuan Mat, 2010). In this bid to enhance the
understanding of how organisational structure would influence a firm's ability to profitably
satisfy the customer, increased research attention is being given to this issue. This study
hypothesised that:
H8: The perceived organisational structure (less formalisation, more decentralisation)
would lead to a higher level of performance in Palestinian Companies

Chapter 7: Regression Analyses, Statistical Assessment of Hypothesesand Discussion of Findings
Jafar Ojra - 227 -
Based on the statistical evidence from this study, H8 is not supported, meaning that (less
formalisation and more decentralisation) would not lead to a higher level of performance in
Palestinian companies. The statistical results show two levels of marginally insignificant
coefficients. At (β = -.139; Sig. = .074; t-value = 1.799), the t-statistics for decentralisation is
marginally below the 1.9 benchmark. This result in itself suggests that more decentralisation
may lead to lower levels of organisational performance (financial) of Palestinian companies.
Also, at (β = -.109; Sig. = .092; t-value = 1.696), the t-statistics for formalisation is marginally
below the benchmark of 1.9.
On the statistical evidence, this present study contrasts with a number of previous studies
concerning the association between organisational structure and organisational performance.
First, this present study contrasts with research on new business venture (Sandberg, 1986).
Further contrast is found in Negandhi & Reimann (1972) who argue that decentralisation is
positively related to effectiveness of Indian manufacturing companies, and also Tuan Mat
(2010) who found that organisational structure positively influences organisational
performance of Malaysian companies.
In the study of Korean retailing industry, Hwang (2005) examined respondents’ satisfaction
with store performance relative to (1) other stores in the industry and (2) key competitors.
While that study hypothesised that formalisation and centralisation will negatively affect
satisfaction with store performance relative (1) and (2), the empirical results suggest the
contrary. The evidence for decentralisation in this present study can be interpreted as a
support for Hwang (2005) concerning centralisation's influence on performance.
Statistically, marginal insignificance was achieved for both decentralisation and formalisation,
though negative direction for formalisation (which also supports the direction of influence
hypothesised in this study) and decentralisation. Based on these statistical results, it seems

Chapter 7: Regression Analyses, Statistical Assessment of Hypothesesand Discussion of Findings
Jafar Ojra - 228 -
very likely that (1) higher levels of decentralisation might lead to lower levels of
organisational performance (financial), and (2) higher levels of formalisation might lead to
lower levels of organisational performance (non-financial). Point (1) therefore contrasts the
study of Tse (1991) which found that higher decentralisation would lead to higher financial
performance. On the other hand, point (2) supports Wally & Baum (1994) who suggest
inverse correlation between formalisation and performance, but contrasts Tse (1991) which
suggests the opposite.
In addition to the above point that reminds of the marginal level of the statistical
insignificance of coefficients achieved in this present study, it is also reminded, as pinpointed
in Section 7.4.11, which discusses the association between business/organisational strategy
(prospector) and decentralisation, that the statistics for prospector strategy type of companies
when examined together with the relevant financial performance statistics, showed that the
prospector strategy combined with a fair level of decentralisation may contribute to enhancing
financial performance. This insight seems to suggest that decentralisation might indirectly
enhance organisational performance, through the strategy (prospector) factor.
The above conclusion of a likelihood indirect influence of decentralisation on organisational
performance connects to contingency insights concerning market orientation adoption (e.g.
Jaworski & Kohli, 1990; Harris, 2000; Pelham & Wilson, 1996). The explanation for this
indirect influence is that when organisations decentralise, they respond quickly and make
decisions that aid the strategic focus of the organisation in responding to changes in the
marketplace.

Chapter 7: Regression Analyses, Statistical Assessment of Hypothesesand Discussion of Findings
Jafar Ojra - 229 -
7.4.10 The association between Organisational/Business Strategy and Strategic
Management Accounting Usage
According to contingency studies investigating the use of managerial accounting systems (e.g.,
Govindarajan & Gupta, 1985; Cadez & Guilding, 2008; Cinquinin & tenucci, 2010;
Pondeville et al., 2013), a firm's strategy influences its nature and extent of (strategic)
management accounting usage. Following evidence in existing literature (See Section 4.3.3.1),
another hypothesis for this study stipulates that:
H9: SMA Techniques would be more widely adopted in prospector than defender
Palestinian Companies
In a strategic management perspective, Brouthers & Roozen (1999) identified “strategic
functions” that can be aided by information provided by a strategic accounting system. These
“strategic functions”, they noted, include, amongst others, environmental analysis and
“strategic alternative selection” (cited in Cinquini & Tenucci, 2010, p.230). It would seem
logical therefore to expect that strategic accounting system of an organisation would be
influenced by these strategic functions (e.g. Pondeville et al., 2013). On that logic, this study
hypothesised that strategic management accounting usage would be influenced by the strategy
(prospector or defender) of an organisation. Specifically, H9 expects SMA Techniques would
be more widely adopted in prospector than defender Palestinian companies.
The examination of the data for organisational strategy, which is a categorical variable, to
identify the correlation to SMAU (Total), showed that prospector type companies had a
higher usage of strategic management accounting techniques than defender type companies.
For prospector type companies, the mean value for SMAU (total) was 4.641. With this
evidence, H9 (SMA Techniques would be more widely adopted in prospector than defender
Palestinian companies) is supported, evidence that lends support to the study of Cadez &
Guilding (2008) that suggests that SMA usage is positively associated with adopting a
prospector strategy. Explained in line with innovation and learning literature, the findings

Chapter 7: Regression Analyses, Statistical Assessment of Hypothesesand Discussion of Findings
Jafar Ojra - 230 -
from this present study connects to the view that the use of innovation and learning measures
and balanced scorecard measures would be positively influenced by prospector strategy type
of behaviour (e.g., Jusoh, 2010). Further, this present study supports the logic in Jusoh (2010)
that business strategy sets the need for type of information. Therefore, since prospector
strategy is more flexible, firms that follow this strategy would prefer to use a broader range of
information.
Explaining the findings from this study in line with environmental management control
systems evidence, this study finds support in Pondeville et al. (2013) which suggests that a
firm's strategic posture has a positive link to its management control systems usage, a finding
which as they explained, stems from the fact that corporate environmental proactivity would
drive the development of environmental management control system (EMCS).
To identify whether there were any differences for the SMAU dimensions, the statistics for
each individual dimension was examined. The results showed that prospector type companies
gave much attention to four SMAU dimensions and with mean values above 4.600, namely
SMAU-Planning, Control and Performance Measurement (4.601), SMAU-Strategic Decision
Making (4.712), SMAU-Competitor Accounting (4.689) and SMAU-Customer Accounting
(4.734), statistical evidences that are much higher than the results for 'defender' type
companies. These findings support some findings in Cinquini & Tenucci (2010). Further
support of Cinquini & Tenucci (2010) is presented in this present study: 'defender' type
companies give more attention to the Costing dimension of SMAU. For 'defender' type
companies the factor means were 4.759 (SMAU-Costing) and 4.467 (SMAU-Planning,
Control and Performance Measurement).
Overall, the findings for the association between organisational strategy and SMAU (total and
dimensional) largely support previous research that suggests that 'prospector' type companies
tend to need more market information than 'defender' type companies (Shortel & Zajack, 1990;

Chapter 7: Regression Analyses, Statistical Assessment of Hypothesesand Discussion of Findings
Jafar Ojra - 231 -
Smith et al., 1989; Cinquinin & Tenucci, 2010). It must however be noted that SMAU-
Planning, Control and Performance Measurement seems to be highly used by both 'prospector'
(at factor mean of 4.601) and 'defender' (at factor mean of 4.759) type Palestinian companies.
On this evidence this study not only supports, but also contrasts past research (e.g., Guilding,
1999; Cinquini & Tenucci (2010): not only 'defender' type companies but also 'prospector'
type companies make greater usage of SMAU-Costing techniques, evidence that suggests that
both type of companies value the need for efficiency and cost control.
Moreover, the findings from this present study concerning the association organisational
strategy and SMA-techniques-Usage lend support to the view of a "loose coupling" between
SMA-technique typology and organisational strategy (Cinquini & Tenucci, 2010, p.250;
Gosselin, 1997; Langfield-Smith, 2007). This present study thus supports the view expressed
in the aforementioned studies which suggests that the same SMA-technique can support
different strategic approaches. On the statistical evidence from this present study, it seems
right to agree with Cinquini & Tenucci (2010) that different strategies may not clearly imply
different orientations in the adoption of SMA tools, therefore, they argue that more significant
determinants must be ascertained by exploring other variables.
Finally, based on the statistical evidence, this present study suggests that companies would
use aspects of different strategic typologies in different measures (Langfield-Smith, 2007) due
to the variability of external environment and company strategy (Cinquini & Tenucci, 2010).

Chapter 7: Regression Analyses, Statistical Assessment of Hypothesesand Discussion of Findings
Jafar Ojra - 232 -
7.4.11 The association between Organisational/Business Strategy and Organisational
Structure
Previous studies have explored the relationship between organisational strategy and
organisational structure (e.g., Covin & Slevin, 1989; Gibbons & O'Connor, 2005). This study
followed research precedence (e.g., Miller, 1987; Opute, 2009) and conceptualised
organisational structure to include formalisation and decentralisation. According to further
relevant literature (Burns & Stalker, 1961) that classifies organisational structure as either
mechanistic or organic, organisations that embrace organic structure tend to encourage
flexibility and decentralised decision making, and such tendencies also influence the strategic
orientation of firms (Glaister et al., 2008). Combining these organisational strategy and
organisational structure notions, this study hypothesised that:
H10: Prospector -strategy would lead to more decentralised structure than defender-
strategy among Palestinian Companies
According to Mintzberg (1979), organisational effectiveness results when there is a match
between organisation's strategy and its structure. The statistical findings for the association
between prospector/defender strategy and decentralised organisational structure were
summarised in section 7.3.3.
Empirically, this study found that firms that follow the prospector type of strategy exhibit
characteristics of decentralisation than defender type of companies. For prospector strategy
type of companies, the mean value for decentralisation was 5.231, while that for defender
strategy type of companies was 3.187. Thus, H10 is supported, and this study argues that
prospector-strategy would lead to more decentralised structure than defender-strategy.
Waweru (2008) found no significant positive relationship between strategy (low cost) and
decentralisation. The findings in this present study connect logically to why (low cost)
strategy would be positively associated to centralisation and not decentralisation.

Chapter 7: Regression Analyses, Statistical Assessment of Hypothesesand Discussion of Findings
Jafar Ojra - 233 -
Furthermore, the insight from this present study supports the studies of Hwang (2005) and
Kohli & Jaworski (1990) which argued that there is a positive relationship between
organisational strategy and organisational structure. It must however be borne in mind that
these scholars explored the association between market orientation strategy and organisational
structure. Further on this market orientation strategy context, this present study contrasts
Selnes et al (1996) who argued that neither centralisation nor formalisation is significantly
related to market orientation in Scandinavian companies.
Empirically, the finding in this present study makes sense: prospector companies are faced
with constant change in their product/service range, dynamic competition, wide range of
environmental and market information and enormous amount of pressure to respond to market
needs, in order to remain competitive in the market, unlike the case for defender type
companies. Therefore, prospector type companies value the need to act swiftly, process
information quickly and respond to changing market circumstances, an organisational
approach that requires a smooth and swift decision making process that is served by a
decentralised structure.
Considering the empirical evidence from this study about the influence of national culture and
Islamic Sharia regulation (See Section 7.4.1) and perceived environmental uncertainty (See
Section 7.4.4) on ensuring non-financial performance, which has a critical importance to the
explored organisations, this empirical evidence of a positive association between prospector
strategy and decentralisation seems logical.
When the decentralisation statistics for prospector strategy type of companies were examined
together with the relevant financial performance statistics, the results suggested that the
prospector strategy driven decentralisation contributed to enhancing financial performance.
Chapter 7: Regression Analyses, Statistical Assessment of Hypothesesand Discussion of Findings
Jafar Ojra - 234 -
7.4.12 The association between Organisational/Business Strategy and Organisational
Performance
According to existing literature (e.g., Dent, 1990; Govindarajan & Shank, 1992; Hope &
Hope, 1995), companies with different operating environments will differ in their strategic
initiative, and may therefore require different management information systems, in order to
enhance organisational performance. Based on this notion, it seems logical to assume that the
type of organisational strategy that a firm follows will influence its organisational
performance (Chong & Chong, 1997; Kwock, 1999; Davila, 2000; Köseoglu et al., 2013). As
explained in Section 4.3.3.3, this study hypothesised that:
H11: Prospector strategy will lead to higher performance than defender strategy in
Palestinian Companies
The statistical evidence for organisational performance (See Section 7.3.2) suggests that in
Palestinian companies’ prospector strategy will lead to higher organisational performance but
only for the non-financial dimension of performance. Explaining this finding, it means that in
their effort to maintain their prospector strategy target, explored companies give much
emphasis to the non-financial performance dimensions.
Thus, while ensuring that they achieve good levels of market share, return on investment,
capacity utilisation and sales margin, they perceive the non-financial performance of customer
satisfaction, product/service quality and development of new products/services are central to
the target of recognising and responding well to the changes in the business environment
(Kaplan & Norton, 1996).
Explained further in line with relevant literature, the emphasis of non-financial criteria over
financial criteria is more prominent in prospector firms than in defender firms because it is
very important for prospector firms to know what the customer wants and for the firm to
produce and market new products/services (Ittner et al., 1997; Hoque, 2004), a rationale that
Chapter 7: Regression Analyses, Statistical Assessment of Hypothesesand Discussion of Findings
Jafar Ojra - 235 -
is congruent with the logic that firms must identify relevant performance metrics that are
consistent with the strategy that is being followed (Hoque, 2004).
Empirically, the evidence of significant positive association between prospector strategy and
non-financial performance reinforces existing literature. It supports the Ittner et al (1997)
findings that greater weight was placed on non-financial performance measures in firms
following an 'innovation oriented' 'prospector' strategy than in firms following a 'defender'
strategy.
Furthermore, based on that statistical evidence, this study also supports the view that the use
of non-financial measures is a core antecedent of organisational performance (Hoque, 2004).
Furthermore, this evidence contributes to the view that organisations, due to their
circumstances might prioritise non-financial than financial performance to enable them
achieve the interest of higher customer service (Köseoglu, 2013).
Having said that, the evidence from this present study concerning H11 (Prospector strategy
will lead to higher performance than defender strategy in Palestinian Companies) contrasts
with Köseoglu (2013) who did not find a significant difference between the results for
defender and prospector strategy type companies.
Finally, and furthermore comparative to Hoque (2004) who examined both direct and indirect
effects of strategic priorities on organisational performance, this present study provides
support and contradiction. On the point of direct effect, this study found a significant effect of
strategic priority on organisational performance (prospector strategy will lead to higher
performance than defender strategy). This direct effect evidence is a contrast to Hoque (2004).
For the indirect effect, though not measured in this study, on the evidence of the inspection of
the statistics for both financial and non-financial performance dimension, it seems right to
conclude that this present study supports Hoque's (2004) findings of a significant indirect
Chapter 7: Regression Analyses, Statistical Assessment of Hypothesesand Discussion of Findings
Jafar Ojra - 236 -
effect of strategic priority on overall organisational performance acting through the use of
non-financial performance.
7.4.13 The association between Strategic Management Accounting Usage and
Organisational Performance
The literature indicates that there is an association between management accounting practices
and organisational performance (e.g. Chenhall & Langfield-Smith, 1998; Ittner & Larcker,
1995; Perera et al., 1997). This contingency perspective of management accounting suggests
that if organisations effectively align their MAS to their organisational and environmental
circumstances, they are likely to perform better (Chenhall, 2003, cited in Tuan Mat, 2010). In
this study of SMAU in Palestinian firms, the final hypothesis is that:
H12: Greater SMA usage is positively associated with performance in Palestinian
Companies
Strategic management literature (Brouthers & Roozen, 1999) identified “strategic functions”
than would benefit from strategic accounting information (See Section 7.4.10). In order to
optimize its strategic role, such information should be both internal and external; future
oriented and be mostly non-financial. The evidence from this study indicates that explored
companies give more attention to non-financial than financial performance metrics, an
evidence that supports the importance underlined by Routhers & Roozen (1999). Statistically
(See Table 7.10), strategic management accounting usage (SMAU) has a significant positive
association to organisational performance (ORGPERF-Non-Financial). On this evidence,
H12 is supported and this study argues that greater SMA usage will lead to increased non-
financial performance.
The first major support for the findings in this present study is found in Perera et al (1997)
who found a positive association between the various forms of management accounting
practices (MAPs) and the use of non-financial measures. In a more recent research, Laitinen

Chapter 7: Regression Analyses, Statistical Assessment of Hypothesesand Discussion of Findings
Jafar Ojra - 237 -
(2006) supports Perera et al (1997) and suggests that large changes in MAS may be associated
with good performance.
Believing the theoretical foundation that organisations that implement new MAS would
improve their decision making and firm performance, Tuan Mat (2010) expected a positive
association between management accounting practices (MAP) and organisational
performance, a proposition that was supported by empirical data for that study. Thus, this
present study also supports Tuan Mat (2010). This positive association is also reported in
Cadez & Guilding's (2008) examination of how SMA usage affects organisational
performance, and in the study of the relationship between MAS and organisational
performance (e.g. Govindarajan & Gupta, 1985; Simons, 1987; Kaplan & Norton, 1996).
Another support for this study is found in Baines & Langfield-Smith (2003) who reported that
a greater reliance on non-financial accounting information enhanced organisational
performance; and Chenhall & Langfield-Smith (1998) who found that greater use of advanced
management accounting practices (AMAP) enables high organisational performance.
It must be noted that Baines & Langfield-Smith (2003) qualifies the relationship of MAS to
performance as indirect, and suggests that other organisational factors feed into this influence,
a view that find support in further research (e.g. Haldma & Lääts, 2002; Hoque, 2004;
Hyvönen, 2007; Mia & Clarke, 1999), who maintain that organisational performance
outcomes depend on the extent of fit between the use of organisational systems and situational
factors. A similar view is shared by Govindarajan & Gupta (1985) and Kaplan & Norton
(1996) who argue that the positive association of MAS to performance is indirectly influenced
by the organisational strategy.
Thus, the explored companies are designing the management accounting and control systems
to support their goal of developing customer satisfaction (e.g., Ittner et al., 1997; Simons,

Chapter 7: Regression Analyses, Statistical Assessment of Hypothesesand Discussion of Findings
Jafar Ojra - 238 -
1990) and coping with product/service quality needs. This empirical evidence supports the
view in Hoque (2005) that, unlike the traditional performance measures (financial), non-
financial performance measures may be a more satisfactory reflection of firm performance in
today's ever changing business environment (see also, Hoque et al., 2001).
Furthermore, the evidence from this present study that greater SMA usage will lead to
increased non-financial performance tallies with the findings in Baines & Langfield-Smith
(2003) that suggests a significant association of organisational performance with increased
reliance on non-financial management accounting information, a logic which connects with
further logic that firms are embracing more non-financial performance measures as this
enables them cope well with environmental changes and enables them determine and evaluate
progress towards firms goals, and affirm achievement of performance (Kaplan & Norton,
1996).
An inspection of the statistics for the dimensions of SMAU showed that except for SMAU-
Costing, all other SMAU dimensions showed statistical results that support the conclusion
that the greater the SMA usage the greater the organisational performance (non-financial in
this case). This dimensional evidence lends support to Perera et al (1997) who suggest a
positive association between all forms of MAPs and the use of non-financial measures.
It is therefore concluded here that the explored Palestinian companies are making effective
use of the SMA techniques to improve their performance. Taking into consideration the
empirical evidence from a number of other contingency factors, it can be argued that the
achieved performance outcome is explained by the fact that the explored organisations are
fitting their SMA usage and levels with their environmental and organisational circumstances.

Chapter 7: Regression Analyses, Statistical Assessment of Hypothesesand Discussion of Findings
Jafar Ojra - 239 -
7.5 Conclusion to the Chapter
Figure 7.6 (in page 239) summarises the empirical conclusions from this study that examined
a contingency model of strategic management accounting usage (SMAU) and performance
(dimensions, magnitude and antecedents) in the Palestinian context. As evident in that Figure
(7.6), SMAU is significantly influenced by business (organisational) strategy, company
(organisational) size, and organisational technology. How much influence these factors have
on SMAU (and dimensions) depends on the features of these factors, as explained in the
relevant sections of chapter 7.
Also, Figure 7.6 presents the empirical evidence of factors that explain variance in the nature
and level of organisational performance. Figure 7.6 shows that whether and how much of
influence perceived environmental uncertainty, strategic management accounting usage
(SMAU) and business (organisational) strategy would individually have on the dimensions of
organisational performance will depend on the feature of these three factors. As empirically
too, as was the case for SMAU, organisational structure is not a significant antecedent of
organisational performance.
Further on the point of organisational structure, but as a dependent variable, Figure 7.6
pinpoints perceived environmental uncertainty and business (organisational) strategy as core
predicting factors of the nature and extent of organisational structure in the explored
companies.
Finally, Figure 7.6 shows that perceived environmental uncertainty significantly influences
the type of strategy that an organisation follows.
In discussing these findings, the supports and contradictions to existing literature were
pinpointed, towards showing how the empirical evidence from this study fits into the stream
of literature.

Chapter 7: Regression Analyses, Statistical Assessment of Hypothesesand Discussion of Findings
Jafar Ojra - 240 -
Further, in this regards, chapter 8 presents the main conclusions from this study, as well as
underline the theoretical and managerial implications of this study. To conclude, the
limitations of this study are pinpointed, and thereafter, the directions for future research are
outlined.

Chapter 7: Regression Analyses, Statistical Assessment of Hypothesesand Discussion of Findings
Jafar Ojra - 241 -
Figure 7.6: Graphical Presentation of Contingency Perspective of SMA Usage (and Organisational
Performance) in Palestinian Companies
SMAU (a)
SMAU-Costing SMAU-PlanContrPer SMAU-StratDecMaking SMAU-CompAccounting SMAU-CustAccounting
National Culture and Islamic Sharia Influence
Organisational Structure (c)
Formalisation Decentralisation
Organisational Performance (b) Financial Performance Non-Financial Performance
a: Strategic management accounting techniques are highly used in Palestinian companies, but dimension(s) and magnitude of use is influenced by features of the companies, e.g., strategy type, company (organisational) size, information and communication technology. Individually, organisational structure and perceived environment uncertainty do not influence SMAU. b: Organisational performance is positively influenced by perceived environmental uncertainty and business (organisational) strategy, but the extent of influence and organisational performance dimension is dependent on the dimensions of perceived environmental uncertainty and business (organisational) strategy. The same conditional influence applies for SMAU. Organisational structure does not influence organisational performance. c: Organisational structure is influenced by perceived environmental uncertaintyand business (organisational) strategy. Business (organisational) strategy (prospector/defender) is significantly influenced by perceived environmental uncertainty. Key: The dotted lines indicate a potency for a mediating/moderating influence of culture and Islamic regulations, NS = Not Supported, CI = Competitive Intensity, MT = Market Turbulence, FP = Financial Performance, and NFP = Non-Financial Performance
Moderating/Mediating Influence
Perceived environmental uncertainty
Business Strategy
Company / Organisational Size
Organisational Technology
+
+
+
NS +
NS +
+
NS - FP + - NFP
+ - CI NS - MT
NS
+

Chapter 8: The Study Conclusions, Contributions, Limitations & Future Research Directions
Jafar Ojra - 242 -
8. The study Conclusions, Contributions, Limitations and Future Research Directions
8.1 Introduction
In Chapter 7 the findings from this study were discussed, underlining the arguments that
emerged from this study, and also pinpointing similarities and contradictions to the body of
literature. In this Chapter (Eight) the main conclusions from this study are pinpointed. In
doing this, this Chapter is presented as follows:
1. The Study Conclusions,
2. The Contributions of the Study,
3. The limitations of the Study, and
4. The Directions for Future Research.
8.2 The Study Conclusions
In pinpointing the conclusions from this study, the research questions for this study (See
Section 1.4, p. 5), which are summarised below, are used as a guide. It is also helpful to
consider the ‘conceptual framework to the research’ in conjunction with the research
questions to assist understanding of the relationships between the questions (See Figure 4.1,
chapter 4, p. 80).
1. What SMA-techniques do Palestinian Companies use and how do these influence their
organisational performance?
2. What influence do the contingency factors have on the choice of these SMA-techniques?
3. What contingency factors influence the organisational performance of Palestinian
Companies?
4. What influence does organisational strategy have on organisational structure and
organisational performance?
5. What influence does perceived environmental uncertainty have on organisational
structure, organisational performance and organisation strategy?
6. What influence does organisational structure have on SMA techniques and
organisational performance?
Chapter 8: The Study Conclusions, Contributions, Limitations & Future Research Directions
Jafar Ojra - 243 -
Research Question 1
The Use of SMA Techniques and Influence on Organisational Performance
Based on the statistical evidence that emerged from the data for this study, the explored
companies strongly use strategic management accounting techniques (16 SMA techniques are
measured in this study. See Table 5.8, p. 137). The majority of the respondents underline this
point in their responses (See Table 6.10, p. 171) for the five conceptualised dimensions
(costing, planning, control and performance measurement, strategic decision making,
competitor accounting and customer accounting). It therefore seems right to conclude further
that the Palestinian companies are valuing the importance of these SMA techniques as tools
for strategic orientation. The explored companies show a high usage of SMA techniques for
all variables except for the SMAU-Customer Accounting variables (See Table 6.10, p. 171).
Thus, this study underlines the importance of using these SMA tools for enhancing strategic
orientation.
Research Question 2
Contingency Factors and Influence on the Choice of SMA Techniques
This study explored five contingency factors which are Perceived Environmental Uncertainty
(market turbulence and competitive intensity), Organisational Strategy (prospector and
defender), Technology, Organisational Size and Organisational Structure (formalisation and
decentralisation).
This study concludes that the degree of environmental uncertainty that a company faces
influences the nature and extent of strategic management accounting techniques. This is
particularly the case for environmental uncertainty of market turbulence characteristics. This
study suggests that market turbulence has a significant negative influence on three SMAU
dimensions (SMAU-Costing, SMAU-Planning, Control and Performance Measurement, and
SMAU-Strategic Decision Making). On the other hand, this study concludes that higher levels

Chapter 8: The Study Conclusions, Contributions, Limitations & Future Research Directions
Jafar Ojra - 244 -
of Competitive Intensity would associate negatively to SMAU-Planning, Control and
Performance Measurement, and SMAU-Strategic Decision Making.
This study also concludes that organisational technology is positively associated to SMAU.
Thus, organisations that show high levels of information and communication technology
show high need for the use of the strategic management accounting techniques. This is true
for the SMAU-total model as well as the individual dimensions of SMAU.
This study concludes that organisational size and organisational strategy influence the use of
strategic management accounting techniques. This means that larger Palestinian companies
will have greater need for higher and dimensional usage of strategic management accounting
techniques. Similarly, Palestinian companies that pursue prospector type strategies have more
need for SMAU than defender type companies.
Research Question 3
Contingency Factors that Influence the Organisational Performance of Palestinian
Companies
This study explored two dimensions of organisational performance (financial and non-
financial performance). While financial and non-financial performance are considered in the
performance orientation of the explored organisations, non-financial performance seems to
weigh more heavily in their performance orientation. On this performance point, this study
concludes that non-financial performance is strongly positively influenced by all levels of
SMA techniques and by competitive intensity dimension of perceived environmental
uncertainty. This means that in the explored Palestinian companies higher levels of SMAU
and competitive intensity would lead to higher emphasis on non-financial performance.
Furthermore, based on the marginally insignificant coefficient, it seems too that decentralised
decision making system might negatively influence financial performance (See Figure 7.2, p.
194).

Chapter 8: The Study Conclusions, Contributions, Limitations & Future Research Directions
Jafar Ojra - 245 -
Research Question 4
The Influence of Organisational Strategy on Organisational Structure and
Organisational Performance
This study concludes that prospector type companies are typically proactive and tend to be
less centralised in their decision making process, and are less formalistic in their
organisational patterns. The reverse is the case for defender type companies where companies
with such characteristics favour centralised decision making and formalised organisational
patterns.
Furthermore, this study concludes that organisational strategy influences the nature and level
of organisational performance. From the data for this study, prospector strategy will lead to
higher non-financial performance.
Research Question 5
The Influence of Perceived Environmental Uncertainty on Organisational Structure,
Organisational Performance and Organisational Strategy
This study concludes that perceived environmental uncertainty-competitive intensity is
positively associate to organisational structure-decentralisation, which means that when there
is high competitive intensity, explored Palestinian companies tend to use decentralised
decision making strategies to respond to the environmental challenges. On the other hand, it
seems, by the marginally insignificant statistical evidence, that perceived environmental
uncertainty-market turbulence might negatively influence organisational structure-
decentralisation.
Concerning organisational performance, this study concludes that when perceived
environmental uncertainty (Competitive intensity) is high, explored Palestinian companies
give much attention to non-financial performance. Moreover, this study concludes that the
level of perceived environmental uncertainty influences the strategic priority
(defender/prospector). In other words, whether explored Palestinian companies pursue

Chapter 8: The Study Conclusions, Contributions, Limitations & Future Research Directions
Jafar Ojra - 246 -
prospector or defender type strategies depends on their environmental circumstances.
Specifically, this study concludes that explored Palestinian companies with high perceived
competitive intensity and market turbulence showed features of prospector type strategy,
while organisations where perceived competitive intensity and market turbulence were low,
reflected features of defender type strategy. Thus, where the perceived environmental
uncertainty is high, organisations would follow the prospector strategy type.
Research Question 6
The Influence of Organisation Structure on SMA Techniques and Organisational
Performance
Statistically, no significant association was found between both dimensions of organisational
structure (formalisation and decentralisation) and SMA usage on the one hand, as well as
between both dimensions of organisational structure and organisational performance (both
financial and non-financial). Having said this, a closer examination of the statistical evidence
for organisational structure - formalisations shows marginally insignificant coefficient for
organisational performance (non-financial), evidence that might tend to suggest that
formalisation might negatively associate to non-financial performance (See Figure 7.3, p.
195). All evidence put together, no conclusions can be drawn about the influence of
organisational structure on SMAU and on organisational performance.
8.3 The Contributions of the Study
The insights from this study contribute to knowledge in several ways, and these are discussed
under theoretical contribution (Section 8.3.1) and managerial contributions (Section 8.3.2).
8.3.1 The Theoretical Contributions
This study makes several contributions to theoretical foundations relating to the contingency
perspective of the organisation concerning strategic dynamics in organisations.

Chapter 8: The Study Conclusions, Contributions, Limitations & Future Research Directions
Jafar Ojra - 247 -
8.3.1.1 Strategic Decision Making Literature
This study of the contingency perspective of strategic management accounting usage
provides insights that enhance the understanding of the effects of context. First, this study
contributes to the theoretical foundation about the important role strategic management
accounting plays in the strategic decision making process of organisations.
This study supports other studies that have underlined the importance of providing strategic
management accounting information (especially information relating to Strategic Decision
Making, Competitor Accounting and Customer Accounting) towards good strategic decision
making (e.g. Cadez & Guilding, 2008; Cinquini & Tenucci, 2010).
Further in this connection of the importance of these three dimensions of SMAU, this study
also contributes to the literature about the importance of these strategic management
accounting information in the ‘Prospector Strategy’ drive of organisations (e.g., Cadez &
Guilding, 2008; Guilding, 1999; Cinquini & Tenucci, 2010).
On the other hand, the evidence for 'defender' type companies shows that such companies
give more attention to the Costing dimension of SMAU than 'prospector' type companies.
These combined evidences for 'prospector' and 'defender' type companies from this study
contribute to the view that 'prospectors' may need more market information than 'defenders'
(Shortel & Zajack, 1990; Smith et al., 1989; Cinquinin & Tenucci, 2010).
8.3.1.2 Contingency Factors of Strategic Management Accounting Usage Literature
This study makes several contributions to the literature on the contingency factors of
strategic management accounting usage. First, this study contributes to the rational/non-
rationality view concerning decision making under conditions of environmental uncertainty
and complexity. In this connection, this study supports and extends studies that suggest that
under conditions of environmental uncertainty and complexity, managers may often not

Chapter 8: The Study Conclusions, Contributions, Limitations & Future Research Directions
Jafar Ojra - 248 -
follow a rational model in their decision making (e.g., Haley & Stumpf, 1989; Payne et al.,
1992; Busenitz & Barney, 1997). Rather, in such circumstances, managerial decision
making may be influenced by several factors (See Section 7.4.5).
This study also contributes to literature concerning the influence of perceived environmental
uncertainty on organisational dynamics. In this context, this study does not only enhance the
understanding of how both competitive intensity and market turbulence would shape the
organisational dynamics, but also contributes to the understanding of the contingencies that
might have substantial role. For example, in the study of Malaysian companies, Jusoh (2010)
comments thus: "the overall conclusion to be drawn from this empirical evidence is that
perceived environmental uncertainty exhibits a limited influence on the use of multiple
performance measures. Again, this means that information that is broad scope and external to
the firms are not that important to the firms given the low uncertainty of the Malaysian
environment. It can also be concluded that business strategy sets the need for types of
information in terms of performance measures" (p.1982).
This present study argues that perceived environmental uncertainty does have a strong
influence on the use of multiple performance; however, the degree of emphasis attached to the
performance being influenced by several other factors like organisational/business strategy.
By this evidence too, business strategy may not be the major driver of the information
needed, rather the external force (environmental uncertainty) is the major determinant of
information need, and as a matter of fact, perceived environmental uncertainty influences the
strategic orientation. Finally, perceived environmental uncertainty (competitive intensity)
positively influences the use of decentralised organisational system, an approach which is
critical towards ensuring quick processing of information so that organisations can adapt
adequately to environmental changes and meet performance targets.

Chapter 8: The Study Conclusions, Contributions, Limitations & Future Research Directions
Jafar Ojra - 249 -
This study also contributes to the growing knowledge on the influence of organisational
technology on SMAU. In this connection, this study indicates that information and
communication technology has a strong positive association to the degree of SMAU. Also,
this study concludes that company (organisational) size influences the extent of SMAU, and
especially on how companies drive for strategic success and ensure customer and competitor
orientation.
Another area where this study contributes to the contingency perspective of strategic
management accounting literature concerns how organisations can manage the organisational
structure factors (formalisation and decentralisation). In this regard, this study contributes to
the notion that while these organisational structure factors might shape SMA usage and
dimensions, (and organisational performance - see performance literature below); maximum
fit to SMA usage and dimensions would be best achieved, if considered along with other
contingency factors that might exert indirect influence (Hwang, 2005; Moores & Mula, 1993;
Kohli & Jaworski, 1990).
8.3.1.3 Performance Literature
This study contributes to the literature on performance and performance measurement in
organisations in several ways. First, it contributes concerning the importance of firms not only
looking at financial performance but also non-financial performance (e.g., Bisbe &
Malagueno, 2012; Gimbert et al., 2010; Ittner, et al., 2003; Hall, 2011).
Empirically, this study suggests that the emphasis placed on the use of the financial and non-
financial dimensions of performance would depend on the contingencies in the explored
context (industrial and national). For example, this study argues that while higher
environmental uncertainty might lead to increased focus on non-financial performance, the
increased use is explained more by increased competitive intensity than market turbulence.
Chapter 8: The Study Conclusions, Contributions, Limitations & Future Research Directions
Jafar Ojra - 250 -
Further contribution to literature is the evidence that in Islamic context, national culture and
Islamic Sharia regulations may be a driving force for increased emphasis on non-financial
performance features, a situation where the customers and general public welfare takes the
priority. The findings from this study contribute to the literature on indirect association
between antecedents (e.g. SMA Usage and decentralisation and/or formalisation) on
organisational performance (e.g. Hoque, 2004; Baines & Langfield-Smith, 2003) and the
increasing notion that organisational performance outcomes depend on the extent of fit
between the use of organisational systems and situational factors (e.g. Haldma & Lääts, 2002;
Hoque, 2004; Hyvönen, 2007; Govindarajan & Gupta, 1985; Mia & Clarke, 1999; Kaplan &
Norton, 1996).
Furthermore, this study contributes to the increasing evidence that organisations are
increasingly paying more attention to non-financial performance than financial performance
(e.g., Ittner & Larcker, 1998; Ittner et al., 1997; Govindarajan & Gupta, 1985; Kaplan &
Norton, 1992, 1996). In this connection, this study supports the notion that when
organisations prioritise non-financial performance, managers can better recognise changes in
the business environment and effectively deal with them (e.g., Kaplan & Norton, 1996).
8.3.2 The Managerial Contributions
This study offers several contributions to practitioners in the explored theoretical,
geographical and industrial contexts.
The primary aim of business entities is to profitably satisfy their customers. Therefore, the
managerial contribution of this study is commenced by pinpointing the organisational
performance outcome and the contingency insights that contributed to the outcome.

Chapter 8: The Study Conclusions, Contributions, Limitations & Future Research Directions
Jafar Ojra - 251 -
Managers are reminded of the importance of including both financial and non-financial
indicators in their organisational performance evaluation. In this connection too, managers are
also reminded that whether a higher importance should be attached to the financial or non-
financial performance will depend on the contingency dynamics (internal and external) of the
company (e.g. organisational strategy, organisational structure, strategic management
accounting techniques in use, and the nature and degree of environmental uncertainty),
prevailing national culture and Islamic Sharia influence.
Attention is drawn to the fact that competitive intensity dimension of environmental
uncertainty, organisational strategy and strategic management accounting usage have strong
positive association with non-financial performance. It seems too that formalisation might
exert a negative influence on non-financial performance. Attention is also drawn to the fact
that decentralisation might exert a negative influence on financial performance.
Concerning the importance of using strategic management accounting techniques, managers’
attention is drawn to a number of issues. First, as mentioned earlier, strategic management
accounting usage is a core factor of organisational performance. In this regard, managers are
reminded that the influence of strategic management accounting usage (and dimensions)
may vary between the financial and non-financial dimensions of organisational performance,
and that the nature and degree of this influence are dependent on a number of contingency
factors. For example, four (excluding SMAU-Costing) dimensions of SMAU have a
significant positive influence of non-financial performance.
On the point of contingency factors, organisational technology (information and
communication technology) and organisational size have strong positive relationship to
strategic management accounting usage; the market turbulence dimension of environmental

Chapter 8: The Study Conclusions, Contributions, Limitations & Future Research Directions
Jafar Ojra - 252 -
uncertainty has a strong negative influence. The influence of these factors across the
dimensions of strategic management accounting also varies.
Finally, managers are reminded that, in addition to the role that (1) strategic management
accounting usage and (2) other contingency factors play individually in determining the
nature and level of organisational performance, and (3) the nature of contingency factors that
influence the extent and dimension of strategic management accounting usage that are
necessary, it is important to note that some degree of inter-connection might exist between the
individual contingency factors.
Therefore, in order to maximise their strategic decision making effectiveness and organisational
performance, managers must ensure that necessary steps are taken to achieve a good fit
between the relevant contingency factors. For example, it seems that the organisational strategy
that a firm follows may influence the association between organisational structure and
organisational performance. Furthermore, different organisational strategies may not clearly
imply different orientations in the adoption of strategic management accounting tools. This
dual evidence supports the view that the level of environmental uncertainty might influence the
degree of association between organisational strategy and strategic management accounting
usage.
8.4 The Study Limitations
This study contributes in several ways to enhance the understanding of the contingency
perspective of strategic management accounting. However, this study has a number of
features that limit the generalisability of the findings; therefore care must be taken in the
interpretation and transportation of the findings from this study into other contexts.
The first limitation of this study concerns the context in which the study is conducted. This
study explored only Palestinian companies. National culture shapes the behaviour of people
Chapter 8: The Study Conclusions, Contributions, Limitations & Future Research Directions
Jafar Ojra - 253 -
and also organisational dynamics (Hofstede, 1980; Xie et al., 2003), therefore caution is
advised in the adoption of the findings from this study, as they may not fit well into other
geographical contexts that do not share similar cultural background with Palestine.
Moreover, although several industries were covered in this study, care must be taken in
applying the results to other contexts that might not fit the industrial description covered in
this study.
Although not explored in depth, another limitation is that culture and Islamic regulations may
shape the contingency dynamics in the Palestinian context, and the influence of these factors
both on the extent and nature of strategic management accounting usage and organisational
performance. It must be reminded that the conclusions in this study concerning this influence
of culture and Islamic regulation are derived mainly from limited interview evidence.
Further on the point of the factors that influence the extent and dimensions of strategic
management accounting usage as well as the extent and dimension of organisational
performance, this study pinpointed a number of significant factors. Also, some suggestions of
indirect association were made based on comparative evidence. Caution is advised in
transporting these suggestions to other contexts.
Attention is drawn to the sample size limitation of this study. The data for this study was
based on 175 responses, which is below 200 (Hair et al., 1998. 2003), a fact that may have
affected the significance levels of explored relationships. A further limitation of this study
regarding responses is that responses were obtained only from one individual in each of the
explored companies, so there is a common method bias threat. Finally, it must be reminded
that this study relied on the translation between English and Arabic, and there is the danger

Chapter 8: The Study Conclusions, Contributions, Limitations & Future Research Directions
Jafar Ojra - 254 -
that information may have been lost / misinterpreted in the translation process. Therefore, care
must be taken in interpreting the findings.
Finally, while a comprehensive approach was adopted in this exploration of the contingency
perspective of strategic management accounting usage in Palestinian companies, it must be
acknowledged that a number of other factors have not been included in the conceptual
framework for this study (e.g. culture, market orientation, accountant's participation, indirect
association, etc.).
8.5 The Directions for Future Research
One major contribution of this present study is that it has enhanced the literature on the fact
that companies are giving much attention to SMA-techniques as a step towards organising
their strategic orientation. In this connection, while this study contributes to the understanding
of how the various SMA-techniques may be used to fit the needs of the diverse strategic
typologies, it also adds to the view about difficulty in explaining the dynamics concerning the
association between the strategic typologies and SMA-techniques usage (Cinquini & Tenucci,
2010). Further studies in this aspect will enable the understanding of this relationship. Efforts
that embrace myriad of strategic typologies would contribute to improving the "loose" picture.
An area which is not explored in depth in this study was the influence of national culture and
Islamic regulations on the contingency dynamic in the Palestinian context. To enhance
knowledge in this area, further studies using a robust qualitative or quantitative, or a
combination of both, is necessary. Such studies should aim to highlight the direct, as well as
the moderating/mediating influence of these two factors in the usage of strategic management
accounting and performance orientation of organisations.
Further on the methodological approach, using qualitative approaches such a interviews, case
studies, and also of longitudinal nature, to explore a comprehensive model will also help to

Chapter 8: The Study Conclusions, Contributions, Limitations & Future Research Directions
Jafar Ojra - 255 -
enhance knowledge development in this area, especially in understanding the relationships
between the constructs than would be explained by a survey approach (Hyvönen, 2008) and
importantly in a comparative form (developed and less developed country contexts).
While this study has contributed to the understanding of the influence of company
(organisational) size on strategic management accounting usage, it draws attention to the fact
that scholars increasingly mention that more research is needed towards enhancing the
understanding of this influence of size on SMAU (e.g. Cinquinni & Tenucci, 2010; Guilding,
1999; Guilding & McManus, 2002).
Also, further studies should aim to enhance our knowledge concerning indirect association of
the contingency variables for strategic management accounting usage and organisational
performance. One core direction in this connection is to explain how industrial and national
contexts may influence such indirect relationships. Finally, on this point, but also for the
purpose of enhancing the framework explored in this study, researchers should aim to: 1) use
data based on ≥200 responses; and 2) employ more robust analytical tools like Structural
Equation Modelling (SEM) to examine the conceptualised relationships. Doing that will help
clarify the nature and significance level of direct and indirect relationships.
Finally, although different industries were explored in this study, the results have not been
presented in a way that industrial differences can be identified, due mainly to response
limitations. This is a critical direction for knowledge development. Therefore, in addition to
pinpointing the industrial differences across nations, further studies should also highlight
industrial differences in a national context and how the contingency factors and influence are
shaped by industrial dynamics.

Jafar Ojra - 256 -
References
Abdel-Kader, M. & Luther, R. (2006). IFAC’s conception of the evolution of management accounting.
Advances in Management Accounting, Vol. 15, pp. 237-256.
Abdel-Kader, M. & Luther, R. (2008). The impact of firm characteristics on management accounting
practices: A UK-based empirical analysis. British Accounting Review, 40 (1), pp. 2-27.
Abdul Rasid, S.Z, Abdul Rahim Abdul Rahman & Wan Khairuzzaman Wan Ismail. (2011).
Management accounting and risk management in Malaysian Financial Institutions: An Exploratory
Study. Managerial Auditing Journal, 26(7), 566-585.
Abelson & Levy. (1985). Decision making and decision theory. In: Lindzey G and Aronsom E (eds.).
Handbook of Social Psychology 1. Random House, New York.
Achrol, R., & Stern, L. (1988). Environmental determinants of decision-making uncertainty in
marketing channels. Journal of Marketing Research, 25, 36-50.
Abernethy, M.A. & J. Bouwens. (2005). Determinants of accounting innovation. Abacus, vol. 41, n° 3,
pp. 217-240
Aiken M, Bacharach S, & French JL. (1982). Organizational structure, work process, and proposal
making in administrative bureaucracies. Acad Manage J; 23(4):631–52.
Aiken, M., & Hage, J. (1968).Organizational interdependence and intra organizational structure.
American Sociological Review, 33, 912-930.
Alarcon, L. F. & Bastias, A. (2000). A computer environment to support the strategic decision-making
process in construction firms. Engineering Construction and Architectural Management, 7(1), 63-75.
Alattar, J. M., Kouhy, R. & Innes, J. (2009). Management accounting information in micro enterprises
in Gaza. Journal of Accounting & Organizational Change, 5(19), pp.81-107.
Alawattage, C., Hooper, T. & Wichramashinghe, D. (2007). Introduction to management accounting
in less developed countries. Journal of Accounting and Organisational Change, 183-191.
Alkaraan, F., & Northcott, D. (2006). Strategic capital investment decision-making: A role for
emergent analysis tools? A study of practice in large UK manufacturing companies. The British
Accounting Review, 38(2): 149-173.
Allen, E., & Seaman, C. A. (2007). Likert Scales and Data Analyses. Quality Progress, 40, 64 65.
Al-Omiri M. & Drury C. (2007).A Survey of factors influencing the choice of product costing systems
in UK organizations. Management Accounting Research, 18(4), 399 424.
Alrawi, H. A., & Thomas, S. S. (2007). Application of contingency theory of accounting information
to the UAE banking sector. Asian Academy of Management Journal 12(2), 33- 55.

Jafar Ojra - 257 -
Amaratunga, D. & Baldry, D. (2001). Case study methodology as a means of theory building:
performance measurement in facilities management organisations. Work Study, Volume 50 Number 3,
MCB University Press, pp.95-104.
Ambler, T. & Roberts, J. (2005). Beware the Silver Metric: Marketing Performance Measurement has
to be Multidimensional. Centre for Marketing Working Paper, 05-207 (September), London Business
School.
Amihud, Y. & B. Lev. (1981). Risk reduction as a managerial motive for conglomerate mergers. Bell
Journal of Economics 12:605-617.
Anastas, M. (1997).The changing world of management accounting and financial management.
Management Accounting, pp. 48-51.
Anderson, S. (2007). Managing cost and cost structures throughout the value chain: research on
strategic cost management, In Langfield-Smith, K. (2008). Strategic management accounting: how far
have we come in 25 years? Accounting, Auditing and Accountability, 21(2), pp. 204-228.
Anderson, S. W., & Lanen, W. N. (1999). Economic transition, strategy and the evolution of
management accounting practices. Accounting, Organizations and Society, 24, 379–412.
Ansoff, H., & McDonnell, E. (1990). Implanting strategic management (2nd ed.). Englewood Cliffs,
NJ: Prentice-Hall.
Arnon, A. (2002). On the Implications of Economic Borders between Israel and Palestine. Israel
Palestine Journal, 9(3): 32-39
Askarany, D. & Smith, M. (2008). The Diffusion of Management Accounting Innovation: A
Longitudinal Study of PACIA. Managerial Auditing Journal, Vol.23 No.9 pp. 900-916
Astley, W. G. & A. H. Van de Ven. (1983). Central perspectives and debates in organization theory.
Administrative Science Quarterly, 28(2): 245-273.
Athey, Susan; Gans, Joshua; Schaefer, Scott; & Stern, Scott. (1994). The Allocation of Decisions in
Organizations. Graduate School of Business Research Paper no. 1322. Stanford, CA: Stanford
University, 1994.
Aver B, Cadez S. (2009). Management accountants’ participation in strategic management processes:
A cross industry comparison. J. East Eur. Manage. Stud., 14(3): 310-322.
Baines, A., & Langfield-Smith, K. (2003). Antecedents to management accounting change: A
structural equation approach. Accounting, Organizations and Society, 28, 675-698.
Bantel, K. (1993). Top team, environment, and performance effects on strategic planning formality.
Group & Organization Management, 18, 436-458.
Baum, J. R., & Wally, S. (2003). Strategic decision speed and firm performance. Strategic
Management Journal, 24: 1107-1129.

Jafar Ojra - 258 -
Begley, T. M. & Boyd, D. P. (1987). Psychological characteristics of associated with performance in
entrepreneurial firms and small businesses. Journal of Business Venturing, 2: 79-83.
Bellis-Jones, R. (1989). Customer profitability analysis. Management Accounting, 63, 26-28.
Bhimani, A. & Keshtvarz, M. A. (1999). British management accountants: strategically oriented.
Journal of Cost Management, pp.25-31.
Belsley, D. A., E. Kuh, & Welsch, R. E. (1980). Regression Diagnostics. In Parry E. M., & Song, M.
X. (1993). Determinants of R&D-marketing integration in High-Tech Japanese firms. Journal of
Product Innovation Management, 10, pp. 4-22.
Belohlav, J. A. (1993). Quality, strategy and competitiveness. California Management Review, 35, 55-
67.
Bentler, P. M. & Kano, Y. (1990). On the equivalence of factors and components. Multivariate
Behavioural Research, 25(1), 67-74.
Bhimani, A. (1999). Mapping methodological frontiers in cross-national management control research.
Accounting, Organizations and Society, 24, 413-440.
Bhimani, A., & Langfield-Smith, K. (2007). Structure, formality and the importance of financial and
non-financial information in strategy development and implementation. Management Accounting
Research, 18, 3-31.
Bimberg J. & Snodgrass, C. (1988). Culture and Control: A Field Study. Accounting Organizations
and Society, pp. 447-464.
Bisbe, J. & Malagueño, R. (2012). Using Strategic Performance Measurement Systems for Strategy
Formulation: Does it Work in Dynamic Environments? Management Accounting Research, 23, pp.
296-311.
Bititci, U S, Carrie AS. McDevitt, L & Turner T. (1998a). Integrated Performance Measurement
Systems, A Reference Model: Organising the Extended Enterprise, Edited by Paul Scohseben and
Alfred Buchel, Chapman and Hall publications, pp 191-203.
Bititci, US, Carrie , AS. Turner, T. (1998b). Diagnosing the Integrity of Your Performance
Measurement Systems. IOM Publication.
Bititci, U.S., Turner, T. & Begemann, C. (2000). Dynamics of performance measurement systems.
International Journal of Operations & Production Management, Vol. 20 No. 6, pp. 692-704.
Bitton, M. (1990). Méthode de conception et d’implantation de systèmes de measure de performances
pour organisations industrielles. Thèse d’ automatique, Université de Bordeaux I, France.
Bourgeois, III, L. (1978). Strategy making, environment, and economic performance: A conceptual
and empirical exploration. Unpublished doctoral dissertation, University of Washington, Seattle.

Jafar Ojra - 259 -
Bourgeois, III. L. (1985). Strategic goals, perceived uncertainty, and economic performance in volatile
environments. Academy of Management Journal, 28, 548-573.
Boyd, B. K. (1991). Strategic planning and financial performance: A meta-analytic review. Journal of
Management Studies, 28(July), 353-374.
Boyd, H., Walker, O., & Larreche, J. (1995). Marketing management –A strategy approach with a
global orientation. Chicago, IL: Irwin.
Bregman, A. (2002). Israel's Wars: A History Since 1947. London: Routledge.
Pressey, A. D. (2000). International relationship marketing: an investigation of the stages of industrial
inter-organisational relationship development with an examination of the influence of national culture.
A PhD Thesis submitted at University of Luton, England, United Kingdom.
Briers, M. & Hirst, M. (1990).The role of budgetary information in performance evaluation.
Accounting, Organizations and Society, 15, pp.373-398.
Bromwich, M. (1990). The case for strategic management accounting: the role of accounting
information for strategy in competitive markets. Accounting, Organisation and Society, 15(1/2),
pp.27–46.
Bromwich, M. & Bhimani, A. (1994). Management accounting pathways to progress. Chartered
Institute of Management Accountants, London.
Brouthers, K.D., Brouthers, L.E. & Werner, S. (2000). Influences on strategic decision-making in the
Dutch financial services industry. Journal of Management 26, 863-883.
Brouthers, K., & Roozen, F. (1999). Is it time to start thinking about strategic accounting? Long Range
Planning, 32, 311-322.
Brown, D. A., Booth, P. & Giacobbe, F. (2004). Technological and Organizational Influences on the
Adoption of Activity Based Costing in Australia. Accounting &Finance, 44(3), 329-356.
Brownell, P. & Hirst, M. (1986). Reliance on accounting information, budgetary participation and task
uncertainly: test of a three – way interaction. Journal of Amounting Research, 24:241 – 249.
Brownlie, D. (1999). Benchmarking your marketing process. Long Range Planning, 31, 88–95.
Bruggeman, W. & Van der Stede, W. (1993). Fitting Management Control Systems to Competitive
Advantage. British Journal of Management, 4, pp. 205-218.
Brush, C., & VanderWerf, P. (1990).Measuring performance of new ventures. Paper presented at the
Babson Entrepreneurship Conference, Wellesley, MA.
Bruns, W.J. & Waterhouse, J.H. (1975). Budgetary control and organizational Structure. Journal of
Accounting Research, pp. 177-203.

Jafar Ojra - 260 -
Bryman, A. (2004). Social Research Methods, 2nd edition. Oxford University Press Inc., New York.
Pp. 11-13, 19-20, 28-60.
Bryman, A. & Bell, E. (2003). Business research methods. New York: Oxford University Press.
Bryman, AE & Cramer, D (2004). Constructing variables. In Hardy, M and Bryman, AE (ed)
Handbook of data analysis, Sage, pp.17-34.
Burns, J. & Scapnes, R. W. (2000). Conceptualizing management accounting change: an institutional
framework. Management Accounting Research, v. 11, p. 3-25, 2000.
Burns, J. & Vaivio, J. (2001). Management accounting change. Management Accounting Research,
Vol. 12 (4), pp. 389-402.
Burns, T., & Stalker, G. (1961). The management of innovation. London: Tavistock.
Busenitz, L. W., & Barney, J. B. (1997). Differences between entrepreneurs and managers in large
organizations: Biases and heuristics in strategic decision-making. Journal of Business Venturing, 12:
9-30.
Cadez, S. (2006). A cross-industry comparison of strategic management accounting practice: an
exploratory study. Economic and Business Review. Vol. 8, 279-298.
Cadez, S., & Guilding, C. (2007). Benchmarking the incidence of strategic management accounting in
Slovenia. Journal of Accounting and Organizational Change, 3, 126-146.
Cadez, S. & Guilding, C. (2008). An exploratory investigation of an integrated contingency model of
strategic management accounting. Accounting, Organisations and Society, 836-873.
Cadez, S. & Guilding, C. (2009). Organizational configurations of strategic choices and strategic
management accounting. A Working Paper in the Documents de treball d'economia de l'empresa
series, Universitat Autonoma de Barcelona, Barcelona, Spain.
Calantone, R.; Garcia, R.; & Dröge, C. (2003). The effects of environmental turbulence on new
product development strategy planning. Journal of Product Innovation Management, 20, 90-103.
Cappelleri, J. C., Kourides, I. A., Gerber, R. A., & Gelfand, R. A. (2000). Development and factor
analysis of a questionnaire to measure patient satisfaction with injected and inhaled insulin for type 1
diabetes. Diabetes Care, Vol. 23 Issue 12, 1799-1803.
Carpenter, M. A. & J. W. Fredrickson (2001). Top Management Teams, Global Strategic Posture and
the Moderating Role of Uncertainty. Academy of Management Journal, 44(3): 533-545.
Cavalluzzo, K.S., & Ittner, C.D. (2004). Implementing performance measurement innovations:
Evidence from government. Accounting, Organizations and Society, 29 (3/4), 243.
Chakravarthy, B. (1997). A new strategy framework for coping with turbulence. Sloan Management
Review, pp. 69-82.

Jafar Ojra - 261 -
Chandler, A. (1962). Strategy and structure. Cambridge, MA: M.I.T. Press.
Chapman, C.S. (1997). Reflections on a contingent view of accounting. Accounting, Organisations
and Society, 189-205.
Chapman, C. S. & Chua, W. F. (2000). Technology, organizational form and accounting. 25th
anniversary Conference, Accounting, Organization & Society, Oxford: Pergamon.
Chatterjee, P. (2004). Interfirm alliances in online retailing. Journal of Business Research, 57 (7),
714–723.
Chenhall, R. (2003). Management control systems design within its organizational context: findings
from contingency-based research and directions for the future. Accounting, Organization & Society,
28, pp.127-168.
Chenhall, R.H. (2005). Integrative performance measurement systems, strategic alignment of
manufacturing, learning and strategic outcomes: an exploratory study. Accounting, Organisations and
Society, 395-422.
Chenhall, R. (2006). Theorizing contingencies in management control systems research. In: Chapman,
C.S. (Ed.), Handbooks of Management Accounting Research, Elsevier, pp. 163-205.
Chenhall, R. (2008). Accounting for the Horizontal Organization’, in C. S. Chapman, A. G.
Hopwood, and M. D. Shields (Eds.). Handbook of Management Accounting Research, pp.
1207-1233 (Oxford: Elsevier).
Chenhall, R.H. & Langfield-Smith, K. (1998). The relationship between strategic priorities,
management techniques and management accounting: an empirical investigation using a systems
approach. Accounting, Organisations and Society, 23, 243-264.
Chenhall, R. H., & Morris, D. (1986). The impact of structure, environment and interdependence on
the perceived usefulness of management accounting systems. The Accounting Review, 61, 16-35.
Chenhall & Morris, D. (1995). Chenhall R.H., Morris D., Organic decision and communication
processes and management accounting systems in entrepreneurial and conservative business
organizations, Omega. International Journal of Management Science, 23, 5, 1995, 485-497.
Child, J. (1972). Organizational structure, environment and performance: The role of strategic choice.
Sociology, 6, 1-22.
Child, J., & Mansfield, R. (1972). Technology, size, and organization structure. Sociology, 6, 369-380.
Chisnall, P. (2001). Marketing research (6th Ed). London: McGraw-Hill.
Chisnall, P. (2005). Marketing Research (7th Ed). McGraw-Hill (London). Pp. 35-49.
Choe, J m. (2004). The Consideration of Cultural Differences in the Design of Information Systems.
Information & Management, 41, 669-684.

Jafar Ojra - 262 -
Chong, V.K. & Chong, K.M. (1997). Strategic choices, environmental uncertainty and SBU
performance: a note on the intervening role of management accounting systems. Accounting and
Business Research, 27, 268-276.
Chow, C. W., & Van Der Stede, W. (2006).The use and usefulness of nonfinancial performance
measures. Management Accounting Quarterly, 7(3), 1–8.
Churchill, G. A. & Iacobucci, D. (2002). Marketing research: Methodological foundations. 8th ed.
Orlando: Harcourt College Publishers.
Cinquini, L. & Tennuci, A. (2010). Strategic management accounting and business strategy: a loose
coupling? Journal of Accounting and Organisational change, 228-259.
Cleveland, William L & Martin Bunton. (2008). A History of the Modern Middle East: 4th Edition,
Westview Press: 2008.
Coad, A. (1996). Smart work and hard work: explicating a learning orientation in management
accounting. Management Accounting Research, 7, 387-408.
Collis, J. & Hussey, R. (2003). Business Research: a practical guide for undergraduate and
postgraduate student. Second edition. Basingstoke: Palgrave Macmillan.
Cook, R. Dennis. (1979). Influential Observations in Linear Regression. Journal of the American
Statistical Association (American Statistical Association) 74 (365): 169–174.
Cooper, D. R., & Emory, C. W. (1994). Business Research Methods (5th edition). USA: Richard D.
Irwin.
Cooper, D.R. & Schindler, C.S. (2001). Business Research Methods. London: Irwin.
Cooper, D. R., & Schindler, P. S. (2003). Business Research Methods (8th edition). USA: McGraw-
Hill.
Cooper, R. (1979). The dimensions of industrial new product success and failure. Journal of
Marketing, 43(3), 93-103.
Cooper, R.G. (1995). Developing New Products on Time, in Time. Research Technology Management,
38(5):49–58.
Cooper, R. (1996). Costing techniques to support corporate strategy: evidence from Japan.
Management Accounting Research, 7, 219-246.
Cooper, R. & R. Kaplan. (1988). Measure cost right: Make the right decision. Harvard Business
Review (September-October): 96-103.
Cooper, R., Kaplan, R. S., Maisel, L. S., Morrissey, E. & Oehm, R. M. (1992). Implementing Activity-
Based Cost Management: Moving from Analysis to Action. Montvale, NJ: Institute of Management
Accountants.
Cooper, R. & R. Slagmulder. (1997). Target Costing and Value Engineering. Productivity Press Inc.

Jafar Ojra - 263 -
Cooper, R., & Slagmulder, R. (1999). Develop profitable new products with target costing. Sloan
Management Review, 40, 23–33.
Cooper, R. & Slagmulder, R. (2004). Interorganizational cost management and relational context.
Accounting, Organisation and Society, 29, 1–26.
Costello, A. B. & Osborne, J. W. (2005). Best practices in exploratory factor analysis: four
recommendations for getting the most from your analysis. Practical Assessment Research &
Evaluation, 10 (7).
Cottier, T. & Pannatier, S. (2000). Overview of Palestine’s Economic Policy and Foreign Trade
Regime. Economic Policy Programme II. London: London School of Economics.
Covin, J., & Slevin, D. (1989). Strategic management of small firms in hostile and benign
environments. Strategic Management Journal, 10, 75-87.
Covin, J. G., & Slevin, D. P. (1991). A conceptual model of entrepreneurship as firm behavior.
Entrepreneurship: Theory and Practice, 16(1): 7-24.
Cravens, K. S., & Guilding, C. (1999). Strategic brand valuation: A cross-functional perspective.
Business Horizons, 42, 53–62.
Cravens, K.S., & Guilding, C. (2001). An empirical study of the application of strategic management
accounting techniques. Advances in Management Accounting, 10, 95-124.
Creswell, J.W. (1994). Research Design: Qualitative & Quantitative Approaches, Sage, Thousand
Oaks, California.
Creswell, J. W. (2003). Qualitative, quantitative, and mixed methods approaches (2nd ed.). Thousand
Oaks, CA: Sage.
Cronbach, L. J. (1951). Coefficient alpha and the internal structure of tests. Psychometrika, 16, 297-
334.
Cross, K. & Lynch, R. (1989). Accounting for competitive performance. Journal of Cost Management,
spring, pp. 20-8.
Crotty, M. (1998). The Foundations of Social Research: Meaning and Perspective in the Research
Process, Allen and Unwin.
Czyzewski, A. B., & Hull, R. (1991). Improving profitability with life cycle costing. Journal of Cost
Management, 5, 20–27.
Daft, R., & Lengel, K. (1986). Organizational information requirements, media richness and structural
design. Management Science, 32, 554-571.
Daft, R. (1989). Organizational theory and design (3rd ed.). St. Paul, MN: West.

Jafar Ojra - 264 -
Daft, R., Sormunen, J., & Parks, D. (1988). Chief executive scanning, environmental characteristics,
and company performance. Strategic Management Journal, 9, 123-139.
Dainty, A. (2007). Review and critique of construction management research methods. In: Hughes, W.
ed. Proceedings of the Construction Management and Economics 25th Anniversary Conference: Past,
Present & Future, July 15-17, University of Reading, UK, Taylor & Francis, CD-ROM.
Damanpour, F. (1991). Organizational Innovation: A Meta-Analysis of Effects of Determinants and
Moderators. Academy of Management Journal, 34 (3), 555-590.
Daud, S. (2011). Money for nothing and occupation for free: the 1994 Pairs protocols on economic
relations between Israel and the PLO. Retrieved from http://mondoweiss.net/2011/09/money-for-
nothing-and-occupation-for-free-the-1994-paris-protcols-on-economic-relations-between-israel-and-
the-plo.html.
Davila, A. (2000). An empirical study on the drivers of management control systems' design in new
product development. Accounting, Organizations and Society, 25, 383-409.
Douglas, C. (1999). Organization redesign: The current state and projected trends. Management
Decision, 37, 621-627.
Dechow, N. & J. Mouritsen (2005). Enterprise resource planning systems, management control and
the quest for integration. Accounting, Organizations and Society, volume 30, issue 7/8, pp. 691-733
Dekker, H. C. (2003). Value chain analysis in interfirm relationships: A field study. Management
Accounting Research, 14, 1–23.
Delafrooz, N., Paim, L. H., & Khatibi, A. (2009). Developing an Instrument for Measurement of
Attitude toward Online Shopping. European Journal of Social Sciences, 7(3), 166- 177.
Delanty, G. (2005). Social Science. 2nd ed. Maidenhead: Open University Press.
Dent, J.F. (1990). Strategy, organization and control: some possibilities for accounting research.
Accounting, Organizations and Society, 15, 3-25.
Dent, J. (1991). Accounting and organisational cultures: A field study of the emergence of a new
organisational reality. Accounting, Organisations, and Society, vol. 16, pp. 705–32.
Deshpande, R. (1983). Paradigms lost: on theory and method in research in Marketing. Journal of
Marketing. Vol. 47, pp. 101-110.
Dess, G. G., & Beard, D. W. (1984). Dimensions of organizational task environments. Administrative
Science Quarterly, 29: 52-73.
De Vaus, D. (2001). Research design in social science, London: Sage.
Dewar, R.D., & Dutton, J.E. (1986). The Adoption of Radical and Incremental Innovations: An
Empirical Analysis. Management Science (32:11), pp 1422-1433.

Jafar Ojra - 265 -
Dewar, R.D., & Hage, J. (1978). Size, technology, complexity, and structural differentiation: toward a
theoretical synthesis. Administrative Science Quarterly, Vol. 23, pp. 111-136.
Diamantopoulos, A. & Schlegelmilch, B.B. (1997). Taking the fear out of data analysis. London: The
Dryden Press.
Dibb, S. (1996). The impact of the changing marketing environment in the Pacific Rim: Four case
studies. International Journal of Retail & Distribution Management, 24(11), 16-30.
Dik, R. (2011). Arab management accounting systems under the influence of their culture.
Unpublished PhD Dissertation submitted at Dortmund University of Technology, Germany.
Dillman, Don A. (1978). Mail Telephone Surveys: The Total Survey Design Method. NY: Wile.
Dixon, J.R., Nanni, A.J. & Vollmann, T.E. (1990). The New Performance Challenge – Measuring
Operations for World-Class Competition, Dow Jones-Irwin, Homewood, IL.
Donelan, J. G. & Kaplan, E. A. (1998). Value chain analysis: a strategic approach to cost management.
Journal of Cost Management, (March/April), pp.7–15.
Dowdy, S. & S. Weardin. (1983). Statistics for research. (John Wiley and Sons, Inc., New York, NY).
Draper, N. & Smith, H. (1981). Applied Regression Analysis. In Parry E. M., & M. X. Song (1993).
Determinants of R&D-Marketing integration in High-Tech Japanese firms. Journal of Product
Innovation Management, 10, pp. 4-22.
Drazin, R. & Van de Ven, A. H. (1985). Alternative forms of fit in contingency theory. Administrative
Science Quarterly, Vol. 30, pp. 514-39.
Dunk A.S. (1992). Reliance on budgetary control, manufacturing process automation and production
sub-unit performance: a research note. Accounting, Organizations and Society, 17, 3/4, 1992, 185-239.
Dunk, A. S. (2004). Product life cycle cost analysis: The impact of customer profiling, competitive
advantage, and quality of IS information. Management Accounting Research, 15, 401-414.
Duncan, R. B. (1972). Characteristics of organizational environments and perceived environmental
uncertainty.Administrative Science Quarterly, 17: 313-327.
Easterby-Smith., M; Thorpe, R. and Lowe, A. (1991). Management Research: An Introduction, Sage
Publications, London.
Easterby-Smith, M., Thorpe, R. & Lowe, A. (2002). Management Research: An Introduction, 2nd
Edition, Sage Publications, London.
Ebrahimi, B. (2000). Perceived strategic uncertainty and environmental scanning behavior of Hong
Kong Chinese executives. Journal of Business Research, 49, 67-77.

Jafar Ojra - 266 -
Egeren, M., & O’Connor, S. (1998). Drivers of market orientation and performance in service firms.
Journal of Service Marketing, 12, 39-58.
Eisenhardt, K. (1989). Making fast strategic decisions in high-velocity environments.
Academy of Management Journal, 32, 543-576.
Elbanna, S. (2003). Strategic decision-making process dimensions: Determinants and outcomes.
International & Organization Group Seminar, University of Birmingham, Birmingham, UK.
Elbanna, S. (2006). Strategic decision making: Process perspectives. International Journal of
Management Reviews, 8(1): 1-20.
Elbanna, S. (2007). An assessment of the Miller perceived environmental uncertainty measure in the
Egyptian manufacturing sector. Paper presented at the Oxford Business and Economics Conference,
Oxford University, Oxford, the UK.
Elbanna, S. & Alhwarai, M. (2012). The influence of environmental uncertainty and hostility on
organization performance. UAEU-FBE-Working Paper Series. Retrieved June 6, 2012 from:
www.fbe.uaeu.ac.ae/research/docs/wp2012_01_updated.pdf
Elbanna, S. and Child, J. (2007). The Influence of decision, environmental and firm characteristics on
the rationality of Strategic Decision-Making. Journal of Management Studies, 44(4), pp.561-592.
Elnathan, D., Lin, T. W., & Young, M. S. (1996). Benchmarking and management accounting: A
framework for research. Journal of Management Accounting Research, 8, 37-54.
Emery, F., & Trist, E. (1965). The causal texture of organizational environments. Human Relations, 18,
21-31.
Emmanuel, C., Otley, D. & K. Merchant. (1990). Accounting for Management Control, (2nd edn),
Wokingham, Van Nostrand Reinhold, UK.
Emsley, D., B. Nevicky, G. & Harrison. (2006). Effect of cognitive style and professional
development on the initiation of radical and non-radical management accounting innovations.
Accounting and Finance. 46: 243-264.
Ewert, R., & C. Ernst. (1999): Target Costing, Coordination, and Strategic Cost Management.
European Accounting Review, 8, 23-49.
Ezzamel, M. (1990). The impact of environmental uncertainty, managerial autonomy and size on
budget characteristics. Manage. Acc. Res., 1: 181-197.
Ezzamel, M., Lilley, S. & Willmott, H. (1997). Accounting for management and managing accounting:
Reflections on recent changes in the UK. Journal of Management Studies, 34(3), pp. 439-463.
Fabrigar, L., Wegener, D., MacCallum, R., & Strahan, E. (1999). Evaluating the use of exploratory
factor analysis in psychological research. Psychological Methods, 4, 272- 299.

Jafar Ojra - 267 -
Federation of Palestinian Chamber of Commerce, Industry & agriculture (2013). Classification of
Palestinian companies based on capital proxy. Ramallah, Palestine. http://www.pal-chambers.org/en-
us/.
Ferrell, O., & Skinner, S. (1988). Ethical behavioral and bureaucratic structure in marketing research
organizations. Journal of Marketing Research, 25, 103-109.
Firth, M. (1996). The diffusion of management accounting procedures in the People’s Republic of
China and the influence of foreign partnered join ventures. Accounting, Organizations and Society,
Vol.21, pp.629-654.
Field, A. (2005). Discovering Statistics using SPSS (2nd edition). Sage Publications (London).
Fisher, J. (1995). Contingency-based research on management control systems: Categorization by
level of complexity. Journal of Accounting Literature, 14, 24-53.
Fisher, J. G. (1998). Contingency theory, management control systems and firm outcomes: past results
and future directions. Behavioural Research in Accounting, 10, 47-64.
Fitzpatrick, A.R. (1983). The meaning of content validity. Applied Psychological Measurement, 7, 3-
13.
Floyd, F. J. & Widaman, K. F. (1995). Factor analysis in the development and refinement of clinical
assessment instruments. Psychological Assessment, 7 (3), 286 299.
Foster, G. & D. W. Swenson. (1997). Measuring the success of activity based cost management and its
determinants. Journal of Management Accounting Research, 9, 109-141.
Foster, G. & Gupta, M. (1994). Marketing, cost management and management accounting.
Management Accounting Research, 6, 43-77.
Foster, G., Gupta, M., & Sjoblom, L. (1996). Customer profitability analysis: Challenges and new
directions. Journal of Cost Management, 10, 5–17.
Franco-Santos, M. & Bourne, M. (2005). An examination of the literature relating to issues affecting
how companies manage through measures. Production Planning & Control. 16(2), pp. 114-124.
Franco-Santos, M., Kennerley, M., Micheli, P., Martinez, V., Mason, S., Marr, B., Gray, D., & Neely,
A. (2007). Towards a definition of a business performance measurement system. International Journal
of Operations & Production Management, 27, pp.784-801.
Frankfort-Nachmias, C. & Nachmias, D. (1992). Research methods in the social sciences (4th edition.).
New York: St Martin’s Press.
Fredrickson, J. W. (1984). The comprehensiveness of strategic decision processes: Extension,
observations, future directions. Academy of Management Journal, 27, 445-466.
Freeman, John Henry. (1973). Environment, Technology and Administrative Intensity of
Manufacturing Organizations. American Sociological Review, 38, 750-63.

Jafar Ojra - 268 -
Fuchs, P.H., K.E. Mifflin, et al. (2000). Strategic integration: competing in the age of capabilities.
California Management Review, V. 42, No.3, P. 118.
Galbraith, J. (1973). Designing complex organizations. Reading, MA: Addison-Wesley.
Carson, D., Gilmore, A., Gronhaug, K. & Perry, C. (2001). Qualitative Research in Marketing, Sage,
London.
Gartner, W.B., Bird, B.J. & Starr, J.A. (1992). Acting as if: differentiating entrepreneurial from
organisational behaviour. Entrepreneurship Theory and Practice, Vol. 16 No. 3, pp. 13-31.
Gerdin, J. (2005). Management accounting system design in manufacturing departments: An empirical
investigation using a multiple contingencies approach. Accounting, Organizations and Society, 30, 99-
126.
Gerdin, J., & Greve, J. (2004). Forms of contingency fit in management accounting research- A
critical review. Accounting, Organization and Society, 29, 303-326.
Ghauri, P., Grnhaug, K. & Kristianslund, I. (1995). Research Methods in Business Studies: A Practical
Guide, Prentice Hall, Hemel Hempstead.
Ghosh, B. & Chan, Y. (1997). Management Accounting in Singapore – Well inplace? Managerial
Auditing Journal, 12(1), pp.16-18.
Gibbons, J. D. (1993). The use of nonparametric methods in tax research. The Journal of the American
Taxation Association, 15(1), 110-120.
Gibbons, PT & O'Connor, T. (2005). Influences on Strategic Planning Processes Among Irish SMEs.
Journal of Small Business Management, 43(2), 170-186.
Gilbert, M. (2008). Israel-A History, 2nd
ed. Santa Barbara, CA: McNally & Loftin Publishers.
Gimbert, X., Bisbe, J., & Mendoza, X. (2010). The role of performance measurement systems in
strategy formulation processes. Long Range Planning, 43 (4), 477-497.
Glaister, W.K., Dincer, O., Tatoglu, E., Demirbag, M., & Zaim, S. (2008). A causal analysis of formal
strategic planning and firm performance: Evidence from an emerging country. Management Decision,
Vol 46, No 3, pp. 365-391.
Godfrey, P. C., & Hill, C. W. L. (1995). The problem of unobservables in strategic management
research. Strategic Management Journal, 16(7), 519-533.
Goll, I., & Rasheed, A. A. (1997). Rational decision-making and firm performance: The moderating
role of environment. Strategic Management Journal, 18(7): 583 591.
Gordon, L. A., & Miller, D. (1976). A contingency framework for the design of accounting
informations systems. Accounting, Organizations and Society, 1, 59-69.

Jafar Ojra - 269 -
Gordon LA, & Narayanan VK. (1984). Management accounting systems, perceived environmental
uncertainty and organization structure: An empirical investigation. Account.Organ. Soc., 9(2): 33-47.
Gorsuch, R. L. (1990). Common Factor-Analysis versus Component Analysis – some well and little
known facts. Multivariate Behavioural Research, 25(1), 33-39.
Gosselin M. (1997). The Effect of strategy and Organizational structure on the Adoption and
Implementation of Activity-based Costing. Accounting, Organizations and Society, 22 (2): 105-122.
Govindarajan, V. (1984). Appropriateness of accounting data in performance evaluation: An empirical
examination of environmental uncertainty as an intervening variable. Accounting, Organizations and
Society, 9 (2), 125-135.
Govindarajan, V. (1986). Decentralization, strategy, and effectiveness of strategic business units in
multi-business organizations. Academy of Management Review, Vol. 11, pp. 844-856.
Govindarajan, V. & Fisher, J. (1990). Strategy, control systems, and resource sharing: Effects on
business-unit performance. Academy of Management journal, 33, 259-285.
Govindarajan, V. & Gupta, A. K. (1985). Linking control systems to business unit strategy: impact on
performance. Accounting, Organisation and Society, 10, pp.51–66.
Govindarajan, V. & Shank, J.K. (1992). Strategic Cost Management: Tailoring Controls to Strategies.
Journal of Cost Management, Vol. 6, No. 3, pp. 14-26.
Grabski, S., Leech, S. & Sangster, S. (2009). Management accounting in enterprise resource planning
systems. Burlington, MA: Elsevier.
Granlund. M. (2001).Towards explaining stability in and around management accounting systems.
Management Accounting Research, vol. 12, n. 2, pp. 141–166.
Granlund, M. (2011). Extending AIS research to management accounting and control issues: A
research note. International Journal of Accounting Information Systems, 12(1), 3-19.
Greenwood, R. & Hinings, C. R. (1996). Understanding radical organizational change: Bringing
together the old and the new institutionalism, Academy of Management Review, 21, pp.1022–1054.
Guadagnoli, E., & Velicer, W. F. (1988). Relation of Sample-Size to the Stability of Component
Patterns. Psychological Bulletin, 103(2), 265-275.
Guba, E.G. & Lincoln, Y.S. (1994). Competing paradigms in qualitative research. Chapter 6 in N.K.
Denzin & Y.S. Lincoln (Eds).Handbook of Qualitative Research. Sage.
Guilding, C. (1992). Should management accounting take up the brand valuation challenge?
Management Accounting, 70, 44-46.
Guilding, C. (1999). Competitor-focused accounting: An exploratory note. Accounting, Organizations
and Society, 24, 583-595.

Jafar Ojra - 270 -
Guilding, C., Cravens, K. S. & Tayles, M. (2000). An international comparison of strategic
management accounting practices. Management Accounting Research, 11 (1), pp.113–135.
Guilding, C., Drury, C., & Tayles, M. (2005). An Empirical Investigation of the Importance of Cost-
plus pricing. Managerial Auditing Journal, Vol. 20 No. 2, pp. 125-137.
Guilding, C. & McManus, L. (2002). The incidence, perceived merit and antecedents of customer
accounting: an exploratory note. Accounting, Organisation and Society, 27(1/2), pp.45–59.
Guilding, C. & Moorhouse, M. (1992). The case for brand value budgeting. In C. Drury (ed)
Management Accounting Handbook. 173-195. Oxford, England: Butterworth-Heinemann Ltd.
Guilding, C. & Pike, R. (1994). Brand valuation: a model and empirical study of organisational
implications. Accounting and Business Research, 24, 241-253.
Gul, F. A., & Chia, Y. M. (1994). The effects of management accounting systems, perceived
environmental uncertainty and decentralization on managerial performance: A test of three-way
interaction. Accounting, Organizations and Society, 19, 413–426.
Gupta, A., & Govindarajan, V. (1984). Business unit strategy, managerial characteristics, and business
unit effectiveness at strategy implementation. Academy of Management Journal, 27, 25-41.
Gupta, S. & Lehmann, D. R. (2003). Customers as Assets. Journal of Interactive Marketing, Vol. 17,
No. 1, pp.9-2.
Hair, J. R., Anderson, R. T. & Black, W. (1998). Multivariate Data Analysis. (5th ed.), London:
Prentice Hall International.
Hair, J.F., R.E. Anderson, R.L. Tatham, & W.C. Black. (1992). Multivariate data analysis. 3rd ed.
New York: Macmillan Publishing Company.
Hair, J.F., Bush RP. & Ortinau DJ. (2003). Marketing research: within a changing information
environment. New York (NY): McGraw Hill/Irwin; 2003.
Hajjawi, O. (2011). Product costing in Palestinian Manufacturing Organization. European Journal of
Economics Finance and Administrative Science, Vol. 43, pp. 50-70.
Hajjawi, O. (2012a). Management accounting practice in Palestine: an empirical evidence, European
J. Economics Finance and Administrative Sciences, 49, 28-40.
Hald, K. S. & Mouritsen, J. (2013). Enterprise resource planning, operations and management:
Enabling and constraining ERP and the role of the production and operations manager. International
Journal of Operations & Production Management, Vol. 33, pp.1075-1104.
Haldma, T., & Laats, K. (2002). Contingencies influencing the management accounting practices of
Estonian manufacturing companies. Management Accounting Research, 13, 379- 400.

Jafar Ojra - 271 -
Haley, U, & Stumpf, S.A. (1989). Cognitive trails in strategic decision making: Linkage theories of
personalities and cognitions. Journal of Management Studies, 26(5), 477-497.
Hall, M. (2011). Do comprehensive performance measurement systems help or hinder manager’s
mental model development. Management Accounting Research, 68-83.
Halliday, F. (2005). 100 Myths about the Middle East. Berkley, CA: University of California Press.
Hambrick, D. (1980). Operating the concept of business-level strategy in research. Academy of
Management Review, 5, 567-576.
Harris, L. (2000). The organizational barriers to developing market orientation. European Journal of
Marketing, 34, 598-624.
Harrison, G. L. (1992). The cross-cultural generalizability of the relation between participation, budget
emphasis and job-related attitudes. Accounting, Organizations and Society, 17, 1-15.
Harrington, R., Lemak, D., Reed, R., & Kendall, K. (2004). A question of fit: The links among
environment, strategy formulation, and performance. Journal of Business and Management, 10, 15-38.
Harrison, G. L. (1993). Reliance on accounting performance measures in supervisor evaluative style:
The influence of national culture and personality. Accounting, Organizations and Society, 18, 319-339.
Hartmann, F. G. H. (2000). The appropriateness of RAPM: toward the further development of theory.
Accounting, Organizations and Society, Vol. 25, n° 4-5: pp. 451-482.
Hartmann, F., & Moers, F. (2003). Testing contingency hypotheses in budgetary research using
moderated regression analysis: A second look. Accounting, Organization & Society, 28(7&8),
October/November, 803.
Hatch, M. J. (1997). Organization Theory – Modern Symbolic and Postmodern Perspectives. New
York: Oxford University Press inc.
Hayes, R., & Abernathy, W. (1980). Managing our way to economic decline. Harvard Business
Review, 4, 67-77.
Heagy, C. D. (1991). Determining optimal quality costs by considering cost of lost sales. Journal of
Cost Management, 5, 64–72.
Healy, M & Perry, C. (2000). Comprehensive criteria to judge validity and reliability of qualitative
research within the realism paradigm. Qualitative Market Research: An International Journal, 3(3), pp.
118-126.
Heiens, R. & Pleshko, L. (2011). A contingency theory approach to market orientation and related
marketing strategy concepts: does fit relate to profit performance? Management & Marketing, 485-500.
Henri, J. F. (2006). Management control systems and strategy: a resource-based perspective.
Accounting, Organizations and Society, 31, 529-558.

Jafar Ojra - 272 -
Hergert, M., & Morris, D. (1989). Accounting data for value chain analysis. Strategic Management
Journal, 10, 175-188.
Hickson, D. J., Butler, R. J., & Wilson, D. C. (2001). The Bradford studies of strategic decision
making. Aldershot: Ashgate.
Hitt, M.A. & Tyler, B.B. (1991). Strategic Decision Models: Integrating Different Perspectives.
Strategic Management Journal, 12 (5): 327-351.
Hodge, B. J., Anthony, W. P., & Gales, L. M. (2003). Organization theory: A strategic approach
(Sixth ed.). New Jersey: Prentice Hall.
Hofstede, G. (1967). The game of budget control: How to live with budgetary standards and yet be
motivated by them. Assen: Van Gorcum & Comp.
Hofstede, G. (1980). Culture's consequences, Beverly Hills, Sage.
Hofstede, G. (1984). Cultural Consequences: International Differences in Work Values. Sage, Beverly
Hills.
Hollis, S. (1994). Statistical analysis: not just ‘p < 0.05’. Nurse Researcher 1:4, 48–67.
Hope, T. & Hope, J. (1995). Transforming the bottom line. Nicholas Brealey Publishing, London.
Hopper, T. (2000). Management accounting in less developed countries. CIMA Research Update,
No.Autumn/Winter, pp.6-7.
Hopper, T. & Hoque, Z. (2004). Accounting and Accountability in Emerging and Transition
Economies, Research in Accounting in Emerging Economies – Special Supplement 2, JAI Press,
Greenwich, CT, pp. 1-18.
Hopper T., Tsamenyi, M., Uddin, S. & Wickramasinghe, S. (2009). Management Accounting in Less
Developed Countries: What is Known and Needs Knowing. Accounting, Auditing and Accountability,
22(3): 469-514.
Hoque, Z. (2001). Strategic management accounting. Oxford: Chandos Publishing.
Hoque, Z. (2004). A contingency model of the association between strategy, environmental
uncertainty and performance measurement: impact on organizational performance. International
Business Review, 13: 485-502.
Hoque, Z. (2005). Securing institutional legitimacy or organizational effectiveness? A case examining
the impact of public sector reform initiatives in an Australian local authority. International Journal of
Public Sector Management 18(4):367 - 382.
Hoque, Z., & James, W. (2000). Linking balanced scorecard measures to size and market factors:
Impact on organizational performance. Journal of Management Accounting Research, 12, 1–17.

Jafar Ojra - 273 -
Hoque, Z. & T. Hopper. (1997). Political and industrial relations turbulence, competition and
budgeting in the nationalised jute mils of Bangladesh. Accounting and Business research, Vol.27,
pp.125-143.
Hoque, Z., Mia, L., & Alam, M. (2001). Market competition, computer-aided manufacturing and use
of multiple performance measures: an empirical study. British Accounting Review, Vol. 33 No.1,
pp.23-45.
Horngren, C. T. (1982). Cost accounting: A managerial emphasis (5th edition). NJ: Prentice-Hall, 9.
Hough, J. R., & White, M. A. (2003). Environmental dynamism and strategic decision making
rationality: An examination at the decision level. Strategic Management Journal, 24, 481-489.
Huang, C., Tayles, M. & Luther, R. (2010). Contingency factors influencing the availability of internal
intellectual capital information. Journal of Financial Reporting and Accounting, 8 (1). pp. 4-21.
Hughes, J., & Sharrock, W. (1997). The Philosophy of Social Research, 3rd edition, Pearson: Essex.
Hult, G. T., Ketchen, D. J. Jr, & Slater, S. F. (2005). Market orientation and performance: an
integration of disparate approaches. Strategic Management Journal, 26(12), pp.1173–1181.
Hunt, S. (1991). Modern Marketing Theory, Southwestern, Cincinnati.
Husted, B. W., & Allen, D. B. (2007). Strategic corporate social responsibility and value creation
among large firms: lessons from the Spanish experience. Long Range Planning, 40 (6) 594-610.
Hwang, E. J. (2005). Strategic management and financial performance in South Korean apparel retail
stores, an unpublished PhD Thesis submitted at Virginia Polytechnic Institute and State University,
US.
Hyvönen, J. (2007). Strategy, performance measurement techniques and information technology of the
firm and their links to organizational performance. Management Accounting Research, 18 (3), 343-
366.
Hyvönen, J. (2008). Linking management accounting and control systems, strategy, informational
technology, manufacturing technology and organizational performance of the firm in contingency
framework.G31 OECONOMICA, University of OULU, Finland.
Hyvönen, T., Järvinen, J, & Pellinen, J. (2003). ICT and Accounting in the Strategy Process. Frontiers
of e-business Research.
Innes, J., & Mitchell, F. (1990). Activity Based Costing: A Review with Case Studies. Chartered
Institute of Management Accountants, London.
Islam, J. & Hu, Hui. (2012). A review of literature on contingency theory in managerial accounting.
African Journal of Business Management, Vol.6 (15), pp. 5159-5164.

Jafar Ojra - 274 -
Ittner, C. D., & Larcker, D. F. (1997). Quality strategy, strategic control systems, and organizational
performance. Accounting, Organizations and Society, 22, 293–314.
Ittner, C.D.& Larcker, D.F. (1998). Are Nonfinancial Measures Leading Indicators of Financial
Performance? An Analysis of Customer Satisfaction. Journal of Accounting Research.
Ittner, C. D. & Larcker, D. F. (2001). Assessing empirical research in managerial accounting: a value-
based management perspective. Journal of Accounting Economics, 32, pp.349–410.
Ittner, C., D. Larcker, & M. Rajan. (1997). The choice of performance measures in annual bonus
contracts. The Accounting Review 72 (2): 231–255.
Ittner, C.D., Larcker, D.F. & Randall, T. (2003). Performance implications of strategic performance
measurement in financial service Firms. Accounting, Organisations and Society, 715-741.
Jacob, R. (1994). Why some customers are more equal than others. Fortune, 130, 215-220.
Jain, D. & Singh, S. S. (2002). Customer lifetime value research in marketing: a review and future
directions. Journal of Interactive Marketing, Vol. 16, No. 2, pp.34-46.
Jaworski, B., & Kohli, A. (1990). Market orientation: Antecedents and consequences. Paper presented
at the Marketing Science Conference, No. 90-123.
Jaworski, B. J., & Kohli, A.K. (1993). Market orientation: Antecedents and consequences. Journal of
Marketing, 57, 53-70.
Jermias, Johnny & Lindawati, Gani. (2002). Linking Strategic Priorities, Organizational
Configurations and Management Accounting Systems with Business Unit Effectiveness: Experience
from Indonesian Publicly Held Companies. Paper Presented at the Asian Academic Accounting
Association, Nagoya, Japan.
Jemison, D. (1984). The importance of boundary spanning roles in strategic decision making. Journal
of Management Studies, 21, 131-152.
M. Jensen. (2001). Value Maximization, Stakeholder Theory, and the Corporate Objective Function.
Journal of Applied Corporate Finance, (Fall): 8-21.
Johnson, G., & Scholes, K. (1993). Exploring corporate strategy (3rd ed.). Thousand Oaks, CA: Sage.
Johnson, P. & Duberley, J. (2000). Understanding Management Research. Sage, London.
Johnson, R. B., & Onwuegbuzie, A. J. (2004). Mixed Methods Research: A Research Paradigm
Whose Time Has Come. Educational Researcher, 33(7), 14-26.
Johnson, T. H., & Kaplan, R. S. (1987). Relevance lost: The rise and fall of management accounting.
Boston: Harvard Business School Press.
Jones, L. (1988). Competitor cost analysis at Caterpillar. Strategic Finance, 77, 32–38.

Jafar Ojra - 275 -
Joshi, P. (2001). The international diffusion of new management accounting practices: the case of
India. Journal of International Accounting, Auditing and Taxation, 10(1), pp. 85-109.
Joshi, P. L., Al-Mudhaki, J., & Bremser, W. D. (2003). Corporate Budget Planning, control and
performance evaluation in Bahrain. Managerial Auditing Journal, 18, 737-750.
Jusoh, R. (2010). The influence of perceived environmental uncertainty, firm size, and strategy on
multiple performance measure usage. African Journal of Business Management, Vol. 4(10), pp. 1972-
1984.
Jusoh R, Ibrahim DN, & Zainuddin Y. (2006). Assessing the alignment between business strategy and
use of multiple performance measures using interaction Approach, Bus. Rev. Cambridge 5:1.
Kahn, K. B. (2001). Market orientation, interdepartmental integration, and product development
performance. Journal of Product innovation management, 18, pp. 314- 323.
Kahneman, D., & Tversky, A. (1982). Variants of uncertainty. Cognition, 11, 143-157.
Kalagnanam, S.S. & Lindsay, R.M. (1998). The use of organic models of control in JIT firms:
generalising Woodward’s findings to modern manufacturing practices. Accounting, Organizations &
Society, Jan1999, Vol. 24 Issue 1, p1-30
Kandemir, D., Yaprak, A., & Cavusgil, S.T. (2006). Alliance Orientation: Conceptualization,
Measurement, and Impact on Market Performance. Journal of the Academy of Marketing Science,
34(3), 324-340.
Kantor, J., Roberts, C. B. & Salter, S. B. (1995). Financial reporting practices in Arab countries.
International Studies of Management and Organisation, Vol. 25, No. 3, pp. 31-50.
Kaplan, R.S. (1989). Management accounting for advanced technological environments. Science, Vol.
245 No.4920, pp.819-23.
Kaplan, R. S. & Atkinson, A. A. (1998).Advanced management accounting.(Vol. Third Edition).
Englewood Cliffs, NJ: Prentice-Hall.
Kaplan, R. & Cooper, R. (1998). Cost and effect: using integrated cost systems to drive profitability
and performance, Boston: Harvard Business School Press.
Kaplan, R.S. & Norton, D.P. (1992). The balanced scorecard-measures that drive performance.
Harvard Business Review, 9-71.
Kaplan, R.S. & Norton, D.P. (1993). Putting the balanced scorecard to work. Harvard Business
Review, Sept./Oct., pp.134–147.
Kaplan, R. S. & Norton, D. P. (1996). The Balanced Scorecard: Translating strategy into action,
Boston, MA, Harvard Business School Publishing.
Kaplan, R. S. & Norton, D. P. (2001). The strategy-focused organization: How Balanced Scorecard
Companies thrive in the new business environment. Harvard Business School, Boston, MA.

Jafar Ojra - 276 -
Kattan, F., Pike, R. & Tayles, M. (2007). Contingency theory of management accounting: The context
of Palestine, a proposed study. School of Business, Bethlehem University, 1-27.
Kattan, F., Pike, R. & Tayles, M. (2007). Reliance of management accounting under environmental
uncertainty. Journal of Accounting and Organisational Change, 229-247.
Keats, B., & Hitt, M. (1988). A causal model of linkages among environmental dimensions, macro
organizational characteristics, and performance. Academy of Management Journal, 31, 570-598.
Kettinger, W., Grover, V., Guha, S. & Segars, A.H. (1994). Strategic information systems revisited: a
study in sustainability and performance. MIS Quarterly, 18(1), 31-58.
Khalid, K., Hilman, H., & Kumar, D. (2012). Get along with quantitative research process.
International Journal of Research in Management, ISSN 2249-5908 Issue2, Vol. 2.
Khandwalla, P. (1972). Environment and its impact on the organization. International Studies of
Management and Organization, 2, 297-313.
Khandwalla, P. (1974). Mass output orientation of operations technology and organizational structure.
Administrative Science Quarterly, 19, 74-97.
Khandwalla, P. (1976). Some top management styles, their context and performance. Organization
and Administrative Science, 7(4), 21-51.
Khandwalla, P. (1977). The design of organizations. Harcourt Brace Jovanovoich, New York.
Kholeif, A., Abdel-Kader, M., & Sherer, M. (2007). ERP customization failure: institutionalized
accounting practices, power relations and market forces. Journal of Accounting and Organizational
Change, Vol. 3, No. 3, pp. 250-269.
Kimberly, J. R. & M. J. Evanisko. (1981). Organizational innovation: The Influence of Individual,
Organizational, and Contextual Factors on Hospital Adoption of Technological and Administrative
Innovations. The Academy of Management Journal, 24 (4), 689-713.
Kloviene, L., & Gimzauskiene, E. (2009). Performance Measurement System Changes According to
Organization‘s External and Internal Environment. Economics and Management, 14, 70-77.
Knight, F. (1921). Risk, uncertainty and profit. New York; Harper & Row.
Kober, R, Ng, J., & Paul, B.J. (2007). The interrelationship between management control mechanisms
and strategy. Management Accounting Research, (18), pp. 425-452.
Kohli, A. J. & Jaworski, B. J. (1990). Market Orientation: the Construct, Research Propositions, and
Managerial Implications. Journal of Marketing, 1-8.
Koo, C., Song, J., et al., (2007). Do e-business strategies matter? The antecedents and relationship
with firm performance. Information Systems Frontiers, 9 (3), 283–296.

Jafar Ojra - 277 -
Köseoglu's, M.A., Topalogluc, C., Parnella, J., & Lestere, D. (2013). Linkages among business
strategy, uncertainty and performance in the hospitality industry: Evidence from an emerging
economy. International Journal of Hospitality Management, 34, 81– 91.
Kuhn, T. S. (1962). The Structure of Scientific Revolutions. University of Chicago Press.
Kwock, Y. (1999). A theoretical integration and empirical test of strategic management: Environment,
strategy, structure, implementation, and performance in the hospitality industry. Unpublished doctoral
dissertation, Virginia Polytechnic Institute and State University, Blacksburg.
Laitinen, E. K. (2006). Explaining Management Accounting Change: Evidence from Finland.
International Journal Accounting, Auditing and Performance Evaluation, 3(2): pp. 252-281.
Lancaster, K. (1979). Variety, Equity, and Efficiency: Product Variety in an Industrial Society. New
York, Columbia University Press.
Langfield-Smith, K. (1997). Management control systems and strategy: A critical review. Accounting,
Organizations and Society, 22, 207-232.
Langfield-Smith, K. (2005). What do we know about management control systems and strategy? In:
Chapman, C. (Ed.), Controlling Strategy: Management, Accounting, and Performance Measurement.
Oxford University Press, Oxford, pp. 62–85.
Langfield-Smith, K. (2007). A review of quantitative research in management control systems and
strategy, in Chapman, C.S., Hopwood, A.G. and Shields, M.D. (Eds). Handbook of Management
Accounting, Vol. 2, Elsevier, Oxford, 84-753.
Langfield-Smith, K. (2008). Strategic management accounting: how far have we come in 25 years?
Accounting, Auditing and Accountability Journal, 21, 204-228.
Lawrence, P., & Lorsch, J. (1967). Organization and environment. Boston, MA: Harvard Business
School.
Layder, D. (1993). New Strategies in Social Research, Polity Press, Cambridge.
Lee, H. & Park, J. (2006). Top team diversity, internationalisation and the mediating effect of
international alliances. British Journal of Management, 17(3), pp.195-213.
Lee, J-H. & Scott, D. (2004). Measuring birding specialisation: A confirmatory factor analysis.
Leisure Sciences, 26, pp. 245-260.
Leftesi, A. (2008). The diffusion of management accounting practices in developing countries:
Evidence from Libya, unpublished PhD thesis submitted at the University of Huddersfield, UK.
Lewis, G. J., & Harvey, B. (2001). Perceived environmental uncertainty: The extension of Miller's
scale to the natural environment. Journal of Management Studies, 38(2): 201-233.

Jafar Ojra - 278 -
Lewis, R. & Chambers, R. (1989). Marketing Leadership in Hospitality-Foundation and Practice. In
Downie, N. (1997).The use of accounting information in hotel marketing decisions. Selected paper
from the IAHMS Conference at HMS Leeuwarden, The Netherlands, November 1996, International
Journal of Hospitality Management, 16(3), pp. 305-312.
Libby, T., Salterio, S. E., & Webb, A. (2004). The balanced scorecard: The effects of assurance and
process accountability on managerial judgement. The Accounting Review, 79, 1075–1094.
Libby, T., & Waterhouse, J.H. (1996). Predicting change in management accounting systems. Journal
of Management Accounting Research, 8, 137-150.
Löfsten, H. & Lindelöf, P. (2005). Environmental hostility, strategic orientation and the importance of
management accounting – empirical analysis of new technology-based firms. Technovation - An
international journal of technical innovation and entrepreneurship, Vol. 25, No. 7, pp. 725-738.
Elsevier Science.
Lonial, S., & Raju, P. (2001). The impact of environmental uncertainty on the market orientation-
performance relationship: A study of the hospital Industry. Journal of Economic and Social Research,
3(1): 5-27.
Luce, R., & Raiffa, H. (1957).Games and decisions. New York: Wiley.
Luft, J., & Shields, M. (2007). Mapping management accounting: graphics and guidelines for theory
consistent empirical research. In C. S. Chapman, A. G. Hopwood, & M. D. Shields (Eds.).Handbook
of Management Accounting Research, Vol. 1. (pp. 27−95) Oxford, UK: Elsevier.
Luther, R.G. & Longden, S. (2001). Management accounting in companies adapting to structural
change and volatility in transition economies: a South African study. Management Accounting
Research, Vol. 12 No. 3, pp. 299-320.
Kvale, S. (1996). Interviews an introduction to qualitative research interviewing, Sage Publications.
Lybaert, N. (1998). The information use in an SME: its importance and some elements of influence.
Small Business Economics, 10 (2), pp.171-191.
MacCallum, R. C. & Tucker, L. R. (1991). Representing sources of error in the Common- Factor
Model - implications for Theory and Practice. Psychological Bulletin, 109(3), 502-511.
Macy, G. & V. Arunachalam. (1995). Management control systems and contingency theory: in
research of effective systems. Advances in Management Accounting, Vol.4, pp.63-86.
Mador, M. (2000). Strategic decision making process research: Are entrepreneur and owner managed
firms different? Strategic Decision Making, 2, 215-234.
Mahama, H. (2006). Management control systems, cooperation and performance in strategic supply
relationships: A survey in the mimes. Management Accounting Research, 17, 315-339.
Mahmood, M. & Mann, G. (1993). Measuring the organizational impact of information technology
investment: An exploratory study. Journal of Manage Information System, 10, pp. 97-122.

Jafar Ojra - 279 -
Mahoney, T.A., Jerdee, T.H. & Carroll, S.J. (1963). Development of Managerial Performance: A
Research Approach, South Western Publishing, Cincinnati, OH.
Marr, B. & Schiuma, G. (2003). Business Performance Measurement - Past, Present, and Future.
Management Decision, Vol. 41, No. 8, pp. 680-687.
Marsden, P., Cook, C., & Kalleberg, A. (1994). Organizational structures. American Behavioral
Scientist, 37, 911-929.
Marsh, D. & M.J. Smith. (2001). There is More Than One Way to do Political Science: On Different
Ways to Study Policy Networks. Political Studies 49, pp. 528–541.
Marsh RM, Mannari H. (1981). Technology and size as determinants of the organizational structure of
Japanese factories. Admin. Sci. Q., 26(1): 33-57.
Marsh, D. & P. Furlong. (2002). A Skin not a Pullover: Ontology and Epistemology in Political
Science’ in D. Marsh and G. Stoker (eds.). Theory and Methods in Political Science (updated and
revised edn), Basingstoke: Macmillan, forthcoming.
Matejka, M. & De Waegenaere, A.M.B. (2000). Organizational design and management accounting
change. Discussion Paper 2000-61, Tilburg University, Centre for Economic Research.
McDougall, P., Covin, J., Robinson, Jr., R., & Herron, L. (1994). The effects of industry growth and
strategic breadth on new venture performance and strategy content. Strategic Management Journal, 15,
537-554.
McChlery, S., Godfrey, A. D., & Meechan, L. (2005). Barriers and catalysts to sound financial
management systems in small sized enterprises. Journal of Applied Accounting Research, vol.7, pp. 1-
26.
McGrath, R., MacMillan, I., & Scheinberg, S. (1992). Elitists, risk-takers, and rugged individualists?
An exploratory analysis of cultural differences between entrepreneurs and non-entrepreneurs. Journal
of Business Venturing, 7 (2), 115–136.
McManus, L. (2012). Customer accounting and marketing performance measures in the hotel industry:
Evidence from Australia. International Journal of Hospitality Management, 33, 140-152.
Mcnair, C.J. & Leibfried, K. (1992). Benchmarking: A Tool for Continuous Improvement. Omneo,
Essex Junction, TX.
Menard, Scott. (1995). Applied Logistic Regression Analysis. Sage Publications. Series:
Quantitative Applications in the Social Sciences, No. 106.
Merchant, K.A. (1981). The design of the corporate budgeting system: Influences on managerial
behaviour and performance. The Accounting Review, 56, 813-829.
Merchant, K.A. (1984). Influences on Departmental Budgeting: An Empirical Examination of a
Contingency Model. Accounting, Organizations and Society, 9, 291-310.
Jafar Ojra - 280 -
Merchant, K.A. (1985). Control in Business Organizations, Ballinger Publishing Company, New York.
Merchant, K. (1990). The effects of financial controls on data manipulation and management myopia.
Accounting, Organizations and Society, Vol. 15: pp. 297-313.
Merchant, K. A. & R. Simons. (1986). Research and Control in Complex Organizations: An
Overview. Journal of Accounting Literature, pp. 183-203.
Merriam, S.B. (1988). Case Study Research in Education: A Qualitative Approach, Jossey- Bass, San
Francisco.
Mia, L. (1993). The role of MAS information in organizations: An empirical study. British Accounting
Review, vol. 25, pp. 269-285.
Mia, L. & B. Clarke. (1999). Market competition, management accounting systems and business unit
performance. Management Accounting Research, Vol.10, pp.137-158.
Mia, L., & Chenhall, R. H. (1994). The usefulness of management accounting systems, functional
differentiations and managerial effectiveness. Accounting, Organizations and Society, 19, 1-13.
Miles, R. E. (2003). Organisational strategy, structure and process, Stanford: Stanford University
Press.
Miles, R. E., & Snow, C. C. (1978). Organizational strategy, structure and process. New York:
McGraw-Hill.
Miles RE., & Snow CC. (1994). Fit, failure, and the hall of fame: How companies succeed or fail.
Free Press, New York.
Miles, R. E., Snow, C. C., Meyer, A. D. & Coleman Jr., H. J. (1978). Organizational strategy, structure
and process. The Academy of Management Review, 3(3), pp.546-562.
Miller, D. (1987). The structural and environmental correlates of business strategy. Strategic
Management Journal, 8, 55-76.
Miller, D., & Dröge, C. (1986). Psychological and traditional determinants of structure. Administrative
Science Quarterly, 31, 539-560.
Miller, Danny & Friesen, Peter H. (1982). Innovation in Conservative and Entrepreneurial Firms: two
Models of Strategic Management. Strategic Management Journal, 3, 1-25.
Miller, G., De Meyer, A. & Nakane, J. (1992). Benchmarking Global Manufacturing, Business One
Irwin, Homewood, IL.
Miller, K. (1993). Industry and country effects on managers’ perceptions of environmental
uncertainties. Journal of International Business Studies, 24, 693-714.
Miller, P. & O’Leary, T. (1994). Accounting ‘economic citizenship’ and the spatial reordering of
manufacture. Accounting, Organizations and Society, 19(1), pp. 15-43.

Jafar Ojra - 281 -
Milliken, F. J. (1987). Three types of perceived uncertainty about the environment: State, effect, and
response uncertainty. Academy of Management Review, 12(1): 133-143.
Mintzberg, H. (1979). The structuring of organizations. Englewood Cliffs, NJ.
Moers F. (2006). Performance measure properties and delegation. The Accounting Review, vol. 81, n°4,
p. 897-924.
Moores, K., & Mula, J. (1993). Contextual and strategic impacts on the form of management
accounting system. School of Business Discussion Paper, Bond University, Gold Coast.
Monden, Y., & Hamada, K. (1991).Target costing and kaizen costing in Japanese automobile
companies. Journal of Management Accounting Research, 3, 16-34.
Moon, P., & Bates, K. (1993). Core analysis in strategic performance appraisal. Management
Accounting Research, 4, 139-152.
Moores, K., & Chenhall, R. H. (1994). Framework and MCS evidence. In K. Moores, & P. Booth
(Eds.). Strategic Management Accounting (pp. 12-26). New York: Wiley.
Morgan, M. J. (1993). Accounting for strategy. Management Accounting, pp. 20-24.
Mouritsen, J. (1999). Valuing Expressive Organisations: Intellectual Capital and the Visualisation of
Value Creation. Copenhagen Business Scholl.
Nachmias, C. F. & Nachmias, D. (2008). Research methods in the social sciences. 7thed. New York:
Worth.
Myers, M. (1997). Interpretive Research in Information Systems”, in J Mingers and F Stowell (Eds).
Information Systems: An Emerging Discipline? McGraw-Hill, London, pp 239-266.
Myers, R.H. (1990). Classical and modern regression application.2nd edition. Duxbury press. CA.
Naman, J. L., & Slevin, D. P. (1993). Entrepreneurship and the concept of fit: A model and empirical
tests. Strategic Management Journal, 14: 137-153.
Nanni, A. J., Dixon, J. R. & Vollmann, T. E. (1992). Integrated performance measurement:
management accounting to support the new manufacturing realities. Journal of Management
Accounting Research, 4, Fall, 1,19.
Nardi, P. M. (2006). Doing survey research. A guide to quantitative methods.2nd edition. Pearson
Education Inc. USA.
Narver, J. C., & Slater, S. F. (1990). The effect of market orientation on business profitability. Journal
of Marketing, 54, 20–35.
Neely, A., Adams, C. & Kennerley, M. (2002). The Performance Prism: The Scorecard for Measuring
and Managing Business Success. Financial Times Prentice Hall, Great Britain.

Jafar Ojra - 282 -
Neely, A.D. Kennerley, M.P. & Adams, C.A. (2000). The New Measurement Crisis: the Performance
Prism as a Solution, Cranfield School of Management, Cranfield.
Neely, A.D., Mills, J.F., Gregory, M.J., Richards, A.H., Platts, K.W. & Bourne, M.C.S. (1996).
Getting the Measure of Your Business. Findlay Publications, Horton Kirby.
Negandhi, A. R. & Reimann, B. C. (1972). A contingency theory of organization re-examined in the
context of a developing country. Academy of Management Journal, 15 (2), 137-146.
Neuman, W. L. (2005). Social research methods: qualitative and quantitative approaches (6th edition).
USA: Allyn & Bacon.
Nimtrakoon, S., & Tayles, M. (2010). Contingency Factors of Management Accounting Practices in
Thailand: A Selection Approach. Asian Journal of Accounting and Governance, vol.1, pp.51-78.
Nunnaly, J. (1978). Psychometric Theory. USA: McGraw-Hill.
Nyamori, R. O., Perera, M. H. B., & Lawrence, S. R. (2001). Concept of strategic change and
implications for management accounting research. Journal of Accounting Literature, 20, 62-83.
O’Connor, N. (1995). The influence of organisational culture on the usefulness of budget participation
by Singaporean-Chinese managers. Accounting, Organisations and Society, vol. 20, pp. 383–404.
O’Connor, N.G., Chow, C.W., & Wu, A. (2004). The adoption of ‘Western’ management
accounting/controls in China’s state-owned enterprises during economic transition. Accounting,
Organizations and Society, 29, 349-375.
O’Connor, N.G., Deng, J., & Luo, Y. (2006). Political constrains, organization design and
performance measurement in China’s state-owned enterprises. Accounting, Organizations and Society,
31, 157-177.
Okumus, F. (2003). A framework to implement strategies in organizations. Management Decisions, 41,
871-882.
Olsen DH & Cooney V. (2000). The strategic benefits of data warehousing: an accounting perspective.
Inform Strategy: Executive’s J Winter, 35–40.
Olve, N., Roy, J. & Wetter, M. (1999). Performance drivers: a practical guide to using the Balanced
Scorecard, John Wiley and Sons, UK.
Oppenheim, A.N. (1992). Questionnaire design, interviewing and attitude measurement. London:
Pinter Publishers.
Oppenheim A.N. (2000). Questionnaire design, interviewing and attitude measurement. (2nd ed).
London: Continuum.

Jafar Ojra - 283 -
Opute, A.P. (2009). Empirical investigation of Accounting-Marketing integration UK financial
services organisations: dimensions, antecedents and strategic marketing evidence. A PhD thesis
submitted at the University of East Anglia, Norwich, UK.
Opute, A. P., Dedoussis, E. & Tzokas, N. (2013). Building blocks of Accounting-Marketing
integration in UK financial services organization. Journal of Marketing and Operations Management
Research, Vol. 1 Issue 4, pp. 323-336.
Organ, D., & Bateman, T. (1986). Organizational behavior. Plano, TX: Business Publications.
Otley, D. T. (1980). The contingency theory of management accounting: achievement and prognosis.
Accounting, Organization and Society, 413-428.
Otley, D. T. (1983). Concepts of Control: The Contribution of Cybernetics and Systems Theory to
Management Control’. In: E. A.Lowe and J. L. J.Machin, (eds). New Perspectives in Management
Control Macmillan, London.
Özsomer, A., Calantone, R., & Benedetto, A. (1997). What make firms more innovative? A look at
organizational and environmental factors. Journal of Business & Industrial Marketing, 12, 400-416.
Palestine Stock Exchange. (2013). The main sectors in the Palestinian economy. Palestine Stock
Exchange, Ramallah, Palestine. http://www.pex.ps/marketwatch/English/SectorsMarketWatch.aspx
Palestinian Central Bureau of Statistics. (2007). Company size based on employment size, Palestinian
Central Bureau of Statistics, Ramallah, Palestine.
http://www.pcbs.gov.ps/Portals/_Rainbow/Documents/est_07a.htm
Palestinian Central Bureau of Statistics. (2009). Palestine in Figures, Palestinian Central Bureau of
Statistics, Ramallah, Palestine.
Palmer, R. J. (1992). Strategic goals and objectives and the design of strategic management accounting
systems. Advanced Management Accounting, pp.179–206.
Papadakis, V.M., Lioukas, S. & Chambers, D. (1998). Strategic decision making: the
role of management and context. Strategic Management Journal, Vol. 19, pp. 115-47.
Pappe, I. (2004). A history of modern Palestine: one land, two peoples. Cambridge: Cambridge
University Press.
Paris Protocol. (1994). The protocol on Economic Relations between the Government of the State of
Israel and the Palestine Liberation Organizations. Retrieved from
http://israelipalestinina.procon.org/view.answers.php?questionID=450.
Pearce II, J., Robbins, D., & Robinson, Jr., R. (1987). The impact of grand strategy and planning
formality on financial performance. Strategic Management Journal, 8, 125-134.

Jafar Ojra - 284 -
Pelham, A., & Wilson, D. (1996). A longitudinal study of the impact of market structure, firm
structure, strategy, and market orientation culture on dimensions of small-firm performance. Journal
of the Academy of Marketing Science, 24, 27-43.
Pennings, J. (1975). The relevance of the structural-contingency model for organizational
effectiveness. Administrative Science Quarterly, 20, 393-410.
Perera, S., Harrison, G., & Poole, M. (1997). Customer-focused manufacturing strategy and use of
operations-based non-financial performance measures: a research note. Accounting Organisations and
Society, 22 (6) (1997), pp. 557-572.
Perera, S., McKinnon, J.L., & Harrison, G.L. (2003). Diffusion of transfer pricing innovation in the
context of commercialization-a longitudinal case study of a government trading enterprise.
Management Accounting Research, Vol. 14 No.2, pp.140-64.
Perry, C., Y. Alizadeh, & A. Riege. (1997). Qualitative methods in entrepreneurship research.
Proceedings of the Annual Conference of the Small Enterprise Association of Australia and New
Zealand, Coffs Harbour, pp. 547-567.
Peters, T., & Waterman, R. (1982). In search of excellence. New York: Harper & Row.
Pfeffer, J., & Salanick, G. (1978). The external control of organizations: A resource dependence
perspective. New York: Harper & Row.
Phillips, D.C. (1987). Philosophy, science, and social inquiry. New York: Pergamon.
PIC. (2008, May 23). The banking system in Palestine. Retrieved September 6, 2011, from Palestinian
Investment Conference: http://www.palst
jp.com/eg/pdf/inv/02/The_Banking_System_in_Palestine.pdf.
Pierce, B., & O’Dea, T. (1998). Management accounting practices in Ireland. The Irish Accounting
Review, 35-66.
Pondeville, S., Swaen, V. & De Ronge, Y. (2013). Environmental management control systems: The
role of contextual and strategic factors. Management Accounting Research, Vol. 24 Issue 4, pp. 317-
332.
Porter, M. (1980). Competitive strategy: Techniques for analyzing industries and competitors. New
York: Free.
Porter, M. (1985). Competitive advantage: creating and sustaining superior performance. Free Press,
New York.
Powell, W. (1991). Expanding the scope of institutional analysis, in DiMaggio, P. and Powell, W.
(Eds). The New Institutionalism in Organizational Analysis, the University of Chicago Press, Chicago,
IL, pp. 183-203.
Power, M. (1990). Brand and goodwill accounting strategies Woodhead-Faulkner, London.

Jafar Ojra - 285 -
Pratt, Z. L. (2004). An investigation of the relationship between external environment, mission and
strategy, leadership, organizational culture and performance. Unpublished Ph.D., Michigan State
University, United States.
Pugh, D., & Hickson, D. (1976). Organizational structure in its context. Westmead, Farnborough,
England: Saxon House.
Pugh, D., Hickson, D., Hinings, C., & Turner, C. (1969). The context of organizational structures.
Administrative Science Quarterly, 14, 91-114.
Puolamäki. (2004). Strategic Management Accounting Constructions in Organisations.A Structuration
Analysis of Two Divisional Strategy Processes. Turunkauppakorkeakoulun julkaisuja. Sarja A-10.
Raaij, V. E. M., Vernooij M. J. A. & Triest, S. V. (2003). The implementation of customer
profitability analysis: A case study. Industrial Marketing Management, 32(7), pp. 573-583.
Rajagopalan, N ., Rasheed, A.M.A. & Datta D. K. (1993). Strategic decision processes: Critical review
and future directions. Journal of Management Vol. 19. No. 2, pp. 349-384.
Rangone, A. (1997). Linking organizational effectiveness, key success factors and performance
measures: An analytical framework. Management Accounting Research, 8, 207–219.
Ravid, B. (2012). ‘Israel: Palestinian economy not stables enough for independent state’. Retrieved
May, 2012, from http://www.haartez.com/blogs/diplomania/israel-palestinian-economy-not-stable-
enough-for-independent-state-1.419358.
Reid, G.C. & Smith, J.A. (2000). The impact of contingencies on management accounting system
development. Management Accounting Research, 427-450.
Rickwood, P.C., Coates, J.B & Stacey, R.J. (1990). Stapylton: strategic management accounting to
gain competitive advantage. Management Accounting Research, 37-49.
Rietveld, T. & Van Hout, R. (1993). Statistical Techniques for the Study of Language and Language
Behaviour. Berlin – New York: Mouton de Gruyter.
Robbins, S.P. (2005). Organizational Behavior (11th Ed.), Upper Saddle River, NJ: Pearson
Education, Inc.
Robson, C. (1993). Real World Research, Oxford, Blackwell.
Romanelli, E., & Tushman, M. L. (1986). Inertia, environments, and strategic choice: A quasi-
experimental design for comparative-longitudinal research. Management Science, 32: 608-621.
Roslender, R. (1995). Accounting for strategic positioning: responding to the crisis in management
accounting. British Journal of Management, 6, pp.45-57.
Roslender, R. (1996). Relevance lost and found: critical perspectives on the promise of management
accounting. Critical Perspectives in Accounting, 7, pp.533-561.

Jafar Ojra - 286 -
Roslender, R. & Hart, S. (2002a). Integrating management accounting and marketing in the pursuit of
competitive advantage: the case for strategic management accounting. Critical Perspectives on
Accounting, Vol. 14 No. 2, pp. 77-255.
Roslender, R. & Hart, S. (2002b). Marketing and management interfaces in the enactment of strategic
management accounting practices: An exploratory investigation. CIMA Publications, London.
Roslender, R. & Hart, S. (2003). In search of strategic management accounting: theoretical and field
study perspectives. Management Accounting Research, 16, pp.255-279.
Roth, K., & Ricks, D. (1994). Goal configuration in a global industry context.
Prendergast, C. (2002). Uncertainty and incentives. Journal of Labour Economics, Vol.20 ppS115-
S137.
Ruekert, R., Walker, O., Jr., & Roering, K. (1985). The organization of marketing activities: A
contingency theory of structure and performance. Journal of Marketing, 49(1), 13-25.
Ryals, L. (2008). Managing Customer Profitability, 1st edition, Chichester: John Wiley & Sons.
Ryals, L. J. and Knox, S. D. (2004). Measuring risk-adjusted customer life-time value and its impact
on relationship marketing strategies and shareholder value. European Journal of Marketing, 39(5/6),
pp.456-472.
Ryals, L. and Payne, A. (2001). Customer relationship management in financial services: towards
information-enabled relationship marketing. Journal of Strategic Marketing, 9, pp. 3-27.
Samson, D.A., Langfield-Smith, K., & McBride, P.M. (1991). The alignment of management
accounting with manufacturing priorities: a strategic perspective. The Australian Accounting Review,
pp.29-40.
Sandberg, W. R. (1986). New venture performance: The role of strategy and industry structure.
Lexington, MA: Lexington Books.
Saunders, M., Lewis, P. & Thornhill.A. (2007). Research methods for business students. 4th ed.
London: Prentice Hall.
Saunders, M., Lewis P., & Thornhill, A. (2009). Research Methods for Business Students (5thedition).
New Jersey: Prentice Hall.
Schaffer, J. (1984). Strategy, organization structure and success in the lodging industry.
Schermerborn, Jr., J. R. (1993). Management for productivity (4th ed.). New York: Wiley.
Schiffman, L. G. & Kanuk, L. L. (1997). Consumer Behaviour. London: Prentice Hall.
Schonemann, P. H. (1990). Facts, fictions, and common-sense about factors and components.
Multivariate Behavioral Research, 25(1), 47-51.

Jafar Ojra - 287 -
Scott, T. W., & Tiessen, P. (1999). Performance measurement and managerial teams. Accounting,
Organizations and Society, 24, 263-285.
Seal, W. (2001). Management accounting and the challenge of strategic focus. Management
Accounting Research, Vol. 12 (4), p. 487-506.
Sekaran, U. (2003). Research methods for business (4th edition). New York: John Wiley.
Selnes, F., Jaworski, B., & Kohli, A. (1996). Market orientation in the United States and Scandinavian
countries: A cross-cultural study. Scandinavian Journal of Management, 12, 139-157.
Selto, F. H., Renner, C. J., & Young, S. M. (1995). Assessing the organizational fit of a just-in-time
manufacturing system: Testing selection, interaction and systems models of contingency theory.
Accounting, Organizations and Society, 20, 665-684.
Shank, J. K. (1996). New wines in old bottles: Reichard Maschinen GmbH. Journal of Cost
Management, (Summer), pp.49–59.
Shank, J.K. (2007). ‘Strategic cost management: uprising, downsizing, and right (?) sizing’, in
Bhimani, A. (Ed.). Contemporary Issues in Management Accounting, Oxford University Press, Oxford,
pp. 79-355.
Shank, J. K. & Govindarajan, V. (1988). Transaction based costing for the complex product line: a
field study, Journal of Cost Management, (Summer), pp.23-31.
Shank, J. K. & Govindarajan, V. (1989). Strategic cost analysis: The evolution from managerial to
strategic accounting. Irwin, Homewood, IL.
Shank, J., K. & V. Govindarajan, V. (1991). Strategic cost management and the value chain. The
Handbook of Cost Management Accounting, B. Brinker, ed., New York: Warren, Gorham and
Lamont.
Shank, J. K. & Govindarajan, V. (1992). Strategic cost management: the value chain perspective.
Journal of Management Accounting Research, 4(Fall), pp.179-197.
Shank, J. K., & Govindarajan, V. (1993). Strategic cost management. New York: The Free Press.
Shanmugam, B. & Guru, B.K. (2003). Electronic banking in Malaysia. Institute Bank-Bank Malaysia: Kuala Lumpor.
Shenhar, A. (2001). One size does not fit all projects: Exploring classical contingency domains.
Management Science, 47, 394–414.
Sherwood, H. (2011). Israeli occupation hitting Palestinian economy, claims report: economy minister
Hasan Abu Libdeh says that Palestinians are prevented from achieving their potential. Retrieved from
http://guardian.co.uk/world/2011/sep/29/israeli-occupation-hits-palestinian-economy.
Shields, M. D. & McEwen, M. A. (1996). Implementing activity based costing systems successfully.
Journal of cost management, 9 (4), 15-22.

Jafar Ojra - 288 -
Shields, M. D., & Young, M. S. (1991). Managing product life cycle costs: An organizational model.
Journal of Cost Management, 5, 39-52.
Shortell, S. M., & Zajac, E. J. (1990). Perceptual and archival measures of Miles and Snow’s strategic
types: A comprehensive assessment of reliability and validity. Academy of Management Journal, 33,
817-832.
Shrivastava, P., & Grant, J. (1985). Empirically derived models of strategic decision making processes.
Strategic Management Journal, 6, 97-113.
Siam, H. (2009). ‘European Commission: Israeli settlements constrain Palestinian economy and
increase PA’s dependence on donor funds’, European Commission Technical Assistance Office,
Jerusalem. Retrieved May, 2012 from http://reliefweb.int/node/315697.
Sidhu, B.K. & Roberts, J.H. (2008). The marketing/accounting interface: lessons and limitations.
Journal of Marketing Management, 24(7-8), pp. 669-686.
Simmonds, K. (1981). Strategic management accountin. Management Accounting, CIMA (April),
pp.26-29.
Simmonds, K. (1982). Strategic management accounting for pricing: a case example. Accounting
Business Research, 47, pp.206-214.
Simmonds, K. (1986). The accounting assessment of competitive position. European Journal of
Marketing, 20, 16-32.
Simon H.A., (1979). Models of Thought, Yale University Press, New Haven.
Simons, R. (1987). Accounting control systems and business strategy: An empirical analysis.
Accounting, Organizations and Society, 12, 357-374.
Simons, R. (1990). The role of management control systems in creating competitive advantage: new
perspectives. Accounting, Organizations and Society, 15: 127-143.
Simons, R. (1991). Strategic Orientation and Top Management Attention to Control Systems.
Strategic Management Journal, Vol 12, pp. 49-62.
Simons, R. (1995). Levers of control, Harvard University Press, Boston, MA.
Simons, R. (2000). Performance measurement & control systems for implementing strategy. Upper
Saddle River, NJ.: Prentice-Hall.
Sisk, H., & Willams, J. (1981). Management and organization. Cincinnati, OH: South Western.
Slater, S., & Narver, J. (1994b). Market orientation, customer value and superior performance.
Business Horizons, 37(2), 22-28.

Jafar Ojra - 289 -
Slevin, D., & Covin, J. (1997). Strategy formation patterns, performance, and the significance of
context. Journal of Management, 23, 189-209.
Smart, C., & Vertinsky, I. (1984). Strategy and the environment; A study of corporate responses to
crises. Strategic Management Journal, 5, 199-213.
Smith, J. A., Morris, J., & Ezzamel, M. (2005). Organisational change, outsourcing and the impact on
management accounting. The British Accounting Review, 37(4), 415-441.
Smith, K.G., Guthrie, J.P., & Chen, M.J. (1989). Strategy size and performance. Organizational
studies, 10 (1), 63-81.
Smith, M., Abdullah, Z., Abdul-Razak, R. (2008). The diffusion of technological and management
accounting innovation: Malaysian evidence. Asian Review of Accounting, Vol. 16 No.3, pp.197-218.
Song, X. M. & Thieme, R. Jeffery (2006). A cross-national investigation of the R&D – Marketing
interface in the product innovation process. Industrial Marketing Management, 35, pp. 308-322.
Soobaroyen, T., & Sannassee, R.V. (2007). An exploratory study of financial priorities, financial
planning and control practices in voluntary organisations: perceptions of treasurers in a developing
country. Journal of Accounting & Organizational Change, Vol. 3, No. 3, pp. 270-301.
Spanos, Y. & Prastacos, G. (2004). Understanding organizational capabilities: towards a conceptual
framework. Journal of Knowledge Management, 8(3), 31-43
Spillard, P. (1985). Organization and marketing. Kent, UK: Croom Helm.
Steiger, J. H. (1990). Structural model evaluation and modi®cation: an interval estimation approach.
Multivariate Behavioural Research, 25, 173±180.
Stonich, P.J. (1982). Implementing strategy: Making strategy happen. Cambridge, MA: Ballinger.
Straub, D. W., Boudreau, M.C., & Gefen, D. (2004). Validation guidelines for IS positivist research.
Communications of the Association for Information Systems, 13, 380-427.
Szychta, A. (2002). The scope of application of management accounting methods in Polish enterprises.
Management Accounting Research, Vol. 13 No. 4, pp. 401.
Tayles, M., Woods, M. & Seary, D. (1996). The cost of process quality: opportunities for new
accounting practices. Management Accounting, 74 (10), pp.28–31.
Taylor DW. (1996). Sub-cultural values and budget-related performance evaluation: Impact on
international joint-venture managers. Int. J. Bus. Stud. 4(1): 35-50.
Terreberry, S. (1968). The evolution of organizational environments. Administrative Science Quarterly,
12, 590-613.
Thompson, J. (1967). Organizations in action. New York: McGraw-Hill.

Jafar Ojra - 290 -
Thorndike, R. M., Cunningham, G. K., Thorndike, R. L., & Hagen E. P. (1991). Measurement and
Evaluation in Psychology and Education. USA: Macmillan Publishing Company
Thurstone, L. L. (1931). Multiple Factor Analysis. Psychological Review, 38(5), 406-427.
Tomkins, C. & Carr, C. (1996). Reflections on the papers in this issue and a commentary on the state
of strategic management accounting. Management Accounting Research (Special Issue): Strategic
Management Accounting, 7(2), pp.271-280.
Trkman P. & McCormack K. (2009). Supply chain risk in turbulent environments: A conceptual
model for managing supply chain network risk. Int. J. Production Economics, Volume 119, 2009, pp.
247-258.
Tse, E. (1991). An empirical analysis of organizational structure and financial performance in the
restaurant industry, 12(2), 59-72.
Tsoukas, H. (1989). The validity of idiographic research explanations. In Plakoyiannaki, M-E (2002).
Customer relationship management: the effect of organisational culture – a longitudinal case study.
Unpublished PhD thesis of the University of Strathclyde.
Tuan Mat, T. (2010). Management accounting and organizational change: impact of alignment of
management accounting system, structure and strategy on performance. Retrieved from
http://ro.ecu.edu.au/theses/149
Tung, R. (1979). Dimensions of organizational environments: An exploratory study of their impact on
organization structure. Academy of Management Journal, 22, 672-693.
UN Conference on Trade and Development (2009) Report on UNCTAD assistance to the Palestinian
people: Developments in the economy of the occupied Palestinian territory. Retrieved from
http://unctad.org/en/Docs/tdb56d3_en.pdf.
UN General Assembly (2012). Occupation Imposes ‘Huge Price Tag’ without which Palestinian
economy would be double its size, United Nations Seminar Told, GA/PAL/1220.New York:
Department of Public Information, News and Media Division. Retrieved from
http://www.un.org/News/Press/docs2012/gapal1220.doc.htm.
UN Office, for the Coordination of Humanitarian Affairs (2007) Occupied Palestinian Territory: West
Bank Closures and Access. Retrieved from http://www.ochaopt.org
Valanciene, L., & Gimzauskiene, E. (2007). Changing role of management accounting: Lithuanian
Experience case studies’.Inzinerine Ekonomika-Engineering Economics (5), 16-23.
Van der Stede, Wim A. Young, S. Mark & Xiaoling Chen, Clara. (2007). Doing management
accounting survey research In: Chapman, Christopher S. and Hopwood, Anthony G. and Shields,
Michael D., (eds.). Handbook of management accounting research. Elsevier Science, 445-478.
Van de Ven AH, & Drazin R. (1985). The concept of fit in contingency theory. Res. Organ. Behav.,
7(4): 333-365.

Jafar Ojra - 291 -
Van de Ven AH, Ferry DL. (1980). Measuring and Assessing Organizations, New York, John Wiley
and Sons.
Van-Triest, S., & Elshahat, M. F. (2007). The use of costing information in Egypt: a research note.
Journal of Accounting & Organizational Change, 3(3), pp. 329-343.
Van Nguyen, H. & Brooks, A. (1997). An empirical investigation of adoption issues relating to
activity-based costing. Asian Accounting Review, 5: 1-18.
Velicer, W. F., & Jackson, D. N. (1990). Component Analysis Versus Common Factor-Analysis –
Some Further Observations. Multivariate Behavioral Research, 25(1), 97 114.
Verbeeten, F.H.M. (2010). Effects of business strategy, structure and technical innovativeness on
change in management accounting and control systems at the business unit level: an empirical study.
International Journal of Management, 27, 123-143
Vogel, V., Evanshitzky, H., & Ramaseshan, B. (2008). Customer Equity drivers and future sales.
Journal of Marketing, Vol. 72, pp. 98-108.
Wally, S., & Baum, J. R. (1994). Personal and structural determinants of the pace of strategic decision
making. Academy of Management Journal, 37: 932-956.
Wang, P., & Chan, P. (1995). Top management perception of strategic information processing in a
turbulent environment. Leadership & Organization Development Journal, 16, 33-43.
Ward, K. (1992). Strategic management accounting. Oxford: Butterworth-Heinemann.
Waterhouse, J., & Tiessen, P. (1978). A contingency framework for management accounting systems
research. Accounting, Organizations and Society, 3, 65-76.
Waterman, R. (1987). The renewal factor. New York: Bantam.
Watson, D. (1975). Contingency formulation structure: Implications for managerial accounting. In
Leslie Livingston (Ed.). Managerial accounting the behavioural foundation.
Waweru, N. (2008). Predicting change in management accounting system: the effects of competitive
strategy. Global Journal of Business Research, Vol 2, No. 1.
Waweru, M.N & Uliana, E. (2005). Predictors of management accounting change in South Africa:
evidence from five retail firms. SA Journal of Accounting Research, Vol. 19 (1), p. 37-71.
Waweru, N. M., Hoque, Z., & Uliana, E. (2004). Management accounting change in South Africa:
case studies from retail services. Accounting, Auditing and Accountability Journal, Vol. 17 No. 5, pp.
675-704.
Werner, S., Brouthers, L. E., & Brouthers, K. D. (1996). International risk and perceived
environmental uncertainty: The dimensionality and internal consistency of Miller's measure. Journal
of International Business Studies, 27(3): 571-587.

Jafar Ojra - 292 -
Widener, S. (2004). An empirical investigation of the relation between the use of strategic human
capital and the design of the management control system. Accounting, Organization & Society,
29(3&4), April/May, 37.
Williams, J.J. & Seaman, A.E. (2001). Predicting change in management accounting systems:
National culture and industrial effects. Accounting, organizations and Society, Vol. 26 (4), pp. 443-
460.
Wilson, R.,M., S.(1995). Strategic Management Accounting”, (in Ashton, D., Hopper, T. and Scapens,
R.-Ed. Issues in Management Accounting, Second Edition, London: Prentice Hall.
Wilson, R. M. S. (1999). Accounting for Marketing, ITP/CIMA, London.
Woodridge, B. & Floyd, S.W. (1990). The strategy process, middle level management and
organisational performance. Strategic Management Journal, 231-241.
Woods, M., Taylor, L., & Ge Fang, G. C. (2012). Electronics: a case study of economic value added in
target costing. Management Accounting Research, 23(4): 261.
Woodward, J. (1965). Industrial organization: Theory and practice. New York: Oxford University
Press.
World Bank, (2004). Four years- Intifada, closures and Palestinian economic crisis: an assessment.
Retrieved September 8, 2011, from World Bank:
http://siteresources.worldbank.org/INTWESTBANKGAZA/Resources/wbgaza-4yrassessment.pdf.
World Bank (2012). Towards economic sustainability of a future Palestinian state: promoting private
sector-led growth. www.worldbank.org/we
Wu, J., Boateng, A. & Drury, C. (2007). An analysis of the adoption, perceived benefits, and expected
future emphasis of Western management accounting practices in Chinese SOEs and JVs. The
International Journal of Accounting, 42(2), pp. 171–185.
Xie, Wallace N. Davidson III & Peter J. DaDalt. (2003). Earnings management and corporate
governance: the role of the board and the audit committee. Journal of Corporate Finance, 9, 295– 316
Yasai-Ardekani, M., & Haug, R. (1997). Contextual determinants of strategic planning processes.
Journal of Management Studies, 34, 729-767.
Young, S. M., & Selto, F. H. (1991). New manufacturing practices and cost management: A review of
the literature and directions for research. Journal of Accounting Literature, 10, 265-298.
Zaltman, G., Duncan, R., & Holbek, J. (1973). Innovations and organizations. New York: Wiley.
Zeithaml, V. A. (2000). Service quality, profitability, and the economic worth of customers: what we
know and what we need to learn. Academy of Marketing Science Journal, 28, 67-85.
Zeithaml, C., Berry, L., & Parasuraman, A. (1988). Communication and control processes in the
delivery of service quality. Journal of Marketing, 52(2), 35-48.
Jafar Ojra - 293 -
Zikmund, W. G. (1997). Business Research Method. (Fifth edition). The Dryden press, Harcourt Brace
College Publishers, Orlando, Florida.
Zikmund, W. G. (2000). Business Research Methods (6th edition). USA: Harcourt.
Zikmund, W.G. (2003). Business Research Methods, (7th edition), Thompson South-Western: Ohio.

Jafar Ojra - 294 -
Appendices
Appendix 1: English Version of the Questionnaire
GENERAL INSTRUCTIONS
1. The purpose of this study is to explore Strategic Management Accounting (SMA) practices
of Palestinian companies, and how these practices influence financial and non-financial
performance of the companies.
2. Please ensure you read and answer all questions. If you are not sure about any of the
questions, please estimate the information to the best of your ability. It is important that all
questions are answered and none are left out.
3. Questions are grouped into two main parts. Part one, deals with general demographics
about your organisation and respondents. Part two which is subdivided into sections, deals
with strategic management accounting practices.
4. The Code of Conduct for Social Science Research applies to this research, therefore, all
responses will be kept strictly confidential and neither the company nor the respondent will
be identifiable.
5. In the last page of this questionnaire a glossary of terms has been presented to enable you to
understand the terms and their contexts within the study.
6. I would like to remind you that participation in this study is optional and you are free to
withdraw at any time.

Jafar Ojra - 295 -
Part One: This part will ask you to provide specific information about your organisation and
yourself.
F. What is your current job title? ………………………………………………………………………………………………………
G. How long (years) have you been in this position? ………………………………………………………………………………………………………. H. How long (years) have you worked for this company? ………………………………………………………………………………………………………. I. How many years of total working experience do you have in your field? ………………………………….
J. Which of the following reflects the highest qualification you obtained?
High School level [] Bachelor Degree [] Postgraduate Degree Master [] Postgraduate PhD []
Professional qualifications [] (please specify)……………..………………..
None [] Other [] (please specify)………………………………….
E. How many years has your organisation been operating?
Less than 5 years [] between 5 – 10 years [] between 11 – 15 years []
between 16 – 20 years [] between 21 – 25 years [] More than 25 years []
B. What is the approximate balance sheet value of your organisation’s total asset? (US Dollar)…………………..
K. What is your gender? Male [] Female []
L. What is your age? ………………………………………………………………………………………………………
M. Are you willing to have an interview? No [] Yes [] Contact email, please…………………………………………
D. What is the approximate number of employees in your organisation? …………………………..
A. Your organisation is classified as:
Investment sector [] Industry sector [] Banking and financial services sector [] Insurance sector [] Service sector []
C. What is the total revenue of your organisation for the last financial year? (US Dollar)………………….

Jafar Ojra - 296 -
Part Two: Operational Activities
Section A. Strategic Management Accounting Techniques
According to the definitions provided in the glossary at the end of the questionnaire, to what extent does
your organisation use the following accounting techniques? Using the scale ranging from
“1” [not at all] to “7” [to a great extent] tick the most appropriate box.
1. Attribute costing………………………………………………………………………
2. Life-cycle costing……………………………………………………………………..
3. Quality costing………………………………………………………………………..
4. Target costing…………………………………………………………………………
5. Value-chain costing…………………………………………………………………...
6. Benchmarking…………………………………………………………………………
7. Integrated performance measurement (balanced scorecard)………………………….
8. Strategic costing (strategic cost management)……………………………………….
9. Strategic pricing………………………………………………………………………
10. Brand valuation………………………………………………………………………
11. Competitor cost assessment……………………………………………………….....
12. Competitive position monitoring…………………………………………………….
13. Competitor performance appraisal…..……………………………………………….
14. Customer profitability analysis………………………………………………………
15. Lifetime customer profitability analysis…………………………………………......
16. Valuation of customers as assets…………………………………………………….
□ □ □ □ □ □ □
□ □ □ □ □ □ □
□ □ □ □ □ □ □
□ □ □ □ □ □ □
□ □ □ □ □ □ □
□ □ □ □ □ □ □
□ □ □ □ □ □ □
□ □ □ □ □ □ □
□ □ □ □ □ □ □
□ □ □ □ □ □ □
□ □ □ □ □ □ □
□ □ □ □ □ □ □
□ □ □ □ □ □ □
□ □ □ □ □ □ □
□ □ □ □ □ □ □
□ □ □ □ □ □ □
1 2 3 4 5 6 7

Jafar Ojra - 297 -
Section B: Business Strategy
Below is a description of two imaginary organisations A and B. Please, read the characteristics and assess
which one describes your organisation best. Then place your organisation on the scale provided by
circling one of the 7 numbers, whereby a (1) is a perfect representation of organisation A, and a (7)
represents organisation B.
Section C: Technology
Please, indicate on the scale below ranging from “1” [not at all] to “7” [to a great extent] the extent to
which below features describe technological environment of your organisation. Please, tick the most
appropriate box.
1. Technology is a core element of the operating system of this organisation…………….
2. Our production/services techniques are technology based………………………………
3. The accounting information system is computer based………..………………………..
4. We invest in software packages to aid our accounting and other operational system......
1 2 3 4 5 6 7
My Organisation A Stable products and services
Constant competition
Ignore any changes that are not affected by
current operations
Keep doing the best job in its existing arena
Focus on efficiency/Cost control
My Organisation B Diversity of products and services
Dynamic competition
Respond to market need
Wide range of environmental and market
information
□ □ □ □ □ □ □
□ □ □ □ □ □ □
□ □ □ □ □ □ □
□ □ □ □ □ □ □
1 2 3 4 5 6 7

Jafar Ojra - 298 -
Section D: Organisational Environment Please, indicate on the scale below ranging from “1” [Strongly Disagree] to “7” [Strongly Agree]) the
extent to which below features describe the environment of your organisation. Please, tick the most
appropriate box.
1. Many promotion wars occur in our industry……………………………………………..
2. Anything that one competitor in our industry can offer, others can match readily……….
3. One hears of new competitive moves in our industry almost every day………………….
4. The current business environment is threatening the survival of ourorganisation …........
5. Tough price competition is threatening our organisation ………………………………..
6. Competitors’ product quality or novelty is threatening our organisation ……………......
7. Sometimes our customers are very price sensitive………………………………………..
8. We are witnessing demand for our products and services from customers who
never bought them before…………………………………………………………………….
9. New customers tend to have product-related needs that are different from those
of our existing customers…………………………………………………………………….
10. Our customers tend to look for new products and services all the time…………………
Section E: Organisational Structure
Please, indicate on the scale below ranging from “1” [Strongly Disagree] to “7” [Strongly Agree]) the
extent to which below features describe the structure of your organisation.
1. Employees in our organisationare allowed to make their own decisions without
checking with anybody else……………………………………………………………….…..
2. My usual experience with our organisationinvolves doing things “by the rule book”……
3. Many activities in our organisationare not covered by formal procedures….…………….
4. Even small matters in our organisationmust be referred to someone higher up
for a final answer………………………………………………………………………………
5. Any major decisions that employees make must havethe approval of top managers……..
6. Employees who want to make their own decisions would be quickly discouraged……….
□ □ □ □ □ □ □
□ □ □ □ □ □ □
□ □ □ □ □ □ □
□ □ □ □ □ □ □
□ □ □ □ □ □ □
□ □ □ □ □ □ □
1 2 3 4 5 6 7
□ □ □ □ □ □ □
□ □ □ □ □ □ □
□ □ □ □ □ □ □
□ □ □ □ □ □ □
□ □ □ □ □ □ □
□ □ □ □ □ □ □
□ □ □ □ □ □ □
□ □ □ □ □ □ □
□ □ □ □ □ □ □
□ □ □ □ □ □ □
1 2 3 4 5 6 7

Jafar Ojra - 299 -
Section F: Organisational Performance
Please, indicate on the scale below ranging from ‘‘1” [below average] to ‘‘7” [above average] your
organisation’sperformance relative to your competitors on each of the following criteria. Please, tick the
most appropriate box. To the best of your knowledge (it is not expected for your answer to be entirely
accurate).
1. Return on investment……………………………………………
2. Sales margin…………………………………………………….
3. Capacity utilisation……………………………………………..
4. Market share…………………………………………………….
5. Customer satisfaction……………………………………………
6. Product/service quality…………………………………………..
7. Development of new products/services………………………….
Thank you very much for your time and engagement in completing the questionnaire!
□ □ □ □ □ □ □
□ □ □ □ □ □ □
□ □ □ □ □ □ □
□ □ □ □ □ □ □
□ □ □ □ □ □ □
□ □ □ □ □ □ □
□ □ □ □ □ □ □
1 2 3 4 5 6 7

Jafar Ojra - 300 -
Appendix 2: Arabic Version of the Questionnaire
تعليمات عامة
هدف هذه الدراسة هو البحث في مدى ممارسة المحاسبة االدارية لدى المؤسسات الفلسطينية، و كيف تؤثر هذه -1
األداء المالي و غيرالمالي للمؤسسة. علىالممارسات
ب . في حال عدم التأكد من فهم أحد األسئلة يرجى تقريءة األسئلة كاملة ثم اإلجابة عليهاالرجاء التأكد من قرا -2
المعلومة ألقصى حد ممكن، و التأكد من اإلجابة عن جميع األسئلة.
االسئلة مقسمة الى مجموعتين: الجزء األول يتعلق بالطبيعة الديموغرافية للشركة و المشارك، و -3
الجزء الثاني )مقسم الى مقاطع(، و يتعلق بممارسة المحاسبة االدارية.
االجتماعية تنطبق على هذه الدراسة، بذلك يمكنك التأكد ان المعلومات الواردة في االستبيان قواعد السلوك في العلوم -4
ستستخدم لألبحاث األكاديمية فقط و ستبقى سرية للغاية.
في الصفحة االخيرة من االستبيان، مجموعة من المصطلحات موجودة لتساعدك على فهم المصطلحات الموجودة في -5
االستبيان.
للتذكير، المشاركة في تعبئة االستبيان هو اختياري و يمكنك االنسحاب بأي قت من هذه الدراسة. -6

Jafar Ojra - 301 -
الشركة التي تعمل بها وعلى نفسك الجزء االول: هذا الجزء يتضمن مجموعة من االسئلة على
...................ح. ما هو موقعك الوظيفي الحالي لدى المؤسسة؟ .....................................................................
..........خ. كم فترة وأنت تعمل في هذا الموقع الوظيفي؟ ..............................................................................
............ د. كم فترة وأنت تعمل في هذه الشركة؟ ............................................................................
.............................ذ. كم اجمالي فترة خبرتك في هذا المجال؟ ...........................................................
ر. ما هي اعلى درجة شهادة حصلت عليها؟
[]درجة الدكتوراة []درجة الماجستير []درجة البكالوريس []مستوى التوجيهي
.......................)أذكرها(................................................................... []مؤهالت او شهادات مهنية
)أذكرها(.......................................................................................... []أخرى []الشيء
أسيسها؟ج. كم سنة تعمل المؤسسة منذ ت
[]سنة 15 – 11بين []سنوات 10 – 5بين [] سنوات 5أقل من
[]سنة 25أكثر من []سنة 25 – 21بين []سنة 20 – 16بين
............................... )دوالر أمريكي( ب. كم تقريبا القيمة االجمالية لألصول في الشركة التي تعمل بها؟
[]انثى []ذكر ز. ما هو جنسك؟
..........................................س. ما هو عمرك؟
[]ال []ش. هل لديك الرغبة في عمل مقابلة معنا؟ نعم
البريد االلكتروني:...............................................................
ث. ما هو المجموع التقريبي للعاملين الحاليين الذي بعملون لدى المؤسسة؟ ..............................
أ. تحت أي قطاع تصنف مؤسستك:
[]قطاع البنوك والخدمات المالية []قطاع الصناعة []قطاع االستثمار
[]قطاع الخدمات []قطاع التأمين
االيرادات لدى المؤسسة التي تعمل بها للسنة المالية الماضية؟ .............................. )دوالر أمريكي(ت. ما هو اجمالي

Jafar Ojra - 302 -
األنشطة التنفيذية الجزء الثاني:
المحاسبة االداريةأ( تقنيات استراتيجية
وفقا الى المصطلحات الموجودة في الصفحة االخيرة من االستبيان، الى أي حد تلتزم المؤسسة التي تديرها باألمور التالية؟
" ]الى حد كبير[ . ضع عالمة في المربع األنسب.7" ]ال على االطالق[ الى "1على مقياس "
.... ............ نظام التكاليف بالمساهمة..............................................................1
...... تكاليف دورة حياة المنتج........................................................................2
................ تكاليف الجودة...........................................................................3
.................................المستهدفة...................................................التكاليف . 4
......................... تحليل/تكلفة سلسلة القيمة.....................................................5
......................المقارن(.................................... مفهوم المقارنة باالفضل )االداء 6
..................... القياس المتوازن لالداء............................................................7
............... التكاليف االستراتيجية ) ادارة التكاليف االستراتيجية(............................8
.............. التسعير االستراتيجي.....................................................................9
..................... تقييم العالمة التجارية............................................................11
............................................................................. تقييم تكلفة المنافس.......11
......... متابعة الموقف التنافسي....................................................................12
.........................تقييم االداء التنافسي بناء على القوئم المالية المنشورة..................13
................ تحليل ربحية المستهلك...............................................................14
.................. تحليل فترة حياة ربحية المستهلك.................................................15
..................ودات.................................................. تقييم العمالء كأصول/موج16
□ □ □ □ □ □ □
□ □ □ □ □ □ □
□ □ □ □ □ □ □
□ □ □ □ □ □ □
□ □ □ □ □ □ □
□ □ □ □ □ □ □
□ □ □ □ □ □ □
□ □ □ □ □ □ □
□ □ □ □ □ □ □
□ □ □ □ □ □ □
□ □ □ □ □ □ □
□ □ □ □ □ □ □
□ □ □ □ □ □ □
□ □ □ □ □ □ □
□ □ □ □ □ □ □
□ □ □ □ □ □ □
1 2 3 4 5 6 7

Jafar Ojra - 303 -
لعملب( استراتيجية ا
التالي هو وصف لمؤسستين افتراضيتين )أ و ب(. الرجاء قراءة خواص كل منها و تقدير ايهما األقرب لتمثيل مؤسستك. ضع
دائرة حول الرقم )الدرجة( األنسب لتمثيل مؤسستك حيث )1( تمثل المؤسسة _أ_ بشكل كامل، و )7( تمثل المؤسسة _ب_ بشكل
كامل.
التكنولوجيا و تطبيقياتها ت)
" ]الى حد كبير[، بما يمثل البيئة التكنولوجية 7" ]ال على االطالق[ الى "1في المقياس التالي ، ضع عالمة على احد األرقام من "
.للمؤسسة. ضع عالمة في المربع األنسب
................ ..... التكنولوجيا عنصر أساسي في نظام التشغيل لهذه المؤسسة..........................1
................. منتجاتنا و خدماتنا تعتمد على التكنولوجيا بشكل كبير.....................................2
.............النظام المحاسبي للشركة يعتمد على البرامج المحاسبية االلكترونية.........................3
.......... نستثمر في حزم برمجية لدعم أنظمة المحاسبة و أنظمة تشغيل أخرى........................4
ث( بيئة العمل
" ]اوافق بشدة[ بما يمثل بيئة العمل لدى 7" ]ال أوافق بشدة[ الى "1في المقياس التالي، ضع عالمة على أحد األرقام، من "
مؤسستك. ضع عالمة في المربع األنسب.
...........مجالنا............................................ حصول العديد من المشاكل حول الترقية في 1
......... أي شيء يعرضه المنافس في مجالنا، يستطيع اآلخرون تطبيقه مباشرة.....................2
...... ظهور العديد من الحركات التنافسية في مجالنا كل يوم............................................3
........................ بيئة العمل الحالية تهدد بقاء شركتنا..................................................4
....................... حدة المنافسة في األسعار تهدد بقاء شركتنا..........................................5
................... ....شركتنا........................................... جودة منتجات المنافسين تهدد بقاء 6
........................ احيانا يكون زبائننا معنيين لحد كبير في السعر....................................7
...................قبل.................. يوجد طلب على منتجاتنا و خدماتنا من زبائن لم يشتروها من 8
.............. زبائننا الجدد لديهم احتياجات متعلقة بالمنتج تختلف عن تلك لدى الزبائن األصليين..9
........................ يميل زبائننا للبحث على منتجات و خدمات جديدة طوال الوقت..............11
ب المؤسسة
خدمات و منتجات متنوعة
منافسة ديناميكية
االستجابة الحتياجات السوق
نطاق واسع من المعلومات البيئية و السوقية
ة أالمؤسس
خدمات و منتجات ثابتة
منافسة مستمرة
متأثرة بالعمليات الراهنةتتجاهل أي تغيرات غير
دائما تقدم األفضل في المجال
رقابة التكاليف ةتركز على الكفاء
1 2 3 4 5 6 7
1 2 3 4 5 6 7
□ □ □ □ □ □ □
□ □ □ □ □ □ □
□ □ □ □ □ □ □
□ □ □ □ □ □ □
1 2 3 4 5 6 7
□ □ □ □ □ □ □
□ □ □ □ □ □ □
□ □ □ □ □ □ □
□ □ □ □ □ □ □
□ □ □ □ □ □ □
□ □ □ □ □ □ □
□ □ □ □ □ □ □
□ □ □ □ □ □ □
□ □ □ □ □ □ □
□ □ □ □ □ □ □

Jafar Ojra - 304 -
ج( الهيكل التنظيمي
" ]اوافق بشدة[ بما يمثل مؤسستك. ضع عالمة في المربع 7" ]ال أوافق بشدة[ الى "1ضع عالمة على الرقم المناسب، من "
األنسب.
.......................يسمح للموظفون اتخاذ القرارات دون الرجوع إلى اي شخص آخر............1
................... خبرتي االعتيادية في هذه الشركة تتطلب عمل المهام حسب "كتاب القوانين"..2
...............في شركتنا ال تنفذ باجراءات رسمية............................... العديد من النشاطات 3
. حتى االمور الصغيرة في شركتنا يجب مراجعتها مع شخص4
..... .....اعلى رتبة للحصول على اجابة نهائية.............................................................
. كل القرارات الهامة التي يتخذها الموظفون يجب5
.......ان يتم الموافقة عليها من مدير أعلى...................................................................
....... الموظفون الذين يودون اتخاذ قراراتهم الخاصة يحبطون بسرعة..............................6
األداء التنظيمي ح(
[ بما يمثل مؤسستك بالنسبة لمنافسيك . فوق المتوسط" ]7" ]اقل من المتوسط[ الى "1ضع عالمة على الرقم المناسب، من "
ضع عالمة في المربع األنسب.
(من غير المتوقع إلجابتك أن تكون دقيقة تماما(.
............... .........معدل العائد على االستثمار........ .1
........... ....هامش المبيعات............................... .2
.... .......الطاقة االستيعابية................االستفادة من .3
... ...الحصة السوقية....................................... .4
..... ....رضا العمالء....................................... .5
.................. ...جودة المنتج و الخدمة................ .6
................تطوير منتجات وخدمات جديدة.......... .7
شكرا جزيال لوقتكم في تعبئة هذا االستبيان
1 2 3 4 5 6 7
□ □ □ □ □ □ □
□ □ □ □ □ □ □
□ □ □ □ □ □ □
□ □ □ □ □ □ □
□ □ □ □ □ □ □
□ □ □ □ □ □ □
1 2 3 4 5 6 7
□ □ □ □ □ □ □
□ □ □ □ □ □ □
□ □ □ □ □ □ □
□ □ □ □ □ □ □
□ □ □ □ □ □ □
□ □ □ □ □ □ □
□ □ □ □ □ □ □

Jafar Ojra - 305 -
Appendix 3: Covering Letter of the Survey Questionnaire in English
Strategic Management Accounting (SMA) and Performance in
Palestinian Companies
The Chief Accountant/Chief Controller/Chief Financial Officer… …………………………………..
…………………………………..
…………………………………..
Date:
Dear Mr/Mrs/Ms/Dr/Prof. ………….,
I am a PhD candidate in the Norwich Business School at the University of East Anglia, United
Kingdom. I would like to invite you to take part in my research. I am exploring Strategic Management
Accounting (SMA) practices of Palestinian companies, and how these practices influence financial and
non-financial organisational performance and I would really value your input.
I am sending this invitation to the Chief Accountant, Chief Controller or Chief Financial Officer
in participating organisations. In particular, this invitation was sent to the most suitable person
among of the three named above to fill the questionnaire.
This questionnaire should take you approximately 20 minutes to complete. I would be very grateful if
you could take the time to complete the questionnaire and return it to me within four weeks of
receiving it.
Once I have analysed the data from the completed questionnaires, I would like to share the results with
you. I will send you an executive report of the aggregated and fully anonymised results and
recommendations, including responses from top Palestinian companies. You can be assured that any
information you provide is intended for academic research only and will be kept strictly confidential.
Your opinion is valuable to this research. The success of this study depends greatly on your
participation in answering all the questions in the questionnaire. If you have any question, please feel
free to contact me or my supervisor Dr Pinar Uslu. Our contacts details are provided below.
Thank you for taking the time to read this letter. I would like to express my gratitude in advance for
your valuable time and cooperation.
Sincerely,
Jafar Ojra (PhD candidate) Dr Pinar Guven Uslu
Email: [email protected] Email: [email protected]
Phone: +972 595 895 811 Phone: +44 1603 591 179

Jafar Ojra - 306 -
Appendix 4: Covering Letter of the Survey Questionnaire in Arabic
استراتيجيةالمحاسبة االدارية في المؤسسات )الشركات( الفلسطينية
مدير المحاسبة/مدير الرقابة/المدير المالي
......................................................
......................................................
......................................................
التاريخ:
عزيزي السيد/ االستاذ/ الدكتور:
عزيزتي السيدة/ االستاذة/ الدكتورة:
انا طالب دكتوراة في تخصص المحاسبة من جامعة ايست انجليا في بريطانيا. ادعوكم للمشاركة في الدراسة التي اقوم
األداء علىبها و التي تبحث في موضوع مدى ممارسة المحاسبة االدارية لدى المؤسسات، و كيف تؤثر هذه الممارسات
كثيرا. المالي و غيرالمالي للمؤسسة. اقدر لكم مشاركتكم
هذه الدعوة موجهة الى مدير المحاسبة, مدير الرقابة أو المدير المالي في المؤسسات المشاركة. بالتحديد، هذه الدعوة موجهة
الى اكثر شخص كفؤ من بين الثالثة المسماه اعاله لتعبئة االستبيان.
الوقت الكافي لتعبئته وأرجو بعد ذلك اذا دقيقة. من فضلك، احصل على 21تعبئة االستبيان سوف يأخذ من وقتك تقريبا
كان باالستطاع اعادته خالل اربعة اسابيع من استالمه.
بعد ان اقوم بتحليل البيانات و المعلومات من االستبيانات المشاركة، سأشارككم النتائج التي توصلت اليها و ابعث لكم تقرير
للمصادر، بما في ذلك ردود افضل المؤسسات الفلسطينية. يمكنك التأكد تنفيذي عن النتائج و التوصيات المجملة بدون ذكر
على ان كل المعلومات الواردة في االستبيان سوف تستخدم لالبحاث االكاديمية قفط وسوف تكون سرية للغاية.
ألسئلة . ألي رأيكم يسعى بالكامل في تحقيق هدف هذه الدراسة و نجاحها يعتمد على مشاركتكم في االجابة عن جميع ا
استفسار بيانات التواصل مدرجة في أسفل الصفحة. يمكنك التواصل معي مباشرة او مع المشرف االكاديمي.
أشكركم لتعاونكم بقراءة هذه الرسالة ولوقتكم الثمين لتعبئة االستبيان والمساهمة في تطور اقتصادنا و مجتمعنا الفلسطيني.
المخلص،
دكتوراة( د.بينار أوسلوجعفر عجرة )طالب
[email protected] البريد االلكتروني: [email protected] :البريد االلكتروني
+44 1613 591 179رقم الهاتف: + 972 595 895 811رقم الهاتف المحمول:

Jafar Ojra - 307 -
Appendix 5: Glossary of terms which provided to respondents
Attribute costing
The costing of specific product attributes that appeal to customers. Attributes that may be costed include: operating
performance variables; reliability, warranty arrangements; assurance of supply; and after sales service.
Benchmarking
The comparison of internal processes to an ideal standard
Brand valuation
The financial valuation of a brand through the assessment of brand strength factors such as: leadership, stability, market,
internationality, trend, support, and protection combined with historical brand profits.
Competitor cost assessment
The provision of regularly scheduled updated estimates of a competitor’s unit cost.
Competitive position monitoring
The analysis of competitor positions within the industry by assessing and monitoring trends in competitor sales, market share,
volume, unit costs, and return on sales. This information can provide a basis for the assessment of a competitor’s market
strategy.
Competitor performance appraisal
The numerical analysis of a competitor’s published statements as a part of an assessment of a competitor’s key sources of
competitive advantage.
Customer profitability analysis
This involves calculating profit earned from a specific customer. The profit calculation is based on costs and sales that can be
traced to a particular customer. This technique is sometimes referred to as ‘‘customer account profitability”.
Integrated performance measurement (Balanced Scorecard)
A measurement system which focuses typically on acquiring performance knowledge based on customer requirements and
may encompass nonfinancial measures. This measure involves departments monitoring those factors which are critical to
securing customer satisfaction.
Life cycle costing
The appraisal of costs based on the length of stages of a product or service’s life. These stages may include design,
introduction, growth, maturity, decline and eventually abandonment.
Lifetime customer profitability analysis
This involves extending the time horizon for customer profitability analysis to include future years. The practice focuses on
all anticipated future revenue streams and costs involved in servicing a particular customer.
Quality costing
Quality costs are those costs associated with the creation, identification, repair and prevention of defects. These can be
classified into three categories: prevention, appraisal, and internal and external failure costs. Cost of quality reports are
produced for the purpose of directing management attention to prioritize quality problems.
Strategic costing (strategic cost management)
The use of cost data based on strategic and marketing information to develop and identify superior strategies that will
produce a sustainable competitive advantage.
Strategic pricing
The analysis of strategic factors in the pricing decision process. These factors may include: competitor price reaction,
elasticity, market growth, economies of scale, and experience.
Target costing
A method used during product and process design that involves estimating a cost calculated by subtracting a desired profit
margin from an estimated (or market-based) price to arrive at a desired production, engineering, or marketing cost. The
product is then designed to meet that cost.
Valuation of customers as assets
The technique refers to the calculation of the value of customers to the company. For example, this could be undertaken by
computing the present value of all future profit streams attributable to a particular customer.
Value chain costing
An activity-based approach where costs are allocated to activities required to design, procure, produce, market, distribute, and
service a product or service.

Jafar Ojra - 308 -
Dome of the Rock, Jerusalem, Palestine
The Nativity Church, Bethlehem, Palestine

Jafar Ojra - 309 -
1947-2014
The Seperation Wall/The Apartheid Wall which was built by Israel on the Palestinian
Territories