Embed Size (px)
Citation preview
STRATEGIC ISSUES RELATING TO WORLD-CLASS PERFORMANCE
WITHIN A GLOBAL MANUFACTURING COMPANY.
By
P.N. PILLAY
Submitted in partial fulfilment of the requirements for the degree of
MASTERS IN BUSINESS ADMINISTRATION
Graduate School ofBusiness, Faculty ofManagement
University ofNatal (Durban)
Supervisor: Professor E. Thomson
September 2003
I

Confidentiality Clause
15 September 2003
To Whom It May Concern:
Re: Confidentiality Clause
Due to the strategic importance of this research it would be appreciated if the contentsremain confidential and not be circulated for a period of five years
Sincerely
P.N. Pillay
11
DECLARATION
This research has not been previously accepted for any degree and is not being
currently submitted in candidature for any degree.
...~.P. N. PiUay
September 2003
III

ACKNOWLEDGEMENTS
I wish to thank the staff of the Graduate School of Business at the University of
NataL Durban for their help and encouragement, and In particular, I wish to thank
my supervisor, Professor Elza Thomson for her support, valuable guidance and
assistance.
I also wish to thank my family for affording me the time to embark on this course,
and in particular my wife Pavitra for all the support and encouragement that was
provided.
IV

ABSTRACT
The objective of grand corporate strategy is the attainment of a sustainable competitiveadvantage; it defines the company and its business, and selects the means of convertingstrategic intent into competitive advantage. In addition, a company must formulate itsbusiness and functional strategies. These are subordinate to the grand strategy and assuch, determine and reveal the corporate purpose and goals, produces the company'sprincipal policies and plans, and provides guidelines for its business units and functionsto achieve these goals. At the level of a business unit, strategy aims to differentiate thecompany from its competitors by creating a unique source of value provided. Thisdetermines the company's distinctive competency, which is not what it can do well butwhat it can do better than its competitors. It is this distinctive competency that must becreated if a company is to successfully align resources and processes to create acompetitive advantage. As the world becomes a global market, the standards applied to"World Class Performance" takes on a common meaning across international boundaries.South African companies are not exempt and have to compete on a global arena. Globalcompetitiveness has never been more intense as firms scan the world for the right mix oftechnology, skills, cost and stability. The main area to be researched that was highlightedis an evaluation of what can be done to improve the current strategic practices of thecompany to a level that exceeds that of world-class companies. By eliciting responsesfrom employees, the researcher hopes to conduct an industry evaluation, generatestrategy and culture profiles and utilise these profiles to determine the current position ofthe company. Based on the fmdings, recommendations would be made to develop animprovement plan for the company.
v

CONTENTS
CHAPTER 1: INTRODUCTION
1.1 Introduction 1
1.2 Background review 2
1.3 Motivation for conducting the research 4
1.4 Value of the study 4
1.5 Problem statement 5
1.6 Research objectives 5
1.7 Research design 6
1.8 Limitations 8
1.9 Structure of the study 8
1.10 Summary 9
CHAPTER 2: THE STRATEGIC MANAGEMENT MODEL
2.1
2.2
2.3
2.4
2.5
2.5.1
2.5.2
2.5.3
2.5.4
2.5.4.1
2.5.4.2
2.5.5
2.5.6
2.5.7
2.5.7.1
2.5.7.2
2.5.7.3
Introduction 10
Decision Making Within An Organisation 11
The Importance Of An Organisational Strategy 12
The Strategic Management Process 13
The Strategic Planning Phase 14
Developing the Mission 14
Establishing the Vision and Goals 16
The Objective-Setting Process 17
The Organisation's External Environment 20
Understanding The Nature Of The Environment 22
Auditing Environmental Influences 23
Scanning and forecasting Of the Remote Environment. 23
Industry Environment 25
Competitive Analysis 25
The Industry's Economic Features 26
Competition Within The Industry 27
Driving Forces within the Industry 35
VI

2.5.7.4
2.5.7.5
2.5.7.6
2.5.7.7
2.6
2.7
2.7.1
2.7.2
2.7.3
2.7.4
2.7.5
2.7.6
2.8
2.8.1
2.8.2
2.8.3
2.9
2.9.1
2.9.1.1
2.9.1.2
2.9.1.3
2.9.2
2.9.3
2.10
2.11
Identifying The Organisation's Competitive Position 37
Monitoring The Strategic Moves OfRivals 38
Key Factors For Competitive Success 40
Attractiveness Of The Industry 41
Globalisation 41
The Internal Environment 44
Evaluation Of Current Strategy 45
Swot Analysis 45
Core Competency Analysis 49
Analysing Pricing And Cost Competitiveness 51
Industry Life Cycle 53
Benchmarking 55
The Strategic Role And Objectives Of The
Operations Function 56
The Role of the Operations Function 57
Judging The Operations Contribution 58
The Five Performance Objectives 59
Strategic Control And Continuous Improvement 59
Operations Improvement 59
Performance Measurement 59
Performance Standards 60
Approaches To Improvement 60
Failure Prevention And Recovery 63
Total Quality Management 64
The Operations Strategy Challenge 65
Conclusion 67
CHAPTER 3: PRESENTING BSN MEDICAL
3. 1 Introduction 69
3.2.1 The Joint Venture 69
3.2.2 Portfolio ofLeading Brands 70
3.2.3 New Opportunities 71
3.2.4 BSN Medical Around The World '" 71
VII

3.2.5
3.2.5.1
3.2.5.2
3.2.5.3
3.2.5.4
3.3
3.3.1
3.3.2
3.3.3
3.4
3.5
3.6
3.7
3.7.1
3.8
3.9
3.10
The First Nine Months of Operation 72
Wound Care 75
Phlebology 75
Casting and Bandaging 75
Regional Sales Review 77
Review of The First Year of Operation 77
Wound Care 79
Phlebology 79
Casting and Bandaging 80
Vision and Value 80
Re-organisation Strategy 81
BSN Medical South Africa 82
BSN South Africa's Improvement Strategy , 84
Overview of The Best Operating Practice Project 85
Healthcare Trend Analysis 88
Factors Affecting the Medical Industry 89
Conclusion 90
CHAPTER 4: EVALUATION OF BSN MEDICAL
The Evaluation Process 91
Industry Assessment 92
The Strategy Dimension 103
The Culture Dimension 108
Conclusion 112
4.1
4.2
4.2.1
4.2.2
4.2.3
4.3
Introduction ...................................................... 91
CHAPTER 5: RECOMMENDATIONS AND CONCLUSION
Recommendations on the Strategy Profile 113
Recommendations on the Culture Profile 116
Overall Summary of the Strategy and Culture Profiles 119
The Immediate action plan for BSN Medical 119
VllI
5.1
5.2
5.3
5.4
5.5
Introduction ....................................................... 113

5.6 Conclusion 122
BIBLIOGRAPHY 123
APENDICES
1. Appendix 1- The Interview Questionnaire ... ... ... ... .. . ... ... 128
IX
LIST OF FIGURES
Fig. 1.1
Fig. 2.1
Fig. 2.2
Fig. 2.3
Fig. 2.4
Fig. 2.5
Fig. 2.6
Fig. 2.7
Fig. 2.8
Fig. 2.9
Fig. 2.10
Fig. 2.11
Fig. 2.12
Fig. 2.13
Fig. 2.14
Fig. 2.15
Fig. 2.16
Fig. 2.17
Fig. 2.18
Fig. 2.19
Fig. 3.1
Fig. 3.2
Fig. 3.3
Fig. 3.4
Fig. 3.5
Fig. 3.6
Fig. 3.7
Fig. 4.1
Fig. 4.2
Performance Gap Analysis 1
Strategic Management Structure 12
The external environment 20
Steps in environmental analysis 21
Approaches to making sense of the environment 22
The competitive environment 28
Strategic group maps 38
International strategy options 43
International strategy options 44
Mobilising the company resources to produce competitive
advantage 47
SWOT Analysis diagram 49
The value chain 52
Life cycle matrix 54
Benchmarking compliments other tools 56
A general model of operations management and strategy 57
Hayes and Wheelwright's four-stage model. 58
Performance breakthrough improvement... . . . . .. .. . . . . 61
The pattern of continuous improvement.. . . . . . . . . . . . . . . . . . . . . 61
The PDCA cycle ... . . . . . . . . . . . . . . . . . . . . . . .. . . . . . . . .. 62
A model of the strategic management process ... . . . .. . . . . . . 68
Sales by global business unit 73
Employees by region......... 74
Sales by region .. . . . . . . . . . . . . . .. . . . . . . . . . . . . . .. . . . .. . . . . . . 77
Sales by major market. .. . . . . . . . .. . . . . . . . . . . . . . .. . . . .. . . . . . . . . . . . 78
Sales by business unit 78
The operational excellence project .. . .. . . . . . . . . . . . . . . . . . . . . 82
The best operating practice project........................... 85
Strategic Direction 104
External Communications .. . . . . . . . . . . . . . . . . . . . . . . . . . . . . . . . . 104
x

Fig. 4.3
Fig. 4.4
Fig. 4.5
Fig. 4.6
Fig. 4.7
Fig. 4.8
Fig. 4.9
Fig. 4.10
Fig. 4.11
Fig. 4.12
Long Term Orientation 105
Core Competence ... .. . . . . . . . . . . . . . . . . . . . . . . . . . . . . . . . . . . . . . . . . . 106
Customer Focus ... .. . . . . . . . . . . . . . . . . . . . . . . .. . . . . . . . . . . .. 106
Strategy Profile... ... ... ... ... ... ... . . . . . . . . . .. . .. . . . . . . . . . . . . . . . . . 107
Empowerment ... .. . . . . . . . . . . . . . . . . . . . . . . . . . . . . . . . . . . . . . .. . . . . . . . 108
Corporate mtegnty. .. . . . . . . . . . ... . . . . . . . . . . . . . . . . . . . . . . . . . . . . . .. 109
Involvement in leadership ... .. . . . . . . . . . . . . . . . . . . . . . . .. . . 109
Motivation to commitment ... . . . . . . . . . . . . . . . . . . . . . . . . .. . .. 110
Culture profile... ... ... ... ... ... . . . . . . . . . . . . . . . . . . . . . . . . . . . . . . . . . III
The competitive matrix...... 112
XI

LIST OF TABLES
Table 2.1 Balanced Scorecard: Summary of Strategy perspectives............... 19
Table 2.2 Summary of the five forces 34
102••••••••• '" '" ••••••••••••••••••••• • 0 •••• ............
From which technological revolution does your industry stem? 92
If you answered A or B above, would you say that its focus is
mainly on specialist, high quality and relatively high technology
parts of the market? ... . . . . . . . . . . . . . . . . . . . . . . . . . . . . . . . . . . . . . . . . . . . . . . . . . . . . . . . .. 93
Table 4.3 How has your industry been affected so far by the new
technologies? 93
Table 4.4 To what extent do you envisage it will be affected over the next
5 years? 94
Table 4.5 At what stage of technological development (i.e. on its S-curve)
is your industry? 95
Table 4.6 Does the current technology fully satisfy customer requirements? 95
Table 4.7 Is continuous innovation the norm for participants in your industry? .. 96
Table 4.8 Does your industry have open technological communications? 96
Table 4.9 Is your industry's basic technology developing fast? 97
Table 4.10 Are the leading firms in your industry managed by finance
professionals? 98
Table 4.11 Is technological competence more important than cost efficiency? 98
Table 4.12 Does your industry have an active research organisation? 99
Table 4.13 Does knowledge of new technological innovations spread quickly
in your industry? 99
Table 4.14 Is your industry heavily unionised? 100
Table 4.15 Do you believe typical junior managers in your industry frequently
work long hours without overtime pay? 100
Table 4.16 Has your industry seen much structural change as a
result ofnew technology? ... ... . . . . . . . . . . . . . . . . . . . . . . . . . . . . . . . . . . . . .. 101
Table 4.17 Are the leading firms in your industry long established? 101
Table 4.18 Do the 'big three' firms in your industry have around 50% or
more market share?
Table 4.1
Table 4.2
XII
Table 4.19 Is your industry subject to a lot of overseas competition? 102
Table 4.20 Is the price the main competitive weapon? 103
XIII
CHAPTER 1: THE INTRODUCTION
1.1 INTRODUCTION
As the world becomes a global market, the standards applied to " World Class
Performance" take on a common meaning across international boundaries. South
African companies are not exempt and have to compete on a global arena.
Global competitiveness has never been more intense as firms scan the world for the
right mix oftechnology, skill, cost and stability.
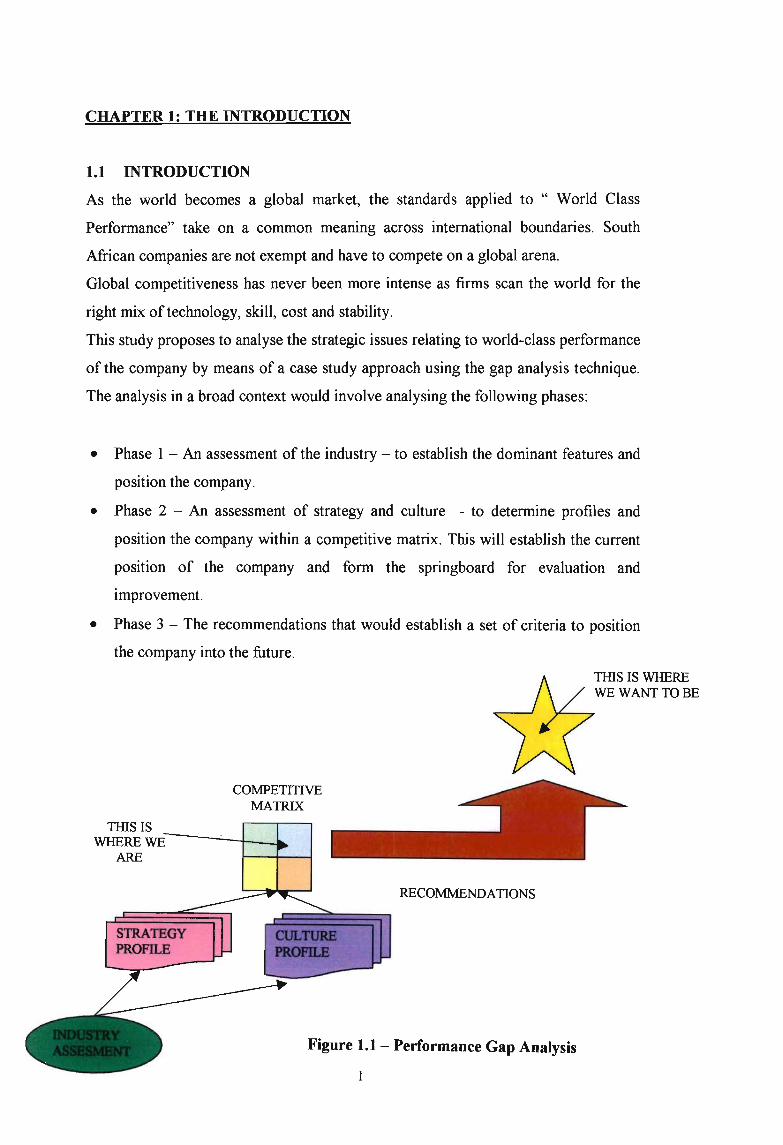
This study proposes to analyse the strategic issues relating to world-class performance
of the company by means of a case study approach using the gap analysis technique.
The analysis in a broad context would involve analysing the following phases:
• Phase 1 - An assessment of the industry - to establish the dominant features and
position the company.
• Phase 2 - An assessment of strategy and culture - to determine profiles and
position the company within a competitive matrix. This will establish the current
position of the company and form the springboard for evaluation and
improvement.
• Phase 3 - The recommendations that would establish a set of criteria to position
the company into the future.
COMPETITIVEMATRIX
THIS ISWHERE WE;:-----..:...-+--J....
ARE
STRATEGYPROFILE
RECOMMENDAnONS
Figure 1.1- Performance Gap Analysis
I

1.2 BACKGROUND REVIEW
Thomas James Smith, a pharmacist, set up a chemist shop in Hull, on England's north
East Coast in 1856. Forty years later, in 1896, he invited his nephew, Horatio Nelson
Smith, to join him in the business; this is how Smith & Nephew came into existence.
It was HN.Smith who came to South Africa in the early 1920's to assess the potential
market for the company's products. In 1931 Smith & Nephew limited was registered
as a company in South Africa to import and sell the products manufactured by the
parent company in the United Kingdom.
Smith & Nephew, South Africa opened its first factory in Pinetown on 02 July 1955,
Manufacturing Elastoplast, Gypsona, Plaster ofParis and Jelonet. In April 2001 Smith
& Nephew and Beiersdorf formed a joint venture manufacturing facility called BSN
medical. In South Africa, only the operations division of Smith & Nephew was
included in the joint venture.
BSN medical, South Africa has manufacturing sites in Pinetown, eZakheni and
iSithebe and now employs approximately 730 people, most of whom work in
Pinetown. The South African head office is in Pinetown. At present the company uses
the services of Smith & Nephew for HR, IT and Finance but this is in the process of
changing as the company grows and develops. The company products are also
exported to many African countries, South East Asia, Australia, and Europe.
The concept of "World Class" is widely spoken about. Every management bookshop
is filled with eloquent works describing what World Class Performance looks like, but
very few describe clearly how to get there. World Class has been defined in many
ways from "a new approach to business" to "setting standards that the competition
can't beat". "World Class is a process of improving more than one thing at a time, and
by doing it over the long term ... it is a synergy between different improvement efforts
and the need for commitment at all levels in the company to achieve total, systematic
enlistment." http://www.index.co.za/wc/
By systematically studying the best business practices, operating tactics and winning
strategies of others, an individual, team or organisation can accelerate its own
progress and improvement.
2
The history of innovative adaptation is arguably as old as humankind. For millennia
people have observed good ideas around them and adapted those ideas to meet their
needs and situations. Fred D. Bowers, Digital Equipment Corporation's benchmarking
program manager, muses that the second person to light a fire" is humankind's first
bench marker. Bowers' logic: the second fire-starter observed the first fire-starter and
then borrowed the practice.
Bench marking's linguistic and metaphorical roots lie in the land surveyor's term,
where a benchmark was a distinctive mark made on a rock, wall or building. In this
context, a benchmark served as a reference point in determining one's current position
or altitude in topographical surveys and tidal observations. In the most general terms,
a benchmark was originally a sighting point from which measurements could be made
or it implied a standard against which others could be measured.
In the 1970s, the concept of a benchmark evolved beyond a technical term signifying
a reference point. The word migrated into the lexicon of business, where it came to
signify the measurement process by which to conduct comparisons. In the early
1980s, Xerox Corporation, a leader in the business process of benchmarking, referred
to benchmarking in rather narrow terms that focused primarily on comparisons with
one's primary competitors. "Benchmarking is the continuous process of measuring
products, services, and practices against the toughest competitors or those companies
recognised as industry leaders," observed former Xerox CEO David Kearns.
Hamel (1990) argues that a company's competitiveness derives from its core
competencies and core products (the tangible results of core competencies). Core
competence is the collective learning in the organisation, especially the capacity to
co-ordinate diverse production skills and integrates streams of technologies. It is also
a commitment to working across organisational boundaries. Ambrosini (1988) goes
on to further summarise a definition, which says that the core competence of an
organisation is its enabling culture, its motivation and applied skills. The core
competence approach enables organisations to achieve organic growth by building on
their core strengths and unique capabilities.
According to Hamel (1994), change is inevitable, the real issue for managers is
whether that change will happen belatedly, in a crisis atmosphere, or with foresight, in
a calm and considered manner; whether the transformation agenda will be set by a
company's more prescient competitors or by its own point of view; whether
3

transformation will be spasmodic and brutal or continuous and peaceful. They further
suggest that developing a point of view about the future should be an ongoing project
sustained by continuous debate within a company, not a massive one-time effort.
Unfortunately, most companies consider the need to regenerate their strategies and
reinvent their industries only when restructuring and reengineering fail to halt the
process of corporate decline. To get ahead of the industry change curve, to have the
chance of conducting a bloodless revolution, top managers must recognise that the
real focus for their companies is the opportunity to compete for the future.
1.3. MOTIVATION FOR CONDUCTING THE RESEARCH
BSN medical South Africa will be required on an increasing basis to supply cost
effective, high quality products to both export and local markets. In order for the
company to sustain its position, and to grow in an increasingly tough competitive
global environment, it is important that the company embark on a programme of
ongoing continuous improvement. By identifying where we are now and where we
want to get to, this would form the springboard for improvement.
"Strategic planning does not deal with future decisions. It deals with the futurity of
present decisions. What we have to do today is to be ready for an uncertain
tomorrow" (Peter F. Drucker, Professor of Social Science and Management).
1.4. VALUE OF THE STUDY
South African companies are fast being included in the melting pot of globalisation.
As the local markets are merged into global markets, companies need to evaluate their
positions in order to implement strategic plans so that they can compete globally. This
type of study would be of value to other South African companies as they share
similar problems of high labour costs, low productivity, low levels of skills and dated
technology. The findings of the study can be used in the following ways:
• Developing a basis for measuring and improving performance
• Deriving a generic set of performance standards utilising historical standards,
target standards, competitor performance and absolute standards.
• Identifying a model for improvement where both breakthrough and continuous
improvement are used in a complimentary manner.
The study is beneficial both as an exercise in implementation and re-engineering
4

strategic issues within a South African division of a global company, and as a means
of assessing requirements in order to establish key success factors for the future.
1.5. PROBLEM STATEMENT
The formation of BSN Medical, a joint venture company formed between Smith &
Nephew and Beiersdorf, has led to the infant company going through a transformation
process where the two different strategies and cultures are being adapted in line with
the requirements of the new company. An added difficulty to this is the fact that the
company has operations globally and each country has their own unique way in
implementing their strategy. These differences in operating strategy now need to be
incorporated into the newly formed company.
Once the hype ofthe joint venture process has ended, the different divisions now need
to asses their current positions and look at ways in which it can improve its practices
and become a key contributor within the group. Due to the fact that the operating
divisions are spread across the globe, from first world to third world, competitiveness
becomes a key issue, which leads us to the question,
" What can be done to improve the current strategic practices of the company to
a level which exceeds that of world class companies?"
1.6. RESEARCH OBJECTIVES
The purpose of this research is to identify the strategic management issues that impact
on the company as a result of the drive to attain world-class leadership. This would
entail evaluation of current strategies, formulating and implementing best practice
strategies to develop an improvement plan to ensure that the company is sustainable
into the future. The aims of the study are as follows:
••••
To establish the positioning of the company within the industry.
To establish a 'Strategy profile' of the company
To establish a 'Culture profile' of the company
To determine the current company position within the competitive matrix by
considering the Strategy and Cultural profiles. This determines where we are.
5

• To evaluate and establish a set of criteria for improvement.
By evaluating the above objectives, the dissertation hopes to bring available theory
and practice together and add to the growing literature in the field.
1.7. RESEARCH METHODOLOGY
1.7.1 EXPLORATORY STUDY
The applied research will be a study posing questions; however there would be no
predictive hypothesis. Through exploration the researcher aims to develop concepts
more clearly and to establish what management dilemmas are currently facing BSN
Medical. The research would take the form of both qualitative and quantitative
techniques.
1.7.2 INTERROGATION/COMMUNICATION STUDY
In order to conduct exploratory investigations, an in-depth interview would be
conducted on a cross-section ofBSN Medical employees. This will take place in the
form of a structured interview and provide the primary data. Data will be checked for
mistakes, coded, formatted, tabulated and edited for validity and reliability.
• Measurement Instrument - The measurIng instrument will be a set of pre
formulated interview questions consisting of three sections; industry assessment,
strategy profile and culture profile as per the 'Competitive Matrix' suggested by
Pearson (1992).
• Measurement - Questions asked in the interview will be clearly structured and
closed ended. The industry assessment questionnaire uses a 1a-point numerical
scale. The overall scores will be summated and averaged to establish the
company's position within the industry. A score of a indicates a weak response
and a score of 1a indicating an excellent response.
The Strategy and Culture profile questionnaire uses a 7 point Likert Scale were
the overall scores will be summated and averaged to establish the Strategy and
Culture profiles of the company. The scores range from +3 to -3. A score of +3
6

indicates the answer is completely true and -3 indicates the answer is completely
untrue.
• Pilot Test - A pilot test will be carried out randomly on 5 employees whilst still
maintaining the same procedures and protocols. It will be conducted to detect any
weaknesses in the sampling design, instruments and procedures. Should the pilot
test highlight any major flaws, pre testing will be repeated to refine the questions/
instruments or procedures tested. The pilot test highlighted no problems and so
there was no reason to modify or alter the questionnaire in any way.
• Sample - A non-probability sample, in particular a convenience quota sample has
been selected for the following reasons:
1. Convenience: selection of the target group is readily available in the form of
employees.
2. Quota: respondents characteristics are predetermined and roughly 1ll
proportion to the total workforce at BSN Medical.
1.7.3 SECONDARY DATA
Secondary data would be investigated by means of document analysis, which will be
used to determine the historical objectives of the company and identify its current
position.
1.7.4 DATA ANALYSIS
The data would be analysed 1ll order to find solutions to problems facing BSN
Medical. Spreadsheets would be used to capture the data and perform the statistical
analysis. Graphical techniques and visual representations will be used to represent the
statistical data results. Examples of these would include frequency tables, bar or pie
charts and histograms.
1.7.5 LITERATURE REVIEW
A literary review will be conducted to identify best practices in order to form a model,
which would lead to competitive advantage.
7

1.7.6 NATURE AND FORM OF RESULTS
The findings will then be analysed; reported and published. This will take the shape of
a report outlining the variances in the findings. Upon the completion of the
dissertation, it is hoped that adequate information regarding the various strategic
management practices of the company will emerge that will be useful to management.
1.8. LIMITATIONS
This study will focus on BSN Medical South Africa only. To further adapt this
information as a basis for industry, further research needs to be conducted. All
information regarding the company is confidential and restricted. Competitors will
normally only exchange information via a trade association or a survey by an
independent body. Car manufacturers, for example, exchange information in this way
on a wide range of production and customer satisfaction measurements. In practice,
exchanges with competitors usually mean that you have access only to figures for
best, worst and average performance. They probably won't give you an insight into
how these companies achieve their results. As a result sensitive information such as
analysis of the company finances have not been included in the study.
1.9. STRUCTURE OF THE STUDY
The following chapters will be presented in this research study:
• Chapter 2: The Strategic Management Model
This chapter includes an examination of the supporting theory on the strategic
management process. This starts very broadly with issues such as company visions
and mission and explores the various theories and models available. The examination
concludes with a look at the production aspect of the value chain and introduces the
Competitive matrix as an evaluation tool. At the end of the chapter a model is
proposed for further use.
8
• Chapter 3: BSN Medical South Africa
This chapter details the history and current operations ofBSN Medical covering both
their local and international business. All aspects of the company's business, from its
formation to the current business practices are discussed in this chapter.
• Chapter 4: Evaluation of BSN Medical's current strategic path
This chapter deals with the evaluation of BSN Medical against the Competitive
Matrix introduced in chapter 2. Three sets of evaluations are done, the industry
analysis, the strategy profile and the culture profile. Interpretations of the results are
offered and discussions are put forward on areas in which the company is doing well
and areas that need attention. The primary focus of the chapter is to determine the
current position of the company and introduce areas for improvement.
• Chapter 5: Recommendations and Conclusions
This chapter will draw conclusions from chapter 4 and make broad recommendations
regarding the way forward in order to eliminate reduce the gap and improve on its
current position. Areas that the company has excelled in are reinforced and areas for
improvement are actioned.
1.10 SUMMARY
This chapter has clearly indicated the critical questions to be answered as well as the
aims of the study. The main area to be researched that was highlighted is an
evaluation of what can be done to improve the current strategic practices of the
company to a level that exceeds that of world-class companies. By eliciting responses
from employees, the researcher hopes to conduct an industry evaluation, generate
strategy and culture profiles and utilise these profiles to determine the current position
of the company. The next chapter will now look at the available theory, which would
be used to generate a road map for the evaluation of the strategic management
practices within the company.
9
CHAPTER 2: THE STRATEGIC MANAGEMENT MODEL
2.1 INTRODUCTION
"Or suppose a king is about to go to war against another king. Will he not first sit
down and consider whether he is able with ten thousand men to oppose the one
coming against him with twenty thousand? If he is not able, he will send a delegation
while the other is still a long way off and will ask for terms of peace" (Luke 14:32).
As in war during the biblical times, organisations over the years have been faced with
critical decisions concerning their futures. As a result some of them have grown to be
extremely large and profitable, diversifying into other business activities, while others
have gone bankrupt.
The single biggest factor contributing to their survival is change and more especially
how they make decisions in the face of constantly changing challenging factors.
Broadly speaking, these factors can be arranged into four groups. The first set of
factors is the internal activities of the organisation. The organisations immediate
external environment poses a second set of challenging factors. This includes
competitors, suppliers and customers. The third group that contributes greatly to the
business challenges is the remote external environment consisting of changes in the
political, environmental, social and technological arena. The final area of complexity
arises out of the business stakeholders, the owners, shareholders, management and
employees. Coupled to these factors are the internationalisation of business and
spiralling costs of natural resources.
With this scenario in mind, the question that needs to be answered is how do
organisations make decisions about their future in this complex and ever changing
environment? The process that is undertaken is called strategic management.
According to (Byars 1987, p.8) "strategic management is concerned with making
decisions about an organisation's future direction and implementing those decisions".
This can be further broken down into the strategic planning phase and the strategy
implementation phase. (Pearce and Robinson 1988, p.6) defines strategic management
as "the set of decisions and actions resulting in formulation and implementation of
strategies designed to achieve the objectives of an organisation"
Strategic management is the process of examining both present and future
environment, formulating the organisation's objectives and making, implementing
10
and controlling decisions focused on achieving these objectives in the present and
future environments.
2.2 DECISION MAKING WITHIN AN ORGANISATION
Strategic management decision-making within organisation is typically characterised
by the following dimensions:
Strategic issues requires top-management decisions due to the fact that they
encompass several areas of the organisations operations and require a broad
understanding of the consequences of the decisions.
Strategic issues require a large amount of the organisation resources. This is usually in
the form of allocation of human resources, assets or finance that must either be
sourced externally or redirected from within the organisation.
Strategic issues often have an impact on the organisation's long -term prosperity. The
organisation is committed for a long term; typically three to five years and the impact
of such decisions last even longer. Strategic decisions have enduring effects on
organisations, which have a positive or negative effect.
Strategic issues result in complex implications for most areas of the organisation.
They are usually multifunctional or multi-business and are affected by changes of
responsibilities and resources as a result ofthe decision-making.
Finally strategic decision-making has to take cognisance of the external environment
as they affect and are affected by external conditions. It is therefore necessary to look
beyond the operations and consider the broader issues.
The decision making process is typically conducted at three levels within the
organisation. At the apex of the pyramid is the corporate level. At this level the key
players consist of the board of directors, chief executive and administrative officers.
Their responsibility is financial performance, maintaining and enhancing the image of
the organisation and social responsibility issues. According to Pearce and Robinson
(1989) corporate level strategic managers attempt to exploit their firm's distinctive
competencies by adopting a portfolio approach to the management of its businesses
and by developing long term plans, typically for a five-year period. The second level
of the pyramid is the business level, which comprises business and corporate
managers. Their task is to translate the corporate level strategy into objectives and
business level strategies and to position the business in the market segment were the
11
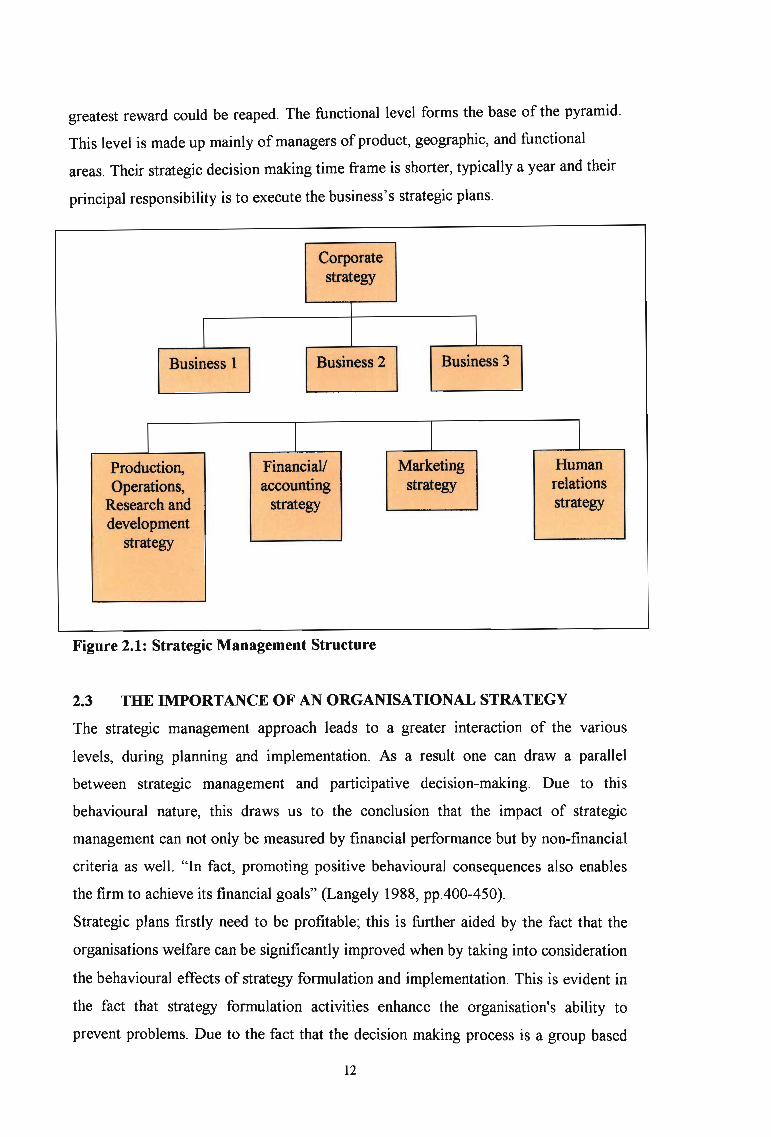
greatest reward could be reaped. The functional level forms the base of the pyramid.
This level is made up mainly of managers of product, geographic, and functional
areas. Their strategic decision making time frame is shorter, typically a year and their
principal responsibility is to execute the business's strategic plans.
Corporatestrategy
I IBusiness 1 Business 2 Business 3
r I I IProduction, Financiall Marketing HumanOperations, accounting strategy relations
Research and strategy strategydevelopment
strategy
Figure 2.1: Strategic Management Structure
2.3 THE IMPORTANCE OF AN ORGANISATIONAL STRATEGY
The strategic management approach leads to a greater interaction of the vanous
levels, during planning and implementation. As a result one can draw a parallel
between strategic management and participative decision-making. Due to this
behavioural nature, this draws us to the conclusion that the impact of strategic
management can not only be measured by financial performance but by non-financial
criteria as well. "In fact, promoting positive behavioural consequences also enables
the firm to achieve its financial goals" (Langely 1988, pp.400-450).
Strategic plans firstly need to be profitable; this is further aided by the fact that the
organisations welfare can be significantly improved when by taking into consideration
the behavioural effects of strategy formulation and implementation. This is evident in
the fact that strategy formulation activities enhance the organisation's ability to
prevent problems. Due to the fact that the decision making process is a group based
12
actIvIty, decisions are likely to be drawn from the best available alternatives. The
employees are motivated due to their involvement in strategy formulation and their
understanding of the consequences of their actions. The different roles of the players
are clarified and any gaps or overlaps in activities are seen up front and corrected.
Finally, through the participation in the process, the employees are sensitised to
change and their resistance to change is reduced.
2.4 THE STRATEGIC MANAGEMENT PROCESS
In making decisions about an organisation's future direction, management must
answer the following three basic questions:
1. Where are we now?
2. Where do we want to be?
3. How do we get to where we want to be?
Answering the first two questions is often called the objective - setting process. The
answers to the third question lead to the strategy formulation process. In its simplest
form, the strategic management process is an integrated process with two core
components. These are strategy planning and strategy implementation.
As stated earlier, strategic management is a decision making process, concerned with
an organisation's future direction and the implementation of the action plans in order
to steer the company towards their future direction. Byars (1987) states that the
strategic planning phase is concerned with making decisions with regard to:
• Defining the organisation's philosophy and mission;
• Establishing long and short-range objectives to achieve the' organisation's
mIssIon;
•
••
•
Selecting the strategy that IS to be used In achieving the organisation's
objectives;
And strategy implementation is concerned with making decisions with regard
to:
Developing the organisation's structure to achieve the strategy;
Ensuring that the activities necessary to achieve the strategy are effectively
performed;
Monitoring the effectiveness of the strategy In achieving the organisation's
objectives;
13
Pearce and Robinson (1994) expand the strategic management process into nine
critical areas. These are:
• Formulation of the company's mission, including broad statements about its
purpose, philosophy, and goals;
• Develop a company profile that reflects its internal conditions and capabilities;
• Assess the company's external environment, including both the competitive and
general contextual factors;
• Analyse the company's options by matching its resources with the external
environment;
• Identifying the most desirable options by evaluating each option in light of the
company's mission;
• Select a set of long-term objectives and grand strategies that will achieve the
most desirable options;
• Develop annual objectives and short term strategies that are compatible with the
selected set of long-term objectives and grand strategies;
• Implement the strategic choices by means of budgeted resource allocations in
which the matching of tasks, people, structures, technologies, and reward
systems is emphasised;
• Evaluate the success of the strategic process as input for future decision
making.
2.5 THE STRATEGIC PLANNING PHASE
The strategic planning phase is one of establishing a company direction. According to
Thompson and Strickland (2001), this constitutes developing a strategic vision and
mission, setting performance objectives and crafting a strategy to produce the desired
results. We will now expand on these aspects and also examine the strategic decision
making process at various levels within the organisation.
2.5.1 DEVELOPING THE MISSION
Johnson and Scholes (1999) states that a mission is a general expression of the overall
purpose of the organisation, which, ideally, is in line with the values and expectations
of the major stakeholders and concerned with the scope and boundaries of the
organisation. The core purpose of a mission is to define the current and future
business activities ofan organisation. In order for an organisation to shape its strategic
14

position, it must determine the basic goals and philosophies, irrespective of whether
the organisation is developing a new business or reformulating direction for an
ongoing business. This generally consists of a broad description of the products,
markets, technology and geographical coverage presently undertaken and also
incorporating a short-term view of three to five years. This is done in a manner that
reflects the values and priorities of the organisations decision-makers. " The
establishment of an organisation's mission is critical: without a concrete statement of
mission it is virtually impossible to develop clear objectives and strategies" (Pearce
and Robinson 1982 pp.15-24). The mission also serves to provide a unifying force, a
sense of direction, and a guide to decision making for all levels of management.
According to King and Cleland (1987) the objectives of the company mission are:
• To ensure unanimity ofpurpose within the organisation.
• To provide a basis for motivating the use of the organisation's resources.
• To develop a basis, or standard, for allocating organisational resources
• To establish a general tone or organisational climate: for example, to suggest a
businesslike operation.
• To serve as a focal point for those who can identify with the organisation's
purpose and direction and to deter those who cannot do so from participating
further in its activities.
• To facilitate the transition of objectives and goals into a work structure
involving the assignment of tasks to responsible elements within the
organisation.
• To specify organisational purposes and the translation of these purposes into
goals in such a way that cost, time, and performance parameters can be assessed
controlled.
Thompson and Strickland (2001) states that a mission statement should define what
business the company is presently in and conveys the essence of" who we are, what
we do, and where we are now." The main benefit of defining the organisation's
mission, forces management to identify the scope of its products or services carefully.
Achieving the mission "drives the business, mobilises the workers, and gets the high
quality product to the market" (LaBarre 1996, p.52). A mission statement reflecting
the boundaries of the company's existing business is a starting point in determining
15

what the business makeup and customer focus needs to be and forms a springboard
for the future of the company.
2.5.2 ESTABLISHING THE VISION AND GOALS
Developing a strategic vision expands on the mission statement and requires creative
ideas on how to prepare a company for the future. According to Johnson and Scholes
(1999), a vision or strategic intent is the desired future state of the organisation. It is
an inspiration around which a strategist, perhaps a chief executive, might seek to
focus the attention and energies of members of the organisation. This entails
examining and developing a strategic path for a company to take. Areas to be
explored are based on the customer or market, product or service, geographic domain,
technology, concern for survival, philosophy, self-concept and concern for public
image.
The basic product or service, primary market and principal technology are key to the
vision and in combination should indicate and describe to all readers, from company
employees to casual observers, the company's business activity. Survival through
growth and profitability are economic goals that guide the strategic direction of
almost every business and convey the intent for the future. Survival into the future is
key to satisfying the aims of the stakeholders and needs to play a crucial role in
strategic decision-making. Concentrating solely on short-term goals or gains without
taking a long-term view often leads to disastrous consequences for the business.
Profitability is regarded as the main criteria, however one has to be sure as to
emphasise that this is measured over the long term and is not a short-term gain.
According to Thompson and Strickland (2001), charting promising strategic course
forces managers to think both creatively and realistically about changing market,
competitive, technological, economic, regulatory, and societal conditions and about
the company's resources and capabilities. "Moving early and quickly to pursue
emerging opportunities can result in competitive advantage" (Colvin and Miles 1999,
pp.47-63).
Communicating the strategic ViSion is almost as important as setting the
organisation's long-term direction. This should be done in a manner that reaches out
and grabs people, creating a vivid image that provokes emotion and excitement.
Portraying an inspiring picture of the vision can benefit the organisation by
motivating people to live the business instead of just coming to work. The vision
16

statement in the form of a slogan that will help generate enthusiasm for the future
direction and inspire dedicated effort. This can also help break down the resistance to
change and promote buy in of the need for redirecting the organisational efforts.
Vision has little meaning unless it can be successfully communicated to those
working in the organisation, since these are the people that will have to realise it. A
well conceived, well-worded vision statement ensures that the first step in
organisational direction setting is successfully completed.
2.5.3 THE OBJECTIVE-SETTING PROCESS
" You cannot manage what you cannot measure ... and what gets measured gets done"
(House and Price 1991, p.93). Setting objectives converts the strategic vision into
specific performance targets. It takes the generalities of the mission and vision
statements and turns them into more specific commitments. This usually covers what
is to be done and when the objective is to be completed. This may take the form of a
quantifiable objective as in an increase in market share or an improvement in some
measure of product quality. As stated by Lynch (2000) the purpose of objectives is
therefore to focus the management task on a specific outcome and to provide a means
of assessing whether that outcome has been achieved after the event. This enables
organisations to substitute purposeful strategic decision making for aimless actions
and confusion over what to accomplish and it also provides a set of benchmarks for
judging the organisation's performance and progress.
According to Thompson and Strickland (2001), in examining what kinds of objectives
to set, key result areas of financial performance and strategic performance stand out.
Adopting a different view on objective setting, Kaplan and Norton (1996) proposed to
steer away from the traditional measures of capital employed and earnings per share
as these where essentially functional measures and that what really matters in strategy
implementation is the process. They argued that "Processes have replaced (or are
replacing) departments and functions." They went on to identify three important types
of processes. These are:
• Management process, concerned with the manner in which the leader runs the
organisation, the decision making process and how these decisions are
implemented.
17
• Business process, concerned with product design, orders fulfilled, customer
satisfaction achieved etc.
• Work processes, concerned with factors of how work is operationalised,
purchased, stored, manufactured etc. They argued that these are the activities
that implement the agreed strategies but they are not the same as return on
capital, market share and growth data and the other measures that often
summarise the outcome of a corporate strategy.
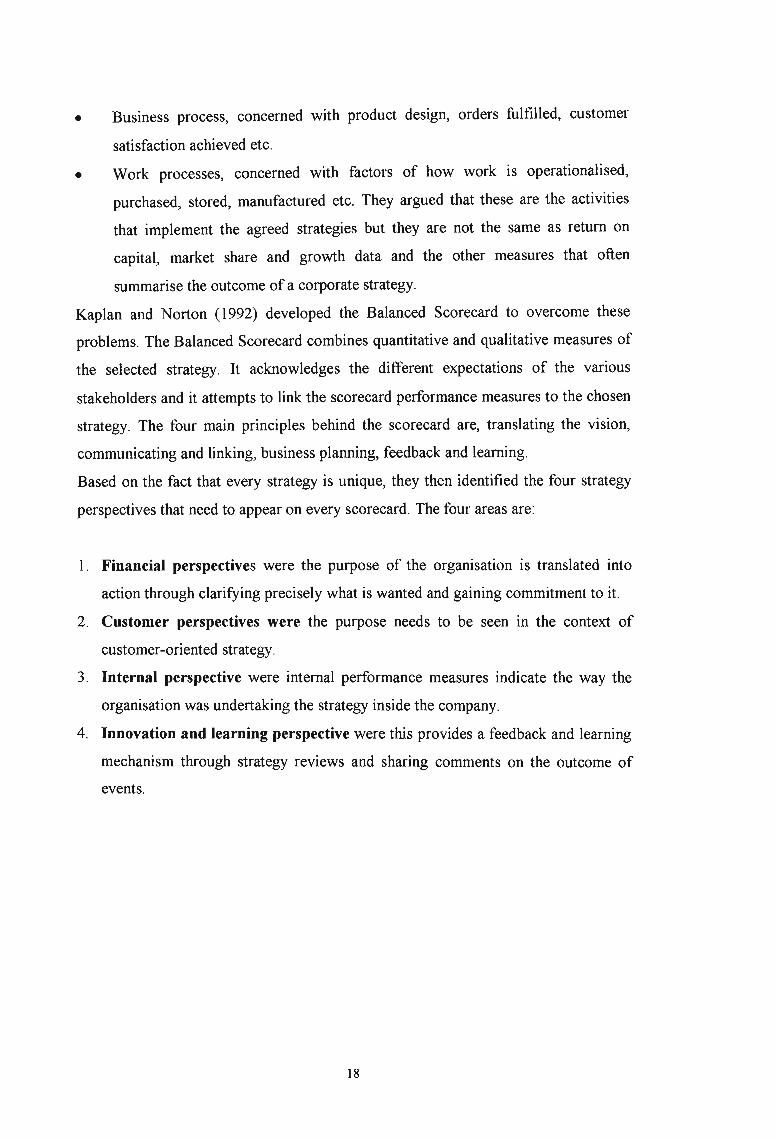
Kaplan and Norton (1992) developed the Balanced Scorecard to overcome these
problems. The Balanced Scorecard combines quantitative and qualitative measures of
the selected strategy. It acknowledges the different expectations of the various
stakeholders and it attempts to link the scorecard performance measures to the chosen
strategy. The four main principles behind the scorecard are, translating the vision,
communicating and linking, business planning, feedback and learning.
Based on the fact that every strategy is unique, they then identified the four strategy
perspectives that need to appear on every scorecard. The four areas are:
1. Financial perspectives were the purpose of the organisation is translated into
action through clarifying precisely what is wanted and gaining commitment to it.
2. Customer perspectives were the purpose needs to be seen in the context of
customer-oriented strategy.
3. Internal perspective were internal performance measures indicate the way the
organisation was undertaking the strategy inside the company.
4. Innovation and learning perspective were this provides a feedback and learning
mechanism through strategy reviews and sharing comments on the outcome of
events.
18
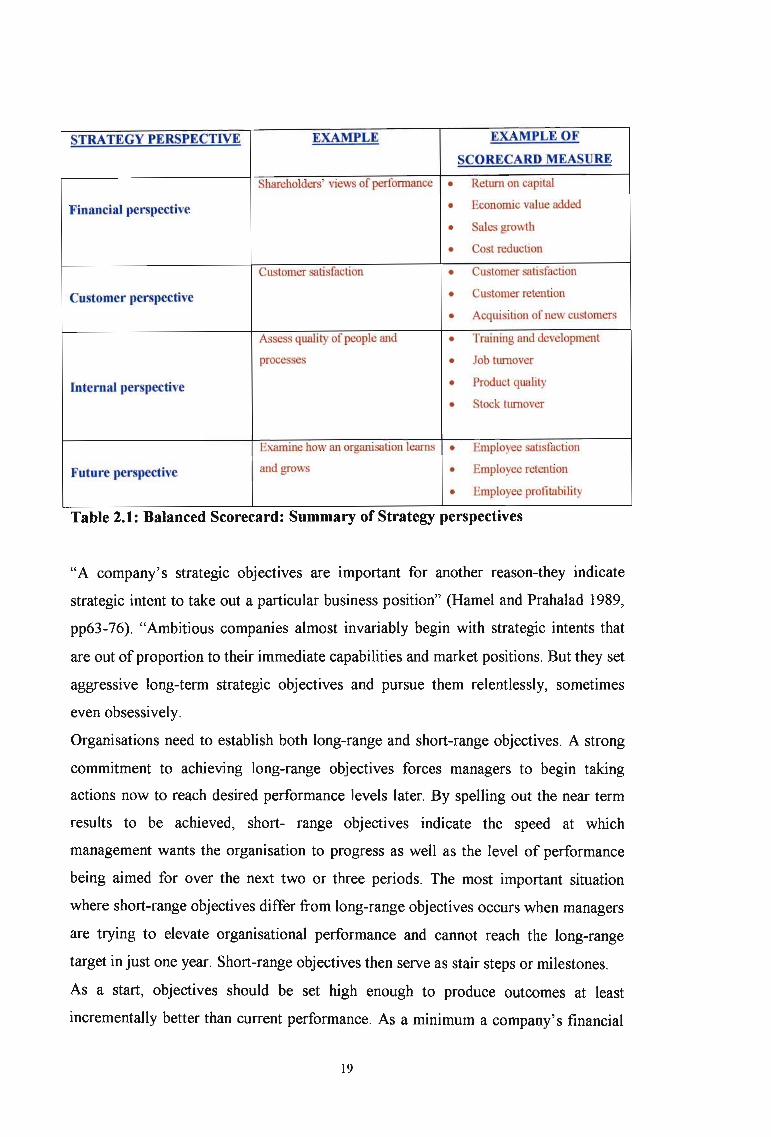
Table 2.1: Balanced Scorecard: Summary of Strategy perspectives
STRATEGY PERSPECTIVE EXAMPLE EXAMPLE OF
SCORECARD MEASURE
Shareholders' views of performance • Return on capital
Financial perspective • Economic value added
• Sales growth
• Cost reduction
Customer satisfaction • Customer satisfaction
Customer perspective • Customer retention
• Acquisition ofnew customers
Assess quality of people and • Training and development
processes • Job turnover
Internal perspective • Product quality
• Stock hunover
Examine how an organisation learns • Employee satisfaction
Future perspective and grows • Employee retention
• Employee profitability
.
"A company's strategic objectives are important for another reason-they indicate
strategic intent to take out a particular business position" (Hamel and Prahalad 1989,
pp63-76). "Ambitious companies almost invariably begin with strategic intents that
are out of proportion to their immediate capabilities and market positions. But they set
aggressive long-term strategic objectives and pursue them relentlessly, sometimes
even obsessively.
Organisations need to establish both long-range and short-range objectives. A strong
commitment to achieving long-range objectives forces managers to begin taking
actions now to reach desired performance levels later. By spelling out the near term
results to be achieved, short- range objectives indicate the speed at which
management wants the organisation to progress as well as the level of performance
being aimed for over the next two or three periods. The most important situation
where short-range objectives differ from long-range objectives occurs when managers
are trying to elevate organisational performance and cannot reach the long-range
target in just one year. Short-range objectives then serve as stair steps or milestones.
As a start, objectives should be set high enough to produce outcomes at least
incrementally better than current performance. As a minimum a company's financial
19
objectives must aim high enough to generate the resources to execute the chosen
strategy proficiently. However an enough to get by mentality is not appropriate in
objective setting. Ideally, objectives ought to serve as a managerial tool for truly
stretching an organisation to reach its full potential; this means setting them high
enough to be challenging - to energise the organisation and its strategy" (Thompson
and Strickland 2001, p45).
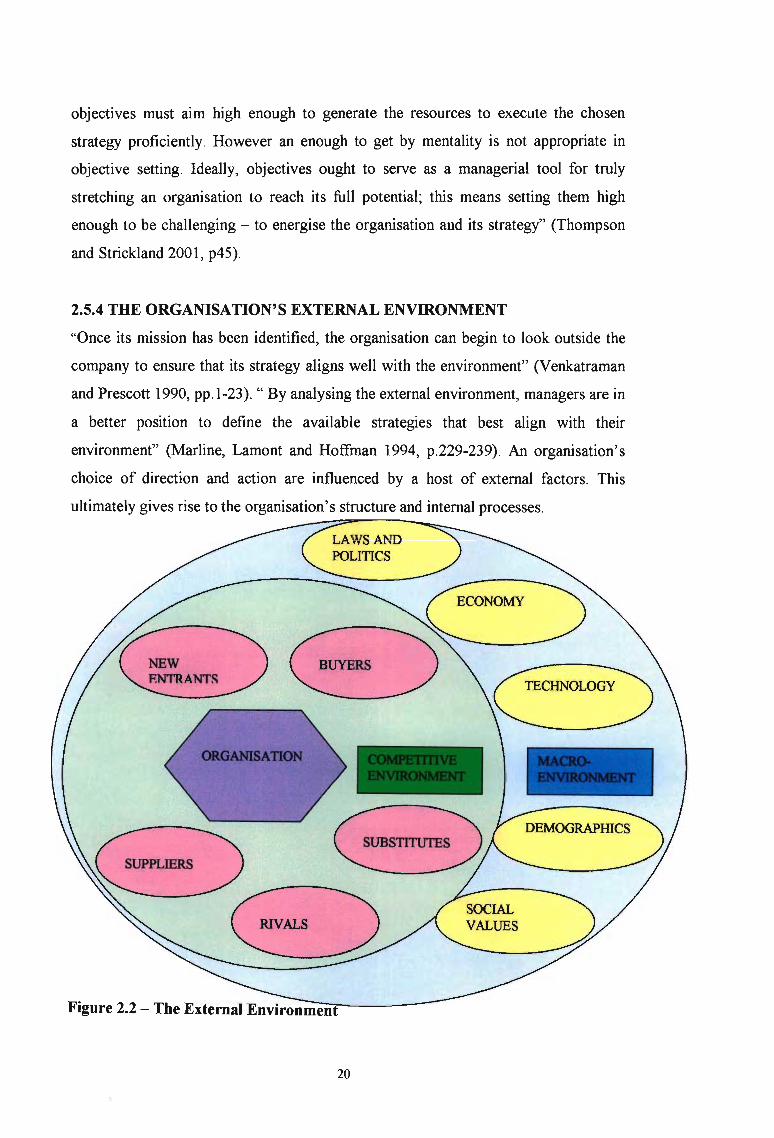
2.5.4 THE ORGANISATION'S EXTERNAL ENVIRONMENT
"Once its mission has been identified, the organisation can begin to look outside the
company to ensure that its strategy aligns well with the environment" (Venkatraman
and Prescott 1990, pp. 1-23). " By analysing the external environment, managers are in
a better position to define the available strategies that best align with their
environment" (Marline, Lamont and Hoffman 1994, p.229-239). An organisation's
choice of direction and action are influenced by a host of external factors. This
ultimately gives rise to the organisation's structure and internal processes.
Figure 2.2 - The External Environm==e":::n7------
20
According to Pearce and Robinson (1994), these factors, which constitute the external
environment, can be divided into three interrelated sub-categories: factors in the
remote environment, factors in the industry environment and factors in the operating
(competitive) environment. Figure 2.2 suggests the interrelationship between these
factors.
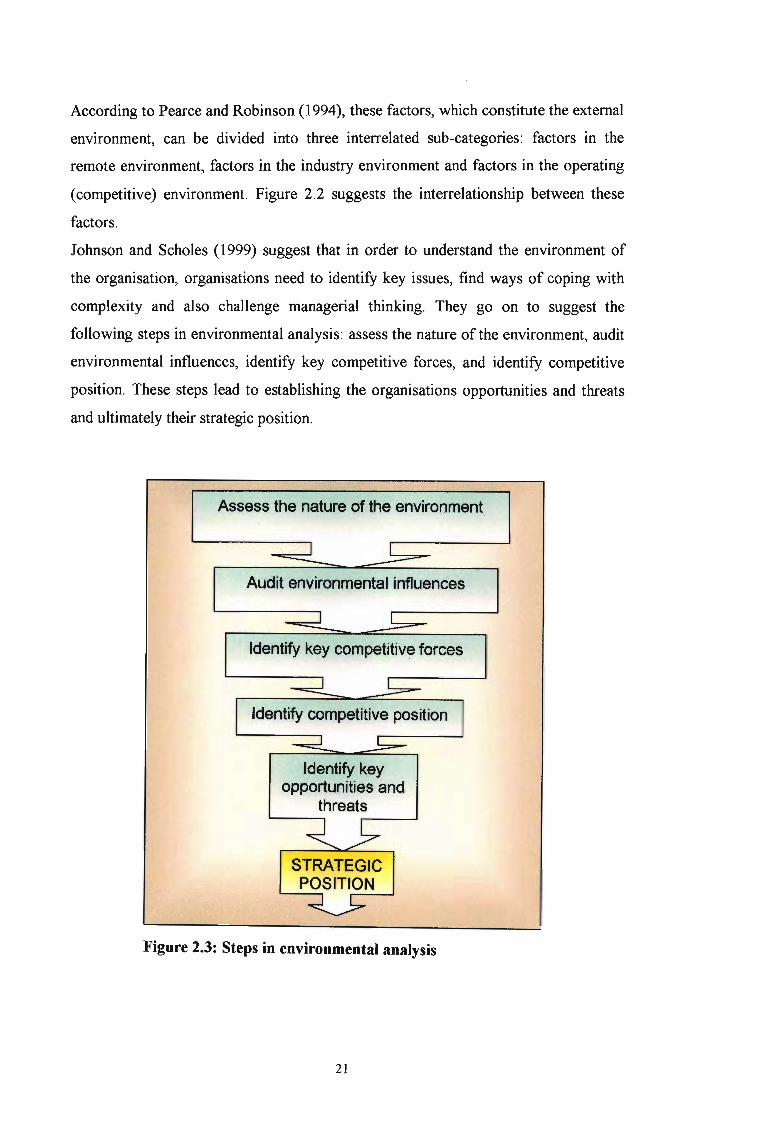
Johnson and Scholes (1999) suggest that in order to understand the environment of
the organisation, organisations need to identify key issues, find ways of coping with
complexity and also challenge managerial thinking. They go on to suggest the
following steps in environmental analysis: assess the nature of the environment, audit
environmental influences, identify key competitive forces, and identify competitive
position. These steps lead to establishing the organisations opportunities and threats
and ultimately their strategic position.
Assess the nature of the environment
Audit environmental influences
Identify key competitive forces
Identify keyopportunities and
threats
Figure 2.3: Steps in environmental analysis
21
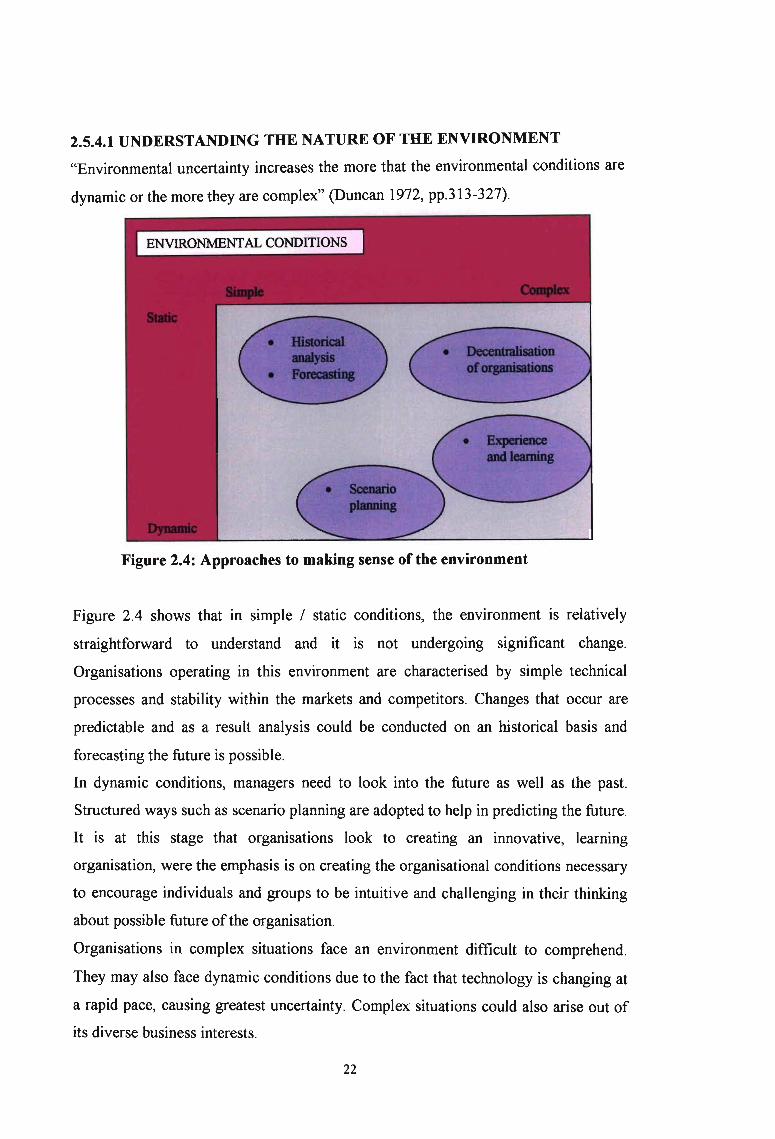
2.5.4.1 UNDERSTANDING THE NATURE OF THE ENVIRONMENT
"Environmental uncertainty increases the more that the environmental conditions are
dynamic or the more they are complex" (Duncan 1972, pp.313-327).
Figure 2.4: Approaches to making sense of the environment
Figure 2.4 shows that in simple / static conditions, the environment is relatively
straightforward to understand and it is not undergoing significant change.
Organisations operating in this environment are characterised by simple technical
processes and stability within the markets and competitors. Changes that occur are
predictable and as a result analysis could be conducted on an historical basis and
forecasting the future is possible.
In dynamic conditions, managers need to look into the future as well as the past.
Structured ways such as scenario planning are adopted to help in predicting the future.
It is at this stage that organisations look to creating an innovative, learning
organisation, were the emphasis is on creating the organisational conditions necessary
to encourage individuals and groups to be intuitive and challenging in their thinking
about possible future of the organisation.
Organisations in complex situations face an environment difficult to comprehend.
They may also face dynamic conditions due to the fact that technology is changing at
a rapid pace, causing greatest uncertainty. Complex situations could also arise out of
its diverse business interests.
22
2.5.4.2 AUDITING ENVIRONMENTAL INFLUENCES
The importance of environmental forces differs from organisation to organisation.
Over time, their importance may also change. A multinational corporation might be
especially concerned with government relations and understanding the policies of
local governments, since it may be operating plants or subsidiaries within many
different countries with different political systems. It is also likely to be concerned
with labour costs and exchange rates, which will affect its ability to compete with
multinational rivals. A retailer, on the other hand, may be primarily concerned with
local customer tastes and behaviour. A computer manufacturer is likely to be
concerned with its technical environment, which leads to product innovation and
perhaps obsolescence. Public sector managers and civil servants are likely to be
especially concerned with public policy issues, public funding levels and
demographic changes. However, none of these forces will remain constant, and
managers need to be aware of their changing impact.
2.5.5 SCANNING AND
ENVIRONMENT.
FORECASTING OF THE REMOTE
Environmental scanning is the systematic methods used by an organisation to monitor
and forecast those factors that are external to and not under the direct control of the
organisation or its industry. Organisations generally categorise environmental
scanning into four areas: political, economic, social and technological. However two
further categories are have been identified. These categories are ecological and legal.
The focus of scanning in each area is on trends that have organisation wide relevance.
The remote environment presents organisations with opportunities, threats, and
constraints, but rarely does a single organisation exert any meaningful reciprocal
influence.
Of the four areas, scanning in the economic area is probably considered the most
significant. Economic factors concern the nature and direction of the economy in
which a firm operates. The general state of the economy (e.g., depression, recession,
recovery, or prosperity), the level of interest paid by corporations and individuals, the
unemployment rate, and the level of consumer income are key economic variables in
corporate investment, employment, and pricing decisions. The rate of inflation and the
23

growth rate of the gross national product are additional economic variables that must
be considered in the strategic planning process.
The social factors that affect an organisation involve the beliefs, values, attitudes,
opinions, and lifestyles of persons in the organisations external environment. These
have evolved over time from cultural, ecological, demographic, religious, educational,
and ethnic factors. As social attitudes change, so too does the demand for various
types of clothing, books, leisure activities, and so on. Like other forces in the remote
external environment, social forces are dynamic, with constant change resulting from
the efforts of individuals to satisfy their desires and needs by controlling and adapting
to environmental factors. Some examples of social change include; the entry of large
numbers of woman into the labour market, the increasing interest by consumers and
employees in the quality of life issues, and shifts in the age distribution of
populations.
The direction and stability of political factors is a major consideration for managers
on formulating company strategy. Political factors define the legal and regulatory
parameters within which firms must operate. Political constraints are placed on
organisations through fair-trade decisions, antitrust laws, tax programs, minimum
wage legislation, pollution and pricing policies and many other actions aimed at
protecting employees, consumers, the general public, and the environment
The fourth set of factors in the environment involves technological change. To avoid
obsolescence and promote innovation, an organisation must be aware of technological
changes that might influence its industry. Creative technological adaptations can
suggest possibilities for new products, for improvements in existing products, or in
manufacturing and marketing techniques. A technological breakthrough can have a
sudden and dramatic effect on an organisation's environment. As a spin off, it may
create sophisticated new markets and products or significantly shorten the anticipated
life of a manufacturing facility. Thus all organisations must strive for an
understanding both of technological advances and the probable future advances that
can affect their products and services.
Ecological factors are increasingly becoming important factors to consider in the
external environmental analysis. It deals with the relationship that exists between the
organisation and the ecology. The biggest problem concerns threats to our life
supporting ecology caused primarily by human activities in an industrial society.
Specific concerns include global warming, loss of habitat and biodiversity, as well as
24
air, water and land pollution. As a major contributor to ecological pollution, business
is now being held responsible for eliminating the toxic by-products of its current
manufacturing processes and for cleaning up the environmental damage that it had
previously caused. Due to increasing government regulations and consumer
environmental concerns, the implementation of environmental policy has become a
point of competitive advantage. Therefore the logical goal of business should be to
limit its impact on the environment, thus ensuring long run benefits to both the firm
and the society, to neglect this responsibility is to ensure the demise of both the
organisation and the ecosystem.
2.5.6 INDUSTRY ENVIRONMENT
According to Thompson and Strickland (2001), industries differ widely in their
economic characteristics, competitive situations, and future prospects. The economic
character of industries varies according to such factors as overall size and market
growth rate, the pace of technological change, the geographic boundaries of the
market, the number of buyers and sellers, whether sellers' products are virtually
identical or highly differentiated, the extent to which costs are affected by economies
of scale, and the types of distribution channels used to access buyers. An industry's
economic traits and competitive conditions, and how they are expected to change,
determine whether its profit prospects are poor, average, or excellent. Industry and
competitive conditions differ so much that leading companies in unattractive
industries can find it hard to earn respectable profits, while even weak companies in
attractive industries can turn in good performances.
2.5.7 COMPETITIVE ANALYSIS
Bateman and Snell (1999) suggest that all organisations are affected by the general
components of the macro environment. Each organisation also functions in a closer,
more immediate competitive environment. The competitive environment comprises
the specific organisations with which the organisation interacts.
Byars (1987) further suggests that organisations do not exist III a vacuum. They
operate within a competitive industry environment. Analysing its competitors not only
enables an organisation to identify its own strengths and weaknesses but also helps to
identify opportunities for and threats to the organisation from its industry
environment.
25
Thompson and Strickland (2001) identifies that in order to undertake an industry and
competitive analysis, use should be made of a tool kit of concepts and techniques to
get a clear fix on key industry traits, the intensity of competition, the drivers of
industry change, the market positions and strategies of rival companies, the keys to
competitive success, and the industry's profit outlook. This analysis can be conducted
through the application of a comprehensive checklist of questions. Some of the key
areas that might be examined about a particular industry include:
2.5.7.1 THE INDUSTRY'S ECONOMIC FEATURES
Due to the fact that industries differ significantly in their basic character and structure,
industry and competitive analysis begins with an overview of the industry's dominant
economic features. This helps to frame the window of strategic approaches a company
can pursue. Thompson and Strickland (2001) suggests the following factors to
consider when profiling an industry's economic features:
• Market size.
•••••
••
•
•
••
•
Scope of competitive rivalry.
Market growth rate and position in the business life.
Number of rivals and their relative sizes.
The number of buyers and their relative sizes.
Whether and to what extent industry rivals have integrated backward and/or
forward.
The types of distribution channels used to access consumers.
The pace of technological changes in both production process innovation and
new product introductions.
Whether products the products and services of rival firms are highly
differentiated, weakly differentiated, or essentially identical.
Whether companies can realise economies of scale III purchasing,
manufacturing, transportation, marketing, or advertising.
Whether key industry participants are clustered in a particular location.
Whether certain industry activities are characterised by strong learning and
experience effects such that unit costs decline as cumulative output grows.
Whether high rates of capacity utilisation are crucial to achieving low cost
production efficiency.
26

• Capital requirements and the ease of entry and exit.
• Whether industry profitability is above or below par.
An industry's economic features are important because of the implications they have
for strategy. In capital Intensive industries, an organisation can spread the burden of
the high fixed costs by pursue a strategy that promotes high utilisation of fixed assets
to generate more revenue. In industries where there is one product advance after
another, a strategy of continuous product innovation becomes a condition of survival.
In industries where strong learning / experience effects in manufacturing cause unit
costs to decline, "a company that initiates production of a new-style product and
develops a successful strategy to capture the largest market share gains a sustainable
competitive advantage as the low cost provider" (Ghemawat 1985, pp.143-149).
2.5.7.2 COMPETITION WITHIN THE INDUSTRY
In order for managers to devise a successful strategy, they need to obtain an in-dept
understanding of the industry's competitive character. This involves delving into the
industry's competitive process to discover what the main sources of competitive
pressures are and the strength of each competitive force. Porter (1980) has postulated
that the competitive environment within an industry depends on five forces:
1. The manoeuvring for position among current competitors within an industry.
2. The threat of new entrants into the industry.
3. The bargaining power of customers.
4. The bargaining power of suppliers.
5. The threat of substitute products or services being introduced into the industry.
According to Porter (1980), successful managers do more than simply react to the
environment; they act in ways that actually shape or change the organisation's
environment. In strategic decision-making, Porter's model as depicted in figure 2.5 is
an excellent method for analysing the competitive environment in order to adapt to or
influence the nature of the competition.
27

SUPPLIERS
NEW
ENTRANTS
RIVALFIRMS
SUBSTITUTES
Figure 2.5 - The Competitive Environment
One approach to competitive analysis is to use the five forces model as a conceptual
framework for identifying an organisation's competitive strengths and weaknesses
and threats to and opportunities for the organisation from its competitive environment.
Thompson and Strickland (2001) noted that the strongest of the five competing forces
is usually the jockeying for position and buyer favour that goes on among rival sellers
of a product or service. The main tactic employed is price competition. Other tactics
such as offering buyers the most attractive combination of performance features,
being first to market with innovative products, introducing higher quality or more
durable products, offering buyers longer warranties and superior after sales service or
creating a stronger brand image are also employed.
The intensity of rivalry among competing sellers is a function of how vigorously they
employ such tactics. Irrespective of the intensity of the rivalry, every company is
challenged to craft a successful strategy for competing, ideally one that produces a
competitive edge over rivals and strengthens its position with buyers. The current
competitive environment is ever changing as companies' act and react to out -compete
28
one another and build customer loyalty. This type of intense rivalry is related to the
presence of a number of factors. Thompson and Strickland (2001) noted the following
factors:
• Rivalry intensifies as the number of competitors increases and as competitors
become more equal in size and capability.
• Rivalry is usually stronger when demand for the product is growing slowly.
• Rivalry is more intense when industry conditions tempt competitors to use price
cuts or other competitive weapons to boost unit volume.
• Rivalry is stronger when customers' costs to switch brands are low.
• Rivalry is stronger when one or more competitors are dissatisfied with their
market position and launch moves to bolster their standing at the expense of
rivals.
• Rivalry increases in proportion to the SIze of the payoff from a successful
strategic move.
• Rivalry tends to be more vigorous when it costs more to get out of a business
than to stay in and compete.
• Rivalry becomes more volatile and unpredictable the more diverse competitors
are in terms of their visions, strategic intents, objectives, strategies, resources,
and country of origin.
• Rivalry increases when strong companies outside the industry acquire weak
firms in the industry and launch aggressive, well-funded moves to transform
their newly acquired competitors into major market contenders.
"New entrants to a market bring new production capacity, the desire to establish a
secure place in the market, and sometimes substantial resources with which to
compete" (Porter 1979, p.138). New entrants into an industry compete with
established companies. If many factors prevent new companies from entering the
industry, the threat to established firms is less serious. If there are a few such barriers
to entry, the threat of new entrants is more serious. Porter (1979) notes the following
types of entry barriers:
• Economies of scale deter entry because they force potential competitors either
to enter on a large scale or accept a cost disadvantage and consequently lower
profitability. Either way, a potential entrant is discouraged by the prospect of
lower profits.
29

• Existing firms may have cost and resource advantages not available to potential
entrants.
• Lower unit costs achieved as a result of experience in producing the product or
other learning curve benefits.
• Successful entry may require technological capability not readily available to a
new comer. Unless new entrants can gain access to such proprietary knowledge,
they cannot compete on a level playing field.
• High brand loyalty means that a potential entrant must commit to building a
network of distributors and dealers, and then be prepared to spend enough
money on advertising and sales promotion to overcome customer loyalties and
build its own clientele. In addition, if it is difficult or costly for a customer to
switch to a new brand, a new entrant must persuade buyers that its brand is
worth the switching costs. To overcome the switching cost barrier, new entrants
may have to offer buyers a discounted price or an extra margin of quality or
service. All this can mean lower expected profit margins for new entrants.
• The larger the capital investment needed to enter the market successfully, the
more limited the pool of potential entrants.
• In the case of consumer goods, a potential entrant may face the barrier of
gaining adequate access to consumers. The more existing producers tie up
present distribution channels, the tougher entry will be.
• Government agencies can limit or even bar entry by requiring licences and
permits. In international markets, host governments commonly limit foreign
entry and must approve all foreign investment applications.
• National governments commonly use tariffs and trade restrictions to raise entry
barriers for foreign firms and protect domestic producers from competition.
In evaluating the potential threat of entry, management must look at:
1. How formidable the entry barriers are for each type of potential entrant and
2. How attractive the profit prospects are for new entrants. " High profits act as a
magnet to firms outside the industry, motivating potential entrants to commit
the resources needed to hurdle entry barriers" (Yip 1982, pp.85-93).
Thompson and Strickland (2001) states that the best test of whether potential entry is
a strong or weak competitive force in the market place is to ask if the industry's
growth and profit prospects are attractive enough to induce additional entry. He goes
30
on to further point out that the threat of entry changes as the industry's prospects grow
brighter or dimmer and as entry barriers rise or fall.
Technological advances and economic efficiencies are among the ways that firms can
develop substitutes for existing products. Substitute products or services can limit
another industry's revenue potential. Companies in those industries are likely to suffer
growth and earnings problems unless they improve quality or launch aggressive
marketing campaigns. Firms in one industry are quite often in close competition with
firms in another industry because their respective products are good substitutes.
According to Johnson and Scholes (1999), the threat of substitution may take different
forms. There could be product for product substitution. There may be substitution of
need by a new product or service rendering an existing product or service superfluous.
Generic substitution occurs where products or services compete for need. Doing
without can also be thought of as a substitute. The availability of substitutes can place
a ceiling on prices for a company's products, or make inroads into the market and so
reduce its attractiveness. The key questions that need to be addressed are:
• Whether or not a substitute poses the threat of obsolescence to a firm's product
or service, or provides a higher perceived benefit or value.
• The ease, with which buyers can switch to substitutes, usually determined by
the one-time costs facing the buyer making such a change.
• To what extent the risk of substitution can be reduced by building in switching
costs, perhaps through added product or service benefits meeting buyer needs.
Porter noted that the presence of readily available and attractively priced substitutes
creates competitive pressure by placing a ceiling on the price an industry can charge
for its product without giving customers an incentive to switch to substitutes and
risking sales erosion. This ceiling price at the same time puts a lid on the profits that
industry members can earn unless they find ways to cut costs. When substitutes are
cheaper than an industry's product, industry members come under heavy competitive
pressure to reduce their prices and find ways to absorb the price cuts with cost
reductions.
Porter (1979) goes on to further discuss that another determinant of the strength of
competition from substitutes is how difficult or costly it is for the industry's
customers to switch to a substitute. When switching costs are low, it is much easier
for sellers of substitutes to convince buyers to change over to their products. As a
31
rule, the lower the price of substitutes, the higher their quality and performance, and
the lower the user's switching costs, the more intense the competitive pressures posed
by substitute products.
Suppliers can exert bargaining power on participants in an industry by raising prices
or reducing the quality of purchased goods and services. Whether this represents a
weak or strong competitive force depends on whether suppliers can influence the
terms and conditions of supply in their favour and also the extent of supplier -seller
collaboration in the industry. The power of each important supplier group depends on
a number of characteristics of its market situation and on the relative importance of its
sales or purchases to the industry compared with its overall business. Pearce (1994)
states that a supplier group is powerful if:
1. It is dominated by a few companies and is more concentrated than the industry
it sells.
2. Its products is unique or at least differentiated, or if it has built up- switching
costs.
3. It is not obliged to contend with other products for sale to the industry.
4. It poses a credible threat of integrating forward into the industry's business.
5. The industry is not an important customer of the supplier group.
In more and more industries, rival sellers are electing to form long-term strategic
partnerships and close working relationships with select suppliers in order to promote
just-in-time deliveries and reduce inventory and logistics costs, speed up the
availability_ of next-generation components, enhance the quality of the parts and
components being supplied and reduce defect rates and lastly to reduce the supplier's
costs and pave the way for lower prices on the items supplied. Such benefits can
translate into competitive advantage for industry members who do the best job of
managing supply chain relationships and form effective collaborative partnerships
with suppliers.
Customers likewise can force down prices, demand higher quality or more service,
and play competitors off against each other. Pearce and Robinson (1994) states that a
buyer group is powerful if:
1. It is concentrated or purchases in large volumes.
2. The products it purchases from the industry are standard or undifferentiated.
3. The products it purchases from the industry form a component of its product
and represent a significant fraction of its cost.
32
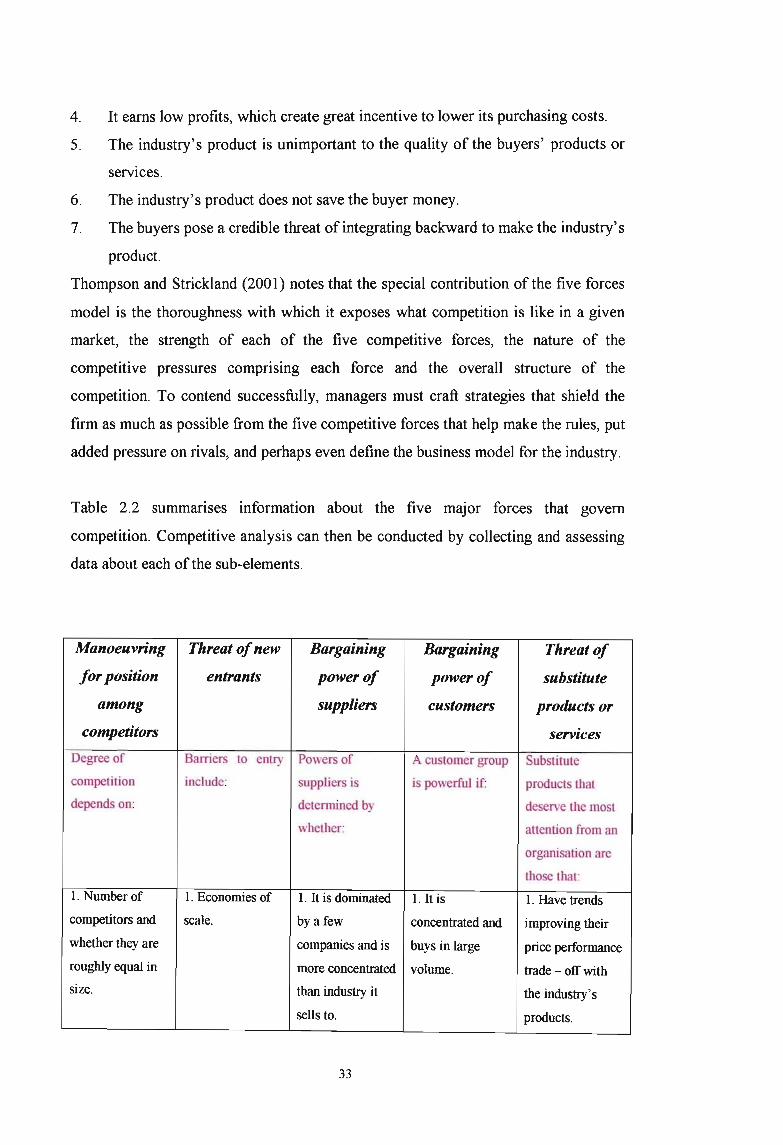
4. It earns low profits, which create great incentive to lower its purchasing costs.
5. The industry's product is unimportant to the quality of the buyers' products or
servIces.
6. The industry's product does not save the buyer money.
7. The buyers pose a credible threat of integrating backward to make the industry's
product.
Thompson and Strickland (2001) notes that the special contribution of the five forces
model is the thoroughness with which it exposes what competition is like in a given
market, the strength of each of the five competitive forces, the nature of the
competitive pressures comprising each force and the overall structure of the
competition. To contend successfully, managers must craft strategies that shield the
firm as much as possible from the five competitive forces that help make the rules, put
added pressure on rivals, and perhaps even define the business model for the industry.
Table 2.2 summarIses information about the five major forces that govern
competition. Competitive analysis can then be conducted by collecting and assessing
data about each of the sub-elements.
Manoeuvring Threat ofnew Bargaining Bargaining Threat of
for position entrants power of power of substitute
among suppliers customers products or
competitors services
Degree of Barriers to entry Powers of A customer group Substitute
competition include: suppliers is is powerful if: products that
depends on: determined by deserve the most
whether: attention from an
organisation are
those that:
1. Number of 1. Economies of 1. It is dominated 1. It is 1. Have trends
competitors and scale. by a few concentrated and improving their
whether they are companies and is buys in large price performance
roughly equal in more concentrated volume. trade - off with
size. than industry it the industry's
sells to. products.
33
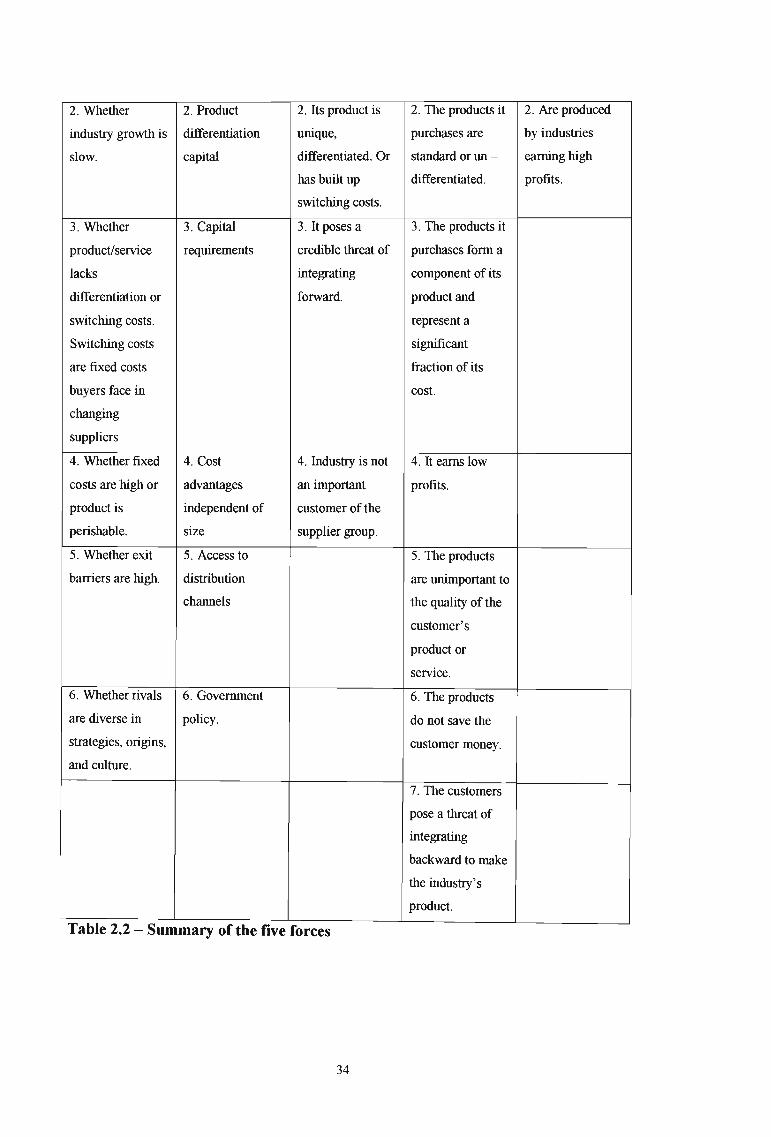
2. Whether 2. Product 2. Its product is 2. The products it 2. Are produced
industry growth is differentiation unique, purchases are by industries
slow. capital differentiated. Or standard or un - earning high
has built up differentiated. profits.
switching costs.
3. Whether 3. Capital 3. It poses a 3. The products it
product/service requirements credible threat of purchases form a
lacks integrating component of its
differentiation or forward. product and
switching costs. represent a
Switching costs significant
are fixed costs fraction of its
buyers face in cost.
changing
suppliers
4. Whether fixed 4. Cost 4. Industry is not 4. It earns low
costs are high or advantages an important profits.
product is independent of customer of the
perishable. size supplier group.
5. Whether exit 5. Access to 5. The products
barriers are high. distribution are unimportant to
channels the quality of the
customer's
product or
service.
6. Whether rivals 6. Government 6. The products
are diverse in policy. do not save the
strategies, origins, customer money.
and culture.
7. The customers
pose a threat of
integrating
backward to make
the industry's
product.
Table 2.2 - Summary of the five forces
34
2.5.7.3 DRIVING FORCES WITHIN THE INDUSTRY
"An industry's economic features and competitive structure say a lot about its
fundamental character but very little about the ways in which its environment may be
changing" (Thompson and Strickland 2001, p93). Industry conditions change because
important forces are driving industry participants to alter their actions. These
participants include competitors, customers and suppliers. The driving forces in an
industry are the major underlying causes of changing industry and competitive
conditions. Analysing these driving forces involves a two-step approach. Firstly one
needs to establish what these forces are and secondly the impact that these forces
would have on an industry.
Porter noted the following most common driving forces:
1. The Internet and the new e-commerce opportunities and threats it breeds in the
industry. The challenge here is to assess how, growing use of the Internet will
alter the industry and competitive landscape.
2. Increasing globalisation of the industry. Tariff reductions, deregulation and
privatisation of government owned enterprises bring local competitors in direct
competition with ambitious global companies. Significant differences in labour
costs among countries may create a strong reason to locate global-scale plants
for labour intensive products low wage countries and use these plants to supply
market demand across the whole world. Significant cost economies may accrue
to firms with world scale volumes as opposed to national scale volumes.
Multinational companies with the ability to transfer their production, marketing
and management know how from country to country at very low cost can
sometimes gain a significant competitive advantage over domestic competitors.
Globalisation is most likely to be a driving force in industries where scale
economies are so large that rival companies need to market their products in
many country markets to gain enough volume to drive unit costs down and also
where low cost production is a critical consideration. Globalisation has triggered
a frantic, fast paced race for global market leadership.
3. Changes in long-term industry growth rate. Shifts in industry growth up or
down are a driving force for industry change. An upsurge in long-term demand
triggers a race for growth among established firms and newcomers attracted by
the prospects for higher growth. Competition becomes a contest of who can
capture the growth opportunities and win a place among the market leaders.
35
4. Changes in who buys the product and how they use it. Shifts in buyer
demographics and new ways of using the product can alter the state of
competition.
S. Product innovation can shake up the structure of competition by broadening an
industry's customer base, rejuvenating industry growth, and widening the
degree of product differentiation among rival sellers.
6. Advances in technology can dramatically alter an industry's landscape, making
it possible to produce new and better products at lower cost and opening up
whole new industry frontiers.
7. When firms are successful in introducing new ways to market their products,
they can spark a burst of buyer interest, widen industry demand, and increase
product differentiation and lower unit costs.
8. The entry or exit of one or more foreign compames into a market once
dominated by domestic firms nearly always shakes up competitive conditions.
9. In recent years technology transfer across national boundaries has emerged as
one of the most important driving forces in globalising markets and
competition. As companies world wide gain access to technical know how, they
upgrade their manufacturing capabilities in a long-term effort to compete head
on against established companies.
10. Widening or shrinking differences In the costs and efficiency among key
competitors tends to dramatically alter the state of competition.
11. A shift to differentiated products is signalled when sellers are able to win a
bigger and more loyal buyer following by offering made to order products.
12. Government regulatory actions can often force significant changes in industry
practices and strategic approaches.
13. Emerging social issues and changing attitudes and lifestyles can be powerful
instigators of industry change.
14. Reductions in uncertainty and business risk
The task of driving force analysis is to separate the major causes of industry change
from the minor ones; usually no more than three or four factors qualify as driving
forces. Sound analysis of an industry's driving forces is a prerequisite to sound
strategy making. Without keen awareness of what external factors will produce the
biggest potential changes in the company's business over the next one to three years,
managers are ill prepared to craft a strategy tightly matched to emerging conditions.
36
Environmental scanmng IS one method of detecting future driving forces. This
involves studying and interpreting social, political, economic, ecological, and
technological trends that could lead to become driving forces. The process entails
spotting emerging trends that are catching on, and to extrapolate their possible
implications five to twenty years into the future.
2.5.7.4 IDENTIFYING THE ORGANISATION'S COMPETITIVE POSITION
The next step in examining the industry's competitive structure is to study the market
positions of rival companies. All organisations, public or private are in a competitive
position relative to each other as they are competing either for customers or resources.
It is therefore important that they understand their relative positioning and its
implications in strategic terms. According to Porter (1980), one technique for
revealing the competitive positions of industry participants is strategic group analysis.
Strategic group analysis aims to identify organisations with similar strategic
characteristics, following similar strategies or competing on similar bases. Such
groups can usually be identified using two, or perhaps three, sets of key
characteristics as a basis of competition. According to Porter (1908), the following
summarises the sorts of characteristics, which distinguish between organisations and
help identify strategic groupings:
• Extent of product or service diversity
• Extent ofgeographical coverage
• Number of market segments served
• Distribution channels used
• Extent ofbranding
• Marketing effort
• Extent ofvertical integration
• Product or service quality
• Technological leadership
• R&D capability
• Cost position
• Utilisation of capacity
• Pricing policy
• Level ofgearing
37
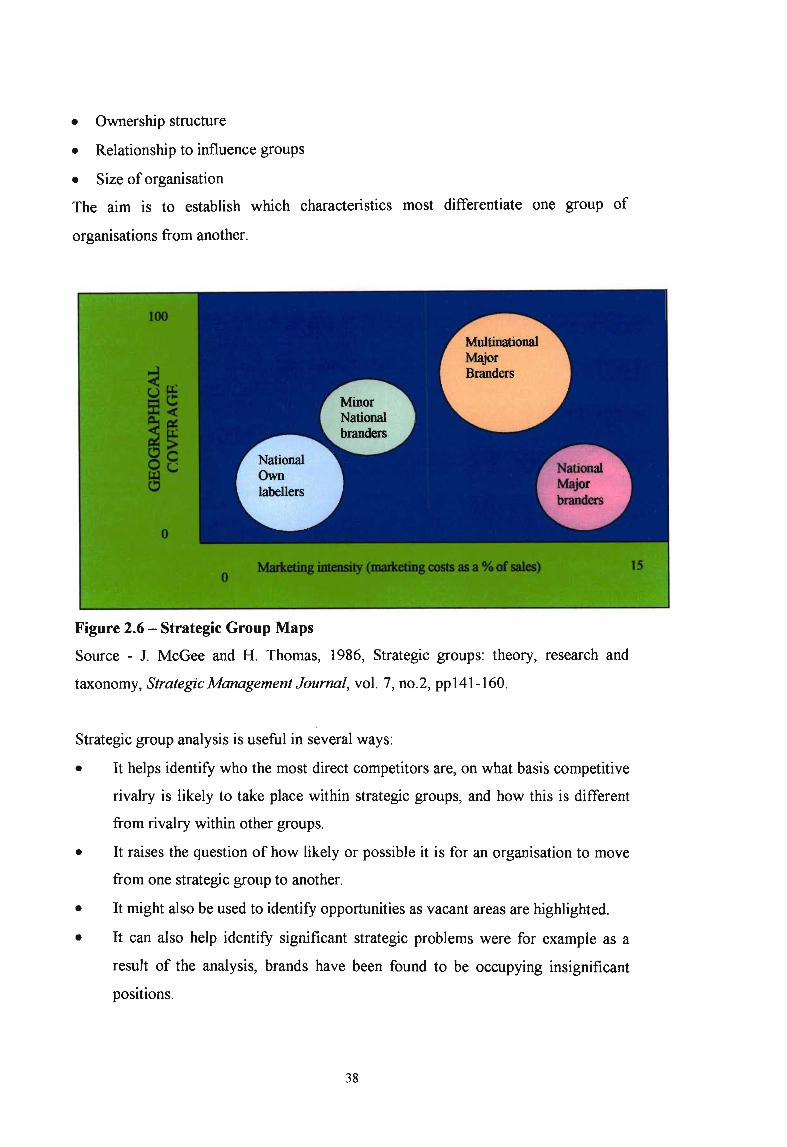
• Ownership structure
• Relationship to influence groups
• Size of organisation
The aim is to establish which characteristics most differentiate one group of
organisations from another.
Figure 2.6 - Strategic Group Maps
Source - 1. McGee and H. Thomas, 1986, Strategic groups: theory, research and
taxonomy, Strategic Management Journal, vol. 7, no.2, ppI41-160.
Strategic group analysis is useful in several ways:
• It helps identify who the most direct competitors are, on what basis competitive
rivalry is likely to take place within strategic groups, and how this is different
from rivalry within other groups.
• It raises the question of how likely or possible it is for an organisation to move
from one strategic group to another.
• It might also be used to identify opportunities as vacant areas are highlighted.
• It can also help identify significant strategic problems were for example as a
result of the analysis, brands have been found to be occupying insignificant
positions.
38

Market segmentation is another analysis technique where similarities and differences
between groups of customers or users are identified. This is important because not all
users are the same: they have different characteristics and needs, behave differently,
and so on. "Markets are therefore most usefully thought of in terms of market
segments, and identifying which organisations are competing in which market
segments is, in itself, a useful and important exercise" (Kotler 1994).
2.5.7.5 MONITORING THE STRATEGIC MOVES OF RIVALS
Successful strategists take great pains in gathering competitive intelligence about
competitors' strategies, monitoring their actions, sizing up their strengths and
weaknesses, and using what they have learned to anticipate what moves rivals are
likely to make next.
Thompson and Strickland (2001) suggests that the best source of information about a
competitor's strategy comes from examining what it is doing in the marketplace and
from what its management is saying about the company's plans. "Additional insights
into what a competitor is up to and its future strategy can be gotten by considering the
competitor's geographic market arena, strategic intent, market share objective,
position on the industry's strategic group map, and willingness to take risks; further, it
is important to know whether the competitor's recent moves are mostly offensive or
defensive" (Kahaner 1996, p84-85). The following provides a checklist for profiling
the objectives and strategies of competitors:
• Competitive scope
• Strategic intent
• Market share objective
• Competitive position! situation
• Strategic posture
• Competitive strategy
Predicting competitors' next moves is the hardest yet most useful part of competitor
analysis. Good clues about what moves a specific company may make next come
from studying its strategic intent, monitoring how well it is fairing in the market
place, and determining how much pressure it is under to improve its fmancial
39

performance. Managers who fail to study competitors closely risk being blindsided by
surprise actions on the part of rivals.
2.5.7.6 KEY FACTORS FOR COMPETITIVE SUCCESS
"An industry's key success factors are those things that most affect industry members'
ability to prosper in the marketplace - the particular strategy elements, product
attributes, resources, competencies, competitive capabilities, and business outcomes
that spell the difference between profit and loss and, ultimately, between competitive
success or failure" (Thompson and Strickland 2001, pI 06).
They go on to suggest three questions that will help identify an industry's key success
factors:
• On what basis do customers choose between the competing brands of sellers?
What product attributes are crucial?
• What resources and competitive capabilities does a seller need to have to be
competitively successful?
• What does it take for sellers to achieve a sustainable competitive advantage?
Pearce and Robinson (1994) suggests that in identifying their firm's current and
potential competitors, executives consider several important variables:
• How do other firms define the scope of their market?
• How similar are the benefits the customers derive from the products and
services that other firms offer?
• How committed are other firms to the industry?
Determining the industry's key success factors, given prevailing and anticipated
industry and competitive conditions, is a top-priority analytical consideration. At the
very least, managers need to understand the industry situation well enough to know
what is more important to competitive success and what is less important. A company
with perceptive understanding of industry key success factors can gain sustainable
competitive advantage by aligning its strategy to the industry key success factors and
devoting its energies to be distinctively better than rivals on one or more of these
factors. " Being distinctively better than rivals on one or more key success factors
presents a golden opportunity for gaining competitive advantage. Hence, using the
40

industry's key success factors as cornerstones for the company's strategy and trying to
gain sustainable competitive advantage by excelling at one particular key success
factor is a fruitful competitive strategy approach" (Ghemawat 1991, pll).
2.5.7.7 ATTRACTIVENESS OF THE INDUSTRY
The final step in conducting an industry and competitive analysis is to interpret the
results of the foregoing analysis and to draw conclusions on industry attractiveness,
for both the near term and long term. Some generic areas to be considered are:
• Factors making the industry attractive
• Factors making the industry unattractive
• Special industry issues/problems
• Profit outlook - favourable/unfavourable
Thompson and Strickland (2001) notes that as a general proposition, if an industry's
overall profit prospects are above average, the industry can be considered attractive; if
its profit prospects are below average, it is unattractive.
Good industry and competitive analysis is a prerequisite to good strategy making. A
competently done industry and competitive analysis tells a clear, easily understood
story about the company's external environment. It provides the understanding of a
company's macro environment needed for shrewdly matching strategy to the
company's external situation.
2.6 GLOBALISATION
"Special complications confront a firm involved in the globalisation of its operations.
Globalisation refers to the strategy of approaching world-wide markets with
standardised products. Such markets are most commonly created by end consumers
that prefer lower priced, standardised products over higher priced, customised
products and by global corporations that use their world wide operations to compete
in local markets" (Levitt 1982, p91).
Ronstadt and Kramer (1982) suggest that firms should take four steps in order to
begin their globalising activities. These include scanning the global situation, making
connections with academia and research organisations, increasing the firm's visibility
and undertaking co-operative research projects. Fayweather and Kapoor (1976)
41

suggest that a firm also needs to conduct external and internal assessments before a
firm enters a global market.
Global strategic planning is a complex task. Pearce and Robinson (1994) suggest the
following factors that contribute to this complexity:
• Globals face multiple political, economic, legal, social, and cultural
environments as well as rates of changes within them.
• Interactions between the national and foreign environments are complex,
because of national sovereignty issues and widely differing economic and social
conditions.
• Geographic separation, cultural and national differences, and variations 1ll
business practices all tend to make communication and control efforts between
headquarters and the overseas affiliates difficult.
• Globals face extreme competition, because of differences in industry structures.
• Globals are restricted in their selection of competitive strategies by various
regional blocs and economic integration.
From the foregoing, one can see that the strategic decisions of a firm competing in a
global marketplace become increasingly complex. In such a firm, managers cannot
view global operations as a set of independent decisions. These managers are faced
with trade-off decisions in which multiple products, country environments, resource
sourcing options, corporate and subsidiary capabilities, and strategic options must be
considered.
Porter (1986) has developed a framework for analysing the basic strategic alternatives
of a firm that competes globally. He states that the starting point of the analysis is an
understanding of the industry or industries in which the firm competes. International
industries can be ranked along a continuum that ranges from multi-domestic to global.
A multi-domestic industry is one in which competition is essentially segmented from
country to country. A global industry is one in which competition crosses national
borders and it occurs on a world- wide basis. Although industries can be characterised
as global or multi-domestic, there is rarely a case were one exists solely in that form.
Figure 2.7 illustrates the multinational strategy options that arise out of the
consideration of location and co-ordination dimensions. These are high foreign
investment, country- centered strategy, global strategy, and export based strategy.
42

High
Low
High foreign
Investment withExtensiveCoordinationAmong Global strategysubsidiaries
Country-centeredstrategy bymultinationals witha number of Export baseddomestic firms strategy withoperating in onlyone country decentralised
Geographicallydispersed
Geographicallyconcentrated
Figure 2.7 - International Strategy Options
Source: Adapted from M.E. Porter, 1986, Changing patterns of International
Competition, California Management Review, Winter, p19
Other areas of consideration that also give rise to international strategy options are
product diversity and market complexity. Complexity refers to the number of critical
success factors that is required to prosper in a given competitive arena. Diversity, the
second variable, refers to the breadth of a firm's business lines. Figure 2.8 illustrates
that when the variables are considered together, the complexity and diversity
dimensions from a continuum of possible strategic choices and combining these two
dimensions highlights many possible actions.
43
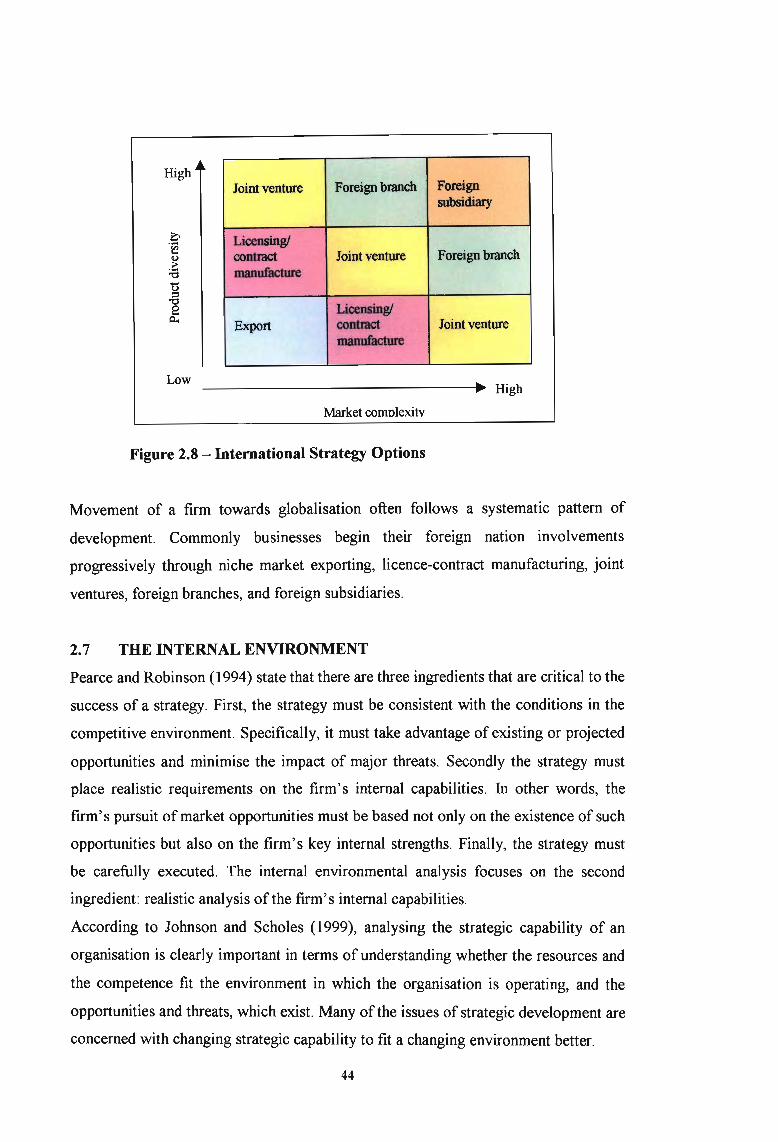
High
Low
Joint venture Foreign branch Foreignsubsidiary
Licensinglcontract Joint venture Foreign branchmanufacture
Licensing!Export conttaet Joint venture
manufacture
--------------... High
Market comolexitv
Figure 2.8 - International Strategy Options
Movement of a firm towards globalisation often follows a systematic pattern of
development. Commonly businesses begin their foreign nation involvements
progressively through niche market exporting, licence-contract manufacturing, joint
ventures, foreign branches, and foreign subsidiaries.
2.7 THE INTERNAL ENVIRONMENT
Pearce and Robinson (1994) state that there are three ingredients that are critical to the
success of a strategy. First, the strategy must be consistent with the conditions in the
competitive environment. Specifically, it must take advantage of existing or projected
opportunities and minimise the impact of major threats. Secondly the strategy must
place realistic requirements on the firm's internal capabilities. In other words, the
firm's pursuit of market opportunities must be based not only on the existence of such
opportunities but also on the firm's key internal strengths. Finally, the strategy must
be carefully executed. The internal environmental analysis focuses on the second
ingredient: realistic analysis of the firm's internal capabilities.
According to Johnson and Scholes (1999), analysing the strategic capability of an
organisation is clearly important in terms of understanding whether the resources and
the competence fit the environment in which the organisation is operating, and the
opportunities and threats, which exist. Many ofthe issues of strategic development are
concerned with changing strategic capability to fit a changing environment better.
44

2.7.1 EVALUATION OF CURRENT STRATEGY
Thompson and Strickland (2001) states that in order to evaluate how well a
company's present strategy is working, one has to identify what the strategy is and
evaluate it from both a qualitative and quantitative standpoint. In pursuing the
qualitative approach, one of the first things to ascertain is the company's competitive
approach. Is it striving to be a low cost leader, searching for ways to differentiate its
product offering, broadening its customer base or pursuing narrow niche markets?
What is the firm' s competitive scope within the industry? The firm's functional
strategies in production, marketing, finance etc further characterise company strategy.
In addition, recent strategic moves such as price cuts, product improvements and
mergers are also integral to its strategy and give some insight into the logic behind the
competitive moves. From a quantitative viewpoint, the best evidence is obtained from
evaluating the strategy against the financial performance. Kaplan and Norton (1992)
states that the two best empirical indicators are whether the company is achieving its
stated financial and strategic objectives, and whether the company is an above
average industry performer. In order to evaluate the performance of a company, one
can look at the following areas:
• Sales performance.
• Customer base.
• Profit margins
• Net profits, return on investment and economic value added.
• Overall financial strength and credit rating.
• Continuous improvement in unit costs, defect rate, scrap rate, employee
motivation and moral, stock-outs, backorders.
• Trends in the company's stock price.
• The image and reputation with its customers.
• Factors on which buyers base their choice ofbrands
According to Thompson and Strickland (2001), the company's overall performance is
an indicator of the suitability of its current strategy. Weak performance suggests that
current strategy must be questioned and ultimately radically changed.
45

2.7.2 SWOT ANALYSIS
"Sizing up a firm's resource strengths and weaknesses and its external opportunities
and threats, commonly known as SWOT analysis, provides a good overview of
whether a firm's business position is fundamentally healthy or unhealthy. SWOT
analysis is grounded in the basic principle that the strategy making efforts must aim at
producing a good fit between a company's resource capability and its external
situation. Perceptive understanding of a company's resource capabilities and
deficiencies, its market opportunities, and the external threats to its future well being
is essential to good strategy making" (Thompson and Strickland 2001, p117). Pearce
and Robinson (1994) state that the SWOT analysis is a systematic identification of
these factors and of the strategy that represents the best match between them. It is
based on the assumption that an effective strategy maximises a firm's strengths and
opportunities and minimises its weakness and threats. Accurately applied, this simple
assumption has powerful implications for the design of a successful strategy.
A strength is a resource, skill, or other advantage relative to competitors and the
needs of the markets a firm serves or expects to serve. It is a distinctive competence
when it gives the firm a comparative advantage in the marketplace. A strength may
exist with regard to a skill or important expertise, physical assets, human assets,
organisational assets, valuable intangible assets, competitive capabilities, an
achievement or attribute that puts the company in a passion of market advantage and
alliances or co-operative ventures.
Figure 2.9 reflects that taken together, a company's skills and expertise, its
intellectual capital, its competitive capabilities, its uniquely strong competencies, its
collection of strategically valuable assets, and its market achievements determine the
complement of resources with which it competes.
46

COMPETITIVEADVANTAGE
Strategic assetsand market
achievements
Core and distinctivecompetencies
Competitive capabilities
Company resources
Figure 2.9 - Mobilising the Company Resources to Produce
Competitive Advantage
The calibre of its resources and its ability to mobilise them in a manner calculated to
result in competitive advantage are the biggest determinants of how well the company
will be able to perform in light of the prevailing industry and competitive conditions.
Pearce and Robinson (1994) state that a weakness is a limitation or deficiency in
resource, skills, and capabilities that seriously impedes a firm's effective
performance. According to Tompson and Strickland (2001), a weakness is something
a company lacks or does poorly or a condition that puts it at a disadvantage. A
company's internal weakness can relate to:
• Deficiencies in competitively important skills or expertise or intellectual capital
or one kind or another
• A lack of competitively important physical, organisational or intangible assets.
• Missing or weak competitive capabilities in key areas.
Internal weaknesses are thus shortcomings in a company's complement of resources.
"An opportunity is a major favourable situation in a firm's environment" (Pearce and
Robinson 1994, p.175). They go on to identify that opportunities are mainly in the
47

form of key trends, however identification of a previously overlooked market
segment, changes in competitive or regulatory circumstances, technological changes,
and improved buyer or supplier relationships could also represent opportunities for
the firm. Thompson and Strickland (2001) states that opportunities most relevant to a
company are those that offer important avenues for profitable growth, those where a
company has the most potential for competitive advantage, and those that match up
well with the company's financial and organisational resource capabilities.
"A threat is a major unfavourable situation in a firm's environment"
(pearce and Robinson 1994, p17S). It is further stated that threats are key
impediments to the firm's current or desired position. The entrance of new
competitors, slow market growth, increased bargaining power of key buyers or
suppliers, technological changes, and new or revised regulations could represent
threats to a firm's success.
The really valuable part of SWOT analysis is determining what story the four lists tell
about the company's situation and thinking about what actions are needed.
" Understanding the story involves evaluating the strengths, weakness, opportunities,
and threats and drawing conclusions about how the company's strategy can be
matched to both its resource capabilities and its market opportunities, and how urgent
it is for the company to correct which particular resource weakness and guard against
which particular external threats" (Duncan, Ginter and Swayne 1998, pp.6-16).
Another way in which SWOT analysis can be used to aid strategic analysis IS
illustrated in figure 2.10.
Key external opportunities and threats are systematically compared with internal
strengths and weaknesses in a structured approach. The objective is identification of
one of four distinct patterns in the match between a firm's internal and external
situations. The options range from cell 1 being the most favourable situation, were the
firm faces several environmental opportunities and has numerous strengths that
encourage pursuit of those opportunities, to cell 4 were it is the least favourable
situation, with the firm facing major environmental threats from a position of relative
weakness.
Successful strategists aim at capturing a company's best growth opportunities and
creating defences against external threats to its competitive position and future
performance.
48

Numerousenvironmentalopportunities
Numerousenvironmentalopportunities
Numerousenvironmentalopportunities
Cell 1: Supportsan aggressivestrategy
Numerousenvironmentalopportunities
Figure 2.10 - SW T AnalysIs Diagram
2.7.3 CORE COMPETENCY ANALYSIS
"Organisations that understand their true strengths are better able to compete
successfully in a rapidly expanding and competitive world economy. Core
competence analysis will help them do this by enabling them to see beyond their end
products and served markets to their core technologies and sources of competitive
49
advantage" (Ambrosini, Johnson and Scholes 1998, p3). The following views help to
further explain the concept: The core competences of an organisation lie in the
collective learning in the organisation, especially " how to co-ordinate diverse
production skills and integrate multiple streams of technologies" (Hamel and Prahalad
1990). Parsons (1960) suggests that the skills and capabilities of an organisation are
embodied in three subsystems: administrative, technical and institutional. Kay (1993)
attributes corporate success to four distinctive capabilities: innovation, architecture,
reputation and strategic assets, and suggests that the effective blending of these four
can contribute to the unique capability of an organisation. (Ambrosini, Johnson and
Scholes 1998) suggests that a summary of all these views leads to a definition which
says that" the core competence of an organisation is its enabling culture," as opposed
to its relationship culture, where the relationship culture could be likened to its
personality and interpersonal skills and its enabling culture to its motivation and
applied skills.
Thompson and Strickland (2001) define core competence as a competitively
important internal activity that a company performs better than other competitively
important internal activities. He goes on to add that what makes it a core competence
as opposed to just a competence is that it is central to a company's competitiveness
and profitability rather than peripheral. "A core competence gives a company
competitive capability and thus qualifies as a genuine company strength and resource"
(Birchall and Tovistiga 1999, pp.1-16). Most often, a company's core competence
resides in its people and in its intellectual capital, not in its assets on the balance sheet.
When comparing a core competence to that of a competitor, (Hamel and Prahalad
1990) suggests that the core competence be termed a distinctive competence, and
offer the following definition. "A distinctive competence is something a company
does well in comparison to its competitors." Differences in company resources
account for why some companies are more profitable and more competitively
successful than others are. Collis and Montgomery (1995) offer a view that for a
particular company resource to qualify as the basis for sustainable competitive
advantage, it must pass four tests of competitive value:
1. Is the resource hard to copy?
2. How long does the resource last?
3. Is the resource really competitively superior?
4. Can the resource be trumped by the different resource/ capabilities of rivals?
50
2.7.4 ANALYSING PRICING AND COST COMPETITIVENESS
One of the most telling signs of whether a company's business position is strong or
precarious is whether its prices and costs are competitive with industry rivals.
Competitors usually do not incur the same costs in supplying their products to end
users. The cost disparities can range from tiny to competitively significant and can
stem from any several factors:
• Differences in the prices paid for raw materials,
• Differences in basic technology
• Differences in production costs,
• Differences in marketing costs,
• Differences in inbound transportation costs,
• Differences in forward channel distribution costs,
• Differences in rival firms' exposure to the effects of inflation.
For a company to be competitively successful, its costs must be in line with those of
close rivals. While every firm engages in internal cost analysis to stay on top of what
its own costs are and how they might be changing, strategic cost analysis goes a step
further to explore how most costs compare against rivals. Strategic cost analysis
focuses on a firm's cost position relative to its rivals. The combined costs of all the
activities in a business define the company's internal cost structure. The task of
strategic cost analysis is to compare a company's costs activity by activity against the
costs ofkey rivals and to learn which internal activities are a source of cost advantage
or disadvantage.
"The primary analytical tool of strategic cost analysis is a value chain identifying the
separate activities, functions, and business processes that are performed in designing,
producing, marketing, delivering, and supporting a product or service" (Cooper and
Kaplan 1988, p96). Value chain analysis is a framework for taking knowledge that
you have about a business and structuring that knowledge so that it can provide you
with new insights into that business. Part of its value as a strategic tool lies in the way
it forces you to make explicit what you know. Value chain analysis was originally
introduced as an accounting analysis to shed light on the value added by separate
steps in complex manufacturing processes, in order to determine where cost
improvements could be made or value creation improved, or both. Porter (1985)
51
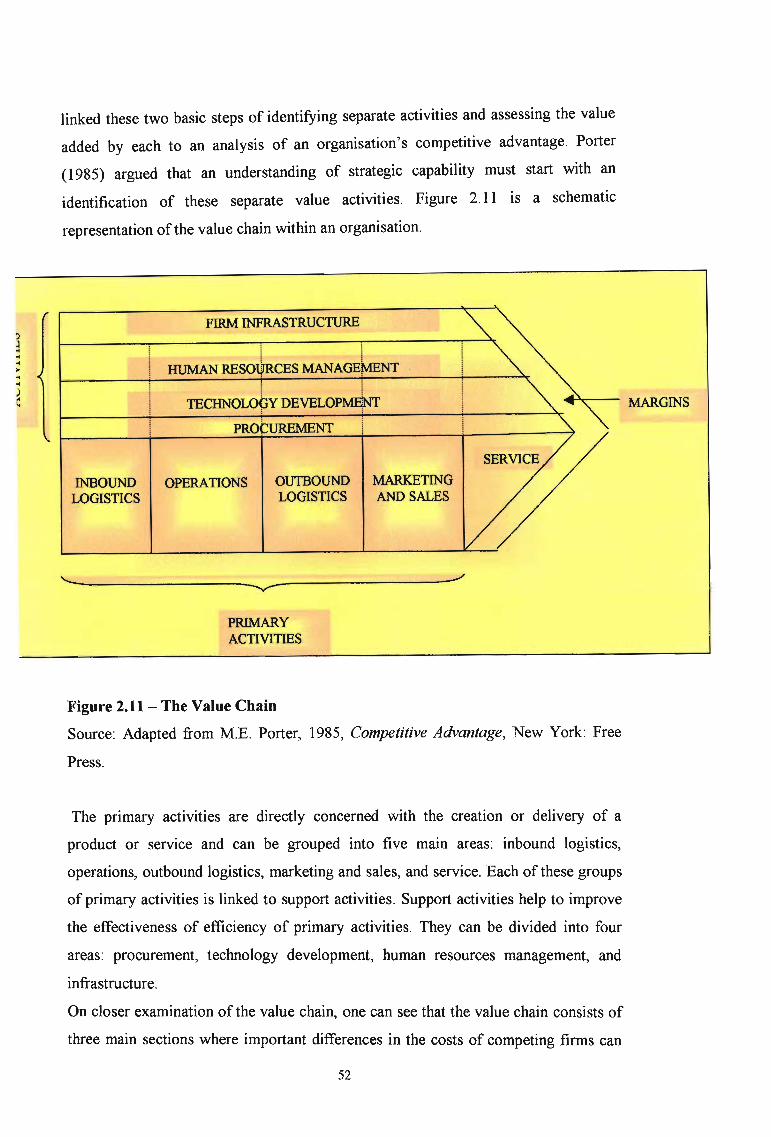
linked these two basic steps of identifying separate activities and assessing the value
added by each to an analysis of an organisation's competitive advantage. Porter
(1985) argued that an understanding of strategic capability must start with an
identification of these separate value activities. Figure 2.11 is a schematic
representation of the value chain within an organisation.
PROt;UREMENT
FIRM INFRASTRUCTURE
TECHNOLO~Y DEVELOP~ ~..--- MARGINS
OUTBOUND MARKETINGLOGISTICS AND SALES
HUMAN RESOtjrRCES MANAGEtvrnNT
INBOUND OPERATIONSLOGISTICS
'-------------- ----------~---.---PRIMARYACTIVITIES
Figure 2.11 - The Value Chain
Source: Adapted from M.B. Porter, 1985, Competitive Advantage, New York: Free
Press.
The primary activities are directly concerned with the creation or delivery of a
product or service and can be grouped into five main areas: inbound logistics,
operations, outbound logistics, marketing and sales, and service. Each of these groups
of primary activities is linked to support activities. Support activities help to improve
the effectiveness of efficiency of primary activities. They can be divided into four
areas: procurement, technology development, human resources management, and
infrastructure.
On closer examination of the value chain, one can see that the value chain consists of
three main sections where important differences in the costs of competing firms can
52
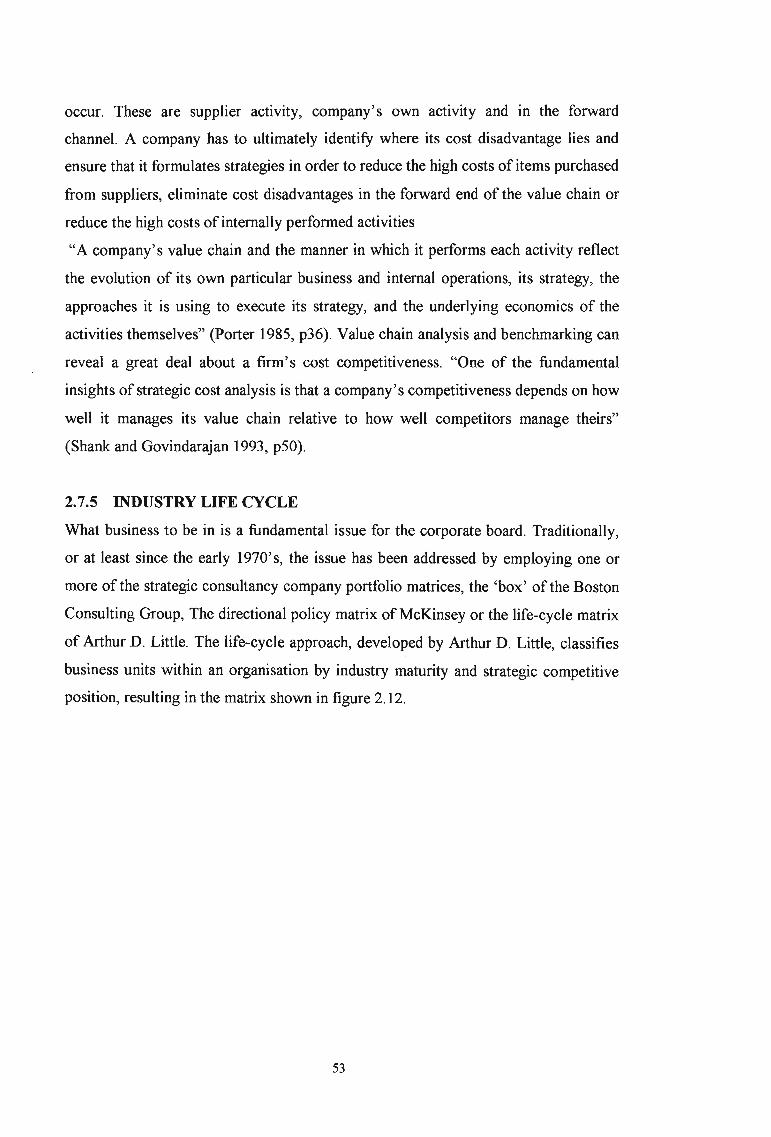
occur. These are supplier activity, company's own activity and in the forward
channel. A company has to ultimately identify where its cost disadvantage lies and
ensure that it formulates strategies in order to reduce the high costs of items purchased
from suppliers, eliminate cost disadvantages in the forward end of the value chain or
reduce the high costs of internally performed activities
"A company's value chain and the manner in which it performs each activity reflect
the evolution of its own particular business and internal operations, its strategy, the
approaches it is using to execute its strategy, and the underlying economics of the
activities themselves" (porter 1985, p36). Value chain analysis and benchmarking can
reveal a great deal about a firm's cost competitiveness. "One of the fundamental
insights of strategic cost analysis is that a company's competitiveness depends on how
well it manages its value chain relative to how well competitors manage theirs"
(Shank and Govindarajan 1993, p50).
2.7.5 INDUSTRY LIFE CYCLE
What business to be in is a fundamental issue for the corporate board. Traditionally,
or at least since the early 1970' s, the issue has been addressed by employing one or
more of the strategic consultancy company portfolio matrices, the 'box' of the Boston
Consulting Group, The directional policy matrix of McKinsey or the life-cycle matrix
of Arthur D. Little. The life-cycle approach, developed by Arthur D. Little, classifies
business units within an organisation by industry maturity and strategic competitive
position, resulting in the matrix shown in figure 2.12.
53
INDUSTRY MATURITY ICOMPETITIVE EMBRYONlC GROWTH MATURE AGING
POSITION
DOMINANT
STRONG
FAVOURABLE
TENABLE
WEAK
Figure 2.12 - Life Cycle Matrix
The life-cycle approach postulates that industries can be grouped into the following
stages of maturity:
• Embryonic - characterised by rapid growth, rapid changes in technology,
pursuit of new customers, and fragmented and changing shares of market.
• Growth - characterised by rapid growth, but customers, market share and
technology are better known and entry into the industry is more difficult.
• Mature - characterised by stability in known customers, technology and market
shares. The industry can, however, still be competitive.
• Ageing - characterised by falling demand, declining number of competitors,
and in many such industries, a narrowing of the product line.
The determination of a business unit's strategic competitive position calls for a
qualitative decision based on multiple criteria such as breadth of product line, market
share, movement in market share, and changes in technology. The lifecycle approach
maintains that as these criteria change over time, a business unit either gains or loses
competitive advantage and can be classified as being dominant, strong, favourable,
tenable, or weak.
After the business unit has been positioned within the matrix, a strategy can be
formulated for the business unit. At corporate level, resources are normally allocated
among business units on a competitive basis. Business units are screened or ranked on
criteria such as desirability of certain maturities, strength of competitive position,
ability to produce positive cash flows in the short or long term, rates of return on
investment or net assets, and degree of risk. This screening enables top management
to decide which business units are to receive what resources.
54
2.7.6 BENCHMARKING
Many companies today are benchmarking their costs of performing a given activity
against competitors' costs. Benchmarking is a tool that allows a company to
determine whether the manner in which it performs particular functions and activities
represent the industry best practices when both cost and effectiveness are taken into
account. " Benchmarking entails doing cross-company compansons of how basic
functions and processes in the value chain are performed, how materials are
purchased, how suppliers are paid, how inventories are managed, how products are
assembled, how fast the company can get new products to market, how the quality
control function is performed, how customers orders are filled and shipped, how
employees are trained, how payrolls are processed, and how maintenance IS
performed, and comparing the costs of these activities" (Watson 1993).
Thompson and Strickland (2001) suggests that the objectives of benchmarking are to
identify the best practices in performing an activity, to learn how other companies
have actually achieved lower costs or better results in performing benchmarked
activities, and to take action to improve a company's competitiveness whenever
benchmarking reveals that its costs and results of performing an activity do not match
those of other companies.
When properly resourced and implemented, benchmarking is a very powerful tool to
focus and drive change. It assists the change process by providing objective targets
and demonstrated best practice. It can enable an organisation to take a quantum leap
in process and bottom line performance improvements and outstrip competitors.
Benchmarking helps to identify relative performance against the selected measures.
This understanding of positioning is critical to the business improvement process, and
provides input to the application of other improvement tools. See figure 2.13.
55

KAIZEN :> O~~ >I PROCESS RE-ENGINEERING::>
CMEASURE~I 'rTJRRENT I
HRNf:HMARKTNG
I 'REST IN rT ,ASS'
Figure 2.13 - Benchmarking Compliments other ToolsSource: Ambrosisni, V; Johnson, G; Scholes, K. 1998. Exploring Techniques of
Analysis and Evaluation in Strategic Management 2nd edition. Financial Times
Prentice Hall.
Using benchmarks will help identify the size of the gap, and therefore the amount of
improvement that is necessary to match and surpass best practice. Once the gap has
been ascertained, it allows corrective action.
2.8 THE STRATEGIC ROLE AND OBJECTIVES OF THE OPERAnONS
FUNCTION
The operations function is central to the organisation because it produces the goods
and services, which are the reason for existing, but it is neither the only, nor
necessarily even the most important function. All organisations have other functions
with their own particular responsibilities. These other functions, although having their
own part to play in the organisation's activities, are bound together, along with
operations by common organisational goals. Operations management evolves from
operations strategy, which is cascaded down from corporate strategy.
56

InputTransformed
resources
MaterialsInformationcustomers
FacilitiesStaff
TheOperationsStrategic
Goodsandservices
InputTransforming
resources
Figure 2.14 - A General Model of Operations Management and Strategy
2.8.1 THE ROLE OF THE OPERATIONS FUNCTION
All parts of the business have their own role to play in achieving its success. At the
simplest level the role of each function is reflected in its name. The marketing
function positions the company's products or services in the market place. The
finance function monitors and controls the company's financial resources. The
operations function produces the services and goods demanded by the company's
customers. In examining the role of the operations function, three areas seem to be
particularly important for the operations function:
• "One role of the operations part business is to support strategy." W. Skinner
(1985). It must develop its resources to provide the capabilities, which are
needed to allow the organisation to achieve its strategic goals.
• As the implementer of business strategy. Most companies will have some kind
of strategy but it is the operation, which puts it into practice.
• As the driver of business strategy by giving it a long-term competitive edge.
57
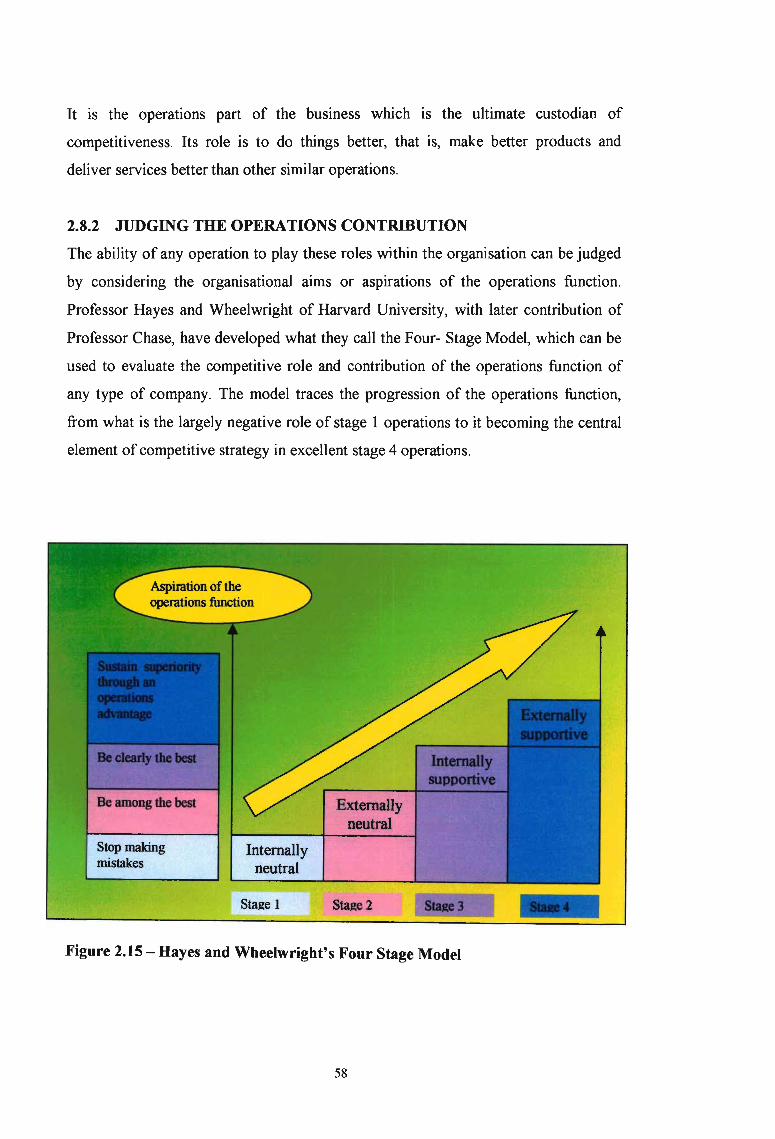
It is the operations part of the business which is the ultimate custodian of
competitiveness. Its role is to do things better, that is, make better products and
deliver services better than other similar operations.
2.8.2 JUDGING THE OPERATIONS CONTRIBUTION
The ability of any operation to play these roles within the organisation can be judged
by considering the organisational aims or aspirations of the operations function.
Professor Hayes and Wheelwright of Harvard University, with later contribution of
Professor Chase, have developed what they call the Four- Stage Model, which can be
used to evaluate the competitive role and contribution of the operations function of
any type of company. The model traces the progression of the operations function,
from what is the largely negative role of stage 1 operations to it becoming the central
element of competitive strategy in excellent stage 4 operations.
Stop makingmistakes
Internallyneutral
Stage 1
Externallyneutral
Staae 2
Figure 2.15 - Hayes and Wheelwright's Four Stage Model
58
2.8.3 THE FIVE PERFORMANCE OBJECTIVES
For any organisation wanting to succeed in the long term, the contribution of its
operations function is vital. It gives the organisation an operations based advantage.
This is achieved through five basic performance objectives. These are:
• Doing things right which gives a quality advantage that results in reduced costs
and increased dependability.
• Doing things fast which gives a speed advantage that results m reduced
inventories and risks.
• Doing things on time, which gives a dependability advantage that saves time
and money.
• Doing things differently, which gives a flexibility advantage that results m
speedier response, time saving and maintaining dependability.
• Doing things cheaply which gives a cost advantage that is affected by the other
performance objectives.
All these performance objectives have both external and internal effects. The internal
effects of high quality, speed, dependability, and flexibility are generally to reduce
costs within the operation.
2.9 STRATEGIC CONTROL AND CONTINUOUS IMPROVEMENT
Even when an operation is designed and its activities are planned and controlled, the
operations manager's task is not finished. All operations, no matter how well
managed, are capable of improvement.
2.9.1 OPERATIONS IMPROVEMENT
In order for operations managers to devise their approach to the improvement of their
operations, they need to know the current performance. The urgency, direction and
priorities of improvement will be partly based on whether the current performance of
an operation is judged to be good, bad or indifferent. As a prerequisite for
improvement, all operations therefore need some kind of performance measurement.
2.9.1.1 PERFORMANCE MEASUREMENT
"Performance measurement is a process of quantifYing action, where measurement
means the process of quantification, and the performance of the operation is assumed
59
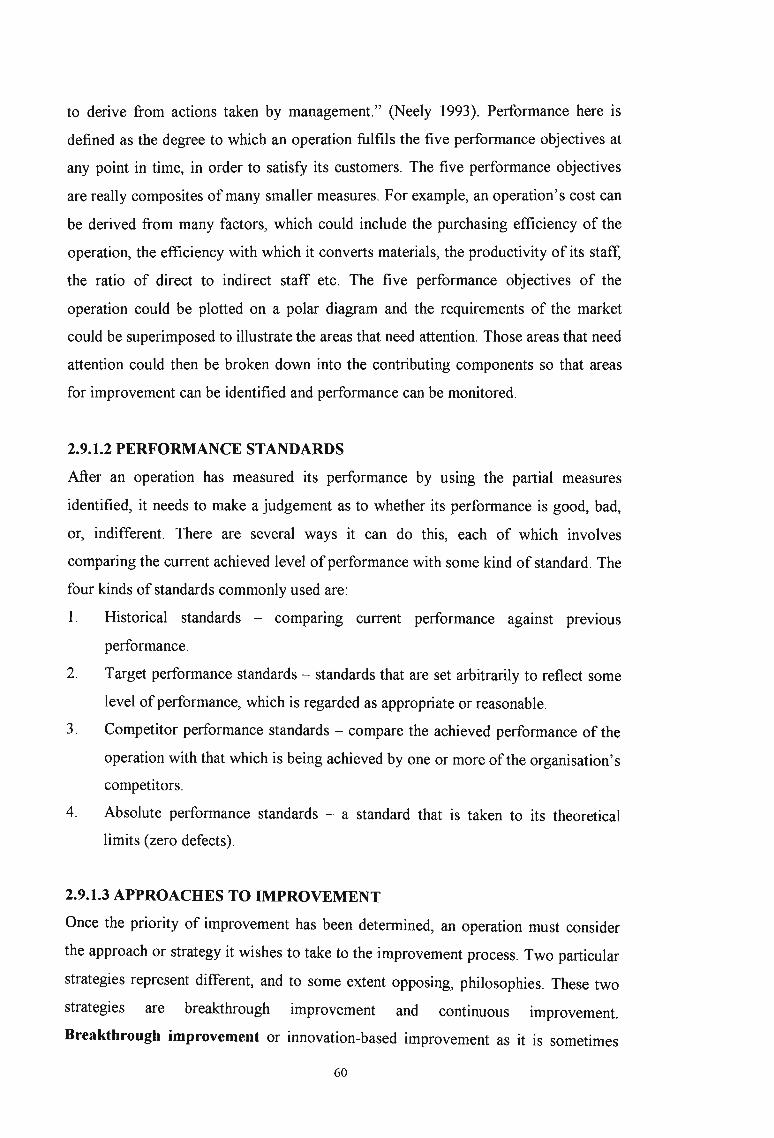
to derive from actions taken by management." (Neely 1993). Performance here is
defined as the degree to which an operation fulfils the five performance objectives at
any point in time, in order to satisfy its customers. The five performance objectives
are really composites of many smaller measures. For example, an operation's cost can
be derived from many factors, which could include the purchasing efficiency of the
operation, the efficiency with which it converts materials, the productivity of its staff,
the ratio of direct to indirect staff etc. The five performance objectives of the
operation could be plotted on a polar diagram and the requirements of the market
could be superimposed to illustrate the areas that need attention. Those areas that need
attention could then be broken down into the contributing components so that areas
for improvement can be identified and performance can be monitored.
2.9.1.2 PERFORMANCE STANDARDS
After an operation has measured its performance by using the partial measures
identified, it needs to make a judgement as to whether its performance is good, bad,
or, indifferent. There are several ways it can do this, each of which involves
comparing the current achieved level ofperformance with some kind of standard. The
four kinds of standards commonly used are:
1. Historical standards - comparmg current performance against preViOUS
performance.
2. Target performance standards - standards that are set arbitrarily to reflect some
level of performance, which is regarded as appropriate or reasonable.
3. Competitor performance standards - compare the achieved performance of the
operation with that which is being achieved by one or more of the organisation's
competitors.
4. Absolute performance standards - a standard that is taken to its theoretical
limits (zero defects).
2.9.1.3 APPROACHES TO IMPROVEMENT
Once the priority of improvement has been determined, an operation must consider
the approach or strategy it wishes to take to the improvement process. Two particular
strategies represent different, and to some extent opposing, philosophies. These two
strategies are breakthrough improvement and continuous improvement.
Breakthrough improvement or innovation-based improvement as it is sometimes
60
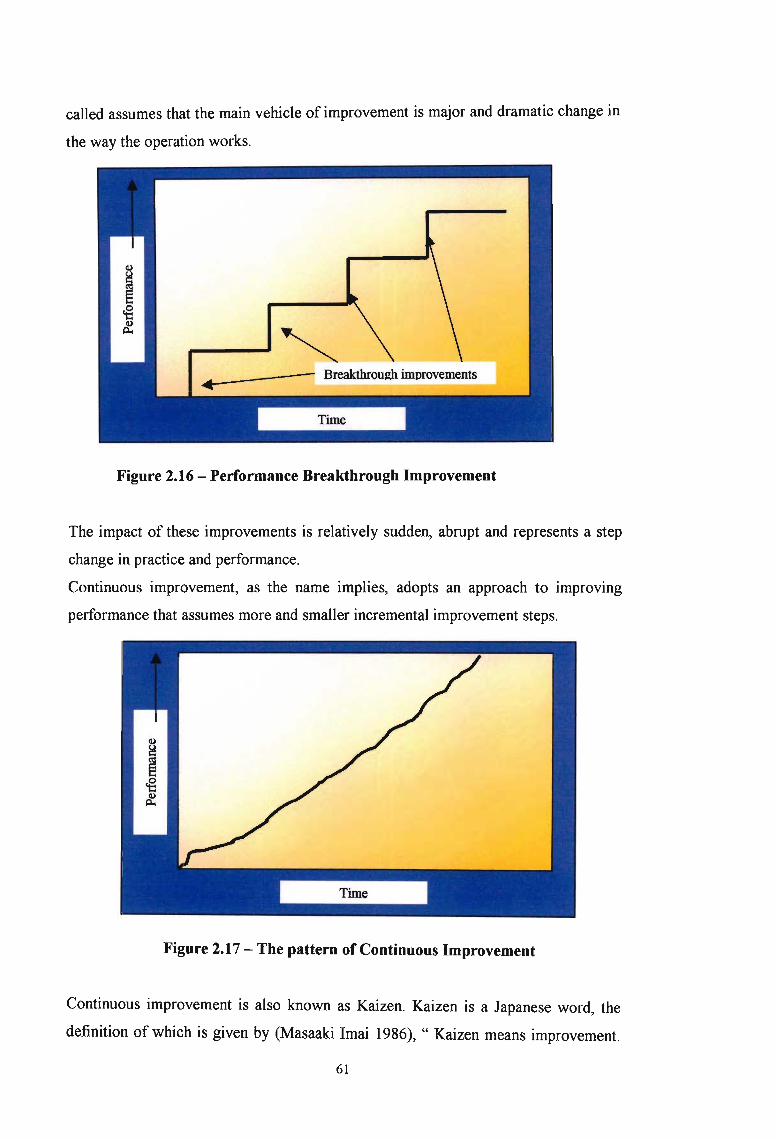
called assumes that the main vehicle of improvement is major and dramatic change in
the way the operation works.
Time
~__----- Breakthrough improvements
Figure 2.16 - Performance Breakthrough Improvement
The impact of these improvements is relatively sudden, abrupt and represents a step
change in practice and performance.
Continuous improvement, as the name implies, adopts an approach to improving
performance that assumes more and smaller incremental improvement steps.
Figure 2.17 - The pattern of Continuous Improvement
Continuous improvement is also known as Kaizen. Kaizen is a Japanese word, the
definition of which is given by (Masaaki Imai 1986), " Kaizen means improvement.
61
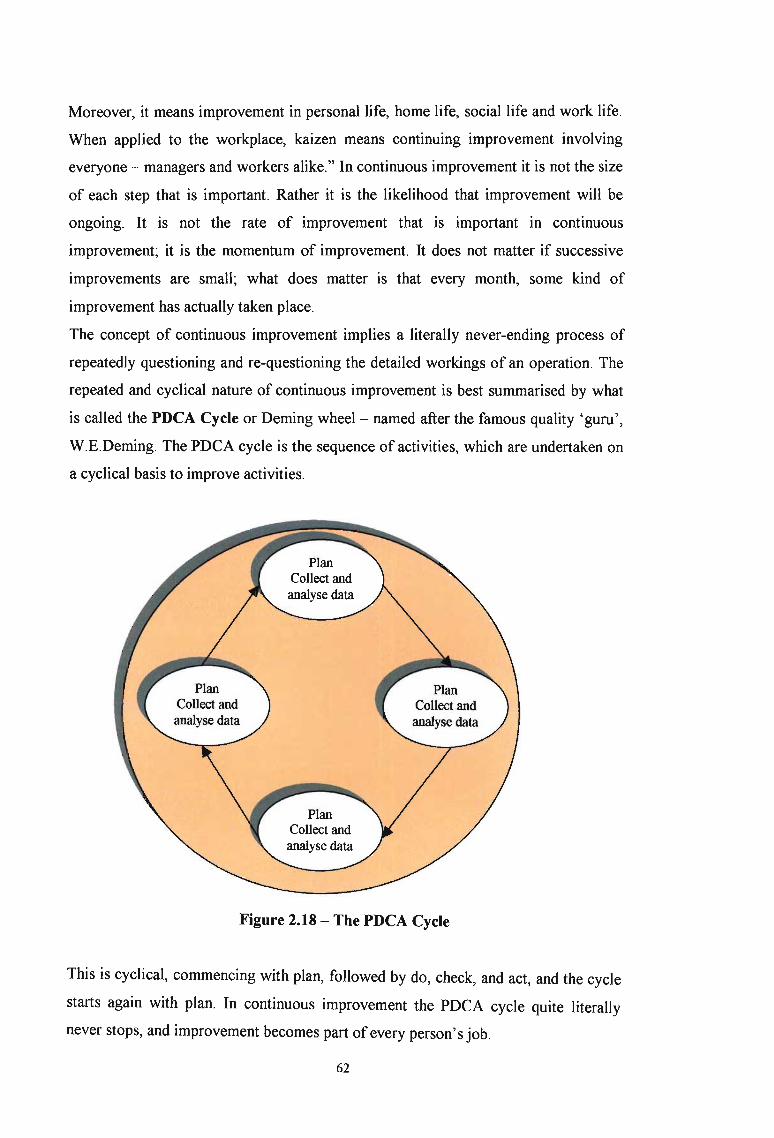
Moreover, it means improvement in personal life, home life, social life and work life.
When applied to the workplace, kaizen means continuing improvement involving
everyone - managers and workers alike." In continuous improvement it is not the size
of each step that is important. Rather it is the likelihood that improvement will be
ongoing. It is not the rate of improvement that is important in continuous
improvement; it is the momentum of improvement. It does not matter if successive
improvements are small; what does matter is that every month, some kind of
improvement has actually taken place.
The concept of continuous improvement implies a literally never-ending process of
repeatedly questioning and re-questioning the detailed workings of an operation. The
repeated and cyclical nature of continuous improvement is best summarised by what
is called the PDCA Cycle or Derning wheel - named after the famous quality 'guru',
W.E.Deming. The PDCA cycle is the sequence of activities, which are undertaken on
a cyclical basis to improve activities.
Figure 2.18 - The PDCA Cycle
This is cyclical, commencing with plan, followed by do, check, and act, and the cycle
starts again with plan. In continuous improvement the PDCA cycle quite literally
never stops, and improvement becomes part of every person's job.
62

Typical of the radical breakthrough way of tackling improvement is the Business
Process Re-engineering (BPR) approach. BPR is a blend of a number of ideas that
have been current in operations management for some time. Just-in -time concepts,
process flow-charting, critical examination in method study, operations network
management and customer-focused operations, all contribute to the BPR concept. It
was the potential of information technologies to enable the fundamental redesign of
processes, however, which acted as the catalyst in bringing these ideas together. BPR
has been defined as: "The fundamental rethinking and radical redesign of business
processes to achieve dramatic improvements in critical, contemporary measures of
performance, such as cost, quality, service and speed," (.Hammer eta! 1993)
2.9.2 FAILURE PREVENTION AND RECOVERY
Failure problems and mistakes are inevitable and intrinsic part of operations life.
Things are always going wrong. This is why operations managers need to be
concerned with the causes and effects of failure, as well as being active in attempting
to minimise failure. Not all failures are equally serious and attention is usually
directed at those that have the most impact on the operation or its customers. Failures
occur in operations for several reasons. Some are as a direct result of goods or
services that are supplied to the operation. Others happen within the operation, either
because there is an overall failure in its design, because one or more of its physical
facilities breakdown, or because there is human error. Customers can also cause
failures through their incompetent handling of goods and services.
There are three ways of measuring failure. These are:
1. Failure rates - indicating how often a failure is likely to occur;
2. Reliability - measures the chances of a failure occurring;
3. Availability - measures the amount of available and useful operating time left
after taking account of failures.
The probability of anything failing over time can be described by a probability curve.
The most common of these is the 'bath-tub' curve which has three stages, the infant
mortality or early life stage, the normal operating life stage, the final wear-out stage.
Failure detection and analysis involves putting mechanisms in place which sense
when some kind of failure has occurred and then analysing the failure to try to
understand its root causes.
63
After detecting and understanding a failure, operations managers need to work on
improving the reliability of operation. This can be done by:
• Designing out the fail points of the operations,
• Building redundancy into the operation,
• Fail-safing the operation so as to make failure and potential failures obvious.
The most common method of improving the operation's reliability however is by
maintaining the physical facilities in some planned and systematic manner.
There are three broad approaches to maintenance:
1. The first is running all facilities until they break down and then repairing them;
2. The second is regularly maintaining the facilities even if they have not broken
down so as to prevent the possibility of future breakdown;
3. The third is to monitor facilities closely to try to predict when breakdown might
occur and pre-empt it by repairing the facility.
The Total Productive Maintenance (TPM) concept is the latest in a development
of maintenance ideas. It is analogous to total quality management in that it proposes
shifting the responsibility of maintenance and care throughout the organisation.
In parallel with attempting to prevent failure, operations management must plan for
what they do if failure does occur. This is important because recovering from failure
can have a significant effect on shaping customers' perceptions of the organisation.
Failure planning provides a systematic framework that can be used to react to
failures when they do occur.
2.9.3 TOTAL QUALITY MANAGEMENT
Total quality management (TQM) is arguably the most significant of the new ideas,
which have swept across the operations management scene over the last few years.
Although the origins of total quality management go back to the 1940s and '50s, the
term was first used formally in1957 by Feigenbaum. Many authorities have however
contributed to the development of the ideas. These authorities include Deming, Juran,
Ishikawa, Taguchi and Crosby. The emphasis placed on various aspects of total
quality management varies among the authorities, but the general thrust of their
arguments are similar. TQM is concerned with more than quality alone. It is
concerned with the improvement of all aspects of operations performance and
particularly how improvement should be managed. TQM assumes that organisations
64
will need to put in place management control systems which facilitate quality
improvements. Such systems help to formalise what is good management practice
anyway. The most universal set of systems and procedures relating to quality are
those influenced by the ISO 9000 standards. These standards are intended to assure
purchasers of products and services that they have been produced in a way which
meets customer requirements. A number of factors appear to be influential in ensuring
the success of TQM initiatives. These are:
• Top management support,
• A steering group to guide the initiative,
• Group based improvements,
• Success in quality being recognised,
• An emphasis on appropriate training.
2.10 THE OPERATIONS STRATEGY CHALLENGE
The ultimate test for any operations manager is whether he or she can develop an
operation which meets the challenges which lie ahead for the organisation. The
process of operations strategy is concerned with the act of creating the strategy,
whereas the content of operations strategy is concerned with the output from the
operations strategy formulation process. Although not all operations have operation
strategy, there is some evidence to suggest that those who do are more likely to be
successful, and those operations managers who take part in the strategy formulation
process should have obtained a better understanding of the organisations overall
strategy.
There are a number of difficulties in formulating operations strategies. In particular
operations managers tend to be geographically dispersed; they also operate in 'real
time' and so therefore need to manage the operation at the same time as they are
formulating its strategy. They cannot easily change resources which have consumed
considerable investment; and finally, they are often not in the habit of contributing to
strategic change. Before looking at the process by which operations strategies can be
formulated, it is worthwhile examining what some people have called generic
operations strategies. These are common approaches to organising the operations
function which have been observed to be adopted by different types of organisations.
According to Mike Sweeney, operations strategies can be classified into categories of
65
generic strategies such as caretaker, marketeer, reorgamser and innovator. Most
organisations, even if they finish up adopting one of the generic strategies described
above, will want to formulate their own operations strategy to cope with what they see
as their individual competitive circumstances. There are several alternative
procedures, which have been suggested as providing the outline framework for
developing an operations strategy. Two well-known procedures are briefly described
here to give some insight into how operations strategies are formulated in practice.
The Hill methodology uses a five step procedure which progressively establishes a
strategic logic between the long term corporate objectives of the organisation, the
marketing strategy of the organisation, its competitive factors for each product or
service group, the structural process choice decisions of operations and the
infrastructural decisions of operations. The Platts-Gregory procedure places a greater
emphasis on comparing the needs of markets with the achieved performance of
operations. It uses profiling methods to determine the gaps between the importance of
competitive factors and the operation's performance at delivering them.
An effective operations strategy should clarify the links between overall competitive
strategy and the development of the company's operations resources. More
specifically, an operations strategy should be judged on the following criteria. The
strategy should be appropriate, comprehensive, coherent, credible, and consistent over
time. In formulating effective operations strategies, the following four strategies in
particular require attention.
1. Strategies must be ethical. Nearly all decisions made by operations managers
have some kind of ethical dimension. These ethical considerations affect one
ore more of the stakeholders of an organisation. Some companies make their
ethical stance explicit through a statement of mission and values.
2. Strategies must be international. Few organisations can afford to limit their
operations strategies to within their national boundaries. For operations
managers the environment within which they make their decisions is
increasingly, a global one.
3. Strategies must be creative. One of the most sought after behaviours in the
process of devising new operations strategies is that of creativity. Creativity
often involves breaking the implicit trade-off paradigm, which is seen by some
as governing the relationship between performance objectives. Creativity is
needed to devise ways in which the pivot of the trade-off can be shifted. This
66

means overcommg some of the blocks to creativity present m most
organisations.
4. Strategies must be implemented. Too often operations strategies fail at the
implementation stage. Successfully implementing operations strategies is
partly a matter of identifying an implementation agenda for any change. The
agenda should provide answers to the questions of, when to start, where to
start, how fast to proceed and how to co-ordinate the implementation
programmes?
2.11 CONCLUSION
This chapter explores the various views on the strategic management process and
outlines the nature, purpose, decisions and importance of an organisational strategy.
One of the main components of the value chain, the operations section of an
organisation was chosen for investigation. Here we investigated the link between
corporate strategy and operations strategy and pulled together some of the threads
which have run through our treatment of the subject. This lead to examining
strategies for performance measurement and continuous improvement and how these
contribute to best operating practices and becoming world class. This chapter
culminates with a model as depicted in figure 2.18.
The model reflects the strategic management journey, starting with the vision and
corporate strategy, taking a detour through to operations strategy and ending with
being world class. This model would be used as the basis for evaluation of strategy
evolution at BSN Medical in their quest to be 'best in the class.'
67
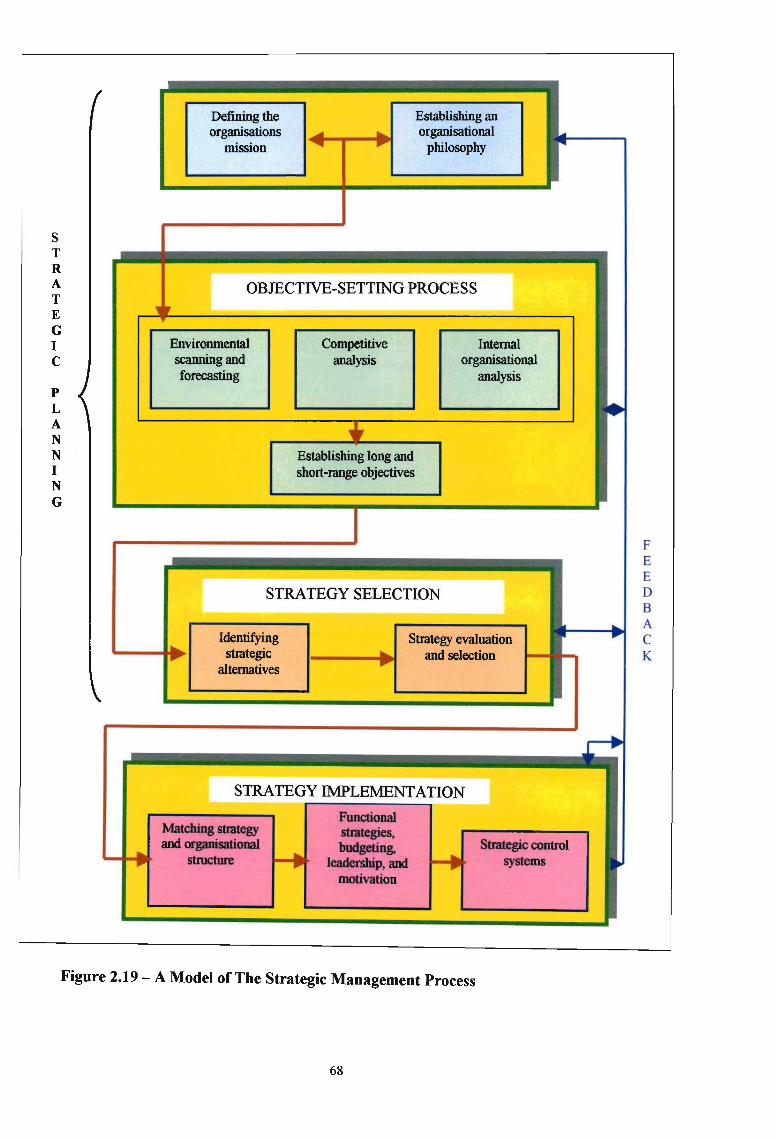
STRATEGIC
PLANNING
Defining the Establishing anorganisations ..... ... organisational L.o
mission ..... .... philosophy I""
OBJECTIVE-SETTING PROCESS,IF
Environmental Competitive Internalscanning and analysis organisationalforecasting analysis
~•Establishing long andshort-range objectives
r STRATEGY SELECTION J...
Identifying Strategy evaluation .......
strategic ... and selection io- ~....alternatives ....
..STRATEGY IMPLEMENTATION
FunctionalMatching strategy sttategies,
... and organisational
~budgeting,
~Strategic control
.... structure leadersbip, and systems
motivation
FEEDBACK
Figure 2.19 - A Model of The Strategic Management Process
68
CHAPTER 3: PRESENTING BSN MEDICAL
3.1 INTRODUCTION
Thomas James Smith, a pharmacist, set up a chemist shop in Hull, on England's north
East Coast in 1856. Forty years later, in 1896, he invited his nephew, Horatio Nelson
Smith, to join him in the business; this is how Smith & Nephew came into existence.
It was RN. Smith who came to South Africa in the early 1920's to assess the potential
market for the company's products. In 1931 Smith & Nephew limited was registered
as a company in South Africa to import and sell the products manufactured by the
parent company in the United Kingdom.
Smith & Nephew, South Africa opened its first factory in Pinetown on 02 July 1955,
Manufacturing Elastoplast, Gypsona, Plaster ofParis and Jelonet. In April 2001 Smith
& Nephew and Beiersdorf formed a joint venture manufacturing facility called BSN
medical. In South Africa, only the operations division of Smith & Nephew was
included in the joint venture.
BSN medical, South Africa has manufacturing sites in Pinetown, eZakheni and
iSithebe and now employs approximately 730 people, most of who work in Pinetown.
The South African head office is in Pinetown. At present the company uses the
services of Smith & Nephew for HR, IT and Finance but this is in the process of
changing as the company grows and develops. The company products are also
exported to many African countries, South East Asia, Australia, and Europe.
3.2.1 THE JOINT VENTURE
BSN Medical the joint venture company between Smith & Nephew and Beiersdorf
started operation in April 2001. The joint venture was agreed earlier in November
2000 and was subject to competition clearances that had to be obtained in the different
operating countries. The new venture brought together the interests ofboth partners in
Casting and bandaging, traditional Woundcare and Phlebology (compression
hosiery). The company had equal shareholding and on transfer into the new company
sales were projected at £150m and operating profits of £17m. Future profits were to
be shared equally between the partners. BSN Medical was to combine the strengths of
both parent companies with a new and separate identity; independent management
and dedicated sales and manufacturing teams all aimed at creating real market focus.
69
Smith & Nephew have had a relationship with Beiersdorf for over 50 years, most
recently through the distribution agreement for Nivea. The joint venture and the
associated sale of Beiersdorfs advanced wound care products to Smith & Nephew
was a logical extension of the relationship and perfectly fitted into the two companies'
strategies: it allowed Smith & Nephew to concentrate on becoming an advanced
medical device company, and Beiersdorf to focus its energies on consumer personal
care products.
3.2.2 PORTFOLIO OF LEADING BRANDS
It was projected that BSN Medical will become a substantial global player with
annual sales of about £300m world-wide. It would manage a portfolio of leading
brands in its core product segments with a mandate to develop business strongly.
Substantial synergies would be realised in all areas of the combined operation,
enabling better resource allocation and creating significant cost reduction
opportunities. This would enable BSN Medical to generate excellent profit growth
over the medium term.
The new business is headquartered in Hamburg, Germany. It consists of some 3000
employees and manufacturing facilities in the United Kingdom, United States of
America, Germany, France, Ireland, South Africa, Mexico, India and Pakistan. The
joint venture company benefited from Smith & Nephew's manufacturing
rationalisation programme and from the integration of the Beiersdorf products and
manufacturing facilities into the programme.
BSN was to adopt a market leader approach in many ofthe fields in which it operated.
Casting and bandaging will contribute about 43% of the business, traditional wound
care 35% and phlebology 22%. Geographically, 59% of sales were destined for
Europe, 22% in North America and 19% in the rest of the world. In the key markets
of Germany, the UK, the US, France and the Netherlands, the company had its own
sales resources. In other countries, BSN Medical shared the selling resources of both
parents. In most countries, Smith & Nephew distributed BSN Medical's products into
the hospital and other non-pharmacy channels; Beiersdorf distributed products into
the retail pharmacy sector. These relationships enabled the joint venture to benefit
from a greater critical mass in all trade channels, to the mutual benefit of both
partners.
70

3.2.3 NEW OPPORTUNITIES
Building on its strong market position is an overriding objective for BSN Medical in
the coming years. With this in mind, the new business actively seeks to develop new
opportunities through enhanced joint research and development investment and
through acquisitions and licensing arrangements. A combined team from Smith &
Nephew and Beiersdorf, led by Graham Siddle, the ChiefExecutive, manages the new
company. The business is being guided rigorously and carefully to become a leading
independent global supplier of high quality health care products and its enhanced
focus is expected to generate real value for its parent companies.
3.2.4 BSN MEDICAL AROUND THE WORLD
BSN Medical (BSN) works closely with its parents across the globe to sell and
distribute its products world-wide. The following is a list ofBSN's key global sites.
• Canada - BSN has a small sales and marketing presence based in Toronto,
employing 12 people.
• USA - North America accounts for 22% of BSN's global sales. BSN has
dedicated sales and marketing operations in the USA and the Casting &
Bandaging and Phlebology Global Business Units (GBU) share their global
headquarters in Charlotte, North Carolina. Phlebology has a manufacturing site in
Rutherford College in North Carolina that produces compression stockings and a
manufacturing site in Toledo, Ohio that produces custom made stockings and burn
garments. Bsn employs over 750 staff in the USA.
• Mexico - Mexico is home to BSN's new Casting and Bandaging factory, which
was officially opened in May 2001. Located in the Border City of Reynosa, the
factory is BSN's global producer of synthetic splints and employs approximately
125 people.
• United Kingdom - The UK is one of BSN's key European markets and has
dedicated sales and marketing operations. The Casting & Bandaging
manufacturing site in Brierfield in Lancashire has transferred from Smith &
Nephew to BSN. The UK business also has a technical and sales and marketing
presence in Hull. BSN employs a total of 465 people in the UK. The Hull factory
remains a Smith & Nephew site but provides product for BSN.
71
• Ireland - Casting & Bandaging's Tipperary manufacturing site 10 Southern
Ireland employs 145 people.
• France - Another key market for BSN. Integrated sales and marketing operations
are based in Le Mans. In addition there is a Casting & Bandaging /Wound care
manufacturing plant in Vibraye. More than 300 people work for BSN in France.
• Netherlands - Like the bigger European and US markets, BSN has a dedicated
sales and marketing business in the Netherlands. Operations are based near
Amsterdam and BSN employs 50 people.
• Germany - Germany is BSN's biggest market, accounting for 22% of sales
world-wide. BSN has established its own sales and marketing operations in
Germany and it is also home to BSN's head office, located in Hamburg. The
Wound Care GBU's head office is in Hamburg and the GBU also has a
manufacturing factory in Hamburg. In addition, Phlebology has a manufacturing
site in Emmerich near the German-Dutch border. More than 500 people work for
BSN in Germany.
• Pakistan - Casting & Bandaging has a manufacturing site 10 Karachi that
employs 200 people.
• South Africa - Casting & Bandaging / Wound Care has a manufacturing facility
in Pinetown which is outside Durban. There are also two smaller sites in South
Africa. In total 740 people work for BSN in South Africa.
• Indonesia - BSN's operations in Indonesia are based in Jakarta and employ 20
people. Products are being marketed by the parent companies.
• New Zealand - Based in Auckland, BSN's products are marketed by Smith &
Nephew. There is also a small manufacturing facility with 35 employees.
3.2.5 THE FIRST NINE MONTHS OF OPERATION
BSN Medical began operations on April 2nd 2001 as a jOlOt venture between
Beiersdorf AG and Smith & Nephew PLC. Their objective was to create a new
company that would focus on the development of product categories that had become
non-core to their businesses. Furthermore, combining the highly complementary
casting, bandaging, woundcare and phlebology operations of the two parents would
create opportunities for growth and substantial synergies over the coming years.
72
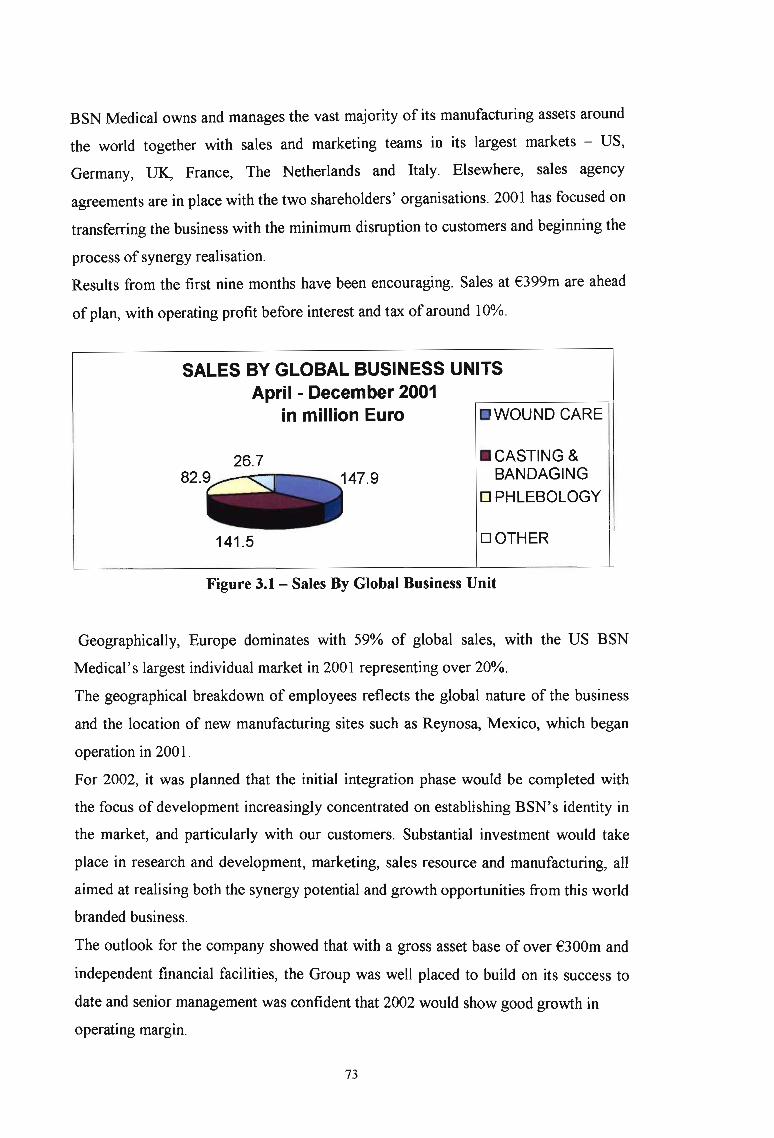
BSN Medical owns and manages the vast majority of its manufacturing assets around
the world together with sales and marketing teams in its largest markets - US,
Germany, UK, France, The Netherlands and Italy. Elsewhere, sales agency
agreements are in place with the two shareholders' organisations. 2001 has focused on
transferring the business with the minimum disruption to customers and beginning the
process of synergy realisation.
Results from the first nine months have been encouraging. Sales at €399m are ahead
of plan, with operating profit before interest and tax of around 10%.
SALES BY GLOBAL BUSINESS UNITSApril - December 2001
in million Euro WOUND CARE
26.7
141.5
-CASTING &BANDAGING
o PHLEBOLOGY
o OTHER
Figure 3.1- Sales By Global Business Unit
Geographically, Europe dominates with 59% of global sales, with the US BSN
Medical's largest individual market in 2001 representing over 20%.
The geographical breakdown of employees reflects the global nature of the business
and the location of new manufacturing sites such as Reynosa, Mexico, which began
operation in 2001.
For 2002, it was planned that the initial integration phase would be completed with
the focus of development increasingly concentrated on establishing BSN's identity in
the market, and particularly with our customers. Substantial investment would take
place in research and development, marketing, sales resource and manufacturing, all
aimed at realising both the synergy potential and growth opportunities from this world
branded business.
The outlook for the company showed that with a gross asset base of over €300m and
independent financial facilities, the Group was well placed to build on its success to
date and senior management was confident that 2002 would show good growth in
operating margin.
73
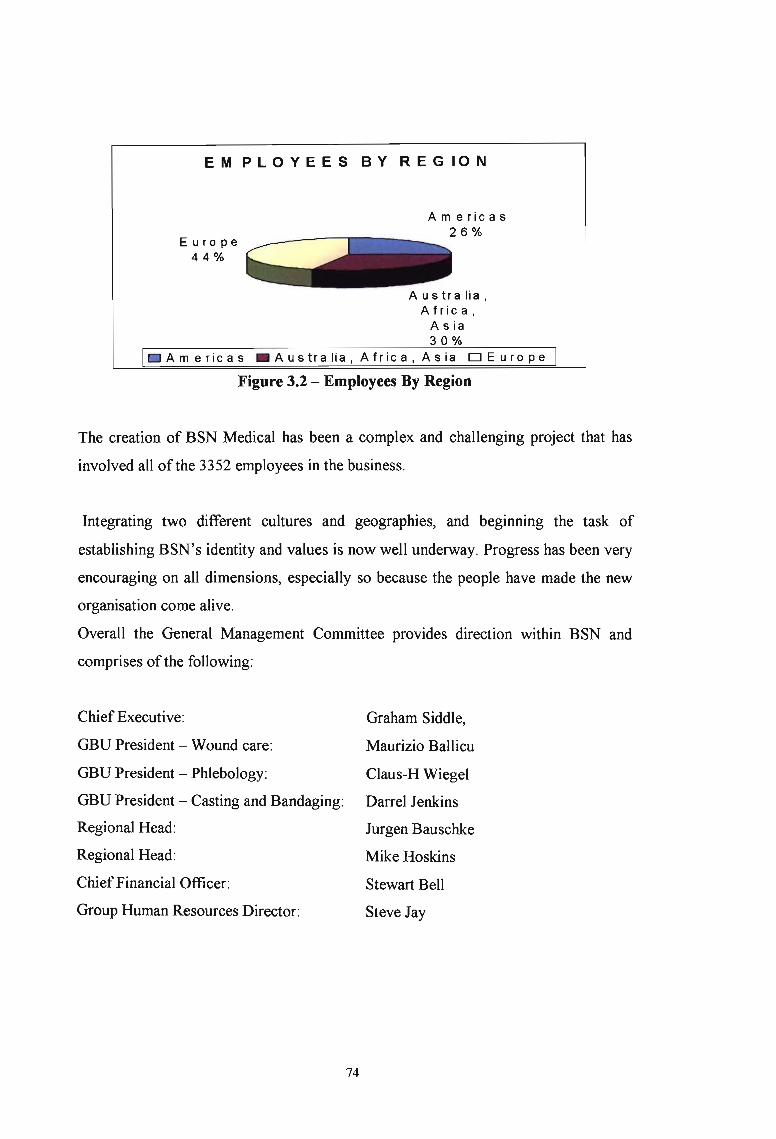
Europe44%
E M PLO Y E E S 8 Y R E G 10 N
Americas26%
Australia,Africa,
Asia30%
Americas _Australia, Africa, Asia DEurope
Figure 3.2 - Employees By Region
The creation of BSN Medical has been a complex and challenging project that has
involved all ofthe 3352 employees in the business.
Integrating two different cultures and geographies, and beginning the task of
establishing BSN's identity and values is now well underway. Progress has been very
encouraging on all dimensions, especially so because the people have made the new
organisation come alive.
Overall the General Management Committee provides direction within BSN and
comprises of the following:
Chief Executive:
GBU President - Wound care:
GBU President - Phlebology:
GBU President - Casting and Bandaging:
Regional Head:
Regional Head:
ChiefFinancial Officer:
Group Human Resources Director:
74
Graham Siddle,
Maurizio Ballicu
Claus-H Wiegel
Darrel Jenkins
Jurgen Bauschke
Mike Hoskins
Stewart Bell
Steve Jay
3.2.5.1 WOUND CARE
BSN medical is the European market leader in surgical tape and wide area fixation
with brands such as the Leuko and Albu range, Fixomull and Hypafix. Creating BSN
gave substantial opportunity to rationalise these ranges of products and their
manufacture and much of the activity in 2001 has concentrated on realising these
synergies. This process will continue into 2002 and will have a positive impact on
operating margin.
At the same time new initiatives such as the transfer from metal to plastic spools in
2002 has created momentum in the business. In April to December 2001, sales
achieved €148m, an encouraging performance with an overall positive trend on
market share.
3.2.5.2 PHLEBOLOGY
Sales reached €83m in April to December 2001 with good growth in operating
margin. This performance reflected the successful launch of the JOBST OPAQUE
range in key countries, which contributed to market share gain in the two largest
markets, USA and Germany. Organisationally, global responsibilities were centralised
in Charlotte, North Carolina during the year, along with the US customer service
function, which transferred from Toledo.
Looking ahead the emphasis will be on developing the JOBST brand through quality,
range and innovation. Our goal is to lead the market and provide the most clinically
effective products for our customers. The end of 2002 will consolidate manufacturing
into two sites, Emmerich, Germany and Rutherford College, USA.
3.2.5.3 CASTING AND BANDAGING
Casting and Bandaging has its sights on taking its business to a new level. The
business success began in 1930 with the launch of the first Plaster of Paris (PoP)
bandage, Gypsona, which is still a highly successful brand. This business unit focuses
on strains, sprains and fractures and had the first nine months sales of €142m in 2001.
This performance was supported by an excellent year in the US, where sales grew by
more than 10%. The GBU is a true market leader, with annual global sales of around
€225m.
Since the start ofBSN, the GBU has continued to succeed in a major drive to improve
product profitability by exploiting selling and manufacturing synergies. The new 8000
75
square meter manufacturing facility in Reynosa, Mexico, became fully operational in
200I and produces synthetic splinting and casting products together. with the more
traditional PoP product. From here the products are being sold world-wide via a new
distribution centre in Texas.
Over the next few years, the immediate goal is to improve customer service and
product quality will be enhanced with a new product development programme. This
will provide customers with cost effective products that have clearly superior features.
the following strategies are in place to achieve this goal:
• Focus on the development of world-class branded products offering high quality
therapeutic solutions to both patients and customers worldwide.
• Maintain the brand heritage and building its equity.
• Focus on accelerating business development by launching of many new products.
The following are examples of this strategy: In 2002, DYNACAST PII, a new
synthetic casting system that does not involve fibreglass is being launched; this
will create additional momentum behind the cast business in 2002 and beyond.
The initial market reactions are very encouraging. DYNACAST ankle splint has
now become a €Im line, a growth of 40%. The wrist splint launch is planned for
2002.
• Introduction of a 'fighting brand' in the shape of Actimove orthopeadic supports.
These will compete in the price sensitive hospital market for the immediate post
trauma or post-surgical treatment phase. The ACTOMOVE range of orthopaedic
soft goods will be launched selectively in certain European countries. This will
complement the strong position of TRICODUR in Germany and provide further
growth in what is already a BSN dominated market.
• In line with BSN strategy of providing educational support for customers, the
GBU has launched a new a new interactive CD-rom 'Bandaging Compass.' This
training tool is aimed at the nursing community and will educate users in
bandaging techniques while instilling brand loyalty.
76

3.2.5.4 REGIONAL SALES REVIEW
The US and Germany are BSN's two largest markets, each with over 20% of total
sales. Encouragingly, the German business showed strong growth. This demonstrates
successful management ofthe transition to BSN during the year.
SALES BY REGION April - December 2001in million Euros
70,...--------------------"5!t"----------,6O.J-----------------.,....-----...,----------j5O.J--------------------t40+-----------,;;:....------------\30+-------~~----____::_:;__----\
20+-----10+------0+------
Americas -Australia, Africa, Asia [] Europe I
Figure 3.3 - Sales By Region
In 2002, BSN will take complete responsibility for all sales and marketing activities in
France and for the professional channel in Italy. This will give BSN direct
responsibility for almost 70% of its sales world-wide, with the rest being managed by
the two shareholders' organisations via sales agency agreements.
3.3 REVIEW OF THE FIRST YEAR OF OPERAnON
In the first full year of operations as BSN, the challenging target of raising the
operating margin by 2% to 12% was met and sales in 2002 was ahead of budget at
513 million Euros. Profits before interest and restructuring expenses were €62.3m.
The restructuring continued in 2002 at a cost of €8.2m as the majority of the
manufacturing rationalisation programme was completed. Interest and other financial
items amounted to €5.2rn, leaving pre-tax profits of€48.9m
77

SALES BY MIUOR MARKET Iln million Euro)
108
E1UKo GermanyEl Italy
El Aus1nllia I New Zealand 0 USA
El France 0 Ne1her1andsDOIhefs
Figure 3.4 - Sales By Major Market
SALES BY BUSINESS UNIT(In million Euro)
33
194
lawaondcar••Costing & Bandaging DPhlebology Dother I
Figure 3.5 - Sales By Business Unit
78
3.3.1 WOUNDCARE
Woundcare beat both its sales and profit targets, with excellent results in Adhesive
and Non Adhesive fixation, led by a significant recovery in the pharmacy channel in
Germany. The operating margin increased to 10.4%, a 60% increase, driven by the
manufacturing restructuring programme, which by the end of 2002 had Vibraye
focusing on rubber adhesive, and Hausbruch on acrylics. In addition, the transition
from metal to plastic spools was realised smoothly and efficiently with the integration
of new packaging equipment. In the US the latex-free Coverlet dressing was launched
following the successful manufacturing transition from Tyco to Beiersdorf Colombia.
The plan for 2003 was to improve margins by undertaking further process
improvements, helping to strengthen the business as it seeks market share growth and
penetration into new markets.
3.3.2 PHLEBOLOGY
2002 was a successful year for the Phlebology Business Unit. The GBU achieved over
target in both sales and profit, its margin approached 10%, and major restructuring
projects were completed. Together with key market initiatives, this will continue to
support Jobst's leadership of the global Phlebology / Lymphology business in the
future.
Sales and profit performance was good in 2002, with strong organic growth in its key
markets; this has further strengthened the market leader position of the Jobst brand.
The rollout of the key Medical Leg Wear brands - Jobst Ultra Sheer, Opaque and For
Men, with several new products, has contributed to that success. In addition, the
Lymphology business, with the Elvarex flagship brand, performed extraordinarily
well.
Overall, the ability ofBSN to offer stockings and bandages to the medical community
is a unique advantage for a one-stop, solution-oriented approach. The Phlebology
Business Unit is set on strengthening its market position through:
• Product innovation, with specific focus on special customer needs and patient
compliance.
• Process improvements in production and throughout the entire business system
• More aggressive rollout ofnew products and programmes.
79
3.3.3 CASTING AND BANDAGING
Sales in 2002 are estimated to have grown by 2%, reflecting BSN's high market share
in a static market. Bandaging sales grew 4% with strong growth in rigid strapping and
non-adhesive support. Casts and splints grew 1%, with synthetic splints up 8%. Non
fibreglass sales grew by 30%, driven by increased penetration in Germany and the
initial launch phase ofDynacast Pll.
Elastic adhesive bandage manufacture was successfully transferred from the US to
South Africa, generating significant benefits along with the completion of several
other manufacturing programmes, all of which contributed significantly to the
operating result. Net profits at €33m were 10% ahead of last year, generating a margin
of 16.7%. The challenge still remains to generate market share growth in a flat market
through targeted product innovation and the effective use of BSN's in-market sales
strength.
3.4 VISION AND VALUES
After a year of evolution and refinement, BSN has a clear statement of its founding
principles. The point of any company Vision and Values is to provide the framework
on which the business rests. It is not a description of what is, but is what we aspire to
and how we want to conduct ourselves.
Our vision is what we are aiming to be as a business, and our values are a set of
shared beliefs, which guide the way we work together to deliver our vision.
VISION:
To grow the value of our business, by developing cost-effective medical products and
therapy solutions, to meet the needs of patients and customers.
VALUES:
• Believing in our people and valuing their diversity.
• Succeeding through teamwork across organisational boundaries and cultures.
• Listening to our customers and being responsive to their needs
• Constantly striving for higher performance and improving what we do.
80
3.5 RE-ORGANISATION STRATEGY
As a result of the joint venture between two established companies, BSN was faced
with numerous production and manufacturing facilities scattered around the globe.
Some of these facilities were duplication and others were not focused in the correct
areas. Due this position the next phase of the joint venture process was to re-organise
manufacturing and production, for efficiency and service.
This activity formed a re-configuration of BSN' s manufacturing to three dedicated
centres that specialised in their own products and supply most of the world. The
following dedicated world production centres resulted from this re-organisation
process:
• Hausbruch, Germany - production centre for acrylic tapes,
• Vibraye, France - production centre for rubber tapes,
• Pinetown, South Africa - production centre for elasticated adhesive bandages
(EABs).
Becoming BSN meant that we took on as much responsibility and actual ownership as
possible of the manufacturing sites in which we produce BSN products. Since April
2001, a complex set of transfers of product manufacture, ownership and operating
responsibility has been carried out. Despite tight time scales, the primary goal, the
transfer to BSN was achieved.
The second phase, which consisted of developing the manufacturing centres to apply
best practice and bring the factories into a new level of performance. Phase one of the
strategy implementation improved the operating margins and phase two is set to
improve those margins further. The project goals are to simplify and streamline the
working methods through the contributions of as many people as possible within the
company. This would be achieved by having manufacturing sites take an in-depth
look at every aspect of their manufacturing processes, and define new or better ways
ofworking
The programme is structured into three separate but interrelated projects, which
together is known as Operational Excellence (O.E).
81
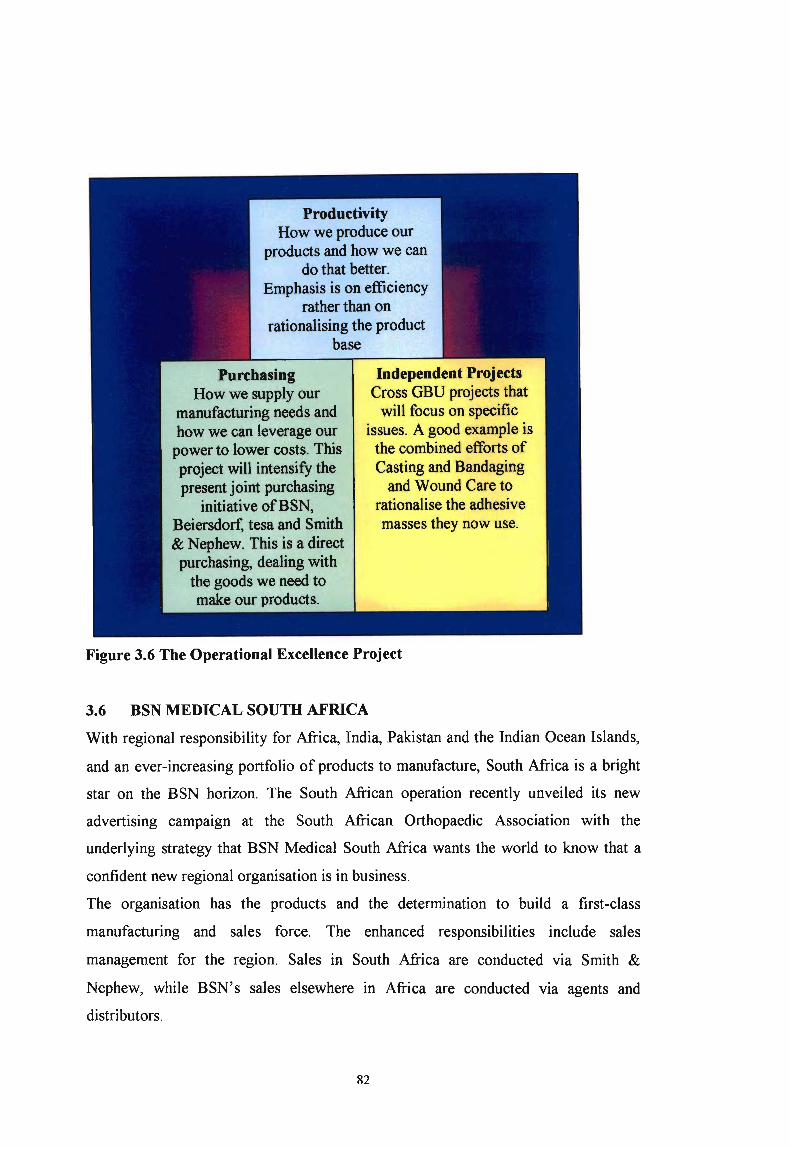
ProductivityHow we produce our
products and how we cando that better.
Emphasis is on efficiencyrather than on
rationalising the productbase
PurchasingHow we supply our
manufacturing needs andhow we can leverage our
power to lower costs. Thisproject will intensify thepresent joint purchasing
initiative ofBSN,Beiersdorf, tesa and Smith& Nephew. This is a directpurchasing, dealing with
the goods we need tomake our products.
Independent ProjectsCross GBU projects that
will focus on specificissues. A good example is
the combined efforts ofCasting and Bandaging
and Wound Care torationalise the adhesivemasses they now use.
Figure 3.6 The Operational Excellence Project
3.6 BSN MEDICAL SOUTH AFRICA
With regional responsibility for Africa, India, Pakistan and the Indian Ocean Islands,
and an ever-increasing portfolio of products to manufacture, South Mrica is a bright
star on the BSN horizon. The South African operation recently unveiled its new
advertising campaign at the South African Orthopaedic Association with the
underlying strategy that BSN Medical South Africa wants the world to know that a
confident new regional organisation is in business.
The organisation has the products and the determination to build a first-class
manufacturing and sales force. The enhanced responsibilities include sales
management for the region. Sales itl South Africa are conducted via Smith &
Nephew, while BSN's sales elsewhere in Africa are conducted via agents and
distributors.
82

South Africa has been an important part of what is now BSN business since 1953,
when Smith & Nephew established a manufacturing site in Pinetown. For over 40
years, the main manufacturing focus was medical textiles, which were further
processed into a range of surgical dressings, adhesive and non-adhesive bandages and
plaster of Paris casting products. In 2002, as part of Smith & Nephew's
manufacturing re-engineering project, specialisation into consumer first aid dressings
began. That was the organisation that BSN acquired in April 2001. With the BSN
name came a raft of changes that are doubling production, increasing employment by
15%, quadrupling exports and energising the whole organisation. Some milestones of
this staggering growth are:
• South Africa is now the site of manufacture of the global requirements for medical
First Aid Dressings and Elastic Adhesive Bandages. Elastic Adhesive Bandages,
once produced at the rate of one million per year, then 6 million in BSN's first
year of operation, 2001, now will be 20 million in 2002.
• Accommodating this need is a brand new Pinetown factory, just opened in
October 2002. Once an old textile building, Pinetown has been transformed with a
R45 million investment.
• South Africa's sales to BSN group are now a major portion of total sales; where
only two years ago total exports were 30% of manufacturing, they now are
growing to be 70 5; the remainder is sold into South Africa as well as exported to
Europe, Australia and Africa.
• Administration is fully in the name ofBSN; in a matter of months, BSN was able
to invoice in its own name, rather than its legacy company.
• Its corporate PR programme and a vigorous marketing programme are raising the
profile of the organisation throughout the country.
• Its employees are amongst the most enthusiastic and best informed, with
numerous communication channels and a can do culture; its Quality Assurance
and Best Operating Practice programmes rival the best.
83
3.7 BSN SOUTH AFRICA'S IMPROVEMENT STRATEGY
A world-class company is one that has:
• The ability to dominate its market by outperforming all companies in those key
selected variables that win the orders from its target market,
• Focused the minds of all its people on the common agenda of survival and growth
as the route to constantly improving the quality of life for all its stakeholders,
• Developed, empowered and motivated all employees with the required skills,
structures, performance measures and rewards to enable constant improvement on
those order winning variables.
BSN medical South Africa is focusing on 'Best Practice' as a means of improving
both procedures and the working environment. The 'Best Operating Practice' (BOP)
project currently underway will be key to achieving the following:
• To elevate standards to that required by the world markets BSN South Africa
seeks to serve,
• To compare the company with World Class Companies and make changes in the
way things are done so that BSN can compete on an equal footing,
• To become more productive and competitive.
The potential benefits of this programme are:
• An improvement in communication at all levels within the organisation,
• Greater involvement of employees in the functioning of their departments,
• Development and growth for individual employees, as the implementation of the
practices also includes a lot of training,
• A more competitive company which increases job security,
• Well-organised work areas making for better working conditions.
The project has a steering committee, which is made up of management and employee
representatives from all parts of the company. Two production areas, Tampons and
Adhesive Spreading were selected to implement pilot programmes. The other
production areas are in the process of being phased in as lessons learnt from the pilot
programmes are passed on.
84

3.7.1 OVERVIEW OF THE BEST OPERATING PRACTICE PROJECT
Becoming World Class is a journey; it requires the systematic identification of the
areas where improvement is to be focused. Best operating practice follows on from
manufacturing strategy, which cascades down from corporate strategy. Therefore it is
important to note the relationship and the fact that best practices needs to be
underpinned by a manufacturing strategy and a transformation process, which
incorporates leading and managing change. These are the first building blocks of the
process. The next level incorporating Teamwork, SS, Visual Performance
Measurement and Focused Improvement are generic and are prerequisite for the
specialist level. On reaching the specialist level, the organisation must select which of
the seven specialist areas or pillars would be most applicable to improve performance.
MANUFACTURING AND BUSINESS STRATEGY
s.
LEADING AND MANAGING CHANGE
Teamwork
Figure 3.7 Best Operating Practice Project
Leading and Managing Change is designed to assist with the process ofguiding and
managing an organisation from a position of being comfortable with the status quo to
85
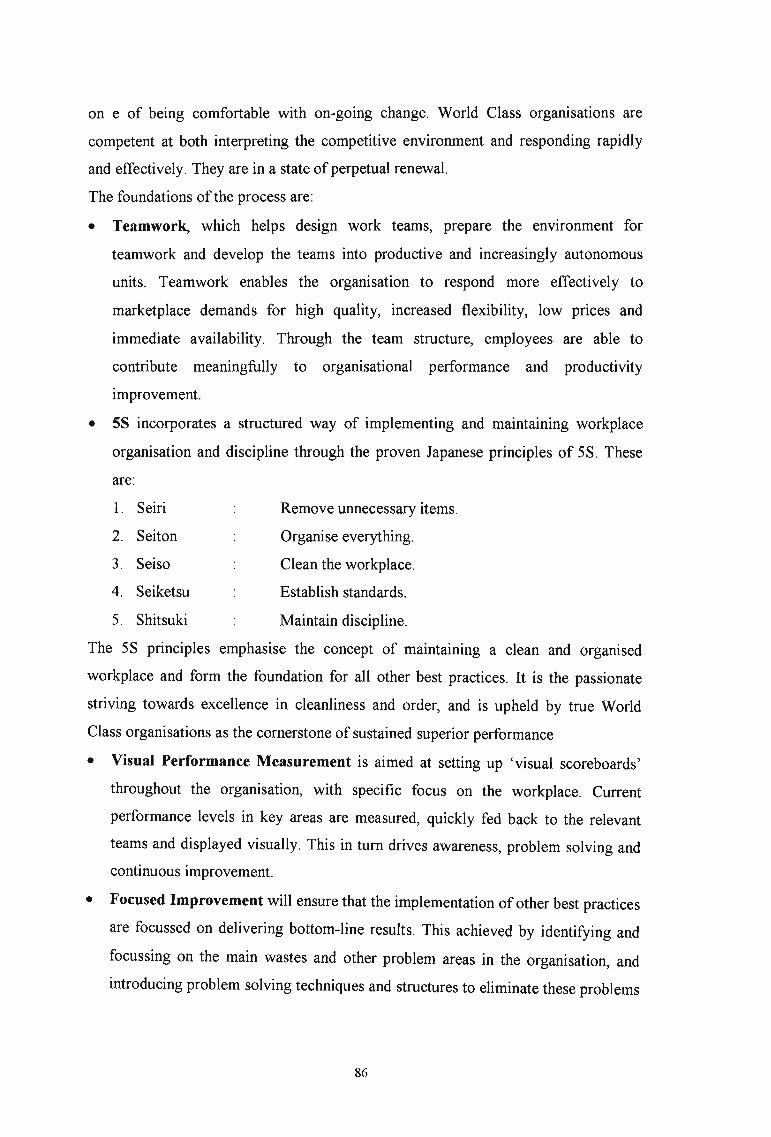
are:
l. Seiri
2. Seiton
3. Seiso
4. Seiketsu
5. Shitsuki
on e of being comfortable with on-going change. World Class organisations are
competent at both interpreting the competitive environment and responding rapidly
and effectively. They are in a state of perpetual renewal.
The foundations of the process are:
• Teamwork, which helps design work teams, prepare the environment for
teamwork and develop the teams into productive and increasingly autonomous
units. Teamwork enables the organisation to respond more effectively to
marketplace demands for high quality, increased flexibility, low prices and
immediate availability. Through the team structure, employees are able to
contribute meaningfully to organisational performance and productivity
improvement.
• 5S incorporates a structured way of implementing and maintaining workplace
organisation and discipline through the proven Japanese principles of 5S. These
Remove unnecessary items.
Organise everything.
Clean the workplace.
Establish standards.
Maintain discipline.
The 5S principles emphasise the concept of maintaining a clean and organised
workplace and form the foundation for all other best practices. It is the passionate
striving towards excellence in cleanliness and order, and is upheld by true World
Class organisations as the cornerstone of sustained superior performance
• Visual Performance Measurement is aimed at setting up 'visual scoreboards'
throughout the organisation, with specific focus on the workplace. Current
performance levels in key areas are measured, quickly fed back to the relevant
teams and displayed visually. This in turn drives awareness, problem solving and
continuous improvement.
• Focused Improvement will ensure that the implementation of other best practices
are focussed on delivering bottom-line results. This achieved by identifying and
focussing on the main wastes and other problem areas in the organisation, and
introducing problem solving techniques and structures to eliminate these problems
86

permanently. Concepts such as Deming's Plan-Do-Check-Act cycle, and General
Electric's Six Sigma drive from the cornerstones at this level.
The specialist level or 'Pillars' is the area were the organisation focus is concentrated.
The organisation chooses one pillar of seven, through which it will achieve World
Class Competitiveness. These pillars are:
• Autonomous Maintenance which will assist ill creating a culture whereby
operators take ownership of their equipment and share the responsibility for its
maintenance with the Engineering Department. The main reason for autonomous
maintenance therefore, is the prevention of breakdowns. The second reason is to
free up the maintenance staff to do more complex and proactive maintenance
work.
• Effective Maintenance - In a capital intensive, continuous manufacturing
environment, downtime due to breakdowns is one of the major waste areas. It is
therefore essential to have an effective preventative maintenance program to
ensure equipment stability and efficiency at reduced maintenance costs.
• Set-up Time Reduction - helps reduce the changeover and set-up times on your
machines, thereby making them more productive and efficient.
• Quality - This pillar provides the organisation with the capability to control
quality at source and ensure consistency in those product characteristics that the
customer values.
• Process Flow - This pillar guides the improvement of material and information
flows associated with an organisation, through a focus on creating value and
eliminating waste along the value chain.
• Supply Chain Effectiveness - aims at reducing waste and lead times across the
external supply chain. It addresses aspects such as demand forecasting, sales and
operational planning, inbound logistics, warehousing, distribution and customer
service.
• Administrative Excellence - Application of the principles and practices of World
Class Manufacturing to an office or administrative environment. Its aim is not
only to eliminate waste and inefficiencies, but also to provide a better service to
the operational functions.
87
3.8 HEALTHCARE TREND ANALYSIS
The healthcare industry, like any other industry is under constant threat due to
globally evolving trends. An analysis of the industry reveals the following most
important trends:
• Due to the high costs of hospitalisation and medical care, there is a severe cost
pressure for shorter hospital stays.
• As the primary care sector strengthens, this is likely to lead to more acceptance of
conservative treatment by healthcare professionals.
• The evolution to an integrated healthcare system is likely to increase focus on
total cost.
• As customer convenience takes on a more important meaning, the growth in one
stop shopping will continue to fuel the demand the demand for complete
solutions.
• Customers, including patients, will demand more effective treatment protocols.
• There is a shift to preventative medicine.
• Technology will push more devices and diagnostics into outpatient and home
settings.
• There is greater number of screenings of 'at risks' patients of a greater number of
asymptomatic conditions. Further along the time continuum, there could be the
regular screening and monitoring of the healthy.
• Chronic illnesses are the most costly to the health care system. The prevention
will reduce the numbers needing expensive treatment, decreasing the number of
people entering hospital and residential care, and allowing for early discharge,
thus g cost to healthcare.
• With a better-informed and wealthier agemg population, people will pay to
prevent the onset of a disease or illness.
• Preventative medicine could also be an effective strategy in poorer countries as
the cost of treatments for common infectious diseases might be beyond the budget
of poorer countries, and the only way of cutting hospital costs is with prevention.
88

3.9 FACTORS AFFECTING THE MEDICAL INDUSTRY
These are the external factors affecting the medical industry, which BSN cannot
influence but must react to.
• Political Factors
1. The healthcare system in each country is greatly influenced by its political
system.
2. Free trade agreements.
3. Political and social unrest.
• Economic Factors
1. Economic Recession
2. Exchange rate fluctuations
3. Healthcare economics
4. Reimbursement
• Social Factors
1. More active population
2. Ageing population
3. Increased consumer focus
4. Media Hype: Increased awareness of medical conditions.
• Technological Factors
1. Telemedicine
2. Greater understanding of conditionslinjuries and how to treat them
3. Trends towards preventative medicine through diagnostics.
• Legal/Regulatory issues
1. FDA, CE, UL approvals
2. Other regulatory requirements
3. Medical devices directives
4. Specific local legal requirements of countries
5. Packaging requirements and specifications.
These factors determine the opportunities and threats facing BSN Casting and
Bandaging division.
89
3.10 CONCLUSION
The creation of the joint venture company BSN Medical has created many
opportunities for the parent companies, however it has thrust the new company onto a
steep learning curve. BSN Medical has proceeded on this journey to create a World
Class company. With so many divisions in different countries and different cultures,
this was no easy task. The first step was to unite the different operating divisions into
one company with one corporate identity. The next step was to concentrate on the
operations function of these divisions in helping the company achieve its objectives.
The South African division has embarked on the Best Operating Practice project in
order to enable this division to close the gap. This initiative has been undertaken to
make the company one of the best in the world in respect of quality and operating
efficiency. It will also help introduce improvement opportunities by adopting new
ways ofworking to help ensure that all the resources are utilised to achieve maximum
operating efficiency. Recent company results and the milestones that have been
achieved show that BSN is well on its way to achieve its goals. However a
mechanism has to be in place in order to establish where we are now, our current level
of achievement and where we want to be, our desired level. The next step, the
evaluation helps measure and determine these positions.
90
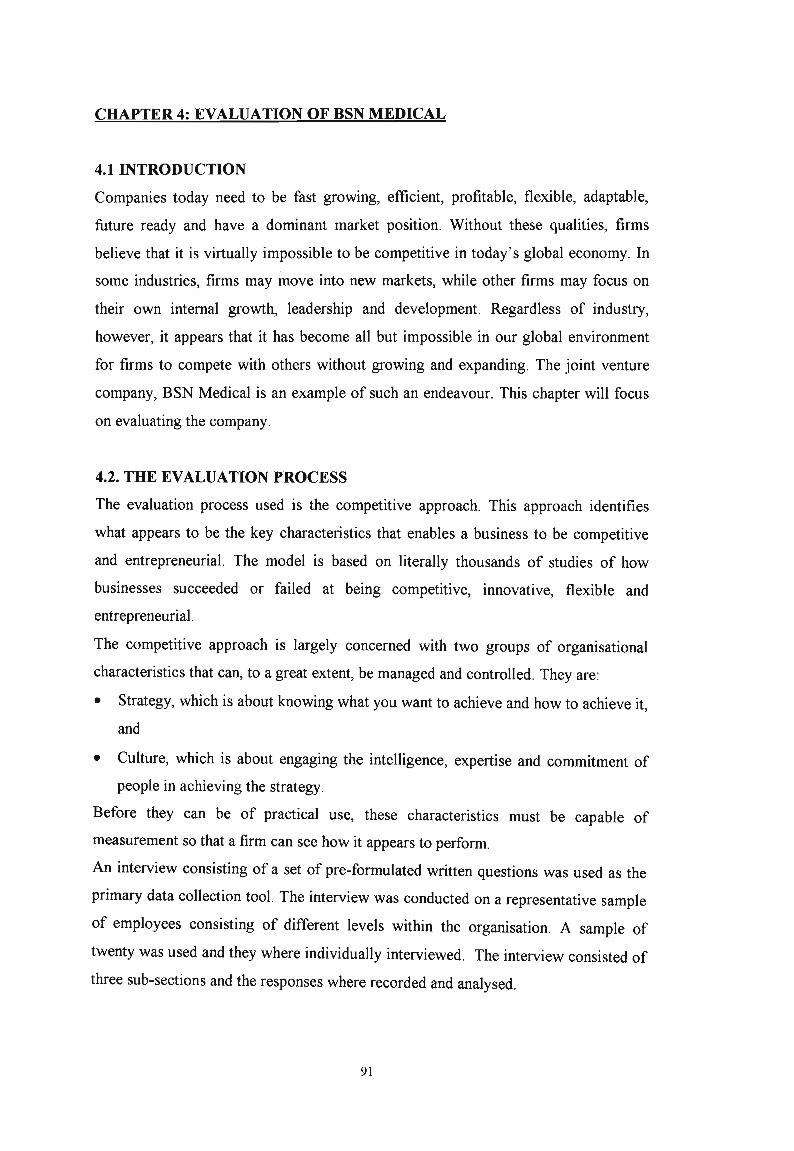
CHAPTER 4: EVALUATION OF BSN MEDICAL
4.1 INTRODUCTION
Companies today need to be fast growing, efficient, profitable, flexible, adaptable,
future ready and have a dominant market position. Without these qualities, firms
believe that it is virtually impossible to be competitive in today's global economy. In
some industries, firms may move into new markets, while other firms may focus on
their own internal growth, leadership and development. Regardless of industry,
however, it appears that it has become all but impossible in our global environment
for firms to compete with others without growing and expanding. The joint venture
company, BSN Medical is an example of such an endeavour. This chapter will focus
on evaluating the company.
4.2. THE EVALUATION PROCESS
The evaluation process used is the competitive approach. This approach identifies
what appears to be the key characteristics that enables a business to be competitive
and entrepreneurial. The model is based on literally thousands of studies of how
businesses succeeded or failed at being competitive, innovative, flexible and
entrepreneurial.
The competitive approach is largely concerned with two groups of organisational
characteristics that can, to a great extent, be managed and controlled. They are:
• Strategy, which is about knowing what you want to achieve and how to achieve it,
and
• Culture, which is about engaging the intelligence, expertise and commitment of
people in achieving the strategy.
Before they can be of practical use, these characteristics must be capable of
measurement so that a firm can see how it appears to perform.
An interview consisting of a set of pre-formulated written questions was used as the
primary data collection tool. The interview was conducted on a representative sample
of employees consisting of different levels within the organisation. A sample of
twenty was used and they where individually interviewed. The interview consisted of
three sub-sections and the responses where recorded and analysed.
91
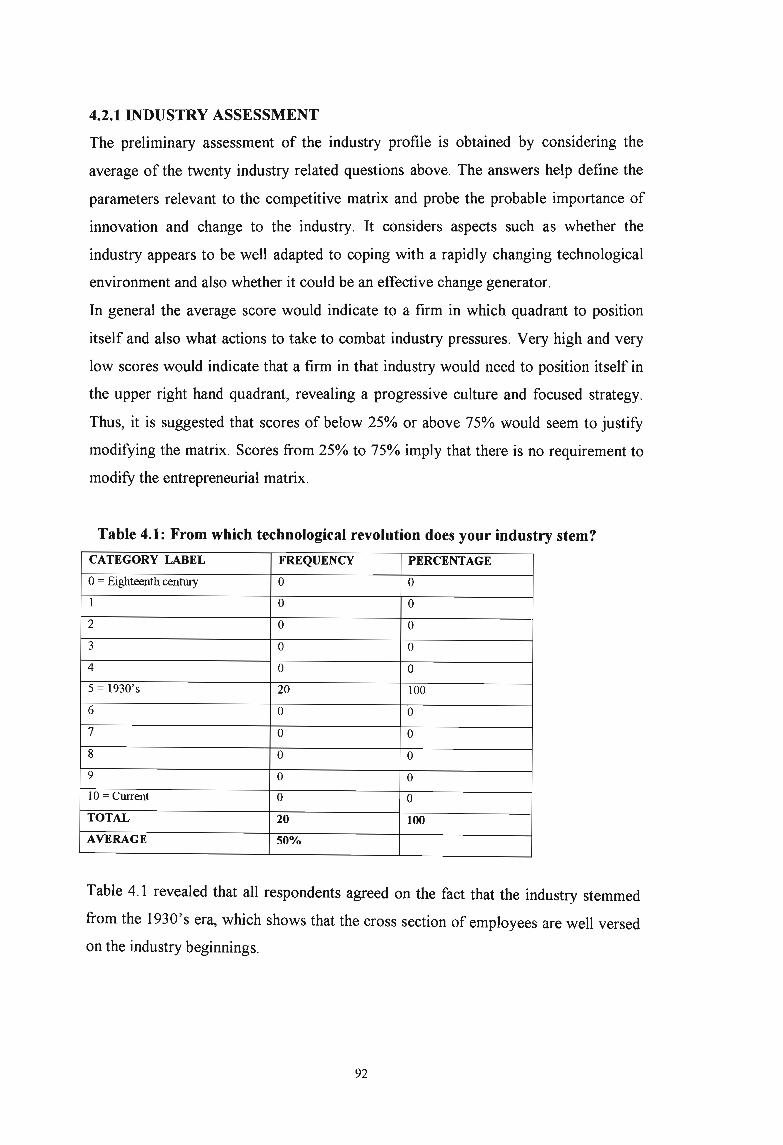
4.2.1 INDUSTRY ASSESSMENT
The preliminary assessment of the industry profile is obtained by considering the
average of the twenty industry related questions above. The answers help define the
parameters relevant to the competitive matrix and probe the probable importance of
innovation and change to the industry. It considers aspects such as whether the
industry appears to be well adapted to coping with a rapidly changing technological
environment and also whether it could be an effective change generator.
In general the average score would indicate to a firm in which quadrant to position
itself and also what actions to take to combat industry pressures. Very high and very
low scores would indicate that a firm in that industry would need to position itself in
the upper right hand quadrant, revealing a progressive culture and focused strategy.
Thus, it is suggested that scores of below 25% or above 75% would seem to justify
modifying the matrix. Scores from 25% to 75% imply that there is no requirement to
modify the entrepreneurial matrix.
Table 4.1: From which technological revolution does your industry stem?
CATEGORY LABEL FREQUENCY PERCENTAGE
o- Eighteenth century 0 0
1 0 0
2 0 0
3 0 0
4 0 0
5 -1930's 20 100
6 0 0
7 0 0
8 0 0
9 0 0
10 - Current 0 0
TOTAL 20 100
AVERAGE 50%
Table 4.1 revealed that all respondents agreed on the fact that the industry stemmed
from the 1930's era, which shows that the cross section of employees are well versed
on the industry beginnings.
92
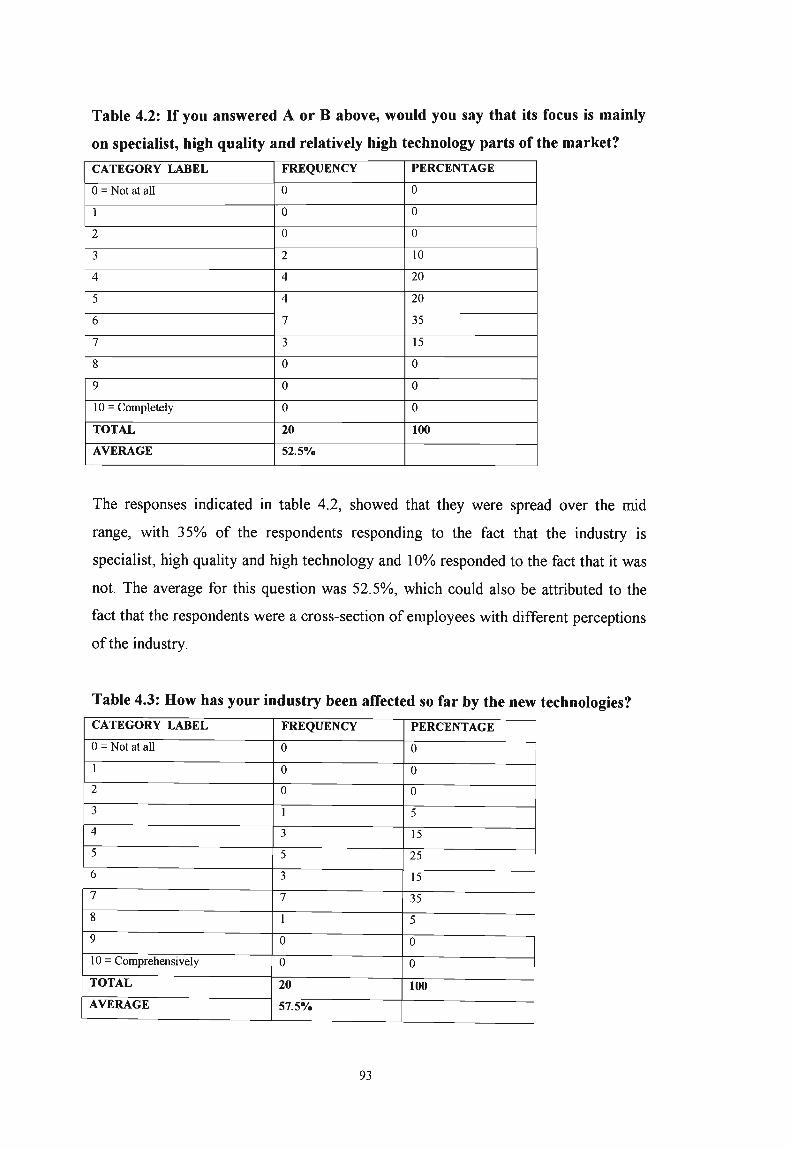
Table 4.2: If you answered A or B above, would you say that its focus is mainly
on specialist, high quality and relatively high technology parts of the market?
CATEGORY LABEL FREQUENCY PERCENTAGE
0= Not at all 0 0
1 0 0
2 0 0
3 2 10
4 4 20
5 4 20
6 7 35
7 3 15
8 0 0
9 0 0
10 = Completely 0 0
TOTAL 20 100
AVERAGE 52.5%
The responses indicated in table 4.2, showed that they were spread over the mid
range, with 35% of the respondents responding to the fact that the industry is
specialist, high quality and high technology and 10% responded to the fact that it was
not. The average for this question was 52.5%, which could also be attributed to the
fact that the respondents were a cross-section of employees with different perceptions
of the industry.
Table 4.3: How has your industry been affected so far by the new technologies?
CATEGORY LABEL FREQUENCY PERCENTAGE
0- Not at all 0 0
1 0 0
2 0 0
3 1 5
4 3 15
5 5 25
6 3 15
7 7 35
8 1 5
9 0 0
10 Comprehensively 0 0
TOTAL 20 100AVERAGE 57.5%
93

Table 4.3 shows that there was again a large spread of responses, with 35% to 40 % of
the respondents responding to the fact that the industry has been affected by new
technologies and 5% responded to the fact that there was little affect. The average for
this question was 57.5%, which could also be attributed to the fact that the
respondents were a cross-section of employees with different perceptions of the
industry and the drivers of change within the industry.
Table 4.4: To what extent do you envisage it will be affected over the next 5
years?
CATEGORY LABEL FREQUENCY PERCENTAGE
0= Not at all 0 0
1 0 0
2 0 0
3 0 0
4 5 5
5 35 35
6 15 15
7 40 40
8 5 5
9 0 0
10 - Comprehensively 0 0
TOTAL 20 100
AVERAGE 60.5%
In table 4.4 there was more consistency in the responses to this question, with 90% of
the respondents believing that the industry would be affected over the next five years.
The average for this question was 60.5%, which suggests that employees have some
idea of future trends within the industry.
Table 4.5 suggests that there was some consensus on this point and most respondents
revealed that the stage of technological development within the industry was regarded
as medium to high. The average for this question was 50.5%.
94
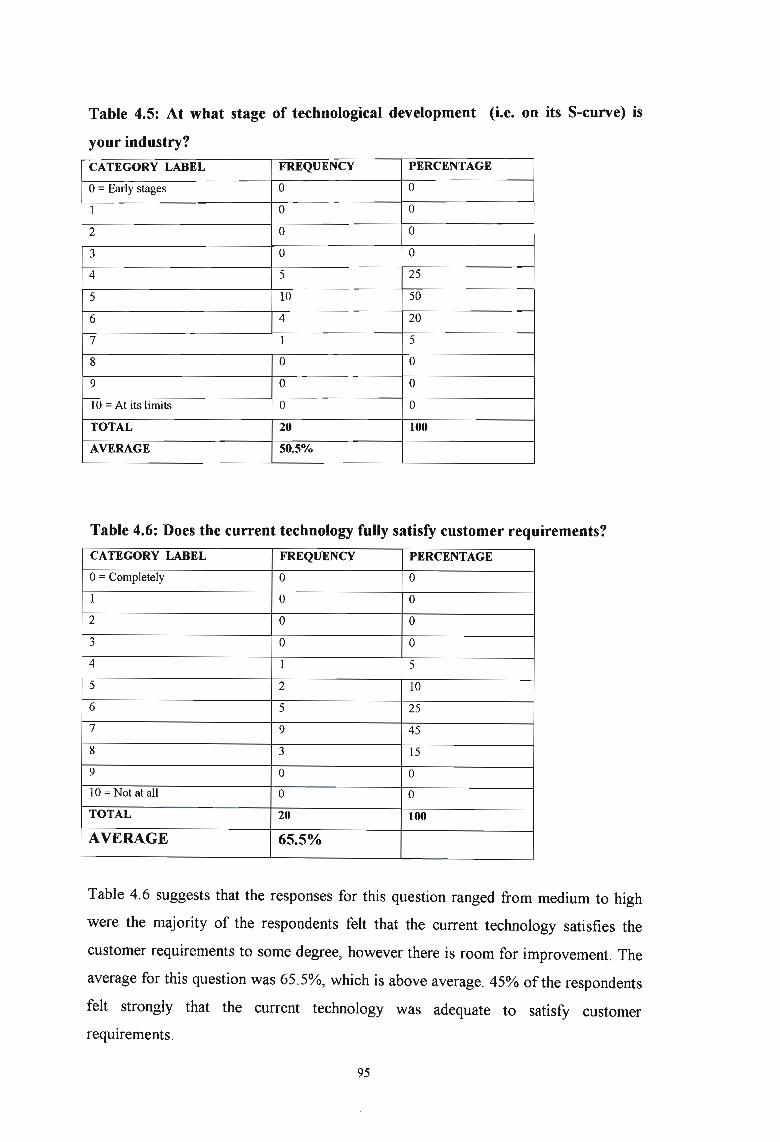
Table 4.5: At what stage of technological development (i.e. on its S-curve) is
your industry?
CATEGORY LABEL FREQUENCY PERCENTAGE
o= Early stages 0 0
1 0 0
2 0 0
3 0 0
4 5 25
5 10 50
6 4 20
7 1 5
8 0 0
9 0 0
10 = At its limits 0 0
TOTAL 20 100
AVERAGE 50.5%
Table 4.6: Does the current technology fully satisfy customer requirements?
CATEGORY LABEL FREQUENCY PERCENTAGE
o= Completely 0 0
1 0 0
2 0 0
3 0 0
4 1 5
5 2 10
6 5 25
7 9 45
8 3 15
9 0 0
10 = Not at all 0 0
TOTAL 20 100
AVERAGE 65.5%
Table 4.6 suggests that the responses for this question ranged from medium to high
were the majority of the respondents felt that the current technology satisfies the
customer requirements to some degree, however there is room for improvement. The
average for this question was 65.5%, which is above average. 45% of the respondents
felt strongly that the current technology was adequate to satisfy customer
requirements.
95
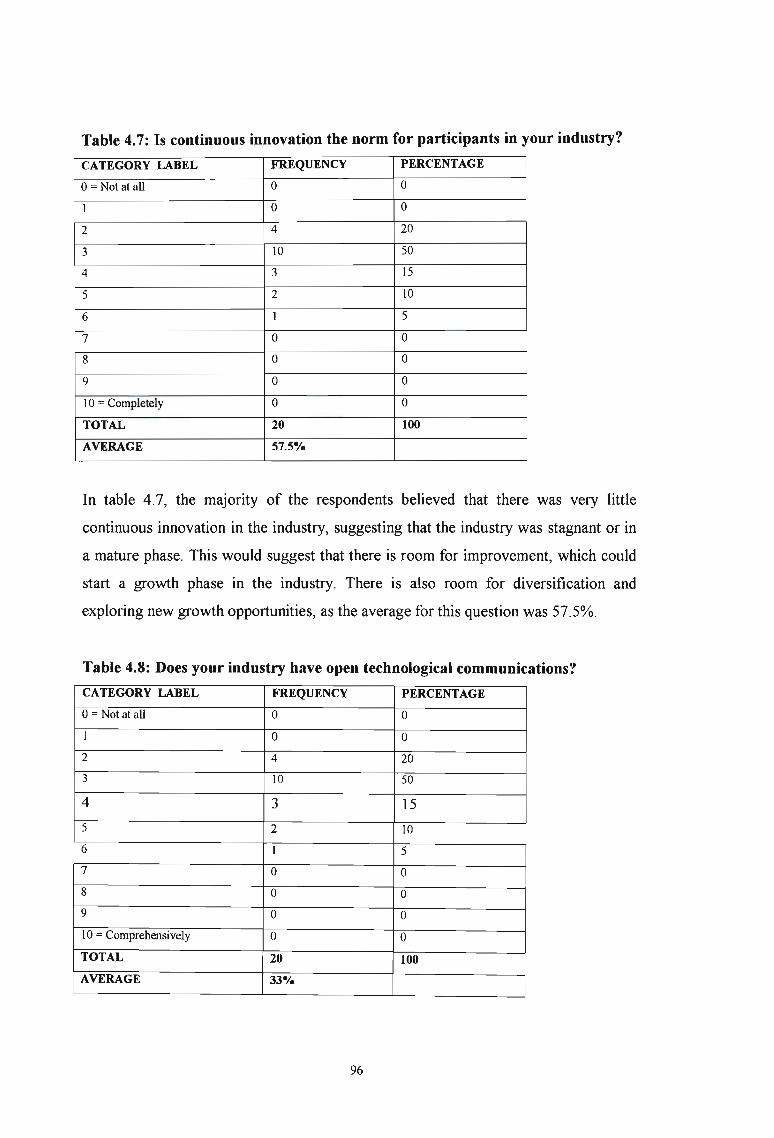
Table 4.7: Is continuous innovation the norm for participants in your industry?
CATEGORY LABEL FREQUENCY PERCENTAGE
0= Not at all 0 0
1 0 0
2 4 20
3 10 50
4 3 15
5 2 10
6 1 5
7 0 0
8 0 0
9 0 0
10 = Completely 0 0
TOTAL 20 100
AVERAGE 57.5%
In table 4.7, the majority of the respondents believed that there was very little
continuous innovation in the industry, suggesting that the industry was stagnant or in
a mature phase. This would suggest that there is room for improvement, which could
start a growth phase in the industry. There is also room for diversification and
exploring new growth opportunities, as the average for this question was 57.5%.
Table 4.8: Does your industry have open technological communications?
CATEGORY LABEL FREQUENCY PERCENTAGE
0- Not at all 0 0
1 0 0
2 4 20
3 10 50
4 3 15
5 2 10
6 I 5
7 0 0
8 0 0
9 0 0
10 Comprehensively 0 0
TOTAL 20 100AVERAGE 33%
96
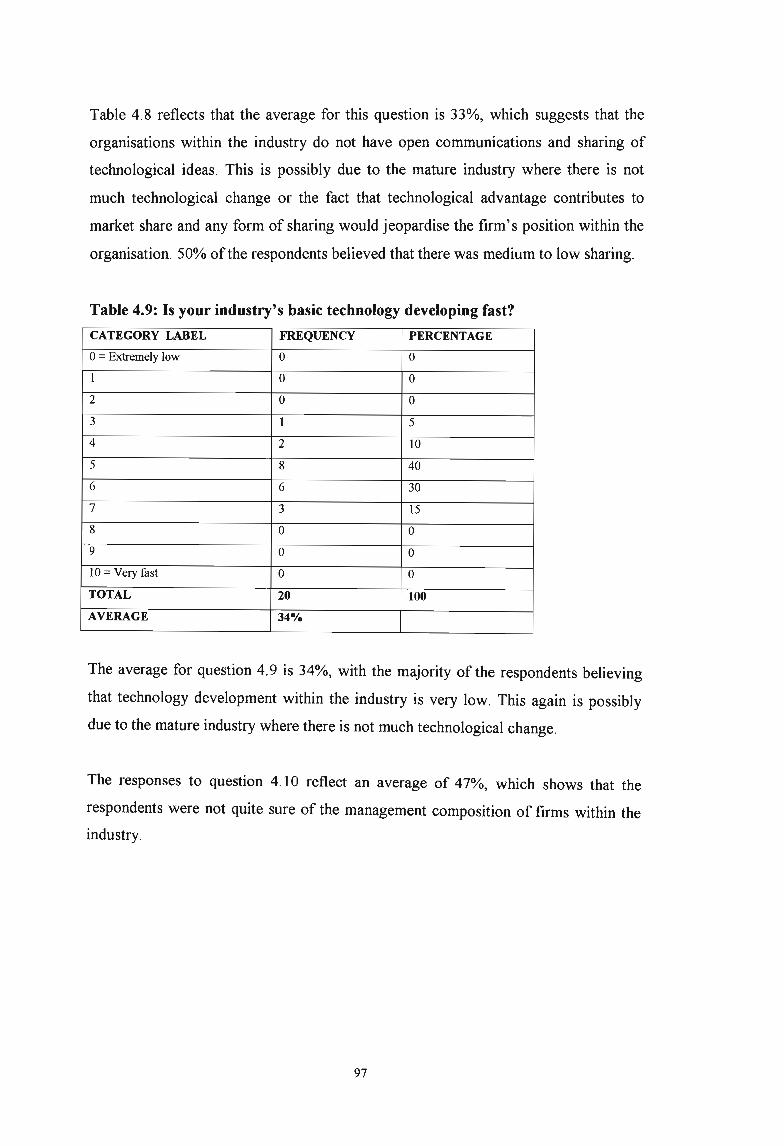
Table 4.8 reflects that the average for this question is 33%, which suggests that the
organisations within the industry do not have open communications and sharing of
technological ideas. This is possibly due to the mature industry where there is not
much technological change or the fact that technological advantage contributes to
market share and any form of sharing would jeopardise the firm's position within the
organisation. 50% ofthe respondents believed that there was medium to low sharing.
Table 4.9: Is your industry's basic technology developing fast?
CATEGORY LABEL FREQUENCY PERCENTAGE
o= Extremely low 0 0
1 0 0
2 0 0
3 1 5
4 2 10
5 8 40
6 6 30
7 3 15
8 0 0
9 0 0
10 - Very fast 0 0
TOTAL 20 100
AVERAGE 34%
The average for question 4.9 is 34%, with the majority of the respondents believing
that technology development within the industry is very low. This again is possibly
due to the mature industry where there is not much technological change.
The responses to question 4.10 reflect an average of 47%, which shows that the
respondents were not quite sure of the management composition of firms within the
industry.
97

Table 4.10: do finance professionals manage the leading firms in your industry?
CATEGORY LABEL FREQUENCY PERCENTAGE
o= Mainly 0 0
1 0 0
2 0 0
3 4 20
4 2 10
5 10 50
6 4 20
7 0 0
8 0 0
9 0 0
10 = None 0 0
TOTAL 20 100
AVERAGE 47%
Table 4.11 reflects that the majority of the respondents believe that technological
competence is more important than cost efficiency. Here again, looking at a mature
industry, players are using the fact that proven technology and quality is what is
important to the customer or is the selling point of the products.
Table 4.11: Is technological competence more important than cost efficiency?
CATEGORY LABEL FREQUENCY PERCENTAGE
o= Definitely not 0 0
I 0 0
2 0 0
3 6 30
4 3 15
5 0 0
6 11 55
7 0 0
8 0 0
9 0 0
10 - Definitely 0 0
TOTAL 20 100AVERAGE 48
98

Table 4.12: Does your industry have an active research organisation?
CATEGORY LABEL FREQUENCY PERCENTAGE
O=No 0 0
1 0 0
2 0 0
3 9 45
4 11 55
5 0 0
6 0 0
7 0 0
8 0 0
9 0 0
10 = Yes 0 0
TOTAL 20 100
AVERAGE 35.5
Table 4.12 shows that there is strong consensus that there is little going on as far as
research within the industry. This again is indicative of a mature industry were there
is no immediate growth potential and there is reluctance to spend funds on research
and development. Here the emphasis is on harvesting of the existing technologies.
Table 4.13: Does knowledge of new technological innovations spread quickly in
your industry?
CATEGORY LABEL FREQUENCY PERCENTAGE0- Yes 0 0
1 0 0
2 0 0
3 0 0
4 6 30
5 3 15
6 0 0
7 11 55
8 0 0
9 0 0
10 No 0 0
TOTAL 20 100
AVERAGE 58% 100
Question 4.13 reveals that the majority of the respondents are of the opinion that
technological innovations do not spread rapidly. This is possibly due to the fact that
99
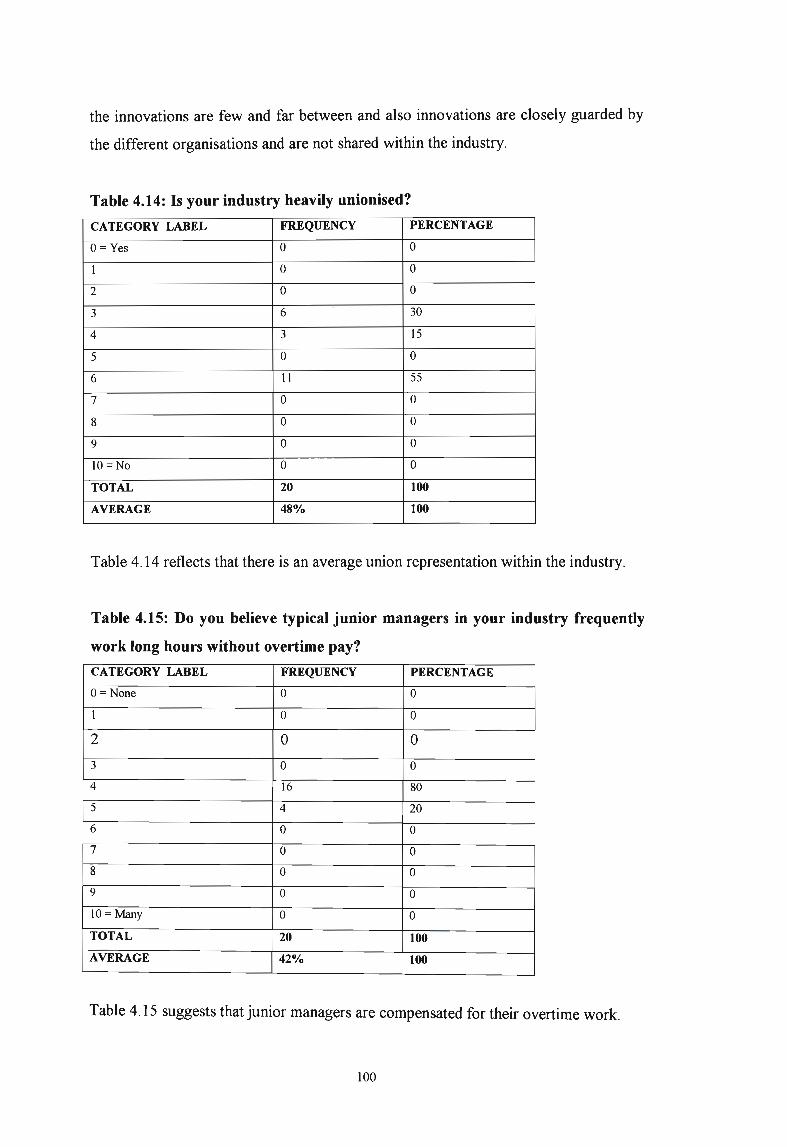
the innovations are few and far between and also innovations are closely guarded by
the different organisations and are not shared within the industry.
Table 4.14: Is your industry heavily unionised?
CATEGORY LABEL FREQUENCY PERCENTAGE
O=Yes 0 0
1 0 0
2 0 0
3 6 30
4 3 15
5 0 0
6 11 55
7 0 0
8 0 0
9 0 0
lO=No 0 0
TOTAL 20 100
AVERAGE 48% 100
Table 4.14 reflects that there is an average union representation within the industry.
Table 4.15: Do you believe typical junior managers in your industry frequently
work long hours without overtime pay?
CATEGORY LABEL FREQUENCY PERCENTAGE
0- None 0 0
1 0 0
2 0 0
3 0 0
4 16 80
5 4 20
6 0 0
7 0 0
8 0 0
9 0 0
10 -Many 0 0
TOTAL 20 100
AVERAGE 42% 100
Table 4.15 suggests that junior managers are compensated for their overtime work.
100

Table 4.16: Has your industry seen much structural change as a result of new
technology?
CATEGORY LABEL FREQUENCY PERCENTAGE
0= Not at all 0 0
1 0 0
2 0 0
3 0 0
4 4 20
5 3 15
6 13 65
7 0 0
8 0 0
9 0 0
10 = A great deal 0 0
TOTAL 20 100
AVERAGE 54.5%
The results reflect that there has been medium to low structural changes in the
industry.
Table 4.17: Are the leading firms in your industry long established?
CATEGORY LABEL FREQUENCY PERCENTAGE
0= Yes 0 0
1 7 35
2 13 65
3 0 0
4 0 0
5 0 0
6 0 o·7 0 0
8 0 0
9 0 0
10 No 0 0
TOTAL 20 100
AVERAGE 16.5%
The results reflect that the leading firms in the industry are long established.
101
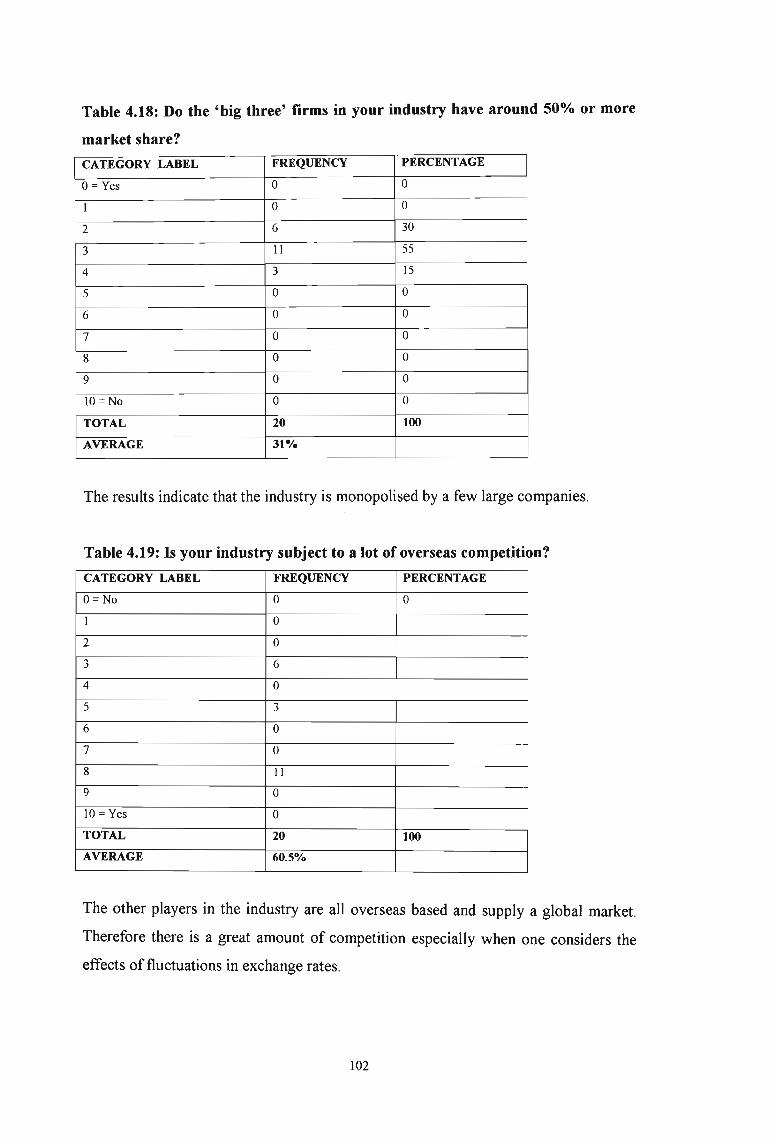
Table 4.18: Do the 'big three' firms in your industry have around 50% or more
market share?
CATEGORY LABEL FREQUENCY PERCENTAGE
0= Yes 0 0
1 0 0
2 6 30
3 11 55
4 3 15
5 0 0
6 0 0
7 0 0
8 0 0
9 0 0
lO=No 0 0
TOTAL 20 100
AVERAGE 31%
The results indicate that the industry is monopolised by a few large companies.
Table 4.19: Is your industry subject to a lot of overseas competition?
CATEGORY LABEL FREQUENCY PERCENTAGE
O=No 0 0
1 0
2 0
3 6
4 0
5 3
6 0
7 0
8 11
9 0
10 - Yes 0
TOTAL 20 100
AVERAGE 60.5%
The other players in the industry are all overseas based and supply a global market.
Therefore there is a great amount of competition especially when one considers the
effects of fluctuations in exchange rates.
102
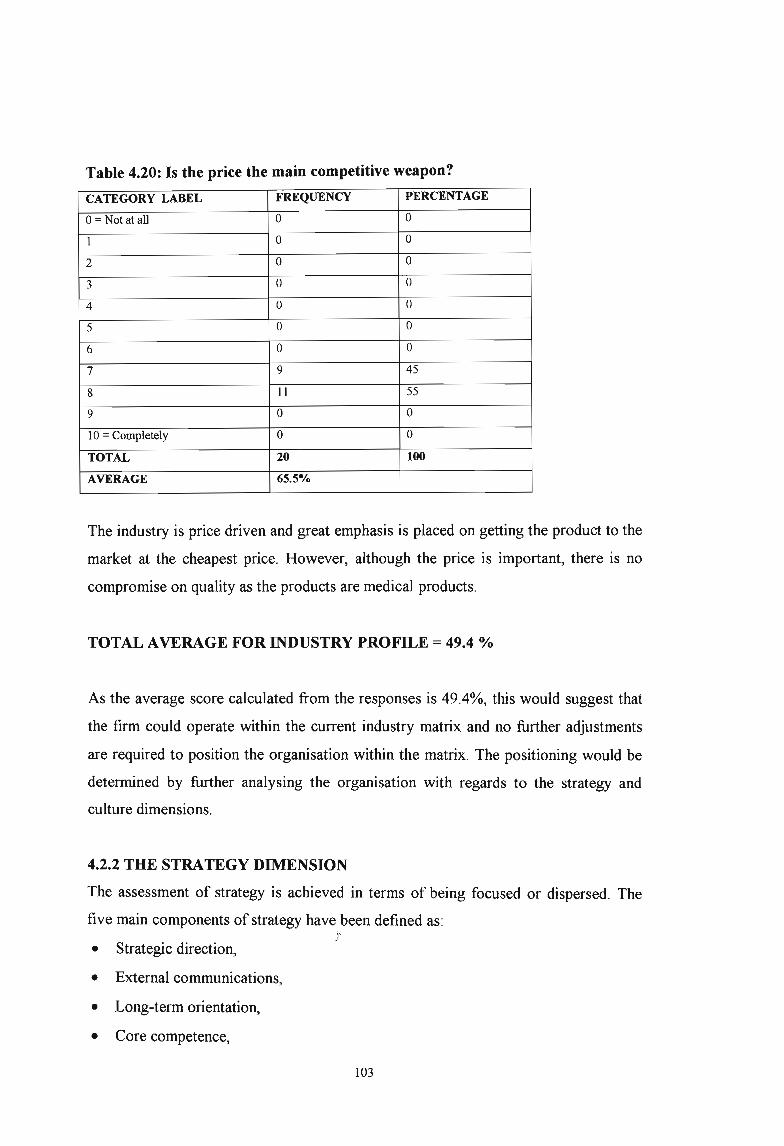
• Strategic direction,
• External communications,
• Long-term orientation,
• Core competence,
Table 4.20: Is the price the main competitive weapon?
CATEGORY LABEL FREQUENCY PERCENTAGE
0= Not at all 0 0
1 0 0
2 0 0
3 0 0
4 0 0
5 0 0
6 0 0
7 9 45
8 11 55
9 0 0
10 = Completely 0 0
TOTAL 20 100
AVERAGE 65.5%
The industry is price driven and great emphasis is placed on getting the product to the
market at the cheapest price. However, although the price is important, there is no
compromise on quality as the products are medical products.
TOTAL AVERAGE FOR INDUSTRY PROFILE = 49.4 %
As the average score calculated from the responses is 49.4%, this would suggest that
the firm could operate within the current industry matrix and no further adjustments
are required to position the organisation within the matrix. The positioning would be
determined by further analysing the organisation with regards to the strategy and
culture dimensions.
4.2.2 THE STRATEGY DIMENSION
The assessment of strategy is achieved in terms of being focused or dispersed. The
five main components of strategy have been defined as:l'
103
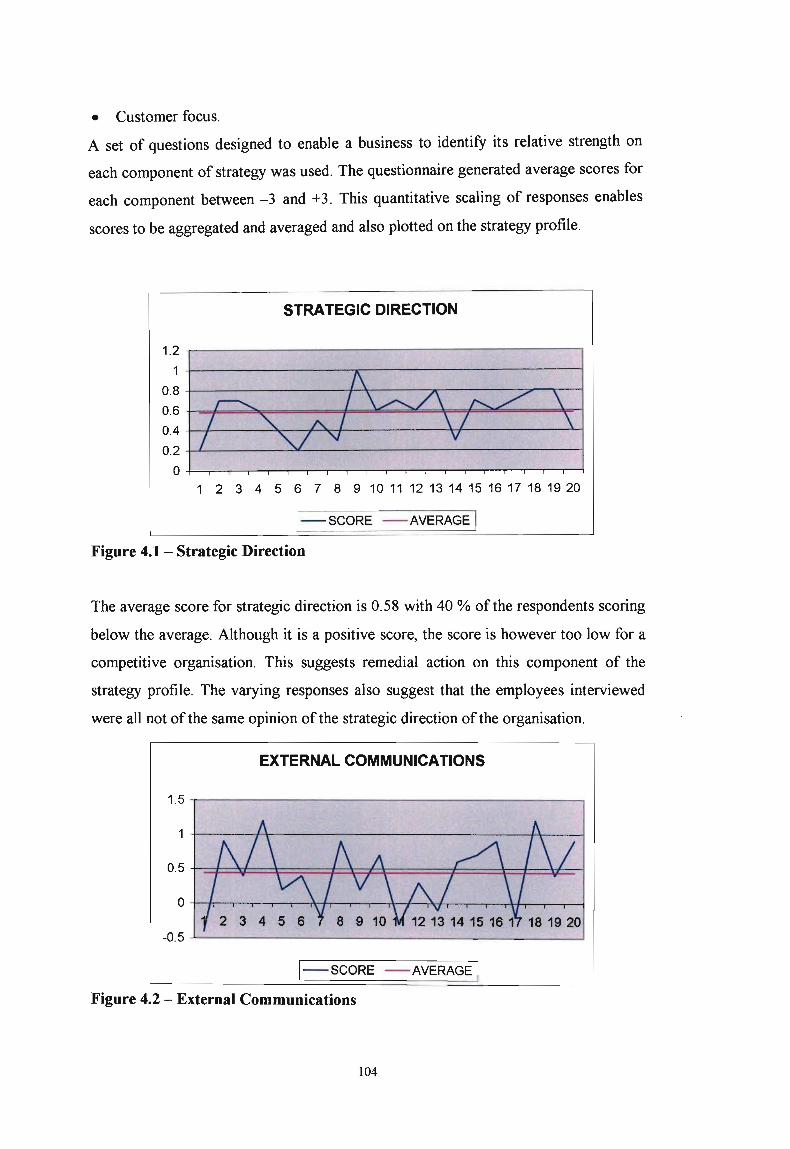
• Customer focus.
A set of questions designed to enable a business to identify its relative strength on
each component of strategy was used. The questionnaire generated average scores for
each component between -3 and +3. This quantitative scaling of responses enables
scores to be aggregated and averaged and also plotted on the strategy profile.
STRATEGIC DIRECTION
1.2 -.--------------------------,
1+-------------..------------_"____j
0.8 +------------+--\---~r__---~"7'""_'T"_"____j
0.6 +-..=""~~o==~~='4=~~~~~~~~~~9=_i
0.4 +---+-------.:~____,f___J<r+-----~.+_-----_>....;
0.2 +-L-----::>L---------------_"____j
O+--.--r-....,.------.---r----r---,r--r--.--...---.--r-....,.------.---r----r---,r--r--.----l
1 2 3 4 5 6 7 8 9 10 11 12 13 14 15 16 17 18 19 20
I---SCORE ---AVERAGE I
Figure 4.1 - Strategic Direction
The average score for strategic direction is 0.58 with 40 % of the respondents scoring
below the average. Although it is a positive score, the score is however too low for a
competitive organisation. This suggests remedial action on this component of the
strategy profile. The varying responses also suggest that the employees interviewed
were all not of the same opinion of the strategic direction of the organisation.
EXTERNAL COMMUNICATIONS
1.5 .,------------------------,
1-t-----t--r---------------+-\--~
18 1920-0.5 ~------------- -l
I---SCORE ---AVERAGE I
Figure 4.2 - External Communications
104

Analysing the results as per figure 4.2, the component of external communications
enables the organisation to determine its role in maintaining the communication
channels between the organisation and the other role players in the immediate
environment. The organisation has to consider the customers, other players in the
industry, competitors, suppliers, the political and legal environments. Social,
technological and economical factors also player a leading role in the analysis. The
organisation needs to maintain open channels of communication and constantly
consider and evaluate its options. The average for this component is 0.435 with 55%
of the respondents scoring below the average. Here again, although positive, the low
score suggests that this is a problem area that needs immediate attention. Management
needs to consider a plan of action in order obtain a greater positive score, which
would help position the company.
LONG TERM ORIENTATION
1.00.,.---------------------,
0.50 t---+\-------j'\---:Pr-------f+---I
-0.50 t-I'---------t---t'-----'V--------..J~---__1
-1.00 -'---------------- .....1
I---SCORE ---AVERAGE I
Figure 4.3 - Long Term Orientation
Long-term orientation explores the company's stance on long-term issues. It looks at
five-year projections, new technology and research and development, capital
expansion and investments, quality and performance improvements and continuous
improvements in order to improve the cost efficiency of the business. The average for
this section is -0.01 with 45% ofthe respondents scoring below the average. This area
of the business needs immediate attention if the company is expected to grow and
survive into the future, especially in a global market. The survival of any business
depends largely on the future vision and strategy that is put into place.
105
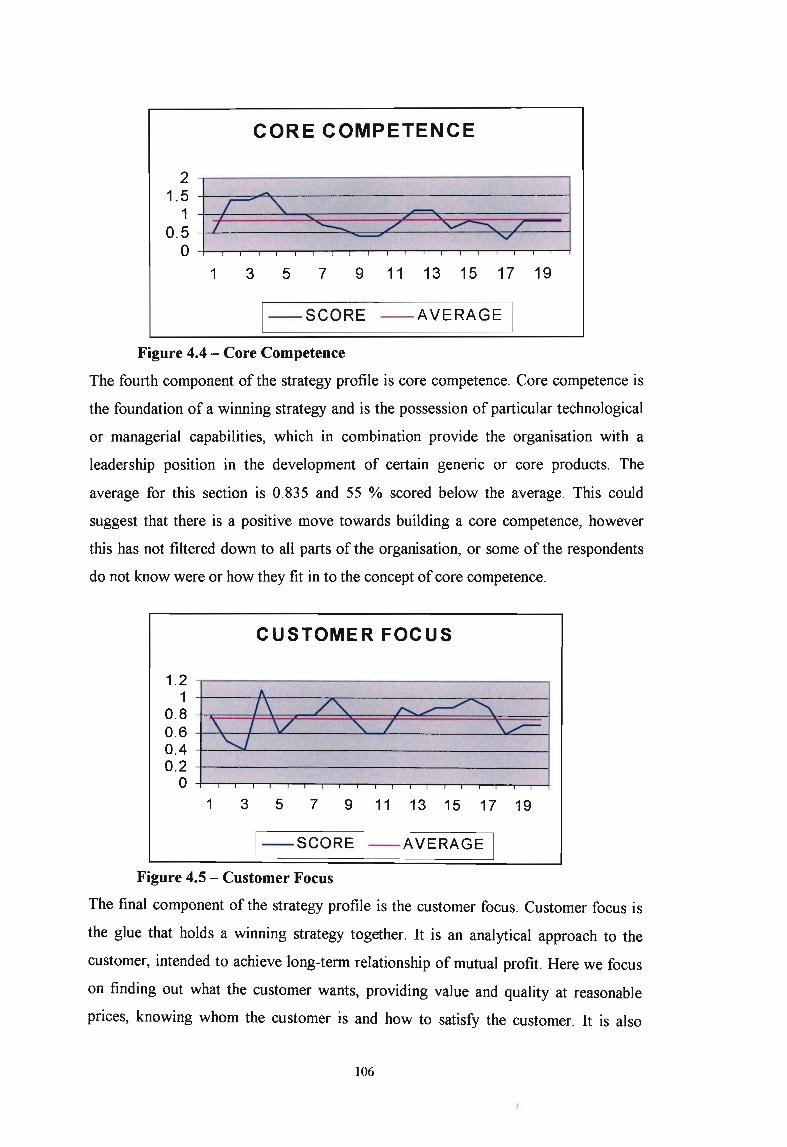
CORE COMPETENCE
2
:ij?5?,:::~~, ,1 3 5 7 9 11 13 15 17 19
A
1\ /"- /'...~,
\. I \/ "- / \...".,.--"J
I---SCORE ---AVERAGE I
Figure 4.4 - Core Competence
The fourth component of the strategy profile is core competence. Core competence is
the foundation of a winning strategy and is the possession of particular technological
or managerial capabilities, which in combination provide the organisation with a
leadership position in the development of certain generic or core products. The
average for this section is 0.835 and 55 % scored below the average. This could
suggest that there is a positive move towards building a core competence, however
this has not filtered down to all parts of the organisation, or some of the respondents
do not know were or how they fit in to the concept of core competence.
CUSTOMER FOCUS
1.21
0.80.60.40.2
o1 3 5 7 9 11 13 15 17 19
I---SCORE ---AVERAGE I
Figure 4.5 - Customer Focus
The final component of the strategy profile is the customer focus. Customer focus is
the glue that holds a winning strategy together. It is an analytical approach to the
customer, intended to achieve long-term relationship of mutual profit. Here we focus
on finding out what the customer wants, providing value and quality at reasonable
prices, knowing whom the customer is and how to satisfy the customer. It is also
106
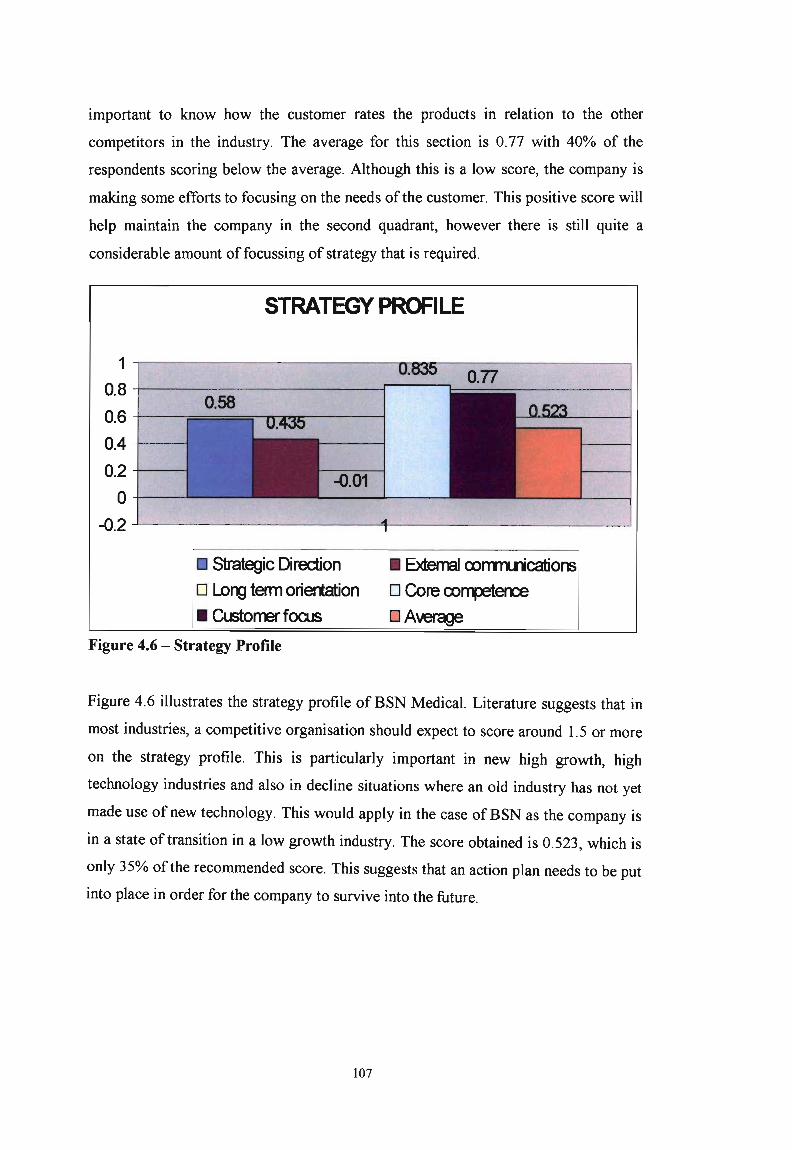
important to know how the customer rates the products in relation to the other
competitors in the industry. The average for this section is 0.77 with 40% of the
respondents scoring below the average. Although this is a low score, the company is
making some efforts to focusing on the needs of the customer. This positive score will
help maintain the company in the second quadrant, however there is still quite a
considerable amount of focussing of strategy that is required.
STRATEGY PROFILE
-0.01
0.58
1-,---------------"f"O":l~--------_,
+- -r--~~o;;.n~---____l0.8
0.6+--
0.4 +--
0.2 +----
0-+-----0.2 ...1.- -+ ---'
Strategic Directiono LorYJ term oriertation• Custorrer fOOJS
• ExlemaI cormuicationso Core corrpeterceDAverege
Figure 4.6 - Strategy Profile
Figure 4.6 illustrates the strategy profile of BSN Medical. Literature suggests that in
most industries, a competitive organisation should expect to score around 1.5 or more
on the strategy profile. This is particularly important in new high growth, high
technology industries and also in decline situations where an old industry has not yet
made use of new technology. This would apply in the case ofBSN as the company is
in a state of transition in a low growth industry. The score obtained is 0.523, which is
only 35% of the recommended score. This suggests that an action plan needs to be put
into place in order for the company to survive into the future.
107
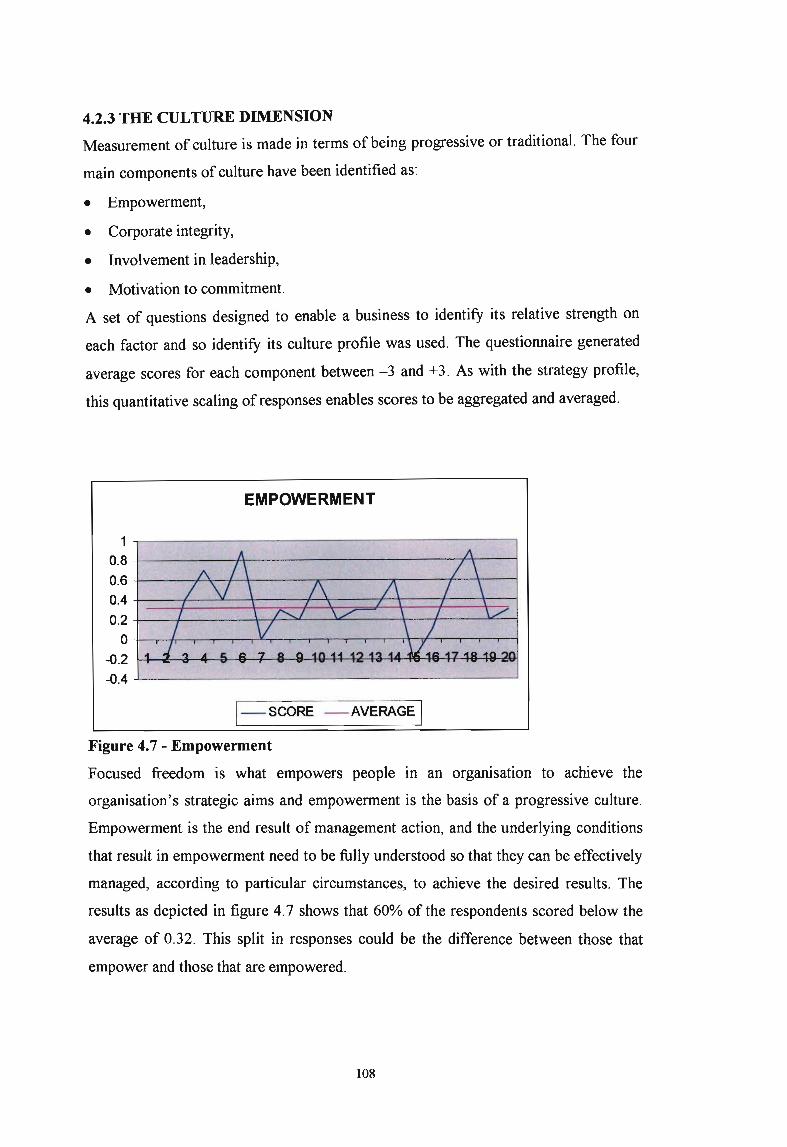
4.2.3 THE CULTURE DIMENSION
Measurement of culture is made in terms of being progressive or traditional. The four
main components of culture have been identified as:
• Empowerment,
• Corporate integrity,
• Involvement in leadership,
• Motivation to commitment.
A set of questions designed to enable a business to identify its relative strength on
each factor and so identify its culture profile was used. The questionnaire generated
average scores for each component between -3 and +3. As with the strategy profile,
this quantitative scaling of responses enables scores to be aggregated and averaged.
EMPOWERMENT
1-.---------------------,0.8 +------A-------------I--\-----10.6 +-----/--J't--.f.---JI-----....------.r---f-----'t-------I
0.4 t==:j~==t=::;;=::/-=4=;;-;:;t:.=\===t==4:::;l0.2 +---I-----\-+-.:::::>.L-----W:::.-..---\-----f--~=-------j
O+--r--/-,-----,--.----,---.-.J£..,---.----.----.,----.,-,---r--r+-~.,_-.--__.___.____l
-0.2 ++~---a-__4_~......{S--+--B--B---W'-+l~~_44-llO--=ttJ4+_14__w~-0.4 -.L-- -J
I---SCORE ---AVERAGE I
Figure 4.7 - Empowerment
Focused freedom is what empowers people in an organisation to achieve the
organisation's strategic aims and empowerment is the basis of a progressive culture.
Empowerment is the end result of management action, and the underlying conditions
that result in empowerment need to be fully understood so that they can be effectively
managed, according to particular circumstances, to achieve the desired results. The
results as depicted in figure 4.7 shows that 60% of the respondents scored below the
average of 0.32. This split in responses could be the difference between those that
empower and those that are empowered.
108

CORPORATE INTEGRITY
2-.---------------------,1.5 +----P~--------------___j
1+---------------¥-------=-.'-------j
0.5 +--------------------------j
12 3 4 5 6 7 891011121314151617181920
I---SCORE ---AVERAGE I
Figure 4.8 - Corporate integrity
Maintaining high integrity is a basic component of an achievement culture. Integrity,
or its lack, is manifested whenever a firm or an individual takes part in some
interaction with another interdependent entity. These interactions may be simple and
direct or extremely indirect. This component explores concepts such as favouritism,
honesty, environmental awareness, contribution to the local community, fairness as an
employer and frequencies of review and reporting of ethical performance. This
component scored a fairly high average of 1.24 and only 45% of the respondents
scored below the average.
INVOLVEMENT IN LEADERSHIP
O,--.-,---,---,--r----,----r---r--r---,.---,----,r--r--r-...-,-.-..,.-....----,
-0.2 +--'-----"'----"'---"L.......ioL--'~L-..u..-.A:L-.J.J.L...LL....lL....l..;l.-l!t.-!.i.le....u:lLU----U:L..1l~~
-0.4 +----+\-------------------l
-0.6 -r--~t-__t_-_r_~:__-~tT_--~:__---_/_\_--l
-0.8 -t-=="f===\=t===\==-=+=\'=#==~~_==I=~
-1 -r----I-----'''-------lt-7''-----\-t''------~r__----l
-1.2 ...L.------- --l
I---SCORE ---AVERAGE I
Figure 4.9 - Involvement in leadership
The basic organisational management problem is how to engage people's involvement
in and commitment to the organisation's strategic intent. Here we evaluate the amount
of influence employees have on decisions that effect them personally, staff
development, initiative, decision making, channels for voicing ideas and suggestions,
109

delegation of decision making, interaction with senior management, and teamwork.
The average for this section is a very low -0.78 with 50 % of the respondents scoring
below average. This suggests that there are serious problems and immediate action is
required.
NDTlVA110N TOCCJ\IMlNENT
1 2 3 4 5 6 7 8 9 10 11 12 13 14 15 16 17 18 19 20-0.2 +-=--:="'~-y--=-----=-------------------j
-0.4 +---+-4---...------x----------rl
-0.6 t===f=:.::\=-:p;:;;.t::=~:::;z=:::s_:;;::t:.~====~t=1
-0.8 +--L=----------+.,f--------l£-----------'~r-----__;
-1 ...L- ----l
I-SCORE -AVERAGE I
Figure 4.10 - Motivation to commitment
Motivation to commitment is the last component that makes up the culture profile.
Some people, who may be highly intelligent and skilled, are fundamentally
uninterested in organisational aims; others, who may be of limited experience and
aptitude, may dedicate 100% of their finite capability to the achievement of strategic
aims. Management's job is to try to ensure that all the people contribute to the
organisational aims as fully as is feasible. The average score is -0.66 with 60% of the
respondents scoring below the average. The points considered here were recognition
of employees' achievements, is the work self satisfying, responsibility, rewards for
efforts, basis for promotions, are salaries and wages competitive, performance
tracking, management's role in helping and supporting, and employee participation in
ownership of the organisation. The extremely low score suggests that this area needs
to be looked at as a matter ofurgency as immediate action is of importance.
110
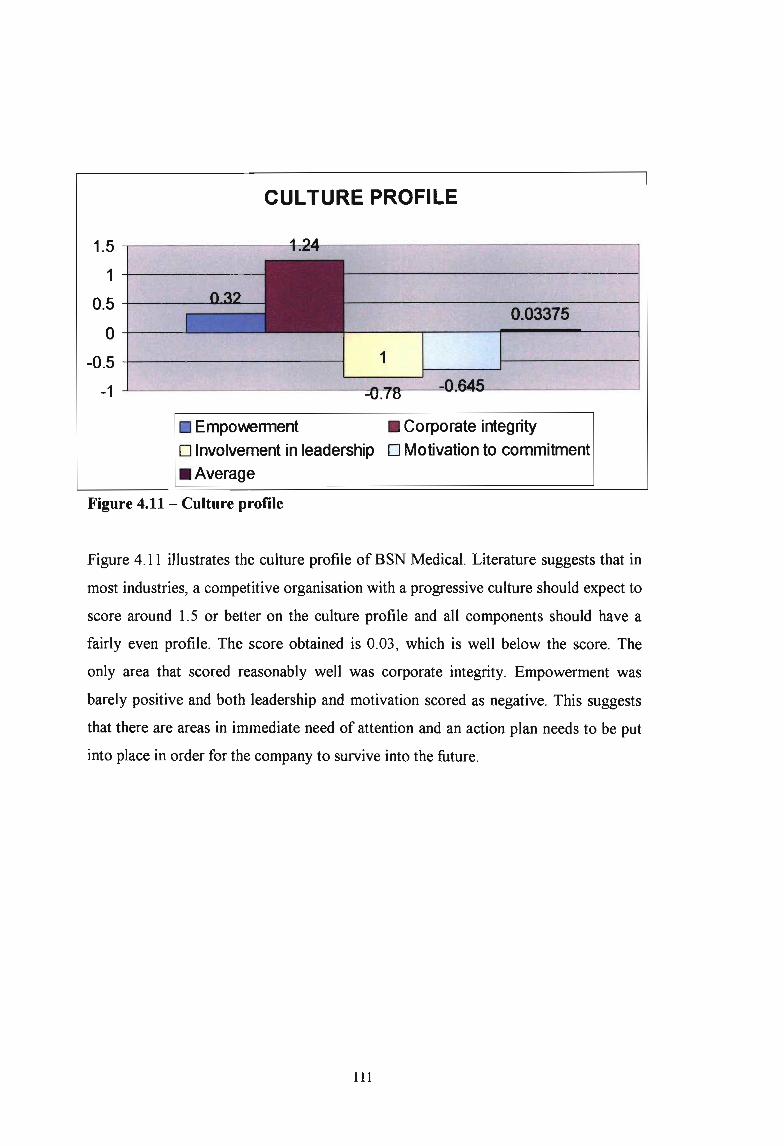
CULlURE PROFILE
0.03375
1
1.5 --r---------+-i~----------------~
1
0.5 +-------'~'-
o -1---------'
-0.5 -1------------1L-_--S---=--=-:-=----'
-1
Empowermento Involvement in leadership• Average
• Corporate integrityo Motivation to commitment
Figure 4.11 - Culture profile
Figure 4.11 illustrates the culture profile ofBSN Medical. Literature suggests that in
most industries, a competitive organisation with a progressive culture should expect to
score around 1.5 or better on the culture profile and all components should have a
fairly even profile. The score obtained is 0.03, which is well below the score. The
only area that scored reasonably well was corporate integrity. Empowerment was
barely positive and both leadership and motivation scored as negative. This suggests
that there are areas in immediate need of attention and an action plan needs to be put
into place in order for the company to survive into the future.
HI
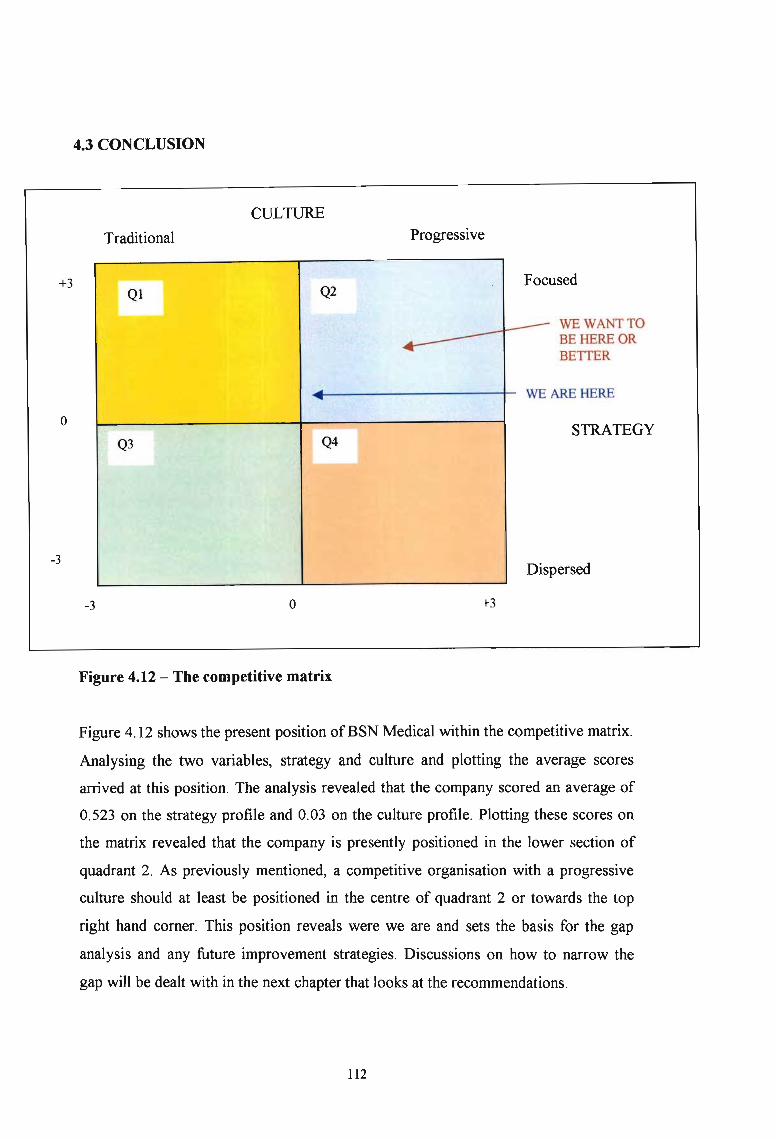
4.3 CONCLUSION
CULTURE
Traditional Progressive
WE WANT TOBE HERE ORBETTER
STRATEGY
ARE HERE
used
persed
FocQl Q2
.-------WE-..
Q3 Q4
Dis
o
+3
-3
-3 o +3
Figure 4.12 - The competitive matrix
Figure 4.12 shows the present position ofBSN Medical within the competitive matrix.
Analysing the two variables, strategy and culture and plotting the average scores
arrived at this position. The analysis revealed that the company scored an average of
0.523 on the strategy profile and 0.03 on the culture profile. Plotting these scores on
the matrix revealed that the company is presently positioned in the lower section of
quadrant 2. As previously mentioned, a competitive organisation with a progressive
culture should at least be positioned in the centre of quadrant 2 or towards the top
right hand corner. This position reveals were we are and sets the basis for the gap
analysis and any future improvement strategies. Discussions on how to narrow the
gap will be dealt with in the next chapter that looks at the recommendations.
112
CHAPTER 5: CONCLUSIONS AND RECOMMENDAnONS
5.1 INTRODUCTION
Literature suggests that in most industries, a competitive organisation should expect to
score around 1.5 or more on the strategy profile and the culture profile. This would
position the company in the second quadrant. This is particularly important in new
high growth, high technology industries and also in decline situations where an old
industry has not yet made use of new technology. This would apply in the case of
BSN as the company is in a state of transition in a low growth industry.
5.2 RECOMMENDAnONS ON THE STRATEGY PROFILE
The assessment of strategy is achieved by evaluating the company with respect to it
being focused or dispersed. In order for BSN Medical to become a world-class
competitor, it would need to adopt a focused strategy. In evaluating the five main
components that formed part of the strategy dimension, the company would need to
consistently score above zero in all components. This is the lower range of the scale,
as companies with focused strategies would score in excess of 1.5 on a scale of -3 to
+3.
The average score for strategic direction is 0.58. Although this score is above zero, it
is well below the 1.5 threshold for a competitive company. This suggests remedial
action on this component of the strategy profile with regards to:
• Ensuring that strategic aims are stated clearly and simply and communicated
to all employees.
• The strategy making process should be a participative process involving all
levels of the organisation.
• Greater efforts are required in ensuring that members of the organisation know
how their jobs contribute to strategy.
• Focus is required in order to exploit opportunities as they arise.
• The company is to move to ensure that the products or services are clearly
different from the main competitor's.
113

• The company needs to establish position in the market, which is recognised by
everyone, both inside and outside the organisation.
• Ensure that the company steers away from fire fighting which detracts from
pursuing the stated strategy of the business.
• A system for monitoring the progress made in achieving the strategic aims
needs to be put into place.
In analysing the results of external communications, the organisation has to consider
the customers, other players in the industry, competitors, suppliers, the political and
legal environments. Social, technological and economical factors also player a leading
role in the analysis. The average for this component is 0.435. Here again, although
positive, the low score suggests that this is a problem area that needs immediate
attention. Management needs to consider a plan of action in order obtain a greater
positive score, which would help position the company. Areas that require attention
are:
• Making special efforts to keep in close touch with customers in addition to
normal routine sales contacts.
• Establish good working contacts in the industry.
• Establish closer links with the suppliers of the technology and raw materials.
• Keep abreast of developments in technology.
• Institute a system of regularly updating of information on customers,
technology, products and market trends.
• Keep abreast of what the government's next moves are likely to be In relation
to the industry.
Long-term orientation explores the company's stance on long-term issues. It looks
at five-year projections, new technology and research and development, capital
expansion and investments, quality and performance improvements and continuous
improvements in order to improve the cost efficiency of the business. The average for
this section is -0.01. This area of the business needs immediate attention if the
company is expected to grow and survive into the future, especially in a global
114
market. The survival of any business depends largely on the future vision and strategy
that is put into place. A serious look into this component is required with regards to:
• Ensuring that management puts more emphasis on long -term issues.
• Forecast market trends over the next five years.
• Ensure that investments in the company's future with regards to new
technology, R&D, market research, etc occurs.
• Engender a culture were new technology IS seen as an opportunity to
improve rather than a threat.
• Ensure that there are continuous improvements in the quality/performance
of the products.
• Ensure that shareholders who invest for the long term, rather than a quick
return are attracted.
The fourth component of the strategy profile, core competence is the foundation of a
winning strategy. The average for this section is 0.835. This could suggest that there
is a positive move towards building a core competence, however work still needs to
be done in this area. The company should focus on areas such as:
• Knowing which major competitor needs to be beaten if the company is to
succeed.
• Ensuring that we have a well understood plan that sets out how the main
competitor will be beaten.
• Top management needs to be experts in the company's core technology.
• The company needs to be well aware of the latest global trends in the industry.
• BSN needs to actively pursue international collaborations so that the company
can keep up with technology in a way it couldn't achieve on our own.
• Analyse the competitor's product and establish what competences they have
that BSN does not build into its products.
The final component of the strategy profile is the customer focus. Here the focus is
on finding out what the customer wants, providing value and quality at reasonable
prices, knowing whom the customer is and how to satisfy the customer. It is also
115
important to know how the customer rates the products in relation to the other
competitors in the industry. The average for this section is 0.77. Although this is a low
score, the company is making some efforts to focusing on the needs of the customer.
This positive score will help maintain the company in the second quadrant, however
there is still quite a considerable amount of focussing of strategy that is required.
Recommendations for this component are as follows:
• The company needs to invest more time and money In finding out what
customers really want.
• BSN needs to determine exactly what the customer means by value and that's
what needs to be delivered.
• Management needs to focus more on ensuring that the customer obtains real
value.
• The company needs to capitalise on the quality of its product as the main
competitive strength.
• The company needs to meet all its major customers at least once a year to
consider how its relationship with them can be improved.
• BSN needs to determine how the customer rates the products in relation to the
main competitors in terms of all the important attributes.
5.3 RECOMMENDAnONS ON THE CULTURE PROFILE
The assessment of the culture dimension is achieved by evaluating the company with
respect to it being progressive or traditional. In order for BSN Medical to become a
world-class competitor, it would need to adopt a progressive culture. As per the
strategy dimension, in evaluating the four main components that formed part of the
culture dimension, the company would need to consistently score above zero in all
components. Again, this is the lower range of the scale, as companies with
progressive cultures would score in excess of 1.5 on a scale of-3 to +3.
The first component of the culture dimension that was analysed was empowerment
Focused freedom is what empowers people in an organisation to achieve the
organisation's strategic aims and empowerment is the basis of a progressive culture.
The results showed that the average was a low 0.32. This score would maintain the
116
company in the second quadrant, however the low score would bring the overall
culture profile score down. Corrective action in the following areas is required:
• Management needs to regard employees as responsible and treat them with
respect.
• Teamwork between management and the work force need to become part of the
company culture.
• The company needs to foster a culture of learning and continuous development.
• Management needs to put more effort into communicating with employees so that
everyone knows what is going on.
• Management needs to realise the future of the organisation depends on its people,
so employees are helped to realise their full potential.
Maintaining high integrity is a basic component of an achievement culture. This is
the second component of the culture profile. Integrity, or its lack, is manifested
whenever a firm or an individual takes part in some interaction with another
interdependent entity. This component scored a fairly high average of 1.24. Some
areas of improvement include:
• Ensuring that all employees have an equal opportunity and there is no favouritism.
• The company must always maintain honesty and fairness with its customers and
suppliers.
• The company must maintain its stance on ensunng it does not damage the
environment.
• The company needs to make a deliberate and positive contribution to the local
community.
• The company must ensure that there is a system in place to ensure that ethical
performance is reviewed and reported.
117

The third component of the culture profile is concerned with involvement in
leadership. This focuses around the basic organisational management problem of how
to engage people's involvement in and commitment to the organisation's strategic
intent. The average for this section is a very low -0.78. This suggests that there are
serious problems and immediate action is required. Some areas for improvement
should be centered around the following:
• Employees are to be given an opportunity to influence decisions that affect them
personally.
• Staff development IS clearly to be regarded as one of management's mam
responsibilities.
• Employees should be encouraged to use their own initiative.
• A mechanism should be instituted were employees in offices and on the shop floor
can voice their ideas and suggestions for improving the business directly to top
management.
• Management to delegate significant decisions as far down the organisation as
possible.
• Employees from the lowest levels of the organisation are to be involved m
projects where they contribute to major decisions.
Motivation to commitment is the last component that makes up the culture profile.
Management's job is to try to ensure that all the people contribute to the
organisational aims as fully as is feasible. The average score for this component is
-0.66. The extremely low score suggests that this area needs to be looked at as a
matter of urgency as immediate action is of importance. Recommendations for this
area are:
•••••
Employees' achievements should always be recognised.
Line managers are to ensure that most employees do work which is self-satisfying.
Employees are to be given the chance of taking on significant responsibility.
Management to ensure that employee' efforts are always rewarded.
Management to ensure that promotions are made on merit, according to skills and
effort.
118
• The company's salaries and wages are to be maintained as good as any in the
industry.
• Employees are to made aware of how they are performing whether it's good or
bad.
5.4 OVERALL SUMMARY OF STRATEGY AND CULTURE PROFILES
The average scores obtained for the strategy profile was 0.523, which is only 35% of
the recommended score. The average score obtained for the culture profile was 0.03,
which is well below the recommended score. The only areas that scored reasonably
well was corporate integrity, core competency and customer focus. Empowerment,
strategic direction and external communication were barely positive and leadership,
motivation, and long term orientation scored as negative. The two sets of average
scores are used to position the company on the competitive matrix as described in
chapter 4.
5.5 THE IMMEDIATE ACTION PLAN FOR BSN MEDICAL
The following recommendations would form part of the immediate action plan in
order to try and close the gap.
1. Team briefings
• A new communication system should be put into action to ensure everyone in the
factory is kept informed of current events.
• The team briefs should occur at least every month and they should communicate
to the employees, information on performance of the company, performance of
the factory, what things are happening in the factory and why they are happening.
• Team briefings should be presented by the relevant departmental manager to
everyone in the department, and copies should also be placed on notice boards for
later reference.
• These briefings would help the employees understand what is happening around
them, and what is expected of them to make the company a success.
119

2. Factory performance
Sales of the products have not been good this year. The customers are not buying as
much of the products as expected. Together with this, the prices the customers are
paying for the products are lower than expected. As a result, the factories are under
loaded and the company is not making as much profit as projected.
Some of the things that can be done to address these problems:
In order to focus the strategies and grow, restructuring and changes to management
responsibilities are required. Firstly, due to the fact that BSN is in a slow growth,
stagnant market, new market opportunities need to be found.
• As a result, a sales director needs to be appointed, who, together with the sales
force, will be responsible for seeking new markets in places where the company
has not sold products before.
• To control and pull activities together at the factories and to ensure that the
factories can deliver, a General manager would now manage the factory and all its
activities. The general manager would then be responsible for the following
functional areas:
o Manufacturing - A Manufacturing manager will be responsible for
manufacturing throughout Pinetown and Hospitek. His/her main
responsibilities are to ensure that production is made efficiently, labour
is utilised fully and our customers orders are met.
o Technical - A Technical Manager will be responsible for technical
development, projects and the laboratory. He/she will ensure that new
products are brought to the factory, that projects get completed on
time, and will assist the factories with technical problems.
o Regulatory compliance and SHE - A manager will be responsible for
regulatory compliance and Safety and Environmental Affairs. He/she
will make sure that the products are safe to use, that the quality
systems are effective and that the employees and the environment are
looked after.
120
o Commercial - A Commercial manager will be responsible for
customer services, purchasing, planning and warehousing. He/she
ensures the customers get the products they have ordered, that the
factories plan the right products to make and the right raw materials are
available to make them with.
o Engineering - An Engineering Manager will be responsible for
Engineering Management and Security. His role is to ensure that
machinery and equipment is safe to use, operates efficiently and can
make the products required with the minimum ofbreakdowns.
o Continuous Process Improvement - A Manager will be responsible for
finding problem areas in the factories where things are going wrong,
and to work with people to solve the problems. Waste reduction and
Best Operating Practices should be part of CPI teams role.
121
5.6 CONCLUSION
This chapter served to discuss the results of the study by relating them back to the
objectives of the study and finally to discuss the usefulness and appropriateness of the
methodology used as outlined in chapter one. The main objective of the study was to
analyse the strategic issues relating to world- class performance of the company by
means of a case study approach using the gap analysis technique. This was achieved
by using the competitive matrix as the evaluation tool, were the two variables of
strategy and culture were used to establish the company's current position. This was
established through structured interviews of a cross-section of the employees.
Recommendations were then based on these finding and an action plan was
suggested. It was highlighted that BSN Medical is on its way to becoming a world
class organisation by adopting a combination of a focussed strategy and a progressive
culture. However in order to close the gap, immediate changes would need to be
made. These changes will lead to:
• Better communication throughout the company,
• Focused leadership,
• Quicker solutions to problems that arise,
• Improvement in the way the factory runs,
• More focus on completion of projects on time,
• Ensuring that the customers get the right products at the right time and at the right
pnce.
• Achieving cost savings,
• Reduction in waste and improvement in efficiency.
These measures are required to be taken to ensure the factory remains profitable and
that company will carry on striving towards being world-class and ensuring its
existence into the future.
122
BffiLIOGRAPHY
Ambrosisni, v., Johnson, G., Scholes, K.1998. Exploring Techniques ofAnalysis and
Evaluation in Strategic Management, 2nd edition, Financial Times Prentice Hall,
Europe, p3.
Bateman, T.S., Snell, S.A.1999. Management: Building Competitive Advantage, 4th
edition, McGraw-Hill, Boston.
Birchall, D.W., Tovistiga, G.1999. The Strategic Potential ofa Firm's Knowledge
Portfolio, Journal ofGeneral Management 25, no. 1, pp 1-16.
Byars, L.L.1987. Strategic Management: Planning and Implementation, Concepts
and Cases, 2nd edition, Harper & Raw inc., New York.
Collis, D.l, Montgomery, C.A.1995. Competing on Resources: Strategy in the 1990s,
Harvard Business Review 73, No. 4, ppI20-123.
Colvin, lG., Miles, M.P.1999. Corporate Entrepreneurship and the Pursuit of
Competitive Advantage, Entrepreneruship: Theory and Practice 23, no 3, pp47-63.
Cooper, R, Kaplan, R S.1988.1988. Measure Costs Right: Make the Right Decisions,
Harvard Business Review 66, no. 5, p96.
Duncan, lW., Ginter, P., Swayne, L.E. 1988. Competitive Advantage and
Organizational Assessment, Academy ofManagement Executive 12, no.3, pp6-16.
Duncan, R1972. Characteristics of organisational environments and perceived
environmental uncertainty, Administrative Science Quarterly, vo1.17, no. 3, pp.313
327.
Fayweather, l, Kapoor, A. 1976. Strategy and Negotiation for the International
Corporation, Mass.: Ballinger, Cambridge.
123
Gideons International. 1980. The New Testament, National Bible press.
Ghemawat, P.1985. Building Strategy on the Experience Curve, Harvard Business
Review 64. No.2, pp.143-149.
Ghemawat, P.1991.Commitment: The Dynamics of Strategy, New York: Free Press,
pl1.
Hamel, G., Prahalad, c.K. 1989. Strategic Intent, Harvard Business Review 89, no. 3,
pp 63-76.
Hamel, G., Prahalad, c.K. 1990. The core competence of the corporation, Harvard
Business Review,
Hamel, G., Prahalad, C.K. 1994. Competing for the future, Harvard Business Review.
Hammer, M., Champy, 1. 1993. Re-engineering the Corporation, Nicholas Brealey
Publishing.
House, c.H., Price, RL. 1991. The Return Map: Tracking Product Teams, Harvard
Business Review 60, no. 1, p.93.
Imai, M. 1986. Kaizen - The Key to Japan's Competitive Success, McGraw-Hill.
Johnson, G., Scholes, K. 1999. Exploring Corporate Strategy. 5th edition. Prentice
Hall, Europe.
Kahaner, L. 1996. Competitive intelligence, Simon & Schuster, New York, pp. 84-85.
Kaplan, RS., Norton, D.P. 1992. The Balanced Scorecard-Measures That Drive
Performance, Harvard Business Review 70, no. 1, p71-79.
Kaplan, RS., Norton, D.P.1996. Ibid, p77
124

Kay, l1993. The Foundations ofCorporate Success, Oxford.
King, W.R, Cleland, DJ. 1987. Strategic Planning and Policy, Van Norstrand
Reinhold, New York, p.124.
Kotler, P. 1994. Marketing Management, 8th edition, Prentice Hall.
LaBarre, P. 1966. Knowledge Brokers, Industry Week, April 1, p.52.
Langely, 1988. The Roles of Formal Strategic Planning, Long Range Planning,
pp.400-450
Levitt, T. 1982. The Globalisation ofMarkets, Harvard Business Review, p91.
Lynch, R 2000. Corporate Strategy, Prentice Hall, London, p. 534.
Marline, D., Lamont, B.T., Hoffman, II 1994. Choice Situation, Strategy and
Performance: A Re-examination, Strategic Management Journal, pp229-239.
McGee, l, Thomas, H. 1986, Strategic groups: theory, research and taxonomy,
Strategic Management Journal, vol. 7, no.2, pp141-160.
Neely, A. 1993. Performance Measurement System Design - Theory and Practice,
Manufacturing Engineering Group, Cambridge University.
Parsons, T. 1960. Structure and Process in Modern Societies, New York: The Free
Press.
Pearce, lA. 1982. The Company Mission as a Strategic Tool, Sloan Management
Review 23, pp15-24.
Pearce, lA., Robinson, RB. 1988. Strategic Management, Strategy Formulation and
Implementation, 3rd edition, Irwin, Illinois.
125
Pearce, lA, Robinson, RE. 1994. Formulation, Implementation, and Control of
Competitive Strategy, 5th edition, Irwin, Chicago.
Pearson, G.l 1992. The Competitive Organisation: Managing for Organisational
excellence, McGraw - Hill International (UK) Limited, Cambridge.
Porter, M.E.1979. How competitive forces shape strategy, Harvard Business Review
57, pp.137-145
Porter, M.E. 1979. How competitive forces shape strategy, Harvard Business Review
57, pp. 138.
Porter, M.E. 1980. Competitive Strategy: Techniques for Analysing Industries and
Competitors, New York: Free Press.
Porter, M.E. 1985. Competitive Advantage, New York: Free Press, p36
Porter, M.B. 1986. Changing Patterns of International Competition, California
Management Review pp 9-40.
Pycraft, M., Singh, H, Phihlela, K. 2000. Operations Management - Southern Africa
Edition, 3rd impression, Pearson Education South Africa.
Ronstadt, R, Kramer, R 1982. Getting the Most out of Innovation Abroad, Harvard
Business Review, pp.94-99.
Shank:, lK., Govindarajan, V. 1993. Strategic Cost Management, New York: Free
Press, p50.
Skinner, W. 1985. Manufacturing The Formidable Competitive Weapon, John Wiley.
Thompson, AA, Strictland, Al 2001. Crafting and Executing Strategy, 12th edition,
McGraw-Hill, USA
126
Venkatraman, N., Prescott, lE. 1990. Environment-Strategy Co-alignment: An
Empirical Test of Its Performance Implications, Strategic Management Journal, pp.
52.
Watson,G.H. 1993. Strategic Benchmarking: How to Rate Your Company's
Performance Against the World's Best, New York: John Wiley.
G.S.Yip, G.S. 1982. Gateways to Entry, Harvard Business Review 60, no. 5, pp. 85
93.
http://www.index.co.za/wc
127
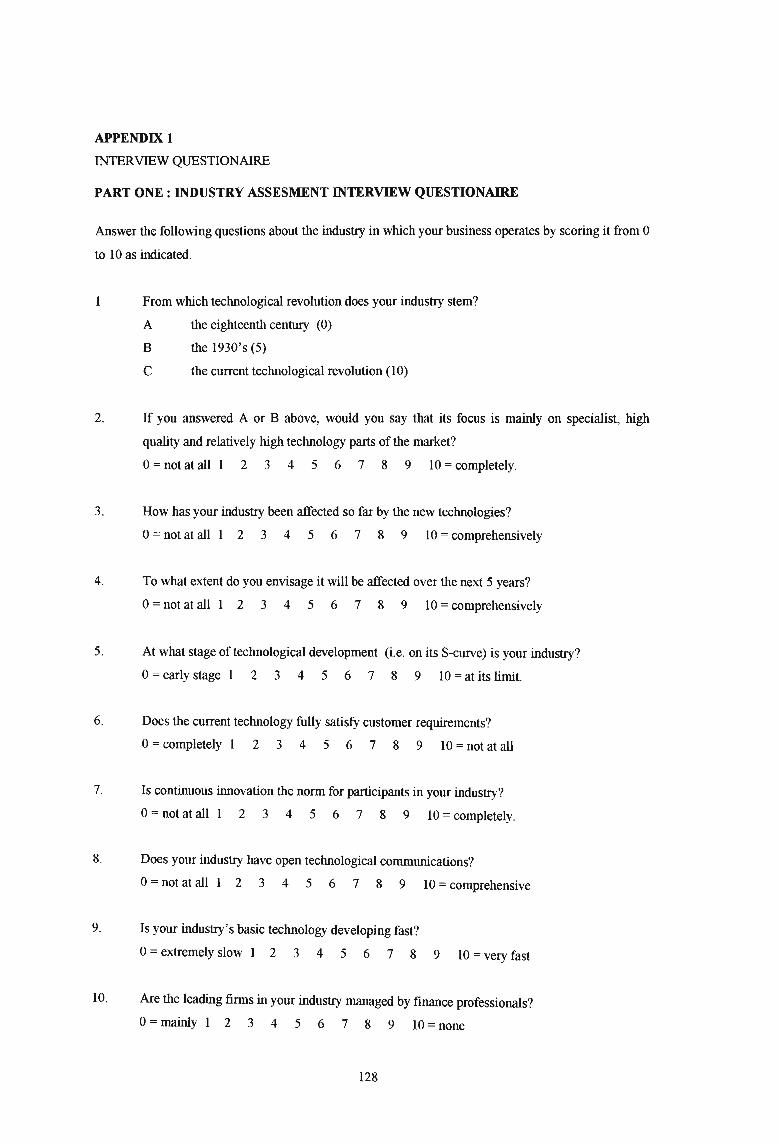
APPENDIX 1
INTERVIEW QUESTIONAIRE
PART ONE: INDUSTRY ASSESMENT INTERVIEW QUESTIONAIRE
Answer the following questions about the industry in which your business operates by scoring it from 0
to 10 as indicated.
1 From which technological revolution does your industry stem?
A the eighteenth century (0)
B the 1930's (5)
C the current technological revolution (10)
2. If you answered A or B above, would you say that its focus is mainly on specialist, high
quality and relatively high technology parts of the market?
0= not at all 1 2 3 4 5 6 7 8 9 10 = completely.
3. How has your industry been affected so far by the new technologies?
0= not at all 1 2 3 4 5 6 7 8 9 10 = comprehensively
4. To what extent do you envisage it will be affected over the next 5 years?
o= not at all 1 2 3 4 5 6 7 8 9 10 = comprehensively
5. At what stage of technological development (i.e. on its S-eurve) is your industry?
o= early stage 1 2 3 4 5 6 7 8 9 10 = at its limit.
6. Does the current technology fully satisfy customer requirements?
o= completely 1 2 3 4 5 6 7 8 9 10 = not at all
7. Is continuous innovation the norm for participants in your industry?
o= not at all 1 2 3 4 5 6 7 8 9 10 = completely.
8. Does your industry have open technological communications?
o= not at all 1 2 3 4 5 6 7 8 9 10 = comprehensive
9. Is your industry's basic technology developing fast?
o= extremely slow 1 2 3 4 5 6 7 8 9 10 = very fast
10. Are the leading firms in your industry managed by finance professionals?
0= mainly 1 2 3 4 5 6 7 8 9 10 = none
128
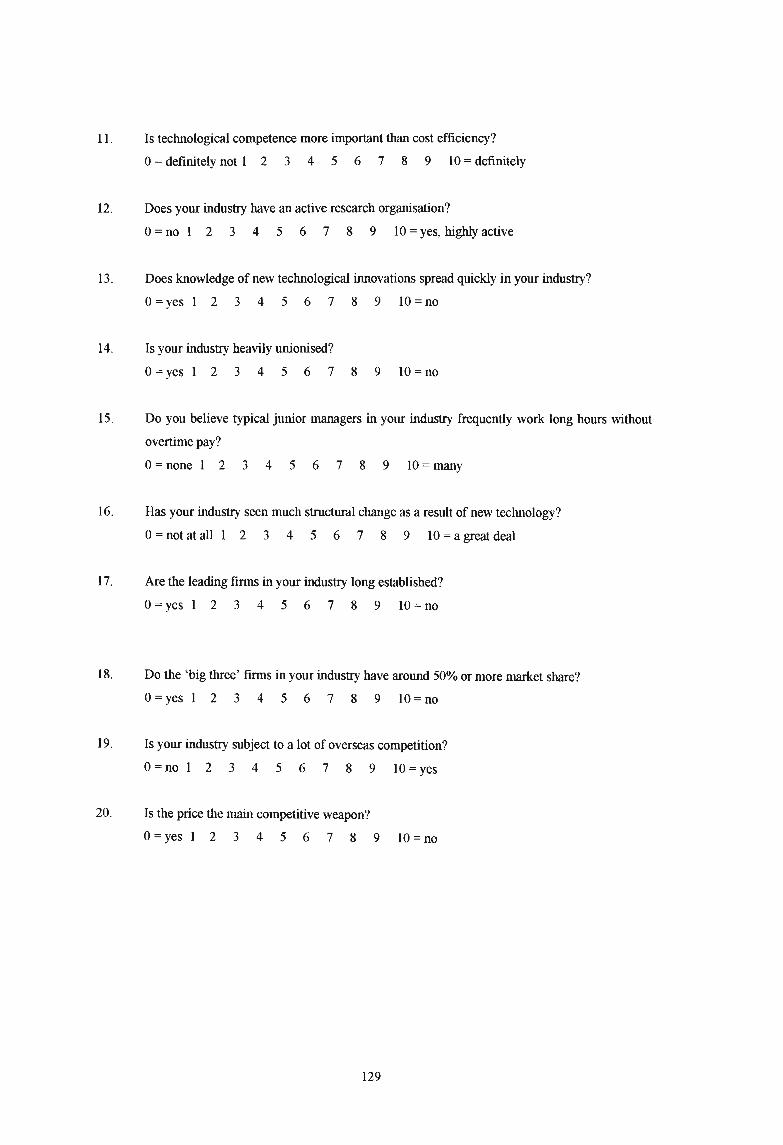
11. Is technological competence more important than cost efficiency?
o= definitely not 1 2 3 4 5 6 7 8 9 10 = definitely
12. Does your industry have an active research organisation?
o= no 1 2 3 4 5 6 7 8 9 10 = yes, highly active
13. Does knowledge of new technological innovations spread quickly in your industry?
o= yes 1 2 3 4 5 6 7 8 9 10 = no
14. Is your industry heavily unionised?
o= yes 1 2 3 4 5 6 7 8 9 10 = no
15. Do you believe typical junior managers in your industry frequently work long hours without
overtime pay?
o= none 1 2 3 4 5 6 7 8 9 10 = many
16. Has your industry seen much structural change as a result of new technology?
o= not at all 1 2 3 4 5 6 7 8 9 10 =a great deal
17. Are the leading firms in your industry long established?
o= yes 1 2 3 4 5 6 7 8 9 10 = no
18. Do the 'big three' firms in your industry have around 50% or more market share?
o=yes 1 2 3 4 5 6 7 8 9 10 =no
19. Is your industry subject to a lot of overseas competition?
o= no 1 2 3 4 5 6 7 8 9 10 = yes
20. Is the price the main competitive weapon?
o=yes 1 2 3 4 5 6 7 8 9 10 =no
129
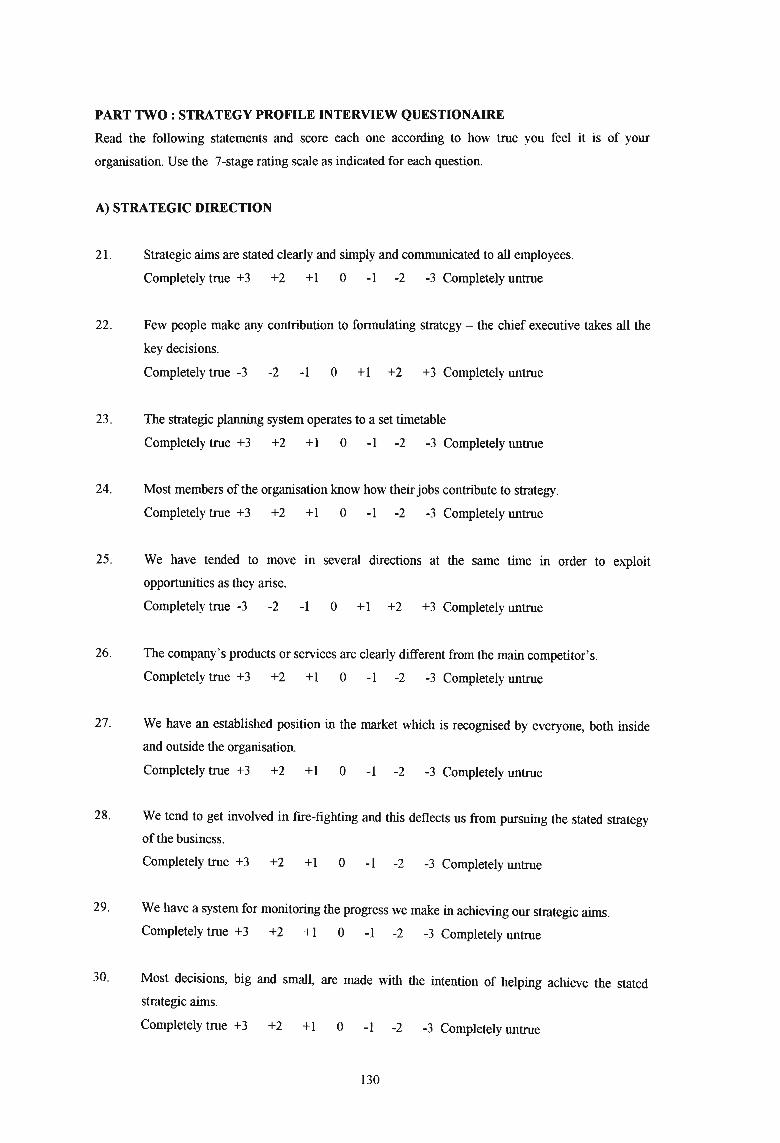
PART TWO : STRATEGY PROFILE INTERVIEW QUESTIONAIRE
Read the following statements and score each one according to how true you feel it is of your
organisation. Use the 7-stage rating scale as indicated for each question.
A) STRATEGIC DIRECTION
21. Strategic aims are stated clearly and simply and communicated to all employees.
Completely true +3 +2 +1 0 -1 -2 -3 Completely untrue
22. Few people make any contribution to formulating strategy - the chief executive takes all the
key decisions.
Completely true -3 -2 -1 0 +1 +2 +3 Completely untrue
23. The strategic planning system operates to a set timetable
Completely true +3 +2 +1 0 -1 -2 -3 Completely untrue
24. Most members of the organisation know how their jobs contribute to strategy.
Completely true +3 +2 +1 0 -1 -2 -3 Completely untrue
25. We have tended to move in several directions at the same time in order to exploit
opportunities as they arise.
Completely true -3 -2 -1 0 +1 +2 +3 Completely untrue
26. The company's products or services are clearly different from the main competitor's.
Completely true +3 +2 +1 0 -1 -2 -3 Completely untrue
27. We have an established position in the market which is recognised by everyone, both inside
and outside the organisation.
Completely true +3 +2 +1 0 -1 -2 -3 Completely untrue
28. We tend to get involved in fire-fighting and this deflects us from pursuing the stated strategy
of the business.
Completely true +3 +2 +1 0 -1 -2 -3 Completely untrue
29. We have a system for monitoring the progress we make in achieving our strategic aims.
Completely true +3 +2 +1 0 -1 -2 -3 Completely untrue
30. Most decisions, big and small, are made with the intention of helping achieve the stated
strategic aims.
Completely true +3 +2 +1 0 -1 -2 -3 Completely untrue
130

B) EXTERNAL COMMUNICATIONS
31. The organisation makes special efforts to keep in close touch with customers in addition to
normal routine sales contacts.
Completely true +3 +2 +1 0 -1 -2 -3 Completely untrue
32. Most managers have good working contacts in the industry.
Completely true +3 +2 +1 0 -1 -2 -3 Completely untrue
33. We regularly meet our competitors and exchange real information.
Completely true +3 +2 +1 0 -1 -2 -3 Completely untrue
34. Most members of the organisation know who our three main competitors are.
Completely true +3 +2 +1 0 -1 -2 -3 Completely untrue
35. We work closely with the suppliers of our teclmology (plant and equipment) and run (or
would be keen to run) trials of prototype equipment for them.
Completely true +3 +2 +1 0 -1 -2 -3 Completely untrue
36. We know what the next developments in our teclmology are going to be.
Completely true +3 +2 +1 0 -1 -2 -3 Completely untrue
37. We know why people may wish to buy products from our competitors.
Completely true +3 +2 +1 0 -1 -2 -3 Completely untrue
38. The organisation maintains regular contacts with teclmology leaders (e.g. machine
manufacturers, research associations, consultants, universities, etc.).
Completely true +3 +2 +1 0 -1 -2 -3 Completely untrue
39. We have a routine system of regularly updating our information on customers, teclmology,
products and market trends.
Completely true +3 +2 +1 0 -1 -2 -3 Completely untrue
40. We know what the government's next moves are likely to be I relation to our industry.
Completely true +3 +2 +1 0 -1 -2 -3 Completely untrue
131
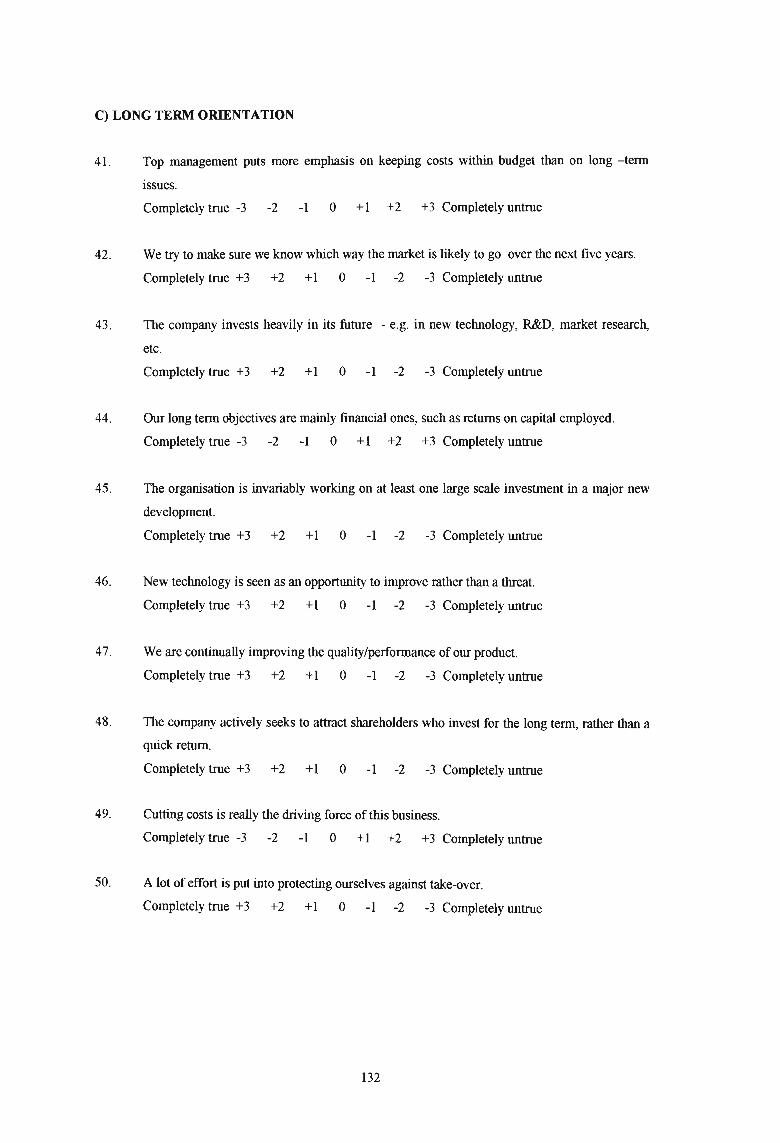
C) LONG TERM ORIENTATION
41. Top management puts more emphasis on keeping costs within budget than on long -term
issues.
Completely true -3 -2 -1 0 +1 +2 +3 Completely untrue
42. We try to make sure we know which way the market is likely to go over the next five years.
Completely true +3 +2 +1 0 -1 -2 -3 Completely untrue
43. The company invests heavily in its future - e.g. in new technology, R&D, market research,
etc.
Completely true +3 +2 +1 0 -1 -2 -3 Completely untrue
44. Our long term objectives are mainly financial ones, such as returns on capital employed.
Completely true -3 -2 -1 0 +1 +2 +3 Completely untrue
45. The organisation is invariably working on at least one large scale investment in a major new
development.
Completely true +3 +2 +1 0 -1 -2 -3 Completely untrue
46. New technology is seen as an opportunity to improve rather than a threat.
Completely true +3 +2 +1 0 -1 -2 -3 Completely untrue
47. We are continually improving the quality/performance of our product.
Completely true +3 +2 +1 0 -1 -2 -3 Completely untrue
48. The company actively seeks to attract shareholders who invest for the long term, rather than a
quick return.
Completely true +3 +2 +1 0 -1 -2 -3 Completely untrue
49. Cutting costs is really the driving force of this business.
Completely true -3 -2 -1 0 +1 +2 +3 Completely untrue
50. A lot of effort is put into protecting ourselves against take-over.
Completely true +3 +2 +1 0 -1 -2 -3 Completely untrue
132
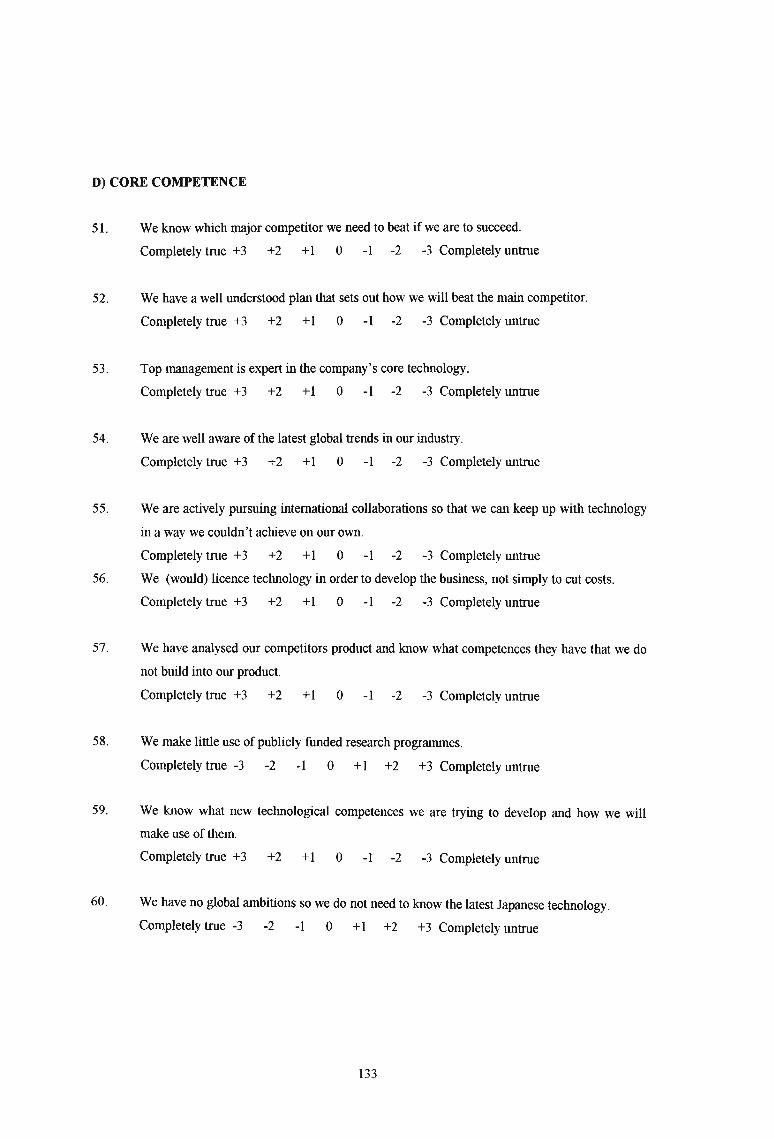
D) CORE COMPETENCE
51. We know which major competitor we need to beat ifwe are to succeed.
Completely true +3 +2 +1 0 -1 -2 -3 Completely untrue
52. We have a well understood plan that sets out how we will beat the main competitor.
Completely true +3 +2 +1 0 -1 -2 -3 Completely untrue
53. Top management is expert in the company's core technology.
Completely true +3 +2 +1 0 -1 -2 -3 Completely untrue
54. We are well aware of the latest global trends in our industry.
Completely true +3 +2 +1 0 -1 -2 -3 Completely untrue
55. We are actively pursuing international collaborations so that we can keep up with technology
in a way we couldn't achieve on our own.
Completely true +3 +2 +1 0 -1 -2 -3 Completely untrue
56. We (would) licence technology in order to develop the business, not simply to cut costs.
Completely true +3 +2 +1 0 -1 -2 -3 Completely untrue
57. We have analysed our competitors product and know what competences they have that we do
not build into our product.
Completely true +3 +2 +1 0 -1 -2 -3 Completely untrue
58. We make little use of publicly funded research programmes.
Completely true -3 -2 -1 0 +1 +2 +3 Completely untrue
59. We know what new technological competences we are trying to develop and how we will
make use of them.
Completely true +3 +2 +1 0 -1 -2 -3 Completely untrue
60. We have no global ambitions so we do not need to know the latest Japanese technology.
Completely true -3 -2 -1 0 +1 +2 +3 Completely untrue
133
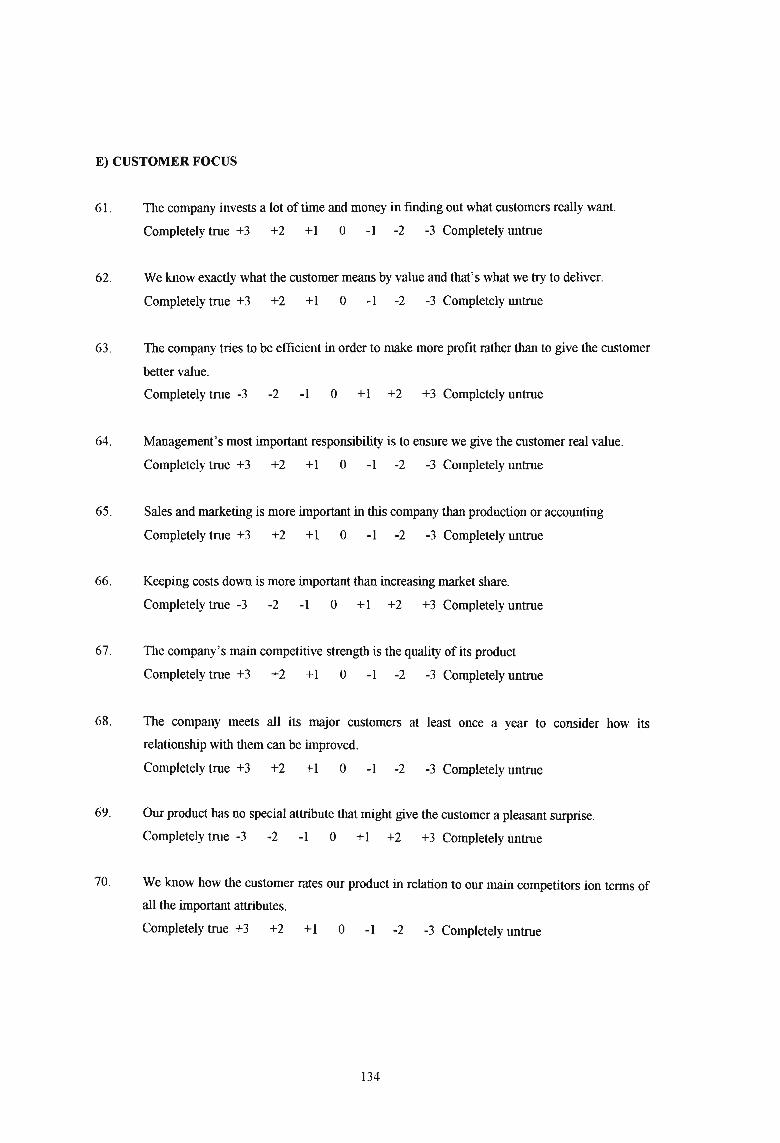
E) CUSTOMER FOCUS
61. The company invests a lot of time and money in finding out what customers really want.
Completely true +3 +2 +1 0 -1 -2 -3 Completely untrue
62. We know exactly what the customer means by value and that's what we try to deliver.
Completely true +3 +2 +1 0 -1 -2 -3 Completely untrue
63. The company tries to be efficient in order to make more profit rather than to give the customer
better value.
Completely true -3 -2 -1 0 +1 +2 +3 Completely untrue
64. Management's most important responsibility is to ensure we give the customer real value.
Completely true +3 +2 +1 0 -1 -2 -3 Completely untrue
65. Sales and marketing is more important in this company than production or accounting
Completely true +3 +2 +1 0 -1 -2 -3 Completely untrue
66. Keeping costs down is more important than increasing market share.
Completely true -3 -2 -1 0 +1 +2 +3 Completely untrue
67. The company's main competitive strength is the quality of its product
Completely true +3 +2 +1 0 -1 -2 -3 Completely untrue
68. The company meets all its major customers at least once a year to consider how its
relationship with them can be improved.
Completely true +3 +2 +1 0 -1 -2 -3 Completely untrue
69. Our product has no special attribute that might give the customer a pleasant surprise.
Completely true -3 -2 -1 0 +1 +2 +3 Completely untrue
70. We know how the customer rates our product in relation to our main competitors ion terms of
all the important attributes.
Completely true +3 +2 +1 0 -1 -2 -3 Completely untrue
134
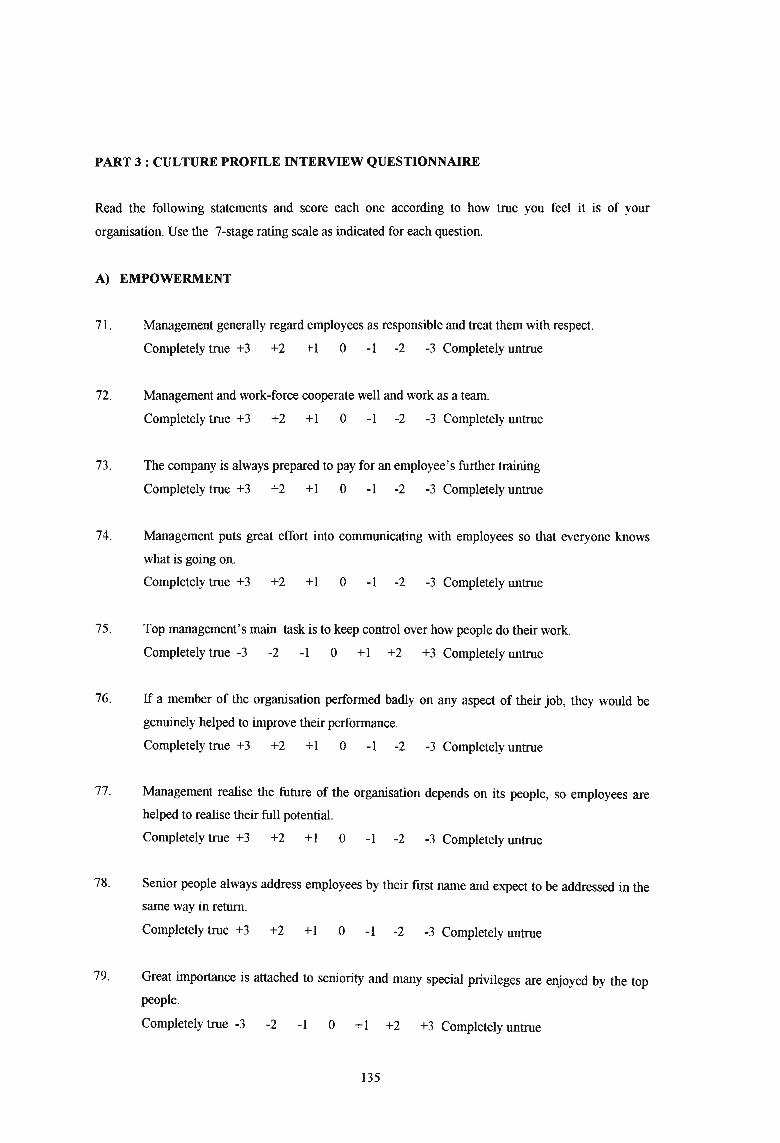
PART 3: CULTURE PROFILE INTERVIEW QUESTIONNAIRE
Read the following statements and score each one according to how true you feel it is of your
organisation. Use the 7-stage rating scale as indicated for each question.
A) EMPOWERMENT
71. Management generally regard employees as responsible and treat them with respect.
Completely true +3 +2 +1 0 -1 -2 -3 Completely untrue
72. Management and work-force cooperate well and work as a team.
Completely true +3 +2 +1 0 -1 -2 -3 Completely untrue
73. The company is always prepared to pay for an employee's further training
Completely true +3 +2 +1 0 -1 -2 -3 Completely untrue
74. Management puts great effort into communicating with employees so that everyone knows
what is going on.
Completely true +3 +2 +1 0 -1 -2 -3 Completely untrue
75. Top management's main task is to keep control over how people do their work.
Completely true -3 -2 -1 0 +1 +2 +3 Completely untrue
76. If a member of the organisation performed badly on any aspect of their job, they would be
genuinely helped to improve their performance.
Completely true +3 +2 +1 0 -1 -2 -3 Completely untrue
77. Management realise the future of the organisation depends on its people, so employees are
helped to realise their full potential.
Completely true +3 +2 +1 0 -1 -2 -3 Completely untrue
78. Senior people always address employees by their first name and expect to be addressed in the
same way in return.
Completely true +3 +2 +1 0 -1 -2 -3 Completely untrue
79. Great importance is attached to seniority and many special privileges are enjoyed by the top
people.
Completely true -3 -2 -1 0 +1 +2 +3 Completely untrue
135

80. Different departments (e.g. sales and production) communicate closely with each other, not
just through department managers.
Completely true +3 +2 +1 0 -1 -2 -3 Completely untrue
B) CORPORATE INTEGRITY
81. Everyone has an equal opportunity to get on - there is no favouritism.
Completely true +3 +2 +1 0 -1 -2 -3 Completely untrue
82. The company is always honest and fair with its customers and suppliers.
Completely true +3 +2 +1 0 -1 -2 -3 Completely untrue
83. The company's products are the best in their field.
Completely true +3 +2 +1 0 -1 -2 -3 Completely untrue
84. The company takes great care to make sure it does not damage the environment.
Completely true +3 +2 +1 0 -1 -2 -3 Completely untrue
85. The company makes a deliberate and positive contribution to the local community.
Completely true +3 +2 +1 0 -1 -2 -3 Completely untrue
86. The company is a good and fair employer
Completely true +3 +2 +1 0 -1 -2 -3 Completely untrue
87. We have a formal arrangement (e.g. a regularly meeting committee, working party, formal
report, etc) for the explicit review and reporting of ethical performance.
Completely true +3 +2 +1 0 -1 -2 -3 Completely untrue
88. We have a reputation for being the leader in terms of quality.
Completely true +3 +2 +1 0 -1 -2 -3 Completely untrue
89. The company would never get involved in any dubious financial dealings.
Completely true +3 +2 +1 0 -1 -2 -3 Completely untrue
90. The organisation has an excellent reputation for ethical behaviour and is very careful to ensure
that this reputation is upheld at all times.
Completely true +3 +2 +1 0 -1 -2 -3 Completely untrue
136

C) INVOLVEMENT IN LEADERSHIP
91. Employees have a real opportunity to influence decisions that affect them personally.
Completely true +3 +2 +1 0 -1 -2 -3 Completely untrue
92. Staff development is clearly regarded as one of management's main responsibilities.
Completely true +3 +2 +1 0 -1 -2 -3 Completely untrue
93. People are encouraged to use their own initiative.
Completely true +3 +2 +1 0 -1 -2 -3 Completely untrue
94. People other than just the chief executive are involved in taking important decisions.
Completely true +3 +2 +1 0 -1 -2 -3 Completely untrue
95. An employee who had made an expensive mistake would be encouraged to try again, rather
than being reprimanded.
Completely true +3 +2 +1 0 -1 -2 -3 Completely untrue
96. People in offices and on the shop floor often voice their ideas and suggestions for improving
the business directly to top management.
Completely true +3 +2 +1 0 -1 -2 -3 Completely untrue
97. Management delegate significant decisions as far down the organisation as possible.
Completely true +3 +2 +1 0 -1 -2 -3 Completely untrue
98. There is plenty of opportunity to talk informally to senior management, no matter how junior
you are.
Completely true +3 +2 +1 0 -1 -2 -3 Completely untrue
99. As much as half or more of most people's time is spent working in a special project team
rather than on routine departmental work.
Completely true +3 +2 +1 0 -1 -2 -3 Completely untrue
100. People from the lowest levels of the organisation may be involved in projects where they
contribute to major decisions.
Completely true +3 +2 +1 0 -1 -2 -3 Completely untrue
137
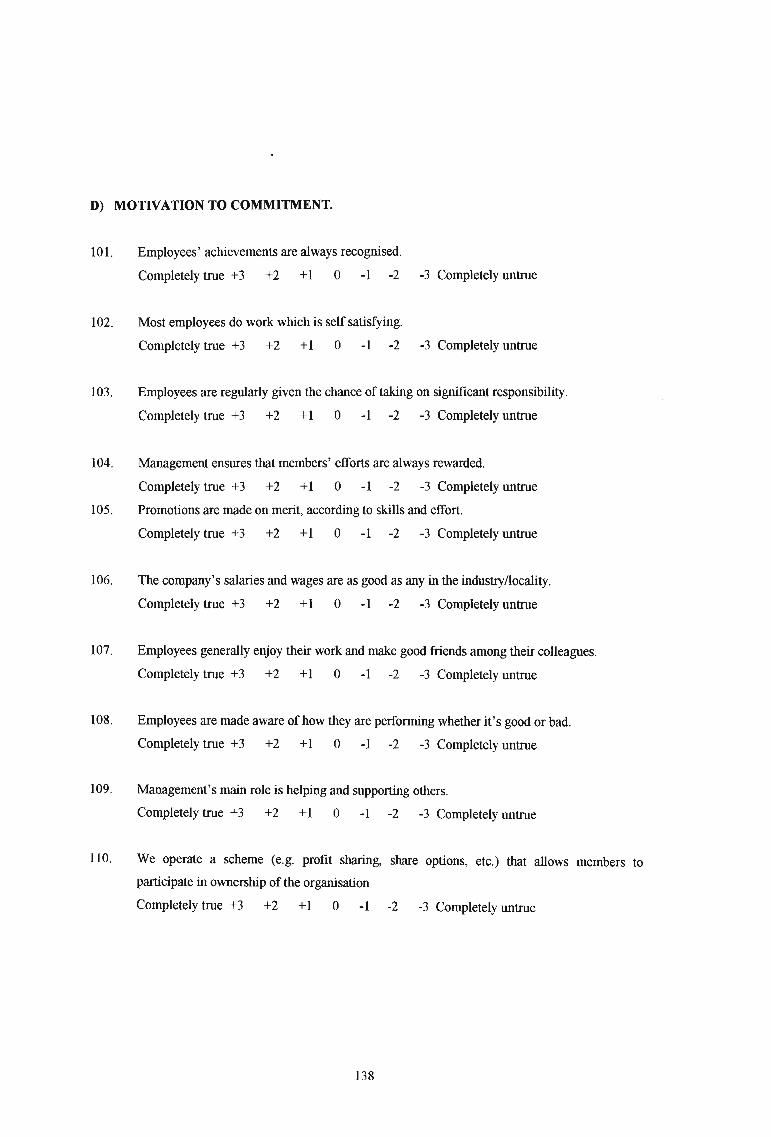
D) MOTIVATION TO COMMITMENT.
101. Employees' achievements are always recognised.
Completely true +3 +2 +1 0 -1 -2 -3 Completely untrue
102. Most employees do work which is self satisfying.
Completely true +3 +2 +1 0 -1 -2 -3 Completely untrue
103. Employees are regularly given the chance of taking on significant responsibility.
Completely true +3 +2 +1 0 -1 -2 -3 Completely untrue
104. Management ensures that members' efforts are always rewarded.
Completely true +3 +2 +1 0 -1 -2 -3 Completely untrue
105. Promotions are made on merit, according to skills and effort.
Completely true +3 +2 +1 0 -1 -2 -3 Completely untrue
106. The company's salaries and wages are as good as any in the industryllocality.
Completely true +3 +2 +1 0 -1 -2 -3 Completely untrue
107. Employees generally enjoy their work and make good friends among their colleagues.
Completely true +3 +2 +1 0 -1 -2 -3 Completely untrue
108. Employees are made aware of how they are performing whether it's good or bad.
Completely true +3 +2 +1 0 -1 -2 -3 Completely untrue
109. Management's main role is helping and supporting others.
Completely true +3 +2 +1 0 -1 -2 -3 Completely untrue
110. We operate a scheme (e.g. profit sharing, share options, etc.) that allows members to
participate in ownership of the organisation
Completely true +3 +2 +1 0 -1 -2 -3 Completely untrue
138


![Strategic Issues[1]](https://img.pdfslide.us/doc/110x75/577d27a51a28ab4e1ea471cc/strategic-issues1.jpg)