Embed Size (px)
Citation preview
Strategic Housing Market Assessment
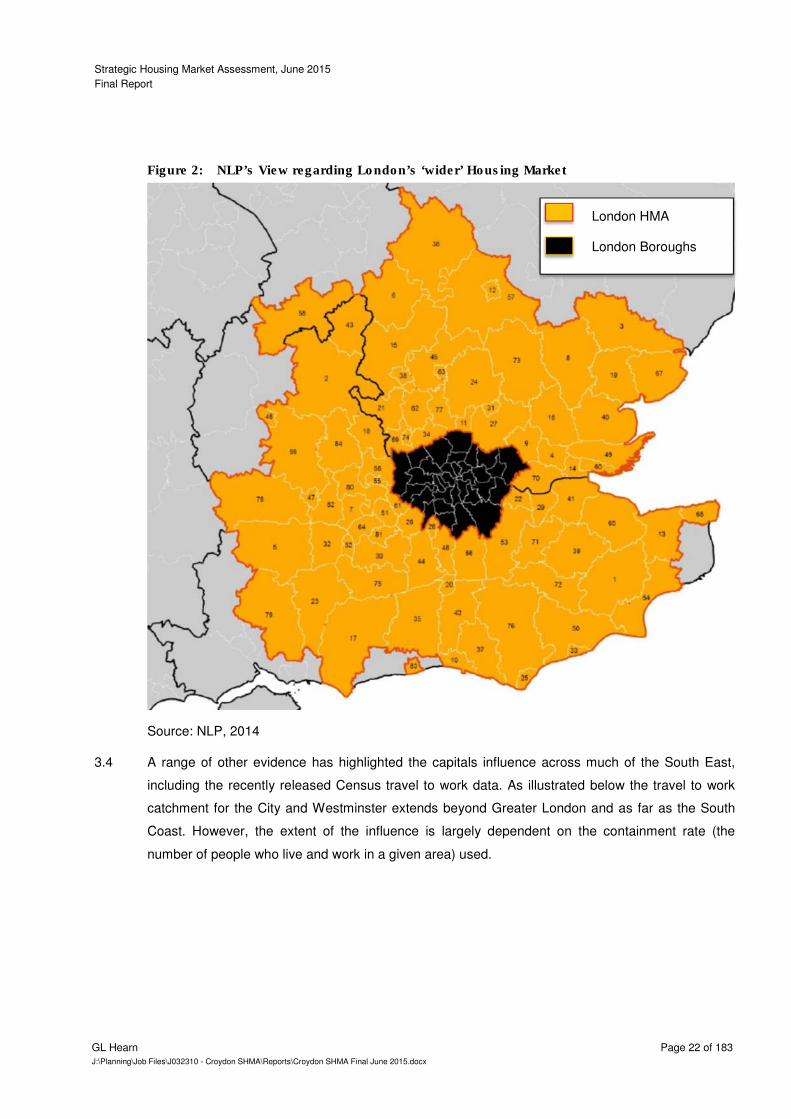
London Borough of Croydon
Final Report
June 2015
Prepared by
GL Hearn Limited
280 High Holborn
London WC1V 7EE
T +44 (0)20 7851 4900
glhearn.com

Strategic Housing Market Assessment, June 2015
Final Report
GL Hearn Page 2 of 183
J:\Planning\Job Files\J032310 - Croydon SHMA\Reports\Croydon SHMA Final June 2015.docx
Contents
Section Page
1 INTRODUCTION 10
2 STRATEGIC CONTEXT FOR HOUSING IN LONDON 17
3 HOUSING MARKET LINKAGES 21
4 DEFINING THE HMA 29
5 UNDERSTANDING CROYDON’S HOUSING MARKET 43
6 HOUSING MARKET DYNAMICS AND MARKET SIGNALS 58
7 OVERALL HOUSING NEED 78
8 AFFORDABLE HOUSING NEED 102
9 NEED FOR DIFFERENT TYPES OF HOUSING 122
10 HOUSING NEEDS OF PARTICULAR GROUPS 134
11 CONCLUSIONS 159
LIST OF FIGURES
OVERVIEW OF APPROACH 15 FIGURE 1:
NLP’S VIEW REGARDING LONDON’S ‘WIDER’ HOUSING MARKET 22 FIGURE 2:
TRAVEL TO WORK CATCHMENT OF WESTMINSTER AND THE CITY (2011) 23 FIGURE 3:
CURDS-DEFINED LONDON FRAMEWORK HMA 25 FIGURE 4:
CURDS-DEFINED LOCAL HOUSING MARKET AREAS 26 FIGURE 5:
AREAS COVERED BY SUB-REGIONAL SHMAS IN LONDON 27 FIGURE 6:
OUTER SOUTH LONDON BROAD RENTAL MARKET AREA 28 FIGURE 7:
MAJOR GROSS MIGRATION FLOWS (2011) 30 FIGURE 8:
MAJOR GROSS MIGRATION FLOWS PER HEAD (2011) 31 FIGURE 9:
MAJOR NET MIGRATION FLOWS (2011) 33 FIGURE 10:
CENTRAL ACTIVITIES ZONE TTW CATCHMENT (2011) 34 FIGURE 11:
MAP OF MAJOR EMPLOYMENT CENTRE 35 FIGURE 12:

Strategic Housing Market Assessment, June 2015
Final Report
GL Hearn Page 3 of 183
J:\Planning\Job Files\J032310 - Croydon SHMA\Reports\Croydon SHMA Final June 2015.docx
COMMUTING TO CENTRAL CROYDON AND WEST CROYDON (2011) 37 FIGURE 13:
MAIN COMMUTING DESTINATION (2011) 38 FIGURE 14:
IN AND OUT COMMUTING WITH CROYDON (2011) 39 FIGURE 15:
AVERAGE SEMI-DETACHED AND TERRACED HOUSE PRICE (2013) 40 FIGURE 16:
AVERAGE HOUSE PRICE CHANGE BY POSTAL SECTOR (2009-2013) 41 FIGURE 17:
CROYDON’S POPULATION, 1981-2013 43 FIGURE 18:
POPULATION GROWTH FROM 2001 44 FIGURE 19:
POPULATION PROFILE, 2013 45 FIGURE 20:
ETHNICITY 46 FIGURE 21:
HOUSEHOLD TYPES 47 FIGURE 22:
HOUSEHOLD GROWTH, 2001-2011 48 FIGURE 23:
OCCUPATIONAL PROFILE 49 FIGURE 24:
QUALIFICATIONS 50 FIGURE 25:
EMPLOYMENT 51 FIGURE 26:
EARNINGS BY RESIDENCE (2013) 52 FIGURE 27:
EARNINGS BY WORKPLACE (2013) 52 FIGURE 28:
HOUSING TYPES, % OF DWELLINGS (2011) 54 FIGURE 29:
DWELLING SIZE BY NUMBER OF BEDROOMS (2011) 55 FIGURE 30:
TENURE TYPE BY DWELLING SIZE, 2011 56 FIGURE 31:
DWELLING % BY COUNCIL TAX BAND 57 FIGURE 32:
UNDERSTANDING HOUSING DEMAND DRIVERS 58 FIGURE 33:
UK ECONOMIC GROWTH, 2007-2013 60 FIGURE 34:
TRENDS IN GROSS MORTGAGE LENDING 61 FIGURE 35:
FIRST-TIME BUYER NUMBERS 62 FIGURE 36:
TRENDS IN BUY-TO-LET LENDING 63 FIGURE 37:
AVERAGE HOUSE PRICES IN OUTER LONDON BOROUGHS FIGURE 38: (APRIL, 2014) 64
MEDIAN HOUSE PRICE (1998-2007) 65 FIGURE 39:
Strategic Housing Market Assessment, June 2015
Final Report
GL Hearn Page 4 of 183
J:\Planning\Job Files\J032310 - Croydon SHMA\Reports\Croydon SHMA Final June 2015.docx
MEDIAN HOUSE PRICE (2008-2013) 66 FIGURE 40:
INDEXED ANALYSIS OF SALES TRENDS (1998 – 2012) 67 FIGURE 41:
MEDIAN HOUSE PRICES (JAN 2013- APRIL 2014) 67 FIGURE 42:
SALES BY DWELLING TYPE (JAN 2013- APRIL 2014) 68 FIGURE 43:
BENCHMARKED TREND IN AVERAGE PRIVATE RENTAL VALUES FIGURE 44: (2011-2014) 69
TREND IN PRIVATE RENTAL TRANSACTIONS (SEPTEMBER 2011 FIGURE 45: TO JUNE 2014) 70
LOWER QUARTILE AFFORDABILITY TREND (1997-2013) 71 FIGURE 46:
CHANGE IN HOUSEHOLDS BY TENURE IN HMA, 2001-11 72 FIGURE 47:
HOUSING SUPPLY VS. PAST TARGETS 73 FIGURE 48:
CHANGE IN DWELLING STOCK (ESTIMATE), 2001 – 2013 74 FIGURE 49:
PAST AND PROJECTED POPULATION GROWTH – CROYDON FIGURE 50: (GLA PROJECTIONS) 81
PAST POPULATION GROWTH – CROYDON (GLA AND ONS) 82 FIGURE 51:
PAST TRENDS IN IN- AND OUT-MIGRATION – CROYDON 83 FIGURE 52:
COMPLETIONS AND MIGRATION FROM CROYDON TO TANDRIDGE FIGURE 53: (2003/04 – 2012/13) 85
COMPLETIONS IN TANDRIDGE (2003/04 – 2012/13) 85 FIGURE 54:
PAST AND PROJECTED POPULATION GROWTH – CROYDON 87 FIGURE 55:
PAST AND PROJECTED POPULATION GROWTH – CROYDON 88 FIGURE 56:
PROJECTED POPULATION GROWTH UNDER A RANGE OF SCENARIOS– FIGURE 57: CROYDON 89
PROJECTED HOUSEHOLD FORMATION RATES BY AGE OF HEAD OF FIGURE 58: HOUSEHOLD – CROYDON 92
PAST AND PROJECTED TRENDS IN AVERAGE HOUSEHOLD SIZE – FIGURE 59: CROYDON 95
PROJECTED NUMBER OF JOBS – CROYDON 98 FIGURE 60:
INDICATIVE INCOME REQUIRED TO PURCHASE/RENT WITHOUT FIGURE 61: ADDITIONAL SUBSIDY 108
DISTRIBUTION OF HOUSEHOLD INCOME IN CROYDON (2013) 109 FIGURE 62:
Strategic Housing Market Assessment, June 2015
Final Report
GL Hearn Page 5 of 183
J:\Planning\Job Files\J032310 - Croydon SHMA\Reports\Croydon SHMA Final June 2015.docx
OVERVIEW OF BASIC NEEDS ASSESSMENT MODEL 110 FIGURE 63:
OVERLAP BETWEEN AFFORDABLE HOUSING TENURES 119 FIGURE 64:
STAGES IN THE HOUSING MARKET MODEL 122 FIGURE 65:
AVERAGE BEDROOMS BY AGE, SEX AND TENURE 124 FIGURE 66:
IMPACT OF DEMOGRAPHIC TRENDS ON MARKET HOUSING FIGURE 67: REQUIREMENTS BY HOUSE SIZE, 2013 TO 2036 126
IMPACT OF DEMOGRAPHIC TRENDS ON AFFORDABLE HOUSING FIGURE 68: REQUIREMENTS BY HOUSE SIZE, 2013 TO 2036 128
SIZE OF HOUSING REQUIRED 2013 TO 2036 129 FIGURE 69:
TENURE OF OLDER PERSON HOUSEHOLDS – CROYDON 138 FIGURE 70:
OCCUPANCY RATING OF OLDER PERSON HOUSEHOLDS – CROYDON 139 FIGURE 71:
POPULATION WITH LTHPD IN EACH AGE BAND 145 FIGURE 72:
POPULATION AGE PROFILE (2011) 149 FIGURE 73:
TENURE BY ETHNIC GROUP – CROYDON 149 FIGURE 74:
OCCUPANCY RATING BY ETHNIC GROUP – CROYDON 150 FIGURE 75:
TENURE OF HOUSEHOLDS WITH DEPENDENT CHILDREN – CROYDON 152 FIGURE 76:
OCCUPANCY RATING AND HOUSEHOLDS WITH DEPENDENT CHILDREN 153 FIGURE 77:
TENURE BY AGE OF HRP – CROYDON 155 FIGURE 78:
ECONOMIC ACTIVITY BY AGE – CROYDON 155 FIGURE 79:
LIST OF TABLES
MAJOR GROSS FLOWS WEIGHTED BY SIZE OF POPULATION (2011) 30 TABLE 1:
MAJOR GROSS FLOWS PER 1000 HEAD OF POPULATION FOR SELECTED TABLE 2: LOCAL AUTHORITIES (2011) 32
MAJOR NET FLOWS IN AND OUT OF CROYDON (2011) 33 TABLE 3:
CONTAINMENT WITHIN CROYDON AND GREATER LONDON (2011) 37 TABLE 4:
DWELLINGS BY TENURE TYPE 53 TABLE 5:
HOUSEHOLDS BY TENURE TYPE 53 TABLE 6:
HOUSEHOLDS BY TENURE TYPE, % CHANGE 2001-2011 54 TABLE 7:

Strategic Housing Market Assessment, June 2015
Final Report
GL Hearn Page 6 of 183
J:\Planning\Job Files\J032310 - Croydon SHMA\Reports\Croydon SHMA Final June 2015.docx
COMPARISON OF LOWER QUARTILE AND MEDIAN AFFORDABILITY (2013) 71 TABLE 8:
CHANGES IN OVER OCCUPIED AND HOUSES IN MULTIPLE OCCUPATION TABLE 9: (2001-2011) 74
PROJECTED HOUSEHOLD GROWTH 2011-21 – CLG 2011-BASED TABLE 10: HOUSEHOLD PROJECTIONS 79
PROJECTED HOUSEHOLD GROWTH 2011-33 – CLG 2008-BASED TABLE 11: HOUSEHOLD PROJECTIONS 79
PROJECTED HOUSEHOLD GROWTH 2013-36 – GLA 80 TABLE 12:
PAST TRENDS IN IN- AND OUT-MIGRATION – CROYDON 84 TABLE 13:
GROWTH IN BME POPULATION (2001-11) 94 TABLE 14:
PROJECTED HOUSEHOLD GROWTH 2013-36 – 2012-BASED SNPP AND TABLE 15: ‘TRACKING’ 2008-BASED CLG HEADSHIP RATES 96
GLA BASED HOUSING NEED (2013-2036) 96 TABLE 16:
COMMUTING PATTERNS IN CROYDON (2011) 98 TABLE 17:
JOBS GROWTH AND CHANGE IN RESIDENT WORKFORCE (2011-36) 99 TABLE 18:
MEETING JOB GROWTH FORECASTS 99 TABLE 19:
LOWER QUARTILE SALES PRICES BY TYPE (Q1 AND Q2 – 2014) 105 TABLE 20:
LOWER QUARTILE PRIVATE RENTS BY SIZE AND LOCATION (YEAR TABLE 21: TO MARCH 2014) 106
MAXIMUM LHA PAYMENTS BY SIZE AND BRMA 106 TABLE 22:
MONTHLY SOCIAL RENT LEVELS 107 TABLE 23:
ESTIMATED NUMBER OF HOUSEHOLDS IN UNSUITABLE HOUSING 112 TABLE 24:
ESTIMATED CURRENT NEED 112 TABLE 25:
ESTIMATED LEVEL OF HOUSING NEED FROM NEWLY FORMING TABLE 26: HOUSEHOLDS (PER ANNUM) 113
ANALYSIS OF PAST SOCIAL/AFFORDABLE RENTED HOUSING SUPPLY TABLE 27: (PER ANNUM - PAST 3 YEARS) 114
SUPPLY OF AFFORDABLE HOUSING 115 TABLE 28:
ESTIMATED LEVEL OF HOUSING NEED (2013-36) 115 TABLE 29:
ESTIMATED LEVEL OF HOUSING NEED (PER ANNUM) AT VARIANT TABLE 30: INCOME THRESHOLDS 116
Strategic Housing Market Assessment, June 2015
Final Report
GL Hearn Page 7 of 183
J:\Planning\Job Files\J032310 - Croydon SHMA\Reports\Croydon SHMA Final June 2015.docx
ESTIMATED LEVEL OF HOUSING NEED (PER ANNUM) BY TYPE OF TABLE 31: AFFORDABLE HOUSING 120
ESTIMATED PROFILE OF DWELLINGS IN 2013 BY SIZE 125 TABLE 32:
ESTIMATED SIZE OF DWELLINGS REQUIRED 2013 TO 2036 – MARKET TABLE 33: HOUSING 126
ESTIMATED SIZE OF DWELLINGS REQUIRED 2013 TO 2036 – TABLE 34: AFFORDABLE HOUSING 128
ESTIMATED DWELLING REQUIREMENT BY NUMBER OF BEDROOMS TABLE 35: (2013 TO 2036) 129
ESTIMATED DWELLING REQUIREMENT BY NUMBER OF BEDROOMS TABLE 36: (2013 TO 2036) 132
MOST APPROPRIATE MIX AFFORDABLE AND MARKET HOMES 132 TABLE 37:
OLDER PERSON POPULATION (2013) 135 TABLE 38:
PROJECTED CHANGE IN POPULATION OF OLDER PERSONS TABLE 39: (2013 TO 2036) 136
PROJECTED CHANGE IN POPULATION OF OLDER PERSONS TABLE 40: (2013 TO 2036) 136
PENSIONER HOUSEHOLDS (CENSUS 2011) 137 TABLE 41:
PENSIONER HOUSEHOLDS WITH OCCUPANCY RATING OF +2 OR MORE TABLE 42: BY TENURE 139
ESTIMATED POPULATION CHANGE FOR RANGE OF HEALTH ISSUES TABLE 43: (2013 TO 2036) 140
ESTIMATED NEED FOR SPECIALIST (EXTRA-CARE) HOUSING 142 TABLE 44:
ANNUAL EXTRA-CARE HOUSING REQUIREMENTS (BY TENURE) 142 TABLE 45:
HOUSEHOLDS AND PEOPLE WITH LONG-TERM HEALTH PROBLEM TABLE 46: OR DISABILITY (2011) 144
BLACK AND MINORITY ETHNIC POPULATION (2011) 147 TABLE 47:
CHANGE IN BME GROUPS 2001 TO 2011 – CROYDON 148 TABLE 48:
HOUSEHOLDS WITH DEPENDENT CHILDREN (2011) 151 TABLE 49:
HOUSEHOLDS WITH NON-DEPENDENT CHILDREN (2011) 154 TABLE 50:
RECOMMENDATIONS REGARDING THE SIZES OF HOMES NEEDED 164 TABLE 51:

Strategic Housing Market Assessment, June 2015
Final Report
GL Hearn Page 8 of 183
J:\Planning\Job Files\J032310 - Croydon SHMA\Reports\Croydon SHMA Final June 2015.docx
Appendices
APPENDIX A: PROJECTION METHODOLOGY AND KEY DATA 168
APPENDIX B: PROJECTED HOUSEHOLD FORMATION RATES BY AGE OF HEAD OF HOUSEHOLD – CROYDON 182

Strategic Housing Market Assessment, June 2015
Final Report
GL Hearn Page 9 of 183
J:\Planning\Job Files\J032310 - Croydon SHMA\Reports\Croydon SHMA Final June 2015.docx
Quality Standards Control
The signatories below verify that this document has been prepared in accordance with our quality control
requirements. These procedures do not affect the content and views expressed by the originator.
This document must only be treated as a draft unless it is has been signed by the Originators and approved
by a Business or Associate Director.
DATE ORIGINATORS APPROVED
June 2015 Paul McColgan, Associate Director Nick Ireland
Aled Barcroft, Assistant Planner Planning Director
Limitations
This document has been prepared for the stated objective and should not be used for any other purpose
without the prior written authority of GL Hearn; we accept no responsibility or liability for the consequences of
this document being used for a purpose other than for which it was commissioned.
Strategic Housing Market Assessment, June 2015
Final Report
GL Hearn Page 10 of 183
J:\Planning\Job Files\J032310 - Croydon SHMA\Reports\Croydon SHMA Final June 2015.docx
1 INTRODUCTION
Context and Purpose
Croydon Council has commissioned GL Hearn to prepare a replacement Strategic Housing Market 1.1
Assessment (SHMA) for the Borough. The SHMA supersedes the Croydon Local Housing Market
Assessment 2008 (January 2010).
The SHMA considers the overall need for housing, for different types of housing and the housing 1.2
needs arising from different groups within the community.
The Council’s Local Plan currently comprises two documents – Strategic Policies, which were 1.3
adopted in 2013; and Detailed Policies and Proposals, the development of which is currently
underway. The Council has however initiated a Partial Review of the Strategic Policies Document,
amongst other things to:
• Take account of the Further Alterations to the London Plan (FALP) 2014;
• Set out revised housing targets for Croydon taking this into account; and
• Review affordable housing requirements, including tenure mix and dwelling type.
The replacement SHMA has been prepared to support this Partial Review. 1.4
The preparation of the SHMA has followed relevant national policy and guidance, specifically: 1.5
• National Planning Policy Framework1;
• National Planning Practice Guidance on Housing and Economic Development Needs
Assessments2.
It has also taken account of the London Strategic Housing Market Assessment 20133, which has 1.6
been prepared by the Greater London Authority (GLA) and forms part of the evidence base for the
FALP. The report however provides a more detailed look at housing need, including demographic
projections, for Croydon.
The analysis presented focuses on providing outputs for the London Borough of Croydon as a 1.7
whole. However for key indicators, distinctions between different parts of the Borough are drawn out
through GIS mapping.
National Planning Policy Framework (NPPF)
The National Planning Policy Framework (NPPF) was published in March 2012. The Framework 1.8
sets a presumption in favour of sustainable development whereby local plans should meet
1 CLG (March 2012) National Planning Policy Framework
2 http://planningguidance.planningportal.gov.uk/blog/guidance/housing-and-economic-development-needs-assessments/
3 Mayor of London (Jan 2014) The London Strategic Housing Market Assessment 2013
Strategic Housing Market Assessment, June 2015
Final Report
GL Hearn Page 11 of 183
J:\Planning\Job Files\J032310 - Croydon SHMA\Reports\Croydon SHMA Final June 2015.docx
objectively assessed development needs, with sufficient flexibility to respond to rapid change,
unless the adverse impacts of doing so would significantly or demonstrably outweigh the benefits or
policies within the Framework indicate that development should be restricted.
The NPPF highlights the Strategic Housing Market Assessment (SHMA) as a key piece of evidence 1.9
in determining housing needs. Paragraph 159 in the Framework outlines that this should identify the
scale and mix of housing and the range of tenures which the local population is likely to need over
the plan period which:
• Meets household and population projections, taking account of migration and demographic
change;
• Addresses the need for all types of housing, including affordable housing and the needs of
different groups in the community; and
• Caters for housing demand and the scale of housing supply necessary to meet this demand.
This is reaffirmed in the NPPF in Paragraph 50. The SHMA is intended to be prepared for the 1.10
housing market area, and include work and dialogue with neighbouring authorities where the HMA
crosses administrative boundaries.
Paragraph 158 of the NPPF also emphasises the alignment of the housing and economic evidence 1.11
base and policy. Paragraph 17 in the NPPF reaffirms this, and outlines that planning should also
take account of market signals, such as land prices and housing affordability. However it also
makes clear that plans must be deliverable.
Paragraph 181 sets out that Local Planning Authorities (LPAs) will be expected to demonstrate 1.12
evidence of having effectively cooperated to plan for issues with cross-boundary impacts when their
Local Plans are submitted for examining. This highlights the importance of collaborative working
and engaging constructively with neighbouring authorities, as required by Section 33A of the 2004
Planning and Compulsory Purchase Act, and ensuring that there is a robust audit trail showing joint
working to meet the requirements of paragraph 181 of the NPPF.
Local plans must be ‘sound.’ The NPPF sets out that this means that they must be positively 1.13
prepared, justified, effective and consistent with national policy. This is tested by an independent
inspector through the plan examination process. To be positively prepared, a Plan “should be
prepared based on a strategy which seeks to meet objectively assessed development and
infrastructure requirements, including unmet needs from neighbouring authorities where it is
reasonable to do so and consistent with achieving sustainable development.” Thus local authorities
in preparing plans must seek to work with their neighbours to consider whether there are unmet
needs in one area which could be met within another.
Strategic Housing Market Assessment, June 2015
Final Report
GL Hearn Page 12 of 183
J:\Planning\Job Files\J032310 - Croydon SHMA\Reports\Croydon SHMA Final June 2015.docx
In considering future housing provision, the SHMA is intended to be brought together with evidence 1.14
of land availability, from a Strategic Housing Land Availability Assessment. To increase housing
supply, the NPPF sets out that local authorities are required to maintain a 5 year supply of specific
deliverable sites, and to include an allowance of 5% to ensure choice and competition in the market
for land (unless there is a persistent track record of under-delivery in which case a buffer of 20%
applies).
In regard to housing mix, the NPPF sets out that local authorities should plan for a mix of housing 1.15
based on current and future demographic trends, market trends and the needs of different groups in
the community. Planning authorities should identify the size, type, tenure and range of housing that
is required in particular locations reflecting local demand. Where a need for affordable housing is
identified, authorities should set policies for meeting this need on site. National thresholds for
affordable housing provision are removed as are national brownfield development targets.
In setting affordable housing targets, the NPPF states that to ensure a plan is deliverable, the sites 1.16
and the scale of development identified in the plan should not be subject to a scale of obligations
and policy burdens such that their ability to be developed is threatened and should support
development throughout the economic cycle. The costs of requirements likely to be applied to
development, including affordable housing requirements, contributions to infrastructure and other
policies in the Plan, should not compromise the viability of development schemes.
The SHMA focuses on assessing housing need. In setting policies for affordable housing provision, 1.17
this would need to be brought together with evidence regarding the economic viability of
development in the Borough.
National Planning Practice Guidance
New Planning Practice Guidance was issued by Government in March 2014. This includes 1.18
Guidance on ‘Assessment of Housing and Economic Development Needs’. This is relevant to this
report in that it provides clarity on how key elements of the NPPF should be interpreted, including
the approach to deriving an objective assessment of the need for housing. The approach in this
report follows that in the Planning Practice Guidance (PPG).
The Guidance defines “need” as referring to ‘the scale and mix of housing and the range of tenures 1.19
that is likely to be needed in the housing market area over the plan period – and should cater for the
housing demand of the area and identify the scale of housing supply necessary to meet this need.’
It sets out that the assessment of need should be realistic in taking account of the particular nature
of that area, and should be based on future scenarios that could be reasonably expected to occur. It

Strategic Housing Market Assessment, June 2015
Final Report
GL Hearn Page 13 of 183
J:\Planning\Job Files\J032310 - Croydon SHMA\Reports\Croydon SHMA Final June 2015.docx
should not take account of supply-side factors or development constraints. Specifically the
Guidance sets out that:
“plan makers should not apply constraints to the overall assessment of need, such as
limitations imposed by the supply of land for new development, historical under performance,
infrastructure or environmental constraints. However these considerations will need to be
addressed when bringing evidence bases together to identify specific policies within
development plans.”
Against this context it is important to recognise that the SHMA assessed need for housing. It does 1.20
not set housing targets – which need to take account both of unmet needs from other areas and
other factors including development constraints and delivery of supporting infrastructure.
The Guidance outlines that estimating future need is not an exact science and that there is no one 1.21
methodological approach or dataset which will provide a definitive assessment of need. However,
the starting point for establishing the need for housing should be the latest household projections
published by the Department for Communities and Local Government (CLG). At the time of
preparation of this report these the latest projections are the 2011-based ‘Interim’ Household
Projections4. It also outlines that the latest population projections should be considered. These are
the 2012 Sub-National Population Projections published by ONS in May 2014.
It sets out that there may be instances where these national projections require adjustment to take 1.22
account of factors affecting local demography or household formation rates, in particular where
there is evidence that household formation rates are or have been constrained by supply.
It suggests that proportional adjustments should be made where the market signals point to supply 1.23
being constrained relative to long-term trends or to other areas in order to improve affordability.
Evidence of affordable housing needs is also relevant, with the Guidance suggesting that the total 1.24
affordable housing need should be considered in the context of its likely delivery as a proportion of
mixed market and affordable housing. In some instances it suggests this may provide a case for
increasing the level of overall housing provision.
In regard to employment trends, the Guidance indicates that job growth trends and/or economic 1.25
forecasts should be considered having regard to the growth in working-age population in the
housing market area. It sets out that where the supply of working age population that is
economically active (labour force supply) is less than the projected job growth, this could result in
unsustainable commuting patterns (depending on public transport accessibility and other
sustainable options such as walking and cycling) and could reduce the resilience of local
4 CLG (April 2013) 2011-based Interim Household Projections

Strategic Housing Market Assessment, June 2015
Final Report
GL Hearn Page 14 of 183
J:\Planning\Job Files\J032310 - Croydon SHMA\Reports\Croydon SHMA Final June 2015.docx
businesses. In such circumstances, plan makers will need to consider how the location of new
housing and infrastructure development could help to address these problems.
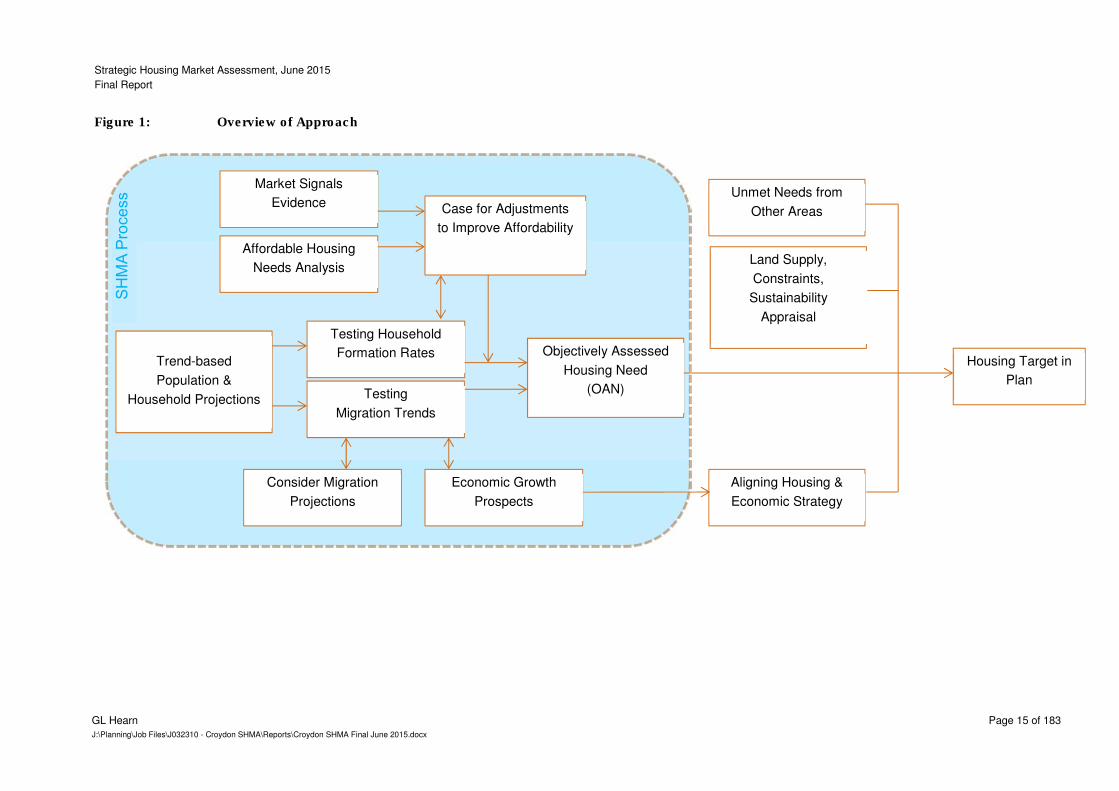
Overview of the Approach to Deriving OAN
The NPPF and PPG set out a clear approach to defining the objectively-assessed need (OAN) for 1.26
housing. We have sought to summarise this within the diagram below, Figure 1. This summarises
the approach we have used to considering OAN.
Strategic Housing Market Assessment, June 2015
Final Report
GL Hearn Page 15 of 183
J:\Planning\Job Files\J032310 - Croydon SHMA\Reports\Croydon SHMA Final June 2015.docx
Overview of ApproachFigure 1:
Trend-based
Population &
Household Projections Testing Migration Trends
Testing Household
Formation Rates
Market Signals
Evidence
Affordable Housing
Needs Analysis
Case for Adjustments
to Improve Affordability
Economic Growth
Prospects Consider Migration
Projections
Objectively Assessed
Housing Need (OAN)
Aligning Housing &
Economic Strategy
Land Supply,
Constraints,
Sustainability
Appraisal
Unmet Needs from
Other Areas
Housing Target in
Plan
SH
MA
Pro
ce
ss

Strategic Housing Market Assessment, June 2015
Final Report
GL Hearn Page 16 of 183
J:\Planning\Job Files\J032310 - Croydon SHMA\Reports\Croydon SHMA Final June 2015.docx
Report Structure
Following this introductory section the remainder of the Croydon Strategic Housing Market 1.27
Assessment is structured as follows:
• Section 2 - Strategic Context for Housing in London;
• Section 3 – Housing Market Linkges;
• Section 4 - Defining the HMA;
• Section 5 - Understanding Croydon’s Housing Market;
• Section 6 - Housing Market Dynamics and Market Signals;
• Section 7 - Overall Housing Need;
• Section 8 - Affordable Housing Need;
• Section 9 - Need for Different Types of Housing;
• Section 10 - Housing Needs of Particular Groups; and
• Section 11 – Conclusions
The report is also accompanied by the following appendices which provide detailed contextual 1.28
information. These comprise:
• Appendix 1: Projection Methodology and Key Data;

Strategic Housing Market Assessment, June 2015
Final Report
GL Hearn Page 17 of 183
J:\Planning\Job Files\J032310 - Croydon SHMA\Reports\Croydon SHMA Final June 2015.docx
2 STRATEGIC CONTEXT FOR HOUSING IN LONDON
Local plans within London must be in general conformity with the London Plan, and it is thus 2.1
appropriate to start out by considering the Mayor of London’s policies for housing provision. In this
section we thus review:
• The Further Alterations to the London Plan (Jan 2014); and
• Homes for London: the London Housing Strategy (Draft, April 2014)5.
Further Alternations to the London Plan
The Mayor intend to publish Further Alterations to the London Plan (the ‘FALP’) in January 2014. 2.2
Once adopted, the FALP will form part of the development plan against which planning applications
are assessed.
The FALP sets out that London should be treated as a single housing market, but recognises that 2.3
housing market linkages extend beyond London – underscoring the importance of inter-regional
coordination in meeting housing requirements in the wider south east.
Housing Targets
The FALP proposes a minimum target for 423,887 homes in London between 2015-25 which 2.4
translates into a minimum annual monitoring target of 42,389 homes per annum. This is principally
driven by the 2013 London Strategic Housing Land Availability Assessment (SHLAA) which
identified capacity for at least 420,000 homes per annum. The target is to be reviewed by 2019/20.
This level of provision falls short of identified housing needs. The central projection within the 2013 2.5
London SHMA indicated a need for between approximately 49,000 (2015-36) and 62,000 (2015-26)
more homes a year in the capital. The range reflects the different levels of population change over
the two periods indicated, the time taken to reduce the current (backlog) housing need and the
anticipated under-delivery between 2011-15. The Plan is based on a core demographic projection
for 40,000 more households a year between 2011-36 – based on the GLA’s 2013 Central Projection
for Population and household formation rates from the 2011-based CLG Household Projections.
The FALP identifies (in Table 3.1) a minimum 10 year target for provision of 14,348 homes in 2.6
London Borough of Croydon (LB Croydon), with an annual monitoring target of 1,435 homes per
annum (pa). However it is clear in Policy 3.3 that this “should be augmented where possible with
extra housing capacity to close the gap between identified housing need and supply in line with the
requirement of the NPPF.” The policy specifically encourages boroughs to identify and seek to
enable additional development capacity to be brought forward which supplements these targets
5 Mayor of London (April 2014) Homes for London: the London Housing Strategy
Strategic Housing Market Assessment, June 2015
Final Report
GL Hearn Page 18 of 183
J:\Planning\Job Files\J032310 - Croydon SHMA\Reports\Croydon SHMA Final June 2015.docx
(having regard to other policies in the Plan) such as through intensification, town centre renewal,
opportunity and intensification and growth corridors, mixed use development and sensitive renewal
of existing residential areas – particularly in areas of good public transport accessibility. To fit local
plan timeframes, it supports the ‘roll forward’ of annual average figures where appropriate.
The implication is that in taking forward the Partial Review of the Strategic Policies DPD, Croydon 2.7
Council the FALP requirement for 1,435 homes per annum is a minimum figure and the Council
should seek to maximise housing delivery taking account of the Borough’s ‘sustainable capacity.’
Types of Homes
The FALP provides quite detailed guidance regarding the types of homes expected to be built – 2.8
setting out density and space standards, and policies regarding housing mix and affordable housing
provision.
Developments are expected to optimise housing output, taking account of location; local context 2.9
and character; design principles; and public transport capacity. Table 3.2 provides a density matrix
linked to the setting and Public Transport Accessibility Rating (PTAL) of the site.
Minimum space standards for development in terms of floorspace per square metre (GIA) are set 2.10
out in Table 3.3.
Policy 3.11 deals with affordable housing. This sets out that the Mayor, boroughs and other relevant 2.11
agencies/partners should maximise affordable housing provision, with:
• An average target of at least 17,000 homes (which is equivalent to 40% of the FALP minimum
targets);
• A tenure mix whereby 60% is of social or affordable rented provision and 40% for intermediate
rent or sale; and
• A priority is given to provision of affordable family housing.
Boroughs are required in LDFs to set an overall target for affordable housing provision and 2.12
separate targets in social/ affordable rent, and intermediate housing. Affordable housing targets can
be expressed in absolute or percentage terms in light of local circumstances, but must take account
of economic viability and other relevant considerations (listed in Policy 3.12). In general a threshold
of 10 or more homes is considered ‘normal’ although Boroughs can seek a lower thresholds where
this can be justified (Policy 3.13).
The FALP sets out in Policy 3.8 that new developments should offer a range of housing choices, in 2.13
terms of the mix of housing sizes and types, taking account of the housing requirements of different
groups and the changing roles of different sectors. It particularly promotes delivery of social/
Strategic Housing Market Assessment, June 2015
Final Report
GL Hearn Page 19 of 183
J:\Planning\Job Files\J032310 - Croydon SHMA\Reports\Croydon SHMA Final June 2015.docx
affordable rented family housing, institutional investment in the Private Rented Sector (PRS) and
enhanced provision of intermediate affordable housing.
The policy also sets out that all new housing should be built to Lifetime Homes standards and 10% 2.14
is designed to be wheelchair accessible or easily adaptable for wheelchair users. This responds to
expected growth in the older population; as well as a current unmet need for from 30,000
households for wheelchair accessible housing and more than 100,000 for redesigned bathing
facilities.
It also requires account to be taken of a growing older population, the needs of particular 2.15
communities, and student housing needs; together with appropriate provision to be made for
accommodation for service families and custom build having regard to local need. This SHMA
Report provides evidence of the needs of these groups within Croydon to inform local policies.
The FALP identifies that between 2015-25 older Londoners may require 3,600 – 4,200 new 2.16
specialist units per annum. More specifically (based on the midpoint of this range) it identifies a
need for 2,600 private units pa, 1,000 in shared ownership and some 300 new affordable units; and
indicates that there may also (in addition) be a requirement for 400-500 new bedspaces pa in care
homes. Indicative requirement benchmarks are set out in Annex A5 to the Plan. In delivery terms, it
notes that it is important that viability assessment take into account the distinct economics of
specialist housing and care home provision.
The FALP sets out that “the planning system must take a more positive approach in enabling [the 2.17
private rented] sector to contribute to achievement of housing targets.” Whilst outlining that the
Mayor will continue to work to encourage institutional investment in the sector, it notes that viability
tests for covenanted PRS should take account of the distinct economics of this form of development.
The FALP also promotes mixed and balanced communities, by tenure and household income, 2.18
particularly in neighbourhoods where there is a predominance of social rented housing.
The London Housing Strategy
Homes for London, the Draft London Housing Strategy (April 2014), sets out the Mayors strategy 2.19
for tackling the housing crisis in London. The overriding aim of the strategy are to increase the
supply of housing of all tenures and to ensure that these homes better support London’s continued
economic success. The key priorities were set out as following:
• Increasing housing supply to levels not seen since the 1930s;
• Better supporting working Londoners and helping more of them into home ownership;
• Improving the private rented sector and promoting new purpose - built and well managed private
rented housing;
Strategic Housing Market Assessment, June 2015
Final Report
GL Hearn Page 20 of 183
J:\Planning\Job Files\J032310 - Croydon SHMA\Reports\Croydon SHMA Final June 2015.docx
• Pushing for a new, long-term financial settlement for London Government to drive housing
delivery; and
• Bringing forward land for development and accelerating the pace of housing delivery through
Housing Zones and the London Housing Bank
The strategy sets out an annual delivery target of a minimum of 42,000 new homes, of which at 2.20
least 17,000 (40%) should be affordable. Over the next 20 years this amounts to 840,000 new
homes in total.
The strategy will increase the provision of smaller affordable homes targeted at those downsizing, 2.21
support purpose-built older people’s housing and offer better incentives for older people to
downsize. This is in order to tackle overcrowding, particularly in the social rented stock.
The Strategy also recognises that London’s housing market is complex and diverse and there is not 2.22
a homogenous housing market within any single borough boundary. It contains a range of sub-
markets which vary widely, not just by tenure and price, but by the type of purchaser and renter.

Strategic Housing Market Assessment, June 2015
Final Report
GL Hearn Page 21 of 183
J:\Planning\Job Files\J032310 - Croydon SHMA\Reports\Croydon SHMA Final June 2015.docx
3 HOUSING MARKET LINKAGES
The London Strategic Housing Market Assessment 2013 sets out that London is a Global City. The 3.1
strength of its economy, its cultural attractions and its history as a city open to newcomers make it a
magnet for international migrants, with around 200,000 international migrants moving to London
each year, and 100,000 moving abroad. It also seeks significant movement of people from other
parts of the UK, the SHMA indicating that:
“London plays a unique role in the national economy, functioning as an ‘escalator region’ for
the whole country, enabling those who come here (as well as lifelong Londoners) to improve
their skill and increase their earnings at a faster rate than any other part of the country. This
unique role helps explain London’s unusually young age profile, high rate of population churn
and large private rented sector. The evidence also indicates that most UK-born Londoners
were born outside London6.”
The London SHMA recognises that London’s housing market extends beyond London’s boundaries 3.2
but does not seek to specifically define this, noting that “recent research has sought to identify
housing market areas using data on commuting and migration, but the boundaries identified are
highly sensitive to the specific level of containment used.”7
A more recent report by consultants NLP on London’s Unmet Housing Needs8 has considered 3.3
house prices, migration flows and commuting (based on areas where more than 2.5% of residents
commute to London) to suggest that London’s ‘wider’ housing market stretches north to Bedford
and Huntingdon, west beyond Reading and Newbury and to the South Coast (Figure 2).
6 Mayor of London (Jan 2014) London Strategic Housing Market Assessment, Para 2.4
7 Mayor of London (Jan 2014) London Strategic Housing Market Assessment, Para 2.7
8 NLP (April 2014) London’s Unmet Housing Needs – Meeting London’s overspill across the wider South East
Strategic Housing Market Assessment, June 2015
Final Report
GL Hearn Page 22 of 183
J:\Planning\Job Files\J032310 - Croydon SHMA\Reports\Croydon SHMA Final June 2015.docx
NLP’s View regarding London’s ‘wider’ Housing Market Figure 2:
Source: NLP, 2014
A range of other evidence has highlighted the capitals influence across much of the South East, 3.4
including the recently released Census travel to work data. As illustrated below the travel to work
catchment for the City and Westminster extends beyond Greater London and as far as the South
Coast. However, the extent of the influence is largely dependent on the containment rate (the
number of people who live and work in a given area) used.
London HMA London Boroughs
Strategic Housing Market Assessment, June 2015
Final Report
GL Hearn Page 23 of 183
J:\Planning\Job Files\J032310 - Croydon SHMA\Reports\Croydon SHMA Final June 2015.docx
Travel to Work Catchment of Westminster and the City (2011) Figure 3:
Source: Census 2011
This study accepts that Croydon operates within this wider London context and seeks to consider 3.5
and identify the more localised market(s) in which the Borough operates. In order to do this we have
reviewed various studies looking at housing market geographies at a national and local level as well
as more recent data.
CLG/ CURDS Study
National research undertaken for the Government by a consortium of academics led by the Centre 3.6
for Urban and Regional Development Studies (CURDS) at Newcastle University has sought to
define housing markets across England. As the PAS Guidance recommends, we have used this as
a ‘starting point’ for considering the HMA geography.
The CURDS study considered commuting and migration dynamics (based on 2001 Census data) 3.7
and house prices (standardised for differences in housing mix and neighbourhood characteristics).
This information was brought together to define a three tiered structure of housing markets, as
follows:
• Strategic (Framework) Housing Markets – based on 77.5% commuting self-containment;
• Local Housing Market Areas – based on 50% migration self-containment; and
Strategic Housing Market Assessment, June 2015
Final Report
GL Hearn Page 24 of 183
J:\Planning\Job Files\J032310 - Croydon SHMA\Reports\Croydon SHMA Final June 2015.docx
• Sub-Markets – which would be defined based on neighbourhood factors and house types.
The Strategic and Local HMAs are mapped across England, with the Local HMAs embedded within 3.8
the wider Strategic HMAs. Both are defined based on wards.
London’s Strategic Housing Market was identified as extending well beyond the M25 into the Home 3.9
Counties in all directions, to include Guildford, Reigate, Tunbridge Wells, the Medway Towns,
Southend, Amersham and Stevenage. In our view a national analysis of house prices would tend to
support this, showing the influence of transport links into London which extends well beyond
Greater London into the South East and East of England regions.
It is clear that Croydon operates within this wider London context. We have therefore sought to 3.10
consider and identify the more localised market(s) in which the Borough operates. In order to do
this we have reviewed various studies looking at housing market geographies at a national and
local level as well as more recent data.
CLG/ CURDS Study
National research undertaken for the Government by a consortium of academics led by the Centre 3.11
for Urban and Regional Development Studies (CURDS) at Newcastle University has sought to
define housing markets across England. As the PAS Guidance recommends, we have used this as
a ‘starting point’ for considering the HMA geography.
The CURDS Study for CLG considers commuting and migration dynamics (based on 2001 Census 3.12
data) and house prices (standardised for differences in housing mix and neighbourhood
characteristics). This information was brought together to define a three tiered structure of housing
markets, as follows:
• Strategic (Framework) Housing Markets – based on 77.5% commuting self-containment (the
number of people who live and work in an area);
• Local Housing Market Areas – based on 50% migration self-containment; and
• Sub-Markets – which would be defined based on neighbourhood factors and house types.
The Strategic and Local HMAs are mapped across England, with the Local HMAs embedded within 3.13
the wider Strategic HMAs. Both are defined based on wards. Although these housing market areas
are based on 2001 data they provide a good basis for which to examine and update the
geographies.
The Study defines a London Framework HMA which extends into the Home Counties. In our view a 3.14
national analysis of house prices would tend to support this, showing the influence of transport links
into London which extends well beyond Greater London into the South East and East of England
regions.
Strategic Housing Market Assessment, June 2015
Final Report
GL Hearn Page 25 of 183
J:\Planning\Job Files\J032310 - Croydon SHMA\Reports\Croydon SHMA Final June 2015.docx
CURDS-Defined London Framework HMA Figure 4:
Source: CURDS
There is a long established trend of migration into London from across the UK and abroad, with net 3.15
movement out of London into the Home Counties. In our view this movement out of London is
influenced both by quality of place/ lifestyle factors and by housing costs, and is most apparent for
family households.
The CURDS Study identifies that the use of local housing market areas are particularly relevant in 3.16
housing markets which include a major urban area, setting out:
“Without a tiered perspective a focus on large Framework HMAs any local areas of very high
and very low house prices will also run the risk of producing an averaged out value which
fails to diagnose the dynamics of local changes in the housing market.
The more fine-grained differentiation of multiple housing markets within a major urban area
will also be missed – the latter is most obvious in London where much of Greater London is
identified as a large Framework HMA. It is in such areas that an additional lower-tier
geography can reflect more localised housing market conditions, and it is notable that in such
areas that separate lower-tier HMAs are mostly identified.”
In respect of the use of the lower-tier local HMAs, the CURDS Study goes on to comment that “a 3.17
tiered geography links to both national/ cross-regional and more strategic sub-regional analysis

Strategic Housing Market Assessment, June 2015
Final Report
GL Hearn Page 26 of 183
J:\Planning\Job Files\J032310 - Croydon SHMA\Reports\Croydon SHMA Final June 2015.docx
whilst, at the same time, providing a sufficiently fine-grained basis for more locally based analysis
and policy formulation in respect of, for example, issues relating to affordability and/or to Core
Strategy / LDF preparation and monitoring by individual local planning authorities.”
Considering the CURDs Defined Local HMA, Croydon is located in a South London Housing Market. 3.18
This market extends beyond the Greater London Boundary into Tandridge in Surrey and a very
small part of Mid Sussex around East Grinstead. The South London LHMA is a fairly linear strip and
is distinct from the South Central and South West London LHMA which neighbour it.
CURDS-Defined Local Housing Market Areas Figure 5:
Source: CURDS
In summary, on a single-tier basis CURDS believe the Borough relates to the London Housing 3.19
market. Looking at more local housing markets then the South London Market is applicable. On a
more practical basis it is necessary to assign Boroughs to a single grouping, in which case we
would include also include Tandridge as part of this local housing market.
London SHMAs
The Greater London Authority recently produced a city wide Strategic Housing Market Assessment 3.20
(January 2014). However, the SHMA does not define any sub-regions within the city. That said,
previous SHMA studies have been conducted at a sub-regional level covering the North, East, West,

Strategic Housing Market Assessment, June 2015
Final Report
GL Hearn Page 27 of 183
J:\Planning\Job Files\J032310 - Croydon SHMA\Reports\Croydon SHMA Final June 2015.docx
South East and South West of London, although these were not necessarily the housing market
areas identified. These sub-regional areas are illustrated in the map below.
The most relevant of these sub-regional studies is the South West London SHMA which was 3.21
produced by Ecotec in August 2009. This covered an area which included the Borough of Croydon
as well as Sutton, Merton, Kingston, Richmond, Wandsworth and Lambeth.
Areas Covered by Sub-Regional SHMAs in London Figure 6:
Source: GL Hearn, 2014
Outside of Greater London, Tandridge, which was identified by CURDS as part of a South London 3.22
LHMA, was most recently included as part of an East Surrey Housing Market Area (2008).
Broad Rental Market Area
The Valuation Office Agency (VOA) also define Broad Rental Market Areas (BRMA) which are the 3.23
geographical areas used to determine Local Housing Allowance (LHA) rates. These can be likened
to Housing Market Areas they are not identified on the basis of the practice guidance i.e. migration,
travel to work patterns nor house price changes.
The Broad Rental Market Areas are based on an area where a person could reasonably be 3.24
expected to live taking into account access to facilities and services for the purposes of health,

Strategic Housing Market Assessment, June 2015
Final Report
GL Hearn Page 28 of 183
J:\Planning\Job Files\J032310 - Croydon SHMA\Reports\Croydon SHMA Final June 2015.docx
education, recreation, personal banking and shopping. The areas are defined by looking at these
services and the ease to which residents can visit them via a variety of transport modes.
According to the VOA, Croydon falls within the Outer South London BRMA, which stretches across 3.25
a wide area of South London. The area includes much of the Boroughs of Croydon, Sutton and
Epsom and Ewell as well as parts of Kingston, Merton, Reigate and Banstead and Tandridge.
Outer South London Broad Rental Market Area Figure 7:
Source: VOA
In summary, the range of historical sources has identified Croydon within the wider London 3.26
framework. There has also been more specific links identified to varying degrees with Tandridge,
Sutton, Epsom and Ewell and Reigate and Banstead.
However, these previous housing market area studies have principally been based on either the 3.27
London Boundaries or have interrogated the 2001 Census data where analysis has been
undertaken below local authority level. Data on commuting and migration flows from the 2011
Census was issued in July 2014, and it is thus an appropriate point at which to review housing
market geographies.
Strategic Housing Market Assessment, June 2015
Final Report
GL Hearn Page 29 of 183
J:\Planning\Job Files\J032310 - Croydon SHMA\Reports\Croydon SHMA Final June 2015.docx
4 DEFINING THE HMA
The National Planning Policy Framework (NPPF) states that local planning authorities should use 4.1
their evidence base to ensure Local Plans meet the full, objectively assessed needs for market and
affordable housing in their housing market area (HMA).
In simple terms, the HMA is a geographical area in which the majority of people, who move, will 4.2
move within. It also reflects functional relationships between where people live and work. However,
defining housing market areas is an inexact science and there is no single source of information
that will clearly identify housing market areas.
As outlined above, previous attempts to identify the Housing Market Areas have shown that the 4.3
Croydon are clearly linked to London with notable although lesser links with Surrey. However, the
CURDS report recommends that we look at more localised housing market areas within areas close
to major urban areas. This section of the report considers key data to identify local housing markets.
In line with the recent PAS Advice note we have produced our own top-down analysis focusing on 4.4
the major settlements and employment centres in the sub-region. We have reviewed both the
catchments of the major centres in and around Croydon, as well as the major commuting and
migration flows to and from Croydon.
Migration Patterns
Migration data from the 2011 census has thus far only been published at a local authority level. 4.5
Migration patterns reflect the location of residents one year prior to the completion of the census.
The main analysis is to review both net and gross flows. Net flows identify the direction of
movement with gross flows highlighting the strength of inter-connectedness.
In total approximately 16,900 people left Croydon in the year leading up to the Census. Over the 4.6
same period 17,200 people arrived in the Borough. This reflects a modest level of in migration into
the district. In addition, approximately 20,200 people moved within the Borough over the same
period.
By reviewing gross flows (the sum of movements in both directions) we can see the strength of 4.7
relationships between Croydon with other local authorities. Perhaps unsurprisingly the data
identifies significant flows with all the neighbouring authorities.
As the map overleaf indicates the most significant inter-relationships are with Lambeth (3,882 4.8
persons per annum), Bromley (2,563 ppa) and Sutton (2,190 ppa). However, we would expect there
to be higher flows from areas with a higher population such as the other London Boroughs.

Strategic Housing Market Assessment, June 2015
Final Report
GL Hearn Page 30 of 183
J:\Planning\Job Files\J032310 - Croydon SHMA\Reports\Croydon SHMA Final June 2015.docx
Major Gross Migration Flows (2011) Figure 8:
Source: ONS, 2011
To negate the impact of larger population centres we have also weighted the flows based on the 4.9
total size of the population in both local authority e.g. gross flows per 1,000 head of population. As
outlined in the following table and map, the largest flows are still with Lambeth.
Major Gross Flows Weighted by Size of Population (2011) Table 1:
Croydon Gross per 1,000 head
Lambeth 5.82
Sutton 3.96
Tandridge 3.90
Bromley 3.81
Merton 3.43
Wandsworth 2.55
Lewisham 2.16
Reigate and Banstead 1.99
Southwark 1.79
Source: ONS, 2011
The links to Bromley are less important when weighted in this manner although still noticeable. In 4.10
contrast the importance of the Tandridge inter-relationship is increased. This ratifies the CURDS

Strategic Housing Market Assessment, June 2015
Final Report
GL Hearn Page 31 of 183
J:\Planning\Job Files\J032310 - Croydon SHMA\Reports\Croydon SHMA Final June 2015.docx
local housing market area links. There are also significant links with the other South London
Boroughs of Merton and Sutton.
Major Gross Migration Flows Per Head (2011) Figure 9:
Source: ONS, 2011
While there are clear links between Croydon and Lambeth, Sutton, Bromley and Tandridge, we also 4.11
must understand the extent to which Croydon represents a key driver to the migration dynamics in
those particular authorities.
As Table 2, shows each of the local authorities has relatively significant links with Croydon, 4.12
however their most significant relationships are with other local authorities. This is particularly the
case with Lambeth whose major links are with Wandsworth and Southwark are much more
significant than those with Croydon.
Strategic Housing Market Assessment, June 2015
Final Report
GL Hearn Page 32 of 183
J:\Planning\Job Files\J032310 - Croydon SHMA\Reports\Croydon SHMA Final June 2015.docx
Major Gross Flows per 1000 head of population for Selected Local Authorities Table 2:
(2011)
Lambeth Gross Per '000 Head
Sutton
Gross Per '000 Head
Tandridge
Gross Per '000 Head
Bromley
Gross Per '000 Head
Wandsworth 13.78 Merton 6.04 Reigate & Banstead 4.35 Lewisham 6.41
Southwark 11.47 Epsom and Ewell 4.06 Croydon 3.90 Croydon 3.81
Croydon 5.82 Croydon 3.96 Mid Sussex 2.28 Greenwich 2.92
Merton 4.01 Reigate & Banstead 3.65 Sevenoaks 1.61 Sevenoaks 2.69
Lewisham 3.87
Kingston upon Thames 2.26 Crawley 1.08 Lambeth 2.31
Westminster & City of London 3.31 Wandsworth 2.05 Sutton 0.82 Southwark 2.24
Islington 3.30 Lambeth 1.12 Mole Valley 0.81 Bexley 2.19
Hammersmith & Fulham 3.19 Tandridge 0.82 Bromley 0.77 Dartford 1.13
Tower Hamlets 2.98 Mole Valley 0.79 Wandsworth 0.61 Wandsworth 1.04
Camden 2.95 Elmbridge 0.49 Horsham 0.53 Tonbridge & Malling 0.95
Source: ONS, 2011
Similarly, although not to the same extent Sutton and Bromley have much stronger relationships 4.13
with Merton and Lewisham respectively than they do with Croydon. Sutton’s relationship with
Epsom and Ewell is also stronger than that with Croydon.
Tandridge is less clear however as the links to Reigate and Banstead are of a similar scale to that 4.14
of Croydon. However the relationship between Croydon and Tandridge is one of significant out
commuting from Croydon. Unlike Tandridge’s links to Reigate and Banstead which are largely both
ways. The net flows are illustrated in the map below.
Strategic Housing Market Assessment, June 2015
Final Report
GL Hearn Page 33 of 183
J:\Planning\Job Files\J032310 - Croydon SHMA\Reports\Croydon SHMA Final June 2015.docx
Major Net Migration Flows (2011) Figure 10:
Source: ONS, 2011
Looking more closely at net migration flows, there is a clear pattern of in commuting from the 4.15
London Boroughs into Croydon and out-commuting to those local authorities in Surrey, West
Sussex and Kent.
Major Net Flows In and Out of Croydon (2011) Table 3:
Local Authority Net In Local Authority Net Out
Lambeth 1,348 Tandridge -443
Merton 503 Reigate and Banstead -282
Wandsworth 468 Crawley -115
Lewisham 361 Nottingham -95
Southwark 342 Mid Sussex -92
Sutton 200 Brighton and Hove -88
Haringey 111 Arun -78
Brent 95 Portsmouth -77
Newham 76 Eastbourne -77
Source: ONS, 2011
Strategic Housing Market Assessment, June 2015
Final Report
GL Hearn Page 34 of 183
J:\Planning\Job Files\J032310 - Croydon SHMA\Reports\Croydon SHMA Final June 2015.docx
Travel to Work
As with the migration data and the previous HMA studies the influence of London on commuting 4.16
patterns is quite clear. At present around 36.8% of residents in Croydon commute to Inner London.
This is also reflected in the CURDS work which illustrates the extent of the London influence.
The map below illustrates the catchments of the London Central Activities Zone, when all of the 4.17
outer London centres catchments are considered, including Croydon, then the influence of Greater
London extends much further into the Home Counties.
Central Activities Zone TTW catchment (2011) Figure 11:
Source: ONS, Census 2011
In line with the CURDS approach we have sought to analyse more local markets based on a top 4.18
down approach centring on key sub-regional employment centres. Our choice of employment
centres reflects the major Metropolitan centres in South London as defined in the London Plan,
these are:
• Kingston;
• Sutton; and
• Bromley;
Strategic Housing Market Assessment, June 2015
Final Report
GL Hearn Page 35 of 183
J:\Planning\Job Files\J032310 - Croydon SHMA\Reports\Croydon SHMA Final June 2015.docx
In addition we have also analysed the travel to work catchments of Crawley (including Gatwick) and 4.19
as shown previously the Central Activities Zone in London. Furthermore we have also considered
where people working in the Borough commute from and where the Borough residents commute to.
Map of Major Employment Centre Figure 12:
Source: GL Hearn, 2013
For each employment centre we have defined the following catchments: 4.20
• Primary Catchment – Which reflects the Middle-Level Super Output Areas (MSOAs) with the
highest contribution of employees comprising 75% of the workforce for the target employment
centre;
• Secondary Catchment – Which reflects the MSOAs with the highest contribution of employees
comprising 75%-90% of the workforce for the target employment centre;
• Full Catchment – Which reflects the MSOAs which contribute any employees to the target
employment centre.
These catchments demonstrate the areas of influence of each of the employment centres and 4.21
broadly reflect the Functional Economic Market Areas. The 75% containment rate we have used for
our primary catchment broadly aligns with that used by ONS to define TTWAs using the 2001
Census data, although the threshold they have used for larger settlements falls to a 66% self-
containment level.

Strategic Housing Market Assessment, June 2015
Final Report
GL Hearn Page 36 of 183
J:\Planning\Job Files\J032310 - Croydon SHMA\Reports\Croydon SHMA Final June 2015.docx
The analysis shows that no part of Croydon falls into the primary catchment areas of Kingston. 4.22
However both Sutton and to a lesser extent Bromley’s primary catchment includes all or part of
Croydon Borough. The Sutton primary catchment largely extends to the South West and includes
all of Epson and Ewell and large parts of Mole Valley and Reigate and Banstead.
The Bromley primary catchment extends eastward and includes large parts of Sevenoaks and 4.23
Tonbridge and Malling as well as the southern parts of Lewisham, Greenwich, Bexley and Dartford.
In absolute terms the largest number of Croydon residents commute to Bromley (1,275 persons) 4.24
and Sutton (1,000 persons every day). Only 342 people commute from Croydon to Kingston. Maps
plotting the catchment areas of these employment centres can be found in the Appendix.
The Central Activities Zone primary catchment includes most of South London and similarly most of 4.25
Croydon. In total around 26,500 Croydon residents work in the Central Activities Zone.
Just over 21,000 Croydon residents work in Central Croydon and the industrial areas around Purley 4.26
Way. This represents just under 50% of the approximately 45,000 people who work in the area.
The catchment for this area is illustrated in the figure below. As shown the primary catchment 4.27
largely extends southwards although it also includes all of Sutton Borough to the West. The shape
of the catchment largely reflects the A23 and A22 corridors which extend into Surrey. There are
also a notable number of commuters from Crawley who are likely to use the regular train service
into East Croydon.
Strategic Housing Market Assessment, June 2015
Final Report
GL Hearn Page 37 of 183
J:\Planning\Job Files\J032310 - Croydon SHMA\Reports\Croydon SHMA Final June 2015.docx
Commuting to Central Croydon and West Croydon (2011) Figure 13:
Source: ONS Census, 2011
We have also reviewed the location of employment for all 140,000 Croydon residents. This analysis 4.28
shows that 34% of the Boroughs residents also work in the Borough i.e. the Borough has a 34%
self-containment rate. However, around 88% of Croydon’s residents work within Greater London
(including Croydon). The most popular employment locations outside Greater London were Reigate
and Banstead and Tandridge both of which received around 2% of Croydon’s working population.
Containment within Croydon and Greater London (2011) Table 4:
Croydon Greater London
Total Residents in Work 140,525 140,525
Residence-based Containment 48,412 123,643
Containment 34% 88%
Source: ONS, Census 2011
We have drawn the catchment maps together into a single map which illustrates which of the 4.29
identified employment centres receives the most commuters from any given MSOA. The map below
Strategic Housing Market Assessment, June 2015
Final Report
GL Hearn Page 38 of 183
J:\Planning\Job Files\J032310 - Croydon SHMA\Reports\Croydon SHMA Final June 2015.docx
illustrates that Croydon as well as Westminster and the City provides a main destination for
Croydon’s residents in each of the Borough’s MSOA.
Main Commuting Destination (2011) Figure 14:
Source: GL Hearn, ONS 2011
The pattern is such that those parts at the very North and South of the Borough alongside those 4.30
living immediately adjacent to East Croydon station travel into Central London whereas those
generally not on the main railway line remain in Croydon. Central Croydon’s influence also extends
beyond the Borough in to Sutton (around Beddington) and also in North Tandridge (around
Warlingham).
We have also reviewed more detailed in and out-commuting patterns involving Croydon residents. 4.31
This is taken from the latest Census data and is mapped at a Mid-Super Output Area level.
The map below illustrates the strength flows out of Croydon to Central London and Canary Wharf. It 4.32
also indicates that there are no substantive flows from outside of Croydon coming into the Borough.
Instead the largest inflows are all internal with the exception of small flows from the immediately
surrounding areas.

Strategic Housing Market Assessment, June 2015
Final Report
GL Hearn Page 39 of 183
J:\Planning\Job Files\J032310 - Croydon SHMA\Reports\Croydon SHMA Final June 2015.docx
Drawing the travel to work analysis together it is clear that Croydon is largely self-reliant for 4.33
employees. Although for employment it is more reliant on Central London which is not unlike most
London Boroughs.
In and Out Commuting With Croydon (2011) Figure 15:
Source: Census, 2013
House Price Analysis
The National Planning Practice Guidance also recommends that house prices and house price 4.34
change are considered when identifying housing market areas. We have taken average sales
prices for terraced and semi-detached prices for the South East region and London. These
typologies reflect mid-range property types and seek to strip out the impact of dominant house
typologies i.e. clusters of larger detached or smaller flatted properties.
As Figure 16 illustrates, there is a clear distinction between the higher house prices in the more 4.35
central London Boroughs and Croydon and Sutton, which are on average much lower. This would
suggest an alignment or convergence of markets. While Bromley and Tandridge also see lower
prices than Central London the prices are still generally higher than in Croydon.

Strategic Housing Market Assessment, June 2015
Final Report
GL Hearn Page 40 of 183
J:\Planning\Job Files\J032310 - Croydon SHMA\Reports\Croydon SHMA Final June 2015.docx
Within the Borough the prices in Central Croydon and around New Addington are lower than those 4.36
at the very North and very South of the Borough. Again this reflects quality of place and direct
transport links to Central London.
Average Semi-detached and Terraced House Price (2013) Figure 16:
Source: HM Land Registry, 2014
By analysing the change in average all house prices between 2009 and 2013 at a postal sector 4.37
level, we can again see a distinct pattern in Croydon compared to the Borough to the North.
The extent of house price growth aligns the Borough more with Sutton, Tandridge, Bromley and 4.38
Reigate and Banstead. The only part of Croydon which has seen negative growth is around the
centre and West of Purley.

Strategic Housing Market Assessment, June 2015
Final Report
GL Hearn Page 41 of 183
J:\Planning\Job Files\J032310 - Croydon SHMA\Reports\Croydon SHMA Final June 2015.docx
Average House Price Change By Postal Sector (2009-2013) Figure 17:
Source: HM Land Registry, 2014
Conclusions
Drawing together the evidence, in regard to both migration, commuting and house prices Croydon 4.39
is clearly influenced by Greater London, suggesting that it still falls within the London Strategic HMA.
The extent of which depends on the weight which is attributed to different data sources and levels
of self-containment sought, but generally it extends well beyond the M25.
Whilst it is important to recognise the influence of London, and to take this into account in planning 4.40
for housing, it is not however practical to develop an SHMA covering London and a significant
proportion of the Home Counties. On this basis we consider that an SHMA should be prepared for
the relevant Local Housing Market.
More widely the picture is one of a series of inter-connected local housing markets which reflect the 4.41
density of transport networks, both road and rail. What is notable is that house prices are lower in
Croydon than in most surrounding areas, particularly those to the north – potentially reflecting
improved connectivity to Central London.

Strategic Housing Market Assessment, June 2015
Final Report
GL Hearn Page 42 of 183
J:\Planning\Job Files\J032310 - Croydon SHMA\Reports\Croydon SHMA Final June 2015.docx
However strong links are still clearly evident between Croydon and Tandridge, Sutton, Bromley and 4.42
Lambeth. The evidence points towards a strong set of relationships in regards to migration between
Croydon and those authorities, although commuting patterns suggest that only Sutton and
Tandridge are strongly aligned with Croydon. Finally only Sutton broadly aligns on review of house
prices.
Taking account of the approach being adopted in surrounding areas, we consider that the 4.43
preparation of a SHMA for Croydon alone would be appropriate. There is a potential case for
including Tandridge and Sutton within this grouping, but recognising that these areas are more
closely related to Reigate and Banstead and Epsom and Ewell respectively.
Given the inter-connected nature of housing markets in South London and Surrey, and the 4.44
functional links between Surrey and Greater London, we would recommend that the findings of
SHMA studies are brought together with wider evidence in considering supply-demand balance and
finalising policies for housing provision. This may be easier to achieve with Sutton and the other
London authorities where working groups already exist.
Strategic Housing Market Assessment, June 2015
Final Report
GL Hearn Page 43 of 183
J:\Planning\Job Files\J032310 - Croydon SHMA\Reports\Croydon SHMA Final June 2015.docx
280,000
290,000
300,000
310,000
320,000
330,000
340,000
350,000
360,000
370,000
380,000
19
81
19
83
19
85
19
87
19
89
19
91
19
93
19
95
19
97
19
99
20
01
20
03
20
05
20
07
20
09
20
11
20
13
Cro
yd
on
's P
op
ula
tio
n5 UNDERSTANDING CROYDON’S HOUSING MARKET
Croydon’s Population
Croydon’s population totals 372,750 persons in mid-20139. Figure 18 indicates how Croydon’s 5.1
population has changed since 1981. The Borough’s population fell by 1.5% between 1981-91, but
then grew by 6.1% over the subsequent decade (1981-91). As the graph shows population growth
has accelerated since 2006, driving an increase in population growth to 8.9% between 2001-11.
Indeed over the 2006-13 period, Croydon’s population has increased by 32,400 with average 5.2
annual growth of 1.3%.
Croydon’s Population, 1981-2013 Figure 18:
Source: ONS Mid-Year Population Estimates
This is a trend which is not specific to Croydon, but has been seen across London. Figure 19 tracks 5.3
population growth since 2001 in Croydon and London. Whilst Croydon has seen more modest
growth than other parts of London over this period, this principally reflects slower growth between
2001-6. Population growth since 2006 has closely tracked London-wide growth rates.
The trend is relatively consistent with that across London. London’s population declined after the 5.4
Second World War but has been increasing since 1981 – slowly at first, but at an increasing rate.
9 ONS 2013 Mid-Year Population Estimates
Strategic Housing Market Assessment, June 2015
Final Report
GL Hearn Page 44 of 183
J:\Planning\Job Files\J032310 - Croydon SHMA\Reports\Croydon SHMA Final June 2015.docx
Population Growth from 2001 Figure 19:
Source: ONS Mid-Year Population Estimates
The Borough’s population structure differs from that of London as a whole. The Borough has a 5.5
lower proportion of people in their 20s and 30s, but a higher proportion of people aged over 45 and
under 18. The profile partly reflects its location within London, and for instance we would expect
Inner London Borough’s to have greater proportions of people in their 20s and 30s – whereas areas
such as Croydon see greater representation of middle aged families with children.
0.90
0.95
1.00
1.05
1.10
1.15
1.20
20
01
20
02
20
03
20
04
20
05
20
06
20
07
20
08
20
09
20
10
20
11
20
12
20
13
Ind
ex (
2001=
1)
Croydon
London
Strategic Housing Market Assessment, June 2015
Final Report
GL Hearn Page 45 of 183
J:\Planning\Job Files\J032310 - Croydon SHMA\Reports\Croydon SHMA Final June 2015.docx
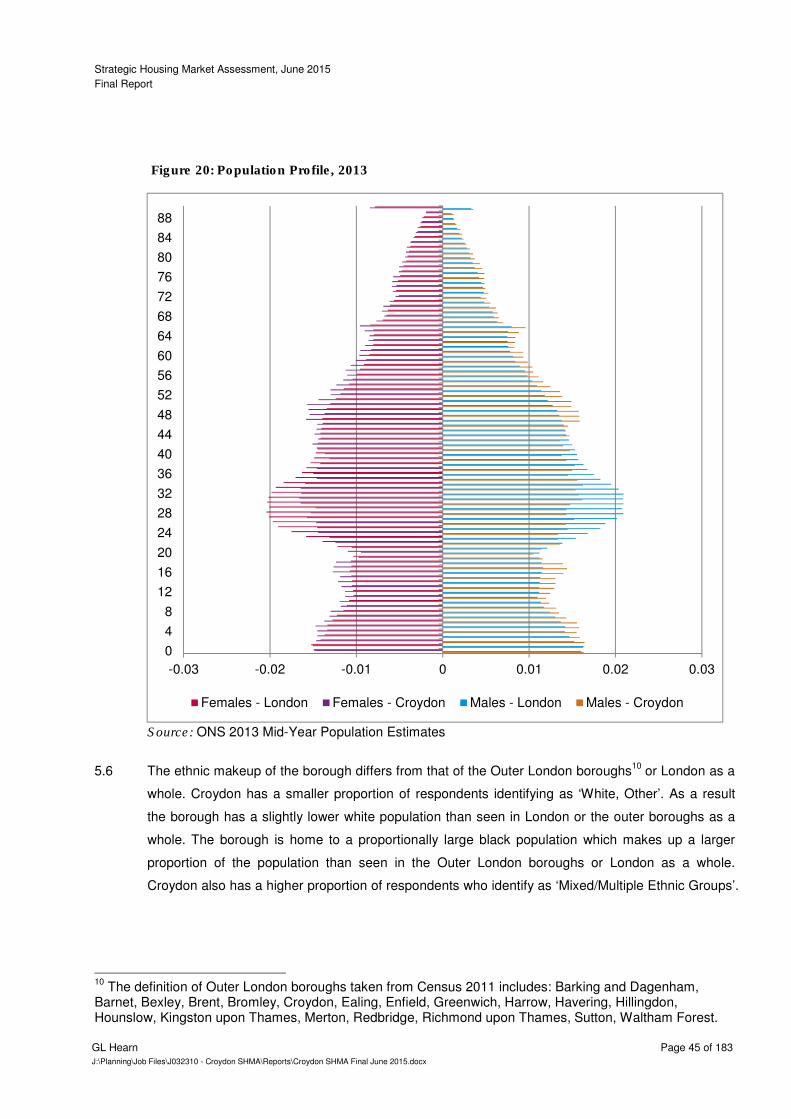
Population Profile, 2013 Figure 20:
Source: ONS 2013 Mid-Year Population Estimates
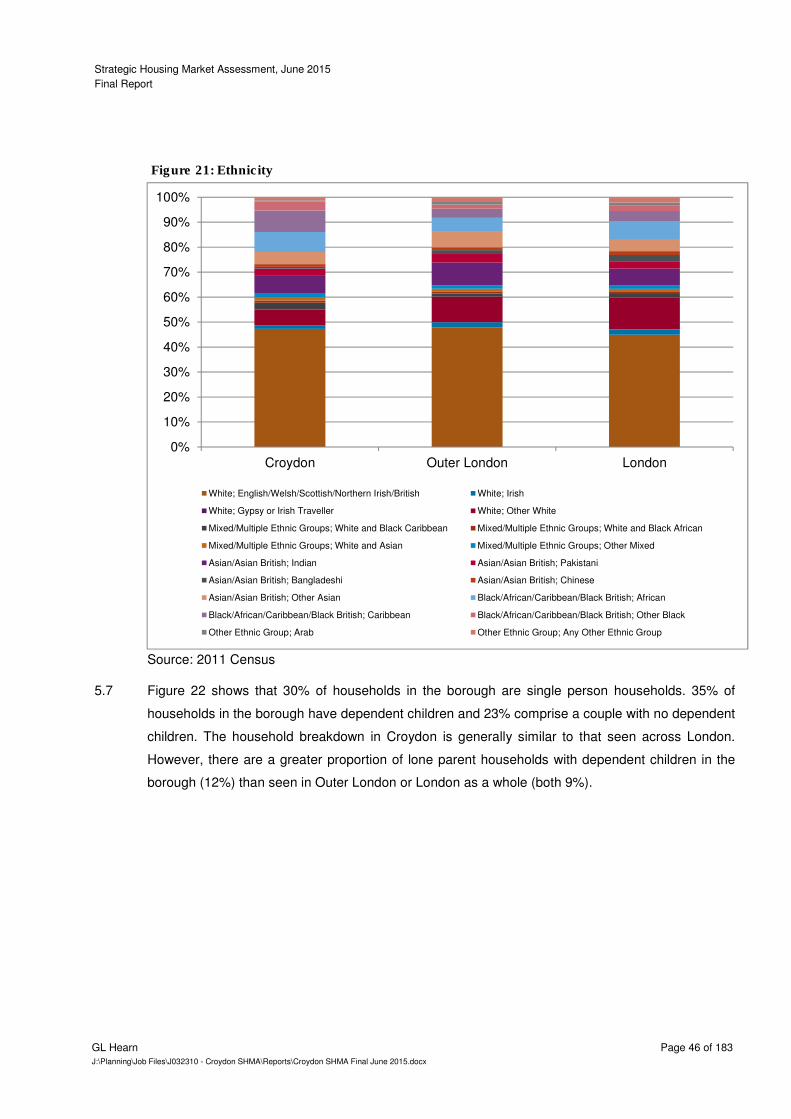
The ethnic makeup of the borough differs from that of the Outer London boroughs10
or London as a 5.6
whole. Croydon has a smaller proportion of respondents identifying as ‘White, Other’. As a result
the borough has a slightly lower white population than seen in London or the outer boroughs as a
whole. The borough is home to a proportionally large black population which makes up a larger
proportion of the population than seen in the Outer London boroughs or London as a whole.
Croydon also has a higher proportion of respondents who identify as ‘Mixed/Multiple Ethnic Groups’.
10
The definition of Outer London boroughs taken from Census 2011 includes: Barking and Dagenham, Barnet, Bexley, Brent, Bromley, Croydon, Ealing, Enfield, Greenwich, Harrow, Havering, Hillingdon, Hounslow, Kingston upon Thames, Merton, Redbridge, Richmond upon Thames, Sutton, Waltham Forest.
-0.03 -0.02 -0.01 0 0.01 0.02 0.03
0
4
8
12
16
20
24
28
32
36
40
44
48
52
56
60
64
68
72
76
80
84
88
Females - London Females - Croydon Males - London Males - Croydon
Strategic Housing Market Assessment, June 2015
Final Report
GL Hearn Page 46 of 183
J:\Planning\Job Files\J032310 - Croydon SHMA\Reports\Croydon SHMA Final June 2015.docx
Ethnicity Figure 21:
Source: 2011 Census
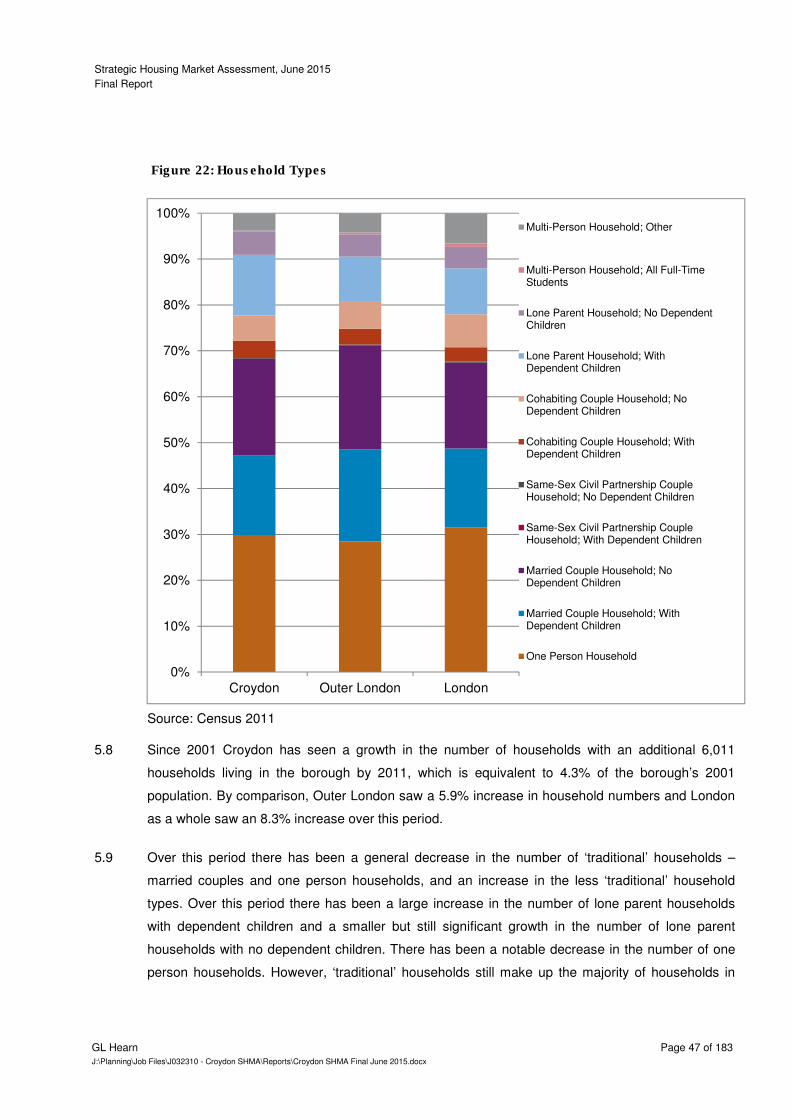
Figure 22 shows that 30% of households in the borough are single person households. 35% of 5.7
households in the borough have dependent children and 23% comprise a couple with no dependent
children. The household breakdown in Croydon is generally similar to that seen across London.
However, there are a greater proportion of lone parent households with dependent children in the
borough (12%) than seen in Outer London or London as a whole (both 9%).
0%
10%
20%
30%
40%
50%
60%
70%
80%
90%
100%
Croydon Outer London London
White; English/Welsh/Scottish/Northern Irish/British White; Irish
White; Gypsy or Irish Traveller White; Other White
Mixed/Multiple Ethnic Groups; White and Black Caribbean Mixed/Multiple Ethnic Groups; White and Black African
Mixed/Multiple Ethnic Groups; White and Asian Mixed/Multiple Ethnic Groups; Other Mixed
Asian/Asian British; Indian Asian/Asian British; Pakistani
Asian/Asian British; Bangladeshi Asian/Asian British; Chinese
Asian/Asian British; Other Asian Black/African/Caribbean/Black British; African
Black/African/Caribbean/Black British; Caribbean Black/African/Caribbean/Black British; Other Black
Other Ethnic Group; Arab Other Ethnic Group; Any Other Ethnic Group
Strategic Housing Market Assessment, June 2015
Final Report
GL Hearn Page 47 of 183
J:\Planning\Job Files\J032310 - Croydon SHMA\Reports\Croydon SHMA Final June 2015.docx
Household Types Figure 22:
Source: Census 2011
Since 2001 Croydon has seen a growth in the number of households with an additional 6,011 5.8
households living in the borough by 2011, which is equivalent to 4.3% of the borough’s 2001
population. By comparison, Outer London saw a 5.9% increase in household numbers and London
as a whole saw an 8.3% increase over this period.
Over this period there has been a general decrease in the number of ‘traditional’ households – 5.9
married couples and one person households, and an increase in the less ‘traditional’ household
types. Over this period there has been a large increase in the number of lone parent households
with dependent children and a smaller but still significant growth in the number of lone parent
households with no dependent children. There has been a notable decrease in the number of one
person households. However, ‘traditional’ households still make up the majority of households in
0%
10%
20%
30%
40%
50%
60%
70%
80%
90%
100%
Croydon Outer London London
Multi-Person Household; Other
Multi-Person Household; All Full-TimeStudents
Lone Parent Household; No DependentChildren
Lone Parent Household; WithDependent Children
Cohabiting Couple Household; NoDependent Children
Cohabiting Couple Household; WithDependent Children
Same-Sex Civil Partnership CoupleHousehold; No Dependent Children
Same-Sex Civil Partnership CoupleHousehold; With Dependent Children
Married Couple Household; NoDependent Children
Married Couple Household; WithDependent Children
One Person Household
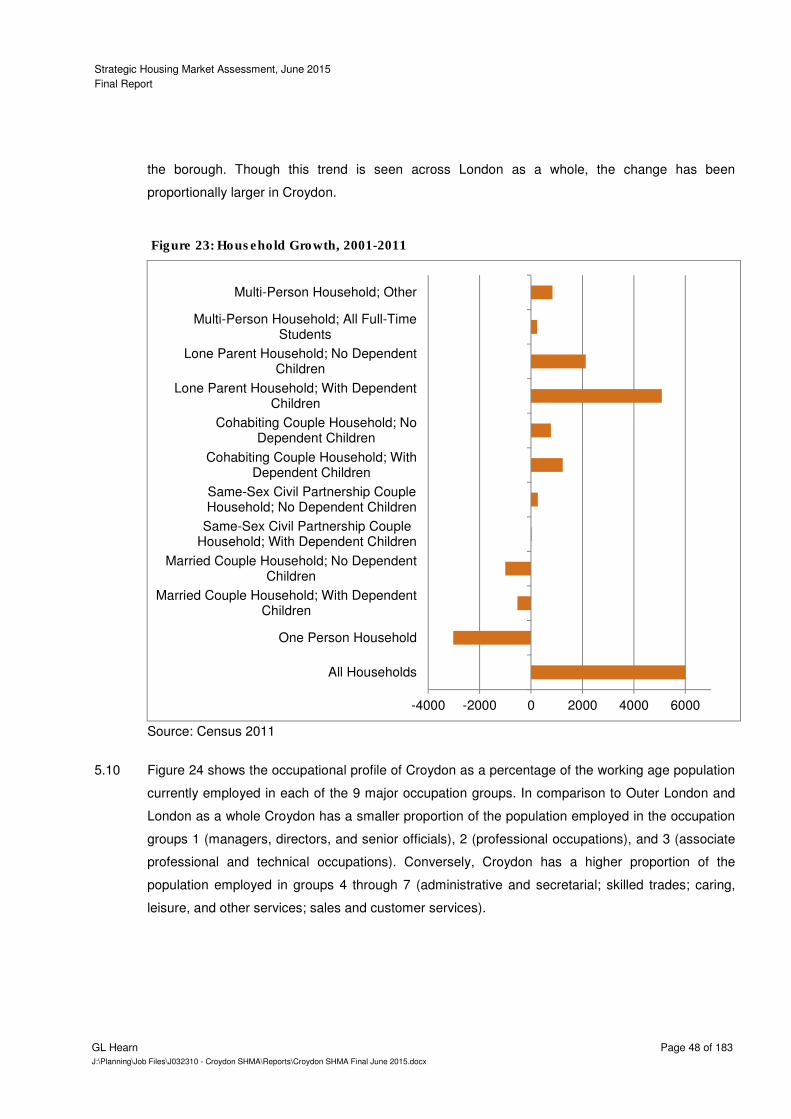
Strategic Housing Market Assessment, June 2015
Final Report
GL Hearn Page 48 of 183
J:\Planning\Job Files\J032310 - Croydon SHMA\Reports\Croydon SHMA Final June 2015.docx
the borough. Though this trend is seen across London as a whole, the change has been
proportionally larger in Croydon.
Household Growth, 2001-2011 Figure 23:
Source: Census 2011
Figure 24 shows the occupational profile of Croydon as a percentage of the working age population 5.10
currently employed in each of the 9 major occupation groups. In comparison to Outer London and
London as a whole Croydon has a smaller proportion of the population employed in the occupation
groups 1 (managers, directors, and senior officials), 2 (professional occupations), and 3 (associate
professional and technical occupations). Conversely, Croydon has a higher proportion of the
population employed in groups 4 through 7 (administrative and secretarial; skilled trades; caring,
leisure, and other services; sales and customer services).
-4000 -2000 0 2000 4000 6000
All Households
One Person Household
Married Couple Household; With DependentChildren
Married Couple Household; No DependentChildren
Same-Sex Civil Partnership CoupleHousehold; With Dependent Children
Same-Sex Civil Partnership CoupleHousehold; No Dependent Children
Cohabiting Couple Household; WithDependent Children
Cohabiting Couple Household; NoDependent Children
Lone Parent Household; With DependentChildren
Lone Parent Household; No DependentChildren
Multi-Person Household; All Full-TimeStudents
Multi-Person Household; Other
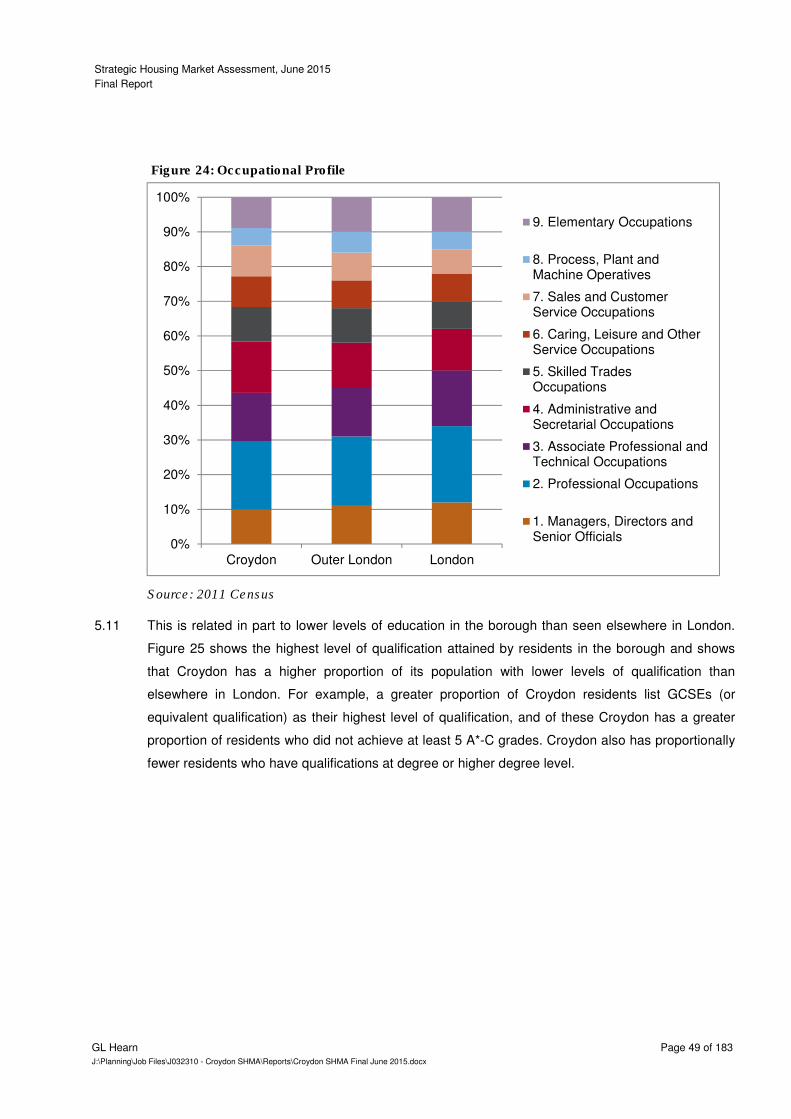
Strategic Housing Market Assessment, June 2015
Final Report
GL Hearn Page 49 of 183
J:\Planning\Job Files\J032310 - Croydon SHMA\Reports\Croydon SHMA Final June 2015.docx
Occupational Profile Figure 24:
Source: 2011 Census
This is related in part to lower levels of education in the borough than seen elsewhere in London. 5.11
Figure 25 shows the highest level of qualification attained by residents in the borough and shows
that Croydon has a higher proportion of its population with lower levels of qualification than
elsewhere in London. For example, a greater proportion of Croydon residents list GCSEs (or
equivalent qualification) as their highest level of qualification, and of these Croydon has a greater
proportion of residents who did not achieve at least 5 A*-C grades. Croydon also has proportionally
fewer residents who have qualifications at degree or higher degree level.
0%
10%
20%
30%
40%
50%
60%
70%
80%
90%
100%
Croydon Outer London London
9. Elementary Occupations
8. Process, Plant andMachine Operatives
7. Sales and CustomerService Occupations
6. Caring, Leisure and OtherService Occupations
5. Skilled TradesOccupations
4. Administrative andSecretarial Occupations
3. Associate Professional andTechnical Occupations
2. Professional Occupations
1. Managers, Directors andSenior Officials

Strategic Housing Market Assessment, June 2015
Final Report
GL Hearn Page 50 of 183
J:\Planning\Job Files\J032310 - Croydon SHMA\Reports\Croydon SHMA Final June 2015.docx
Qualifications Figure 25:
Source: 2011 Census
Figure 26 shows employment levels as a percentage of the economically active population, which is 5.12
those of working age who are either in employment, or not in employment but seeking work. Figure
26 shows that employment levels in Croydon is 87% - similar to those seen across London, albeit
there are slightly more employees and slightly fewer self-employed in Croydon. Unemployment in
Croydon is 8%, 1% higher than the London average.
0%
10%
20%
30%
40%
50%
60%
70%
80%
90%
100%
Croydon Outer London London
Foreign Qualifications
Other Vocational/Work-RelatedQualifications
Professional Qualifications
NVQ Level 4-5, HNC, HND, RSAHigher Diploma, BTEC Higher Level
Degree (E.g. BA, BSc), Higher Degree(E.g. MA, PhD, PGCE)
NVQ Level 3, Advanced GNVQ
2+ A Levels/VCEs, 4+ As Levels
Apprenticeship
NVQ Level 2, Intermediate GNVQ
5+ O Level (Passes)/CSEs (Grade1)/GCSEs (Grades A*-C)
NVQ Level 1, Foundation GNVQ
1-4 O Levels/CSE/GCSEs (AnyGrades)
No Qualifications
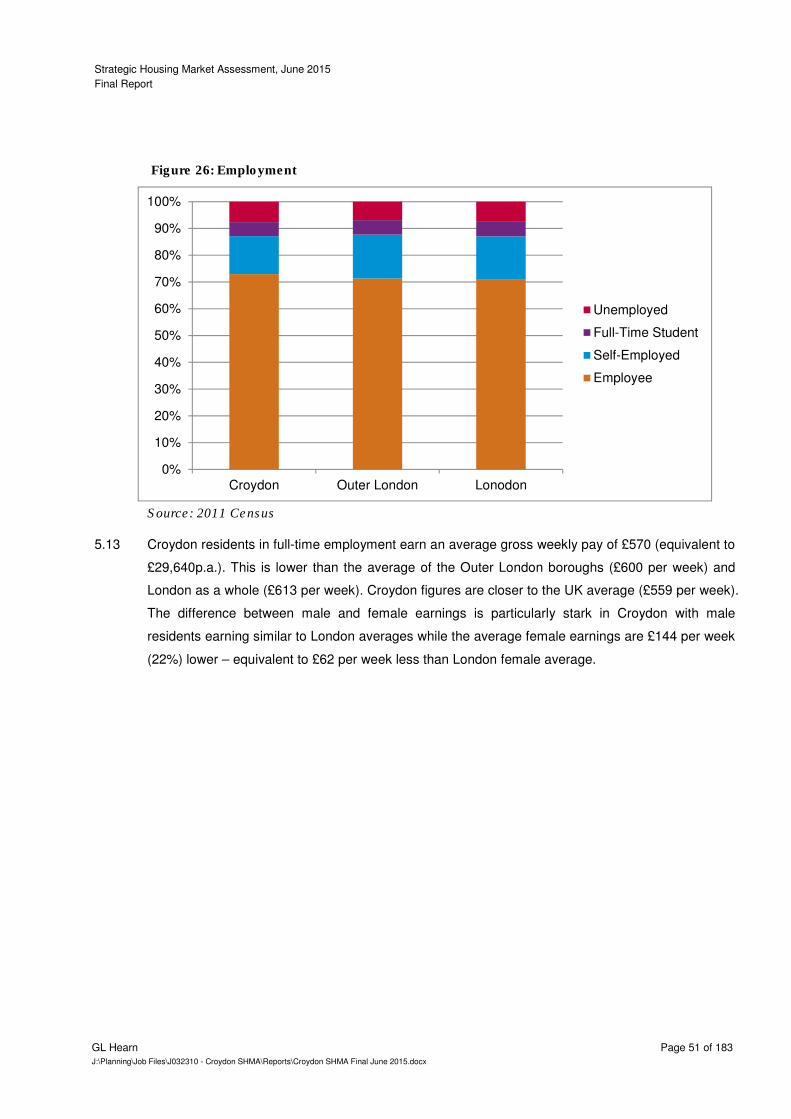
Strategic Housing Market Assessment, June 2015
Final Report
GL Hearn Page 51 of 183
J:\Planning\Job Files\J032310 - Croydon SHMA\Reports\Croydon SHMA Final June 2015.docx
0%
10%
20%
30%
40%
50%
60%
70%
80%
90%
100%
Croydon Outer London Lonodon
Unemployed
Full-Time Student
Self-Employed
Employee
Employment Figure 26:
Source: 2011 Census
Croydon residents in full-time employment earn an average gross weekly pay of £570 (equivalent to 5.13
£29,640p.a.). This is lower than the average of the Outer London boroughs (£600 per week) and
London as a whole (£613 per week). Croydon figures are closer to the UK average (£559 per week).
The difference between male and female earnings is particularly stark in Croydon with male
residents earning similar to London averages while the average female earnings are £144 per week
(22%) lower – equivalent to £62 per week less than London female average.
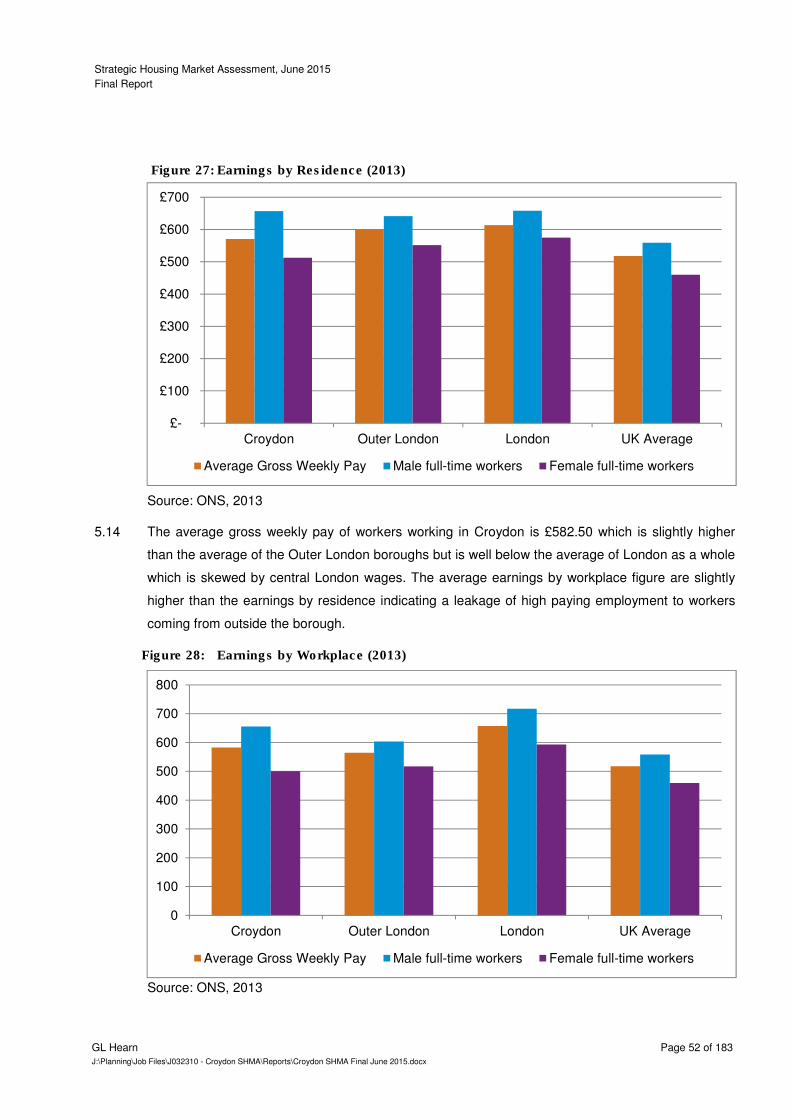
Strategic Housing Market Assessment, June 2015
Final Report
GL Hearn Page 52 of 183
J:\Planning\Job Files\J032310 - Croydon SHMA\Reports\Croydon SHMA Final June 2015.docx
Earnings by Residence (2013) Figure 27:
Source: ONS, 2013
The average gross weekly pay of workers working in Croydon is £582.50 which is slightly higher 5.14
than the average of the Outer London boroughs but is well below the average of London as a whole
which is skewed by central London wages. The average earnings by workplace figure are slightly
higher than the earnings by residence indicating a leakage of high paying employment to workers
coming from outside the borough.
Earnings by Workplace (2013) Figure 28:
Source: ONS, 2013
£-
£100
£200
£300
£400
£500
£600
£700
Croydon Outer London London UK Average
Average Gross Weekly Pay Male full-time workers Female full-time workers
0
100
200
300
400
500
600
700
800
Croydon Outer London London UK Average
Average Gross Weekly Pay Male full-time workers Female full-time workers
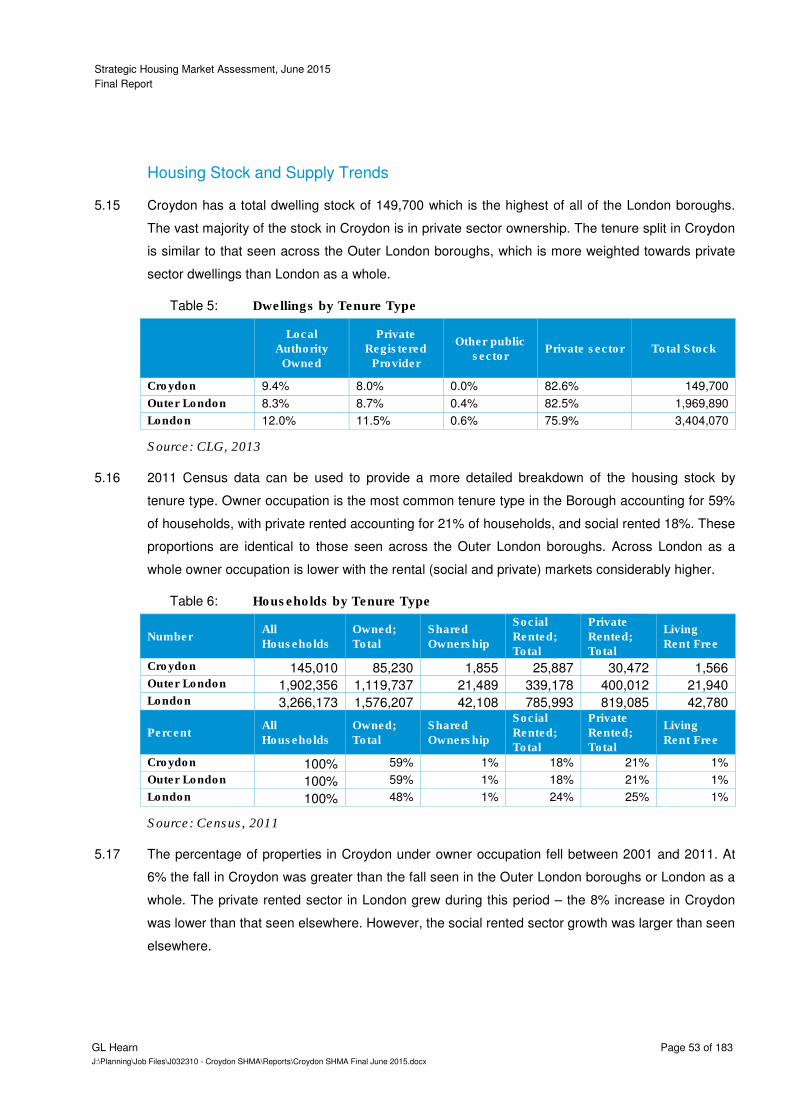
Strategic Housing Market Assessment, June 2015
Final Report
GL Hearn Page 53 of 183
J:\Planning\Job Files\J032310 - Croydon SHMA\Reports\Croydon SHMA Final June 2015.docx
Housing Stock and Supply Trends
Croydon has a total dwelling stock of 149,700 which is the highest of all of the London boroughs. 5.15
The vast majority of the stock in Croydon is in private sector ownership. The tenure split in Croydon
is similar to that seen across the Outer London boroughs, which is more weighted towards private
sector dwellings than London as a whole.
Dwellings by Tenure Type Table 5:
Local
Authority
Owned
Private
Registered
Provider
Other public
sector Private sector Total Stock
Croydon 9.4% 8.0% 0.0% 82.6% 149,700
Outer London 8.3% 8.7% 0.4% 82.5% 1,969,890
London 12.0% 11.5% 0.6% 75.9% 3,404,070
Source: CLG, 2013
2011 Census data can be used to provide a more detailed breakdown of the housing stock by 5.16
tenure type. Owner occupation is the most common tenure type in the Borough accounting for 59%
of households, with private rented accounting for 21% of households, and social rented 18%. These
proportions are identical to those seen across the Outer London boroughs. Across London as a
whole owner occupation is lower with the rental (social and private) markets considerably higher.
Households by Tenure Type Table 6:
Number All
Households
Owned;
Total
Shared
Ownership
Social
Rented;
Total
Private
Rented;
Total
Living
Rent Free
Croydon 145,010 85,230 1,855 25,887 30,472 1,566 Outer London 1,902,356 1,119,737 21,489 339,178 400,012 21,940 London 3,266,173 1,576,207 42,108 785,993 819,085 42,780
Percent All
Households
Owned;
Total
Shared
Ownership
Social
Rented;
Total
Private
Rented;
Total
Living
Rent Free
Croydon 100% 59% 1% 18% 21% 1%
Outer London 100% 59% 1% 18% 21% 1%
London 100% 48% 1% 24% 25% 1%
Source: Census, 2011
The percentage of properties in Croydon under owner occupation fell between 2001 and 2011. At 5.17
6% the fall in Croydon was greater than the fall seen in the Outer London boroughs or London as a
whole. The private rented sector in London grew during this period – the 8% increase in Croydon
was lower than that seen elsewhere. However, the social rented sector growth was larger than seen
elsewhere.
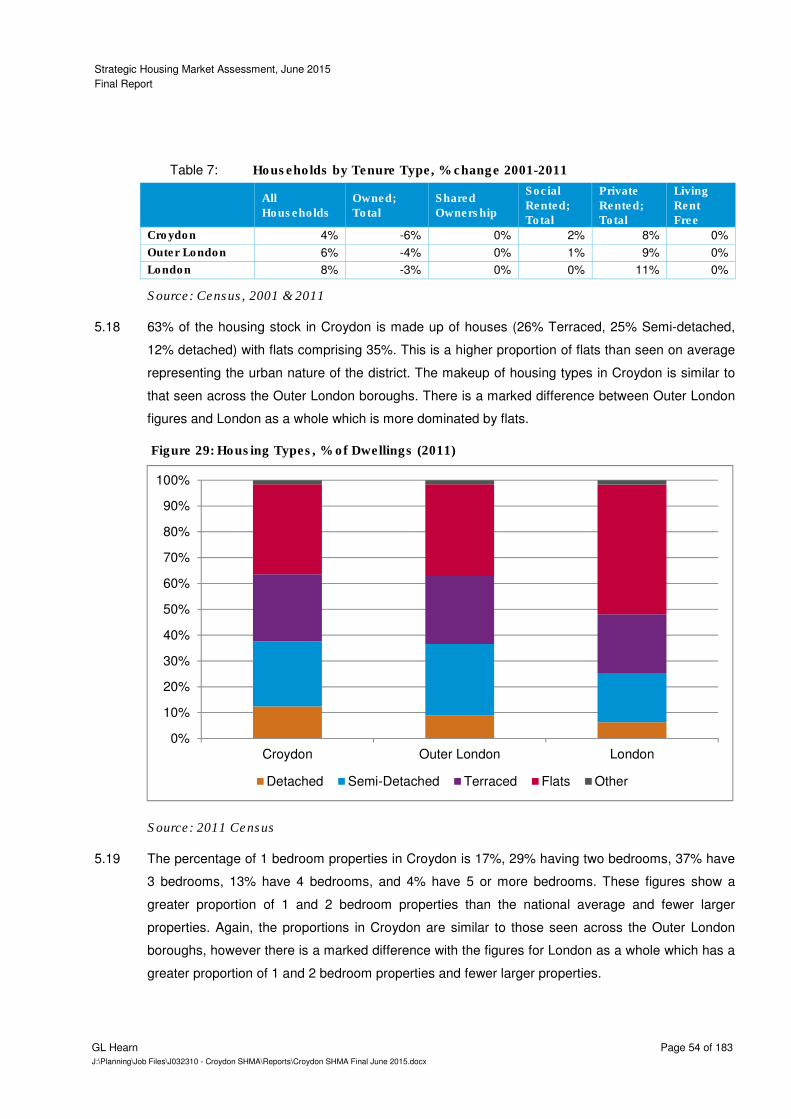
Strategic Housing Market Assessment, June 2015
Final Report
GL Hearn Page 54 of 183
J:\Planning\Job Files\J032310 - Croydon SHMA\Reports\Croydon SHMA Final June 2015.docx
Households by Tenure Type, % change 2001-2011 Table 7:
All
Households
Owned;
Total
Shared
Ownership
Social
Rented;
Total
Private
Rented;
Total
Living
Rent
Free
Croydon 4% -6% 0% 2% 8% 0%
Outer London 6% -4% 0% 1% 9% 0%
London 8% -3% 0% 0% 11% 0%
Source: Census, 2001 & 2011
63% of the housing stock in Croydon is made up of houses (26% Terraced, 25% Semi-detached, 5.18
12% detached) with flats comprising 35%. This is a higher proportion of flats than seen on average
representing the urban nature of the district. The makeup of housing types in Croydon is similar to
that seen across the Outer London boroughs. There is a marked difference between Outer London
figures and London as a whole which is more dominated by flats.
Housing Types, % of Dwellings (2011) Figure 29:
Source: 2011 Census
The percentage of 1 bedroom properties in Croydon is 17%, 29% having two bedrooms, 37% have 5.19
3 bedrooms, 13% have 4 bedrooms, and 4% have 5 or more bedrooms. These figures show a
greater proportion of 1 and 2 bedroom properties than the national average and fewer larger
properties. Again, the proportions in Croydon are similar to those seen across the Outer London
boroughs, however there is a marked difference with the figures for London as a whole which has a
greater proportion of 1 and 2 bedroom properties and fewer larger properties.
0%
10%
20%
30%
40%
50%
60%
70%
80%
90%
100%
Croydon Outer London London
Detached Semi-Detached Terraced Flats Other
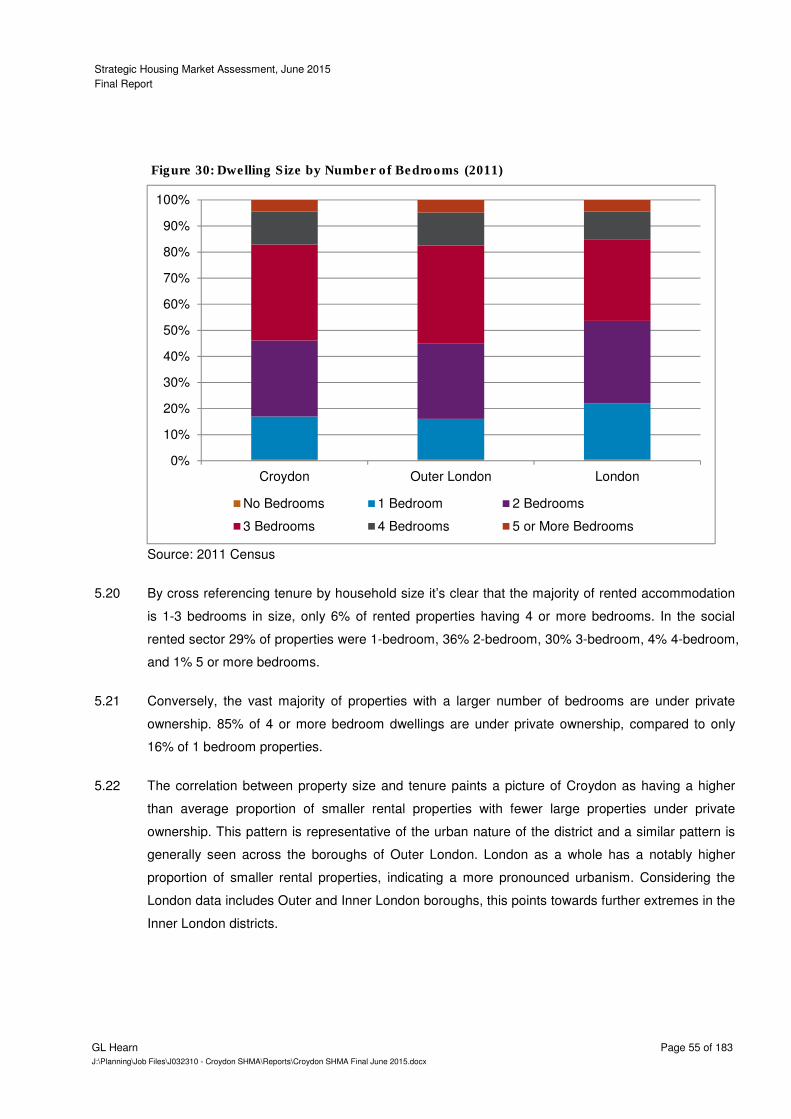
Strategic Housing Market Assessment, June 2015
Final Report
GL Hearn Page 55 of 183
J:\Planning\Job Files\J032310 - Croydon SHMA\Reports\Croydon SHMA Final June 2015.docx
Dwelling Size by Number of Bedrooms (2011) Figure 30:
Source: 2011 Census
By cross referencing tenure by household size it’s clear that the majority of rented accommodation 5.20
is 1-3 bedrooms in size, only 6% of rented properties having 4 or more bedrooms. In the social
rented sector 29% of properties were 1-bedroom, 36% 2-bedroom, 30% 3-bedroom, 4% 4-bedroom,
and 1% 5 or more bedrooms.
Conversely, the vast majority of properties with a larger number of bedrooms are under private 5.21
ownership. 85% of 4 or more bedroom dwellings are under private ownership, compared to only
16% of 1 bedroom properties.
The correlation between property size and tenure paints a picture of Croydon as having a higher 5.22
than average proportion of smaller rental properties with fewer large properties under private
ownership. This pattern is representative of the urban nature of the district and a similar pattern is
generally seen across the boroughs of Outer London. London as a whole has a notably higher
proportion of smaller rental properties, indicating a more pronounced urbanism. Considering the
London data includes Outer and Inner London boroughs, this points towards further extremes in the
Inner London districts.
0%
10%
20%
30%
40%
50%
60%
70%
80%
90%
100%
Croydon Outer London London
No Bedrooms 1 Bedroom 2 Bedrooms
3 Bedrooms 4 Bedrooms 5 or More Bedrooms

Strategic Housing Market Assessment, June 2015
Final Report
GL Hearn Page 56 of 183
J:\Planning\Job Files\J032310 - Croydon SHMA\Reports\Croydon SHMA Final June 2015.docx
1bedroom
2bedrooms
3bedrooms
4bedrooms
5 or morebedrooms
Private rented: Other privaterented or living rent free
742 1,148 988 290 108
Private rented: Privatelandlord or letting agency
9,947 11,218 5,764 1,291 542
Social rented: Total 7,449 9,370 7,675 1,144 249
Owned or shared ownership:Total
6,473 20,490 38,957 15,587 5,578
0%
10%
20%
30%
40%
50%
60%
70%
80%
90%
100%
Tenure Type by Dwelling Size, 2011 Figure 31:
Source: 2011 Census
Croydon has a greater proportion of properties within Council Tax Bands B and Band C and a 5.23
smaller proportion in Bands D and E than is seen across the Outer London Boroughs. This
indicates that although Croydon has similar housing mix characteristics, in terms of housing stock,
to the other Outer London Boroughs values at the time of calculation were generally lower.
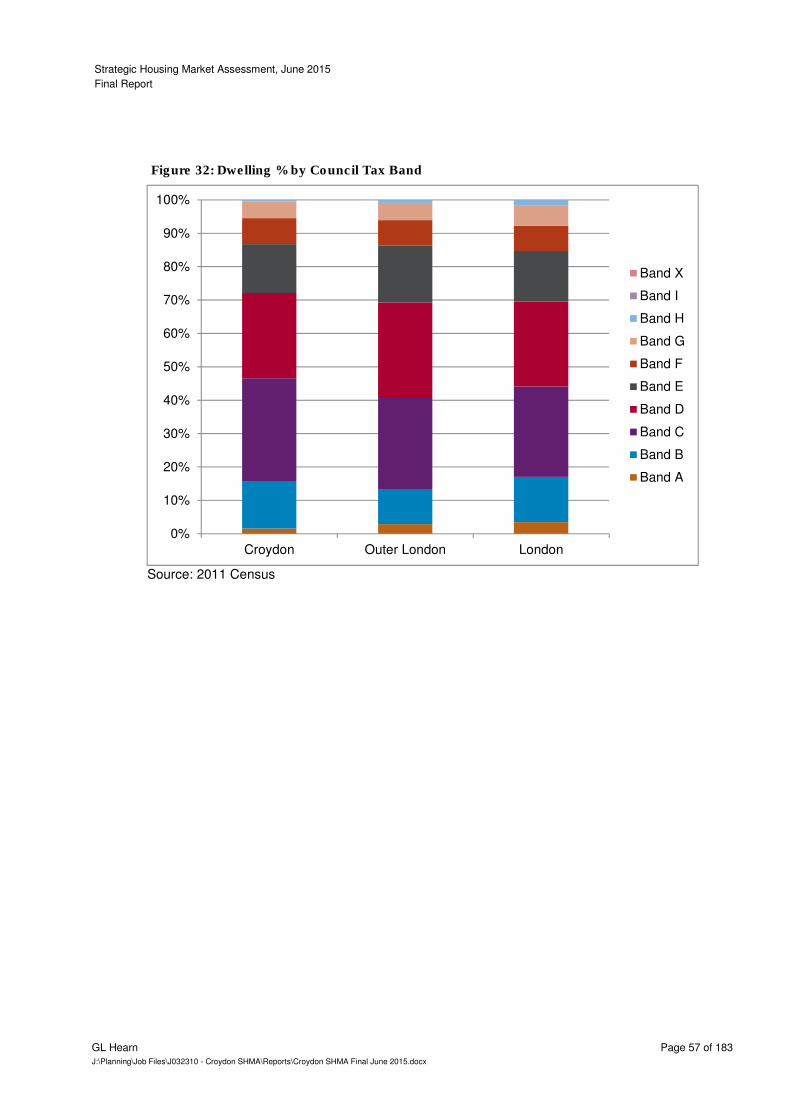
Strategic Housing Market Assessment, June 2015
Final Report
GL Hearn Page 57 of 183
J:\Planning\Job Files\J032310 - Croydon SHMA\Reports\Croydon SHMA Final June 2015.docx
Dwelling % by Council Tax Band Figure 32:
Source: 2011 Census
0%
10%
20%
30%
40%
50%
60%
70%
80%
90%
100%
Croydon Outer London London
Band X
Band I
Band H
Band G
Band F
Band E
Band D
Band C
Band B
Band A
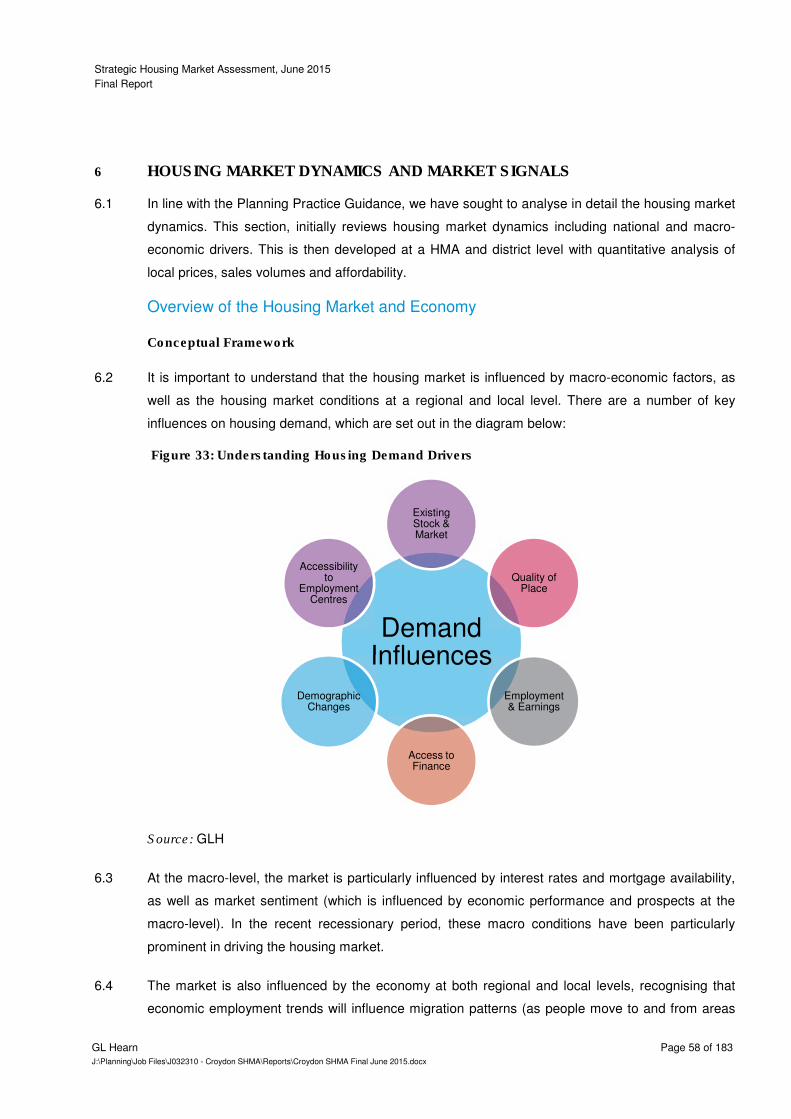
Strategic Housing Market Assessment, June 2015
Final Report
GL Hearn Page 58 of 183
J:\Planning\Job Files\J032310 - Croydon SHMA\Reports\Croydon SHMA Final June 2015.docx
6 HOUSING MARKET DYNAMICS AND MARKET SIGNALS
In line with the Planning Practice Guidance, we have sought to analyse in detail the housing market 6.1
dynamics. This section, initially reviews housing market dynamics including national and macro-
economic drivers. This is then developed at a HMA and district level with quantitative analysis of
local prices, sales volumes and affordability.
Overview of the Housing Market and Economy
Conceptual Framework
It is important to understand that the housing market is influenced by macro-economic factors, as 6.2
well as the housing market conditions at a regional and local level. There are a number of key
influences on housing demand, which are set out in the diagram below:
Understanding Housing Demand Drivers Figure 33:
Source: GLH
At the macro-level, the market is particularly influenced by interest rates and mortgage availability, 6.3
as well as market sentiment (which is influenced by economic performance and prospects at the
macro-level). In the recent recessionary period, these macro conditions have been particularly
prominent in driving the housing market.
The market is also influenced by the economy at both regional and local levels, recognising that 6.4
economic employment trends will influence migration patterns (as people move to and from areas
Demand Influences
Existing Stock & Market
Quality of Place
Employment & Earnings
Access to Finance
Demographic Changes
Accessibility to
Employment Centres
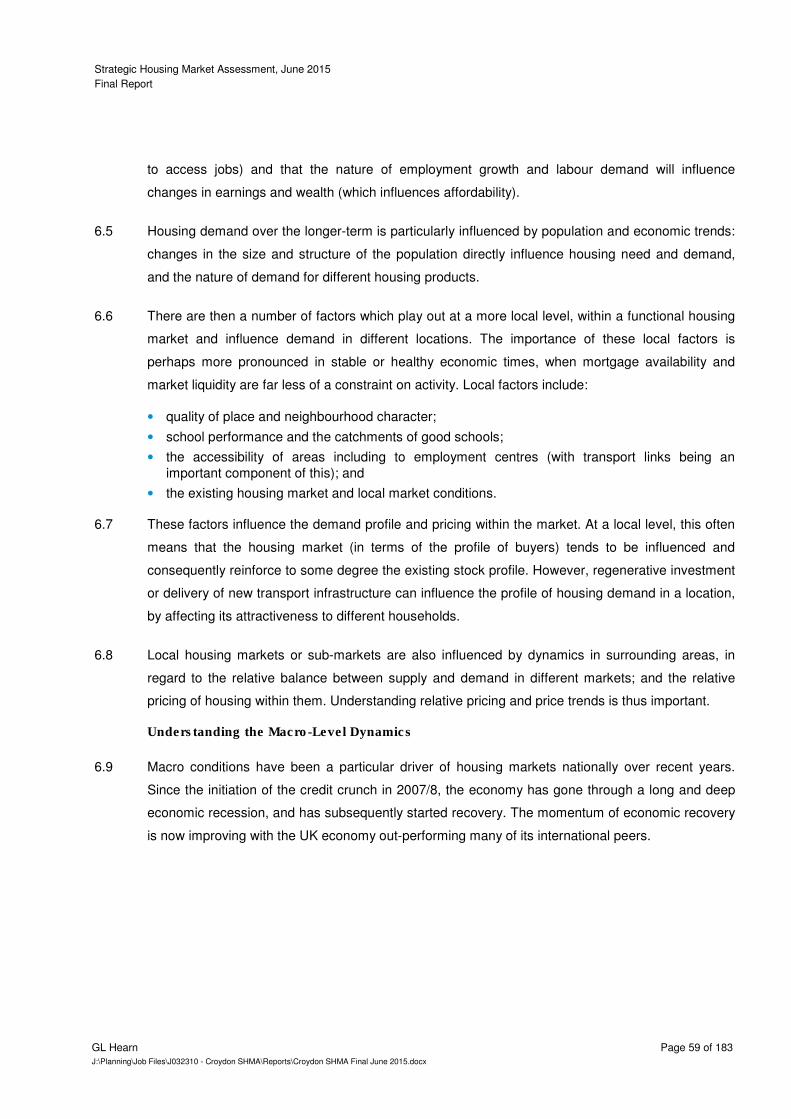
Strategic Housing Market Assessment, June 2015
Final Report
GL Hearn Page 59 of 183
J:\Planning\Job Files\J032310 - Croydon SHMA\Reports\Croydon SHMA Final June 2015.docx
to access jobs) and that the nature of employment growth and labour demand will influence
changes in earnings and wealth (which influences affordability).
Housing demand over the longer-term is particularly influenced by population and economic trends: 6.5
changes in the size and structure of the population directly influence housing need and demand,
and the nature of demand for different housing products.
There are then a number of factors which play out at a more local level, within a functional housing 6.6
market and influence demand in different locations. The importance of these local factors is
perhaps more pronounced in stable or healthy economic times, when mortgage availability and
market liquidity are far less of a constraint on activity. Local factors include:
• quality of place and neighbourhood character;
• school performance and the catchments of good schools;
• the accessibility of areas including to employment centres (with transport links being an
important component of this); and
• the existing housing market and local market conditions.
These factors influence the demand profile and pricing within the market. At a local level, this often 6.7
means that the housing market (in terms of the profile of buyers) tends to be influenced and
consequently reinforce to some degree the existing stock profile. However, regenerative investment
or delivery of new transport infrastructure can influence the profile of housing demand in a location,
by affecting its attractiveness to different households.
Local housing markets or sub-markets are also influenced by dynamics in surrounding areas, in 6.8
regard to the relative balance between supply and demand in different markets; and the relative
pricing of housing within them. Understanding relative pricing and price trends is thus important.
Understanding the Macro-Level Dynamics
Macro conditions have been a particular driver of housing markets nationally over recent years. 6.9
Since the initiation of the credit crunch in 2007/8, the economy has gone through a long and deep
economic recession, and has subsequently started recovery. The momentum of economic recovery
is now improving with the UK economy out-performing many of its international peers.
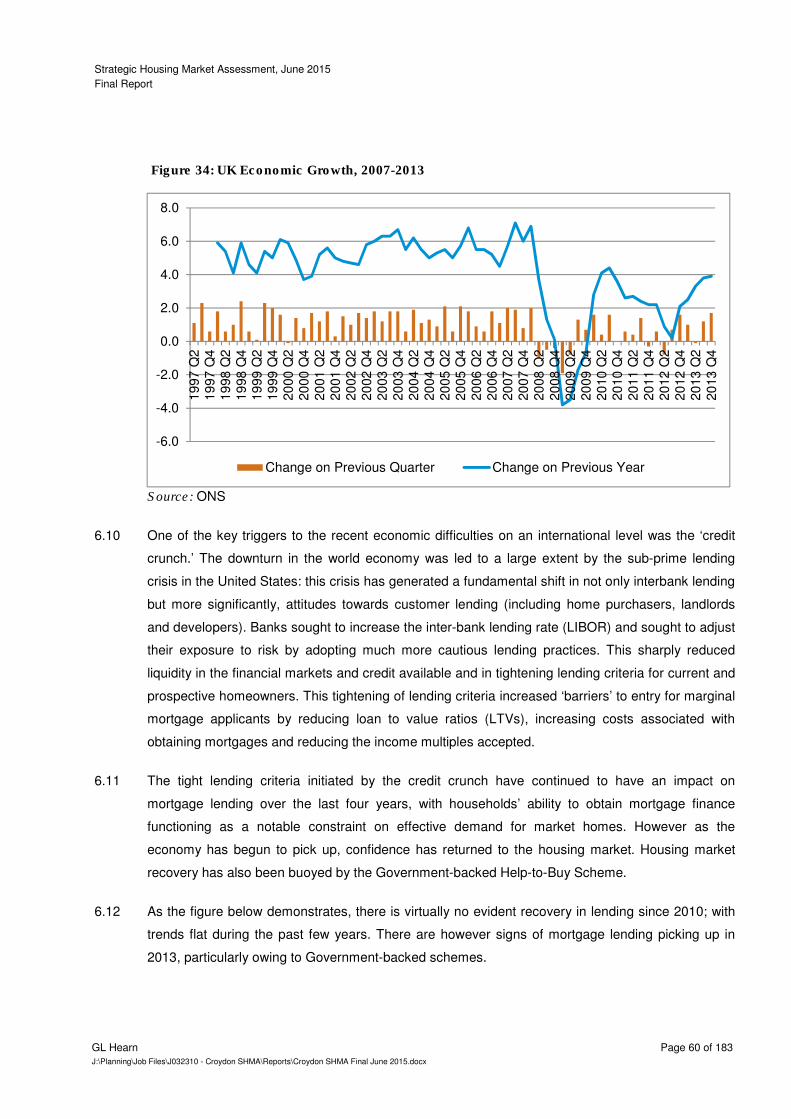
Strategic Housing Market Assessment, June 2015
Final Report
GL Hearn Page 60 of 183
J:\Planning\Job Files\J032310 - Croydon SHMA\Reports\Croydon SHMA Final June 2015.docx
UK Economic Growth, 2007-2013 Figure 34:
Source: ONS
One of the key triggers to the recent economic difficulties on an international level was the ‘credit 6.10
crunch.’ The downturn in the world economy was led to a large extent by the sub-prime lending
crisis in the United States: this crisis has generated a fundamental shift in not only interbank lending
but more significantly, attitudes towards customer lending (including home purchasers, landlords
and developers). Banks sought to increase the inter-bank lending rate (LIBOR) and sought to adjust
their exposure to risk by adopting much more cautious lending practices. This sharply reduced
liquidity in the financial markets and credit available and in tightening lending criteria for current and
prospective homeowners. This tightening of lending criteria increased ‘barriers’ to entry for marginal
mortgage applicants by reducing loan to value ratios (LTVs), increasing costs associated with
obtaining mortgages and reducing the income multiples accepted.
The tight lending criteria initiated by the credit crunch have continued to have an impact on 6.11
mortgage lending over the last four years, with households’ ability to obtain mortgage finance
functioning as a notable constraint on effective demand for market homes. However as the
economy has begun to pick up, confidence has returned to the housing market. Housing market
recovery has also been buoyed by the Government-backed Help-to-Buy Scheme.
As the figure below demonstrates, there is virtually no evident recovery in lending since 2010; with 6.12
trends flat during the past few years. There are however signs of mortgage lending picking up in
2013, particularly owing to Government-backed schemes.
-6.0
-4.0
-2.0
0.0
2.0
4.0
6.0
8.019
97 Q
219
97 Q
419
98 Q
219
98 Q
419
99 Q
219
99 Q
420
00 Q
220
00 Q
420
01 Q
220
01 Q
420
02 Q
220
02 Q
420
03 Q
220
03 Q
420
04 Q
220
04 Q
420
05 Q
220
05 Q
420
06 Q
220
06 Q
420
07 Q
220
07 Q
420
08 Q
220
08 Q
420
09 Q
220
09 Q
420
10 Q
220
10 Q
420
11 Q
220
11 Q
420
12 Q
220
12 Q
420
13 Q
220
13 Q
4
Change on Previous Quarter Change on Previous Year
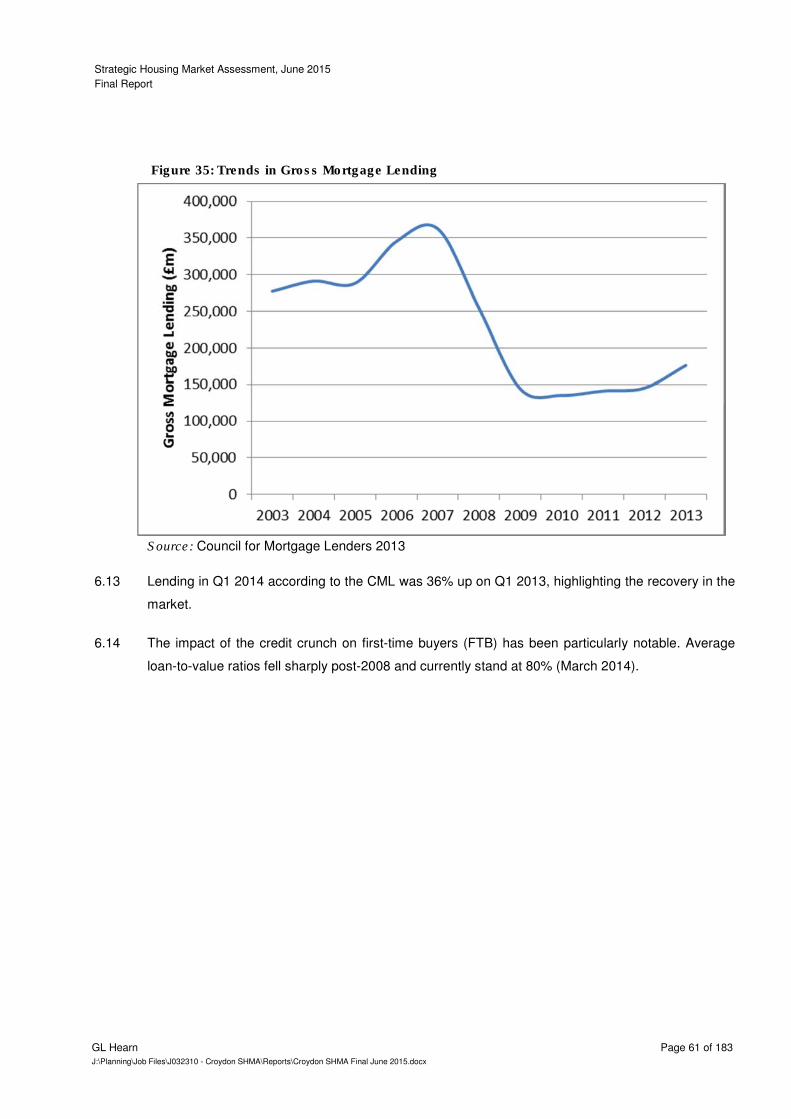
Strategic Housing Market Assessment, June 2015
Final Report
GL Hearn Page 61 of 183
J:\Planning\Job Files\J032310 - Croydon SHMA\Reports\Croydon SHMA Final June 2015.docx
Trends in Gross Mortgage Lending Figure 35:
Source: Council for Mortgage Lenders 2013
Lending in Q1 2014 according to the CML was 36% up on Q1 2013, highlighting the recovery in the 6.13
market.
The impact of the credit crunch on first-time buyers (FTB) has been particularly notable. Average 6.14
loan-to-value ratios fell sharply post-2008 and currently stand at 80% (March 2014).
Strategic Housing Market Assessment, June 2015
Final Report
GL Hearn Page 62 of 183
J:\Planning\Job Files\J032310 - Croydon SHMA\Reports\Croydon SHMA Final June 2015.docx
First-Time Buyer Numbers Figure 36:
Source: Council for Mortgage Lenders
Key issues affecting the ability of households and investors to secure mortgage finance are: 6.15
• Savings and Capital: the ability to raise a deposit;
• Earnings and Interest Rates: affecting the ability to afford repayments;
• Lending Criteria: key criteria which have to be met to secure finance.
The typical first-time buyer income multiple in April 2014 was 3.42 times their gross income. Low 6.16
mortgage interest rates have kept borrowers' payment burden low. First-time buyers spent 19.4% of
gross income on capital and interest payments. As the figure overleaf indicates first-time buyer
numbers have been gradually increasing but remain below levels pre-2007.
Market sales are also influenced by investment activity - that is properties bought to be rented 6.17
privately. The buy-to-let sector continues to grow, with the Council for Mortgage Lenders indicating
that the number of new buy-to-let loans in the first quarter of 2014 was slightly up on the fourth
quarter of 2013 to 47,000, up 1% on the previous quarter and 46% on the first quarter of 2013.
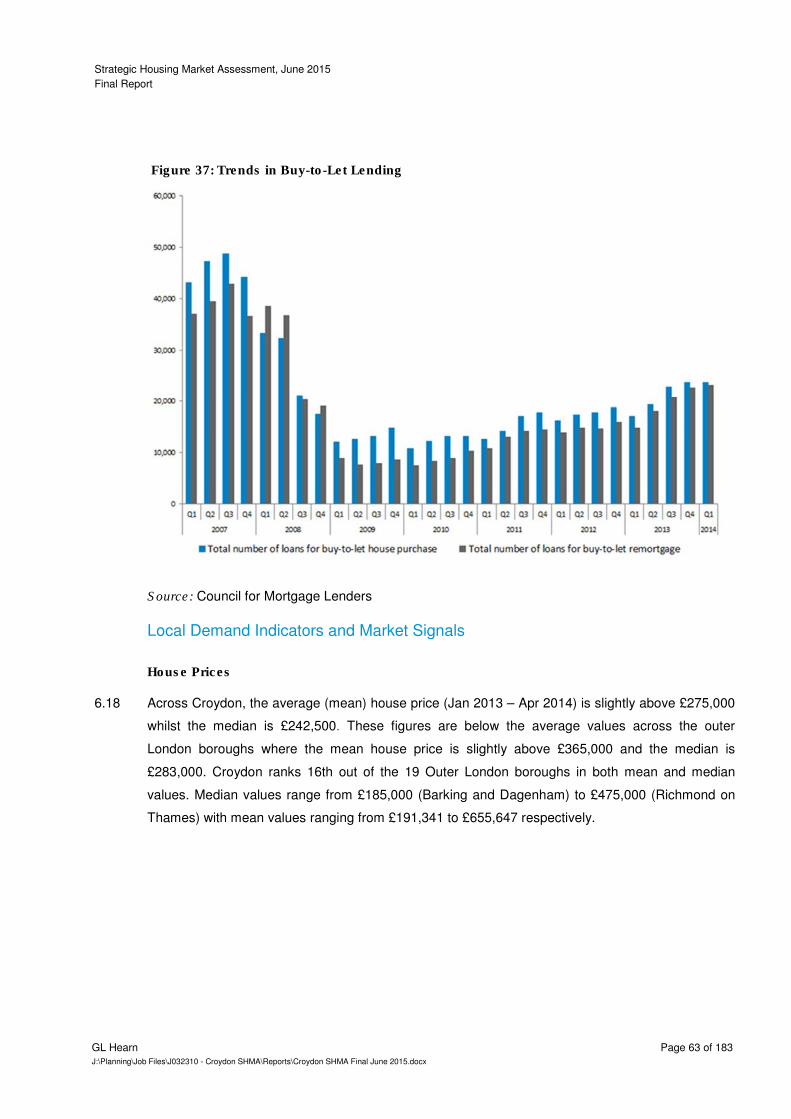
Strategic Housing Market Assessment, June 2015
Final Report
GL Hearn Page 63 of 183
J:\Planning\Job Files\J032310 - Croydon SHMA\Reports\Croydon SHMA Final June 2015.docx
Trends in Buy-to-Let Lending Figure 37:
Source: Council for Mortgage Lenders
Local Demand Indicators and Market Signals
House Prices
Across Croydon, the average (mean) house price (Jan 2013 – Apr 2014) is slightly above £275,000 6.18
whilst the median is £242,500. These figures are below the average values across the outer
London boroughs where the mean house price is slightly above £365,000 and the median is
£283,000. Croydon ranks 16th out of the 19 Outer London boroughs in both mean and median
values. Median values range from £185,000 (Barking and Dagenham) to £475,000 (Richmond on
Thames) with mean values ranging from £191,341 to £655,647 respectively.
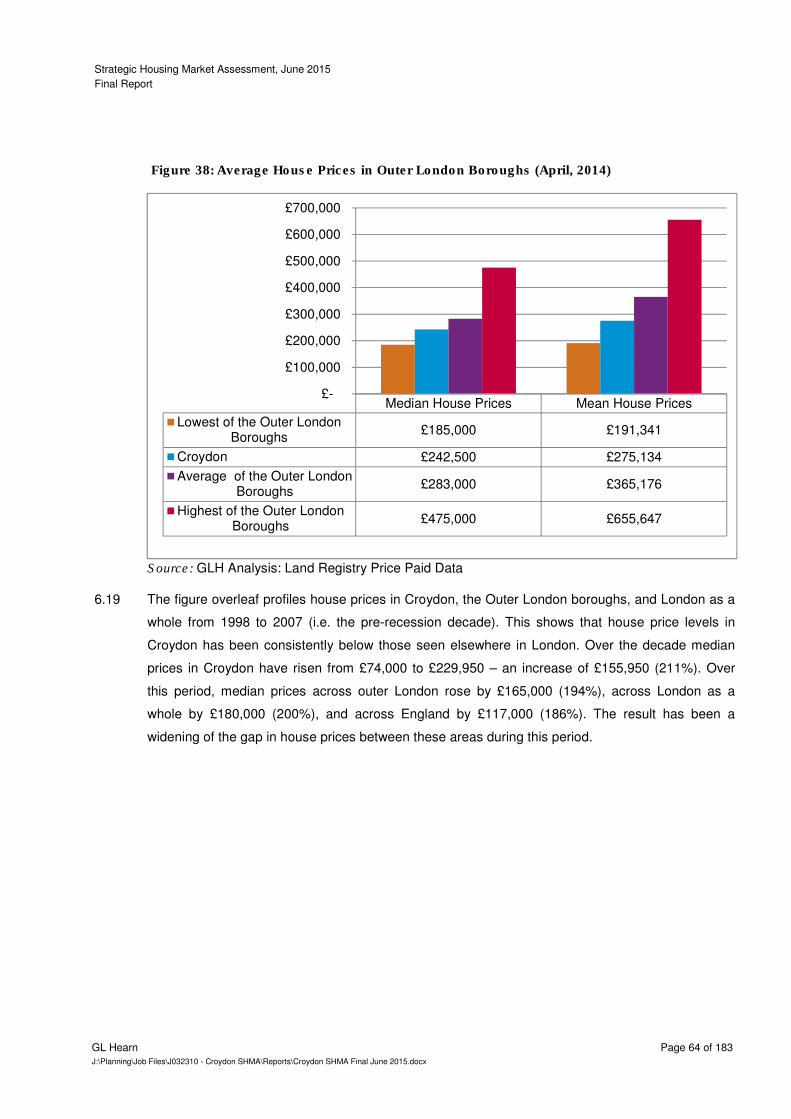
Strategic Housing Market Assessment, June 2015
Final Report
GL Hearn Page 64 of 183
J:\Planning\Job Files\J032310 - Croydon SHMA\Reports\Croydon SHMA Final June 2015.docx
Median House Prices Mean House Prices
Lowest of the Outer LondonBoroughs
£185,000 £191,341
Croydon £242,500 £275,134
Average of the Outer LondonBoroughs
£283,000 £365,176
Highest of the Outer LondonBoroughs
£475,000 £655,647
£-
£100,000
£200,000
£300,000
£400,000
£500,000
£600,000
£700,000
Average House Prices in Outer London Boroughs (April, 2014) Figure 38:
Source: GLH Analysis: Land Registry Price Paid Data
The figure overleaf profiles house prices in Croydon, the Outer London boroughs, and London as a 6.19
whole from 1998 to 2007 (i.e. the pre-recession decade). This shows that house price levels in
Croydon has been consistently below those seen elsewhere in London. Over the decade median
prices in Croydon have risen from £74,000 to £229,950 – an increase of £155,950 (211%). Over
this period, median prices across outer London rose by £165,000 (194%), across London as a
whole by £180,000 (200%), and across England by £117,000 (186%). The result has been a
widening of the gap in house prices between these areas during this period.
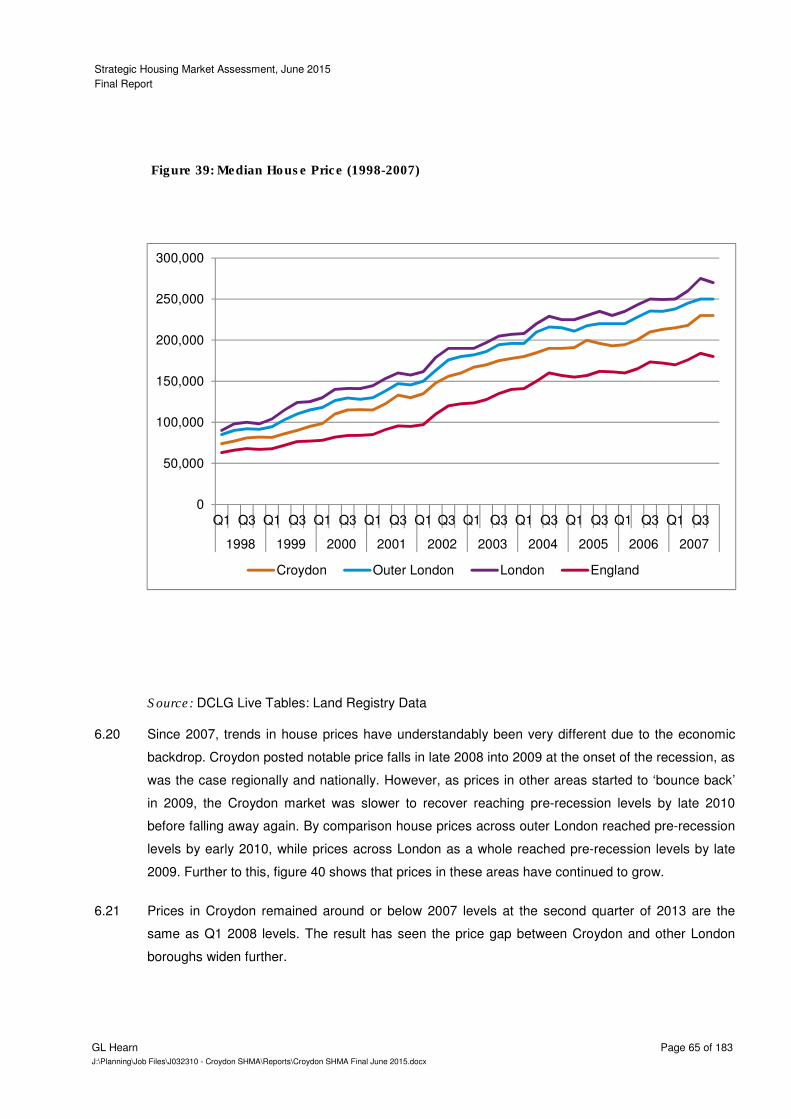
Strategic Housing Market Assessment, June 2015
Final Report
GL Hearn Page 65 of 183
J:\Planning\Job Files\J032310 - Croydon SHMA\Reports\Croydon SHMA Final June 2015.docx
Median House Price (1998-2007) Figure 39:
Source: DCLG Live Tables: Land Registry Data
Since 2007, trends in house prices have understandably been very different due to the economic 6.20
backdrop. Croydon posted notable price falls in late 2008 into 2009 at the onset of the recession, as
was the case regionally and nationally. However, as prices in other areas started to ‘bounce back’
in 2009, the Croydon market was slower to recover reaching pre-recession levels by late 2010
before falling away again. By comparison house prices across outer London reached pre-recession
levels by early 2010, while prices across London as a whole reached pre-recession levels by late
2009. Further to this, figure 40 shows that prices in these areas have continued to grow.
Prices in Croydon remained around or below 2007 levels at the second quarter of 2013 are the 6.21
same as Q1 2008 levels. The result has seen the price gap between Croydon and other London
boroughs widen further.
0
50,000
100,000
150,000
200,000
250,000
300,000
Q1 Q3 Q1 Q3 Q1 Q3 Q1 Q3 Q1 Q3 Q1 Q3 Q1 Q3 Q1 Q3 Q1 Q3 Q1 Q3
1998 1999 2000 2001 2002 2003 2004 2005 2006 2007
Croydon Outer London London England
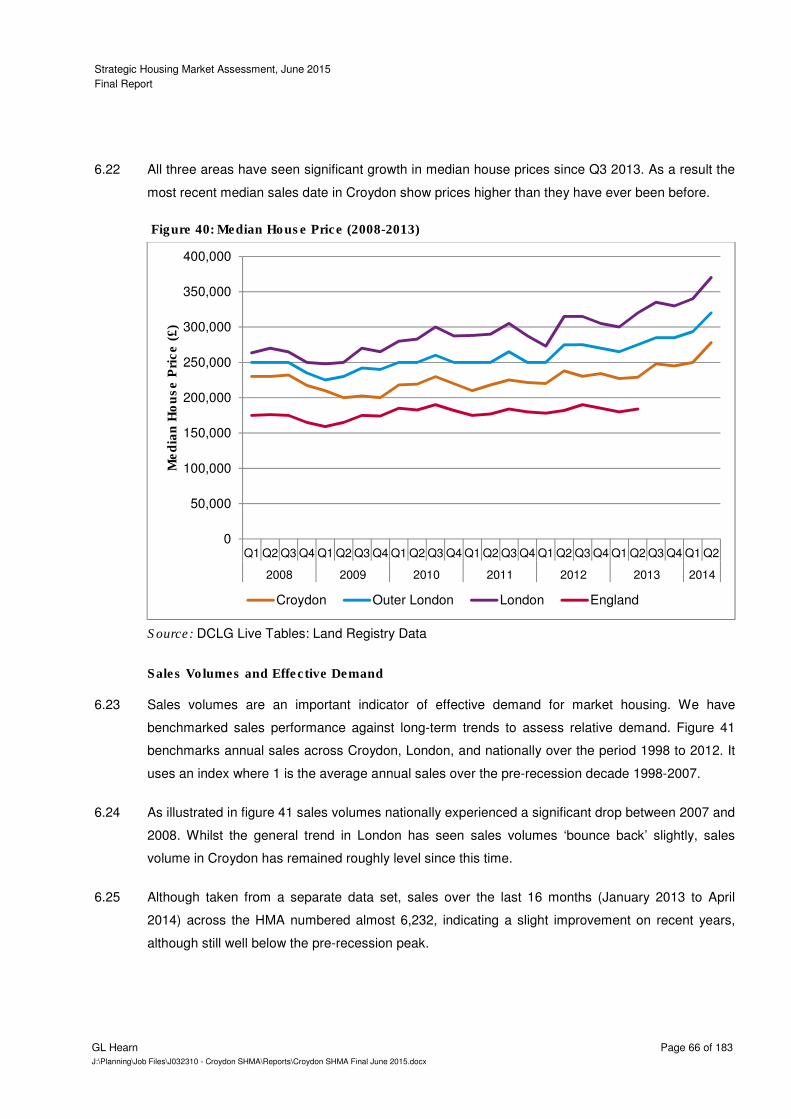
Strategic Housing Market Assessment, June 2015
Final Report
GL Hearn Page 66 of 183
J:\Planning\Job Files\J032310 - Croydon SHMA\Reports\Croydon SHMA Final June 2015.docx
All three areas have seen significant growth in median house prices since Q3 2013. As a result the 6.22
most recent median sales date in Croydon show prices higher than they have ever been before.
Median House Price (2008-2013) Figure 40:
Source: DCLG Live Tables: Land Registry Data
Sales Volumes and Effective Demand
Sales volumes are an important indicator of effective demand for market housing. We have 6.23
benchmarked sales performance against long-term trends to assess relative demand. Figure 41
benchmarks annual sales across Croydon, London, and nationally over the period 1998 to 2012. It
uses an index where 1 is the average annual sales over the pre-recession decade 1998-2007.
As illustrated in figure 41 sales volumes nationally experienced a significant drop between 2007 and 6.24
2008. Whilst the general trend in London has seen sales volumes ‘bounce back’ slightly, sales
volume in Croydon has remained roughly level since this time.
Although taken from a separate data set, sales over the last 16 months (January 2013 to April 6.25
2014) across the HMA numbered almost 6,232, indicating a slight improvement on recent years,
although still well below the pre-recession peak.
0
50,000
100,000
150,000
200,000
250,000
300,000
350,000
400,000
Q1 Q2 Q3 Q4 Q1 Q2 Q3 Q4 Q1 Q2 Q3 Q4 Q1 Q2 Q3 Q4 Q1 Q2 Q3 Q4 Q1 Q2 Q3 Q4 Q1 Q2
2008 2009 2010 2011 2012 2013 2014
Med
ian
Ho
use P
rice (
£)
Croydon Outer London London England
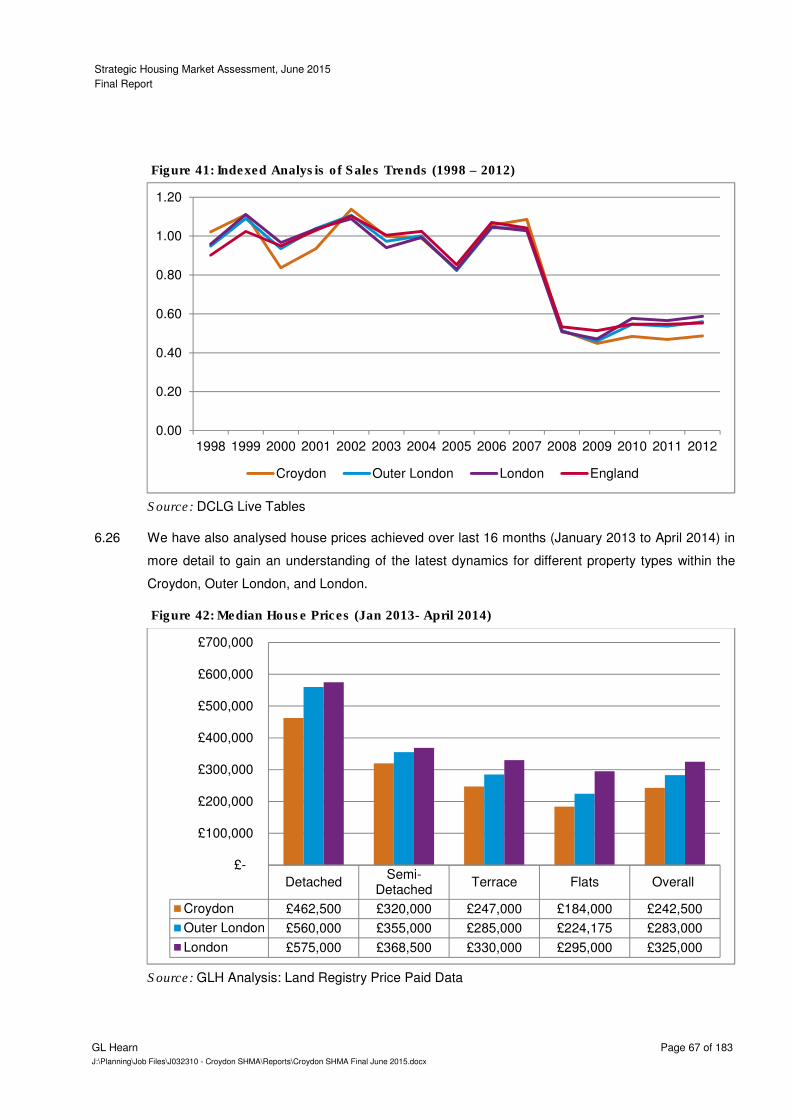
Strategic Housing Market Assessment, June 2015
Final Report
GL Hearn Page 67 of 183
J:\Planning\Job Files\J032310 - Croydon SHMA\Reports\Croydon SHMA Final June 2015.docx
Indexed Analysis of Sales Trends (1998 – 2012) Figure 41:
Source: DCLG Live Tables
We have also analysed house prices achieved over last 16 months (January 2013 to April 2014) in 6.26
more detail to gain an understanding of the latest dynamics for different property types within the
Croydon, Outer London, and London.
Median House Prices (Jan 2013- April 2014) Figure 42:
Source: GLH Analysis: Land Registry Price Paid Data
0.00
0.20
0.40
0.60
0.80
1.00
1.20
1998 1999 2000 2001 2002 2003 2004 2005 2006 2007 2008 2009 2010 2011 2012
Croydon Outer London London England
DetachedSemi-
DetachedTerrace Flats Overall
Croydon £462,500 £320,000 £247,000 £184,000 £242,500
Outer London £560,000 £355,000 £285,000 £224,175 £283,000
London £575,000 £368,500 £330,000 £295,000 £325,000
£-
£100,000
£200,000
£300,000
£400,000
£500,000
£600,000
£700,000
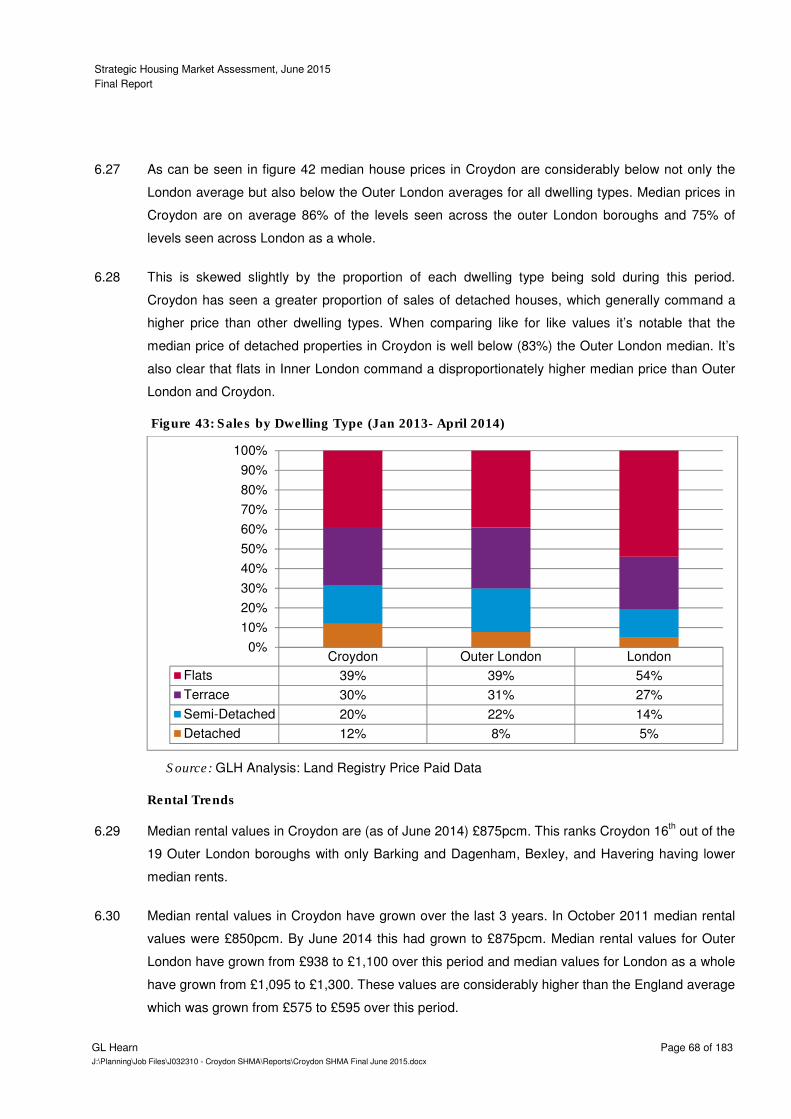
Strategic Housing Market Assessment, June 2015
Final Report
GL Hearn Page 68 of 183
J:\Planning\Job Files\J032310 - Croydon SHMA\Reports\Croydon SHMA Final June 2015.docx
As can be seen in figure 42 median house prices in Croydon are considerably below not only the 6.27
London average but also below the Outer London averages for all dwelling types. Median prices in
Croydon are on average 86% of the levels seen across the outer London boroughs and 75% of
levels seen across London as a whole.
This is skewed slightly by the proportion of each dwelling type being sold during this period. 6.28
Croydon has seen a greater proportion of sales of detached houses, which generally command a
higher price than other dwelling types. When comparing like for like values it’s notable that the
median price of detached properties in Croydon is well below (83%) the Outer London median. It’s
also clear that flats in Inner London command a disproportionately higher median price than Outer
London and Croydon.
Sales by Dwelling Type (Jan 2013- April 2014) Figure 43:
Source: GLH Analysis: Land Registry Price Paid Data
Rental Trends
Median rental values in Croydon are (as of June 2014) £875pcm. This ranks Croydon 16th out of the 6.29
19 Outer London boroughs with only Barking and Dagenham, Bexley, and Havering having lower
median rents.
Median rental values in Croydon have grown over the last 3 years. In October 2011 median rental 6.30
values were £850pcm. By June 2014 this had grown to £875pcm. Median rental values for Outer
London have grown from £938 to £1,100 over this period and median values for London as a whole
have grown from £1,095 to £1,300. These values are considerably higher than the England average
which was grown from £575 to £595 over this period.
Croydon Outer London London
Flats 39% 39% 54%
Terrace 30% 31% 27%
Semi-Detached 20% 22% 14%
Detached 12% 8% 5%
0%
10%
20%
30%
40%
50%
60%
70%
80%
90%
100%
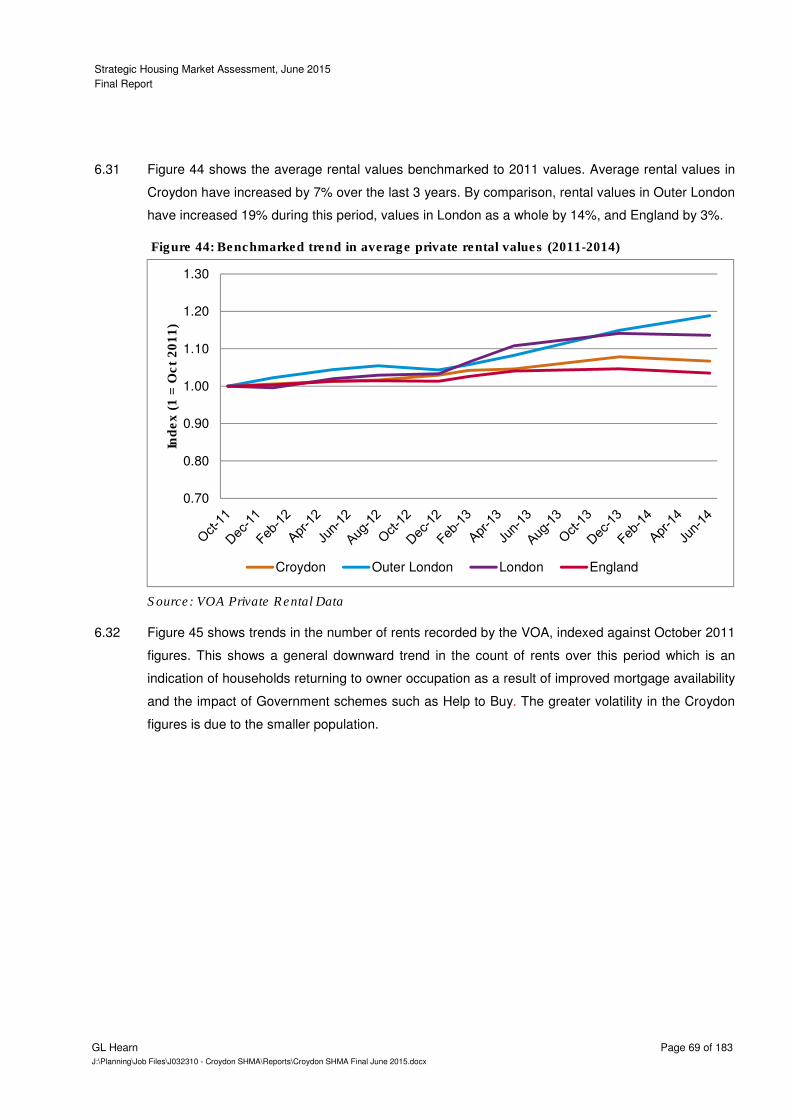
Strategic Housing Market Assessment, June 2015
Final Report
GL Hearn Page 69 of 183
J:\Planning\Job Files\J032310 - Croydon SHMA\Reports\Croydon SHMA Final June 2015.docx
Figure 44 shows the average rental values benchmarked to 2011 values. Average rental values in 6.31
Croydon have increased by 7% over the last 3 years. By comparison, rental values in Outer London
have increased 19% during this period, values in London as a whole by 14%, and England by 3%.
Benchmarked trend in average private rental values (2011-2014) Figure 44:
Source: VOA Private Rental Data
Figure 45 shows trends in the number of rents recorded by the VOA, indexed against October 2011 6.32
figures. This shows a general downward trend in the count of rents over this period which is an
indication of households returning to owner occupation as a result of improved mortgage availability
and the impact of Government schemes such as Help to Buy. The greater volatility in the Croydon
figures is due to the smaller population.
0.70
0.80
0.90
1.00
1.10
1.20
1.30
Ind
ex (
1 =
Oct
2011)
Croydon Outer London London England

Strategic Housing Market Assessment, June 2015
Final Report
GL Hearn Page 70 of 183
J:\Planning\Job Files\J032310 - Croydon SHMA\Reports\Croydon SHMA Final June 2015.docx
Trend in private rental transactions (September 2011 to June 2014) Figure 45:
Source: VOA Private Rental Data
Affordability of Market Housing
Price-income ratios
In line with the planning practice guidance, we have considered evidence of affordability by looking 6.33
specifically at the relationship between lower quartile house prices and incomes.
As a general observation, we can see that across all areas the affordability of property has 6.34
worsened quite markedly over the past 15 years; however, the issue has been continually more
acute across London. Nationally, the ratio of affordability peaked in 2007 before experiencing a
post-recession slump in 2009. Affordability ratios have since plateaued with current affordability
ratios lower than the 2007 peak.
London follows the national trend, albeit with a consistently higher affordability ratios, indicating a 6.35
greater gap between average house prices and incomes. Croydon tracked the London ratio closely
until the crash in 2009. Since 2009, house prices in Croydon have plateaued which is borne out in a
slower growth in the affordability ratio since then. As a result lower quartile affordability in Croydon
is slightly better than levels seen in Outer London and London as a whole. However, affordability in
Croydon remains considerably worse than the national average.
0.00
0.20
0.40
0.60
0.80
1.00
1.20
Ind
ex (
1 =
Sep
t 2011)
Croydon Outer London London England
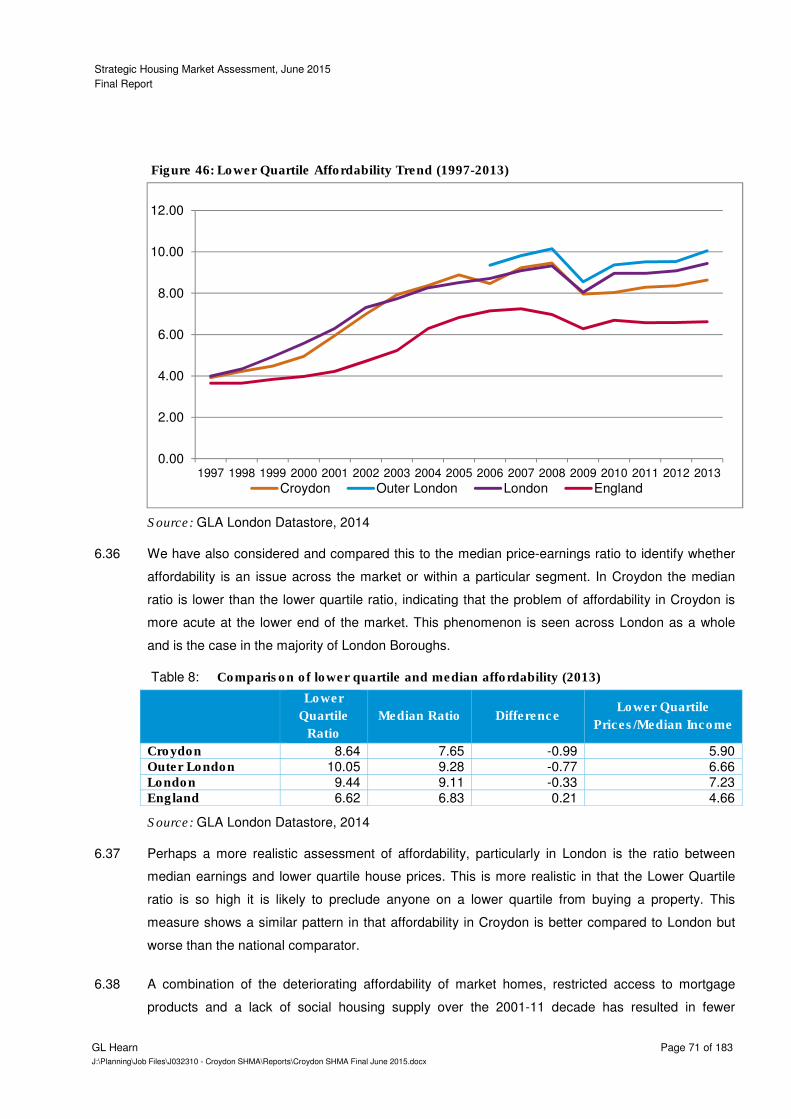
Strategic Housing Market Assessment, June 2015
Final Report
GL Hearn Page 71 of 183
J:\Planning\Job Files\J032310 - Croydon SHMA\Reports\Croydon SHMA Final June 2015.docx
Lower Quartile Affordability Trend (1997-2013) Figure 46:
Source: GLA London Datastore, 2014
We have also considered and compared this to the median price-earnings ratio to identify whether 6.36
affordability is an issue across the market or within a particular segment. In Croydon the median
ratio is lower than the lower quartile ratio, indicating that the problem of affordability in Croydon is
more acute at the lower end of the market. This phenomenon is seen across London as a whole
and is the case in the majority of London Boroughs.
Comparison of lower quartile and median affordability (2013) Table 8:
Lower
Quartile
Ratio
Median Ratio Difference Lower Quartile
Prices/Median Income
Croydon 8.64 7.65 -0.99 5.90 Outer London 10.05 9.28 -0.77 6.66 London 9.44 9.11 -0.33 7.23 England 6.62 6.83 0.21 4.66
Source: GLA London Datastore, 2014
Perhaps a more realistic assessment of affordability, particularly in London is the ratio between 6.37
median earnings and lower quartile house prices. This is more realistic in that the Lower Quartile
ratio is so high it is likely to preclude anyone on a lower quartile from buying a property. This
measure shows a similar pattern in that affordability in Croydon is better compared to London but
worse than the national comparator.
A combination of the deteriorating affordability of market homes, restricted access to mortgage 6.38
products and a lack of social housing supply over the 2001-11 decade has resulted in fewer
0.00
2.00
4.00
6.00
8.00
10.00
12.00
1997 1998 1999 2000 2001 2002 2003 2004 2005 2006 2007 2008 2009 2010 2011 2012 2013
Croydon Outer London London England
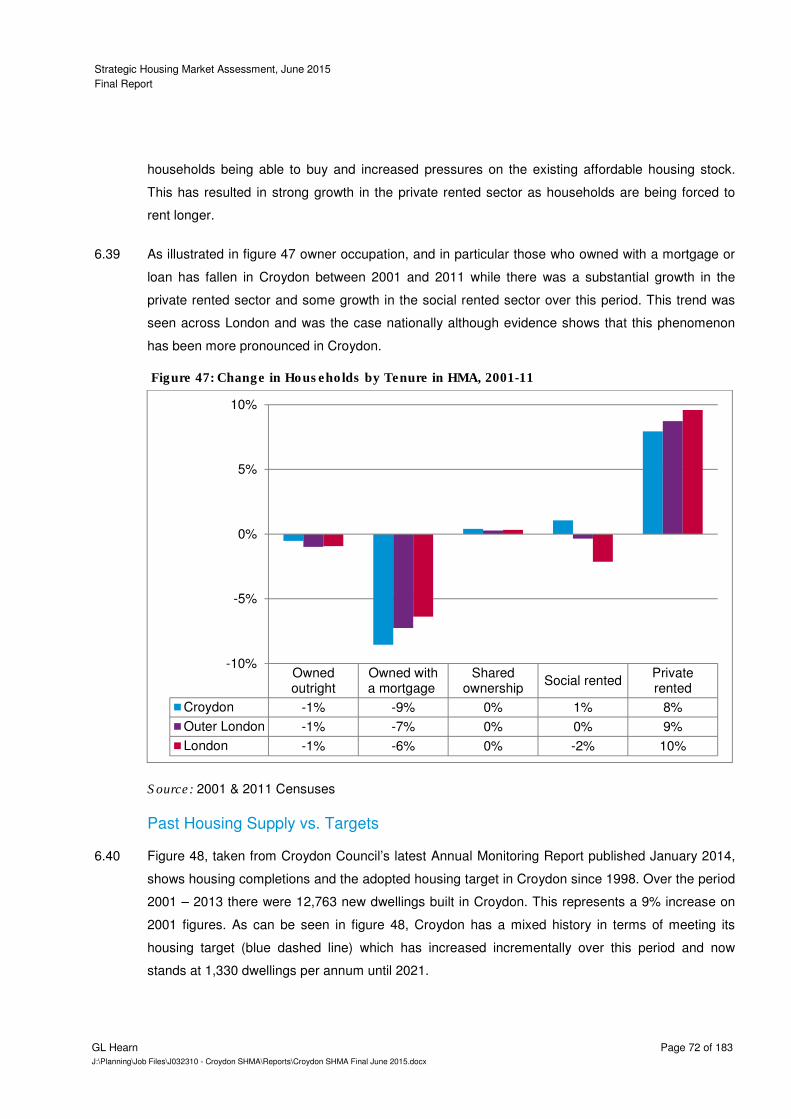
Strategic Housing Market Assessment, June 2015
Final Report
GL Hearn Page 72 of 183
J:\Planning\Job Files\J032310 - Croydon SHMA\Reports\Croydon SHMA Final June 2015.docx
households being able to buy and increased pressures on the existing affordable housing stock.
This has resulted in strong growth in the private rented sector as households are being forced to
rent longer.
As illustrated in figure 47 owner occupation, and in particular those who owned with a mortgage or 6.39
loan has fallen in Croydon between 2001 and 2011 while there was a substantial growth in the
private rented sector and some growth in the social rented sector over this period. This trend was
seen across London and was the case nationally although evidence shows that this phenomenon
has been more pronounced in Croydon.
Change in Households by Tenure in HMA, 2001-11 Figure 47:
Source: 2001 & 2011 Censuses
Past Housing Supply vs. Targets
Figure 48, taken from Croydon Council’s latest Annual Monitoring Report published January 2014, 6.40
shows housing completions and the adopted housing target in Croydon since 1998. Over the period
2001 – 2013 there were 12,763 new dwellings built in Croydon. This represents a 9% increase on
2001 figures. As can be seen in figure 48, Croydon has a mixed history in terms of meeting its
housing target (blue dashed line) which has increased incrementally over this period and now
stands at 1,330 dwellings per annum until 2021.
Ownedoutright
Owned witha mortgage
Sharedownership
Social rentedPrivaterented
Croydon -1% -9% 0% 1% 8%
Outer London -1% -7% 0% 0% 9%
London -1% -6% 0% -2% 10%
-10%
-5%
0%
5%
10%
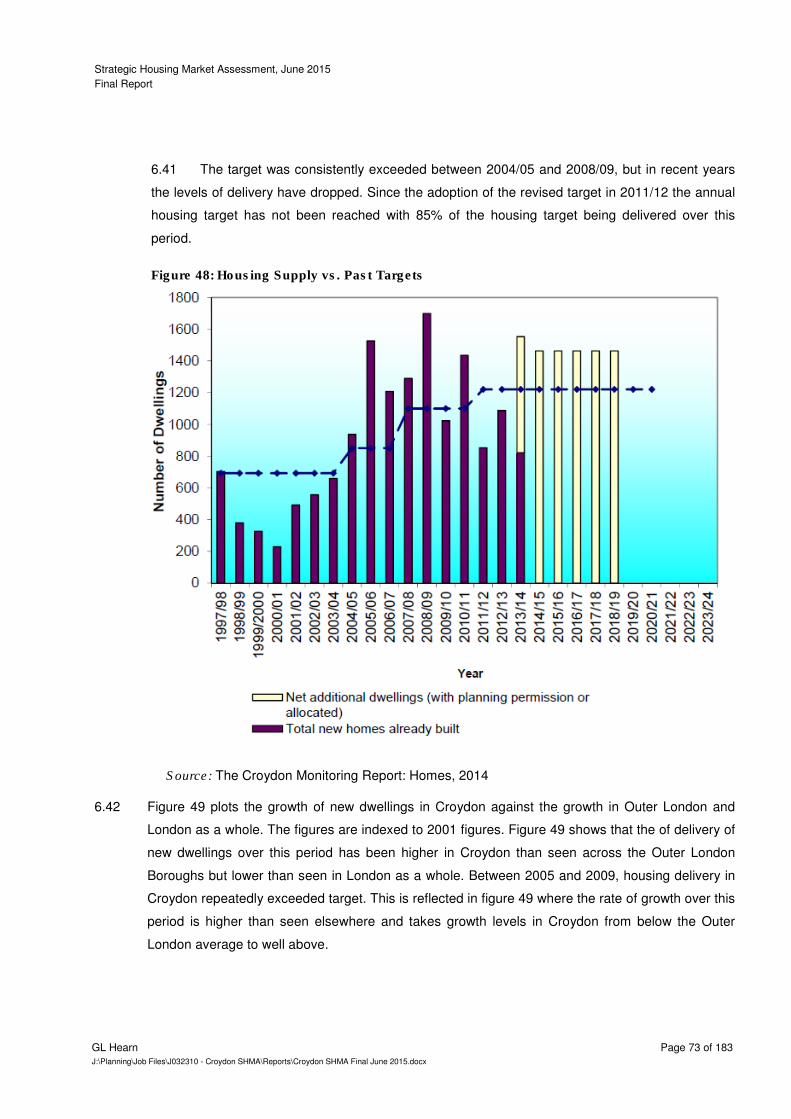
Strategic Housing Market Assessment, June 2015
Final Report
GL Hearn Page 73 of 183
J:\Planning\Job Files\J032310 - Croydon SHMA\Reports\Croydon SHMA Final June 2015.docx
The target was consistently exceeded between 2004/05 and 2008/09, but in recent years 6.41
the levels of delivery have dropped. Since the adoption of the revised target in 2011/12 the annual
housing target has not been reached with 85% of the housing target being delivered over this
period.
Housing Supply vs. Past Targets Figure 48:
Source: The Croydon Monitoring Report: Homes, 2014
Figure 49 plots the growth of new dwellings in Croydon against the growth in Outer London and 6.42
London as a whole. The figures are indexed to 2001 figures. Figure 49 shows that the of delivery of
new dwellings over this period has been higher in Croydon than seen across the Outer London
Boroughs but lower than seen in London as a whole. Between 2005 and 2009, housing delivery in
Croydon repeatedly exceeded target. This is reflected in figure 49 where the rate of growth over this
period is higher than seen elsewhere and takes growth levels in Croydon from below the Outer
London average to well above.
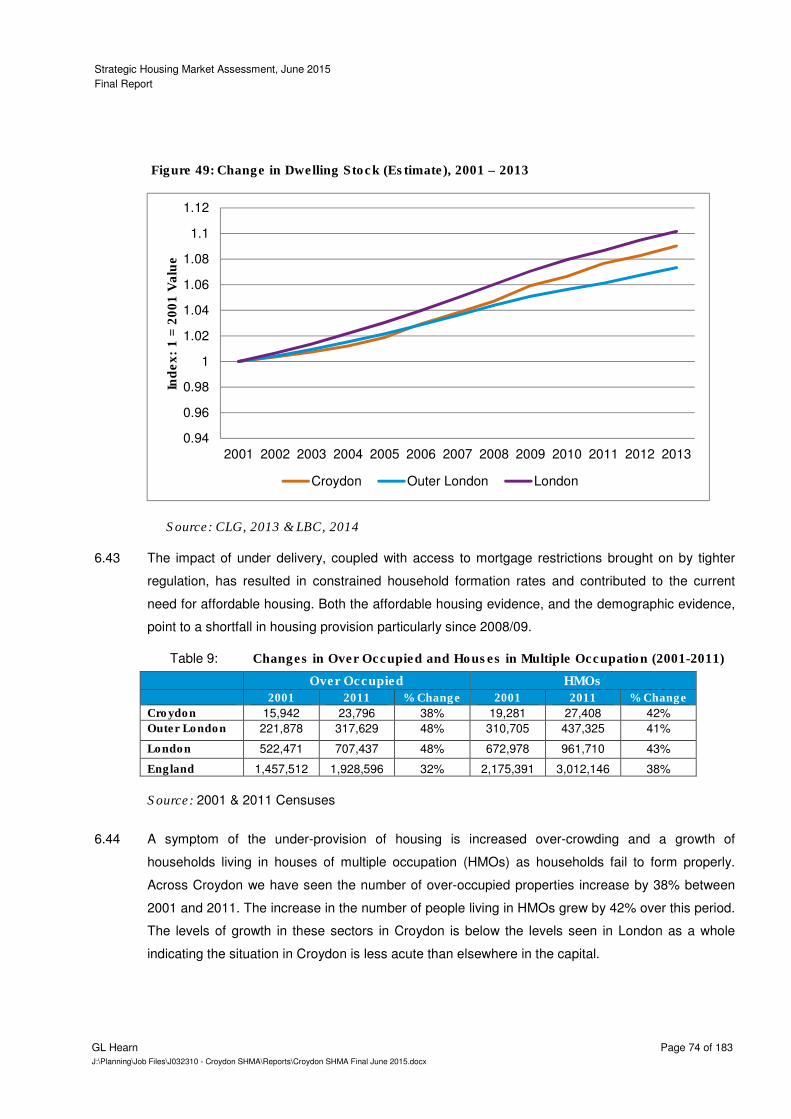
Strategic Housing Market Assessment, June 2015
Final Report
GL Hearn Page 74 of 183
J:\Planning\Job Files\J032310 - Croydon SHMA\Reports\Croydon SHMA Final June 2015.docx
Change in Dwelling Stock (Estimate), 2001 – 2013 Figure 49:
Source: CLG, 2013 & LBC, 2014
The impact of under delivery, coupled with access to mortgage restrictions brought on by tighter 6.43
regulation, has resulted in constrained household formation rates and contributed to the current
need for affordable housing. Both the affordable housing evidence, and the demographic evidence,
point to a shortfall in housing provision particularly since 2008/09.
Changes in Over Occupied and Houses in Multiple Occupation (2001-2011) Table 9:
Over Occupied HMOs
2001 2011 % Change 2001 2011 % Change
Croydon 15,942 23,796 38% 19,281 27,408 42%
Outer London 221,878 317,629 48% 310,705 437,325 41%
London 522,471 707,437 48% 672,978 961,710 43%
England 1,457,512 1,928,596 32% 2,175,391 3,012,146 38%
Source: 2001 & 2011 Censuses
A symptom of the under-provision of housing is increased over-crowding and a growth of 6.44
households living in houses of multiple occupation (HMOs) as households fail to form properly.
Across Croydon we have seen the number of over-occupied properties increase by 38% between
2001 and 2011. The increase in the number of people living in HMOs grew by 42% over this period.
The levels of growth in these sectors in Croydon is below the levels seen in London as a whole
indicating the situation in Croydon is less acute than elsewhere in the capital.
0.94
0.96
0.98
1
1.02
1.04
1.06
1.08
1.1
1.12
2001 2002 2003 2004 2005 2006 2007 2008 2009 2010 2011 2012 2013
Ind
ex:
1 =
2001 V
alu
e
Croydon Outer London London

Strategic Housing Market Assessment, June 2015
Final Report
GL Hearn Page 75 of 183
J:\Planning\Job Files\J032310 - Croydon SHMA\Reports\Croydon SHMA Final June 2015.docx
Qualitative Evidence
We have also undertaken some limited consultation with local estate and letting agents. Although 6.45
some agents covered the entire borough and beyond, most agents or particular offices operated in
a specific part of the Borough. Although overlapping three broad areas were noted. These were:
• Central and North Croydon (including East and West Croydon, Thornton Heath and
Addiscombe);
• South Croydon (including Sanderstead and New Addington); and
• Coulsdon (including Purley and Kenley).
Broadly the agents report that values have steadily increased across the Borough but there has not 6.46
been a significant jump in values. Although this has occurred locally in tandem with new build
supply and regeneration.
The main drivers of the housing market are links to central London although this is less so in the 6.47
East of the Borough.
There is some hope from agents that development of Westfield will bring more jobs to the Borough 6.48
and subsequently have a major impact on the housing market. Similarly the Overground extension
to West Croydon is seen as a long term driver of regeneration.
Central and North Croydon
The area had a wide variety of supply with pockets of 3, 4 and 5 bed semis and terraced properties, 6.49
in West Croydon and Addiscombe. East and Central Croydon the supply tended to be smaller 1 and
2 bedroom flats.
There is a significant number of new build developments coming on to the market in this area the 6.50
majority of which are being taken up by local London based investors although there has also been
some interest from international investors.
Occupiers in these areas tend to be individuals and couples. One agent had seen an eight fold 6.51
increase in the number of buyers and occupiers coming out from the London wide rental market
(including from North and East London). Most ex-renters tended to be young professionals no
children. They are particularly attracted to the area given the quality of access to Central London.
South Croydon
In this area demand is split between 1 and 2 bedroom properties in South Croydon and 3 and 4 6.52
bedroom semi- detached properties in Sanderstead. There is a particularly strong demand for 1-
bedroom properties in South Croydon with properties being sold very soon after coming on to the
market.

Strategic Housing Market Assessment, June 2015
Final Report
GL Hearn Page 76 of 183
J:\Planning\Job Files\J032310 - Croydon SHMA\Reports\Croydon SHMA Final June 2015.docx
Most of the demand in this area is from individuals and couples. Attracted to the area by the 6.53
transport links to Central London. Unlike Central and North Croydon these individuals tend to have
some historic link to the Borough. Semi-detached properties in Sanderstead tend to attract families,
again attracted by the Transport links.
The area does see some interest from investors although these tend to be local small scale 6.54
investors.
Coulsdon
Demand for housing was seen to be quite high in this particular area although supply has been 6.55
stagnant for the last 18 months. This has resulted in a notable increase in prices.
The area had particular demand for family sized accommodation (2&3 bedrooms), this reflects the 6.56
majority of the stock which tends to be larger in comparison to the wider Borough. Demand in the
area is driven by its good travel links into Central London and Gatwick and the quality of the schools
in the area.
Most of the demand was from people already in the Borough (particularly locally with the South of 6.57
the Borough but also from Norbury and Thornton Heath) seeking to upgrade, although there was
also notable demand from places such as Mitcham. The latter was particularly from families or
young couples moving to the area for the first time. Purley in particular had high demand from first
time buyers
We also asked whether there was in interest from Self-build across the Borough but most agents 6.58
agreed that there was very little supply of plots. Any sites that were available were mostly taken up
by developers rather than individuals.
Summary and Implications
There has been a fundamental shift in housing market conditions nationally since 2007, particularly 6.59
in relation to confidence and credit availability. Since the recession the housing market in Croydon
has steadied but has shown little sign of improvement. House prices have remained fairly constant
during this period and remain at pre-recession levels. Since 2007 sales volume in Croydon has
plateaued and has remained fairly level. In recent years private rental values have increased
slightly but there has been a general decline in the proportion of rental transactions in the borough.
The trends in Croydon roughly match the trends seen across the outer London boroughs and 6.60
London as a whole, indicating that the capital is the biggest influence on the local market. However,
the evidence consistently shows the housing market in Croydon is less buoyant than seen
elsewhere in London and shows the Croydon housing market is performing less well than many of

Strategic Housing Market Assessment, June 2015
Final Report
GL Hearn Page 77 of 183
J:\Planning\Job Files\J032310 - Croydon SHMA\Reports\Croydon SHMA Final June 2015.docx
the other outer London boroughs. In general, sales and rental values in Croydon are below the
average of the outer London boroughs. Conversely, levels of affordability are good relative to
London levels but still less affordable than the national benchmark. The evidence shows that this is
a long term trend, and predates the 2007 recession.
More recently, the housing market in Croydon has not benefited from the same post-recession 6.61
‘bounce back’ as was seen in other boroughs of Outer London and seen across London as a whole,
which has resulted in the performance gap (wages, affordability, house prices etc.) widening. This
has resulted in effective demand in Croydon below the London average.
This paints a picture of the Croydon housing market within the London context. However, when 6.62
considered within the national context, sales and rental values are higher than the national average
and the trend for sales and rental transactions shows Croydon performing worse than the national
average. Affordability in Croydon, although better than the majority of London boroughs, is much
worse than the national average – the evidence shows affordability ratio in Croydon is closer to
London average than the national average. As a result, over the past decade Croydon has
experienced a growth in the number of residents living in over occupied accommodation or HMOs.
While the increase in Croydon is less severe than seen in other London boroughs, it is notably
above the national trend.
Croydon has a mixed record of delivering new dwellings, exceeding target from 2004 to 2011, 6.63
however in recent years this target has not been delivered. When compared to other parts of
London it’s clear that the rate of delivering new housing stock in Croydon is better than the Outer
London average.
Strategic Housing Market Assessment, June 2015
Final Report
GL Hearn Page 78 of 183
J:\Planning\Job Files\J032310 - Croydon SHMA\Reports\Croydon SHMA Final June 2015.docx
7 OVERALL HOUSING NEED
Introduction
The analysis carried out follows the requirements of the National Planning Policy Framework and 7.1
the more recent (March 2014) CLG advice about assessing housing and economic development
needs. The National Planning Practice Guidance (NPPG) effectively describes a process whereby
the latest population and household projections are a starting point; and a number of “tests” then
need to be considered to examine whether it is appropriate to consider an upward adjustment to
housing provision. These are:
• Is there evidence that household formation rates in the projections have been constrained? Do
market signals point to a need to increase housing supply?
• How do the demographic projections ‘sit’ with the affordable housing needs evidence, and
should housing supply be increased to meet affordable needs?
• What do economic forecasts say about job growth? Is there evidence that an increase in
housing numbers would be needed to support this?
In this section consideration is given to demographic evidence of housing need. The analysis 7.2
begins by looking at the most recent household projections published by CLG and the GLA before
moving on to consider more recent population projection information to form a view about the most
appropriate scenario for Croydon. To convert population into households the concept of headship
rates is used and we have again studied recent data about household formation rates by age to
form a view about the most appropriate data to use. Finally the section considers the overlay
between population growth and job growth to check there will be a sufficient workforce moving
forward.
The core projections in this section look at housing needs in the period from 2013 to 2036. This 7.3
reflects the most appropriate base date given date availability.
What is the Starting Point to Establish the Need for Housing?
The NPPG states that ‘household projections published by the Department for Communities and 7.4
Local Government should provide the starting point estimate of overall housing need. The
household projections are produced by applying projected household representative rates to the
population projections published by the Office for National Statistics. Projected household
representative rates are based on trends observed in Census and Labour Force Survey data’.
At the time of writing these were the 2012-based subnational population projections (SNPP) and the 7.5
2011-based ‘interim’ household projections from CLG (which are directly based on the SNPP).
These projections are important as they provide a consistent approach where key inputs (such as
levels of internal migration) sum at a national level. The SNPP is also a good source of data as it

Strategic Housing Market Assessment, June 2015
Final Report
GL Hearn Page 79 of 183
J:\Planning\Job Files\J032310 - Croydon SHMA\Reports\Croydon SHMA Final June 2015.docx
uses a ‘multi-regional’ model that studies migratory movements by age and sex between all local
authorities in the Country. The SNPP is however limited by the accuracy of data underpinning it
such as migration which is notoriously difficult to accurately measure – particularly at smaller area
level.
The table below shows household growth from the 2011-based CLG projections. The projections 7.6
cover the 10-year period to 2021 which is the full period covered by CLG. For the whole period
studied this projection suggests an 18,384 increase in households (1,838 per annum). The
percentage increase in households is 12.6% which is above the figure for England (10%) but
notably below the London average (16%).
Projected household growth 2011-21 – CLG 2011-based household Table 10:
projections
Croydon
Households 2011 145,584
Households 2021 163,968
Change in households 18,384
Per annum 1,838
% change from 2011 12.6%
Source: CLG 2011-based household projections
We can also look back to older series of demographic projections such as the 2008-based CLG 7.7
household projections. This projection has the advantage of being extended beyond 2021 (which is
the end date of the 2011-based version). The outputs from the 2008-based CLG projections are
shown below (covering the period from 2011 to 2033 – the full range of these projections was 2008-
33). This shows a projected household growth of 1,664 per annum – slightly lower than the 2011-
based projections.
Projected household growth 2011-33 – CLG 2008-based household projections Table 11:
Croydon
Households 2011 149,796
Households 2033 186,405
Change in households 36,609
Per annum 1,664
% change from 2011 24.4%
Source: CLG 2008-based Household Projections
A final set of household projections that can be considered are those published by the GLA in their 7.8
‘2013 round population and household projections’. We discuss the population projections under-
pinning these in the next section and below have just provided the core outputs in terms of
household growth for the purposes of comparison with the two sources studied above.
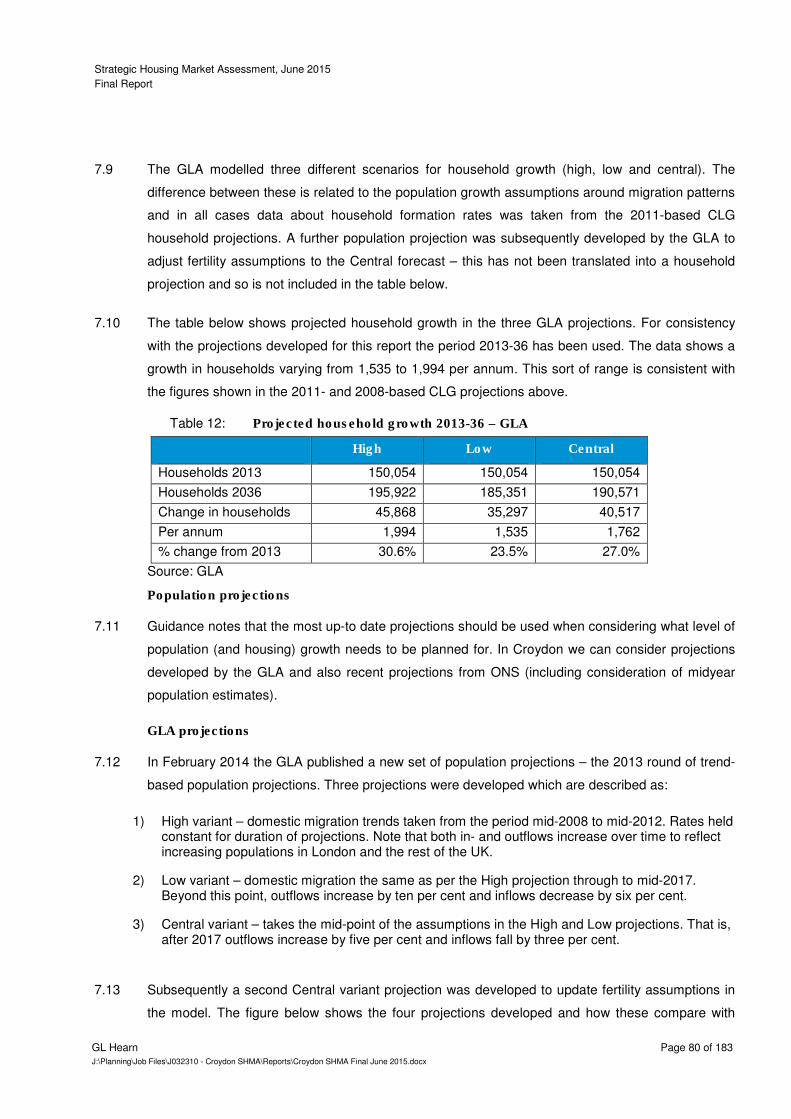
Strategic Housing Market Assessment, June 2015
Final Report
GL Hearn Page 80 of 183
J:\Planning\Job Files\J032310 - Croydon SHMA\Reports\Croydon SHMA Final June 2015.docx
The GLA modelled three different scenarios for household growth (high, low and central). The 7.9
difference between these is related to the population growth assumptions around migration patterns
and in all cases data about household formation rates was taken from the 2011-based CLG
household projections. A further population projection was subsequently developed by the GLA to
adjust fertility assumptions to the Central forecast – this has not been translated into a household
projection and so is not included in the table below.
The table below shows projected household growth in the three GLA projections. For consistency 7.10
with the projections developed for this report the period 2013-36 has been used. The data shows a
growth in households varying from 1,535 to 1,994 per annum. This sort of range is consistent with
the figures shown in the 2011- and 2008-based CLG projections above.
Projected household growth 2013-36 – GLA Table 12:
High Low Central
Households 2013 150,054 150,054 150,054
Households 2036 195,922 185,351 190,571
Change in households 45,868 35,297 40,517
Per annum 1,994 1,535 1,762
% change from 2013 30.6% 23.5% 27.0%
Source: GLA
Population projections
Guidance notes that the most up-to date projections should be used when considering what level of 7.11
population (and housing) growth needs to be planned for. In Croydon we can consider projections
developed by the GLA and also recent projections from ONS (including consideration of midyear
population estimates).
GLA projections
In February 2014 the GLA published a new set of population projections – the 2013 round of trend-7.12
based population projections. Three projections were developed which are described as:
1) High variant – domestic migration trends taken from the period mid-2008 to mid-2012. Rates held constant for duration of projections. Note that both in- and outflows increase over time to reflect increasing populations in London and the rest of the UK.
2) Low variant – domestic migration the same as per the High projection through to mid-2017. Beyond this point, outflows increase by ten per cent and inflows decrease by six per cent.
3) Central variant – takes the mid-point of the assumptions in the High and Low projections. That is, after 2017 outflows increase by five per cent and inflows fall by three per cent.
Subsequently a second Central variant projection was developed to update fertility assumptions in 7.13
the model. The figure below shows the four projections developed and how these compare with
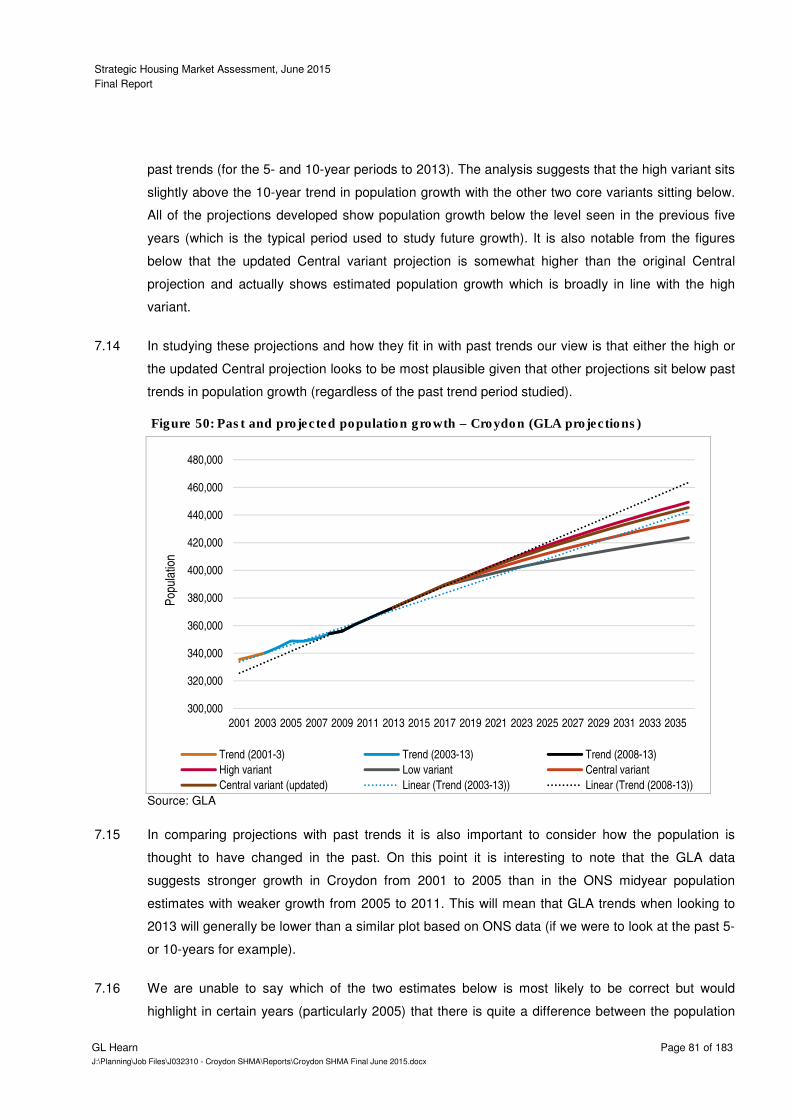
Strategic Housing Market Assessment, June 2015
Final Report
GL Hearn Page 81 of 183
J:\Planning\Job Files\J032310 - Croydon SHMA\Reports\Croydon SHMA Final June 2015.docx
300,000
320,000
340,000
360,000
380,000
400,000
420,000
440,000
460,000
480,000
2001 2003 2005 2007 2009 2011 2013 2015 2017 2019 2021 2023 2025 2027 2029 2031 2033 2035
Pop
ulat
ion
Trend (2001-3) Trend (2003-13) Trend (2008-13)
High variant Low variant Central variant
Central variant (updated) Linear (Trend (2003-13)) Linear (Trend (2008-13))
past trends (for the 5- and 10-year periods to 2013). The analysis suggests that the high variant sits
slightly above the 10-year trend in population growth with the other two core variants sitting below.
All of the projections developed show population growth below the level seen in the previous five
years (which is the typical period used to study future growth). It is also notable from the figures
below that the updated Central variant projection is somewhat higher than the original Central
projection and actually shows estimated population growth which is broadly in line with the high
variant.
In studying these projections and how they fit in with past trends our view is that either the high or 7.14
the updated Central projection looks to be most plausible given that other projections sit below past
trends in population growth (regardless of the past trend period studied).
Past and projected population growth – Croydon (GLA projections) Figure 50:
Source: GLA
In comparing projections with past trends it is also important to consider how the population is 7.15
thought to have changed in the past. On this point it is interesting to note that the GLA data
suggests stronger growth in Croydon from 2001 to 2005 than in the ONS midyear population
estimates with weaker growth from 2005 to 2011. This will mean that GLA trends when looking to
2013 will generally be lower than a similar plot based on ONS data (if we were to look at the past 5-
or 10-years for example).
We are unable to say which of the two estimates below is most likely to be correct but would 7.16
highlight in certain years (particularly 2005) that there is quite a difference between the population
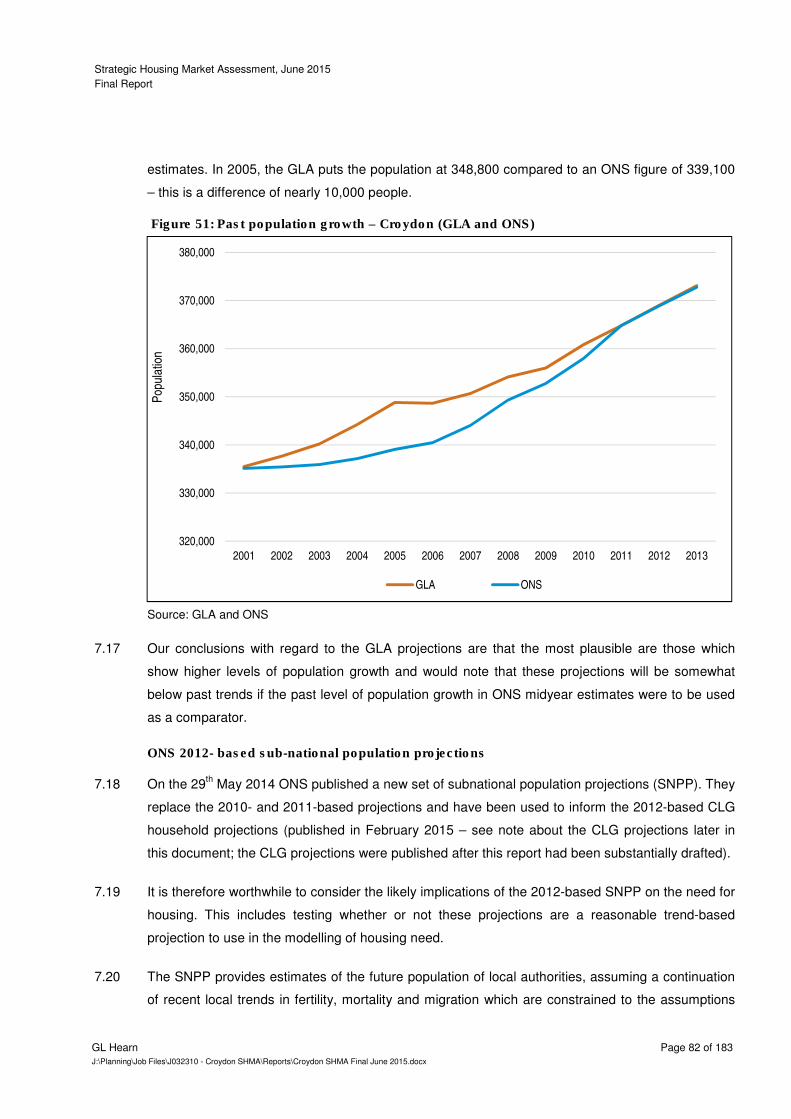
Strategic Housing Market Assessment, June 2015
Final Report
GL Hearn Page 82 of 183
J:\Planning\Job Files\J032310 - Croydon SHMA\Reports\Croydon SHMA Final June 2015.docx
estimates. In 2005, the GLA puts the population at 348,800 compared to an ONS figure of 339,100
– this is a difference of nearly 10,000 people.
Past population growth – Croydon (GLA and ONS) Figure 51:
Source: GLA and ONS
Our conclusions with regard to the GLA projections are that the most plausible are those which 7.17
show higher levels of population growth and would note that these projections will be somewhat
below past trends if the past level of population growth in ONS midyear estimates were to be used
as a comparator.
ONS 2012- based sub-national population projections
On the 29th May 2014 ONS published a new set of subnational population projections (SNPP). They 7.18
replace the 2010- and 2011-based projections and have been used to inform the 2012-based CLG
household projections (published in February 2015 – see note about the CLG projections later in
this document; the CLG projections were published after this report had been substantially drafted).
It is therefore worthwhile to consider the likely implications of the 2012-based SNPP on the need for 7.19
housing. This includes testing whether or not these projections are a reasonable trend-based
projection to use in the modelling of housing need.
The SNPP provides estimates of the future population of local authorities, assuming a continuation 7.20
of recent local trends in fertility, mortality and migration which are constrained to the assumptions
320,000
330,000
340,000
350,000
360,000
370,000
380,000
2001 2002 2003 2004 2005 2006 2007 2008 2009 2010 2011 2012 2013
Pop
ulat
ion
GLA ONS
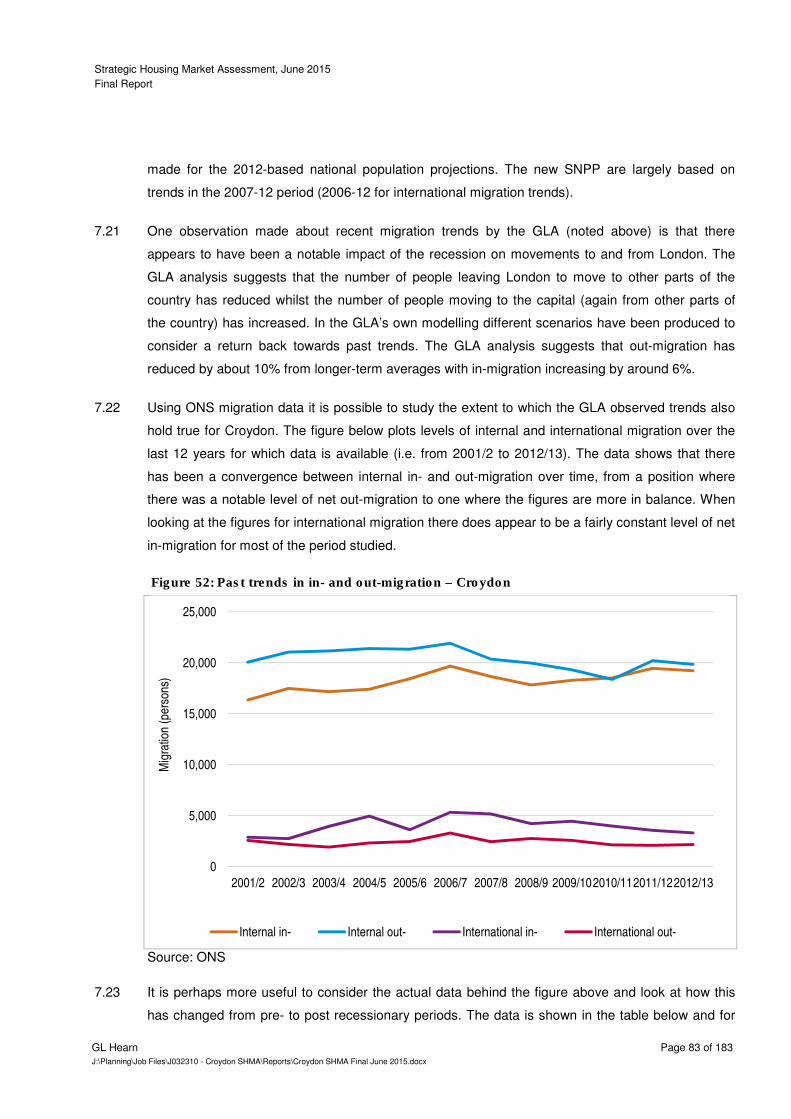
Strategic Housing Market Assessment, June 2015
Final Report
GL Hearn Page 83 of 183
J:\Planning\Job Files\J032310 - Croydon SHMA\Reports\Croydon SHMA Final June 2015.docx
made for the 2012-based national population projections. The new SNPP are largely based on
trends in the 2007-12 period (2006-12 for international migration trends).
One observation made about recent migration trends by the GLA (noted above) is that there 7.21
appears to have been a notable impact of the recession on movements to and from London. The
GLA analysis suggests that the number of people leaving London to move to other parts of the
country has reduced whilst the number of people moving to the capital (again from other parts of
the country) has increased. In the GLA’s own modelling different scenarios have been produced to
consider a return back towards past trends. The GLA analysis suggests that out-migration has
reduced by about 10% from longer-term averages with in-migration increasing by around 6%.
Using ONS migration data it is possible to study the extent to which the GLA observed trends also 7.22
hold true for Croydon. The figure below plots levels of internal and international migration over the
last 12 years for which data is available (i.e. from 2001/2 to 2012/13). The data shows that there
has been a convergence between internal in- and out-migration over time, from a position where
there was a notable level of net out-migration to one where the figures are more in balance. When
looking at the figures for international migration there does appear to be a fairly constant level of net
in-migration for most of the period studied.
Past trends in in- and out-migration – Croydon Figure 52:
Source: ONS
It is perhaps more useful to consider the actual data behind the figure above and look at how this 7.23
has changed from pre- to post recessionary periods. The data is shown in the table below and for
0
5,000
10,000
15,000
20,000
25,000
2001/2 2002/3 2003/4 2004/5 2005/6 2006/7 2007/8 2008/9 2009/102010/112011/122012/13
Mig
ratio
n (p
erso
ns)
Internal in- Internal out- International in- International out-
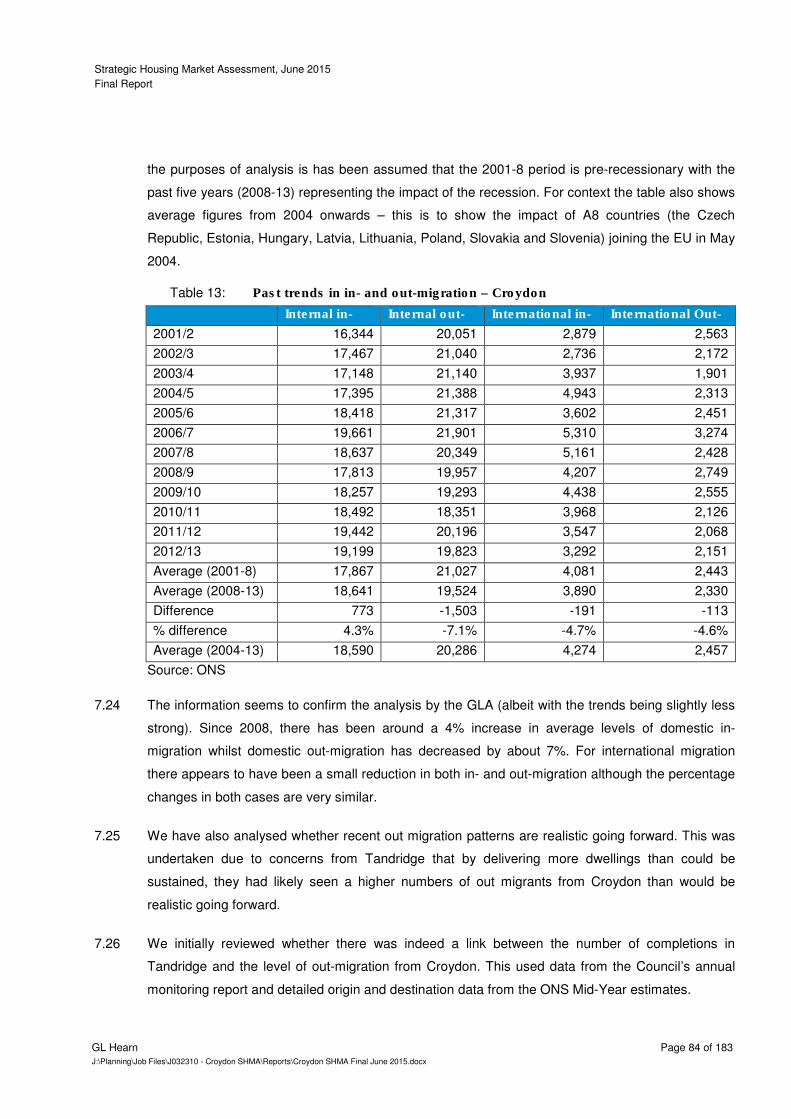
Strategic Housing Market Assessment, June 2015
Final Report
GL Hearn Page 84 of 183
J:\Planning\Job Files\J032310 - Croydon SHMA\Reports\Croydon SHMA Final June 2015.docx
the purposes of analysis is has been assumed that the 2001-8 period is pre-recessionary with the
past five years (2008-13) representing the impact of the recession. For context the table also shows
average figures from 2004 onwards – this is to show the impact of A8 countries (the Czech
Republic, Estonia, Hungary, Latvia, Lithuania, Poland, Slovakia and Slovenia) joining the EU in May
2004.
Past trends in in- and out-migration – Croydon Table 13:
Internal in- Internal out- International in- International Out-
2001/2 16,344 20,051 2,879 2,563
2002/3 17,467 21,040 2,736 2,172
2003/4 17,148 21,140 3,937 1,901
2004/5 17,395 21,388 4,943 2,313
2005/6 18,418 21,317 3,602 2,451
2006/7 19,661 21,901 5,310 3,274
2007/8 18,637 20,349 5,161 2,428
2008/9 17,813 19,957 4,207 2,749
2009/10 18,257 19,293 4,438 2,555
2010/11 18,492 18,351 3,968 2,126
2011/12 19,442 20,196 3,547 2,068
2012/13 19,199 19,823 3,292 2,151
Average (2001-8) 17,867 21,027 4,081 2,443
Average (2008-13) 18,641 19,524 3,890 2,330
Difference 773 -1,503 -191 -113
% difference 4.3% -7.1% -4.7% -4.6%
Average (2004-13) 18,590 20,286 4,274 2,457
Source: ONS
The information seems to confirm the analysis by the GLA (albeit with the trends being slightly less 7.24
strong). Since 2008, there has been around a 4% increase in average levels of domestic in-
migration whilst domestic out-migration has decreased by about 7%. For international migration
there appears to have been a small reduction in both in- and out-migration although the percentage
changes in both cases are very similar.
We have also analysed whether recent out migration patterns are realistic going forward. This was 7.25
undertaken due to concerns from Tandridge that by delivering more dwellings than could be
sustained, they had likely seen a higher numbers of out migrants from Croydon than would be
realistic going forward.
We initially reviewed whether there was indeed a link between the number of completions in 7.26
Tandridge and the level of out-migration from Croydon. This used data from the Council’s annual
monitoring report and detailed origin and destination data from the ONS Mid-Year estimates.
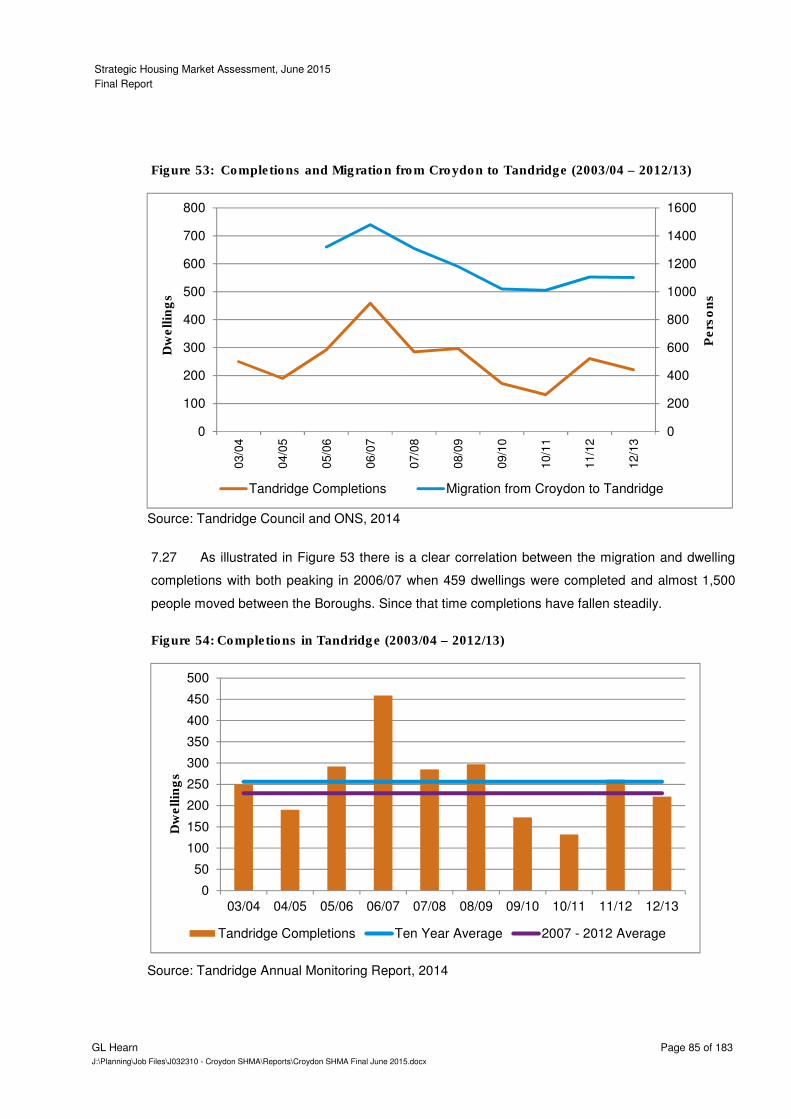
Strategic Housing Market Assessment, June 2015
Final Report
GL Hearn Page 85 of 183
J:\Planning\Job Files\J032310 - Croydon SHMA\Reports\Croydon SHMA Final June 2015.docx
Completions and Migration from Croydon to Tandridge (2003/04 – 2012/13) Figure 53:
Source: Tandridge Council and ONS, 2014
As illustrated in Figure 53 there is a clear correlation between the migration and dwelling 7.27
completions with both peaking in 2006/07 when 459 dwellings were completed and almost 1,500
people moved between the Boroughs. Since that time completions have fallen steadily.
Completions in Tandridge (2003/04 – 2012/13) Figure 54:
Source: Tandridge Annual Monitoring Report, 2014
0
200
400
600
800
1000
1200
1400
1600
0
100
200
300
400
500
600
700
800
03/0
4
04/0
5
05/0
6
06/0
7
07/0
8
08/0
9
09/1
0
10/1
1
11/1
2
12/1
3
Pers
on
s
Dw
ellin
gs
Tandridge Completions Migration from Croydon to Tandridge
0
50
100
150
200
250
300
350
400
450
500
03/04 04/05 05/06 06/07 07/08 08/09 09/10 10/11 11/12 12/13
Dw
ellin
gs
Tandridge Completions Ten Year Average 2007 - 2012 Average
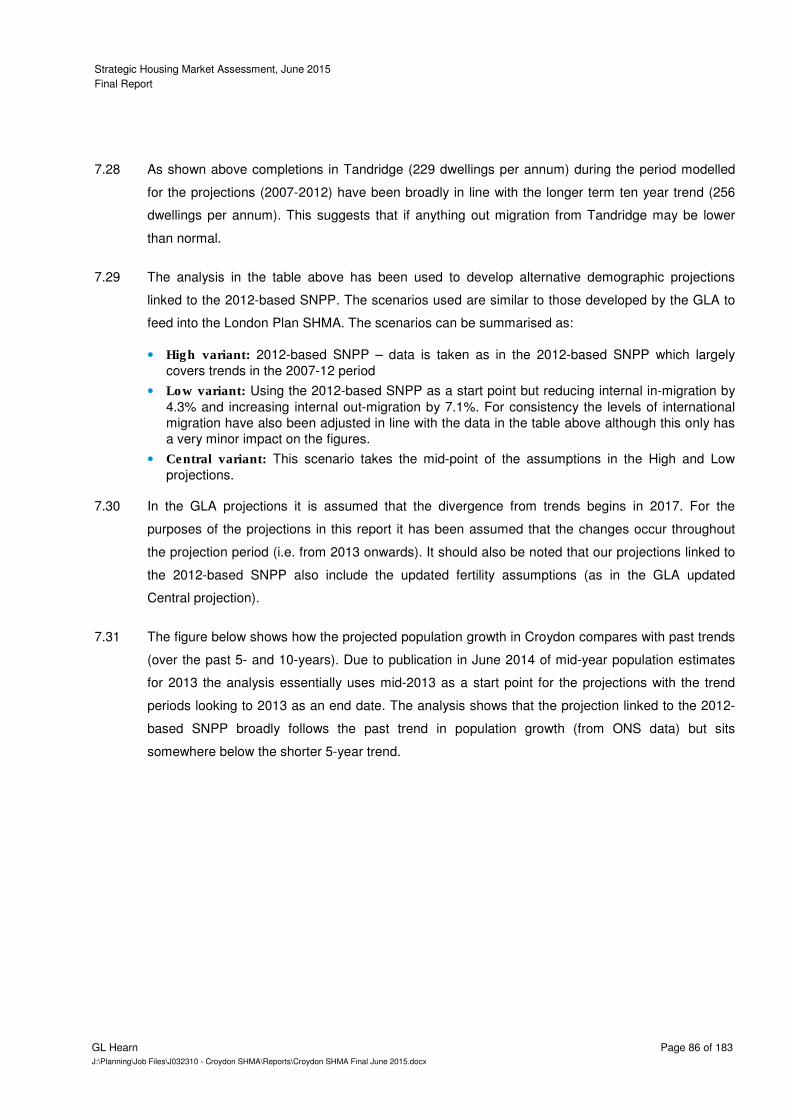
Strategic Housing Market Assessment, June 2015
Final Report
GL Hearn Page 86 of 183
J:\Planning\Job Files\J032310 - Croydon SHMA\Reports\Croydon SHMA Final June 2015.docx
As shown above completions in Tandridge (229 dwellings per annum) during the period modelled 7.28
for the projections (2007-2012) have been broadly in line with the longer term ten year trend (256
dwellings per annum). This suggests that if anything out migration from Tandridge may be lower
than normal.
The analysis in the table above has been used to develop alternative demographic projections 7.29
linked to the 2012-based SNPP. The scenarios used are similar to those developed by the GLA to
feed into the London Plan SHMA. The scenarios can be summarised as:
• High variant: 2012-based SNPP – data is taken as in the 2012-based SNPP which largely
covers trends in the 2007-12 period
• Low variant: Using the 2012-based SNPP as a start point but reducing internal in-migration by
4.3% and increasing internal out-migration by 7.1%. For consistency the levels of international
migration have also been adjusted in line with the data in the table above although this only has
a very minor impact on the figures.
• Central variant: This scenario takes the mid-point of the assumptions in the High and Low
projections.
In the GLA projections it is assumed that the divergence from trends begins in 2017. For the 7.30
purposes of the projections in this report it has been assumed that the changes occur throughout
the projection period (i.e. from 2013 onwards). It should also be noted that our projections linked to
the 2012-based SNPP also include the updated fertility assumptions (as in the GLA updated
Central projection).
The figure below shows how the projected population growth in Croydon compares with past trends 7.31
(over the past 5- and 10-years). Due to publication in June 2014 of mid-year population estimates
for 2013 the analysis essentially uses mid-2013 as a start point for the projections with the trend
periods looking to 2013 as an end date. The analysis shows that the projection linked to the 2012-
based SNPP broadly follows the past trend in population growth (from ONS data) but sits
somewhere below the shorter 5-year trend.
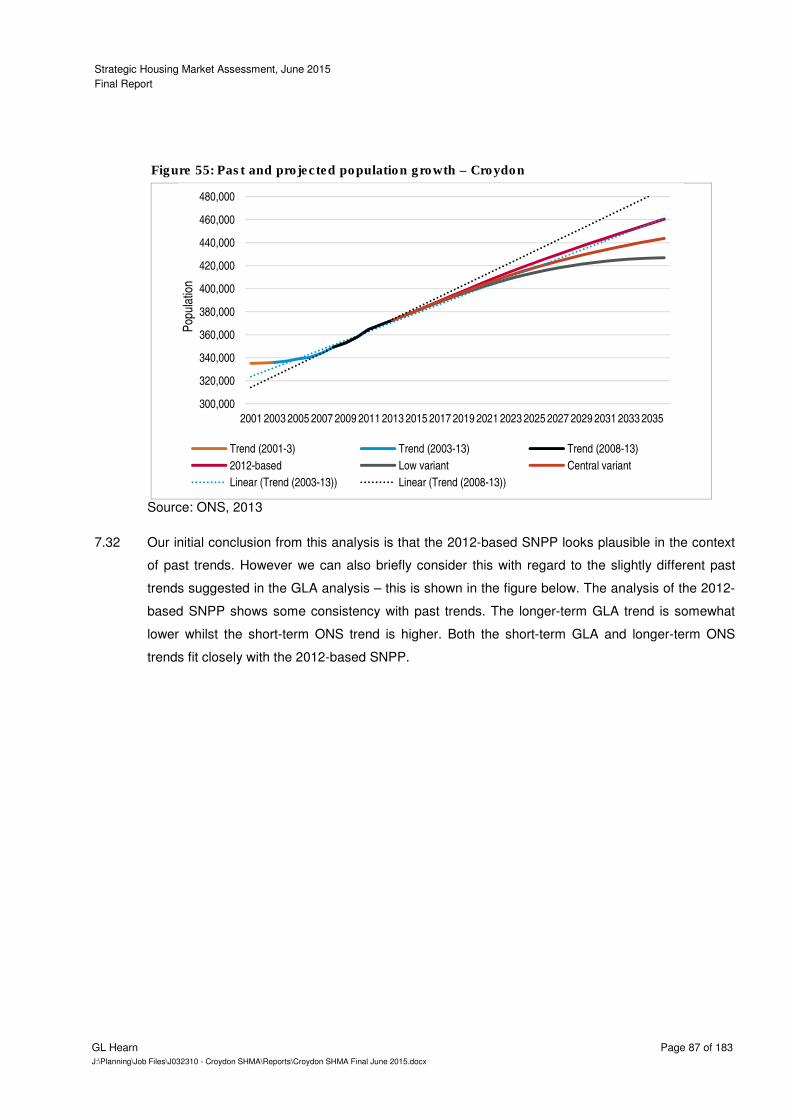
Strategic Housing Market Assessment, June 2015
Final Report
GL Hearn Page 87 of 183
J:\Planning\Job Files\J032310 - Croydon SHMA\Reports\Croydon SHMA Final June 2015.docx
Past and projected population growth – Croydon Figure 55:
Source: ONS, 2013
Our initial conclusion from this analysis is that the 2012-based SNPP looks plausible in the context 7.32
of past trends. However we can also briefly consider this with regard to the slightly different past
trends suggested in the GLA analysis – this is shown in the figure below. The analysis of the 2012-
based SNPP shows some consistency with past trends. The longer-term GLA trend is somewhat
lower whilst the short-term ONS trend is higher. Both the short-term GLA and longer-term ONS
trends fit closely with the 2012-based SNPP.
300,000
320,000
340,000
360,000
380,000
400,000
420,000
440,000
460,000
480,000
2001 2003 2005 2007 2009 2011 2013 2015 2017 2019 2021 2023 2025 2027 2029 2031 2033 2035
Pop
ulat
ion
Trend (2001-3) Trend (2003-13) Trend (2008-13)
2012-based Low variant Central variant
Linear (Trend (2003-13)) Linear (Trend (2008-13))
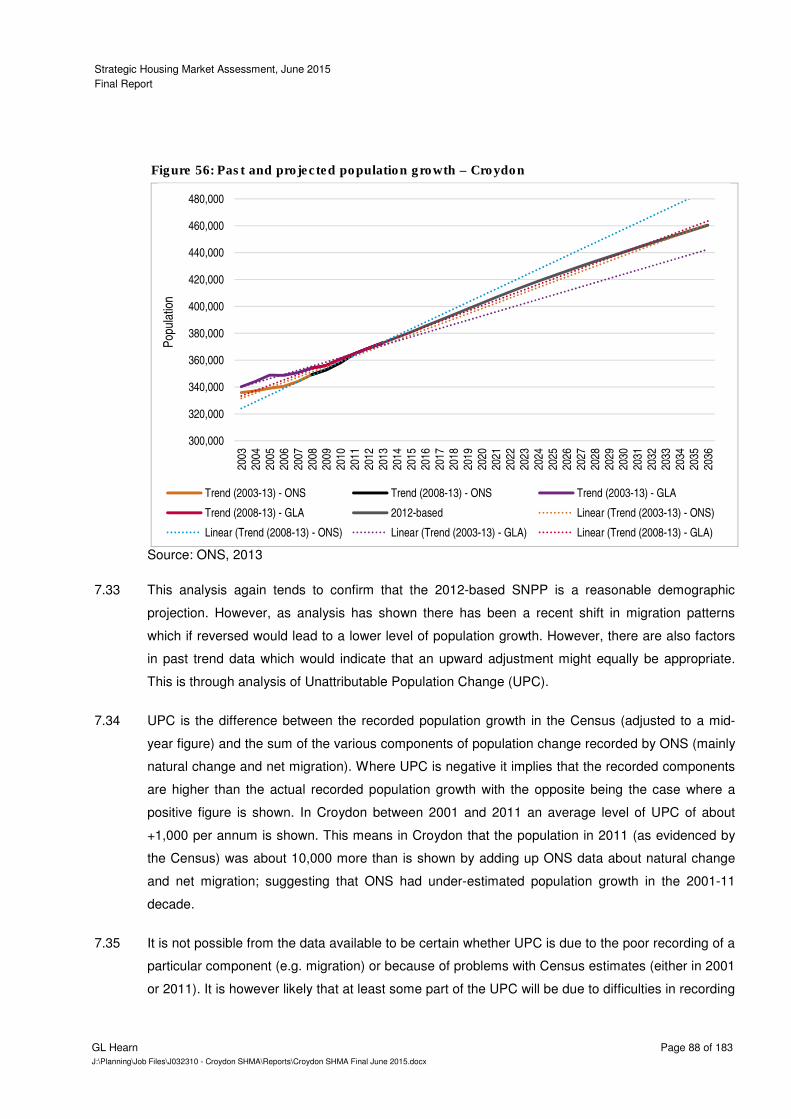
Strategic Housing Market Assessment, June 2015
Final Report
GL Hearn Page 88 of 183
J:\Planning\Job Files\J032310 - Croydon SHMA\Reports\Croydon SHMA Final June 2015.docx
Past and projected population growth – Croydon Figure 56:
Source: ONS, 2013
This analysis again tends to confirm that the 2012-based SNPP is a reasonable demographic 7.33
projection. However, as analysis has shown there has been a recent shift in migration patterns
which if reversed would lead to a lower level of population growth. However, there are also factors
in past trend data which would indicate that an upward adjustment might equally be appropriate.
This is through analysis of Unattributable Population Change (UPC).
UPC is the difference between the recorded population growth in the Census (adjusted to a mid-7.34
year figure) and the sum of the various components of population change recorded by ONS (mainly
natural change and net migration). Where UPC is negative it implies that the recorded components
are higher than the actual recorded population growth with the opposite being the case where a
positive figure is shown. In Croydon between 2001 and 2011 an average level of UPC of about
+1,000 per annum is shown. This means in Croydon that the population in 2011 (as evidenced by
the Census) was about 10,000 more than is shown by adding up ONS data about natural change
and net migration; suggesting that ONS had under-estimated population growth in the 2001-11
decade.
It is not possible from the data available to be certain whether UPC is due to the poor recording of a 7.35
particular component (e.g. migration) or because of problems with Census estimates (either in 2001
or 2011). It is however likely that at least some part of the UPC will be due to difficulties in recording
300,000
320,000
340,000
360,000
380,000
400,000
420,000
440,000
460,000
480,000
2003
2004
2005
2006
2007
2008
2009
2010
2011
2012
2013
2014
2015
2016
2017
2018
2019
2020
2021
2022
2023
2024
2025
2026
2027
2028
2029
2030
2031
2032
2033
2034
2035
2036
Pop
ulat
ion
Trend (2003-13) - ONS Trend (2008-13) - ONS Trend (2003-13) - GLA
Trend (2008-13) - GLA 2012-based Linear (Trend (2003-13) - ONS)
Linear (Trend (2008-13) - ONS) Linear (Trend (2003-13) - GLA) Linear (Trend (2008-13) - GLA)
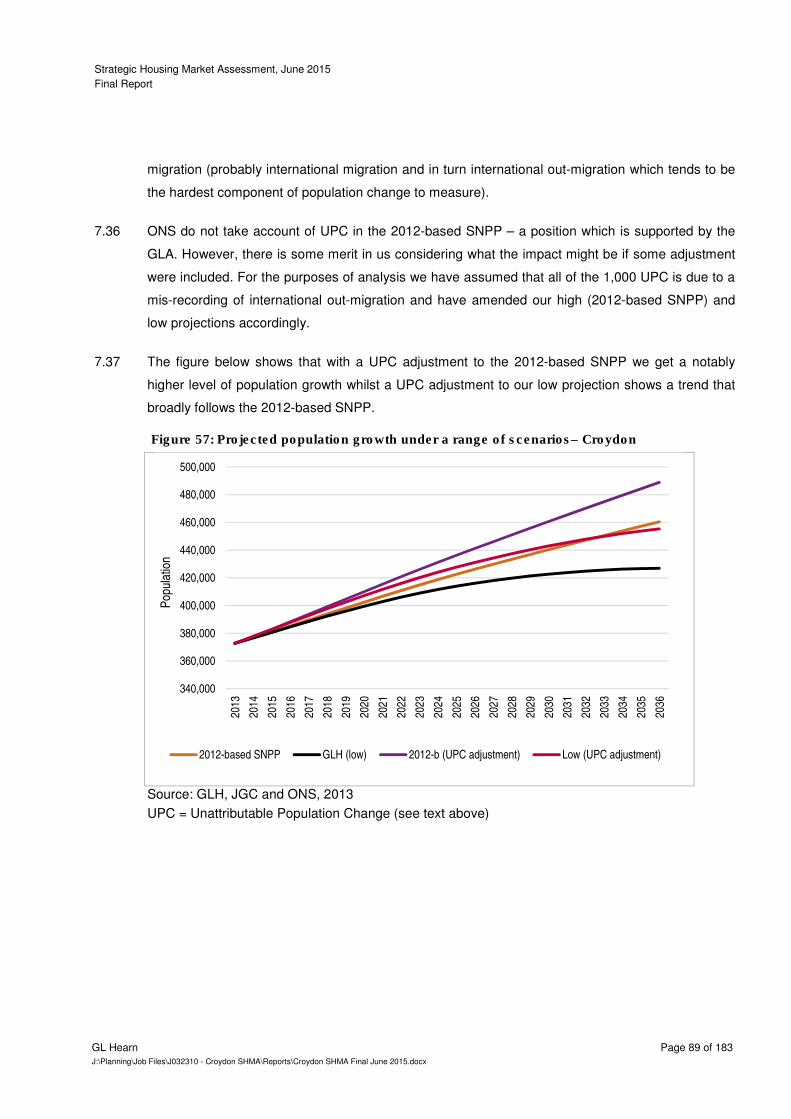
Strategic Housing Market Assessment, June 2015
Final Report
GL Hearn Page 89 of 183
J:\Planning\Job Files\J032310 - Croydon SHMA\Reports\Croydon SHMA Final June 2015.docx
migration (probably international migration and in turn international out-migration which tends to be
the hardest component of population change to measure).
ONS do not take account of UPC in the 2012-based SNPP – a position which is supported by the 7.36
GLA. However, there is some merit in us considering what the impact might be if some adjustment
were included. For the purposes of analysis we have assumed that all of the 1,000 UPC is due to a
mis-recording of international out-migration and have amended our high (2012-based SNPP) and
low projections accordingly.
The figure below shows that with a UPC adjustment to the 2012-based SNPP we get a notably 7.37
higher level of population growth whilst a UPC adjustment to our low projection shows a trend that
broadly follows the 2012-based SNPP.
Projected population growth under a range of scenarios– Croydon Figure 57:
Source: GLH, JGC and ONS, 2013
UPC = Unattributable Population Change (see text above)
340,000
360,000
380,000
400,000
420,000
440,000
460,000
480,000
500,000
2013
2014
2015
2016
2017
2018
2019
2020
2021
2022
2023
2024
2025
2026
2027
2028
2029
2030
2031
2032
2033
2034
2035
2036
Pop
ulat
ion
2012-based SNPP GLH (low) 2012-b (UPC adjustment) Low (UPC adjustment)
Strategic Housing Market Assessment, June 2015
Final Report
GL Hearn Page 90 of 183
J:\Planning\Job Files\J032310 - Croydon SHMA\Reports\Croydon SHMA Final June 2015.docx
Considering Household Formation
7.37 Whilst the analysis above points to the 2012-based SNPP as being broadly reasonable we also
need to convert the population data into household estimates and hence into housing need.
Population data is converted into households by using the concept of headship rates (essentially
the chances of a person in any particular age band being the head of household – i.e. headship rate
× population by age band = number of households). There are two main sources of data for
headship rates; these are the 2011- and 2008-based CLG household projections. Generally, the
2011-based projections are criticised for including an element of suppression moving forward whilst
the 2008-based projections are less constrained.
For our analysis here we have looked in some detail at the specific headship rates in each of these 7.38
sources and how this might change in the future. The figure below shows:
a) Headship rates in the 2011-based CLG projections
b) Headship rates in the 2008-based CLG projections (including a time series back to 2001)
c) The trends if headship were to ‘track’ the 2008-based figures from 2011 onwards
There are a number of observations which can be made; these are most easily done on an 7.39
individual age band basis:
• 15-24 and 25-34 – the 2011-based rates go down whilst the 2008-based rates go up from 2011.
The 2011-based rates imply that additional suppression is expected in the future. These age
groups are two which may well have been impacted by housing market factors (such as lack of
mortgage availability) and to plan positively in the future we might expect improved affordability
to see some increase. Hence the trends shown in the 2011-based projections do look to be a bit
pessimistic.
• 35-44 – the 2011-based rates are fairly constant moving forward whereas the 2008-based rates
shown some positive improvement. Whilst we do not consider the flat-rate in the 2011-based
projection to be unrealistic some improvement in the future would mean that more households
are able to form.
• 45-54 and 55-64 – both of these age groups are expected to see some improvement moving
forward in the 2011-based projections. Some small improvements are not unrealistic although
we would expect the headship rates of these groups to be more constant over time given that
people in these age groups are likely to be in more established families/households.
• 65-74 – both the 2011- and 2008-based projections are fairly flat over time (albeit from a
different base position in 2011)
• 75-84 and 85+ - both of these groups show notable increase over time in the 2011-based
projections. This does not seem right. Generally, if anything, we would expect the rates in these
age groups to fall (as people live longer and therefore remain in couple households for longer). It
is not considered that the 2011-based projections are realistic for these age groups, whereas the
trends in the 2008-based projections look plausible.

Strategic Housing Market Assessment, June 2015
Final Report
GL Hearn Page 91 of 183
J:\Planning\Job Files\J032310 - Croydon SHMA\Reports\Croydon SHMA Final June 2015.docx
The figures overleaf show the proportions of each age group which is likely to be a head of a 7.40
household. The vertical axis shows this percentage with 0.4 equating to 40%. Each graph has three
lines representing the headship rates applied in each of three projections.
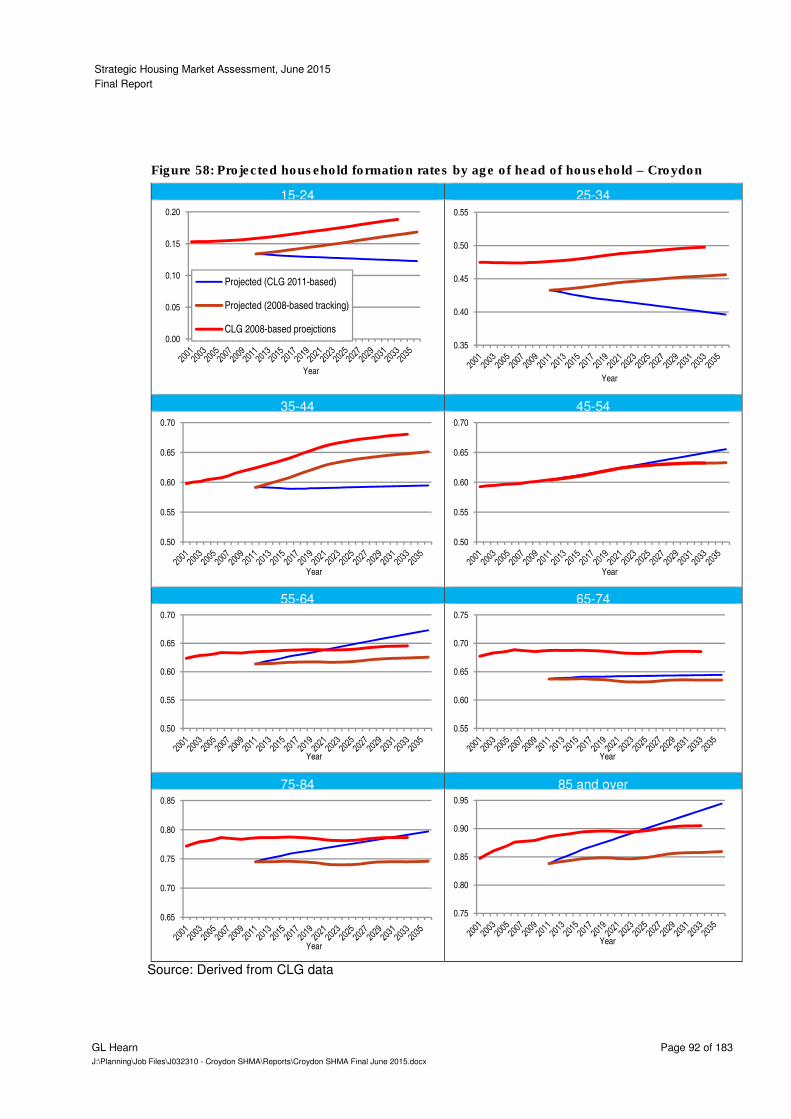
Strategic Housing Market Assessment, June 2015
Final Report
GL Hearn Page 92 of 183
J:\Planning\Job Files\J032310 - Croydon SHMA\Reports\Croydon SHMA Final June 2015.docx
Projected household formation rates by age of head of household – Croydon Figure 58:
15-24 25-34
35-44 45-54
55-64 65-74
75-84 85 and over
Source: Derived from CLG data
0.00
0.05
0.10
0.15
0.20
Year
Projected (CLG 2011-based)
Projected (2008-based tracking)
CLG 2008-based proejctions
0.35
0.40
0.45
0.50
0.55
Year
0.50
0.55
0.60
0.65
0.70
Year
0.50
0.55
0.60
0.65
0.70
Year
0.50
0.55
0.60
0.65
0.70
Year
0.55
0.60
0.65
0.70
0.75
Year
0.65
0.70
0.75
0.80
0.85
Year
0.75
0.80
0.85
0.90
0.95
Year
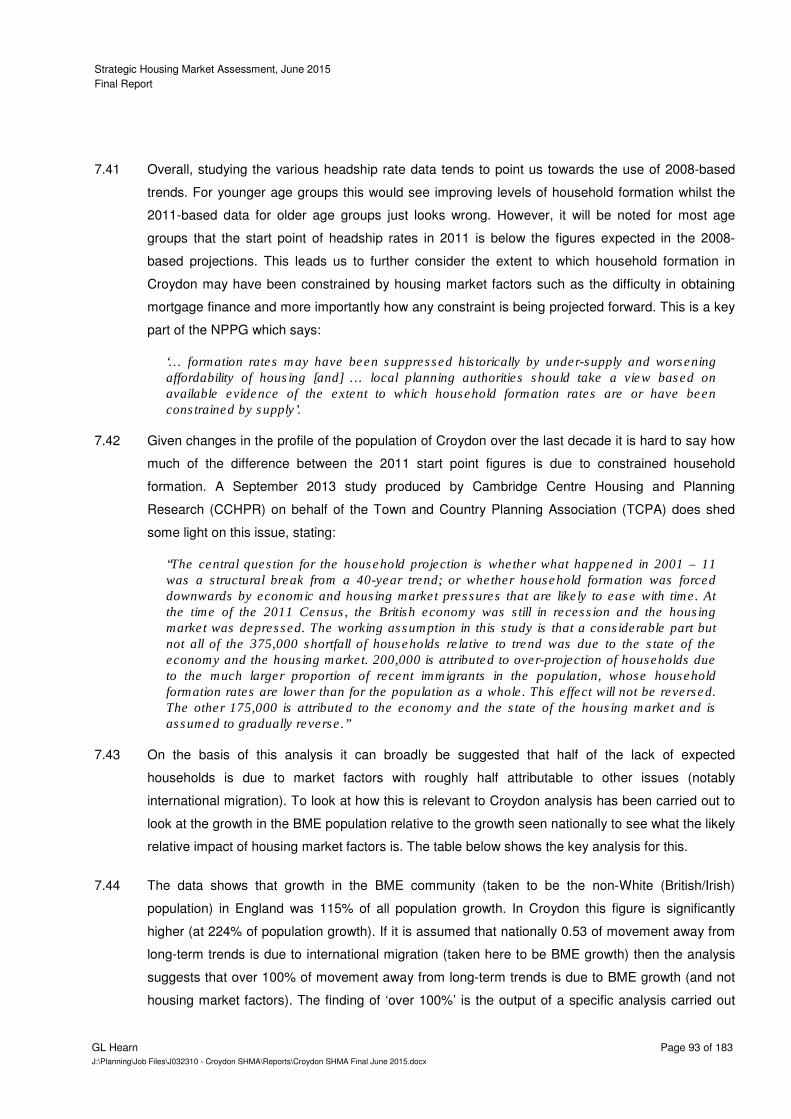
Strategic Housing Market Assessment, June 2015
Final Report
GL Hearn Page 93 of 183
J:\Planning\Job Files\J032310 - Croydon SHMA\Reports\Croydon SHMA Final June 2015.docx
Overall, studying the various headship rate data tends to point us towards the use of 2008-based 7.41
trends. For younger age groups this would see improving levels of household formation whilst the
2011-based data for older age groups just looks wrong. However, it will be noted for most age
groups that the start point of headship rates in 2011 is below the figures expected in the 2008-
based projections. This leads us to further consider the extent to which household formation in
Croydon may have been constrained by housing market factors such as the difficulty in obtaining
mortgage finance and more importantly how any constraint is being projected forward. This is a key
part of the NPPG which says:
‘… formation rates may have been suppressed historically by under-supply and worsening
affordability of housing [and] … local planning authorities should take a view based on
available evidence of the extent to which household formation rates are or have been
constrained by supply’.
Given changes in the profile of the population of Croydon over the last decade it is hard to say how 7.42
much of the difference between the 2011 start point figures is due to constrained household
formation. A September 2013 study produced by Cambridge Centre Housing and Planning
Research (CCHPR) on behalf of the Town and Country Planning Association (TCPA) does shed
some light on this issue, stating:
“The central question for the household projection is whether what happened in 2001 – 11
was a structural break from a 40-year trend; or whether household formation was forced
downwards by economic and housing market pressures that are likely to ease with time. At
the time of the 2011 Census, the British economy was still in recession and the housing
market was depressed. The working assumption in this study is that a considerable part but
not all of the 375,000 shortfall of households relative to trend was due to the state of the
economy and the housing market. 200,000 is attributed to over-projection of households due
to the much larger proportion of recent immigrants in the population, whose household
formation rates are lower than for the population as a whole. This effect will not be reversed.
The other 175,000 is attributed to the economy and the state of the housing market and is
assumed to gradually reverse.”
On the basis of this analysis it can broadly be suggested that half of the lack of expected 7.43
households is due to market factors with roughly half attributable to other issues (notably
international migration). To look at how this is relevant to Croydon analysis has been carried out to
look at the growth in the BME population relative to the growth seen nationally to see what the likely
relative impact of housing market factors is. The table below shows the key analysis for this.
The data shows that growth in the BME community (taken to be the non-White (British/Irish) 7.44
population) in England was 115% of all population growth. In Croydon this figure is significantly
higher (at 224% of population growth). If it is assumed that nationally 0.53 of movement away from
long-term trends is due to international migration (taken here to be BME growth) then the analysis
suggests that over 100% of movement away from long-term trends is due to BME growth (and not
housing market factors). The finding of ‘over 100%’ is the output of a specific analysis carried out
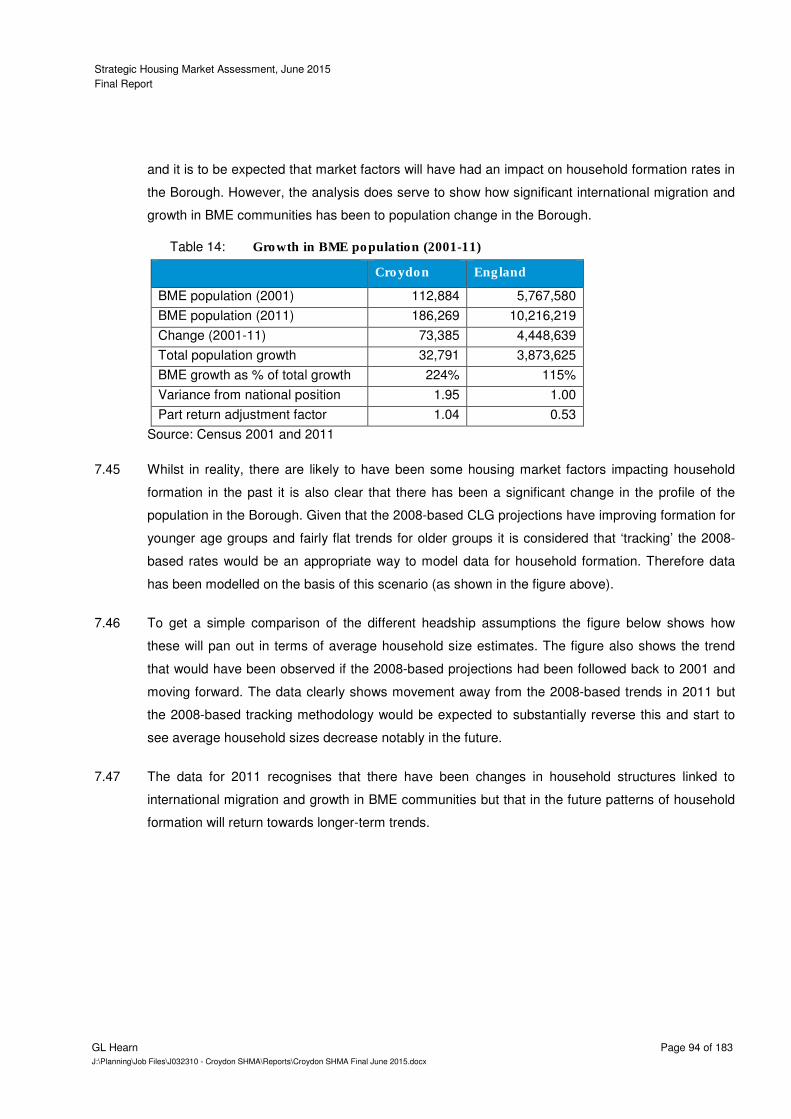
Strategic Housing Market Assessment, June 2015
Final Report
GL Hearn Page 94 of 183
J:\Planning\Job Files\J032310 - Croydon SHMA\Reports\Croydon SHMA Final June 2015.docx
and it is to be expected that market factors will have had an impact on household formation rates in
the Borough. However, the analysis does serve to show how significant international migration and
growth in BME communities has been to population change in the Borough.
Growth in BME population (2001-11) Table 14:
Croydon England
BME population (2001) 112,884 5,767,580
BME population (2011) 186,269 10,216,219
Change (2001-11) 73,385 4,448,639
Total population growth 32,791 3,873,625
BME growth as % of total growth 224% 115%
Variance from national position 1.95 1.00
Part return adjustment factor 1.04 0.53
Source: Census 2001 and 2011
Whilst in reality, there are likely to have been some housing market factors impacting household 7.45
formation in the past it is also clear that there has been a significant change in the profile of the
population in the Borough. Given that the 2008-based CLG projections have improving formation for
younger age groups and fairly flat trends for older groups it is considered that ‘tracking’ the 2008-
based rates would be an appropriate way to model data for household formation. Therefore data
has been modelled on the basis of this scenario (as shown in the figure above).
To get a simple comparison of the different headship assumptions the figure below shows how 7.46
these will pan out in terms of average household size estimates. The figure also shows the trend
that would have been observed if the 2008-based projections had been followed back to 2001 and
moving forward. The data clearly shows movement away from the 2008-based trends in 2011 but
the 2008-based tracking methodology would be expected to substantially reverse this and start to
see average household sizes decrease notably in the future.
The data for 2011 recognises that there have been changes in household structures linked to 7.47
international migration and growth in BME communities but that in the future patterns of household
formation will return towards longer-term trends.
Strategic Housing Market Assessment, June 2015
Final Report
GL Hearn Page 95 of 183
J:\Planning\Job Files\J032310 - Croydon SHMA\Reports\Croydon SHMA Final June 2015.docx
Past and projected trends in Average Household Size – Croydon Figure 59:
Source: Derived from ONS and CLG data
CORE CONCLUSION – HOUSEHOLD FORMATION (HEADSHIP) RATES
The analysis shows that average household sizes have dramatically departed from long-term
trends in the 2008-based projections. However, this seems likely to largely be due to changes
in the population profile of the Borough (a large increase in BME communities which have
different household structures). Moving forward however, both the 2011- and 2008-based CLG
projections would expect household sizes to start to fall. The 2008-based ‘trends’ in particular
look sound in improving formation rates for younger people and it is considered that a
methodology of ‘tracking’ the 2008-rates from a 2011 start point is the most robust method for
studying headship rates.
Using the 2008-based CLG household projections we have therefore developed a series of 7.48
headship rates to apply to our demographic data (from the 2012-based SNPP). This suggests a
housing requirement of 2,437 dwellings per annum from 2013 to 2036 – this includes a small uplift
from household estimates to take account of short term frictional vacancies (a figure of 2.6% has
been used; derived from 2011 Census data). In general, Croydon has very low level of long-term
vacant properties therefore using a figure derived from the census will not result in planning to
account for or increase the number of long-term vacant properties.
2.1
2.15
2.2
2.25
2.3
2.35
2.4
2.45
2.520
01
2003
2005
2007
2009
2011
2013
2015
2017
2019
2021
2023
2025
2027
2029
2031
2033
2035
Trend (2001-11)
Projected (CLG 2011-based)
Projected (2008-based tracking)
2008-based
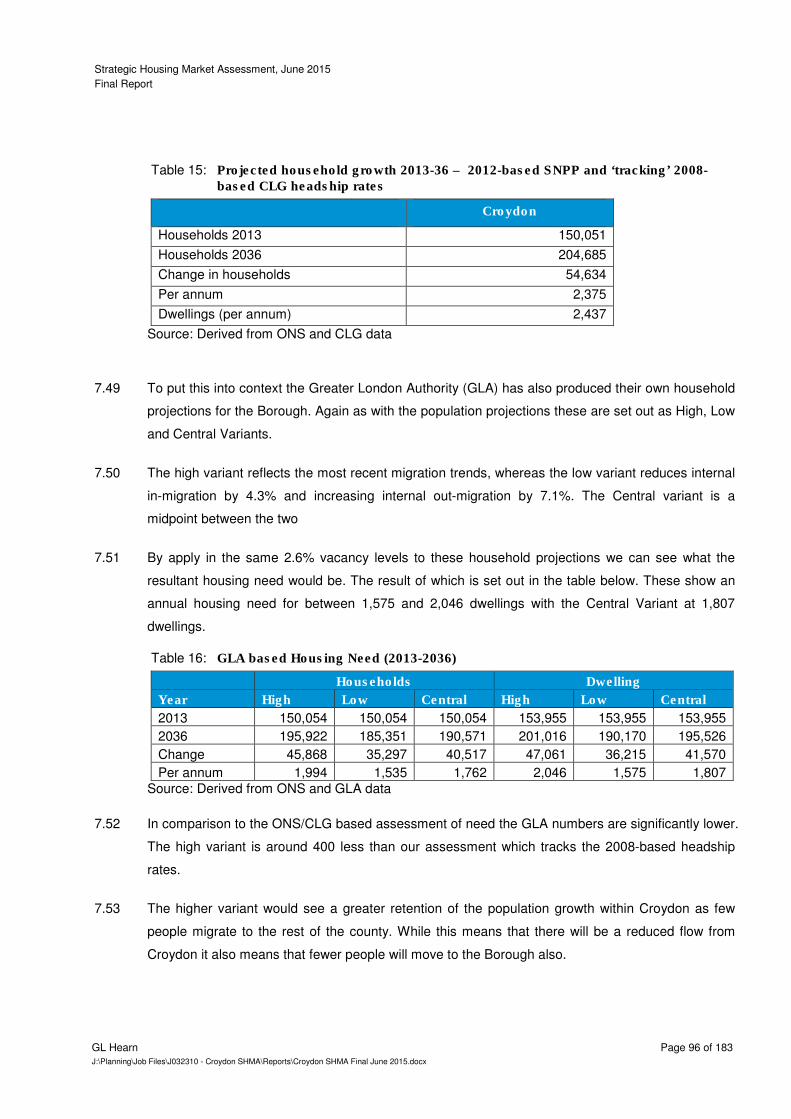
Strategic Housing Market Assessment, June 2015
Final Report
GL Hearn Page 96 of 183
J:\Planning\Job Files\J032310 - Croydon SHMA\Reports\Croydon SHMA Final June 2015.docx
Projected household growth 2013-36 – 2012-based SNPP and ‘tracking’ 2008-Table 15:
based CLG headship rates
Croydon
Households 2013 150,051
Households 2036 204,685
Change in households 54,634
Per annum 2,375
Dwellings (per annum) 2,437
Source: Derived from ONS and CLG data
To put this into context the Greater London Authority (GLA) has also produced their own household 7.49
projections for the Borough. Again as with the population projections these are set out as High, Low
and Central Variants.
The high variant reflects the most recent migration trends, whereas the low variant reduces internal 7.50
in-migration by 4.3% and increasing internal out-migration by 7.1%. The Central variant is a
midpoint between the two
By apply in the same 2.6% vacancy levels to these household projections we can see what the 7.51
resultant housing need would be. The result of which is set out in the table below. These show an
annual housing need for between 1,575 and 2,046 dwellings with the Central Variant at 1,807
dwellings.
GLA based Housing Need (2013-2036) Table 16:
Households Dwelling
Year High Low Central High Low Central
2013 150,054 150,054 150,054 153,955 153,955 153,955
2036 195,922 185,351 190,571 201,016 190,170 195,526
Change 45,868 35,297 40,517 47,061 36,215 41,570
Per annum 1,994 1,535 1,762 2,046 1,575 1,807
Source: Derived from ONS and GLA data
In comparison to the ONS/CLG based assessment of need the GLA numbers are significantly lower. 7.52
The high variant is around 400 less than our assessment which tracks the 2008-based headship
rates.
The higher variant would see a greater retention of the population growth within Croydon as few 7.53
people migrate to the rest of the county. While this means that there will be a reduced flow from
Croydon it also means that fewer people will move to the Borough also.
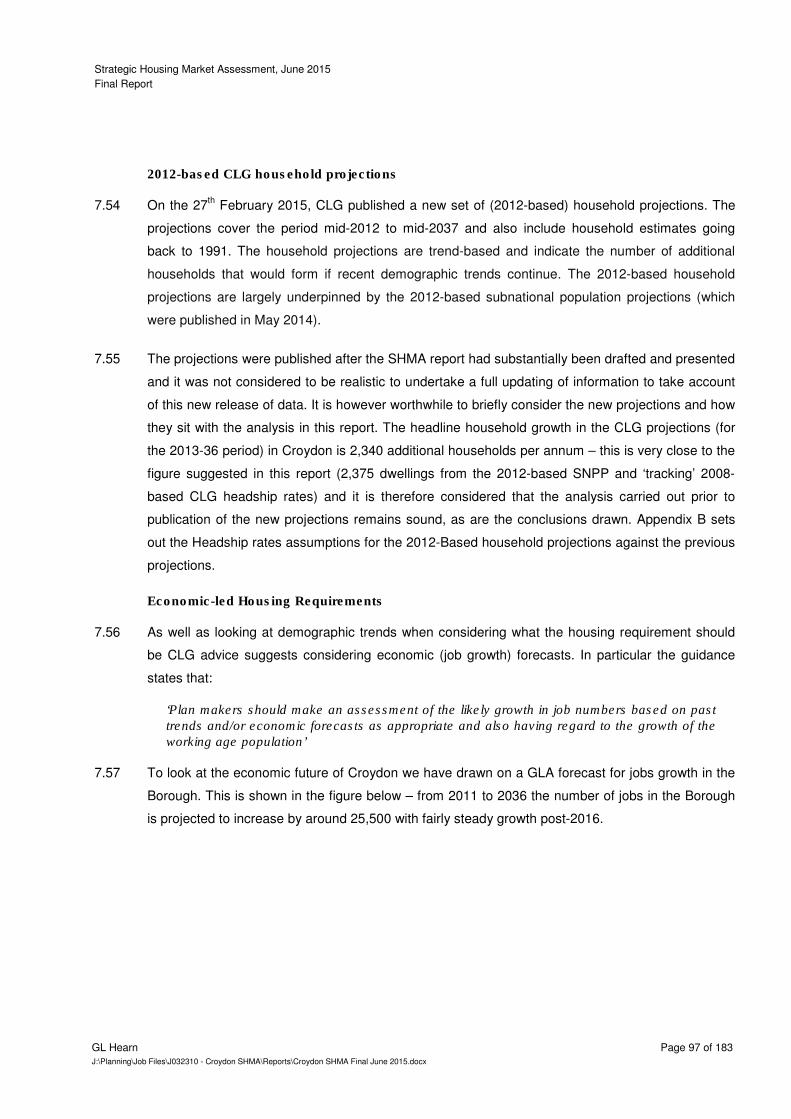
Strategic Housing Market Assessment, June 2015
Final Report
GL Hearn Page 97 of 183
J:\Planning\Job Files\J032310 - Croydon SHMA\Reports\Croydon SHMA Final June 2015.docx
2012-based CLG household projections
On the 27th February 2015, CLG published a new set of (2012-based) household projections. The 7.54
projections cover the period mid-2012 to mid-2037 and also include household estimates going
back to 1991. The household projections are trend-based and indicate the number of additional
households that would form if recent demographic trends continue. The 2012-based household
projections are largely underpinned by the 2012-based subnational population projections (which
were published in May 2014).
The projections were published after the SHMA report had substantially been drafted and presented 7.55
and it was not considered to be realistic to undertake a full updating of information to take account
of this new release of data. It is however worthwhile to briefly consider the new projections and how
they sit with the analysis in this report. The headline household growth in the CLG projections (for
the 2013-36 period) in Croydon is 2,340 additional households per annum – this is very close to the
figure suggested in this report (2,375 dwellings from the 2012-based SNPP and ‘tracking’ 2008-
based CLG headship rates) and it is therefore considered that the analysis carried out prior to
publication of the new projections remains sound, as are the conclusions drawn. Appendix B sets
out the Headship rates assumptions for the 2012-Based household projections against the previous
projections.
Economic-led Housing Requirements
As well as looking at demographic trends when considering what the housing requirement should 7.56
be CLG advice suggests considering economic (job growth) forecasts. In particular the guidance
states that:
‘Plan makers should make an assessment of the likely growth in job numbers based on past
trends and/or economic forecasts as appropriate and also having regard to the growth of the
working age population’
To look at the economic future of Croydon we have drawn on a GLA forecast for jobs growth in the 7.57
Borough. This is shown in the figure below – from 2011 to 2036 the number of jobs in the Borough
is projected to increase by around 25,500 with fairly steady growth post-2016.
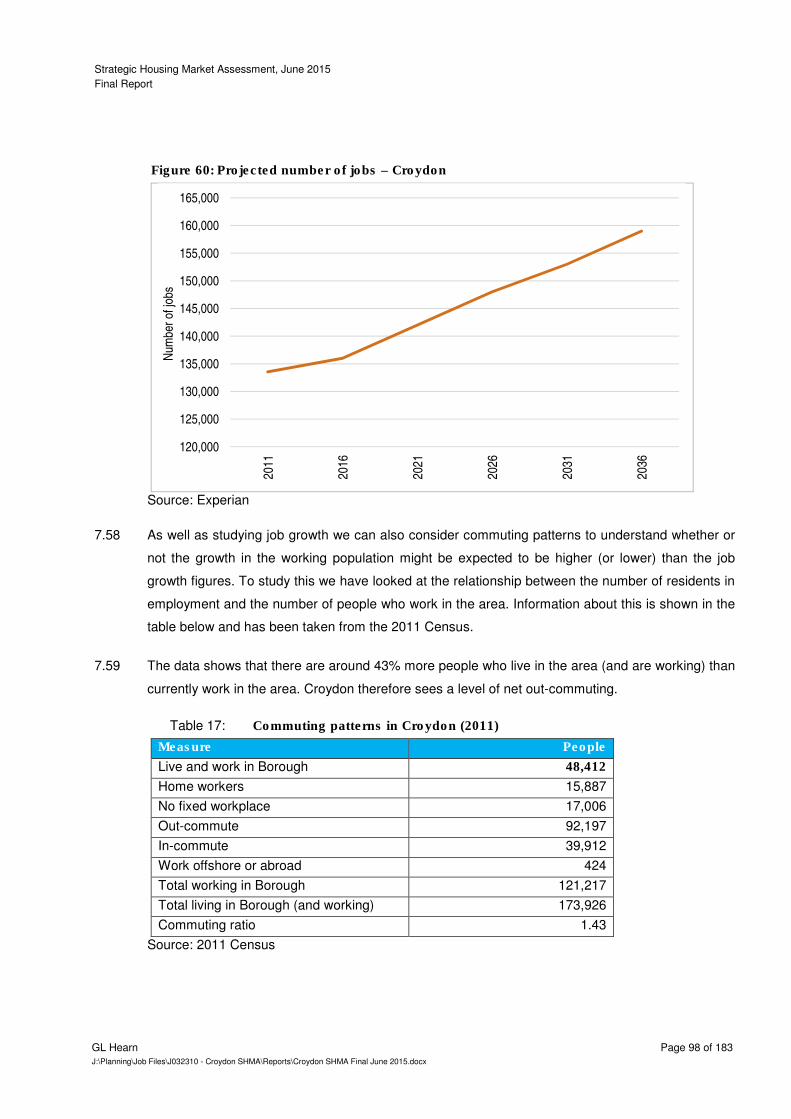
Strategic Housing Market Assessment, June 2015
Final Report
GL Hearn Page 98 of 183
J:\Planning\Job Files\J032310 - Croydon SHMA\Reports\Croydon SHMA Final June 2015.docx
Projected number of jobs – Croydon Figure 60:
Source: Experian
As well as studying job growth we can also consider commuting patterns to understand whether or 7.58
not the growth in the working population might be expected to be higher (or lower) than the job
growth figures. To study this we have looked at the relationship between the number of residents in
employment and the number of people who work in the area. Information about this is shown in the
table below and has been taken from the 2011 Census.
The data shows that there are around 43% more people who live in the area (and are working) than 7.59
currently work in the area. Croydon therefore sees a level of net out-commuting.
Commuting patterns in Croydon (2011) Table 17:
Measure People
Live and work in Borough 48,412
Home workers 15,887
No fixed workplace 17,006
Out-commute 92,197
In-commute 39,912
Work offshore or abroad 424
Total working in Borough 121,217
Total living in Borough (and working) 173,926
Commuting ratio 1.43
Source: 2011 Census
120,000
125,000
130,000
135,000
140,000
145,000
150,000
155,000
160,000
165,000
2011
2016
2021
2026
2031
2036
Num
ber
of jo
bs
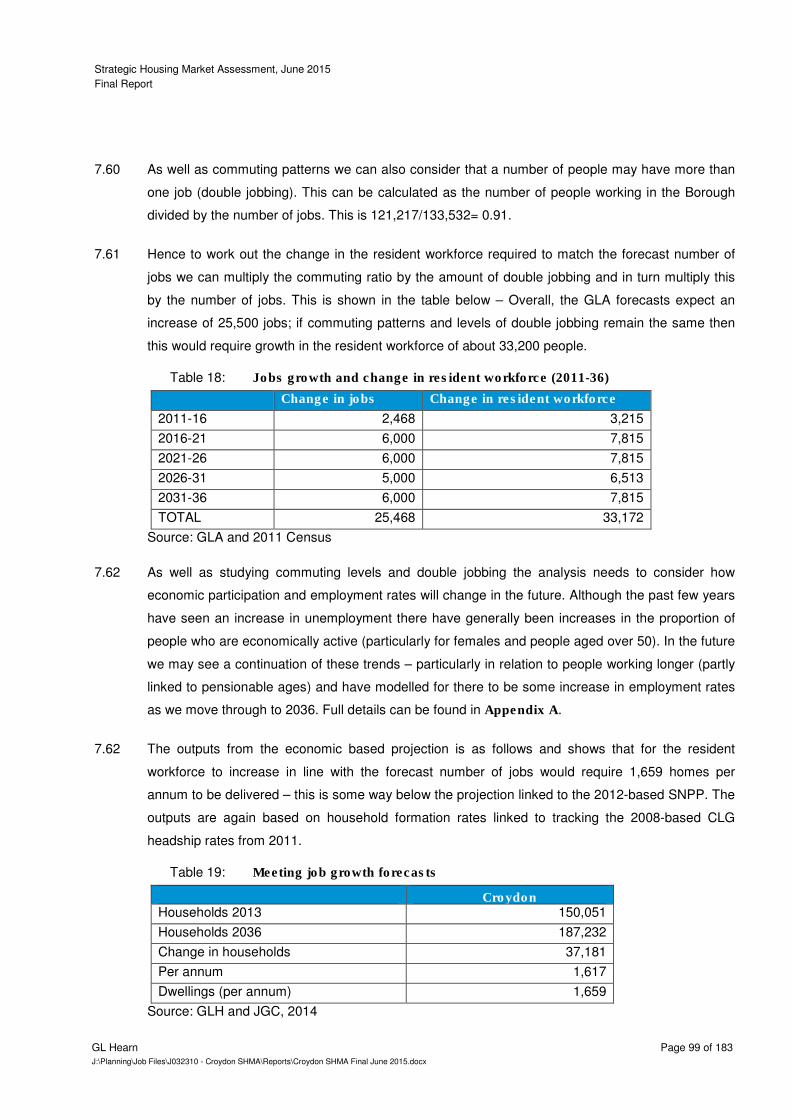
Strategic Housing Market Assessment, June 2015
Final Report
GL Hearn Page 99 of 183
J:\Planning\Job Files\J032310 - Croydon SHMA\Reports\Croydon SHMA Final June 2015.docx
As well as commuting patterns we can also consider that a number of people may have more than 7.60
one job (double jobbing). This can be calculated as the number of people working in the Borough
divided by the number of jobs. This is 121,217/133,532= 0.91.
Hence to work out the change in the resident workforce required to match the forecast number of 7.61
jobs we can multiply the commuting ratio by the amount of double jobbing and in turn multiply this
by the number of jobs. This is shown in the table below – Overall, the GLA forecasts expect an
increase of 25,500 jobs; if commuting patterns and levels of double jobbing remain the same then
this would require growth in the resident workforce of about 33,200 people.
Jobs growth and change in resident workforce (2011-36) Table 18:
Change in jobs Change in resident workforce
2011-16 2,468 3,215
2016-21 6,000 7,815
2021-26 6,000 7,815
2026-31 5,000 6,513
2031-36 6,000 7,815
TOTAL 25,468 33,172
Source: GLA and 2011 Census
As well as studying commuting levels and double jobbing the analysis needs to consider how 7.62
economic participation and employment rates will change in the future. Although the past few years
have seen an increase in unemployment there have generally been increases in the proportion of
people who are economically active (particularly for females and people aged over 50). In the future
we may see a continuation of these trends – particularly in relation to people working longer (partly
linked to pensionable ages) and have modelled for there to be some increase in employment rates
as we move through to 2036. Full details can be found in Appendix A.
7.62 The outputs from the economic based projection is as follows and shows that for the resident
workforce to increase in line with the forecast number of jobs would require 1,659 homes per
annum to be delivered – this is some way below the projection linked to the 2012-based SNPP. The
outputs are again based on household formation rates linked to tracking the 2008-based CLG
headship rates from 2011.
Meeting job growth forecasts Table 19:
Croydon Households 2013 150,051
Households 2036 187,232
Change in households 37,181
Per annum 1,617
Dwellings (per annum) 1,659
Source: GLH and JGC, 2014
Strategic Housing Market Assessment, June 2015
Final Report
GL Hearn Page 100 of 183
J:\Planning\Job Files\J032310 - Croydon SHMA\Reports\Croydon SHMA Final June 2015.docx
Summary and Conclusions
The conclusions are drawn on the basis of an assessment process which interrogates demographic 7.63
information under a range of different scenarios and thus provides recommendations about what
might be a reasonable level of future housing provision. The methodology follows the series of
steps set out in CLG advice of March 2014. The projections cover the period from 2013 to 2036.
The analysis begins by looking at the most recent nationally published projections – these are the 7.64
2011-based ‘interim’ projections from CLG which cover the period from 2011 to 2021. This
projection suggests household growth of 1,838 per annum across the Borough. This figure is
slightly above that contained in the previous (2008-based) CLG projections which put annual
household growth (in the 2011-31 period) at 1,664.
The next stage of the process was to consider the validity of the 2011-based projections, more 7.65
recent 2012-based subnational population projections (SNPP) and the 2013 mid-year population
estimates. Overall, the analysis supports the 2012-based SNPP as being broadly reasonable as a
demographic projection. When comparing future growth with past trends this projection sits below
the population trend of the past 5-years and in-line with a longer-term (10-year) trend.
The next step was to consider the most reasonable set of household formation rates. Across the 7.66
Borough the evidence would suggest that there has been some suppression in the past although
there has also been a significant change in the population profile in the area (notably very large
growth in BME communities). Moving forward it is however the case that the 2011-based
projections are expecting household sizes to begin falling again. However, closer investigation of
the 2011-based data suggested that some of the trends were on the pessimistic side whilst other
simply looked wrong.
A set of headship rates were therefore developed which took 2011-based rates as a start point and 7.67
projected forward in terms of the trends contained in the 2008-based projections. Carrying out the
projection on this basis suggests household growth of 2,375 per annum and a housing requirement
for 2,437 additional homes per annum (once a vacancy allowance has been included).
This s somewhat higher than the alternative household forecasts produced by the Greater London 7.68
Authority which sets out a need between 1,575 and 2,046 dwellings per annum with the central
variant at 1,807 dwellings per annum. The high end reflects the most recent migration trends,
whereas the low reduces internal in-migration by 4.3% and increasing internal out-migration by
7.1%. The central variant is a midpoint between the two and results in a need for 1,807 dwellings
per annum.

Strategic Housing Market Assessment, June 2015
Final Report
GL Hearn Page 101 of 183
J:\Planning\Job Files\J032310 - Croydon SHMA\Reports\Croydon SHMA Final June 2015.docx
It is also important to consider age structure changes; in particular whether the population growth 7.69
will support the required increase in the workforce to meet employment growth trends/forecasts. In
looking at a GLA economic forecast it was established that an increase in the number of residents
in employment of around 33,200 could be expected in the 2013-36 period. Running this figure
through the demographic model shows that annual housing requirement for 1,659 would be
appropriate to ensure labour-force growth. This is some way below the demographic projection.
Overall, the analysis suggests that the housing requirement in Croydon is for around 2,440 7.70
dwellings per annum. Over the 23-year period from 2013 to 2036 this would represent 56,100
additional homes. Alternatively the GLA’s own figures suggest a need for between 1,575 and
2,046 dwellings per annum with the central variant at 1,807 dwellings per annum.
Strategic Housing Market Assessment, June 2015
Final Report
GL Hearn Page 102 of 183
J:\Planning\Job Files\J032310 - Croydon SHMA\Reports\Croydon SHMA Final June 2015.docx
8 AFFORDABLE HOUSING NEED
Introduction
In this section we discuss levels of affordable housing need in Croydon. Housing need is defined in 8.1
SHMA guidance as the quantity of housing required for households who are unable to access
suitable housing without financial assistance. These households will be eligible for affordable
housing. Affordable housing is defined in the National Planning Policy Framework as social rented,
affordable rented and intermediate housing provided to eligible households whose needs are not
met by the market.
Government guidance on Strategic Housing Market Assessments sets out a model for assessing 8.2
housing need (known as the Basic Needs Assessment Model). This model has been retained in the
CLG advice of March 2014 and is used herein. The analysis is based on secondary data sources. It
draws on a number of sources of information including 2011 Census data, demographic projections,
house prices/rents and income information.
It should be recognised that in establishing housing requirements, evidence of both housing need 8.3
and demand should both be considered. This section, addressing housing need specifically, should
be considered alongside the evidence of demand presented; and the demographic-led projections
of housing requirements. Land availability, infrastructure requirements, viability (as well as funding
available for affordable housing), Sustainability Appraisal and the views of the local community and
wider stakeholders also need to be considered in the development of planning policy. It is not a
simple predict and provide issue.
The housing needs model is based largely on housing market conditions (and particularly the 8.4
relationship of housing costs and incomes) at a particular point in time – the time of the assessment
– as well as the existing supply of affordable housing (through relets of current stock) which can be
used to meet housing need. On this basis, estimates of housing need are provided in this section
for the twenty-three year period between 2013 and 2036.
Key Definitions
We begin by setting out key definitions relating to housing need, affordability and affordable housing. 8.5
Housing Need
Housing need is defined as the number of households who lack their own housing or who live in 8.6
unsuitable housing and who cannot afford to meet their housing needs in the market.
Strategic Housing Market Assessment, June 2015
Final Report
GL Hearn Page 103 of 183
J:\Planning\Job Files\J032310 - Croydon SHMA\Reports\Croydon SHMA Final June 2015.docx
Newly-Arising Need
Newly-arising (or future) need is a measure of the number of households who are expected to have 8.7
an affordable housing need at some point in the future. In this assessment we have used trend data
from CoRe along with demographic projections about the number of new households forming
(along with affordability) to estimate future needs.
Supply of Affordable Housing
An estimate of the likely future supply of affordable housing is also made (drawing on secondary 8.8
data sources about past lettings). The future supply of affordable housing is subtracted from the
newly-arising need to make an assessment of the net future need for affordable housing.
Affordability
Affordability is assessed by comparing household incomes, based on income data modelled using a 8.9
number of sources including CACI, ASHE, the English Housing Survey (EHS) and ONS data,
against the cost of suitable market housing (to either buy or rent). Separate tests are applied for
home ownership and private renting (in line with the SHMA Guidance) and are summarised below:
d) Assessing whether a household can afford home ownership: A household is considered able to afford to buy a home if it costs 3.5 times the gross household income – CLG guidance suggests
using different measures for households with multiple incomes (2.9×) and those with a single
income (3.5×), however (partly due to data availability) we have only used a 3.5 times multiplier for analysis. This ensures that housing need figures are not over-estimated – in practical terms it makes little difference to the analysis due to the inclusion of a rental test (below) which tends to require lower incomes for households to be able to afford access to market housing;
e) Assessing whether a household can afford market renting: A household is considered able to afford market rented housing in cases where the rent payable would constitute no more than 30% of gross income. CLG guidance suggests that 25% of income is a reasonable start point but suggests that a higher figure could be used. A review of SHMAs carried out across the Country suggests that 30% has been established as the benchmark figure to be used in such assessments. Analysis has also been carried out to test the sensitivity of affordable need at different percentages (from 25% to 40%).
It should be recognised that a key challenge in assessing housing need using secondary sources is 8.10
the lack of information available regarding households’ existing savings. This is a key factor in
affecting the ability of young households to purchase housing particularly in the current market
context where a deposit of at least 10% is typically required for the more attractive mortgage deals.
The ‘help to buy’ scheme is likely to be making some improvements in access to the owner-
occupied sector although at present this is likely to be limited (although the impact of recent
extensions to this scheme to include the second-hand market should be monitored moving forward).
In many cases households who do not have sufficient savings to purchase have sufficient income to
rent housing privately without support, and thus the impact of deposit issues on the overall
assessment of housing need is limited.
Strategic Housing Market Assessment, June 2015
Final Report
GL Hearn Page 104 of 183
J:\Planning\Job Files\J032310 - Croydon SHMA\Reports\Croydon SHMA Final June 2015.docx
Affordable Housing
The NPPF provides the definition of affordable housing (as used in this report). The following is 8.11
taken from Annex 2 of NPPF.
“Affordable housing includes social rented, affordable rented and intermediate housing,
provided to specified eligible households whose needs are not met by the market. Affordable
housing should:
• Meet the needs of eligible households including availability at a cost low enough for them to
afford, determined with regard to local incomes and local house prices;
• Include provision for the home to remain at an affordable price for future eligible households or,
if these restrictions are lifted, for the subsidy to be recycled for alternative affordable housing
provision.”
Within the definition of affordable housing there is also the distinction between social rented 8.12
affordable rented, and intermediate housing. Social rented housing is defined as:
“Rented housing owned and managed by local authorities and registered social landlords, for
which guideline target rents are determined through the national rent regime. It may also
include rented housing owned or managed by other persons and provided under equivalent
rental arrangements to the above, as agreed with the local authority or with the Homes and
Communities Agency as a condition of grant.”
Affordable rented housing is defined as: 8.13
“Rented housing let by registered providers of social housing to households who are eligible
for social rented housing. Affordable Rent is not subject to the national rent regime but is
subject to other rent controls that require a rent of no more than 80 per cent of the local
market rent.”
The definition of intermediate housing is shown below: 8.14
“Intermediate affordable housing is ‘Housing at prices and rents above those of social rent,
but below market price or rents. These can include shared equity products (e.g. HomeBuy),
other low cost homes for sale and intermediate rent but does not include affordable rented
housing.”
As part of our analysis in this report we have therefore studied the extent to which both social 8.15
rented, intermediate housing and affordable rented housing can meet housing need in Croydon.
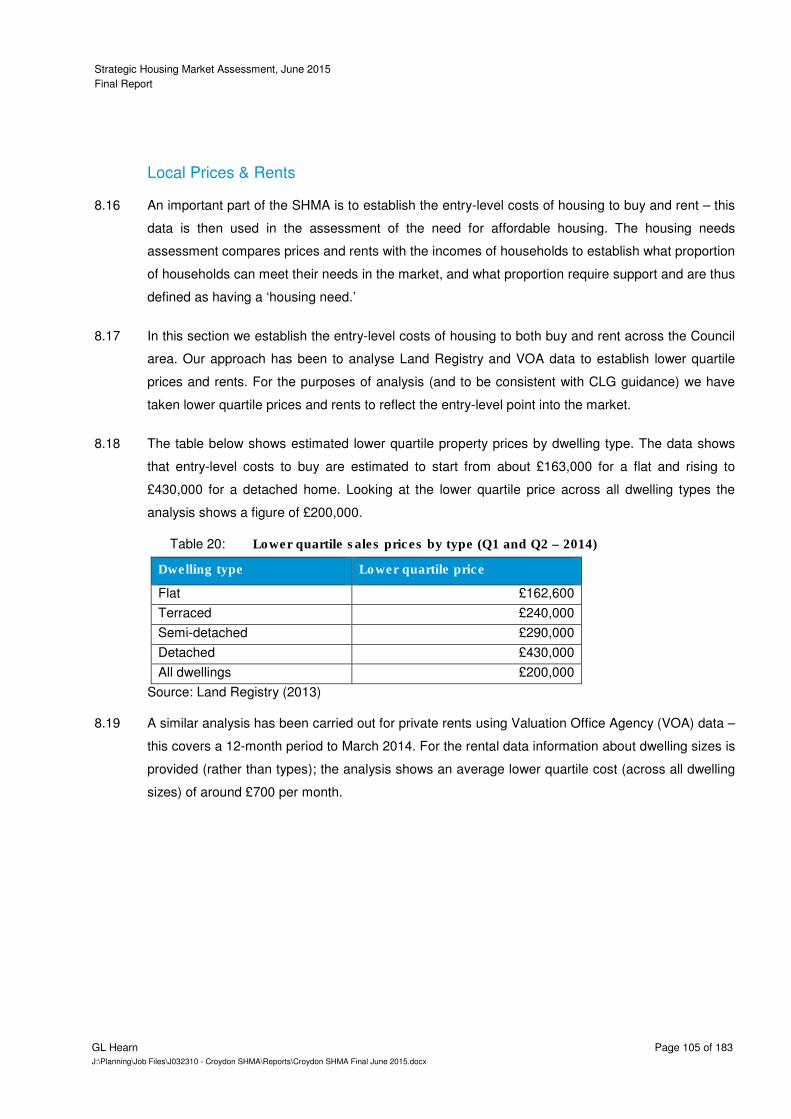
Strategic Housing Market Assessment, June 2015
Final Report
GL Hearn Page 105 of 183
J:\Planning\Job Files\J032310 - Croydon SHMA\Reports\Croydon SHMA Final June 2015.docx
Local Prices & Rents
An important part of the SHMA is to establish the entry-level costs of housing to buy and rent – this 8.16
data is then used in the assessment of the need for affordable housing. The housing needs
assessment compares prices and rents with the incomes of households to establish what proportion
of households can meet their needs in the market, and what proportion require support and are thus
defined as having a ‘housing need.’
In this section we establish the entry-level costs of housing to both buy and rent across the Council 8.17
area. Our approach has been to analyse Land Registry and VOA data to establish lower quartile
prices and rents. For the purposes of analysis (and to be consistent with CLG guidance) we have
taken lower quartile prices and rents to reflect the entry-level point into the market.
The table below shows estimated lower quartile property prices by dwelling type. The data shows 8.18
that entry-level costs to buy are estimated to start from about £163,000 for a flat and rising to
£430,000 for a detached home. Looking at the lower quartile price across all dwelling types the
analysis shows a figure of £200,000.
Lower quartile sales prices by type (Q1 and Q2 – 2014) Table 20:
Dwelling type Lower quartile price
Flat £162,600
Terraced £240,000
Semi-detached £290,000
Detached £430,000
All dwellings £200,000
Source: Land Registry (2013)
A similar analysis has been carried out for private rents using Valuation Office Agency (VOA) data – 8.19
this covers a 12-month period to March 2014. For the rental data information about dwelling sizes is
provided (rather than types); the analysis shows an average lower quartile cost (across all dwelling
sizes) of around £700 per month.

Strategic Housing Market Assessment, June 2015
Final Report
GL Hearn Page 106 of 183
J:\Planning\Job Files\J032310 - Croydon SHMA\Reports\Croydon SHMA Final June 2015.docx
Lower quartile private rents by size and location (year to March 2014) Table 21:
Dwelling size Monthly rent
Room only £400
Studio £585
1 bedroom £725
2 bedrooms £900
3 bedrooms £1,127
4+ bedrooms £1,500
All dwellings £700
Source: Valuation Office Agency
In addition to rental costs from our internet survey we have looked at the maximum amount of Local 8.20
Housing Allowance (LHA) payable on different sized properties within the area. Maximum LHA
payments are based on estimates of rents at the 30th percentile and should therefore be roughly
comparable with our estimates of lower quartile costs.
The geographical areas used to determine LHA are not however co-terminus with local authority 8.21
boundaries and so any comparison is not exact. LHA levels are based on Broad Rental Market
Areas (BRMA). The BRMA is an area where a person could reasonably be expected to live taking
into account access to facilities and services for the purposes of health, education, recreation,
personal banking and shopping (as defined by the Rent Office).
Virtually all of Croydon falls into the Outer South London BRMA with a very small part to the north 8.22
being in the Inner South East London BRMA. The Outer South London BRMA does however
extend beyond the Council boundary and into parts of Surrey. Below we have therefore provided
details for the Outer South London BRMA. The data suggests only small differences between LHA
rates and our analysis based on VOA data.
Maximum LHA payments by Size and BRMA Table 22:
Size Outer South London BRMA
Room only £344
1 bedroom £697
2 bedrooms £877
3 bedrooms £1,163
4 bedrooms £1,435
Source: VOA data (July 2014)
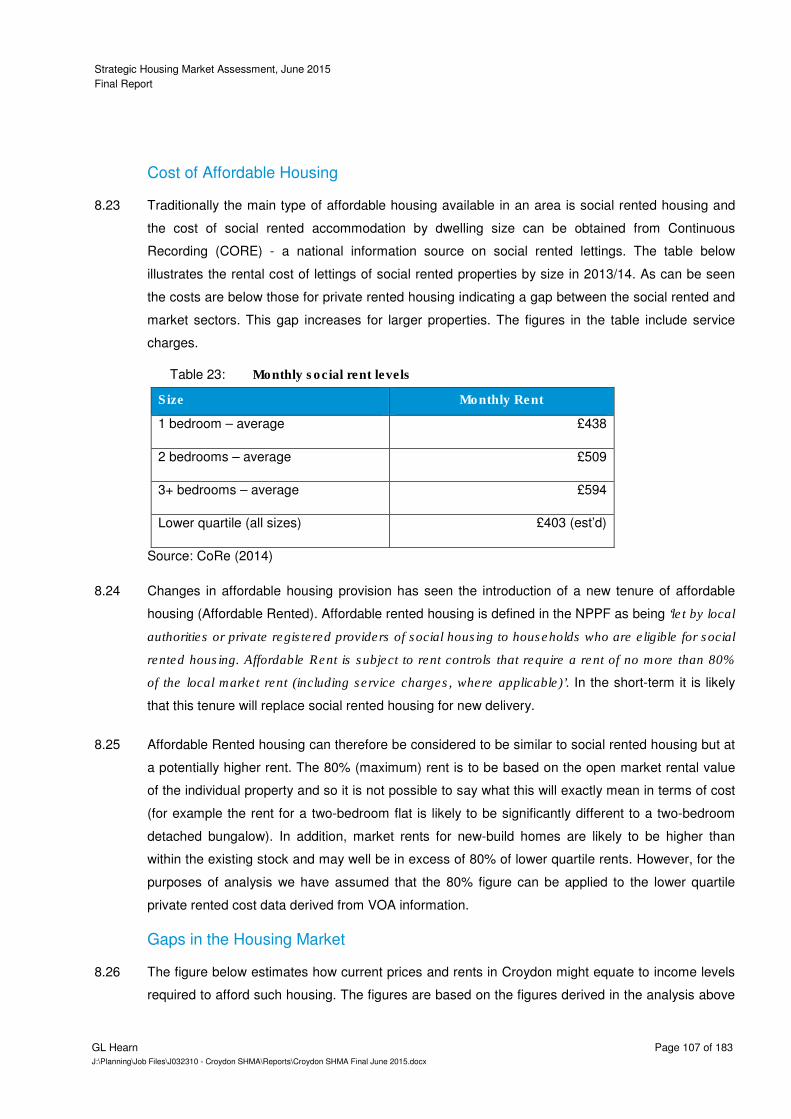
Strategic Housing Market Assessment, June 2015
Final Report
GL Hearn Page 107 of 183
J:\Planning\Job Files\J032310 - Croydon SHMA\Reports\Croydon SHMA Final June 2015.docx
Cost of Affordable Housing
Traditionally the main type of affordable housing available in an area is social rented housing and 8.23
the cost of social rented accommodation by dwelling size can be obtained from Continuous
Recording (CORE) - a national information source on social rented lettings. The table below
illustrates the rental cost of lettings of social rented properties by size in 2013/14. As can be seen
the costs are below those for private rented housing indicating a gap between the social rented and
market sectors. This gap increases for larger properties. The figures in the table include service
charges.
Monthly social rent levels Table 23:
Size Monthly Rent
1 bedroom – average £438
2 bedrooms – average £509
3+ bedrooms – average £594
Lower quartile (all sizes) £403 (est’d)
Source: CoRe (2014)
Changes in affordable housing provision has seen the introduction of a new tenure of affordable 8.24
housing (Affordable Rented). Affordable rented housing is defined in the NPPF as being ‘let by local
authorities or private registered providers of social housing to households who are eligible for social
rented housing. Affordable Rent is subject to rent controls that require a rent of no more than 80%
of the local market rent (including service charges, where applicable)’. In the short-term it is likely
that this tenure will replace social rented housing for new delivery.
Affordable Rented housing can therefore be considered to be similar to social rented housing but at 8.25
a potentially higher rent. The 80% (maximum) rent is to be based on the open market rental value
of the individual property and so it is not possible to say what this will exactly mean in terms of cost
(for example the rent for a two-bedroom flat is likely to be significantly different to a two-bedroom
detached bungalow). In addition, market rents for new-build homes are likely to be higher than
within the existing stock and may well be in excess of 80% of lower quartile rents. However, for the
purposes of analysis we have assumed that the 80% figure can be applied to the lower quartile
private rented cost data derived from VOA information.
Gaps in the Housing Market
The figure below estimates how current prices and rents in Croydon might equate to income levels 8.26
required to afford such housing. The figures are based on the figures derived in the analysis above
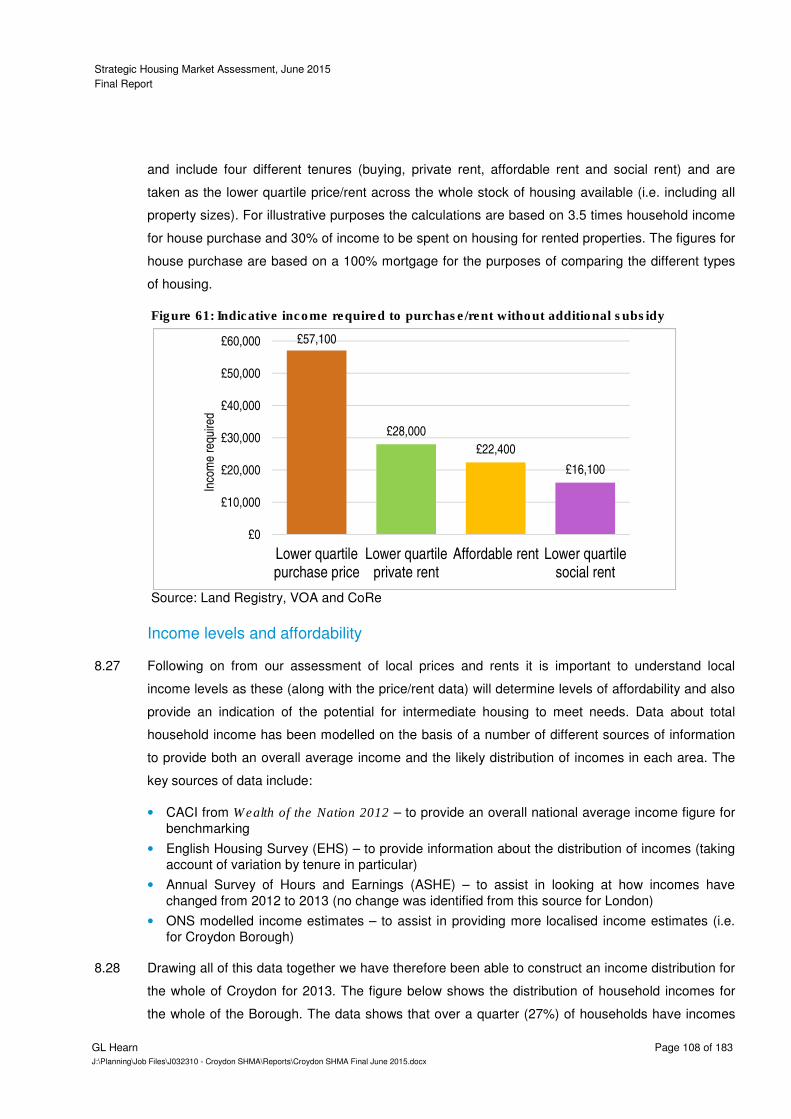
Strategic Housing Market Assessment, June 2015
Final Report
GL Hearn Page 108 of 183
J:\Planning\Job Files\J032310 - Croydon SHMA\Reports\Croydon SHMA Final June 2015.docx
and include four different tenures (buying, private rent, affordable rent and social rent) and are
taken as the lower quartile price/rent across the whole stock of housing available (i.e. including all
property sizes). For illustrative purposes the calculations are based on 3.5 times household income
for house purchase and 30% of income to be spent on housing for rented properties. The figures for
house purchase are based on a 100% mortgage for the purposes of comparing the different types
of housing.
Indicative income required to purchase/rent without additional subsidy Figure 61:
Source: Land Registry, VOA and CoRe
Income levels and affordability
Following on from our assessment of local prices and rents it is important to understand local 8.27
income levels as these (along with the price/rent data) will determine levels of affordability and also
provide an indication of the potential for intermediate housing to meet needs. Data about total
household income has been modelled on the basis of a number of different sources of information
to provide both an overall average income and the likely distribution of incomes in each area. The
key sources of data include:
• CACI from Wealth of the Nation 2012 – to provide an overall national average income figure for
benchmarking
• English Housing Survey (EHS) – to provide information about the distribution of incomes (taking
account of variation by tenure in particular)
• Annual Survey of Hours and Earnings (ASHE) – to assist in looking at how incomes have
changed from 2012 to 2013 (no change was identified from this source for London)
• ONS modelled income estimates – to assist in providing more localised income estimates (i.e.
for Croydon Borough)
Drawing all of this data together we have therefore been able to construct an income distribution for 8.28
the whole of Croydon for 2013. The figure below shows the distribution of household incomes for
the whole of the Borough. The data shows that over a quarter (27%) of households have incomes
£57,100
£28,000
£22,400
£16,100
£0
£10,000
£20,000
£30,000
£40,000
£50,000
£60,000
Lower quartilepurchase price
Lower quartileprivate rent
Affordable rent Lower quartilesocial rent
Inco
me
requ
ired
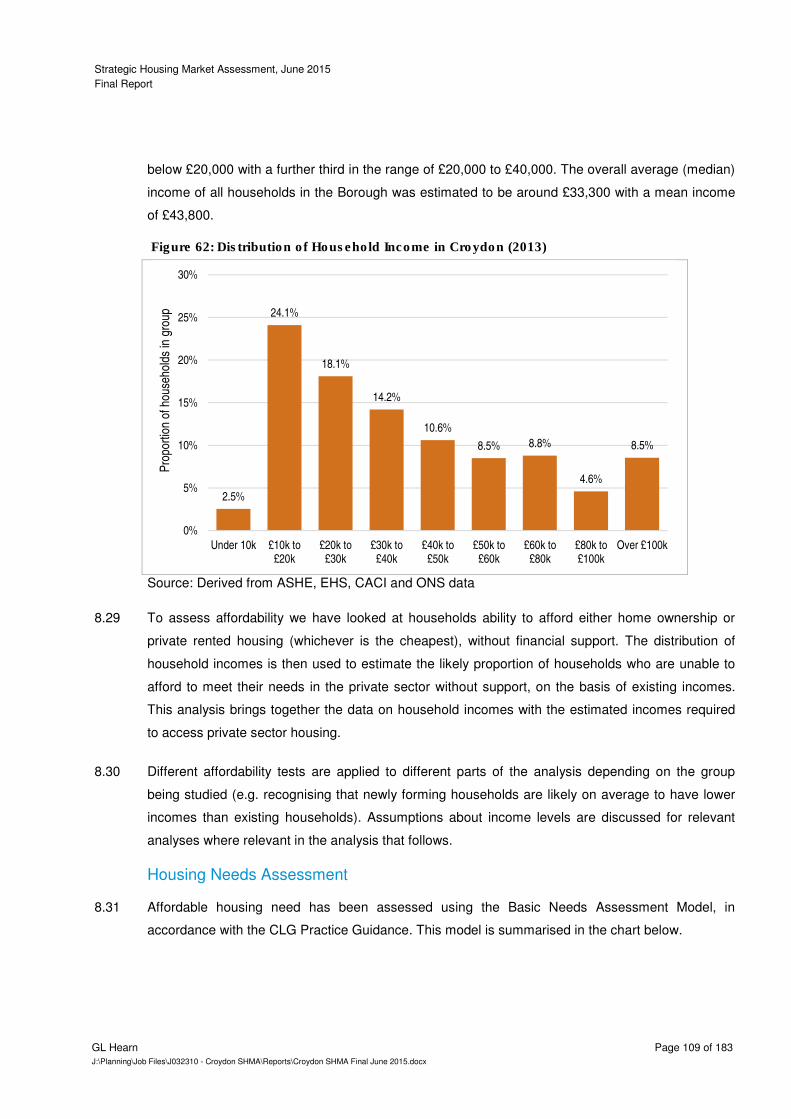
Strategic Housing Market Assessment, June 2015
Final Report
GL Hearn Page 109 of 183
J:\Planning\Job Files\J032310 - Croydon SHMA\Reports\Croydon SHMA Final June 2015.docx
below £20,000 with a further third in the range of £20,000 to £40,000. The overall average (median)
income of all households in the Borough was estimated to be around £33,300 with a mean income
of £43,800.
Distribution of Household Income in Croydon (2013) Figure 62:
Source: Derived from ASHE, EHS, CACI and ONS data
To assess affordability we have looked at households ability to afford either home ownership or 8.29
private rented housing (whichever is the cheapest), without financial support. The distribution of
household incomes is then used to estimate the likely proportion of households who are unable to
afford to meet their needs in the private sector without support, on the basis of existing incomes.
This analysis brings together the data on household incomes with the estimated incomes required
to access private sector housing.
Different affordability tests are applied to different parts of the analysis depending on the group 8.30
being studied (e.g. recognising that newly forming households are likely on average to have lower
incomes than existing households). Assumptions about income levels are discussed for relevant
analyses where relevant in the analysis that follows.
Housing Needs Assessment
Affordable housing need has been assessed using the Basic Needs Assessment Model, in 8.31
accordance with the CLG Practice Guidance. This model is summarised in the chart below.
2.5%
24.1%
18.1%
14.2%
10.6%
8.5% 8.8%
4.6%
8.5%
0%
5%
10%
15%
20%
25%
30%
Under 10k £10k to£20k
£20k to£30k
£30k to£40k
£40k to£50k
£50k to£60k
£60k to£80k
£80k to£100k
Over £100k
Pro
port
ion
of h
ouse
hold
s in
gro
up
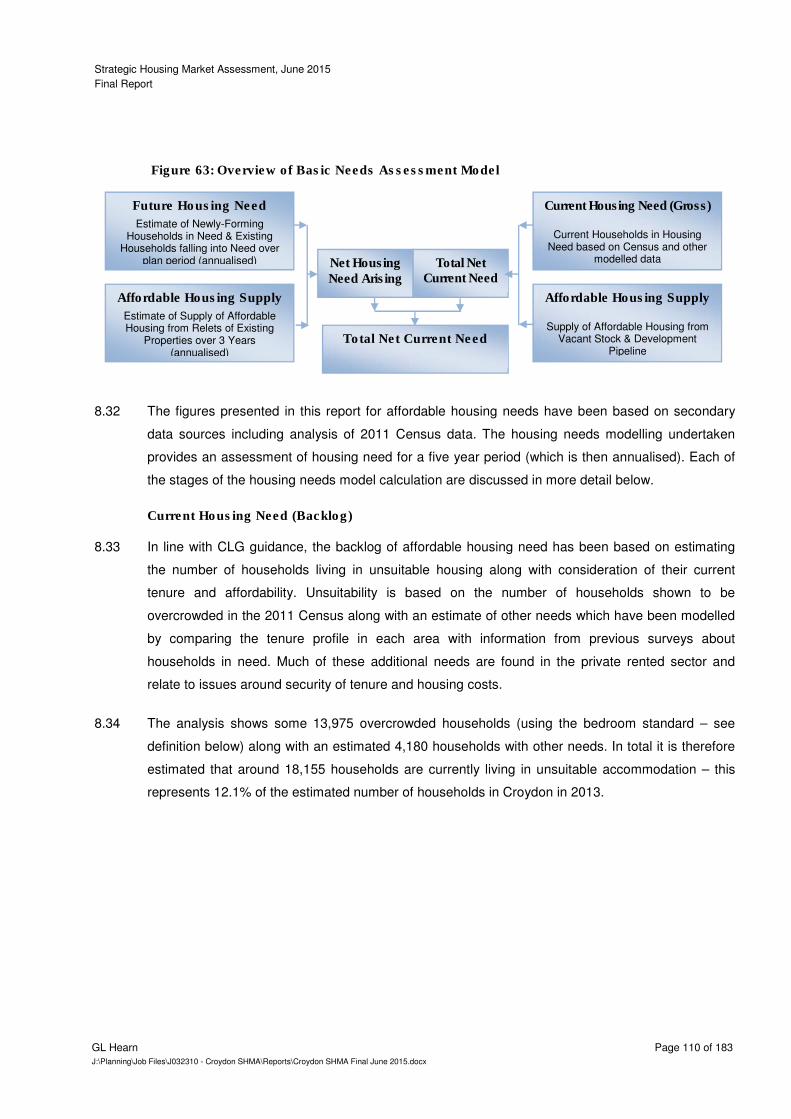
Strategic Housing Market Assessment, June 2015
Final Report
GL Hearn Page 110 of 183
J:\Planning\Job Files\J032310 - Croydon SHMA\Reports\Croydon SHMA Final June 2015.docx
Overview of Basic Needs Assessment Model Figure 63:
The figures presented in this report for affordable housing needs have been based on secondary 8.32
data sources including analysis of 2011 Census data. The housing needs modelling undertaken
provides an assessment of housing need for a five year period (which is then annualised). Each of
the stages of the housing needs model calculation are discussed in more detail below.
Current Housing Need (Backlog)
In line with CLG guidance, the backlog of affordable housing need has been based on estimating 8.33
the number of households living in unsuitable housing along with consideration of their current
tenure and affordability. Unsuitability is based on the number of households shown to be
overcrowded in the 2011 Census along with an estimate of other needs which have been modelled
by comparing the tenure profile in each area with information from previous surveys about
households in need. Much of these additional needs are found in the private rented sector and
relate to issues around security of tenure and housing costs.
The analysis shows some 13,975 overcrowded households (using the bedroom standard – see 8.34
definition below) along with an estimated 4,180 households with other needs. In total it is therefore
estimated that around 18,155 households are currently living in unsuitable accommodation – this
represents 12.1% of the estimated number of households in Croydon in 2013.
Future Housing Need
Estimate of Newly-Forming Households in Need & Existing
Households falling into Need over plan period (annualised)
Affordable Housing Supply
Estimate of Supply of Affordable Housing from Relets of Existing
Properties over 3 Years (annualised)
Affordable Housing Supply
Supply of Affordable Housing from Vacant Stock & Development
Pipeline
Current Housing Need (Gross)
Current Households in Housing Need based on Census and other
modelled data Total Net Current Need
Net Housing Need Arising
Total Net Current Need

Strategic Housing Market Assessment, June 2015
Final Report
GL Hearn Page 111 of 183
J:\Planning\Job Files\J032310 - Croydon SHMA\Reports\Croydon SHMA Final June 2015.docx
DEFINITION OF BEDROOM STANDARD
The Housing (Overcrowding) Bill of 2003 defines the bedroom standard as: “For the purposes
of the bedroom standard a separate bedroom shall be allocated to the following persons:
(a) A person living together with another as husband and wife (whether that other person is of
the same sex or the opposite sex)
(b) A person aged 21 years or more
(c) Two persons of the same sex aged 10 years to 20 years
(d) Two persons (whether of the same sex or not) aged less than 10 years
(e) Two persons of the same sex where one person is aged between 10 years and 20 years
and the other is aged less than 10 years
(f) Any person aged under 21 years in any case where he or she cannot be paired with another
occupier of the dwelling so as to fall within (c), (d) or (e) above.”
While the 2011 Census uses the bedroom standard definition stated above, the Housing Bill of
2003 also takes account of uninhabitable bedrooms and rooms with less than 50ft2 floor space
in determining bedrooms or rooms available to a household. The census does not collect this
information and it is therefore not used in deriving the 2011 Census bedroom occupancy
ratings.
In taking this estimate forward, the data modelling estimates housing unsuitability by tenure. From 8.35
the overall number in unsuitable housing (18,155) households living in affordable housing are
excluded (as these households would release a dwelling on moving and so no net need for
affordable housing will arise). The analysis also excludes all outright owners under the assumption
(which is supported by analysis of survey data) that they will have sufficient equity to move and
90% of owners with a mortgage. Again analysis of a range of recent surveys indicates that the vast
majority of owners with a mortgage are able to afford housing once savings and equity are taken
into account. A final adjustment (which is fairly small in Croydon) is to slightly reduce the
unsuitability figures to take account of student-only households – such households could technically
be overcrowded but would be unlikely to be considered as being in housing need.
At the time of the assessment there were an estimated 8,142 households living in unsuitable 8.36
housing (excluding current social tenants and the majority of owner-occupiers) – this represents
5.4% of all households in the Council area – this data is shown in the table below.
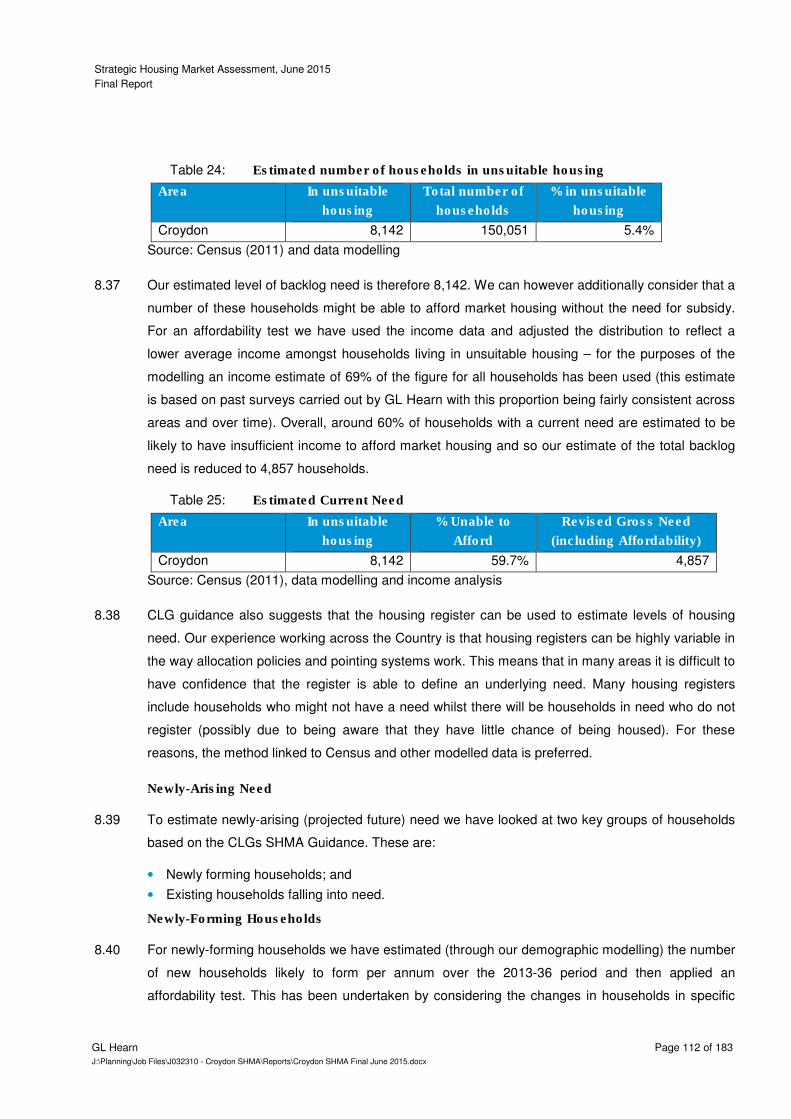
Strategic Housing Market Assessment, June 2015
Final Report
GL Hearn Page 112 of 183
J:\Planning\Job Files\J032310 - Croydon SHMA\Reports\Croydon SHMA Final June 2015.docx
Estimated number of households in unsuitable housing Table 24:
Area In unsuitable
housing
Total number of
households
% in unsuitable
housing
Croydon 8,142 150,051 5.4%
Source: Census (2011) and data modelling
Our estimated level of backlog need is therefore 8,142. We can however additionally consider that a 8.37
number of these households might be able to afford market housing without the need for subsidy.
For an affordability test we have used the income data and adjusted the distribution to reflect a
lower average income amongst households living in unsuitable housing – for the purposes of the
modelling an income estimate of 69% of the figure for all households has been used (this estimate
is based on past surveys carried out by GL Hearn with this proportion being fairly consistent across
areas and over time). Overall, around 60% of households with a current need are estimated to be
likely to have insufficient income to afford market housing and so our estimate of the total backlog
need is reduced to 4,857 households.
Estimated Current Need Table 25:
Area In unsuitable
housing
% Unable to
Afford
Revised Gross Need
(including Affordability)
Croydon 8,142 59.7% 4,857
Source: Census (2011), data modelling and income analysis
CLG guidance also suggests that the housing register can be used to estimate levels of housing 8.38
need. Our experience working across the Country is that housing registers can be highly variable in
the way allocation policies and pointing systems work. This means that in many areas it is difficult to
have confidence that the register is able to define an underlying need. Many housing registers
include households who might not have a need whilst there will be households in need who do not
register (possibly due to being aware that they have little chance of being housed). For these
reasons, the method linked to Census and other modelled data is preferred.
Newly-Arising Need
To estimate newly-arising (projected future) need we have looked at two key groups of households 8.39
based on the CLGs SHMA Guidance. These are:
• Newly forming households; and
• Existing households falling into need.
Newly-Forming Households
For newly-forming households we have estimated (through our demographic modelling) the number 8.40
of new households likely to form per annum over the 2013-36 period and then applied an
affordability test. This has been undertaken by considering the changes in households in specific
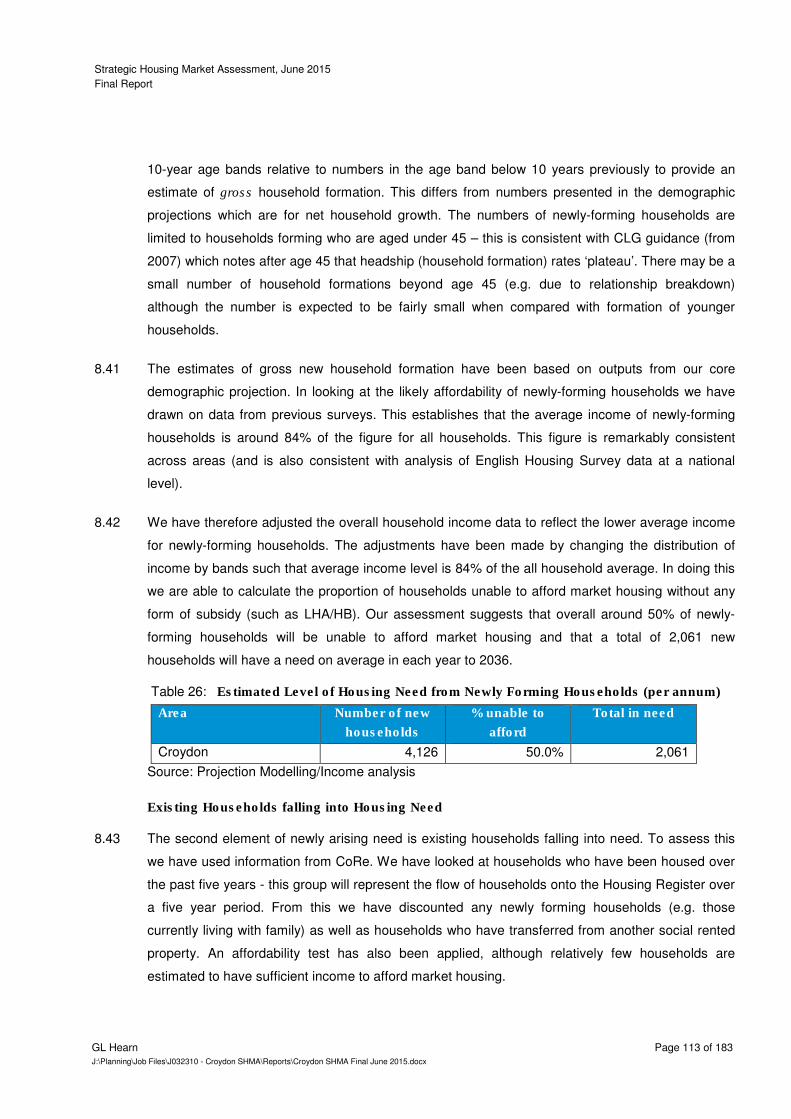
Strategic Housing Market Assessment, June 2015
Final Report
GL Hearn Page 113 of 183
J:\Planning\Job Files\J032310 - Croydon SHMA\Reports\Croydon SHMA Final June 2015.docx
10-year age bands relative to numbers in the age band below 10 years previously to provide an
estimate of gross household formation. This differs from numbers presented in the demographic
projections which are for net household growth. The numbers of newly-forming households are
limited to households forming who are aged under 45 – this is consistent with CLG guidance (from
2007) which notes after age 45 that headship (household formation) rates ‘plateau’. There may be a
small number of household formations beyond age 45 (e.g. due to relationship breakdown)
although the number is expected to be fairly small when compared with formation of younger
households.
The estimates of gross new household formation have been based on outputs from our core 8.41
demographic projection. In looking at the likely affordability of newly-forming households we have
drawn on data from previous surveys. This establishes that the average income of newly-forming
households is around 84% of the figure for all households. This figure is remarkably consistent
across areas (and is also consistent with analysis of English Housing Survey data at a national
level).
We have therefore adjusted the overall household income data to reflect the lower average income 8.42
for newly-forming households. The adjustments have been made by changing the distribution of
income by bands such that average income level is 84% of the all household average. In doing this
we are able to calculate the proportion of households unable to afford market housing without any
form of subsidy (such as LHA/HB). Our assessment suggests that overall around 50% of newly-
forming households will be unable to afford market housing and that a total of 2,061 new
households will have a need on average in each year to 2036.
Estimated Level of Housing Need from Newly Forming Households (per annum) Table 26:
Area Number of new
households
% unable to
afford
Total in need
Croydon 4,126 50.0% 2,061
Source: Projection Modelling/Income analysis
Existing Households falling into Housing Need
The second element of newly arising need is existing households falling into need. To assess this 8.43
we have used information from CoRe. We have looked at households who have been housed over
the past five years - this group will represent the flow of households onto the Housing Register over
a five year period. From this we have discounted any newly forming households (e.g. those
currently living with family) as well as households who have transferred from another social rented
property. An affordability test has also been applied, although relatively few households are
estimated to have sufficient income to afford market housing.

Strategic Housing Market Assessment, June 2015
Final Report
GL Hearn Page 114 of 183
J:\Planning\Job Files\J032310 - Croydon SHMA\Reports\Croydon SHMA Final June 2015.docx
This method for assessing existing households falling into need is consistent with the 2007 SHMA 8.44
guide which says on page 46 that ‘Partnerships should estimate the numbers of existing
households falling into need each year by looking at recent trends. This should include households
who have entered the housing register and been housed within the year as well as households
housed outside of the register (such as priority homeless households applicants)’.
Following the analysis through suggests a need arising from 419 existing households each year – 8.45
this is about 0.3% of all households living in the Borough (in 2013).
Supply of Affordable Housing
The future supply of affordable housing is the flow of affordable housing arising from the existing 8.46
stock that is available to meet future need. It is split between the annual supply of social/affordable
rent relets and the annual supply of relets/sales within the intermediate sector.
The Practice Guidance suggests that the estimate of likely future relets from the social rented stock 8.47
should be based on past trend data which can be taken as a prediction for the future. We have
used information from the Continuous Recording system (CORE) to establish past patterns of social
housing turnover. Our figures include general needs and supported lettings but exclude lettings of
new properties plus an estimate of the number of transfers from other social rented homes. These
exclusions are made to ensure that the figures presented reflect relets from the existing stock.
Additionally an estimate of the number of ‘temporary’ supported lettings has been removed from the
figures (the proportion shown in CoRe as being lettings in direct access hostels or foyer schemes).
On the basis of past trend data is has been estimated that 379 units of social/affordable rented 8.48
housing are likely to become available each year moving forward.
Analysis of past social/affordable rented housing supply (per annum - past 3 Table 27:
years)
Value Number
Total lettings 1,202
% as non-new build 79.5%
Lettings in existing stock 955
% non-transfers 62.5%
Sub-total 597
% non-temporary housing 97.4%
Total lettings to new tenants 582
Source: CoRe
The supply figure is for social/affordable rented housing only and whilst the stock of intermediate 8.49
housing in Croydon is not significant compared to the social/affordable rented stock it is likely that
some housing does become available each year (e.g. re-sales of shared ownership). For the
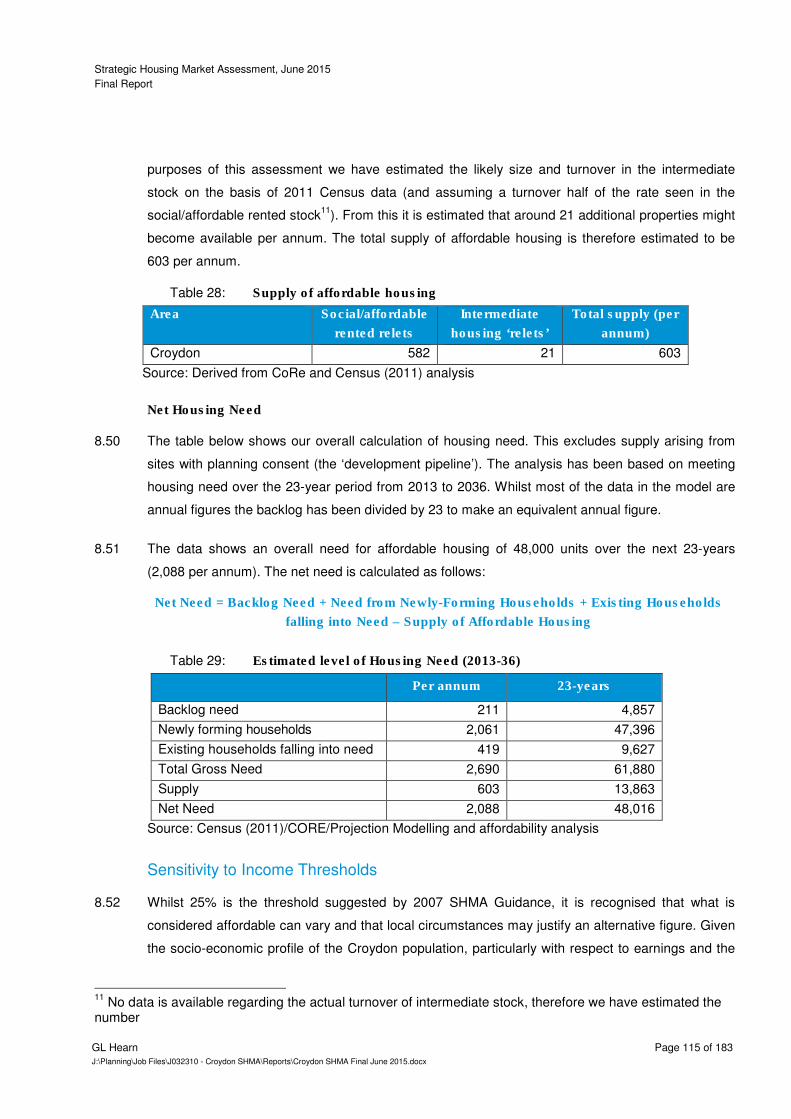
Strategic Housing Market Assessment, June 2015
Final Report
GL Hearn Page 115 of 183
J:\Planning\Job Files\J032310 - Croydon SHMA\Reports\Croydon SHMA Final June 2015.docx
purposes of this assessment we have estimated the likely size and turnover in the intermediate
stock on the basis of 2011 Census data (and assuming a turnover half of the rate seen in the
social/affordable rented stock11
). From this it is estimated that around 21 additional properties might
become available per annum. The total supply of affordable housing is therefore estimated to be
603 per annum.
Supply of affordable housing Table 28:
Area Social/affordable
rented relets
Intermediate
housing ‘relets’
Total supply (per
annum)
Croydon 582 21 603
Source: Derived from CoRe and Census (2011) analysis
Net Housing Need
The table below shows our overall calculation of housing need. This excludes supply arising from 8.50
sites with planning consent (the ‘development pipeline’). The analysis has been based on meeting
housing need over the 23-year period from 2013 to 2036. Whilst most of the data in the model are
annual figures the backlog has been divided by 23 to make an equivalent annual figure.
The data shows an overall need for affordable housing of 48,000 units over the next 23-years 8.51
(2,088 per annum). The net need is calculated as follows:
Net Need = Backlog Need + Need from Newly-Forming Households + Existing Households
falling into Need – Supply of Affordable Housing
Estimated level of Housing Need (2013-36) Table 29:
Per annum 23-years
Backlog need 211 4,857
Newly forming households 2,061 47,396
Existing households falling into need 419 9,627
Total Gross Need 2,690 61,880
Supply 603 13,863
Net Need 2,088 48,016
Source: Census (2011)/CORE/Projection Modelling and affordability analysis
Sensitivity to Income Thresholds
Whilst 25% is the threshold suggested by 2007 SHMA Guidance, it is recognised that what is 8.52
considered affordable can vary and that local circumstances may justify an alternative figure. Given
the socio-economic profile of the Croydon population, particularly with respect to earnings and the
11
No data is available regarding the actual turnover of intermediate stock, therefore we have estimated the number
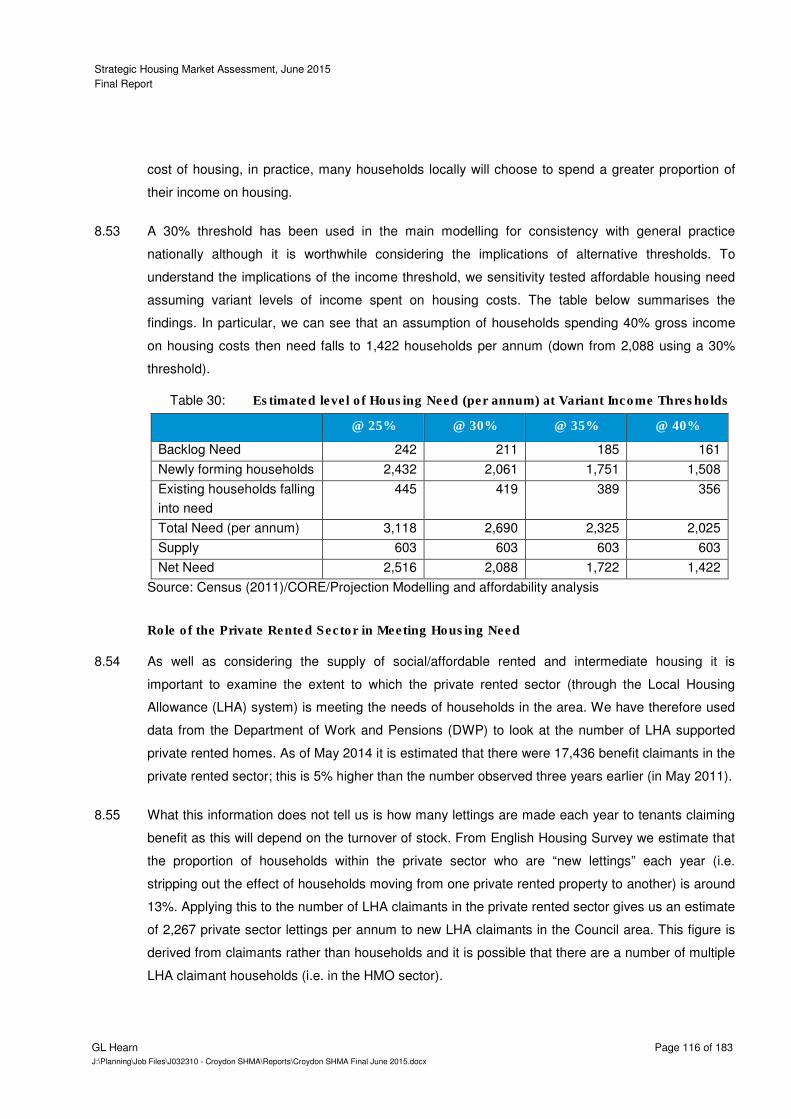
Strategic Housing Market Assessment, June 2015
Final Report
GL Hearn Page 116 of 183
J:\Planning\Job Files\J032310 - Croydon SHMA\Reports\Croydon SHMA Final June 2015.docx
cost of housing, in practice, many households locally will choose to spend a greater proportion of
their income on housing.
A 30% threshold has been used in the main modelling for consistency with general practice 8.53
nationally although it is worthwhile considering the implications of alternative thresholds. To
understand the implications of the income threshold, we sensitivity tested affordable housing need
assuming variant levels of income spent on housing costs. The table below summarises the
findings. In particular, we can see that an assumption of households spending 40% gross income
on housing costs then need falls to 1,422 households per annum (down from 2,088 using a 30%
threshold).
Estimated level of Housing Need (per annum) at Variant Income Thresholds Table 30:
@ 25% @ 30% @ 35% @ 40%
Backlog Need 242 211 185 161
Newly forming households 2,432 2,061 1,751 1,508
Existing households falling
into need
445 419 389 356
Total Need (per annum) 3,118 2,690 2,325 2,025
Supply 603 603 603 603
Net Need 2,516 2,088 1,722 1,422
Source: Census (2011)/CORE/Projection Modelling and affordability analysis
Role of the Private Rented Sector in Meeting Housing Need
As well as considering the supply of social/affordable rented and intermediate housing it is 8.54
important to examine the extent to which the private rented sector (through the Local Housing
Allowance (LHA) system) is meeting the needs of households in the area. We have therefore used
data from the Department of Work and Pensions (DWP) to look at the number of LHA supported
private rented homes. As of May 2014 it is estimated that there were 17,436 benefit claimants in the
private rented sector; this is 5% higher than the number observed three years earlier (in May 2011).
What this information does not tell us is how many lettings are made each year to tenants claiming 8.55
benefit as this will depend on the turnover of stock. From English Housing Survey we estimate that
the proportion of households within the private sector who are “new lettings” each year (i.e.
stripping out the effect of households moving from one private rented property to another) is around
13%. Applying this to the number of LHA claimants in the private rented sector gives us an estimate
of 2,267 private sector lettings per annum to new LHA claimants in the Council area. This figure is
derived from claimants rather than households and it is possible that there are a number of multiple
LHA claimant households (i.e. in the HMO sector).

Strategic Housing Market Assessment, June 2015
Final Report
GL Hearn Page 117 of 183
J:\Planning\Job Files\J032310 - Croydon SHMA\Reports\Croydon SHMA Final June 2015.docx
The overall estimated number of lettings in the LHA part of the Private Rental Sector (PRS) can 8.56
therefore be seen to be slightly higher than the total net need derived through housing needs
analysis. It is not however appropriate to treat this sector as a form of affordable housing and net it
from the overall annual housing needs estimate of 2,088 affordable homes per annum. Neither the
SHMA Guidance (CLG, 2007) nor the NPPF (CLG, 2012) recognise this sector as affordable
housing.
However, it should be recognised that, in practice, the private rented sector does make a significant 8.57
contribution to filling the gap in relation to meeting housing need and given the levels of affordable
housing need shown in this study, the private rented sector is likely to continue to be used to some
degree to make up for the shortfall of genuine affordable housing for the foreseeable future.
The extent to which the Council wishes to see the private rented sector being used to make up for 8.58
shortages of affordable housing is a matter for policy intervention and is outside the scope of this
report. However it should be recognised that the Private Rented Sector does not provide secure
tenancies and that standards within the sector are likely to be lower than for social rented properties.
Furthermore there are households with specific housing needs who may not be able to find suitable
accommodation within the Private Rented Sector.
Understanding the Context to the Housing Needs Assessment
The housing needs analysis concludes that there is a shortfall of 48,000 affordable homes over the 8.59
period from 2013 to 2036 (2,088 per annum). If this level of affordable housing was to be delivered
as 40% of the total stock (in line with the London Housing Strategy) then 5,220 dwellings would be
required to be delivered per annum. This would represent a significant uplift from the demographic
need of 2,440 dwellings identified earlier.
However there are a number of things that need to be remembered in interpreting the housing 8.60
needs analysis. Firstly, the Basic Needs Assessment Model which has been used was designed
specifically to identify whether there is a shortfall or surplus of affordable housing. It is a statutory
requirement to underpin affordable housing policies.
The needs assessment therefore does not look at all housing needs, but specifically the needs of 8.61
those who can’t afford market housing (assuming no more than 30% of households’ gross income
is spent on housing costs). It assumes that all households are adequately housed in a home that
they can afford.
The needs assessment is a ‘snapshot’ assessment at a point in time, which is affected by the 8.62
differential between housing costs and incomes at that point; as well as the existing supply of
affordable housing. In the case of Croydon, the stock of affordable housing (social rented)
Strategic Housing Market Assessment, June 2015
Final Report
GL Hearn Page 118 of 183
J:\Planning\Job Files\J032310 - Croydon SHMA\Reports\Croydon SHMA Final June 2015.docx
represents about 18% of the total number of households – this is notably below the equivalent
figure for London (24%). This has affected the level of affordable housing need. The shortfall of
affordable housing identified is therefore to some extent affected by past investment decisions.
Moreover, as the Basic Needs Assessment Model is designed to identify a shortfall of genuine 8.63
affordable housing, it assumes that all households in ‘housing need’ are housed in affordable
homes (which include a provision that the home remains at an affordable price for future eligible
households).
In reality, there are two key factors which need to be considered: 8.64
• Many households defined as in housing need may choose to spend more than 30% of their
gross income on housing costs or may not actively seek an affordable home; and
• Some households defined as in housing need are accommodated in the Private Rented Sector,
supported by Local Housing Allowance.
It is estimated that there are currently around 17,400 Local Housing Allowance claimants housed in 8.65
the Private Rented Sector with many more expected to be in this sector and paying more than 30%
of their income on housing but not claiming Housing Benefit (for example a single person might
need to see their housing costs get up to around 45%-50% of rent before getting Housing Benefit
(although other benefits such as working tax credits will kick in below this level))
As the level of housing need is very sensitive to differences between housing costs and incomes, 8.66
changes in the difference between incomes and housing costs over time will affect the level of
housing need identified.
Due to the role of the private rented sector in meeting housing need there is no evidence of a 8.67
significant shortfall in overall housing provision to meet local housing requirements over and above
that shown by the demographic modelling and so no additional uplift is required to take account of
affordability issues.
Given the current stock of affordable housing in the area, the funding mechanisms for delivery of 8.68
new affordable housing and policies affecting sales of existing properties, it is unrealistic to assume
that all households in housing need will be provided with an affordable home. It is realistic to
assume that the Private Rented Sector will continue to play an important role in meeting housing
need in the short-to-medium term.
Need for Different Types of Affordable Housing
Having studied housing costs, incomes and housing need the next step is to make an estimate of 8.69
the proportion of affordable housing need that should be met through provision of different housing
products. We therefore use the income information presented earlier in this section to estimate the
Strategic Housing Market Assessment, June 2015
Final Report
GL Hearn Page 119 of 183
J:\Planning\Job Files\J032310 - Croydon SHMA\Reports\Croydon SHMA Final June 2015.docx
proportion of households who are likely to be able to afford intermediate housing and the number
for whom only social or affordable rented housing will be affordable. There are three main types of
affordable housing that can be studied in this analysis:
• Intermediate
• Affordable rent
• Social rent
Whilst the process of separating households into different income bands for analytical purposes is 8.70
quite straightforward, this does not necessarily tell us what sort of affordable housing they might be
able to afford or occupy.
For example a household with an income close to being able to afford market housing might be 8.71
able to afford intermediate or affordable rent but may be prevented from accessing certain
intermediate products (such as shared ownership) as they have an insufficient savings to cover a
deposit. Such a household might therefore be allocated to affordable rented or intermediate rented
housing as the most suitable solution. However we would expect that few Registered Providers
would build intermediate rented homes, given that the level of potential occupants for affordable
rented homes is greater (as it includes households who could claim housing benefit to supplement
their incomes).
The distinction between social and affordable rented housing is also complex. Whilst rents for 8.72
affordable rented housing would be expected to be higher than social rents, this does not
necessarily mean that such a product would be reserved for households with a higher income. In
reality, as long as the rent to be paid falls at or below LHA limits then it will be accessible to a range
of households (many of whom will need to claim housing benefit). Local authorities’ tenancy
strategies might set policies regarding the types of households which might be allocated affordable
rented homes; and many authorities will seek to avoid where possible households having to claim
higher levels of housing benefit. This however needs to be set against other factors, including
viability and the availability of grant funding. Over the current spending period to 2015 grant funding
is primarily available to support delivery of affordable rented homes. A significant level of affordable
housing delivery is however through developer contributions (Section 106 Agreements).
For these reasons it is difficult to exactly pin down what proportion of additional affordable homes 8.73
should be provided through different affordable tenure categories. In effect there is a degree of
overlap between different affordable housing tenures, as the figure below shows.
Overlap between Affordable Housing Tenures Figure 64:
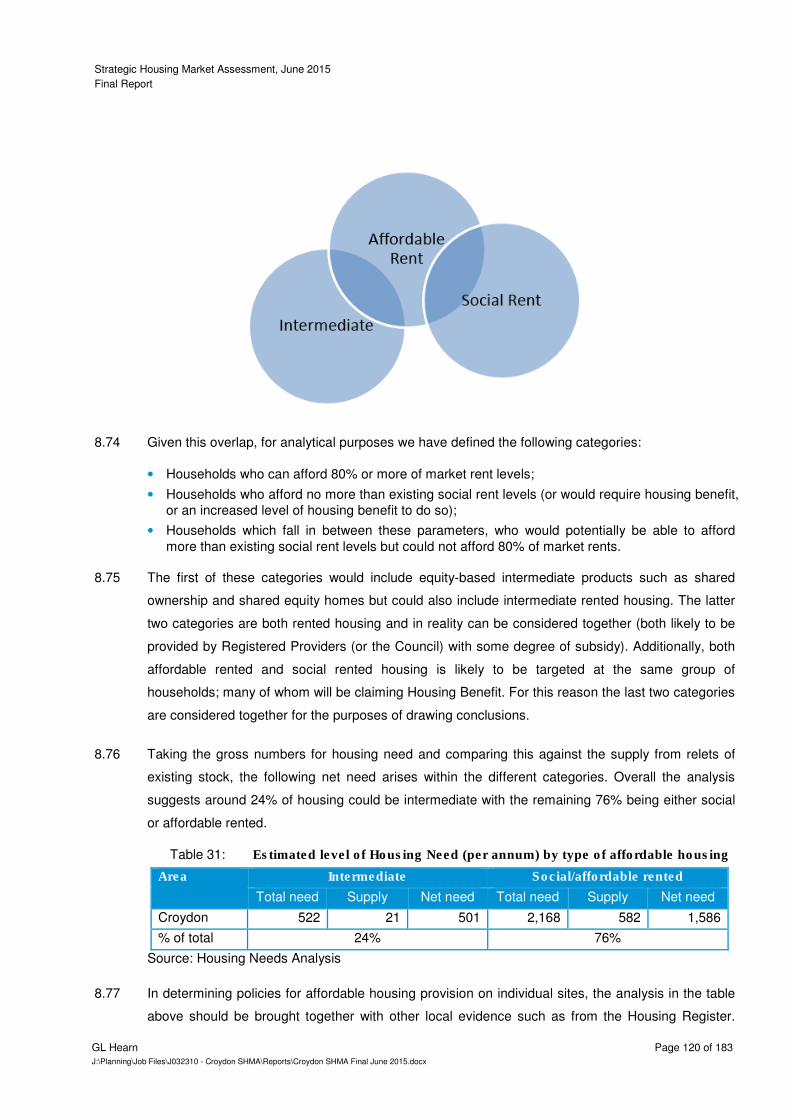
Strategic Housing Market Assessment, June 2015
Final Report
GL Hearn Page 120 of 183
J:\Planning\Job Files\J032310 - Croydon SHMA\Reports\Croydon SHMA Final June 2015.docx
Given this overlap, for analytical purposes we have defined the following categories: 8.74
• Households who can afford 80% or more of market rent levels;
• Households who afford no more than existing social rent levels (or would require housing benefit,
or an increased level of housing benefit to do so);
• Households which fall in between these parameters, who would potentially be able to afford
more than existing social rent levels but could not afford 80% of market rents.
The first of these categories would include equity-based intermediate products such as shared 8.75
ownership and shared equity homes but could also include intermediate rented housing. The latter
two categories are both rented housing and in reality can be considered together (both likely to be
provided by Registered Providers (or the Council) with some degree of subsidy). Additionally, both
affordable rented and social rented housing is likely to be targeted at the same group of
households; many of whom will be claiming Housing Benefit. For this reason the last two categories
are considered together for the purposes of drawing conclusions.
Taking the gross numbers for housing need and comparing this against the supply from relets of 8.76
existing stock, the following net need arises within the different categories. Overall the analysis
suggests around 24% of housing could be intermediate with the remaining 76% being either social
or affordable rented.
Estimated level of Housing Need (per annum) by type of affordable housing Table 31:
Area Intermediate Social/affordable rented
Total need Supply Net need Total need Supply Net need
Croydon 522 21 501 2,168 582 1,586
% of total 24% 76%
Source: Housing Needs Analysis
In determining policies for affordable housing provision on individual sites, the analysis in the table 8.77
above should be brought together with other local evidence such as from the Housing Register.

Strategic Housing Market Assessment, June 2015
Final Report
GL Hearn Page 121 of 183
J:\Planning\Job Files\J032310 - Croydon SHMA\Reports\Croydon SHMA Final June 2015.docx
Consideration could also be given to areas with high concentrations of social rented housing where
additional intermediate housing might be desirable to improve the housing mix and to create
‘housing pathways’.
Housing Need – Summary of the Evidence
An assessment of housing need has been undertaken which is compliant with Government 8.78
guidance to identify whether there is a shortfall or surplus of affordable housing in Croydon. This
has estimated current housing need in 2013 of 4,857 households, excluding existing social housing
tenants where they would release a home for another household in need.
The housing needs model then looked at the balance between needs arising and the supply of 8.79
affordable housing. Each year an estimated 2,479 households are expected to fall into housing
need and 603 properties are expected to come up for re-let.
Overall, in the period from 2013 to 2036 a net deficit of 48,000 affordable homes is identified (2,088 8.80
per annum). There is thus a requirement for new affordable housing in the Council area and the
Council is justified in seeking to secure additional affordable housing.
While a deficiency in affordable housing is identified, in practice some households who are unable 8.81
to secure affordable housing are able to live within the Private Rented Sector supported by housing
benefit, It seems likely that the Private Rented Sector will continue to be used to make up for any
shortfall of affordable housing.
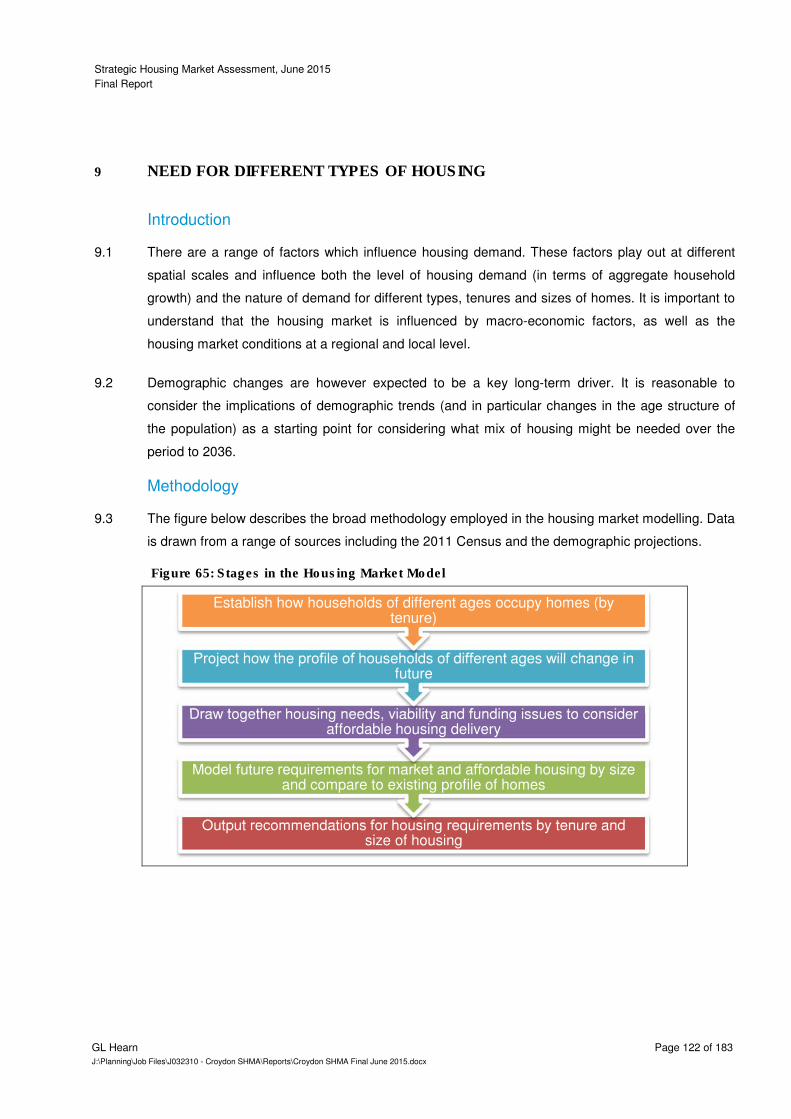
Strategic Housing Market Assessment, June 2015
Final Report
GL Hearn Page 122 of 183
J:\Planning\Job Files\J032310 - Croydon SHMA\Reports\Croydon SHMA Final June 2015.docx
9 NEED FOR DIFFERENT TYPES OF HOUSING
Introduction
There are a range of factors which influence housing demand. These factors play out at different 9.1
spatial scales and influence both the level of housing demand (in terms of aggregate household
growth) and the nature of demand for different types, tenures and sizes of homes. It is important to
understand that the housing market is influenced by macro-economic factors, as well as the
housing market conditions at a regional and local level.
Demographic changes are however expected to be a key long-term driver. It is reasonable to 9.2
consider the implications of demographic trends (and in particular changes in the age structure of
the population) as a starting point for considering what mix of housing might be needed over the
period to 2036.
Methodology
The figure below describes the broad methodology employed in the housing market modelling. Data 9.3
is drawn from a range of sources including the 2011 Census and the demographic projections.
Stages in the Housing Market Model Figure 65:
Output recommendations for housing requirements by tenure and size of housing
Model future requirements for market and affordable housing by size and compare to existing profile of homes
Draw together housing needs, viability and funding issues to consider affordable housing delivery
Project how the profile of households of different ages will change in future
Establish how households of different ages occupy homes (by tenure)
Strategic Housing Market Assessment, June 2015
Final Report
GL Hearn Page 123 of 183
J:\Planning\Job Files\J032310 - Croydon SHMA\Reports\Croydon SHMA Final June 2015.docx
Understanding how Households Occupy Homes
Whilst the demographic projections provide a good indication of how the population and household 9.4
structure will develop it is not a simple task to convert the net increase in the number of households
in to a suggested profile for additional housing to be provided. The main reason for this is that in the
market sector households are able to buy or rent any size of property (subject to what they can
afford) and therefore knowledge of the profile of households in an area does not directly transfer
into the sizes of property to be provided. The size of housing which households occupy relates
more to their wealth and age than the number of people which they contain.
For example, there is no reason why a single person cannot buy (or choose to live in) a four 9.5
bedroom home as long as they can afford it and hence projecting an increase in single person
households does not automatically translate in to a need for smaller units. This issue is less
relevant in the affordable sector (particularly since the introduction of the social sector size criteria)
although there will still be some level of under-occupation moving forward with regard to older
person and working households who may be able to continue to under-occupy their current homes.
The general methodology is to use the information derived in the projections about the number of 9.6
household reference persons (HRPs) in each age and sex group and apply this to the profile of
housing within these groups. The data for this analysis has been formed from a commissioned table
by ONS (Table C1213 which provides relevant data for all local authorities in England) with data
then calibrated to be consistent with 2011 Census data (e.g. about house sizes in different tenure
groups and locations).
The figure below shows an estimate of how the average number of bedrooms varies for different 9.7
ages of HRP and different sexes by broad tenure group. In the market sector the average size of
accommodation rises over time to typically reach a peak around the 50-59 age groups. In the
affordable sector this peak appears earlier. After sizes peak, the average dwelling size decreases –
possibly linked to some households down-sizing as they get older. It is also notable that the
average size for affordable housing dwellings are lower than those for market housing whilst in
market housing, male HRPs typically live in larger accommodation for all age groups (with no strong
trend being seen in the affordable sector).

Strategic Housing Market Assessment, June 2015
Final Report
GL Hearn Page 124 of 183
J:\Planning\Job Files\J032310 - Croydon SHMA\Reports\Croydon SHMA Final June 2015.docx
Average Bedrooms by Age, Sex and Tenure Figure 66:
Source: Derived from ONS Commissioned Table C1213 and 2011 Census
Establishing a Baseline Position
As of 2013 it is estimated that there were 150,051 households living in the Borough. Analysis of 9.8
Census data linked to the demographic baseline provides us with an estimate of the profile of the
housing stock in 2013, as shown in the table below. The table shows that an estimated 18% of
households live in affordable housing with 82% being in the market sector (the size of the affordable
sector has been fixed by reference to an estimate of the number of occupied social rented and
shared ownership homes in the 2011 Census). The data also suggests that homes in the market
sector are generally bigger than in the affordable sector with 58% having three or more bedrooms
compared to 35% for affordable housing.
These figures are for households rather than dwellings due to information about the sizes of vacant 9.9
homes across the whole stock (i.e. market and affordable) not being readily available. For the
purposes of analysis this will not make any notable difference to the outcome. We have however
translated the household projections into dwelling figures by including a 2.6% vacancy allowance
when studying the final outputs of the market modelling.
0
0.5
1
1.5
2
2.5
3
3.5
Under25
25-29 30-34 35-39 40-44 45-49 50-54 55-59 60-64 65-69 70-74 75-79 80-84 85+
Ave
rage
num
ber
of b
edro
oms
Male - market Female - market Male - affordable Female - affordable
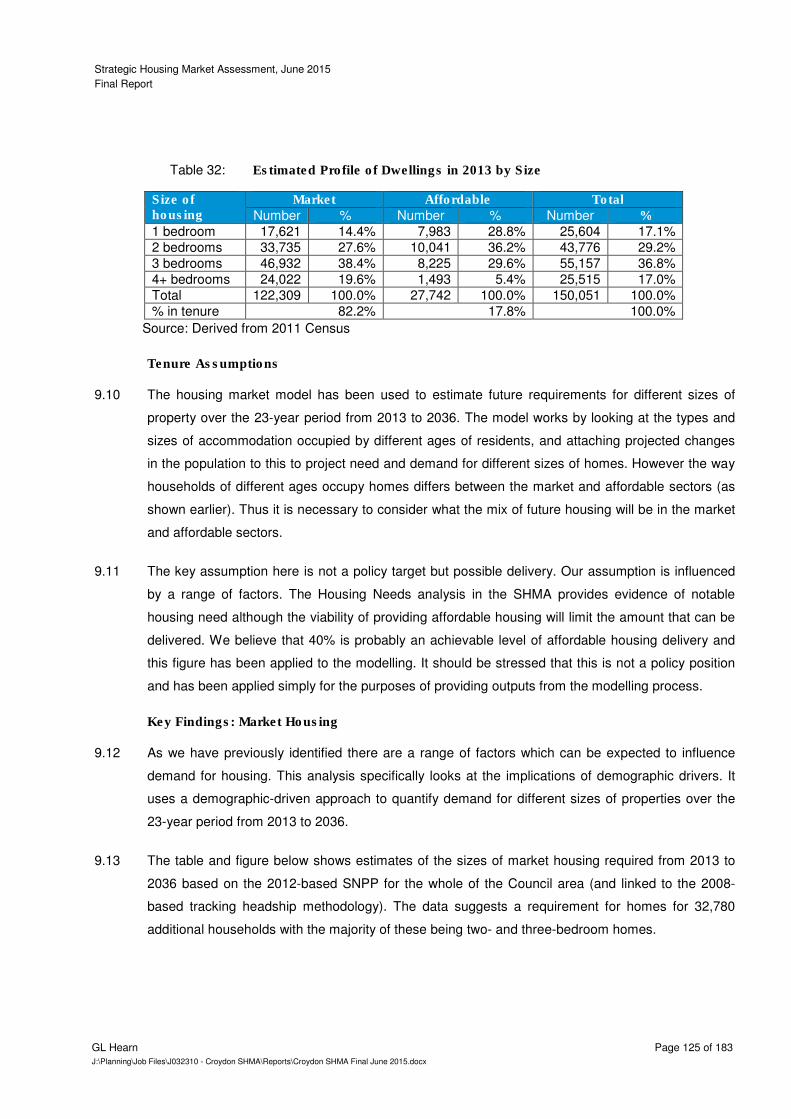
Strategic Housing Market Assessment, June 2015
Final Report
GL Hearn Page 125 of 183
J:\Planning\Job Files\J032310 - Croydon SHMA\Reports\Croydon SHMA Final June 2015.docx
Estimated Profile of Dwellings in 2013 by Size Table 32:
Source: Derived from 2011 Census
Tenure Assumptions
The housing market model has been used to estimate future requirements for different sizes of 9.10
property over the 23-year period from 2013 to 2036. The model works by looking at the types and
sizes of accommodation occupied by different ages of residents, and attaching projected changes
in the population to this to project need and demand for different sizes of homes. However the way
households of different ages occupy homes differs between the market and affordable sectors (as
shown earlier). Thus it is necessary to consider what the mix of future housing will be in the market
and affordable sectors.
The key assumption here is not a policy target but possible delivery. Our assumption is influenced 9.11
by a range of factors. The Housing Needs analysis in the SHMA provides evidence of notable
housing need although the viability of providing affordable housing will limit the amount that can be
delivered. We believe that 40% is probably an achievable level of affordable housing delivery and
this figure has been applied to the modelling. It should be stressed that this is not a policy position
and has been applied simply for the purposes of providing outputs from the modelling process.
Key Findings: Market Housing
As we have previously identified there are a range of factors which can be expected to influence 9.12
demand for housing. This analysis specifically looks at the implications of demographic drivers. It
uses a demographic-driven approach to quantify demand for different sizes of properties over the
23-year period from 2013 to 2036.
The table and figure below shows estimates of the sizes of market housing required from 2013 to 9.13
2036 based on the 2012-based SNPP for the whole of the Council area (and linked to the 2008-
based tracking headship methodology). The data suggests a requirement for homes for 32,780
additional households with the majority of these being two- and three-bedroom homes.
Size of housing
Market Affordable Total
Number % Number % Number %
1 bedroom 17,621 14.4% 7,983 28.8% 25,604 17.1%
2 bedrooms 33,735 27.6% 10,041 36.2% 43,776 29.2%
3 bedrooms 46,932 38.4% 8,225 29.6% 55,157 36.8%
4+ bedrooms 24,022 19.6% 1,493 5.4% 25,515 17.0%
Total 122,309 100.0% 27,742 100.0% 150,051 100.0%
% in tenure 82.2% 17.8% 100.0%
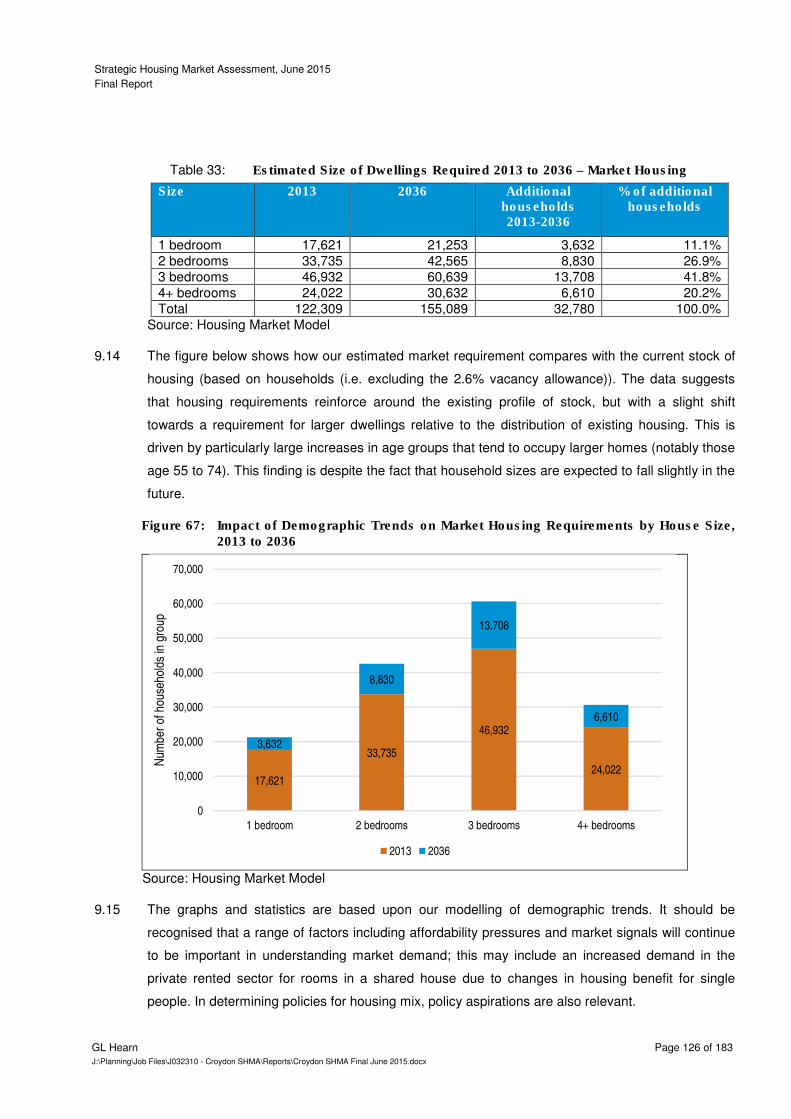
Strategic Housing Market Assessment, June 2015
Final Report
GL Hearn Page 126 of 183
J:\Planning\Job Files\J032310 - Croydon SHMA\Reports\Croydon SHMA Final June 2015.docx
Estimated Size of Dwellings Required 2013 to 2036 – Market Housing Table 33:
Size 2013 2036 Additional households 2013-2036
% of additional households
1 bedroom 17,621 21,253 3,632 11.1%
2 bedrooms 33,735 42,565 8,830 26.9%
3 bedrooms 46,932 60,639 13,708 41.8%
4+ bedrooms 24,022 30,632 6,610 20.2%
Total 122,309 155,089 32,780 100.0%
Source: Housing Market Model
The figure below shows how our estimated market requirement compares with the current stock of 9.14
housing (based on households (i.e. excluding the 2.6% vacancy allowance)). The data suggests
that housing requirements reinforce around the existing profile of stock, but with a slight shift
towards a requirement for larger dwellings relative to the distribution of existing housing. This is
driven by particularly large increases in age groups that tend to occupy larger homes (notably those
age 55 to 74). This finding is despite the fact that household sizes are expected to fall slightly in the
future.
Impact of Demographic Trends on Market Housing Requirements by House Size, Figure 67:2013 to 2036
Source: Housing Market Model
The graphs and statistics are based upon our modelling of demographic trends. It should be 9.15
recognised that a range of factors including affordability pressures and market signals will continue
to be important in understanding market demand; this may include an increased demand in the
private rented sector for rooms in a shared house due to changes in housing benefit for single
people. In determining policies for housing mix, policy aspirations are also relevant.
17,621
33,735
46,932
24,022
3,632
8,830
13,708
6,610
0
10,000
20,000
30,000
40,000
50,000
60,000
70,000
1 bedroom 2 bedrooms 3 bedrooms 4+ bedrooms
Num
ber
of h
ouse
hold
s in
gro
up
2013 2036
Strategic Housing Market Assessment, June 2015
Final Report
GL Hearn Page 127 of 183
J:\Planning\Job Files\J032310 - Croydon SHMA\Reports\Croydon SHMA Final June 2015.docx
In the short-term we would expect stronger demand in relative terms for larger family homes as the 9.16
market for smaller properties may continue to be restricted by mortgage finance constraints. Over
the 23-year projection period it is anticipated that there will be a continuing market for family homes,
but the existing stock is expected to make a significant contribution to meeting this demand, as
older households downsize (releasing equity from existing homes).
As the last few years have shown, there are a range of inter-dependencies which affect housing 9.17
demand, with effective demand for entry-level market housing currently curtailed by the availability
of mortgage finance for first-time buyers and those on lower earnings. This is likely to affect market
demand for smaller properties typically purchased by first-time buyers in the short-term.
We are of the view that it is appropriate through the planning system to seek to influence the 9.18
balance of types and sizes of market housing through considering the mix of sites allocated for
development rather than specific policies relating to the proportion of homes of different sizes which
are then applied to specific sites. This approach is implicit within NPPF which requires local
planning authorities to ‘identify the size, type, tenure and range of housing that is required’.
At the strategic level, a local authority in considering which sites to allocate, can consider what type 9.19
of development would likely be delivered on these sites. It can also provide guidance on housing
mix implicitly through policies on development densities.
Key Findings: Affordable Housing
The table and figure below show estimates of the sizes of affordable housing required based on our 9.20
understanding of demographic trends. The data suggests in the period between 2013 and 2036 that
around 68% of the requirement is for homes with one- or two-bedrooms with around 32% of the
requirement being for larger homes with three or more bedrooms.
This analysis provides a longer-term view of requirements for affordable housing and does not 9.21
reflect any specific priorities such as for family households in need rather than single people. In
addition we would note that smaller properties (i.e. one bedroom homes) typically offer limited
flexibility in accommodating the changing requirements of households, whilst delivery of larger
properties can help to meet the needs of households in high priority and to manage the housing
stock by releasing supply of smaller properties. That said, there may in the short-term be an
increased requirement for smaller homes as a result of welfare reforms limiting the amount of
housing benefit being paid to some working-age households.
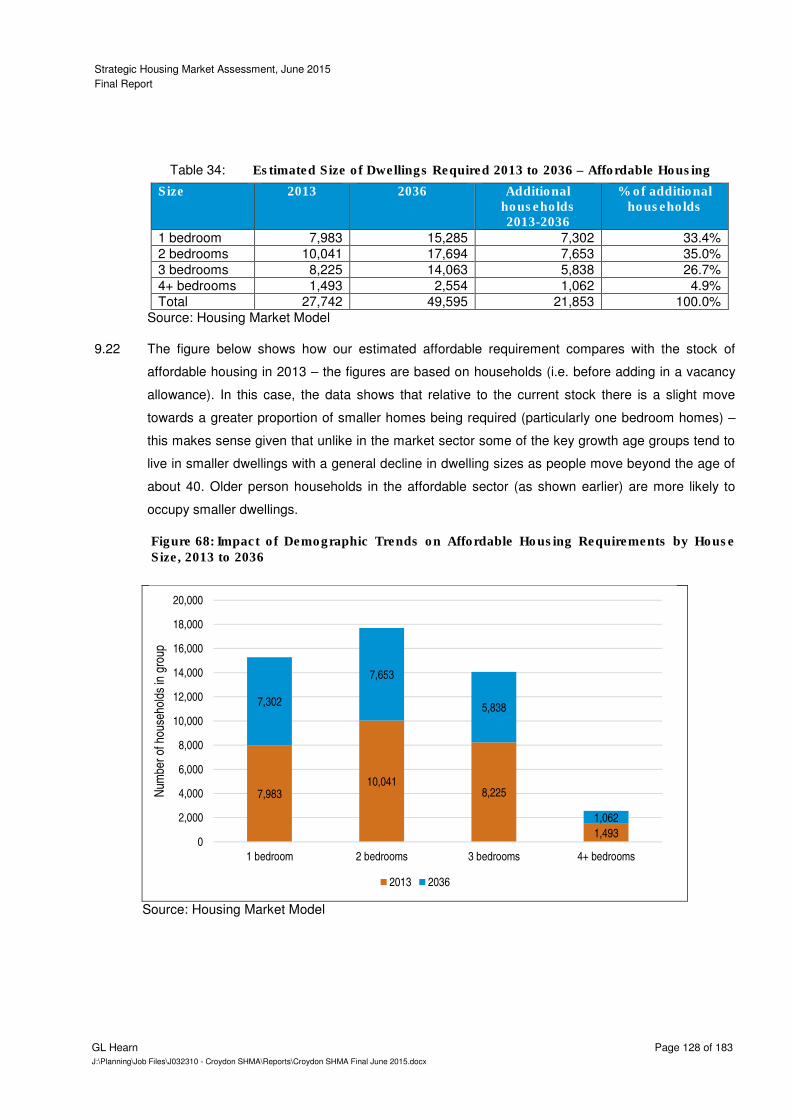
Strategic Housing Market Assessment, June 2015
Final Report
GL Hearn Page 128 of 183
J:\Planning\Job Files\J032310 - Croydon SHMA\Reports\Croydon SHMA Final June 2015.docx
Estimated Size of Dwellings Required 2013 to 2036 – Affordable Housing Table 34:
Size 2013 2036 Additional households 2013-2036
% of additional households
1 bedroom 7,983 15,285 7,302 33.4%
2 bedrooms 10,041 17,694 7,653 35.0%
3 bedrooms 8,225 14,063 5,838 26.7%
4+ bedrooms 1,493 2,554 1,062 4.9%
Total 27,742 49,595 21,853 100.0%
Source: Housing Market Model
The figure below shows how our estimated affordable requirement compares with the stock of 9.22
affordable housing in 2013 – the figures are based on households (i.e. before adding in a vacancy
allowance). In this case, the data shows that relative to the current stock there is a slight move
towards a greater proportion of smaller homes being required (particularly one bedroom homes) –
this makes sense given that unlike in the market sector some of the key growth age groups tend to
live in smaller dwellings with a general decline in dwelling sizes as people move beyond the age of
about 40. Older person households in the affordable sector (as shown earlier) are more likely to
occupy smaller dwellings.
Impact of Demographic Trends on Affordable Housing Requirements by House Figure 68:Size, 2013 to 2036
Source: Housing Market Model
7,98310,041
8,225
1,493
7,302
7,653
5,838
1,062
0
2,000
4,000
6,000
8,000
10,000
12,000
14,000
16,000
18,000
20,000
1 bedroom 2 bedrooms 3 bedrooms 4+ bedrooms
Num
ber
of h
ouse
hold
s in
gro
up
2013 2036
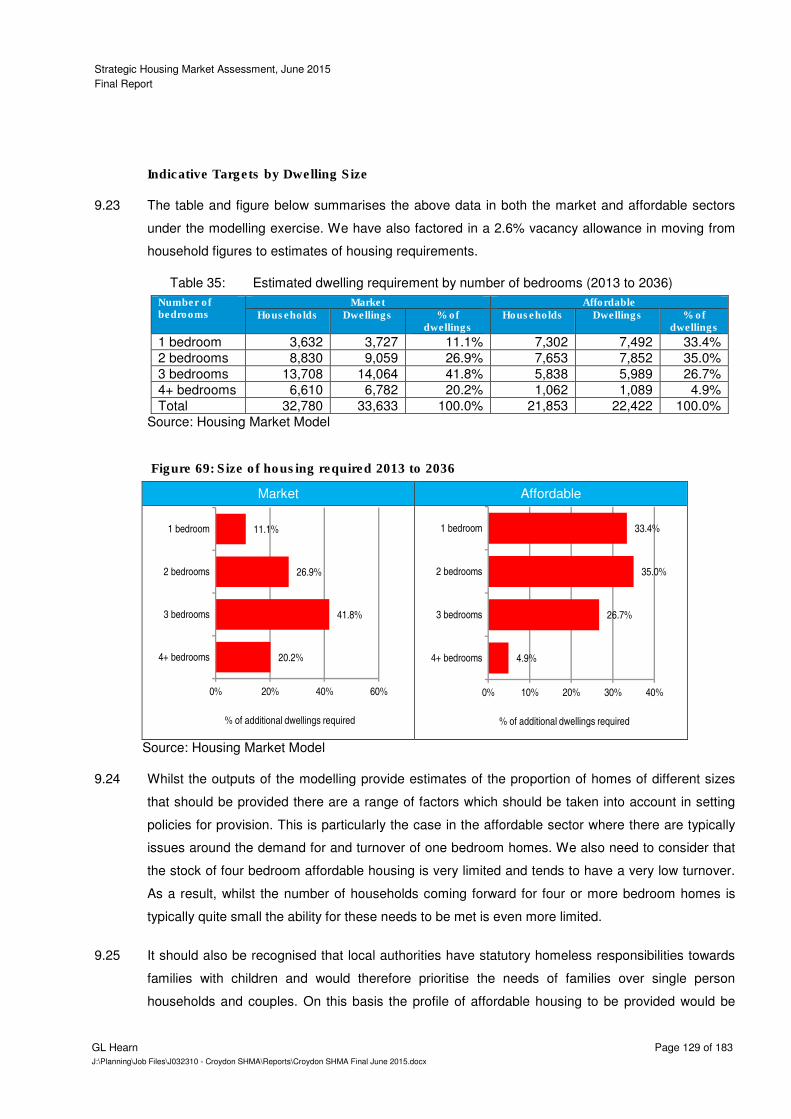
Strategic Housing Market Assessment, June 2015
Final Report
GL Hearn Page 129 of 183
J:\Planning\Job Files\J032310 - Croydon SHMA\Reports\Croydon SHMA Final June 2015.docx
Indicative Targets by Dwelling Size
The table and figure below summarises the above data in both the market and affordable sectors 9.23
under the modelling exercise. We have also factored in a 2.6% vacancy allowance in moving from
household figures to estimates of housing requirements.
Estimated dwelling requirement by number of bedrooms (2013 to 2036) Table 35:
Number of bedrooms
Market Affordable Households Dwellings % of
dwellings Households Dwellings % of
dwellings
1 bedroom 3,632 3,727 11.1% 7,302 7,492 33.4%
2 bedrooms 8,830 9,059 26.9% 7,653 7,852 35.0%
3 bedrooms 13,708 14,064 41.8% 5,838 5,989 26.7%
4+ bedrooms 6,610 6,782 20.2% 1,062 1,089 4.9%
Total 32,780 33,633 100.0% 21,853 22,422 100.0%
Source: Housing Market Model
Size of housing required 2013 to 2036 Figure 69:
Market Affordable
Source: Housing Market Model
Whilst the outputs of the modelling provide estimates of the proportion of homes of different sizes 9.24
that should be provided there are a range of factors which should be taken into account in setting
policies for provision. This is particularly the case in the affordable sector where there are typically
issues around the demand for and turnover of one bedroom homes. We also need to consider that
the stock of four bedroom affordable housing is very limited and tends to have a very low turnover.
As a result, whilst the number of households coming forward for four or more bedroom homes is
typically quite small the ability for these needs to be met is even more limited.
It should also be recognised that local authorities have statutory homeless responsibilities towards 9.25
families with children and would therefore prioritise the needs of families over single person
households and couples. On this basis the profile of affordable housing to be provided would be
20.2%
41.8%
26.9%
11.1%
0% 20% 40% 60%
4+ bedrooms
3 bedrooms
2 bedrooms
1 bedroom
% of additional dwellings required
4.9%
26.7%
35.0%
33.4%
0% 10% 20% 30% 40%
4+ bedrooms
3 bedrooms
2 bedrooms
1 bedroom
% of additional dwellings required

Strategic Housing Market Assessment, June 2015
Final Report
GL Hearn Page 130 of 183
J:\Planning\Job Files\J032310 - Croydon SHMA\Reports\Croydon SHMA Final June 2015.docx
further weighted to two or more bedroom housing. In the short-term however there may be a need
to increase the supply of one-bedroom homes due to the social sector size criteria.
For these reasons we would suggest in converting the long-term modelled outputs into a profile of 9.26
housing to be provided (in the affordable sector) that the proportion of one bedroom homes required
is reduced slightly from these outputs with a commensurate increase in four or more bedroom
homes also being appropriate.
There are thus a range of factors which are relevant in considering policies for the mix of affordable 9.27
housing sought through development schemes. At a Council area-wide level, the analysis would
support policies for the mix of affordable housing of:
• 1-bed properties: 30%-35%
• 2-bed properties: 30%-35%
• 3-bed properties: 25%-30%
• 4-bed properties: 5%-10%
Our strategic conclusions recognise the role which delivery of larger family homes can play in 9.28
releasing supply of smaller properties for other households; together with the limited flexibility which
one-bed properties offer to changing household circumstances which feed through into higher
turnover and management issues.
The need for affordable housing of different sizes will vary by area across the Council area and over 9.29
time. In considering the mix of homes to be provided within specific development schemes, the
information herein should be brought together with details of households currently on the Housing
Register in the local area and the stock and turnover of existing properties.
In the market sector we would suggest a profile of housing that closely matches the outputs of the 9.30
modelling. The recommendations take some account of the time period used for the modelling and
the fact that the full impact of the ageing population will not be experienced in the short-term. In
addition, as noted earlier, current constraints on mortgage finance is likely to suppress demand for
smaller units in the short-term (particularly those which would normally have high demand from first-
time buyers).
On the basis of these factors we consider that the provision of market housing should be more 9.31
explicitly focused on delivering smaller family housing for younger households. On this basis we
would recommend the following mix of market housing be sought:
• 1-bed properties: 10%
• 2-bed properties: 30%
• 3-bed properties: 40%
• 4-bed properties: 20%

Strategic Housing Market Assessment, June 2015
Final Report
GL Hearn Page 131 of 183
J:\Planning\Job Files\J032310 - Croydon SHMA\Reports\Croydon SHMA Final June 2015.docx
Although we have quantified this on the basis of the market modelling and our understanding of the 9.32
current housing market we do not strongly believe that such prescriptive figures should be included
in the plan making process and that the ‘market’ is to some degree a better judge of what is the
most appropriate profile of homes to deliver at any point in time. The figures can however be used
as a monitoring tool to ensure that future delivery is not unbalanced when compared with the likely
requirements as driven by demographic change in the area.
Impact of the GLA Figures
The Greater London Authority have also produced their own housing target for the Croydon as part 9.33
of the publication of the Further Alterations to the London Plan (FALP). These were based on the
central variant household projections produced by the Greater London Authority (GLA) which were
subsequently redistributed across the Boroughs on the basis of their capacity. The Croydon specific
figures set out in the FALP (1,435 dwellings per annum) will be adopted as a minimum target by the
Council.
However, the FALP monitoring target for the London Borough Croydon is significantly lower that the 9.34
need identified in both this report (2,440 dwellings per annum) and the GLA projections which
inform them (1,807 dwellings per annum see Table 16).
The inspector on the FALP suggested that while there is no need for the Boroughs to calculate their 9.35
own housing need there would be some need for them to look at the housing mix required in their
Boroughs.
We have therefore set out below an alternative housing mix required in the Borough if housing is 9.36
delivered to the level set out by both the GLA household forecasts and FALP monitoring target –
these figures are compared with the main analysis in the table below. This shows that with lower
housing delivery we would expect a very small shift towards a greater proportion of larger homes
being needed in the market sector. In the affordable sector, the opposite pattern is found (a very
small shift towards smaller homes). The differences occur due to the changing levels of migration
being assumed and how this impacts on the age structure. It should however be stressed that the
differences under different modelling assumptions are very slight, and do not impact on the overall
conclusions drawn.

Strategic Housing Market Assessment, June 2015
Final Report
GL Hearn Page 132 of 183
J:\Planning\Job Files\J032310 - Croydon SHMA\Reports\Croydon SHMA Final June 2015.docx
Estimated dwelling requirement by number of bedrooms (2013 to 2036) Table 36:
Projection Number of bedrooms
Market Affordable
Households Dwellings % of dwellings
Households Dwellings % of dwellings
Main analysis (2,437 dpa)
1 bedroom 3,632 3,727 11.1% 7,302 7,492 33.4% 2 bedrooms 8,830 9,059 26.9% 7,653 7,852 35.0% 3 bedrooms 13,708 14,064 41.8% 5,838 5,989 26.7% 4+ bedrooms 6,610 6,782 20.2% 1,062 1,089 4.9% Total 32,780 33,633 100.0% 21,853 22,422 100.0%
Alternative analysis (1,807 dpa)
1 bedroom 2,366 2,427 9.7% 5,413 5,554 33.4% 2 bedrooms 6,409 6,575 26.4% 5,705 5,854 35.2% 3 bedrooms 10,467 10,739 43.1% 4,305 4,417 26.6% 4+ bedrooms 5,063 5,194 20.8% 780 800 4.8% Total 24,305 24,936 100.0% 16,203 16,624 100.0%
Alternative analysis (1,435 dpa)
1 bedroom 1,597 1,639 8.3% 4,496 4,613 34.9% 2 bedrooms 5,029 5,159 26.1% 4,489 4,605 34.9% 3 bedrooms 8,594 8,817 44.5% 3,287 3,372 25.5% 4+ bedrooms 4,082 4,188 21.1% 596 611 4.6% Total 19,301 19,803 100.0% 12,867 13,202 100.0%
Source: Housing Market Model
Summary
There are a range of factors which will influence demand for different sizes of homes, including 9.37
demographic changes; future growth in real earnings and households’ ability to save; economic
performance and housing affordability. Our analysis linked to long-term (23-year) demographic
change concludes that the following represents an appropriate mix of affordable and market home.
Most appropriate mix affordable and Market Homes Table 37:
1-bed 2-bed 3-bed 4+ bed
Market 10% 30% 40% 20%
Affordable 30-35% 30-35% 25-30% 5-10%
All dwellings 20% 30% 35% 15%
Source: GLH and JGC
Our strategic conclusions in the affordable sector recognise the role which delivery of larger family 9.38
homes can play in releasing supply of smaller properties for other households; together with the
limited flexibility which one-bed properties offer to changing household circumstances which feed
through into higher turnover and management issues.
The mix identified above should inform strategic Council area-wide policies. In applying these to 9.39
individual development sites regard should be had to the nature of the development site and
character of the area, and to up-to-date evidence of need as well as the existing mix and turnover of
properties at the local level.
Based on the evidence, we would expect the focus of new market housing provision to be on two 9.40
and three-bed properties. Continued demand for family housing can be expected from newly

Strategic Housing Market Assessment, June 2015
Final Report
GL Hearn Page 133 of 183
J:\Planning\Job Files\J032310 - Croydon SHMA\Reports\Croydon SHMA Final June 2015.docx
forming households. There may also be some demand for medium-sized properties (2 and 3 beds)
from older households downsizing and looking to release equity in existing homes, but still retain
flexibility for friends and family to come and stay.
The analysis of an appropriate mix of dwellings should also inform the ‘portfolio’ of sites which are 9.41
considered through the Local Plan process, including: Site Allocations, Neighbourhood Plans and
other planning documents. Equally it will be of relevance to affordable housing negotiations.
The Council should also consider whether it is appropriate to set out specific space standards for 9.42
new development, particularly to encourage provision of decent sized family housing (e.g. 3 bed
properties). It should also consider whether it is appropriate to limit the sub-division of existing
larger properties which can help to attract and retain family households in certain parts of the
Borough.
Strategic Housing Market Assessment, June 2015
Final Report
GL Hearn Page 134 of 183
J:\Planning\Job Files\J032310 - Croydon SHMA\Reports\Croydon SHMA Final June 2015.docx
10 HOUSING NEEDS OF PARTICULAR GROUPS
Introduction
We have established overall housing requirements for different sizes of properties over the next 23-10.1
years, however there can be specific groups within the population who require specialist housing
solutions or for whom housing needs may differ from the wider population. These groups are
considered within this section.
Estimates of household groups who have particular housing needs is a key output of the SHMA 10.2
Guidance whilst the National Planning Policy Framework identifies that local planning authorities
should plan for a mix of housing which takes account of the needs of different groups in the
community.
The following key groups have been identified which may have housing needs which differ from 10.3
those of the wider population:
• Older Persons;
• People with disabilities;
• Black and Minority Ethnic (BME) households;
• Households with children
• Young people
Housing Needs of Older People
The SHMA Guidance recognises the need to provide housing for older people as part of achieving 10.4
a good mix of housing. A key driver of change in the housing market over the next 23-years is
expected to be the growth in the population of older persons.
Indeed as population projections show, the number of older people is expected to increase 10.5
significantly over the next few years. In this section we draw on a range of sources including our
population projections, 2011 Census information and data from POPPI (Projecting Older People
Population Information).
The context to older persons housing provision can be summarised as below: 10.6
• A need to provide housing for older people as part of achieving a good mix of housing, but
recognizing that many older people are able to exercise choice and control over housing options
– e.g. owner occupiers with equity in their homes;
• Falling demand for residential care in some areas, and a rapidly rising average age of people
living in sheltered housing and requiring higher levels of support. Many local authorities have
struggled to contain expenditure on services for older people;
• New models of enhanced and extra care housing have emerged. These aim to meet the needs
of those who require high levels of care and support alongside those who are still generally able
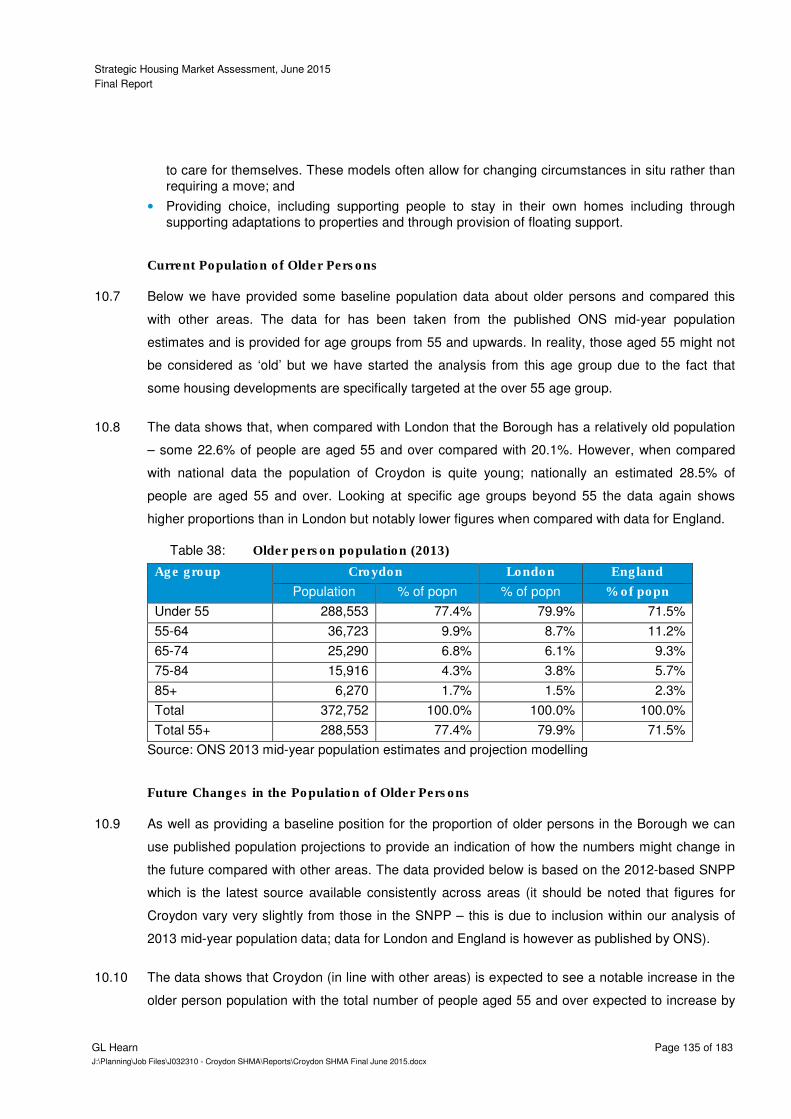
Strategic Housing Market Assessment, June 2015
Final Report
GL Hearn Page 135 of 183
J:\Planning\Job Files\J032310 - Croydon SHMA\Reports\Croydon SHMA Final June 2015.docx
to care for themselves. These models often allow for changing circumstances in situ rather than
requiring a move; and
• Providing choice, including supporting people to stay in their own homes including through
supporting adaptations to properties and through provision of floating support.
Current Population of Older Persons
Below we have provided some baseline population data about older persons and compared this 10.7
with other areas. The data for has been taken from the published ONS mid-year population
estimates and is provided for age groups from 55 and upwards. In reality, those aged 55 might not
be considered as ‘old’ but we have started the analysis from this age group due to the fact that
some housing developments are specifically targeted at the over 55 age group.
The data shows that, when compared with London that the Borough has a relatively old population 10.8
– some 22.6% of people are aged 55 and over compared with 20.1%. However, when compared
with national data the population of Croydon is quite young; nationally an estimated 28.5% of
people are aged 55 and over. Looking at specific age groups beyond 55 the data again shows
higher proportions than in London but notably lower figures when compared with data for England.
Older person population (2013) Table 38:
Age group Croydon London England
Population % of popn % of popn % of popn
Under 55 288,553 77.4% 79.9% 71.5%
55-64 36,723 9.9% 8.7% 11.2%
65-74 25,290 6.8% 6.1% 9.3%
75-84 15,916 4.3% 3.8% 5.7%
85+ 6,270 1.7% 1.5% 2.3%
Total 372,752 100.0% 100.0% 100.0%
Total 55+ 288,553 77.4% 79.9% 71.5%
Source: ONS 2013 mid-year population estimates and projection modelling
Future Changes in the Population of Older Persons
As well as providing a baseline position for the proportion of older persons in the Borough we can 10.9
use published population projections to provide an indication of how the numbers might change in
the future compared with other areas. The data provided below is based on the 2012-based SNPP
which is the latest source available consistently across areas (it should be noted that figures for
Croydon vary very slightly from those in the SNPP – this is due to inclusion within our analysis of
2013 mid-year population data; data for London and England is however as published by ONS).
The data shows that Croydon (in line with other areas) is expected to see a notable increase in the 10.10
older person population with the total number of people aged 55 and over expected to increase by
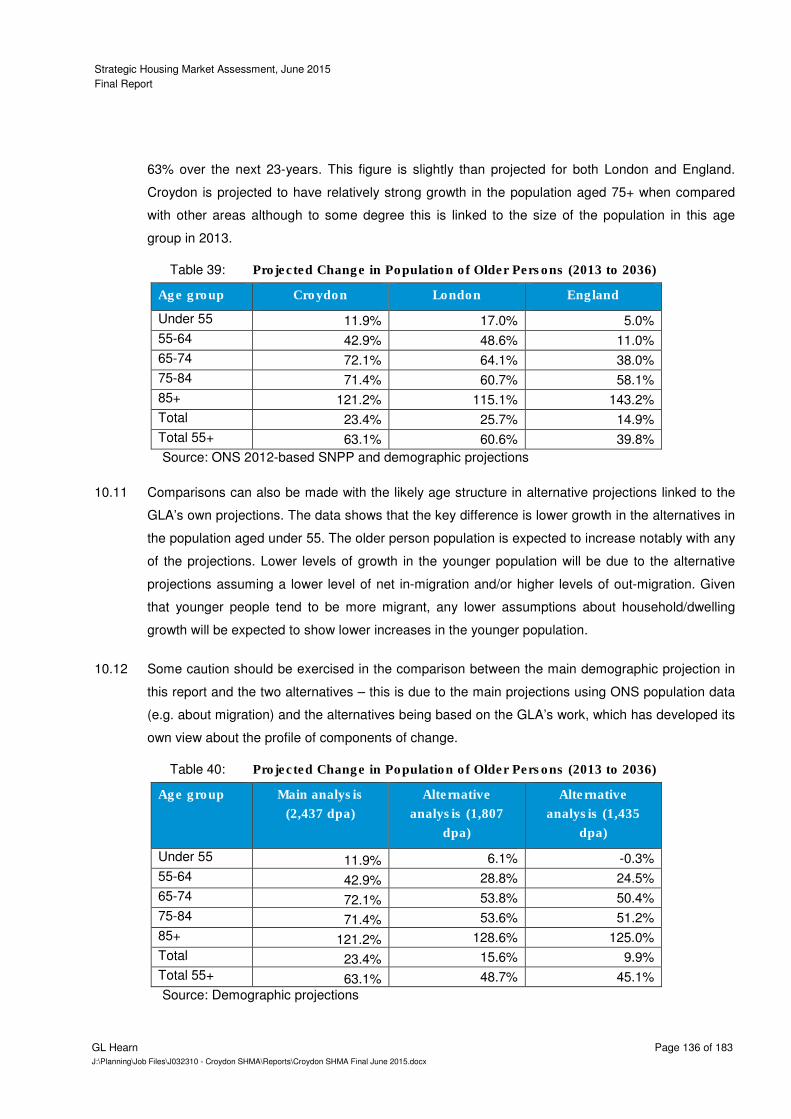
Strategic Housing Market Assessment, June 2015
Final Report
GL Hearn Page 136 of 183
J:\Planning\Job Files\J032310 - Croydon SHMA\Reports\Croydon SHMA Final June 2015.docx
63% over the next 23-years. This figure is slightly than projected for both London and England.
Croydon is projected to have relatively strong growth in the population aged 75+ when compared
with other areas although to some degree this is linked to the size of the population in this age
group in 2013.
Projected Change in Population of Older Persons (2013 to 2036) Table 39:
Age group Croydon London England
Under 55 11.9% 17.0% 5.0% 55-64 42.9% 48.6% 11.0% 65-74 72.1% 64.1% 38.0% 75-84 71.4% 60.7% 58.1% 85+ 121.2% 115.1% 143.2% Total 23.4% 25.7% 14.9% Total 55+ 63.1% 60.6% 39.8%
Source: ONS 2012-based SNPP and demographic projections
Comparisons can also be made with the likely age structure in alternative projections linked to the 10.11
GLA’s own projections. The data shows that the key difference is lower growth in the alternatives in
the population aged under 55. The older person population is expected to increase notably with any
of the projections. Lower levels of growth in the younger population will be due to the alternative
projections assuming a lower level of net in-migration and/or higher levels of out-migration. Given
that younger people tend to be more migrant, any lower assumptions about household/dwelling
growth will be expected to show lower increases in the younger population.
Some caution should be exercised in the comparison between the main demographic projection in 10.12
this report and the two alternatives – this is due to the main projections using ONS population data
(e.g. about migration) and the alternatives being based on the GLA’s work, which has developed its
own view about the profile of components of change.
Projected Change in Population of Older Persons (2013 to 2036) Table 40:
Age group Main analysis
(2,437 dpa)
Alternative
analysis (1,807
dpa)
Alternative
analysis (1,435
dpa)
Under 55 11.9% 6.1% -0.3%
55-64 42.9% 28.8% 24.5%
65-74 72.1% 53.8% 50.4%
75-84 71.4% 53.6% 51.2%
85+ 121.2% 128.6% 125.0%
Total 23.4% 15.6% 9.9%
Total 55+ 63.1% 48.7% 45.1%
Source: Demographic projections
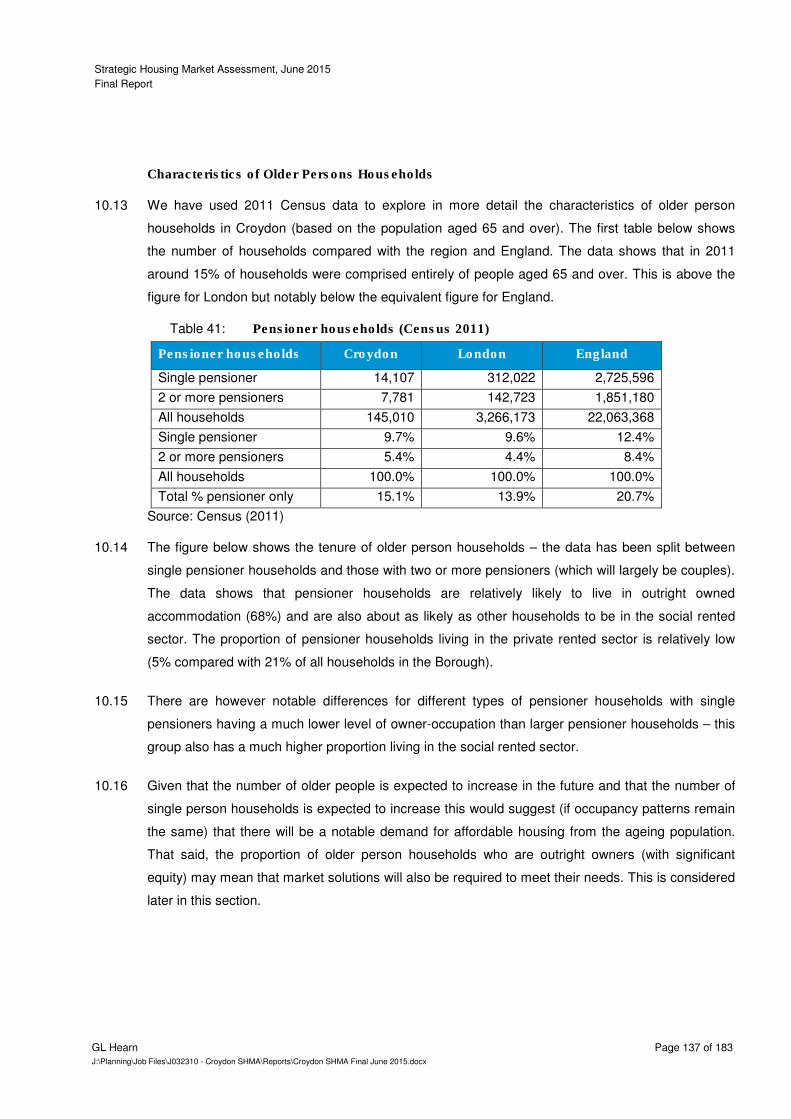
Strategic Housing Market Assessment, June 2015
Final Report
GL Hearn Page 137 of 183
J:\Planning\Job Files\J032310 - Croydon SHMA\Reports\Croydon SHMA Final June 2015.docx
Characteristics of Older Persons Households
We have used 2011 Census data to explore in more detail the characteristics of older person 10.13
households in Croydon (based on the population aged 65 and over). The first table below shows
the number of households compared with the region and England. The data shows that in 2011
around 15% of households were comprised entirely of people aged 65 and over. This is above the
figure for London but notably below the equivalent figure for England.
Pensioner households (Census 2011) Table 41:
Pensioner households Croydon London England
Single pensioner 14,107 312,022 2,725,596
2 or more pensioners 7,781 142,723 1,851,180
All households 145,010 3,266,173 22,063,368
Single pensioner 9.7% 9.6% 12.4%
2 or more pensioners 5.4% 4.4% 8.4%
All households 100.0% 100.0% 100.0%
Total % pensioner only 15.1% 13.9% 20.7%
Source: Census (2011)
The figure below shows the tenure of older person households – the data has been split between 10.14
single pensioner households and those with two or more pensioners (which will largely be couples).
The data shows that pensioner households are relatively likely to live in outright owned
accommodation (68%) and are also about as likely as other households to be in the social rented
sector. The proportion of pensioner households living in the private rented sector is relatively low
(5% compared with 21% of all households in the Borough).
There are however notable differences for different types of pensioner households with single 10.15
pensioners having a much lower level of owner-occupation than larger pensioner households – this
group also has a much higher proportion living in the social rented sector.
Given that the number of older people is expected to increase in the future and that the number of 10.16
single person households is expected to increase this would suggest (if occupancy patterns remain
the same) that there will be a notable demand for affordable housing from the ageing population.
That said, the proportion of older person households who are outright owners (with significant
equity) may mean that market solutions will also be required to meet their needs. This is considered
later in this section.
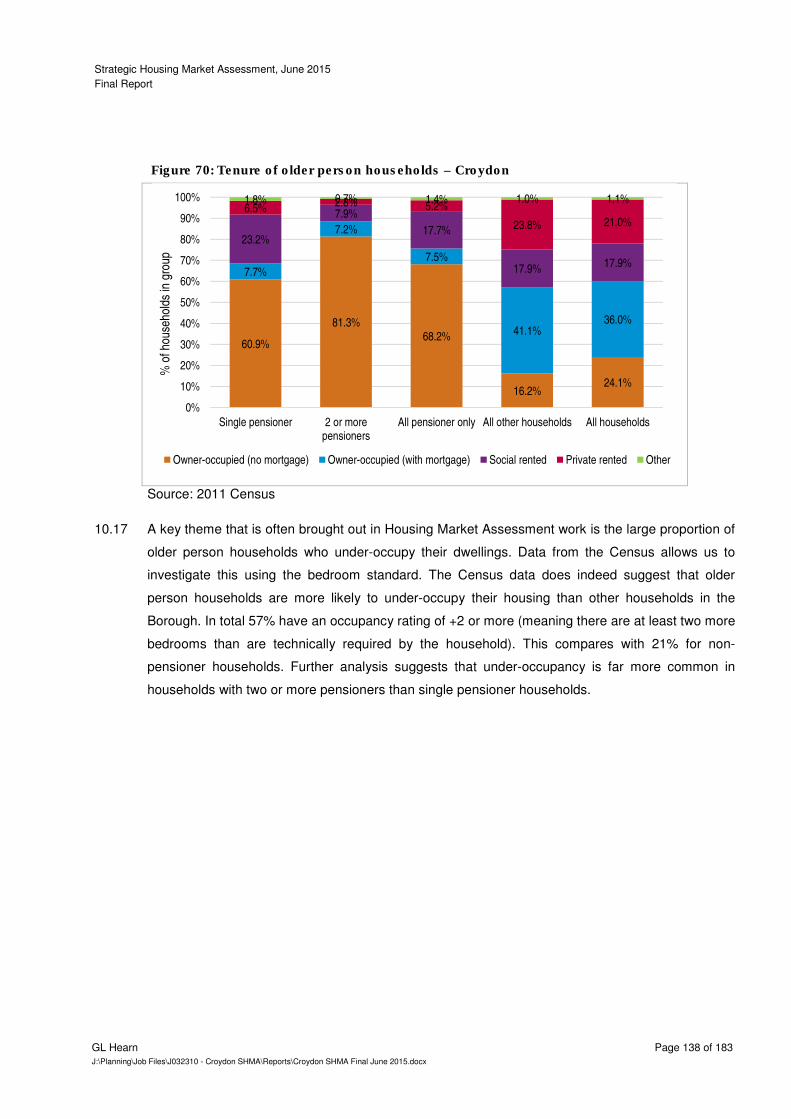
Strategic Housing Market Assessment, June 2015
Final Report
GL Hearn Page 138 of 183
J:\Planning\Job Files\J032310 - Croydon SHMA\Reports\Croydon SHMA Final June 2015.docx
Tenure of older person households – Croydon Figure 70:
Source: 2011 Census
A key theme that is often brought out in Housing Market Assessment work is the large proportion of 10.17
older person households who under-occupy their dwellings. Data from the Census allows us to
investigate this using the bedroom standard. The Census data does indeed suggest that older
person households are more likely to under-occupy their housing than other households in the
Borough. In total 57% have an occupancy rating of +2 or more (meaning there are at least two more
bedrooms than are technically required by the household). This compares with 21% for non-
pensioner households. Further analysis suggests that under-occupancy is far more common in
households with two or more pensioners than single pensioner households.
60.9%
81.3%68.2%
16.2%24.1%
7.7%
7.2%
7.5%
41.1%36.0%
23.2%
7.9%
17.7%
17.9%17.9%
6.5%2.8% 5.2%
23.8% 21.0%
1.8% 0.7% 1.4% 1.0% 1.1%
0%
10%
20%
30%
40%
50%
60%
70%
80%
90%
100%
Single pensioner 2 or morepensioners
All pensioner only All other households All households
% o
f hou
seho
lds
in g
roup
Owner-occupied (no mortgage) Owner-occupied (with mortgage) Social rented Private rented Other

Strategic Housing Market Assessment, June 2015
Final Report
GL Hearn Page 139 of 183
J:\Planning\Job Files\J032310 - Croydon SHMA\Reports\Croydon SHMA Final June 2015.docx
Occupancy rating of older person households – Croydon Figure 71:
Source: 2011 Census
It is of interest to study the above information by tenure. The table below shows the number of 10.18
pensioner households who had an occupancy rating of +2 or more in each of three broad tenure
groups in 2011. Whilst the majority of older person households with an occupancy rating of +2 or
more were in the owner-occupied sector, there were nearly 700 properties in the social rented
sector occupied by pensioner only households with an occupancy rating of +2 or more. This may
therefore present some opportunity to reduce under-occupation although to achieve this it may be
necessary to provide housing in areas where households currently live and where they have social
and community ties.
Pensioner households with occupancy rating of +2 or more by tenure Table 42:
Tenure Single pensioner 2 or more
pensioners
All pensioner only
households
Owner-occupied 5,783 5,354 11,137
Social rented 470 197 667
Private rented 264 100 364
All tenures 6,517 5,651 12,168
Source: 2011 Census
It should however be recognised that many older households in the private sector will have built up 10.19
equity in their existing homes. In the private sector many older households may be able to afford a
larger home than they need (and thus under-occupy housing). Some may look to downsize to
release equity from homes to support their retirement (or may move away from the area); however
we would expect many older households to want to retain family housing with space to allow friends
46.2%
76.4%
56.6%
21.0% 26.3%
27.5%
18.7%
24.5%
29.9%29.1%
26.3%
4.9%
18.9%
37.8%35.0%
0.0% 0.0% 0.0%11.3% 9.6%
0%
10%
20%
30%
40%
50%
60%
70%
80%
90%
100%
Single pensioner 2 or morepensioners
All pensioner only All other households All households
% o
f hou
seho
lds
in g
roup
+2 or more +1 0 -1 or less
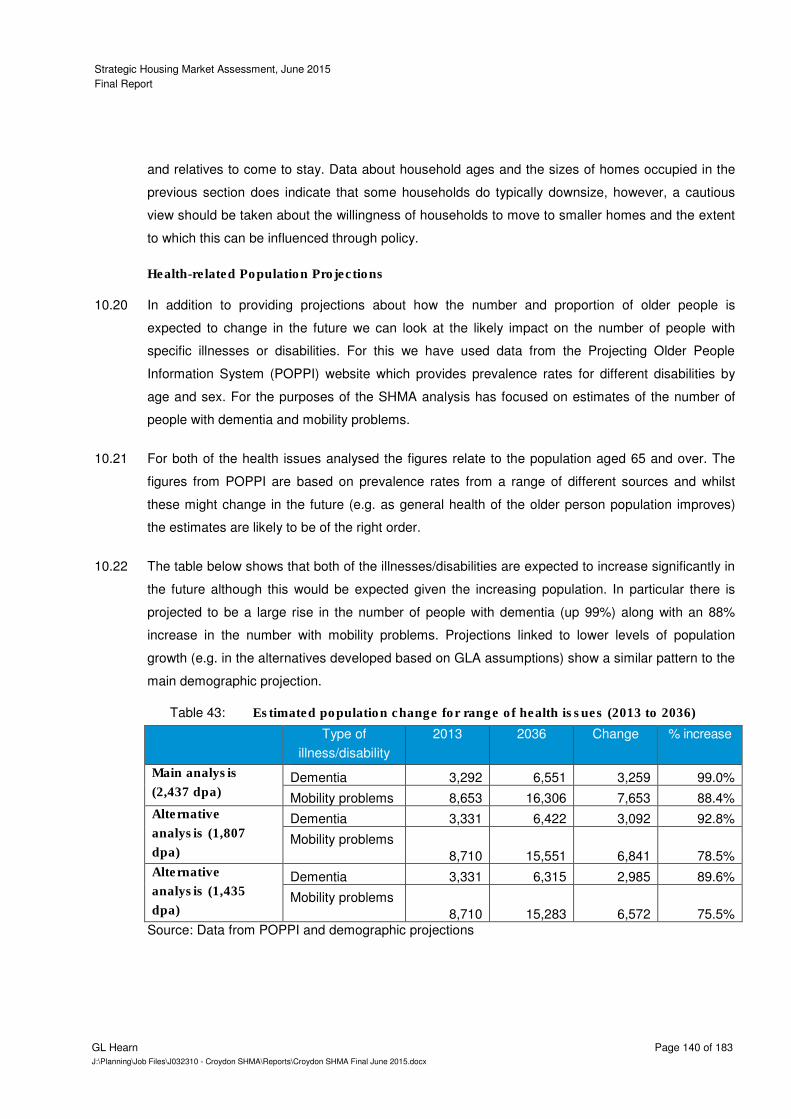
Strategic Housing Market Assessment, June 2015
Final Report
GL Hearn Page 140 of 183
J:\Planning\Job Files\J032310 - Croydon SHMA\Reports\Croydon SHMA Final June 2015.docx
and relatives to come to stay. Data about household ages and the sizes of homes occupied in the
previous section does indicate that some households do typically downsize, however, a cautious
view should be taken about the willingness of households to move to smaller homes and the extent
to which this can be influenced through policy.
Health-related Population Projections
In addition to providing projections about how the number and proportion of older people is 10.20
expected to change in the future we can look at the likely impact on the number of people with
specific illnesses or disabilities. For this we have used data from the Projecting Older People
Information System (POPPI) website which provides prevalence rates for different disabilities by
age and sex. For the purposes of the SHMA analysis has focused on estimates of the number of
people with dementia and mobility problems.
For both of the health issues analysed the figures relate to the population aged 65 and over. The 10.21
figures from POPPI are based on prevalence rates from a range of different sources and whilst
these might change in the future (e.g. as general health of the older person population improves)
the estimates are likely to be of the right order.
The table below shows that both of the illnesses/disabilities are expected to increase significantly in 10.22
the future although this would be expected given the increasing population. In particular there is
projected to be a large rise in the number of people with dementia (up 99%) along with an 88%
increase in the number with mobility problems. Projections linked to lower levels of population
growth (e.g. in the alternatives developed based on GLA assumptions) show a similar pattern to the
main demographic projection.
Estimated population change for range of health issues (2013 to 2036) Table 43:
Type of
illness/disability
2013 2036 Change % increase
Main analysis
(2,437 dpa) Dementia 3,292 6,551 3,259 99.0%
Mobility problems 8,653 16,306 7,653 88.4% Alternative
analysis (1,807
dpa)
Dementia 3,331 6,422 3,092 92.8%
Mobility problems
8,710 15,551 6,841 78.5% Alternative
analysis (1,435
dpa)
Dementia 3,331 6,315 2,985 89.6%
Mobility problems
8,710 15,283 6,572 75.5% Source: Data from POPPI and demographic projections
Strategic Housing Market Assessment, June 2015
Final Report
GL Hearn Page 141 of 183
J:\Planning\Job Files\J032310 - Croydon SHMA\Reports\Croydon SHMA Final June 2015.docx
Indicative Requirements for Specialist Housing
Given the ageing population and higher levels of disability and health problems amongst older 10.23
people there is likely to be an increased requirement for specialist housing options moving forward.
Such housing can broadly be split into three categories; sheltered, extra-care and residential care.
Over the past few years there has generally been a move away from providing sheltered and
residential care housing towards extra-care housing (ECH). We would consider moving forward that
the majority of additional specialist housing is likely to be of ECH. In Croydon, data from the
Housing Learning and Improvement Network (Housing LIN) website indicates that there is currently
a significant supply of sheltered housing (particularly in the affordable sector) and also of
Registered Care (Residential and Nursing Homes).
Hence the analysis that follows is designed to estimate requirements for ECH in the period from 10.24
2013 to 2036. It inherently assumes that there is no requirement for increases in the stock of other
types of specialist housing. The methodology employed uses prevalence rates to estimate the
number of people requiring ECH. In addition, assumptions have been made about the proportion of
this that should be in each of the social/affordable and market sectors (including shared ownership).
This recognises that a large proportion of older persons are owner-occupiers who will be able to
access specialist market housing given the levels of equity built up in their existing homes. The key
assumptions are:
• 125 people per 1,000 population aged 75 and over will require ECH; and
• A tenure split of 30% social/affordable housing and 70% market (including shared ownership)
depending on location.
This methodology is broadly consistent with that utilised in other areas and also in line with that 10.25
used on the Housing LIN website (which is specifically set up to study older persons housing
needs). The tenure split chosen is consistent with the split between owner-occupied and rented
housing when studying pensioner only households.
Additionally, a vacancy allowance has been added to the derived household figures to make a 10.26
dwelling estimate (this figure being consistent with that used in the main projections). Whilst we
would consider the assumptions above to be sound, the outputs should be treated as indicative - in
the longer-term changes to the age structure with more people in ‘older’ age groups (e.g. 85+, 90+)
could see requirements increase.
The table below shows estimated levels of need for ECH by applying the above assumptions. In 10.27
addition we have taken a supply estimate from the Housing LIN website (which looks to be entirely
in the affordable sector). The data is shown for the whole 23-year period from 2013 to 2036. The
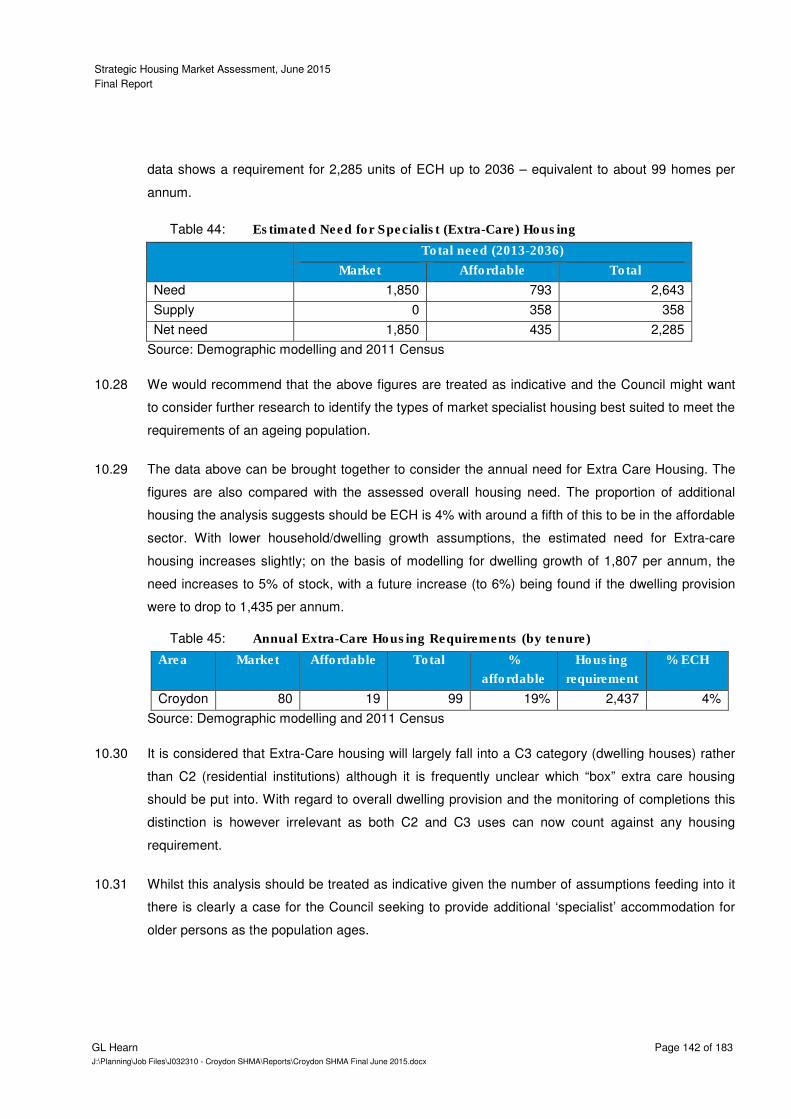
Strategic Housing Market Assessment, June 2015
Final Report
GL Hearn Page 142 of 183
J:\Planning\Job Files\J032310 - Croydon SHMA\Reports\Croydon SHMA Final June 2015.docx
data shows a requirement for 2,285 units of ECH up to 2036 – equivalent to about 99 homes per
annum.
Estimated Need for Specialist (Extra-Care) Housing Table 44:
Total need (2013-2036)
Market Affordable Total
Need 1,850 793 2,643
Supply 0 358 358
Net need 1,850 435 2,285
Source: Demographic modelling and 2011 Census
We would recommend that the above figures are treated as indicative and the Council might want 10.28
to consider further research to identify the types of market specialist housing best suited to meet the
requirements of an ageing population.
The data above can be brought together to consider the annual need for Extra Care Housing. The 10.29
figures are also compared with the assessed overall housing need. The proportion of additional
housing the analysis suggests should be ECH is 4% with around a fifth of this to be in the affordable
sector. With lower household/dwelling growth assumptions, the estimated need for Extra-care
housing increases slightly; on the basis of modelling for dwelling growth of 1,807 per annum, the
need increases to 5% of stock, with a future increase (to 6%) being found if the dwelling provision
were to drop to 1,435 per annum.
Annual Extra-Care Housing Requirements (by tenure) Table 45:
Area Market Affordable Total %
affordable
Housing
requirement
% ECH
Croydon 80 19 99 19% 2,437 4%
Source: Demographic modelling and 2011 Census
It is considered that Extra-Care housing will largely fall into a C3 category (dwelling houses) rather 10.30
than C2 (residential institutions) although it is frequently unclear which “box” extra care housing
should be put into. With regard to overall dwelling provision and the monitoring of completions this
distinction is however irrelevant as both C2 and C3 uses can now count against any housing
requirement.
Whilst this analysis should be treated as indicative given the number of assumptions feeding into it 10.31
there is clearly a case for the Council seeking to provide additional ‘specialist’ accommodation for
older persons as the population ages.
Strategic Housing Market Assessment, June 2015
Final Report
GL Hearn Page 143 of 183
J:\Planning\Job Files\J032310 - Croydon SHMA\Reports\Croydon SHMA Final June 2015.docx
Older person households - conclusions
The older person population of Croydon is fairly small when compared with national figures but is 10.32
projected to increase significantly up until 2036.
Older persons are more likely to under-occupy homes. In the affordable sector, there may be 10.33
potential to reduce (or seek to limit potential growth in) under-occupation and the Council may wish
to consider providing support and incentives to social housing occupiers to downsize. This will help
to release larger affordable homes for younger households. An analysis of older person households
suggest that they are more likely to live in social rented housing (especially single pensioner
households). With the projected increases in older persons there may therefore be additional
pressure on the affordable housing stock from such households.
Our analysis also suggests that the growing older population (particularly in the oldest age groups) 10.34
will result in growth in households with specialist housing needs. Typically the greatest support
needs are for alterations to properties (such as to bathrooms, showers and toilets, provision of
emergency alarms or help maintaining homes). Many of these can be resolved in situ through
adaptations to existing properties and the resource implications of this will need to be planned for.
The growing older population will however likely lead to some increase in requirements for 10.35
specialist housing solutions. The analysis above suggests a 99% growth in older population with
dementia, and an 88% increase in the older population with mobility problems. From a planning
point of view, some of these people will require specialist housing such as extra care provision.
Increasing numbers of older people with health problems will also require joint-working between
housing and health (Council and NHS). Analysis of future demographic change suggests a
requirement for around 4% of additional housing units to be Extra-Care accommodation to meet the
needs of the older person population.
People with disabilities
This section concentrates on the housing situation of people/households that contain someone with 10.36
some form of disability. We have again drawn on Census data although it should be recognised that
an analysis of people with disabilities is very strongly linked with the above analysis about older
people.
The table below shows the proportion of people with a long-term health problem or disability 10.37
(LTHPD) and the proportion of households where at least one person has a LTHPD. The data
suggests that across Croydon some 22.8% of households contain someone with a LTHPD. This
figure is lower than the equivalent figure England and in-line with the London average. The figures
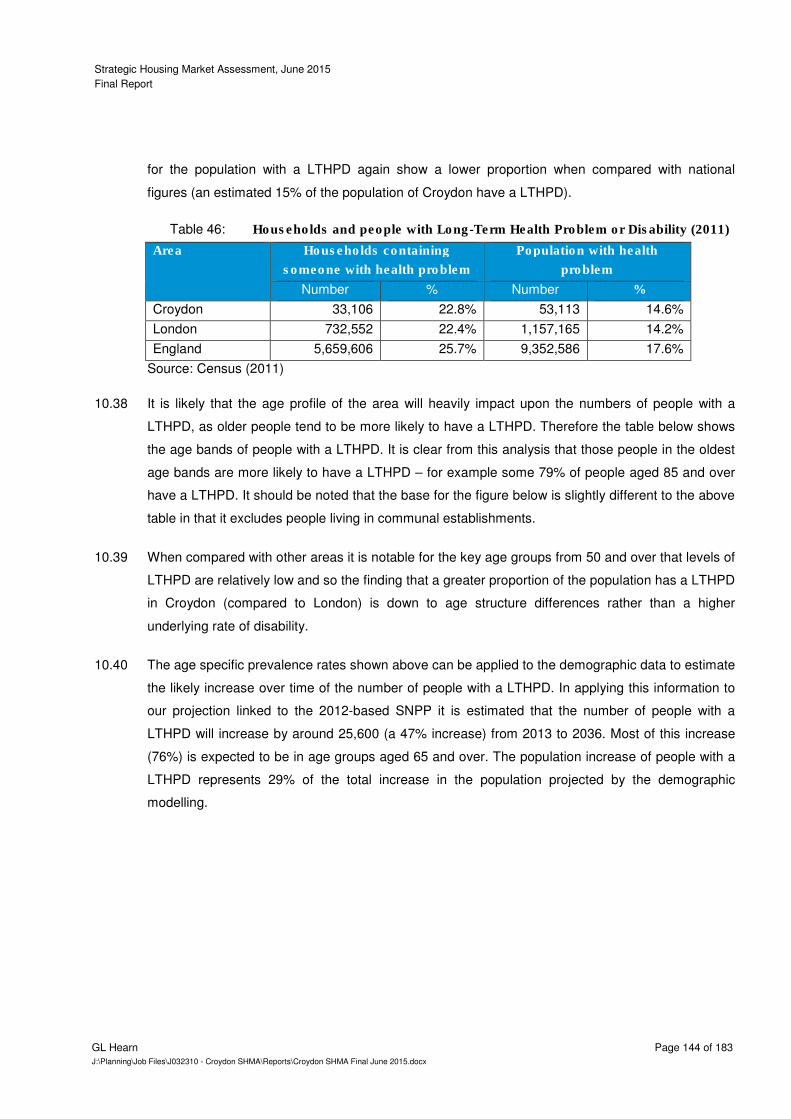
Strategic Housing Market Assessment, June 2015
Final Report
GL Hearn Page 144 of 183
J:\Planning\Job Files\J032310 - Croydon SHMA\Reports\Croydon SHMA Final June 2015.docx
for the population with a LTHPD again show a lower proportion when compared with national
figures (an estimated 15% of the population of Croydon have a LTHPD).
Households and people with Long-Term Health Problem or Disability (2011) Table 46:
Area Households containing
someone with health problem
Population with health
problem
Number % Number %
Croydon 33,106 22.8% 53,113 14.6%
London 732,552 22.4% 1,157,165 14.2%
England 5,659,606 25.7% 9,352,586 17.6%
Source: Census (2011)
It is likely that the age profile of the area will heavily impact upon the numbers of people with a 10.38
LTHPD, as older people tend to be more likely to have a LTHPD. Therefore the table below shows
the age bands of people with a LTHPD. It is clear from this analysis that those people in the oldest
age bands are more likely to have a LTHPD – for example some 79% of people aged 85 and over
have a LTHPD. It should be noted that the base for the figure below is slightly different to the above
table in that it excludes people living in communal establishments.
When compared with other areas it is notable for the key age groups from 50 and over that levels of 10.39
LTHPD are relatively low and so the finding that a greater proportion of the population has a LTHPD
in Croydon (compared to London) is down to age structure differences rather than a higher
underlying rate of disability.
The age specific prevalence rates shown above can be applied to the demographic data to estimate 10.40
the likely increase over time of the number of people with a LTHPD. In applying this information to
our projection linked to the 2012-based SNPP it is estimated that the number of people with a
LTHPD will increase by around 25,600 (a 47% increase) from 2013 to 2036. Most of this increase
(76%) is expected to be in age groups aged 65 and over. The population increase of people with a
LTHPD represents 29% of the total increase in the population projected by the demographic
modelling.

Strategic Housing Market Assessment, June 2015
Final Report
GL Hearn Page 145 of 183
J:\Planning\Job Files\J032310 - Croydon SHMA\Reports\Croydon SHMA Final June 2015.docx
Population with LTHPD in each Age Band Figure 72:
Source: Census (2011)
Modelling the same data on the basis of lower levels of household/housing growth (i.e. linked to the 10.41
GLA’s projections) shows a smaller increase in the number of people with disabilities; but a higher
increase as a proportion of all population growth. With provision of 1,807 dwellings per annum, the
number of people with a disability is projected to increase by 38%, representing 35% of all
population growth; with provision of 1,435 dwellings per annum, the number of people with a
disability is projected to increase by 33%, representing 48% of all population growth.
The Councils Integrated Commissioning and Housing team have also identified key priorities of 10.42
delivery for specialist accommodation, these are:
• Extra care sheltered housing for older people:
– In the region of 40 units with communal facilities and staff office to extra care standards
• Extra care sheltered housing scheme for older people with mental health problems who
are stepping down from residential care services with the following features:
- 20 to 25 units comprising a mix of studio and 1 bedroom flats - En suite single rooms - Communal lounge, kitchen, laundry - Reception/ staff office, counselling room, sleepover room, staff shower/ wc
17.2%
83.0%
60.9%
38.7%
23.1%
11.7%
6.3%
5.2%
3.7%
13.8%
81.2%
60.3%
39.6%
23.8%
11.4%
4.8%
4.6%
3.4%
14.1%
79.3%
58.3%
36.5%
20.4%
11.3%
5.8%
5.1%
3.9%
0% 10% 20% 30% 40% 50% 60% 70% 80% 90%
All ages
Age 85 and over
Age 75 to 84
Age 65 to 74
Age 50 to 64
Age 35 to 49
Age 25 to 34
Age 16 to 24
Age 0 to 15
LTHPD
Croydon
London
England

Strategic Housing Market Assessment, June 2015
Final Report
GL Hearn Page 146 of 183
J:\Planning\Job Files\J032310 - Croydon SHMA\Reports\Croydon SHMA Final June 2015.docx
• People with learning disabilities and people with physical disabilities:
- Small cluster schemes of 6-10 self-contained 1 and 2 bedroom flats including ground floor flats to full wheelchair standards
- Welcoming of proposals to redevelop existing shared group homes for these client groups
• Re-provide the 24 hour mental health service at Glazier and Croham Road with a new purpose built hostel with the following features:
- 16 units - En suite single rooms - Communal lounge, kitchen, laundry - Reception/ staff office, counselling room, sleepover room, staff shower/ wc - Exterior smoking area
• Mental health move on flats:
– self-contained studio and 1 bedroom flats
In addition the Housing Report for Informal Cabinet recommended the following: 10.43
• An increase the number of homes suitable for people with disabilities with 10% of new homes meeting full wheelchair-accessible standards.
• Enabling people who develop disabilities to remain in their homes by adapting 190 private sector homes a year through disabled facilities grants and 120 council homes through direct investment, thereby meeting all newly-arising need
• In partnership with eligible landlords, we will submit a proposal for extra care housing provision for older people under phase 2 of the Mayor of London’s specialist housing fund, with the aim of reducing the reliance on residential care homes and thereby offering greater Independence.
• Consulting tenants on proposals for converting existing special sheltered provision into extra care housing which will better cater to them as they grow older.
• Review of existing retirement housing stock and identify options for refurbishment or replacement within our housing development and estate refurbishment programmes.
• Work with partners to develop a new model for retirement housing, creating a modern, mixed-tenure “village” for older people which is fully integrated with the local community
• Continue to improve on and add to our supported housing stock by submitting bids for anticipated GLA funding with proposals including schemes for people with mental health problems, people with both learning and physical disabilities, and young people.
People with disabilities – conclusions
Currently 23% of households contain someone with a long-term health problem or disability. 10.44
Demographic trends are expected to lead to a significant growth in the population and number of
households with disabilities over the period to 2036. Housing support services, including provision
of adaptations to properties, will need to be adequately resources to take account of this.
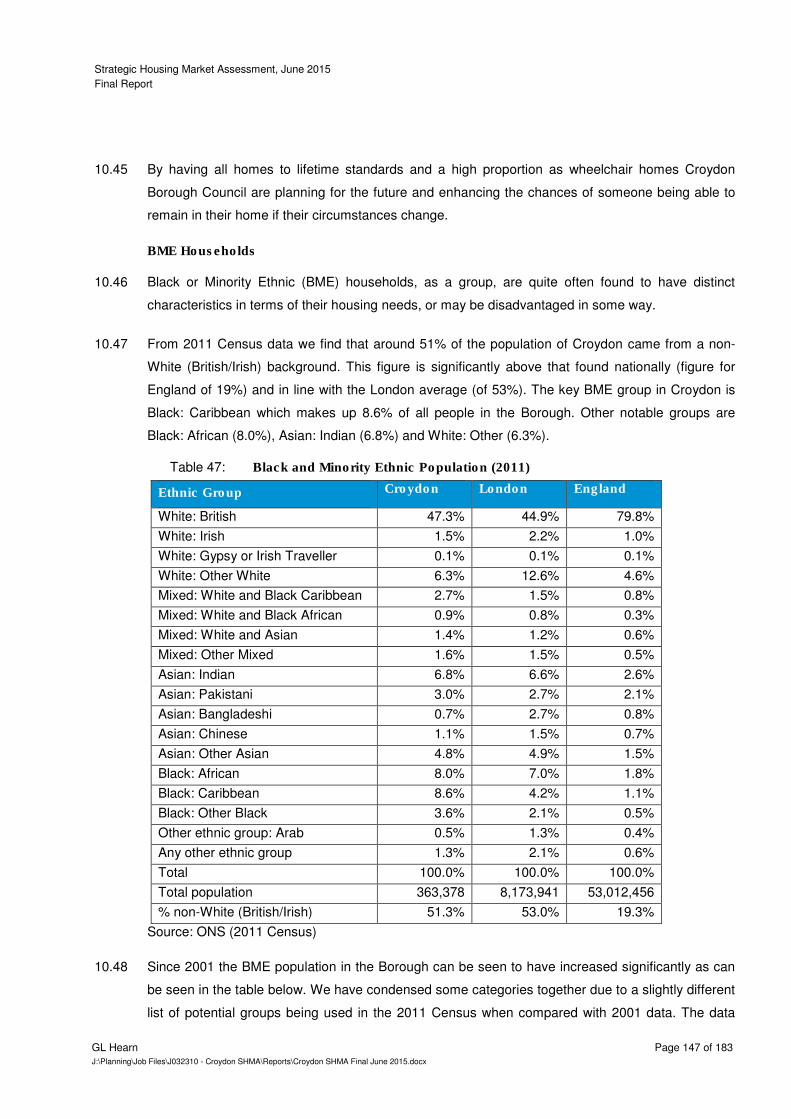
Strategic Housing Market Assessment, June 2015
Final Report
GL Hearn Page 147 of 183
J:\Planning\Job Files\J032310 - Croydon SHMA\Reports\Croydon SHMA Final June 2015.docx
By having all homes to lifetime standards and a high proportion as wheelchair homes Croydon 10.45
Borough Council are planning for the future and enhancing the chances of someone being able to
remain in their home if their circumstances change.
BME Households
Black or Minority Ethnic (BME) households, as a group, are quite often found to have distinct 10.46
characteristics in terms of their housing needs, or may be disadvantaged in some way.
From 2011 Census data we find that around 51% of the population of Croydon came from a non-10.47
White (British/Irish) background. This figure is significantly above that found nationally (figure for
England of 19%) and in line with the London average (of 53%). The key BME group in Croydon is
Black: Caribbean which makes up 8.6% of all people in the Borough. Other notable groups are
Black: African (8.0%), Asian: Indian (6.8%) and White: Other (6.3%).
Black and Minority Ethnic Population (2011) Table 47:
Ethnic Group Croydon London England
White: British 47.3% 44.9% 79.8%
White: Irish 1.5% 2.2% 1.0%
White: Gypsy or Irish Traveller 0.1% 0.1% 0.1%
White: Other White 6.3% 12.6% 4.6%
Mixed: White and Black Caribbean 2.7% 1.5% 0.8%
Mixed: White and Black African 0.9% 0.8% 0.3%
Mixed: White and Asian 1.4% 1.2% 0.6%
Mixed: Other Mixed 1.6% 1.5% 0.5%
Asian: Indian 6.8% 6.6% 2.6%
Asian: Pakistani 3.0% 2.7% 2.1%
Asian: Bangladeshi 0.7% 2.7% 0.8%
Asian: Chinese 1.1% 1.5% 0.7%
Asian: Other Asian 4.8% 4.9% 1.5%
Black: African 8.0% 7.0% 1.8%
Black: Caribbean 8.6% 4.2% 1.1%
Black: Other Black 3.6% 2.1% 0.5%
Other ethnic group: Arab 0.5% 1.3% 0.4%
Any other ethnic group 1.3% 2.1% 0.6%
Total 100.0% 100.0% 100.0%
Total population 363,378 8,173,941 53,012,456
% non-White (British/Irish) 51.3% 53.0% 19.3%
Source: ONS (2011 Census)
Since 2001 the BME population in the Borough can be seen to have increased significantly as can 10.48
be seen in the table below. We have condensed some categories together due to a slightly different
list of potential groups being used in the 2011 Census when compared with 2001 data. The data
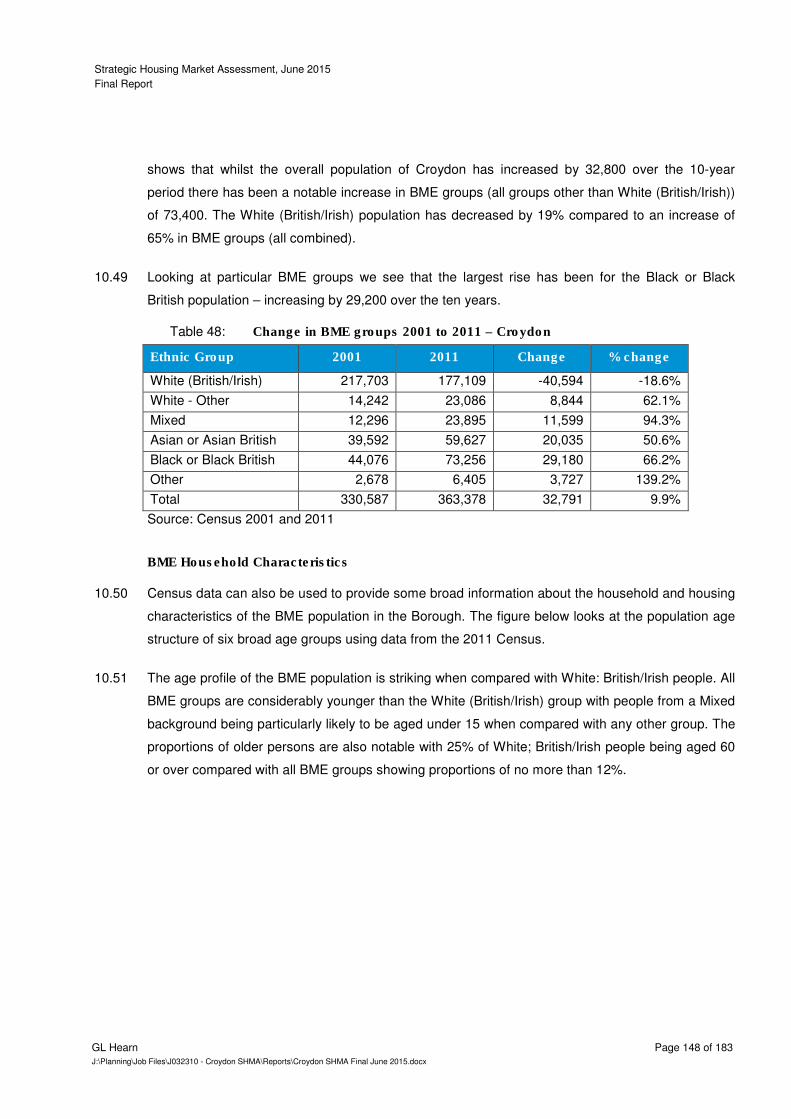
Strategic Housing Market Assessment, June 2015
Final Report
GL Hearn Page 148 of 183
J:\Planning\Job Files\J032310 - Croydon SHMA\Reports\Croydon SHMA Final June 2015.docx
shows that whilst the overall population of Croydon has increased by 32,800 over the 10-year
period there has been a notable increase in BME groups (all groups other than White (British/Irish))
of 73,400. The White (British/Irish) population has decreased by 19% compared to an increase of
65% in BME groups (all combined).
Looking at particular BME groups we see that the largest rise has been for the Black or Black 10.49
British population – increasing by 29,200 over the ten years.
Change in BME groups 2001 to 2011 – Croydon Table 48:
Ethnic Group 2001 2011 Change % change
White (British/Irish) 217,703 177,109 -40,594 -18.6%
White - Other 14,242 23,086 8,844 62.1%
Mixed 12,296 23,895 11,599 94.3%
Asian or Asian British 39,592 59,627 20,035 50.6%
Black or Black British 44,076 73,256 29,180 66.2%
Other 2,678 6,405 3,727 139.2%
Total 330,587 363,378 32,791 9.9%
Source: Census 2001 and 2011
BME Household Characteristics
Census data can also be used to provide some broad information about the household and housing 10.50
characteristics of the BME population in the Borough. The figure below looks at the population age
structure of six broad age groups using data from the 2011 Census.
The age profile of the BME population is striking when compared with White: British/Irish people. All 10.51
BME groups are considerably younger than the White (British/Irish) group with people from a Mixed
background being particularly likely to be aged under 15 when compared with any other group. The
proportions of older persons are also notable with 25% of White; British/Irish people being aged 60
or over compared with all BME groups showing proportions of no more than 12%.
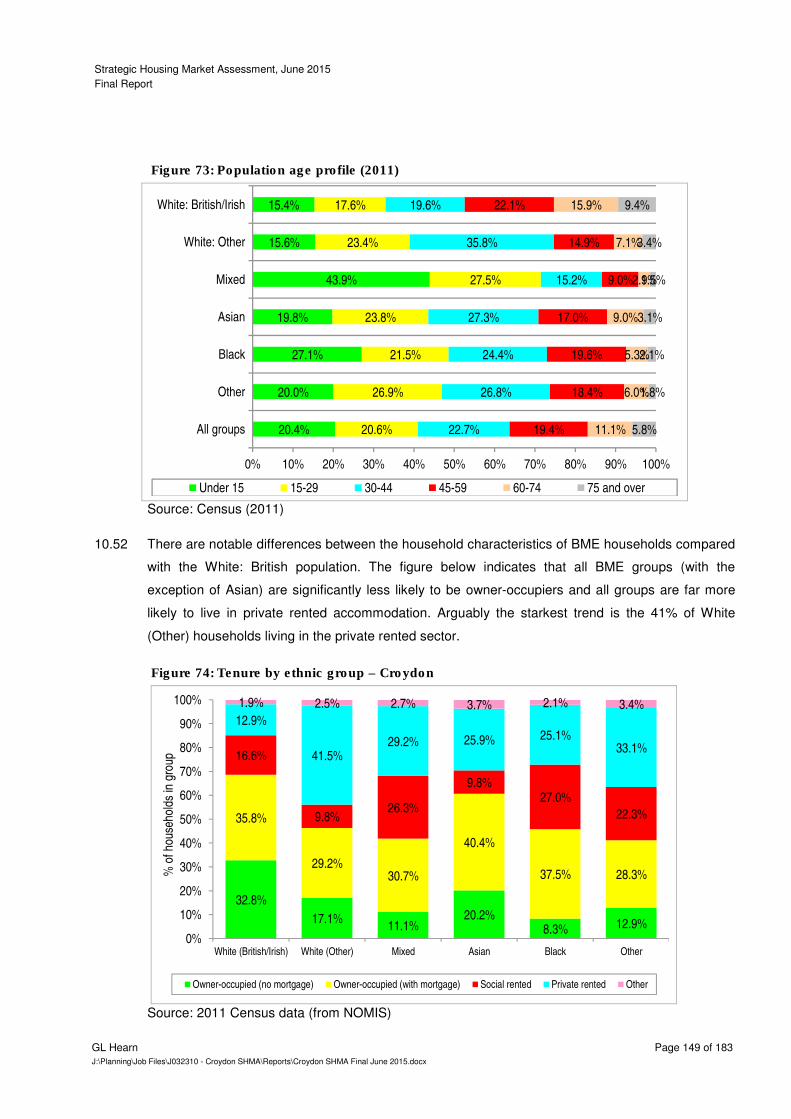
Strategic Housing Market Assessment, June 2015
Final Report
GL Hearn Page 149 of 183
J:\Planning\Job Files\J032310 - Croydon SHMA\Reports\Croydon SHMA Final June 2015.docx
Population age profile (2011) Figure 73:
Source: Census (2011)
There are notable differences between the household characteristics of BME households compared 10.52
with the White: British population. The figure below indicates that all BME groups (with the
exception of Asian) are significantly less likely to be owner-occupiers and all groups are far more
likely to live in private rented accommodation. Arguably the starkest trend is the 41% of White
(Other) households living in the private rented sector.
Tenure by ethnic group – Croydon Figure 74:
Source: 2011 Census data (from NOMIS)
20.4%
20.0%
27.1%
19.8%
43.9%
15.6%
15.4%
20.6%
26.9%
21.5%
23.8%
27.5%
23.4%
17.6%
22.7%
26.8%
24.4%
27.3%
15.2%
35.8%
19.6%
19.4%
18.4%
19.6%
17.0%
9.0%
14.9%
22.1%
11.1%
6.0%
5.3%
9.0%
2.9%
7.1%
15.9%
5.8%
1.8%
2.1%
3.1%
1.5%
3.4%
9.4%
0% 10% 20% 30% 40% 50% 60% 70% 80% 90% 100%
All groups
Other
Black
Asian
Mixed
White: Other
White: British/Irish
Under 15 15-29 30-44 45-59 60-74 75 and over
32.8%
17.1%11.1%
20.2%8.3% 12.9%
35.8%
29.2%30.7%
40.4%
37.5% 28.3%
16.6%
9.8%26.3%
9.8%27.0%
22.3%
12.9%
41.5%29.2% 25.9% 25.1%
33.1%
1.9% 2.5% 2.7% 3.7% 2.1% 3.4%
0%
10%
20%
30%
40%
50%
60%
70%
80%
90%
100%
White (British/Irish) White (Other) Mixed Asian Black Other
% o
f hou
seho
lds
in g
roup
Owner-occupied (no mortgage) Owner-occupied (with mortgage) Social rented Private rented Other
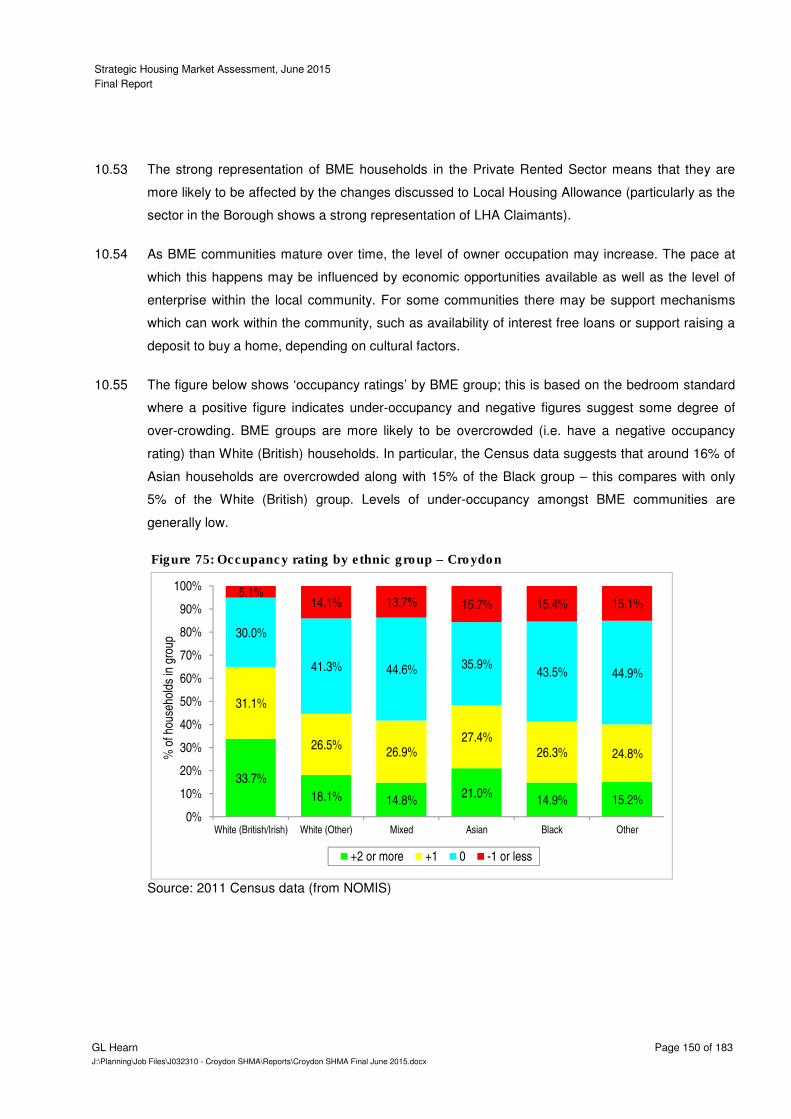
Strategic Housing Market Assessment, June 2015
Final Report
GL Hearn Page 150 of 183
J:\Planning\Job Files\J032310 - Croydon SHMA\Reports\Croydon SHMA Final June 2015.docx
The strong representation of BME households in the Private Rented Sector means that they are 10.53
more likely to be affected by the changes discussed to Local Housing Allowance (particularly as the
sector in the Borough shows a strong representation of LHA Claimants).
As BME communities mature over time, the level of owner occupation may increase. The pace at 10.54
which this happens may be influenced by economic opportunities available as well as the level of
enterprise within the local community. For some communities there may be support mechanisms
which can work within the community, such as availability of interest free loans or support raising a
deposit to buy a home, depending on cultural factors.
The figure below shows ‘occupancy ratings’ by BME group; this is based on the bedroom standard 10.55
where a positive figure indicates under-occupancy and negative figures suggest some degree of
over-crowding. BME groups are more likely to be overcrowded (i.e. have a negative occupancy
rating) than White (British) households. In particular, the Census data suggests that around 16% of
Asian households are overcrowded along with 15% of the Black group – this compares with only
5% of the White (British) group. Levels of under-occupancy amongst BME communities are
generally low.
Occupancy rating by ethnic group – Croydon Figure 75:
Source: 2011 Census data (from NOMIS)
33.7%
18.1% 14.8%21.0%
14.9% 15.2%
31.1%
26.5%26.9%
27.4%26.3% 24.8%
30.0%
41.3% 44.6% 35.9%43.5% 44.9%
5.1%14.1% 13.7% 15.7% 15.4% 15.1%
0%
10%
20%
30%
40%
50%
60%
70%
80%
90%
100%
White (British/Irish) White (Other) Mixed Asian Black Other
% o
f hou
seho
lds
in g
roup
+2 or more +1 0 -1 or less
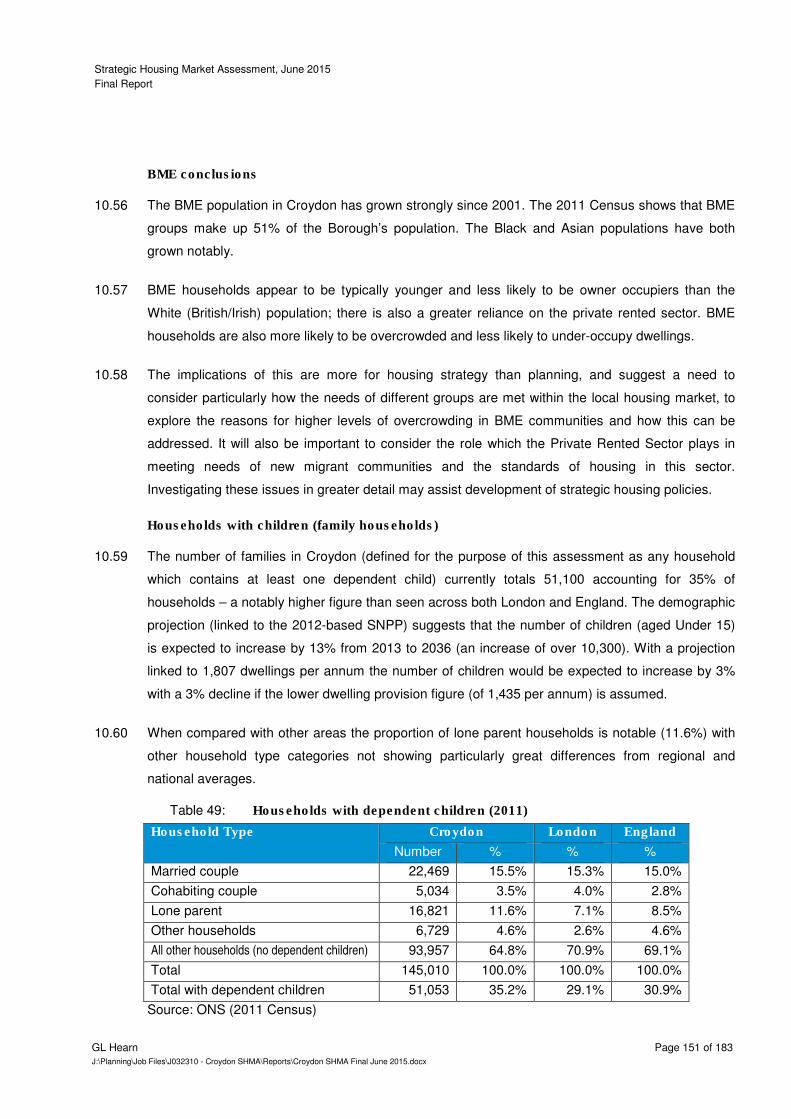
Strategic Housing Market Assessment, June 2015
Final Report
GL Hearn Page 151 of 183
J:\Planning\Job Files\J032310 - Croydon SHMA\Reports\Croydon SHMA Final June 2015.docx
BME conclusions
The BME population in Croydon has grown strongly since 2001. The 2011 Census shows that BME 10.56
groups make up 51% of the Borough’s population. The Black and Asian populations have both
grown notably.
BME households appear to be typically younger and less likely to be owner occupiers than the 10.57
White (British/Irish) population; there is also a greater reliance on the private rented sector. BME
households are also more likely to be overcrowded and less likely to under-occupy dwellings.
The implications of this are more for housing strategy than planning, and suggest a need to 10.58
consider particularly how the needs of different groups are met within the local housing market, to
explore the reasons for higher levels of overcrowding in BME communities and how this can be
addressed. It will also be important to consider the role which the Private Rented Sector plays in
meeting needs of new migrant communities and the standards of housing in this sector.
Investigating these issues in greater detail may assist development of strategic housing policies.
Households with children (family households)
The number of families in Croydon (defined for the purpose of this assessment as any household 10.59
which contains at least one dependent child) currently totals 51,100 accounting for 35% of
households – a notably higher figure than seen across both London and England. The demographic
projection (linked to the 2012-based SNPP) suggests that the number of children (aged Under 15)
is expected to increase by 13% from 2013 to 2036 (an increase of over 10,300). With a projection
linked to 1,807 dwellings per annum the number of children would be expected to increase by 3%
with a 3% decline if the lower dwelling provision figure (of 1,435 per annum) is assumed.
When compared with other areas the proportion of lone parent households is notable (11.6%) with 10.60
other household type categories not showing particularly great differences from regional and
national averages.
Households with dependent children (2011) Table 49:
Household Type Croydon London England
Number % % %
Married couple 22,469 15.5% 15.3% 15.0%
Cohabiting couple 5,034 3.5% 4.0% 2.8%
Lone parent 16,821 11.6% 7.1% 8.5%
Other households 6,729 4.6% 2.6% 4.6%
All other households (no dependent children) 93,957 64.8% 70.9% 69.1%
Total 145,010 100.0% 100.0% 100.0%
Total with dependent children 51,053 35.2% 29.1% 30.9%
Source: ONS (2011 Census)

Strategic Housing Market Assessment, June 2015
Final Report
GL Hearn Page 152 of 183
J:\Planning\Job Files\J032310 - Croydon SHMA\Reports\Croydon SHMA Final June 2015.docx
The figure below shows the current tenure of households with dependent children. There are some 10.61
considerable differences by household type with lone parents having a very high proportion living in
the social rented sector and also in private rented accommodation. Only around 22% of lone parent
households are owner-occupiers compared with 70% of married couples with children.
Tenure of households with dependent children – Croydon Figure 76:
Source: 2011 Census
Overcrowding is often a key theme when looking at the housing needs of households with children 10.62
and the figure below shows that households with children are about five times more likely than other
households to be overcrowded. In total, some 20% of all households with dependent children are
overcrowded and included within this the data shows 22% of lone parent households are
overcrowded along with 46% of ‘other’ households with dependent children. Other than for married
couple households levels of under-occupancy are also very low.
8.2% 3.8% 3.2%10.5%
33.6%24.1%
6.4%
61.8%
45.3%
18.3%
44.2%
31.9%
36.0%
43.5%
10.9%
23.1%
45.4%
17.2%
14.3%17.9%
24.3%
18.5%27.0% 32.1% 27.0%
18.9% 21.0% 25.0%
0.6% 0.8% 0.9% 1.1% 1.2% 1.1% 0.8%
0%
10%
20%
30%
40%
50%
60%
70%
80%
90%
100%
Married couple Cohabitingcouple
Lone parent Otherhouseholds
All otherhouseholds (no
dependentchildren)
All households All householdswith dependent
children
% o
f hou
seho
lds
in g
roup
Owner-occupied (no mortgage) Owner-occupied (with mortgage) Social rented Private rented Other
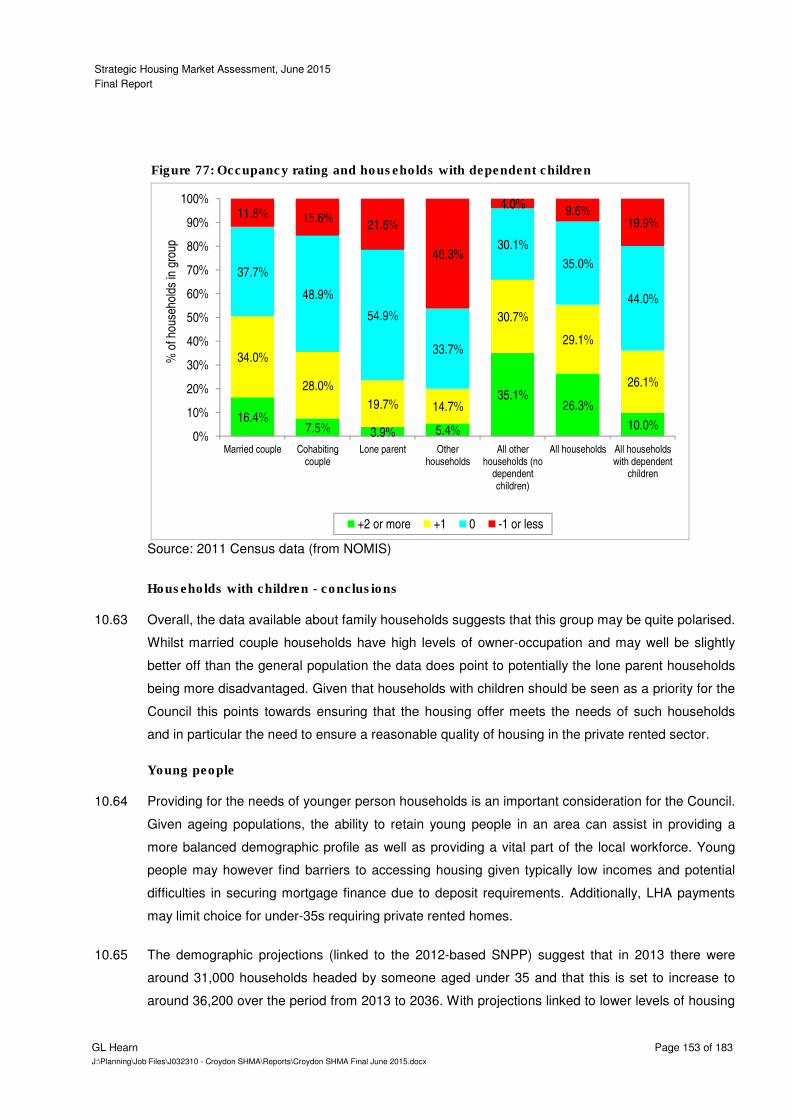
Strategic Housing Market Assessment, June 2015
Final Report
GL Hearn Page 153 of 183
J:\Planning\Job Files\J032310 - Croydon SHMA\Reports\Croydon SHMA Final June 2015.docx
Occupancy rating and households with dependent children Figure 77:
Source: 2011 Census data (from NOMIS)
Households with children - conclusions
Overall, the data available about family households suggests that this group may be quite polarised. 10.63
Whilst married couple households have high levels of owner-occupation and may well be slightly
better off than the general population the data does point to potentially the lone parent households
being more disadvantaged. Given that households with children should be seen as a priority for the
Council this points towards ensuring that the housing offer meets the needs of such households
and in particular the need to ensure a reasonable quality of housing in the private rented sector.
Young people
Providing for the needs of younger person households is an important consideration for the Council. 10.64
Given ageing populations, the ability to retain young people in an area can assist in providing a
more balanced demographic profile as well as providing a vital part of the local workforce. Young
people may however find barriers to accessing housing given typically low incomes and potential
difficulties in securing mortgage finance due to deposit requirements. Additionally, LHA payments
may limit choice for under-35s requiring private rented homes.
The demographic projections (linked to the 2012-based SNPP) suggest that in 2013 there were 10.65
around 31,000 households headed by someone aged under 35 and that this is set to increase to
around 36,200 over the period from 2013 to 2036. With projections linked to lower levels of housing
16.4%7.5% 3.9% 5.4%
35.1%26.3%
10.0%
34.0%
28.0%
19.7% 14.7%
30.7%
29.1%
26.1%
37.7%
48.9%
54.9%
33.7%
30.1%
35.0%
44.0%
11.8% 15.6%21.6%
46.3%
4.0%9.6%
19.9%
0%
10%
20%
30%
40%
50%
60%
70%
80%
90%
100%
Married couple Cohabitingcouple
Lone parent Otherhouseholds
All otherhouseholds (no
dependentchildren)
All households All householdswith dependent
children
% o
f hou
seho
lds
in g
roup
+2 or more +1 0 -1 or less

Strategic Housing Market Assessment, June 2015
Final Report
GL Hearn Page 154 of 183
J:\Planning\Job Files\J032310 - Croydon SHMA\Reports\Croydon SHMA Final June 2015.docx
delivery (e.g. the alternatives linked to GLA assumptions) the number of younger households is
actually expected to drop slightly (by between 1,900 and 3,500 households).
As well as households headed by a younger person there will be others living as part of another 10.66
household (typically with parents). The table below shows the number of households in the Borough
with non-dependent children. In total, some 11% of households (15,400) contain non-dependent
children. This may to some degree highlight the difficulties faced by young people in accessing
housing. Young people may be less likely to be eligible for social housing, have lower household
incomes and have difficulty in accessing the owner-occupied sector due to mortgage constraints
and deposit requirements. All of these factors contribute to the current trend for young people
moving in with or continuing to live with parents.
Households with non-dependent children (2011) Table 50:
Source: ONS (2011 Census)
When considering households that are currently headed by a younger person (taken for this 10.67
analysis as being aged under 35) we can use 2011 Census data to look at some key
characteristics. The figure below shows the tenure groups of these households (compared with
other age groups). The data clearly shows that very few younger households are owner-occupiers
with a particular reliance on the private rented sector and to a lesser degree social rented housing.
Household Type Croydon London England
Number % % %
Married couple 8,292 5.7% 5.6% 4.8%
Cohabiting couple 724 0.5% 0.5% 0.4%
Lone parent 6,339 4.4% 3.5% 4.1%
All other households 129,655 89.4% 90.4% 90.7%
Total 145,010 100.0% 100.0% 100.0%
Total with non-dependent children 15,355 10.6% 9.6% 9.3%
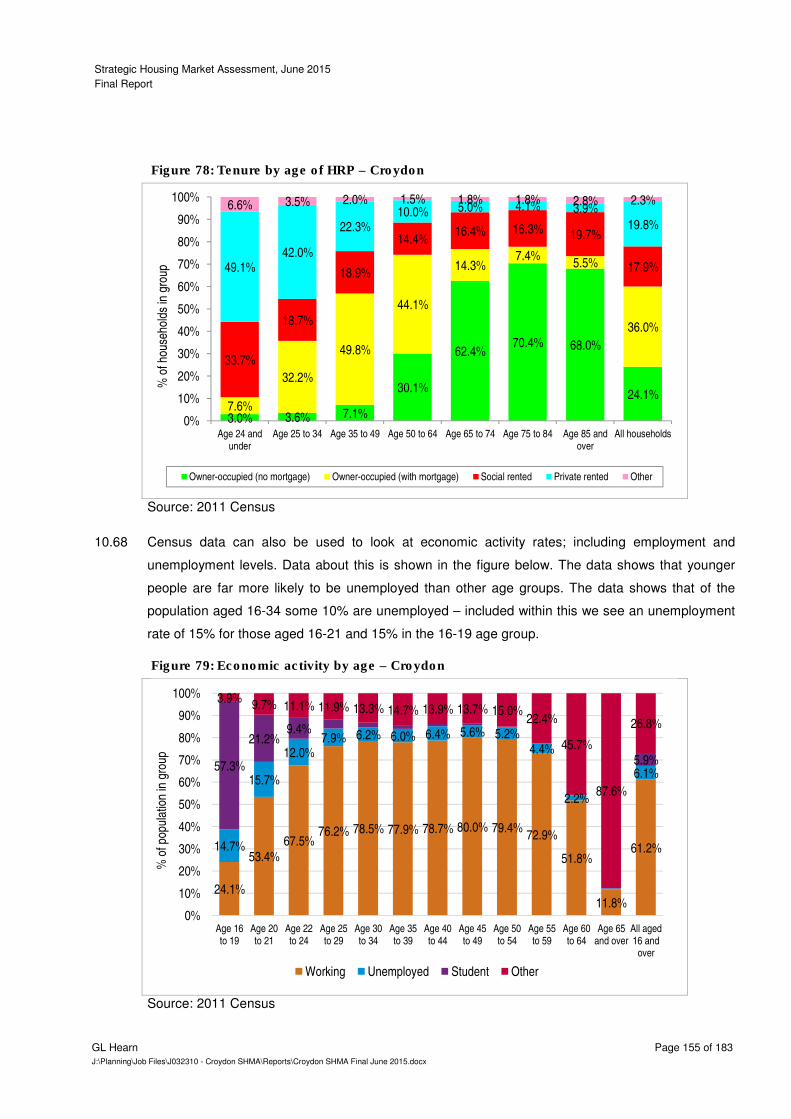
Strategic Housing Market Assessment, June 2015
Final Report
GL Hearn Page 155 of 183
J:\Planning\Job Files\J032310 - Croydon SHMA\Reports\Croydon SHMA Final June 2015.docx
Tenure by age of HRP – Croydon Figure 78:
Source: 2011 Census
Census data can also be used to look at economic activity rates; including employment and 10.68
unemployment levels. Data about this is shown in the figure below. The data shows that younger
people are far more likely to be unemployed than other age groups. The data shows that of the
population aged 16-34 some 10% are unemployed – included within this we see an unemployment
rate of 15% for those aged 16-21 and 15% in the 16-19 age group.
Economic activity by age – Croydon Figure 79:
Source: 2011 Census
3.0% 3.6% 7.1%
30.1%
62.4%70.4% 68.0%
24.1%7.6%
32.2%
49.8%
44.1%
14.3%7.4%
5.5%
36.0%
33.7%
18.7%
18.9%
14.4%16.4% 16.3% 19.7%
17.9%49.1%42.0%
22.3%10.0% 5.0% 4.1% 3.9%
19.8%
6.6% 3.5% 2.0% 1.5% 1.8% 1.8% 2.8% 2.3%
0%
10%
20%
30%
40%
50%
60%
70%
80%
90%
100%
Age 24 andunder
Age 25 to 34 Age 35 to 49 Age 50 to 64 Age 65 to 74 Age 75 to 84 Age 85 andover
All households
% o
f hou
seho
lds
in g
roup
Owner-occupied (no mortgage) Owner-occupied (with mortgage) Social rented Private rented Other
24.1%
53.4%67.5%
76.2% 78.5% 77.9% 78.7% 80.0% 79.4%72.9%
51.8%
11.8%
61.2%14.7%
15.7%
12.0%7.9% 6.2% 6.0% 6.4% 5.6% 5.2%
4.4%
2.2%
6.1%57.3%
21.2%9.4%
5.9%
3.9%9.7% 11.1% 11.9% 13.3% 14.7% 13.9% 13.7% 15.0%
22.4%
45.7%
87.6%
26.8%
0%
10%
20%
30%
40%
50%
60%
70%
80%
90%
100%
Age 16to 19
Age 20to 21
Age 22to 24
Age 25to 29
Age 30to 34
Age 35to 39
Age 40to 44
Age 45to 49
Age 50to 54
Age 55to 59
Age 60to 64
Age 65and over
All aged16 and
over
% o
f pop
ulat
ion
in g
roup
Working Unemployed Student Other

Strategic Housing Market Assessment, June 2015
Final Report
GL Hearn Page 156 of 183
J:\Planning\Job Files\J032310 - Croydon SHMA\Reports\Croydon SHMA Final June 2015.docx
Young people - conclusions
Analysis of younger person households shows a high reliance on rented housing. Younger age 10.69
cohorts may therefore be forced into private rented (including shared) housing as the only means of
meeting their housing needs, aside from residing with parents, where they would not form a head of
household. Factors such as a balanced approach to housing in terms of bedroom sizes and
property types, along with high standards for Houses in Multiple Occupation (HMOs) will help
younger households to access housing
Custom/Self-Build
SHMAs need to investigate the contribution that self-builds makes toward the local supply. Laying 10.70
the Foundations – a Housing Strategy for England 2010 sets out that only one in 10 new homes in
Britain was self-built in 2010 – a lower level than in other parts of Europe. It identifies barriers to self
or custom-build development as including:
• A lack of land;
• Limited finance and mortgage products;
• Restrictive regulation; and
• A lack of impartial information for potential custom home builders.
Government aspires to make self-build a ‘mainstream housing option’ by making funding available 10.71
to support self-builders and by asking local authorities to champion the sector. Up to £30m of
funding has been made available via the Custom Build programme administered by the HCA to
provide short-term project finance to help unlock group custom build or self-build schemes. The
fund can be used to cover eligible costs such as land acquisition, site preparation, infrastructure,
S106 planning obligations etc.
Quantitative information regarding levels of self-build is hard to come by. Information from local 10.72
authority planning officers is therefore anecdotal. Planning officers within the HMA have indicated
that there has limited interest in such schemes within the Borough.
We have also reviewed a number of websites dedicated to advising and assisting people to self-10.73
build. Some assist in the brokerage of individual building plots and this is part of our SHMA
information gathering. Their websites show very few opportunities for self-build within Croydon. In
deed across London only 8 plots were being advertised. These will be stand-alone, self-contained
dwellings and are often constructed for employees or family members some of whom may be frail
or disabled in some way.
Local estate agents tell us that they are rarely asked to sell plots within the Borough for self-build. 10.74
Those plots which do appear tend to be for single unit development. However most of the demand

Strategic Housing Market Assessment, June 2015
Final Report
GL Hearn Page 157 of 183
J:\Planning\Job Files\J032310 - Croydon SHMA\Reports\Croydon SHMA Final June 2015.docx
for plots are from small developers rather than self-build individuals. Overall the evidence suggest
that this is currently a niche sector in the Borough.
From a development point of view, key issues with this market are associated with skills and risk: 10.75
whist there may be notable number of people with an ‘interest’ in self-build, there is in some
circumstances a significant financial outlay, risk and time-cost associated with self-build.
We would expect most new delivery to be on small windfall sites; although there is some potential 10.76
through policy to encourage developers of larger schemes to designate parts of these as plots
available for custom build. However it is likely to be difficult to demonstrate concrete evidence of
demand at a local level; albeit that local authorities could develop and maintain registers of those
with an interest in doing so.
While the focus of Self-build is understandably for market housing there are opportunities for 10.77
delivery of affordable homes through this method. One example of this is the ‘Build!’ programme run
by Cherwell District Council in Oxfordshire.
This programme offers individuals or interested groups the opportunity to come together to either 10.78
build a new home, or to renovate and decorate an existing property. These properties are
eventually available on a shared ownership or affordable rent tenure. In return for their labour
participants would receive reduced purchase price or lower rental rates. The level of discount
applied would reflect the individual’s involvement in the build or renovation process.
More locally there have been a number of successful community self-build schemes in South 10.79
London. In Lewisham for example there was a successful community self-build scheme which
delivered 12 units for unemployed men and woman. Similarly in Lambeth 11 eco-friendly family
homes were built in 2005.
In order for this to work in Croydon the Council would be required to make plots available that have 10.80
secured detailed planning permission and set up a register for those interested in such a scheme.
As well as delivering additional affordable homes the scheme would also achieve a number of other
social achievements including training.
Policy Implications
This section of the report has studied the housing circumstances of various different groups of the 10.81
population. These are:
• Older people;
• People with disabilities;
• The Black and Minority Ethnic population;
Strategic Housing Market Assessment, June 2015
Final Report
GL Hearn Page 158 of 183
J:\Planning\Job Files\J032310 - Croydon SHMA\Reports\Croydon SHMA Final June 2015.docx
• Households with children (family households); and
• Young households
Specific conclusions have been provided for each of these groups with core conclusions 10.82
summarised below:
Older persons – the key challenge here will be to meet the needs of an ageing population with the 10.83
number of people aged 65 and above expected to increase by 37,200 (78%) from 2013 to 2036.
Demographic change is likely to see a requirement for additional levels of care/support along with
provision of some specialist accommodation in both the market and affordable sectors – it is
estimated that around 4% of new provision should be Extra-Care for older people.
People with disabilities – the number of people with disabilities is closely related to the age of the 10.84
population and many of the conclusions related to older persons are relevant for this group.
Demographic projections suggest a 127% increase in the population aged over 85 from 2013 to
2036 with Census data suggesting that 79% of this age group have some level of disability.
BME groups – the BME population of Croydon is relatively large and has grown significantly over 10.85
the past decade. Characteristics of BME groups (including tenure profiles and occupancy patterns)
suggest that such households may be disadvantaged in the housing market. Where possible the
Council should provide advice to BME groups and in particular ensure that accommodation quality
(particularly in the private rented sector) can meet the needs of such households which are
disproportionately likely to contain children.
Family households – data about family households suggests that lone parents are particularly 10.86
disadvantaged with a high reliance on rented housing. Projections suggest an increase in the
number of children in the Borough over the next few years and if past trends are repeated this will
also see a notable increase in the number of lone parents. Again advice about housing options and
maintaining a good quality of accommodation will be critical to ensure that such households’ needs
are best met.
Young person households – young people (aged under 35) are important for any area due to the 10.87
long-term economic potential they can bring. As with other groups there are some indications of this
group being disadvantaged with a reliance on rented accommodation and high levels of
unemployment. Given that the housing options for young people may be more limited than for other
groups it will be important to monitor the accommodation quality – this will need to focus on HMOs
given general trends of an increase in house sharing over time.
Strategic Housing Market Assessment, June 2015
Final Report
GL Hearn Page 159 of 183
J:\Planning\Job Files\J032310 - Croydon SHMA\Reports\Croydon SHMA Final June 2015.docx
11 CONCLUSIONS
Housing Market Area
The National Planning Policy Framework (NPPF) states that local planning authorities should use 11.1
their evidence base to ensure Local Plans meet the full, objectively assessed needs for market and
affordable housing in their housing market area (HMA). However, as the Planning Practice
Guidance recognises, there is no “hard and fast” approach for defining a housing market area and,
in practice, many housing market areas overlap.
From our analysis of market dynamics, migration patterns and commuting there is clearly a complex 11.2
set of relationships at play across London and more locally Croydon. Triangulation of the evidence
converges upon a single authority HMA covering Croydon to be the most appropriate. Although
there are also notable links with Lambeth, Bromley and more specifically Tandridge and Sutton.
It is however important to recognise overlaps between these surrounding authorities and markets in 11.3
this area. In the context of the Duty to Cooperate, the authorities with the strongest localised links
should be engaged in considering strategic housing issues not only in the preparation of the SHMA
but also the subsequent development of plan policies.
Overall Housing Need
The NPPF sets out that plans should be prepared on the basis of meeting full needs for market and 11.4
affordable housing. Planning Practice Guidance sets out that the latest national projections should
be seen as a starting point but that authorities may consider sensitivity testing projections in
response to local circumstances and the latest demographic evidence.
In accordance with the Planning Practice Guidance, the latest population projections have formed 11.5
the starting point for our assessment, the case these are the 2012-based Sub-National Population
Projections (SNPP) and related CLG Household Projections.
The latest 2011-based interim household projections indicate household growth of 1,838 11.6
households per annum across the Borough between 2011 and 2021. However these projections
assume that household formation rates seen over the 2001-11 period continue moving forward.
These trends arguably build in a degree of suppression of household formation, a point which is
acknowledged by CLG in the Planning Practice Guidance on Assessment of Housing and
Economic Development Needs.
Against this context a sensitivity analysis has been developed exploring different projections of 11.7
household formation rates and to take account of the latest migration data. This analysis concludes
that the most appropriate means of projecting household formation would be based on a set of
Strategic Housing Market Assessment, June 2015
Final Report
GL Hearn Page 160 of 183
J:\Planning\Job Files\J032310 - Croydon SHMA\Reports\Croydon SHMA Final June 2015.docx
headship rates which took 2011-based rates as a start point and projected forward in terms of the
trends contained in the 2008-based projections.
Carrying out the projection on this basis suggests household growth of 2,375 per annum and a 11.8
housing requirement for 2,437 additional homes per annum (once a vacancy allowance has been
included).
Alternatively if the GLA projections are to be used for the same period then a need for between 11.9
1,575 and 2,046 dwellings per annum with the central variant at 1,807 dwellings per annum being
the most reasonable.
The guidance then sets three key tests which should be applied in order to identify whether there is 11.10
a case to adjust the starting point. We see these tests as:
• Do market signals point to a need to increase housing supply in order to address affordability
and high demand?
• Is there a need to increase overall housing supply in order to boost delivery of affordable homes
to meet identified needs?
• Is there evidence that an increase in housing supply is needed to ensure a sufficient labour
supply to support forecast economic and employment growth in different parts of the HMA?
Test 1: Do market signals point to a need to increase housing supply in order to address
affordability and high demand?
The Planning Practice Guidance sets out that the housing need suggested by household 11.11
projections should be adjusted to reflect appropriate market signals and indicators of the balance
between the demand for and supply of homes. It sets out that the more significant the affordability
constraints (in terms of rising housing costs and worsening affordability) the larger the additional
supply response required.
The market analysis undertaken indicates that house prices across Croydon are significantly below 11.12
the London-wide level, although still above national trends. The median house price across the
Borough is around £242,500 compared to £325,000 across London and £283,000.
Despite the relatively low house price in the Borough they are still at 8.6 times the lower quartile 11.13
wages. This makes accessing the housing market difficult for most first time buyers to enter the
housing ladder without a sizeable deposit.
Since 2001 Croydon has delivered almost 13,000 additional homes. The housing target was 11.14
consistently exceeded between 2004/05 and 2008/09, but in recent years the levels of delivery
have dropped. That said housing supply in Croydon has had a mixed history in terms of meeting its
Strategic Housing Market Assessment, June 2015
Final Report
GL Hearn Page 161 of 183
J:\Planning\Job Files\J032310 - Croydon SHMA\Reports\Croydon SHMA Final June 2015.docx
housing target which has increased incrementally over this period due in part to under-delivery and
now stands at 1,330 dwellings per annum until 2021.
Against this context there is some basis for considering an upwards adjustment to housing
provision in order to improve the affordability of market. The return to 2008-based household
formation rates within the demographic projections in-part address this.
Test 2: Is there a need to increase overall housing supply in order to boost delivery of
affordable homes to meet identified needs?
The second test is to consider the ability of overall housing numbers to ensure affordable housing 11.15
needs can be satisfied. Affordable housing is defined as including social rented, affordable rented
and intermediate housing. Following the approach advocated by the Guidance, the net affordable
housing need identified in Croydon is for 2,088 homes per year.
However, such a level of delivery is not likely to be achievable as at the current London Housing 11.16
Strategy rates of delivery (40%) this would require 5,220 dwellings per annum to be built to support
this level of affordable housing. This is far higher than the demographic need outlined earlier in the
report. As stated in the NPPG, an increase in the total housing figures should be considered where
it could help deliver the required number of affordable homes.
The needs evidence indicates that the Council would be justified in seeking to secure the maximum 11.17
viable level of affordable housing in future through new development schemes. However they must
balance competing potential priorities. Furthermore It is important to note that the Council are
however not solely reliant on affordable housing delivery through market-led schemes. The Council
can deliver affordable homes directly and in partnership with Registered Providers. These are likely
to be an important source of supply going forward.
Whilst a significant quantitative shortfall of affordable housing is identified, there are in reality two 11.18
factors which are important to consider in interpreting the figures in context. Firstly, in practice there
are likely to be households who are adequately housed whilst paying more than the 30% of income
threshold used in this report. Secondly, the private rented sector makes a potentially significant
contribution to meeting affordable housing needs through households supported by Local Housing
Allowance (LHA). The extent to which the Council wishes to see the private rented sector being
used to make up for shortages of affordable housing is plainly a local policy decision which is
outside the scope of this study.
We therefore believe that the affordable housing need identified does not provide definitive 11.19
evidence for possibly considering upwards adjustment to housing provision relative to the
demographic projections in order to support higher affordable housing delivery.
Strategic Housing Market Assessment, June 2015
Final Report
GL Hearn Page 162 of 183
J:\Planning\Job Files\J032310 - Croydon SHMA\Reports\Croydon SHMA Final June 2015.docx
Test 3: Is there evidence that an increase in housing supply is needed to ensure a sufficient
labour supply to support forecast economic and employment growth in different parts of the
HMA?
In line with the Guidance, we have also considered the implications of future economic and 11.20
employment trends on housing needs by modelling the housing which would be required to meet
the level of employment growth forecast by the GLA economic forecasts.
The GLA forecasts indicate an almost 25,500 increase in jobs over the period between 2011 and 11.21
2036. Modelling these forecasts through to housing numbers results in a need for 1,659 homes per
annum to 2036.
The economic led forecasts are significantly lower than the demographic needs identified. However, 11.22
it is important to recognise that there is no basis in national policy or guidance to use the economic
forecasts to argue that housing provision in an individual local authority should be lower than in the
demographic projections.
Overall Conclusion on Housing Needs
We have sought to draw the range of evidence together to define objectively-assessed need for 11.23
housing. In doing so we have followed the following approach:
• Define the base level of need with regard to the demographic projections;
• Consider the case for adjustments in response to market signals. This points to a case for
upwards which has been factored in by reverting to 2008-based household formation rates;
• Compare the demographic projections against the proportionate economic-led projections in
regard to the scope to encourage local living and working;
• Overlay the affordable housing evidence in regard to the % supply based on the demographic
projections needed to support full affordable housing delivery;
• Identify the higher level of the range to take account of the market signals, economic evidence
and affordable housing need.
In interpreting the affordable housing needs evidence, we recognise that whilst the Planning 11.24
Practice Guidance identifies a need to consider adjustments to the overall assessment of need to
enhance affordable housing delivery, some households in housing need are able to live within the
Private Rented Sector supported by Local Housing Allowance. A proportionate adjustment is thus
inappropriate to enhance affordable delivery where applicable. The economic-led forecasts would
also result in a need which is below the demographic need.
Our assessment of market signals suggest a modest requirement to uplift to improve affordability in 11.25
the Borough. The level of uplift can be quantified by assessing the degree to which household
formation levels have been constrained and what scale of adjustment to housing provision would be
Strategic Housing Market Assessment, June 2015
Final Report
GL Hearn Page 163 of 183
J:\Planning\Job Files\J032310 - Croydon SHMA\Reports\Croydon SHMA Final June 2015.docx
necessary for affordability to improve. By using 2008-based household formation rates we have
adjusted the projections to reflect a period when the affordability was less acute. This resulted in a
housing need of 2,437 homes per annum across the HMA.
This identified objectively assed need is significantly higher than the minimum of 1,435 additional 11.26
homes per annum as identified the FALP. However any additional housing delivery will go towards
closing the gap between identified housing need and supply in line with the requirement of the
NPPF.
The GLA’s on projections inform the FALP figures at a City wide level. As such these can be seen 11.27
as a credible alternative to the FALP figures and those set out in this report. The central variant of
these results in a need for 1,807 dwellings per annum.
The FALP policy specifically encourages boroughs to identify and seek to enable additional 11.28
development capacity to be brought forward which supplements these targets (having regard to
other policies in the Plan) such as through intensification, town centre renewal, opportunity and
intensification and growth corridors, mixed use development and sensitive renewal of existing
residential areas – particularly in areas of good public transport accessibility. To fit local plan
timeframes, it supports the ‘roll forward’ of annual average figures where appropriate.
By planning to deliver dwellings over and above that set out in the FALP the Borough would meet 11.29
the policies in the FALP and also help ease the need for housing in more constrained parts of the
City.
However, It should be recognised that this is an objective assessment of housing need and takes 11.30
no account of land supply, development constraints, environmental constraints or the feasibility of
delivering infrastructure to support sustainable development. The Planning Practice Guidance12
is
clear on these issues, setting out that “plan makers should not apply constraints to the overall
assessment of need, such as limitations imposed by the supply of land for development, historical
under performance, infrastructure or environmental constraints. However these considerations will
need to be addressed when bringing evidence bases together to identify specific policies within
development plans.”
These supply-side factors are relevant in translating the need identified into a policy target for 11.31
housing provision in the local plan. Ongoing engagement with adjoining authorities, partly through
this process will be necessary to assess whether there is potential to contribute to meeting unmet
needs of adjoining authorities where they exist or relieve Croydon’s unmet need if this transpires. In
12
CLG (March 2014) Planning Practice Guidance – Assessment of Housing and Economic Development Needs
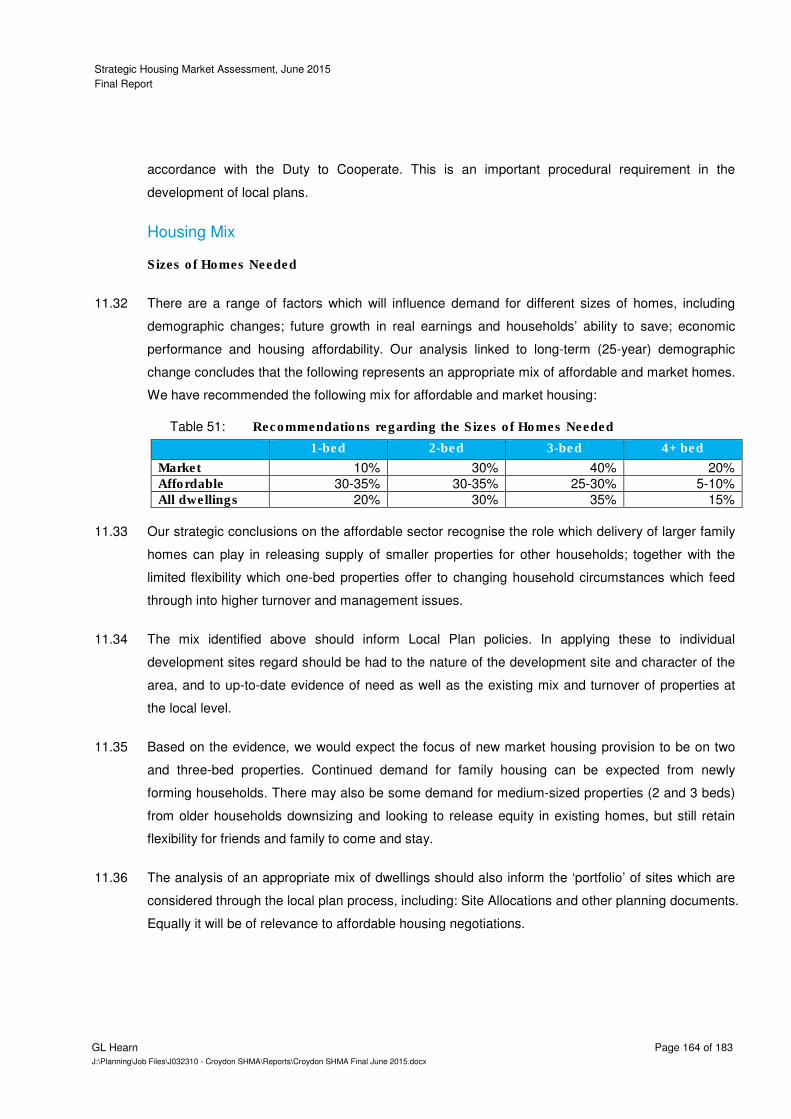
Strategic Housing Market Assessment, June 2015
Final Report
GL Hearn Page 164 of 183
J:\Planning\Job Files\J032310 - Croydon SHMA\Reports\Croydon SHMA Final June 2015.docx
accordance with the Duty to Cooperate. This is an important procedural requirement in the
development of local plans.
Housing Mix
Sizes of Homes Needed
There are a range of factors which will influence demand for different sizes of homes, including 11.32
demographic changes; future growth in real earnings and households’ ability to save; economic
performance and housing affordability. Our analysis linked to long-term (25-year) demographic
change concludes that the following represents an appropriate mix of affordable and market homes.
We have recommended the following mix for affordable and market housing:
Recommendations regarding the Sizes of Homes Needed Table 51:
1-bed 2-bed 3-bed 4+ bed
Market 10% 30% 40% 20% Affordable 30-35% 30-35% 25-30% 5-10% All dwellings 20% 30% 35% 15%
Our strategic conclusions on the affordable sector recognise the role which delivery of larger family 11.33
homes can play in releasing supply of smaller properties for other households; together with the
limited flexibility which one-bed properties offer to changing household circumstances which feed
through into higher turnover and management issues.
The mix identified above should inform Local Plan policies. In applying these to individual 11.34
development sites regard should be had to the nature of the development site and character of the
area, and to up-to-date evidence of need as well as the existing mix and turnover of properties at
the local level.
Based on the evidence, we would expect the focus of new market housing provision to be on two 11.35
and three-bed properties. Continued demand for family housing can be expected from newly
forming households. There may also be some demand for medium-sized properties (2 and 3 beds)
from older households downsizing and looking to release equity in existing homes, but still retain
flexibility for friends and family to come and stay.
The analysis of an appropriate mix of dwellings should also inform the ‘portfolio’ of sites which are 11.36
considered through the local plan process, including: Site Allocations and other planning documents.
Equally it will be of relevance to affordable housing negotiations.
Strategic Housing Market Assessment, June 2015
Final Report
GL Hearn Page 165 of 183
J:\Planning\Job Files\J032310 - Croydon SHMA\Reports\Croydon SHMA Final June 2015.docx
Tenure
Overall a net deficit of 48,016 affordable homes is identified (2,088 per annum). There is thus a 11.37
significant requirement for new affordable housing in Croydon and the Council is justified in seeking
to secure additional affordable housing.
While a significant deficiency in affordable housing is identified, in practice many households who 11.38
are unable to secure affordable housing are able to live within the Private Rented Sector supported
by housing benefit. It seems likely that the Private Rented Sector will continue to be used to make
up for a shortfall of fully affordable housing.
We have also assessed the proportion of affordable housing need that should be met through 11.39
provision of different housing products. There are three main types of affordable housing that can
be studied in this analysis:
• Intermediate;
• Affordable rent; and
• Social rent
Overall, 24% of households that cannot afford market housing can afford more than the affordable 11.40
rent level of 80% market rent. The remaining 76% can only afford at current affordable or social
rents or below. The analysis suggests around 24% of affordable housing could be equity-based
intermediate (such as shared ownership) with the remaining 76% being a rented product, either
social or affordable rented although there is potential overlap between these categories.
In determining policies for affordable housing provision on individual sites, our findings should be 11.41
brought together with other local evidence such as from the Housing Register. Consideration could
also be given to areas with high concentrations of social rented housing where additional
intermediate housing might be desirable to improve the housing mix and to create ‘housing
pathways’.
It should also be noted that funding for the delivery of new-build affordable housing is now focused 11.42
on affordable rent tenure. The dominance of this tenure within new build delivery is also confounded
by registered providers now being able to convert existing social rent properties to affordable rent
as they become vacant, in effect reducing the level of available socially rented properties. This is
likely to lead to a further focus/reliance on the affordable rental tenure in future years.
Needs of Specific Groups
The SHMA identifies a particular need to plan for a growing older population. The SHMA analysis 11.43
indicates that the growing older population (particularly in the oldest age groups) will result in
growth in households with specialist housing needs. Typically the greatest support needs are for
Strategic Housing Market Assessment, June 2015
Final Report
GL Hearn Page 166 of 183
J:\Planning\Job Files\J032310 - Croydon SHMA\Reports\Croydon SHMA Final June 2015.docx
alterations to properties (such as to bathrooms, showers and toilets, provision of emergency alarms
or help maintaining homes). Many of these can be resolved in situ through adaptations to existing
properties and the resource implications of this will need to be planned for.
The growing older population will however likely lead to some increase in requirements for 11.44
specialist housing solutions. The analysis above suggests a 99% growth in older population with
dementia, and a 93% increase in the older population with mobility problems. From a planning point
of view, some of these people will require specialist housing such as sheltered or extra care
provision. Increasing numbers of older people with health problems will also require joint-working
between housing and health (Council and NHS).
Our analysis suggests a potential requirement for around 99 additional housing units to be 11.45
specialist accommodation across the Borough to meet the needs of the older person population
each year moving to 2036.
Within the different models and assumptions made regarding the future need for specialist 11.46
retirement housing (normally defined as a form of congregate housing designed exclusively for
older people which usually offers some form of communal space, community alarm service and
access to support and care if required), there may for example be an option to substitute some of
this specialist provision with a mix of one and two bedroomed housing aimed to attract ‘early retired’
older people which could be designated as age specific or not. Such housing could be part of the
general mix of one and two bedroom homes but built to Lifetime Homes standards in order to attract
retired older people looking to ‘down size’ but perhaps not wanting to live in specialist retirement
housing.
Regarding the tenure mix; we have noted that at present there is a much higher level of supply in 11.47
the affordable sector than for market housing whereas the majority of older person households are
owner-occupiers. This would suggest moving forward that a greater emphasis could be placed on
market specialist provision than has been the case in the past.
As well as the need for specialist housing for older people the analysis needs to consider 11.48
Registered Care. The focus of the institutional population in the elderly age groups is those over 75.
Currently 23% of households contain someone with a long-term health problem or disability. 11.49
Demographic trends are expected to lead to a significant growth in the population and number of
households with disabilities over the period to 2036. Housing support services, including provision
of adaptations to properties, will need to be adequately resourced to take account of this.

Strategic Housing Market Assessment, June 2015
Final Report
GL Hearn Page 167 of 183
J:\Planning\Job Files\J032310 - Croydon SHMA\Reports\Croydon SHMA Final June 2015.docx
The BME population in Croydon has grown strongly since 2001. The 2011 Census shows that BME 11.50
groups make up 51% of the HMA’s population (up from 30% in 2001). The Black: Caribbean
population (which is the main BME group) has grown notably over the past decade.
BME households appear to be typically younger and less likely to be owner occupiers than the 11.51
White (British/Irish) population; there is also a greater reliance on the private rented sector. BME
households are also more likely to be overcrowded and less likely to under-occupy dwellings. The
implications of this are more for housing strategy than planning, and suggest a need to consider
particularly how the needs of different groups are met within the local housing market, to explore
the reasons for higher levels of overcrowding in BME communities and how this can be addressed.
It will also be important to consider the role which the Private Rented Sector plays in meeting needs
of new migrant communities and the standards of housing in this sector. Investigating these issues
in greater detail may assist development of strategic housing policies.
Analysis is included within the report regarding the needs of other groups such as young people 11.52
and families with children. It will be important that the needs of these groups continue to be planned
for and monitored.
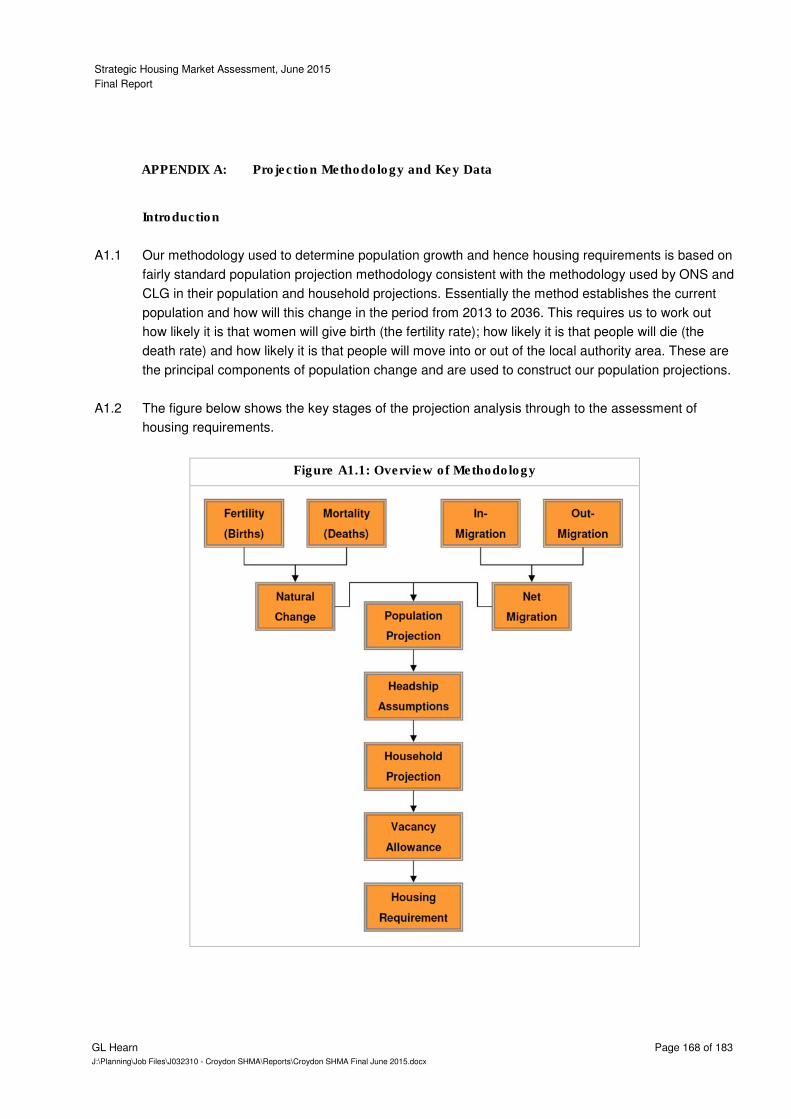
Strategic Housing Market Assessment, June 2015
Final Report
GL Hearn Page 168 of 183
J:\Planning\Job Files\J032310 - Croydon SHMA\Reports\Croydon SHMA Final June 2015.docx
APPENDIX A: Projection Methodology and Key Data
Introduction
A1.1 Our methodology used to determine population growth and hence housing requirements is based on
fairly standard population projection methodology consistent with the methodology used by ONS and
CLG in their population and household projections. Essentially the method establishes the current
population and how will this change in the period from 2013 to 2036. This requires us to work out
how likely it is that women will give birth (the fertility rate); how likely it is that people will die (the
death rate) and how likely it is that people will move into or out of the local authority area. These are
the principal components of population change and are used to construct our population projections.
A1.2 The figure below shows the key stages of the projection analysis through to the assessment of
housing requirements.
Figure A1.1: Overview of Methodology
Strategic Housing Market Assessment, June 2015
Final Report
GL Hearn Page 169 of 183
J:\Planning\Job Files\J032310 - Croydon SHMA\Reports\Croydon SHMA Final June 2015.docx
Projections Run
A1.3 As part of this assessment we have run a number of projections to assess how the population and
local economy (number of people in employment) might change under different assumptions. The
projections were developed to follow the logical set of steps set out in CLG advice of March 2014.
Two core projections were developed (one based on demographic trends and one on meeting job
growth forecasts). Core outputs from these projections are provided in this section with a summary
of the projections being listed below:
• PROJ 1 (Demographic-based – linked to the latest (2012-based) SNPP)
• PROJ 2 (Jobs-led – linked to employment growth of about 25,500 jobs – this being the level of job
growth expected in a GLA economic forecast)
Past Population Dynamics
A1.4 Before describing the projection process and key inputs it is of interest to study past population
growth and the components of change. The table below summarises key data from ONS mid-year
population estimates (MYE) going back to 2001. The data for 2001-11 is from the revised MYE
which uses Census data to adjust past estimates to ensure consistency between data for 2001 and
2011.
A1.5 The information shows a number of interesting trends in relation to Croydon and these are
summarised below:
• Natural change (the number of births minus the number of deaths) has been increasing over time
from less than 2,000 per annum up to 2004 to over 3,000 in each of the last three years. This trend
is consistent with that seen in many areas where relatively high birth rates have driven a greater
level of population growth than was observed earlier in the past decade.
• Net internal migration (people moving from one part of the Country to/from Croydon) has increased
noticeably over time (become less negative); averaging 3,800 (net out-migration) in the 2001-5
period but only 400 over the past three years (2010-13).
• International net migration has been more consistent over time with notable levels of net in-migration
throughout the period studied.
• The other changes are generally fairly minor in number compared to the migration figures – other
changes are largely linked to estimated changes in the prison and armed forces populations.
• The other (unattributable) column of data reflects an adjustment made by ONS to ensure
consistency between Census based mid-year population estimates and the mid-year estimates prior
to Census data being available. In Croydon the positive figures imply that the various components of
population change (once added together) are about 10,000 people lower than the overall level of
population growth (in the decade to 2011). Whilst it is unknown as to what components of change
this difference is linked to it is most probable that this will be due to the over-recording of in-migration
or under-recording of out-migration – this in turn may be linked to international migration data which
has historically been the most difficult component of population change to accurately measure. The
ONS data does not provide a figure for other (unattributable) in 2011/13 as there is no Census data
against which to measure whether or not population change has been over- or under-estimated.

Strategic Housing Market Assessment, June 2015
Final Report
GL Hearn Page 170 of 183
J:\Planning\Job Files\J032310 - Croydon SHMA\Reports\Croydon SHMA Final June 2015.docx
Figure A1.2: Components of population change (2001-13) – Croydon
Year Natural
change
Net
internal
migration
Net
international
migration
Other
changes
Other
(unattributable)
Total
change
2001/2 1,610 -3,707 1,676 -24 748 303
2002/3 1,759 -3,573 1,539 -13 792 504
2003/4 1,990 -3,992 2,412 26 779 1,215
2004/5 2,252 -3,993 2,843 -11 827 1,918
2005/6 2,095 -2,899 1,254 12 935 1,397
2006/7 2,714 -2,240 2,142 -27 991 3,580
2007/8 3,047 -1,712 2,876 -2 1,070 5,279
2008/9 2,767 -2,144 1,672 -1 1,161 3,455
2009/10 2,931 -1,036 2,002 -34 1,325 5,188
2010/11 3,337 141 1,993 11 1,382 6,864
2011/12 3,337 -754 1,479 9 0 4,071
2012/13 3,346 -624 1,141 3 0 3,866
Source: ONS Components of Change
Baseline Population
A1.6 The baseline for our projections is taken to be 2013 with the projection run for each year over the
period up to 2036. The estimated population profile as of 2013 has been taken from ONS mid-year
population estimates. The overall population in 2013 is estimated to be 372,752 with slightly more
females than males.
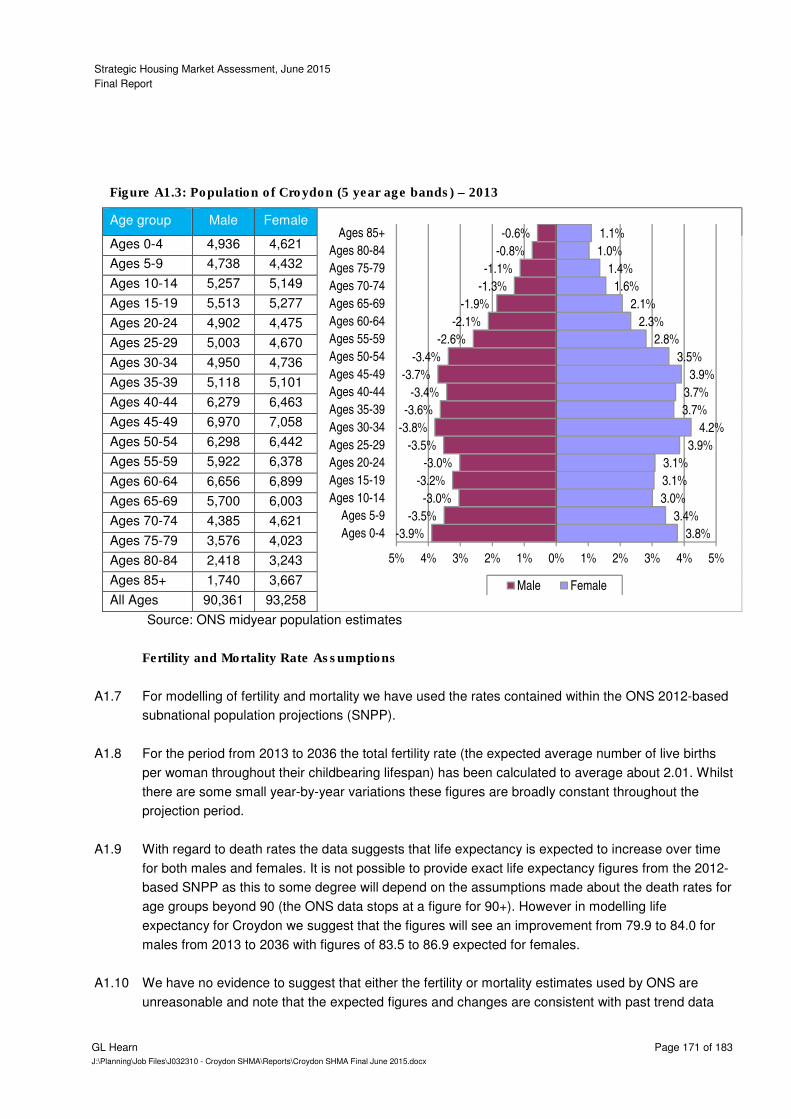
Strategic Housing Market Assessment, June 2015
Final Report
GL Hearn Page 171 of 183
J:\Planning\Job Files\J032310 - Croydon SHMA\Reports\Croydon SHMA Final June 2015.docx
Figure A1.3: Population of Croydon (5 year age bands) – 2013
Age group Male Female
Ages 0-4 4,936 4,621
Ages 5-9 4,738 4,432
Ages 10-14 5,257 5,149
Ages 15-19 5,513 5,277
Ages 20-24 4,902 4,475
Ages 25-29 5,003 4,670
Ages 30-34 4,950 4,736
Ages 35-39 5,118 5,101
Ages 40-44 6,279 6,463
Ages 45-49 6,970 7,058
Ages 50-54 6,298 6,442
Ages 55-59 5,922 6,378
Ages 60-64 6,656 6,899
Ages 65-69 5,700 6,003
Ages 70-74 4,385 4,621
Ages 75-79 3,576 4,023
Ages 80-84 2,418 3,243
Ages 85+ 1,740 3,667
All Ages 90,361 93,258
Source: ONS midyear population estimates
Fertility and Mortality Rate Assumptions
A1.7 For modelling of fertility and mortality we have used the rates contained within the ONS 2012-based
subnational population projections (SNPP).
A1.8 For the period from 2013 to 2036 the total fertility rate (the expected average number of live births
per woman throughout their childbearing lifespan) has been calculated to average about 2.01. Whilst
there are some small year-by-year variations these figures are broadly constant throughout the
projection period.
A1.9 With regard to death rates the data suggests that life expectancy is expected to increase over time
for both males and females. It is not possible to provide exact life expectancy figures from the 2012-
based SNPP as this to some degree will depend on the assumptions made about the death rates for
age groups beyond 90 (the ONS data stops at a figure for 90+). However in modelling life
expectancy for Croydon we suggest that the figures will see an improvement from 79.9 to 84.0 for
males from 2013 to 2036 with figures of 83.5 to 86.9 expected for females.
A1.10 We have no evidence to suggest that either the fertility or mortality estimates used by ONS are
unreasonable and note that the expected figures and changes are consistent with past trend data
3.8%
3.4%
3.0%
3.1%
3.1%
3.9%
4.2%
3.7%
3.7%
3.9%
3.5%
2.8%
2.3%
2.1%
1.6%
1.4%
1.0%
1.1%
-3.9%
-3.5%
-3.0%
-3.2%
-3.0%
-3.5%
-3.8%
-3.6%
-3.4%
-3.7%
-3.4%
-2.6%
-2.1%
-1.9%
-1.3%
-1.1%
-0.8%
-0.6%
5% 4% 3% 2% 1% 0% 1% 2% 3% 4% 5%
Ages 0-4
Ages 5-9
Ages 10-14
Ages 15-19
Ages 20-24
Ages 25-29
Ages 30-34
Ages 35-39
Ages 40-44
Ages 45-49
Ages 50-54
Ages 55-59
Ages 60-64
Ages 65-69
Ages 70-74
Ages 75-79
Ages 80-84
Ages 85+
Male Female
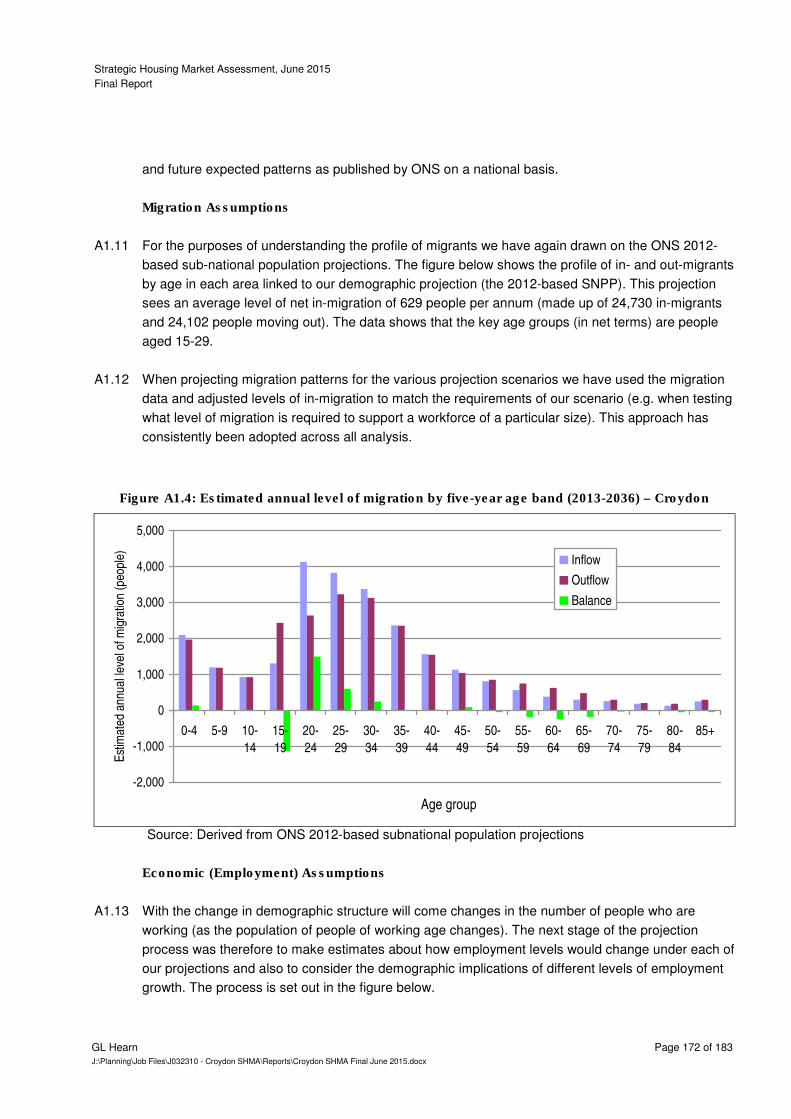
Strategic Housing Market Assessment, June 2015
Final Report
GL Hearn Page 172 of 183
J:\Planning\Job Files\J032310 - Croydon SHMA\Reports\Croydon SHMA Final June 2015.docx
and future expected patterns as published by ONS on a national basis.
Migration Assumptions
A1.11 For the purposes of understanding the profile of migrants we have again drawn on the ONS 2012-
based sub-national population projections. The figure below shows the profile of in- and out-migrants
by age in each area linked to our demographic projection (the 2012-based SNPP). This projection
sees an average level of net in-migration of 629 people per annum (made up of 24,730 in-migrants
and 24,102 people moving out). The data shows that the key age groups (in net terms) are people
aged 15-29.
A1.12 When projecting migration patterns for the various projection scenarios we have used the migration
data and adjusted levels of in-migration to match the requirements of our scenario (e.g. when testing
what level of migration is required to support a workforce of a particular size). This approach has
consistently been adopted across all analysis.
Figure A1.4: Estimated annual level of migration by five-year age band (2013-2036) – Croydon
-2,000
-1,000
0
1,000
2,000
3,000
4,000
5,000
0-4 5-9 10-
14
15-
19
20-
24
25-
29
30-
34
35-
39
40-
44
45-
49
50-
54
55-
59
60-
64
65-
69
70-
74
75-
79
80-
84
85+
Age group
Est
imat
ed a
nnua
l lev
el o
f mig
ratio
n (p
eopl
e) Inflow
Outflow
Balance
Source: Derived from ONS 2012-based subnational population projections
Economic (Employment) Assumptions
A1.13 With the change in demographic structure will come changes in the number of people who are
working (as the population of people of working age changes). The next stage of the projection
process was therefore to make estimates about how employment levels would change under each of
our projections and also to consider the demographic implications of different levels of employment
growth. The process is set out in the figure below.
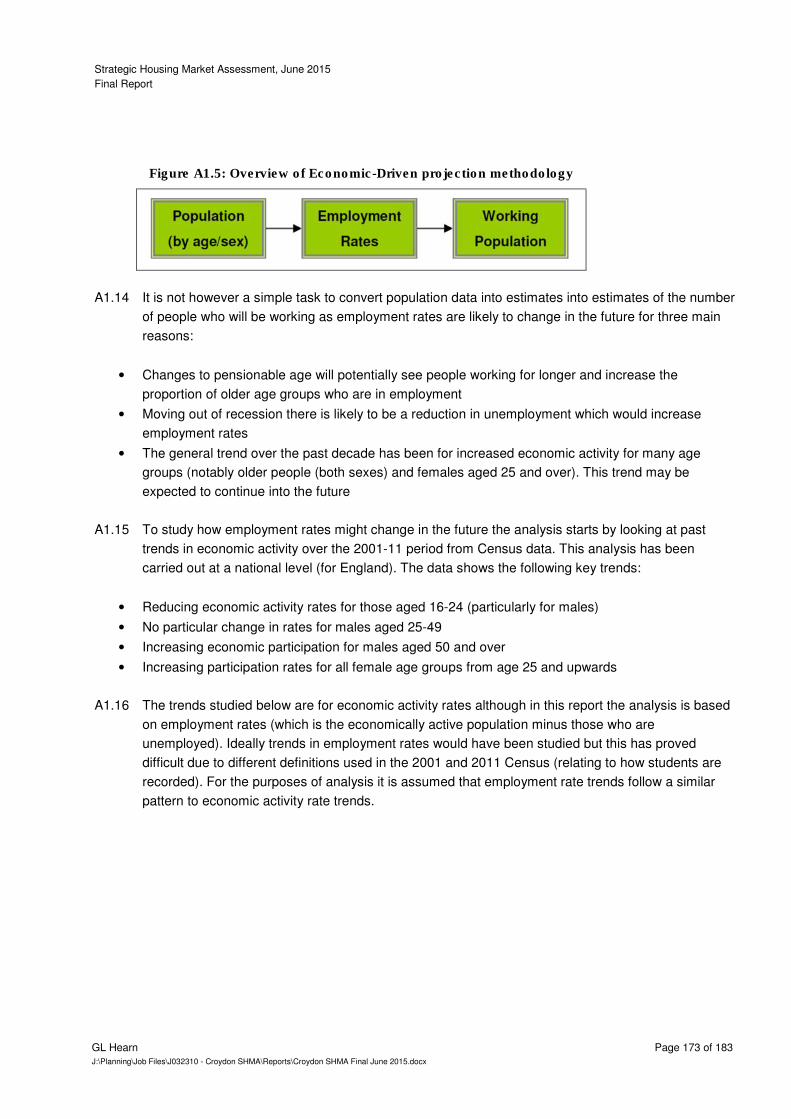
Strategic Housing Market Assessment, June 2015
Final Report
GL Hearn Page 173 of 183
J:\Planning\Job Files\J032310 - Croydon SHMA\Reports\Croydon SHMA Final June 2015.docx
Figure A1.5: Overview of Economic-Driven projection methodology
A1.14 It is not however a simple task to convert population data into estimates into estimates of the number
of people who will be working as employment rates are likely to change in the future for three main
reasons:
• Changes to pensionable age will potentially see people working for longer and increase the
proportion of older age groups who are in employment
• Moving out of recession there is likely to be a reduction in unemployment which would increase
employment rates
• The general trend over the past decade has been for increased economic activity for many age
groups (notably older people (both sexes) and females aged 25 and over). This trend may be
expected to continue into the future
A1.15 To study how employment rates might change in the future the analysis starts by looking at past
trends in economic activity over the 2001-11 period from Census data. This analysis has been
carried out at a national level (for England). The data shows the following key trends:
• Reducing economic activity rates for those aged 16-24 (particularly for males)
• No particular change in rates for males aged 25-49
• Increasing economic participation for males aged 50 and over
• Increasing participation rates for all female age groups from age 25 and upwards
A1.16 The trends studied below are for economic activity rates although in this report the analysis is based
on employment rates (which is the economically active population minus those who are
unemployed). Ideally trends in employment rates would have been studied but this has proved
difficult due to different definitions used in the 2001 and 2011 Census (relating to how students are
recorded). For the purposes of analysis it is assumed that employment rate trends follow a similar
pattern to economic activity rate trends.
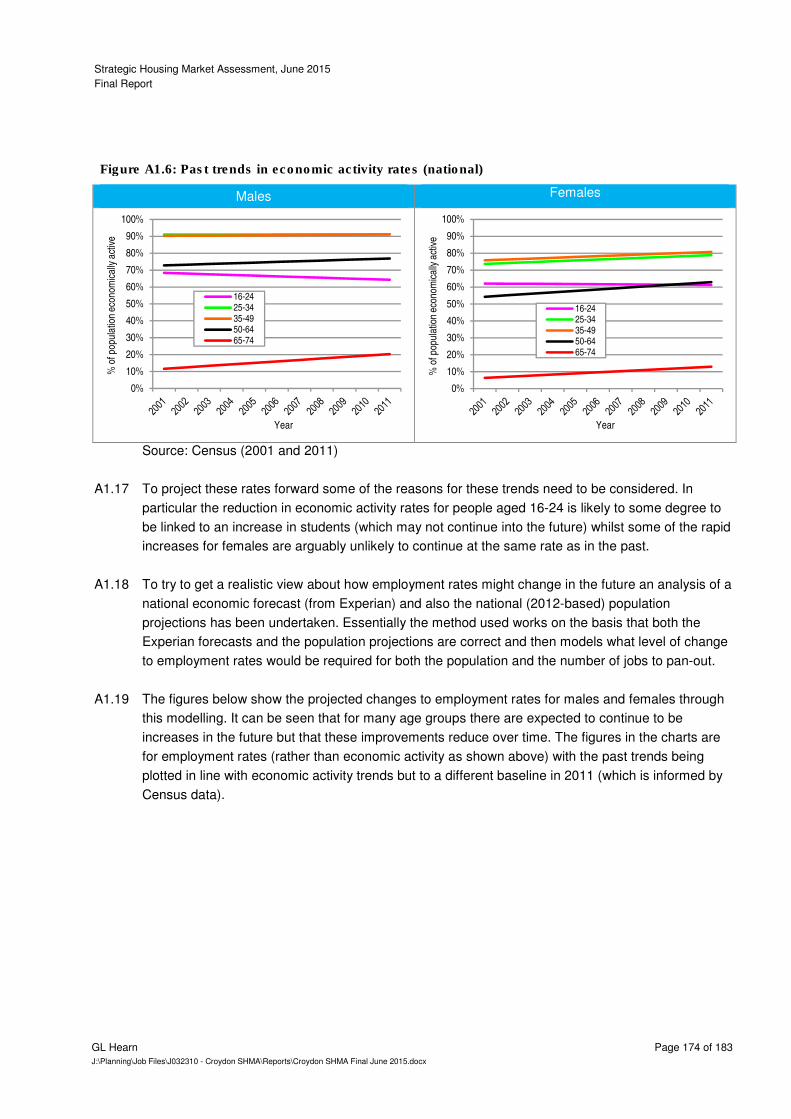
Strategic Housing Market Assessment, June 2015
Final Report
GL Hearn Page 174 of 183
J:\Planning\Job Files\J032310 - Croydon SHMA\Reports\Croydon SHMA Final June 2015.docx
Figure A1.6: Past trends in economic activity rates (national)
Males Females
Source: Census (2001 and 2011)
A1.17 To project these rates forward some of the reasons for these trends need to be considered. In
particular the reduction in economic activity rates for people aged 16-24 is likely to some degree to
be linked to an increase in students (which may not continue into the future) whilst some of the rapid
increases for females are arguably unlikely to continue at the same rate as in the past.
A1.18 To try to get a realistic view about how employment rates might change in the future an analysis of a
national economic forecast (from Experian) and also the national (2012-based) population
projections has been undertaken. Essentially the method used works on the basis that both the
Experian forecasts and the population projections are correct and then models what level of change
to employment rates would be required for both the population and the number of jobs to pan-out.
A1.19 The figures below show the projected changes to employment rates for males and females through
this modelling. It can be seen that for many age groups there are expected to continue to be
increases in the future but that these improvements reduce over time. The figures in the charts are
for employment rates (rather than economic activity as shown above) with the past trends being
plotted in line with economic activity trends but to a different baseline in 2011 (which is informed by
Census data).
0%
10%
20%
30%
40%
50%
60%
70%
80%
90%
100%
% o
f pop
ulat
ion
econ
omic
ally
act
ive
Year
16-2425-3435-4950-6465-74
0%
10%
20%
30%
40%
50%
60%
70%
80%
90%
100%
% o
f pop
ulat
ion
econ
omic
ally
act
ive
Year
16-2425-3435-4950-6465-74
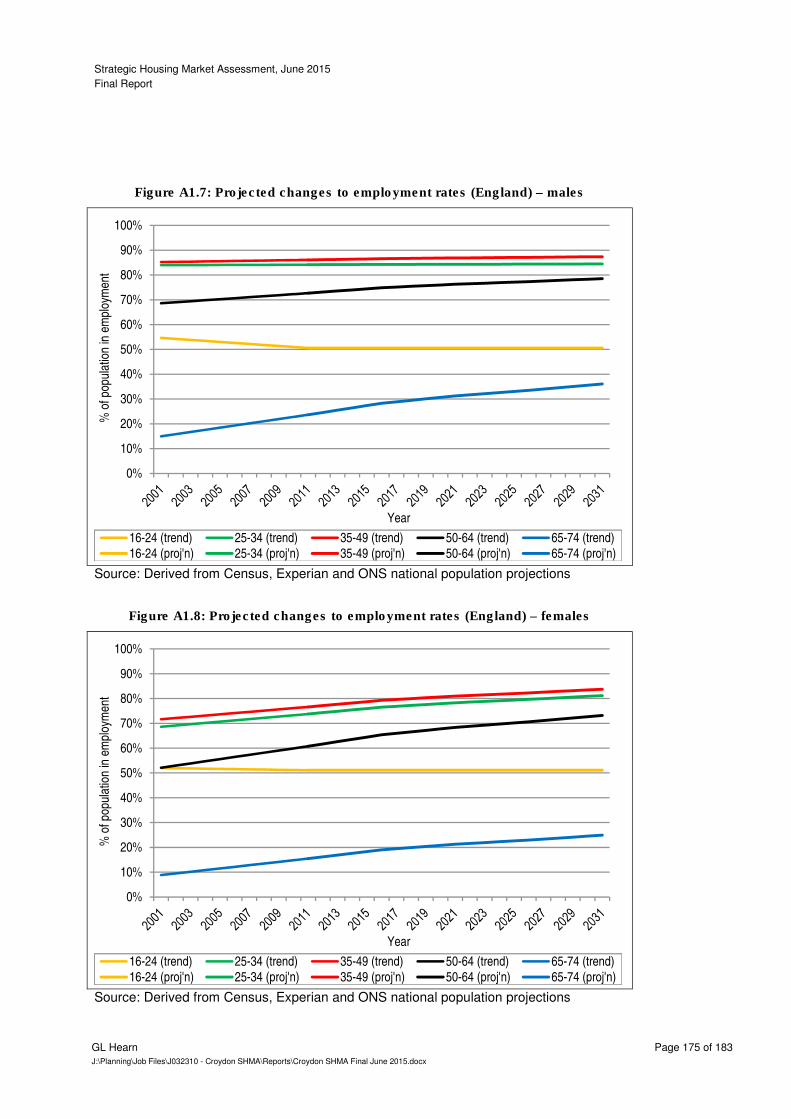
Strategic Housing Market Assessment, June 2015
Final Report
GL Hearn Page 175 of 183
J:\Planning\Job Files\J032310 - Croydon SHMA\Reports\Croydon SHMA Final June 2015.docx
Figure A1.7: Projected changes to employment rates (England) – males
Source: Derived from Census, Experian and ONS national population projections
Figure A1.8: Projected changes to employment rates (England) – females
Source: Derived from Census, Experian and ONS national population projections
0%
10%
20%
30%
40%
50%
60%
70%
80%
90%
100%
% o
f pop
ulat
ion
in e
mpl
oym
ent
Year
16-24 (trend) 25-34 (trend) 35-49 (trend) 50-64 (trend) 65-74 (trend)16-24 (proj'n) 25-34 (proj'n) 35-49 (proj'n) 50-64 (proj'n) 65-74 (proj'n)
0%
10%
20%
30%
40%
50%
60%
70%
80%
90%
100%
% o
f pop
ulat
ion
in e
mpl
oym
ent
Year
16-24 (trend) 25-34 (trend) 35-49 (trend) 50-64 (trend) 65-74 (trend)16-24 (proj'n) 25-34 (proj'n) 35-49 (proj'n) 50-64 (proj'n) 65-74 (proj'n)
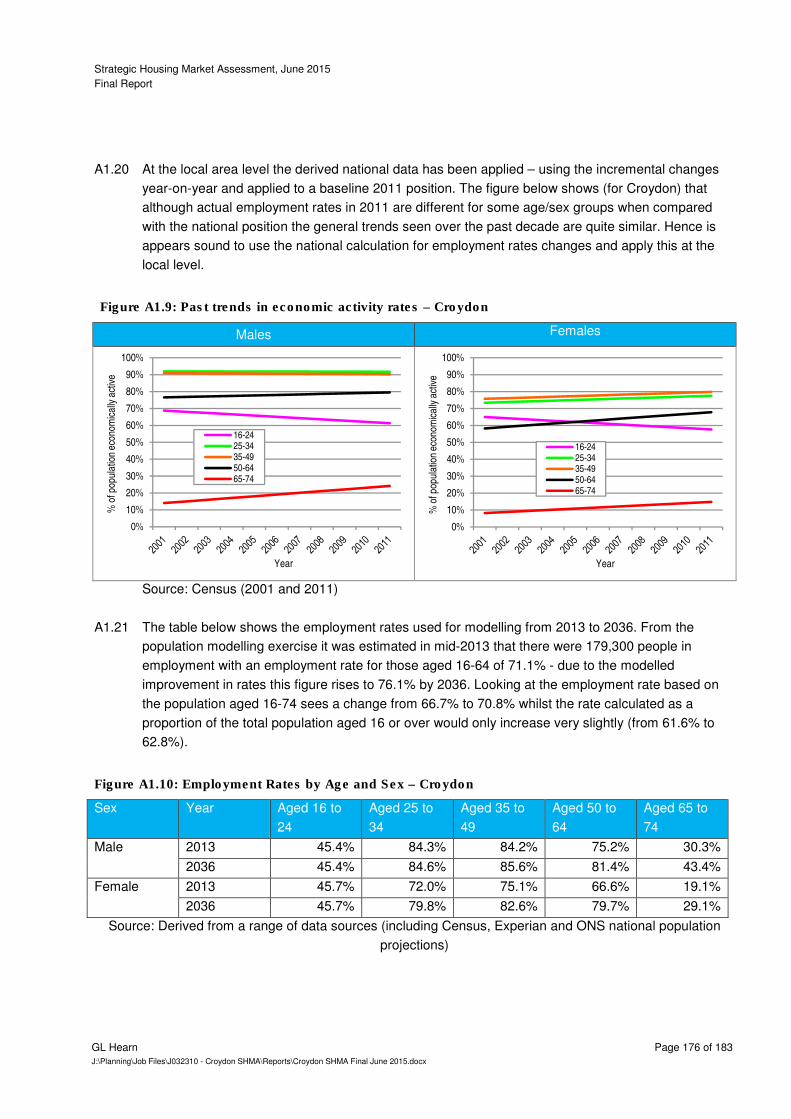
Strategic Housing Market Assessment, June 2015
Final Report
GL Hearn Page 176 of 183
J:\Planning\Job Files\J032310 - Croydon SHMA\Reports\Croydon SHMA Final June 2015.docx
A1.20 At the local area level the derived national data has been applied – using the incremental changes
year-on-year and applied to a baseline 2011 position. The figure below shows (for Croydon) that
although actual employment rates in 2011 are different for some age/sex groups when compared
with the national position the general trends seen over the past decade are quite similar. Hence is
appears sound to use the national calculation for employment rates changes and apply this at the
local level.
Figure A1.9: Past trends in economic activity rates – Croydon
Males Females
Source: Census (2001 and 2011)
A1.21 The table below shows the employment rates used for modelling from 2013 to 2036. From the
population modelling exercise it was estimated in mid-2013 that there were 179,300 people in
employment with an employment rate for those aged 16-64 of 71.1% - due to the modelled
improvement in rates this figure rises to 76.1% by 2036. Looking at the employment rate based on
the population aged 16-74 sees a change from 66.7% to 70.8% whilst the rate calculated as a
proportion of the total population aged 16 or over would only increase very slightly (from 61.6% to
62.8%).
Figure A1.10: Employment Rates by Age and Sex – Croydon
Sex Year Aged 16 to
24
Aged 25 to
34
Aged 35 to
49
Aged 50 to
64
Aged 65 to
74
Male 2013 45.4% 84.3% 84.2% 75.2% 30.3%
2036 45.4% 84.6% 85.6% 81.4% 43.4%
Female 2013 45.7% 72.0% 75.1% 66.6% 19.1%
2036 45.7% 79.8% 82.6% 79.7% 29.1%
Source: Derived from a range of data sources (including Census, Experian and ONS national population
projections)
0%
10%
20%
30%
40%
50%
60%
70%
80%
90%
100%
% o
f pop
ulat
ion
econ
omic
ally
act
ive
Year
16-2425-3435-4950-6465-74
0%
10%
20%
30%
40%
50%
60%
70%
80%
90%
100%
% o
f pop
ulat
ion
econ
omic
ally
act
ive
Year
16-2425-3435-4950-6465-74
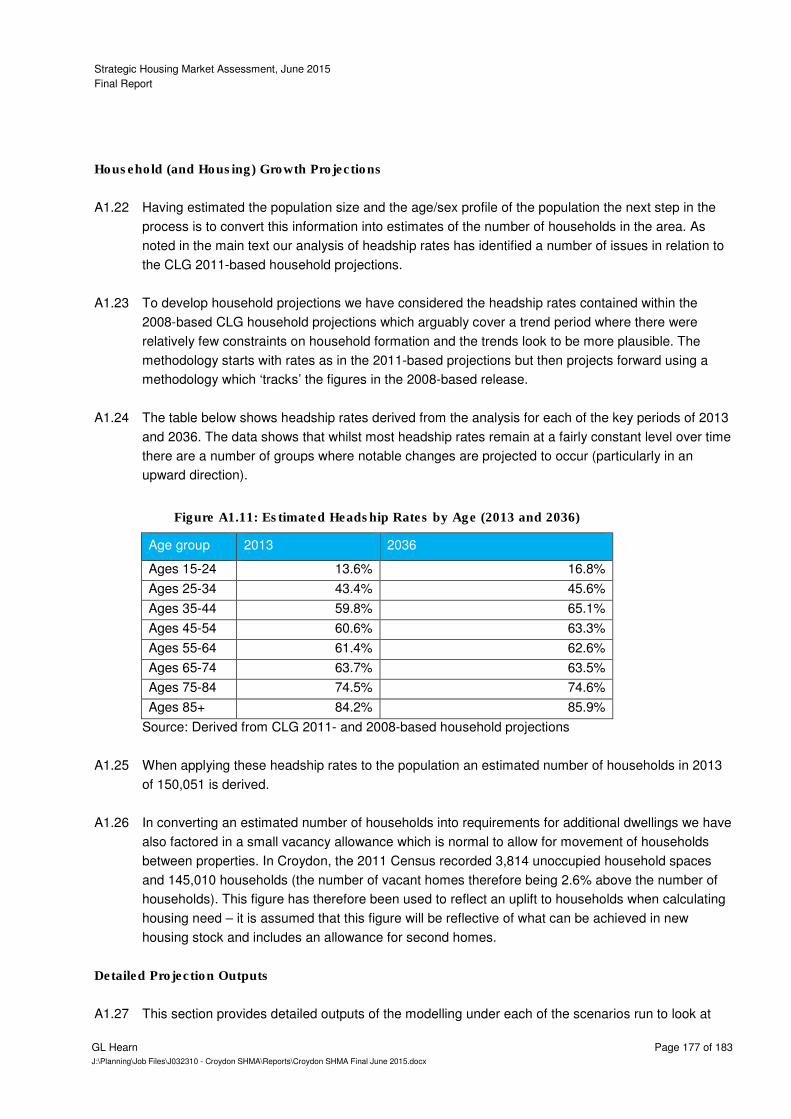
Strategic Housing Market Assessment, June 2015
Final Report
GL Hearn Page 177 of 183
J:\Planning\Job Files\J032310 - Croydon SHMA\Reports\Croydon SHMA Final June 2015.docx
Household (and Housing) Growth Projections
A1.22 Having estimated the population size and the age/sex profile of the population the next step in the
process is to convert this information into estimates of the number of households in the area. As
noted in the main text our analysis of headship rates has identified a number of issues in relation to
the CLG 2011-based household projections.
A1.23 To develop household projections we have considered the headship rates contained within the
2008-based CLG household projections which arguably cover a trend period where there were
relatively few constraints on household formation and the trends look to be more plausible. The
methodology starts with rates as in the 2011-based projections but then projects forward using a
methodology which ‘tracks’ the figures in the 2008-based release.
A1.24 The table below shows headship rates derived from the analysis for each of the key periods of 2013
and 2036. The data shows that whilst most headship rates remain at a fairly constant level over time
there are a number of groups where notable changes are projected to occur (particularly in an
upward direction).
Figure A1.11: Estimated Headship Rates by Age (2013 and 2036)
Age group 2013 2036
Ages 15-24 13.6% 16.8%
Ages 25-34 43.4% 45.6%
Ages 35-44 59.8% 65.1%
Ages 45-54 60.6% 63.3%
Ages 55-64 61.4% 62.6%
Ages 65-74 63.7% 63.5%
Ages 75-84 74.5% 74.6%
Ages 85+ 84.2% 85.9%
Source: Derived from CLG 2011- and 2008-based household projections
A1.25 When applying these headship rates to the population an estimated number of households in 2013
of 150,051 is derived.
A1.26 In converting an estimated number of households into requirements for additional dwellings we have
also factored in a small vacancy allowance which is normal to allow for movement of households
between properties. In Croydon, the 2011 Census recorded 3,814 unoccupied household spaces
and 145,010 households (the number of vacant homes therefore being 2.6% above the number of
households). This figure has therefore been used to reflect an uplift to households when calculating
housing need – it is assumed that this figure will be reflective of what can be achieved in new
housing stock and includes an allowance for second homes.
Detailed Projection Outputs
A1.27 This section provides detailed outputs of the modelling under each of the scenarios run to look at
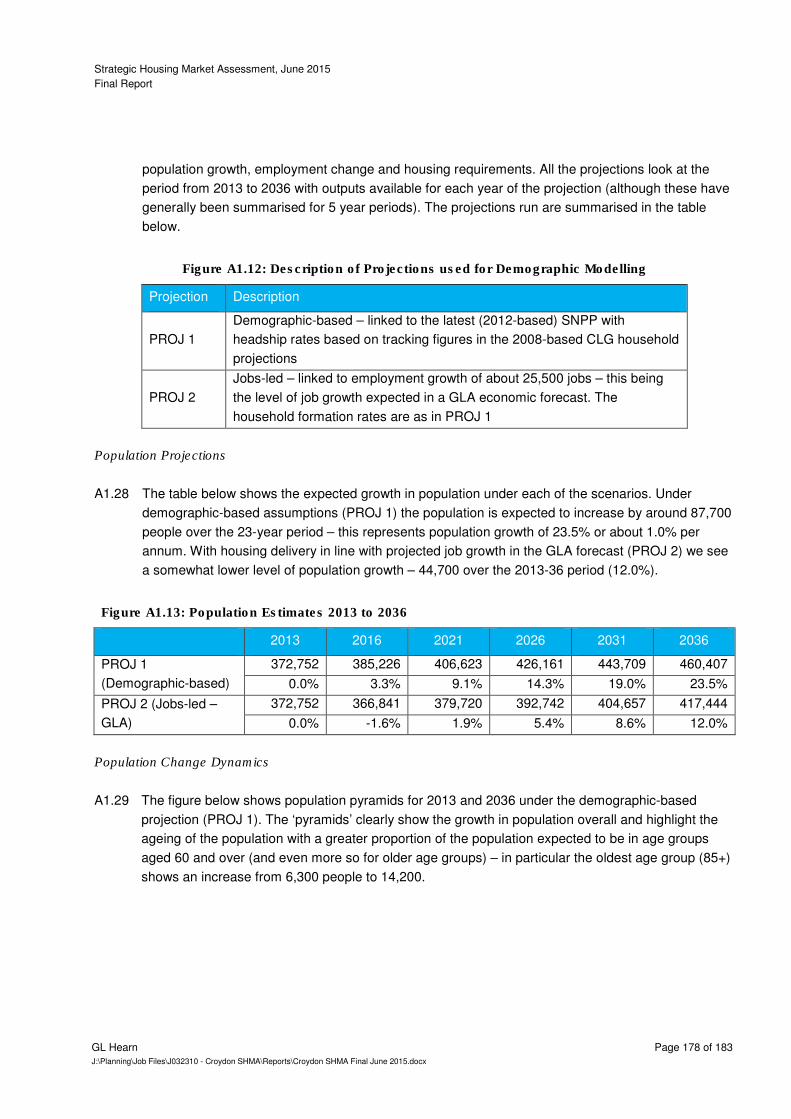
Strategic Housing Market Assessment, June 2015
Final Report
GL Hearn Page 178 of 183
J:\Planning\Job Files\J032310 - Croydon SHMA\Reports\Croydon SHMA Final June 2015.docx
population growth, employment change and housing requirements. All the projections look at the
period from 2013 to 2036 with outputs available for each year of the projection (although these have
generally been summarised for 5 year periods). The projections run are summarised in the table
below.
Figure A1.12: Description of Projections used for Demographic Modelling
Projection Description
PROJ 1
Demographic-based – linked to the latest (2012-based) SNPP with
headship rates based on tracking figures in the 2008-based CLG household
projections
PROJ 2
Jobs-led – linked to employment growth of about 25,500 jobs – this being
the level of job growth expected in a GLA economic forecast. The
household formation rates are as in PROJ 1
Population Projections
A1.28 The table below shows the expected growth in population under each of the scenarios. Under
demographic-based assumptions (PROJ 1) the population is expected to increase by around 87,700
people over the 23-year period – this represents population growth of 23.5% or about 1.0% per
annum. With housing delivery in line with projected job growth in the GLA forecast (PROJ 2) we see
a somewhat lower level of population growth – 44,700 over the 2013-36 period (12.0%).
Figure A1.13: Population Estimates 2013 to 2036
2013 2016 2021 2026 2031 2036
PROJ 1
(Demographic-based)
372,752 385,226 406,623 426,161 443,709 460,407
0.0% 3.3% 9.1% 14.3% 19.0% 23.5%
PROJ 2 (Jobs-led –
GLA)
372,752 366,841 379,720 392,742 404,657 417,444
0.0% -1.6% 1.9% 5.4% 8.6% 12.0%
Population Change Dynamics
A1.29 The figure below shows population pyramids for 2013 and 2036 under the demographic-based
projection (PROJ 1). The ‘pyramids’ clearly show the growth in population overall and highlight the
ageing of the population with a greater proportion of the population expected to be in age groups
aged 60 and over (and even more so for older age groups) – in particular the oldest age group (85+)
shows an increase from 6,300 people to 14,200.
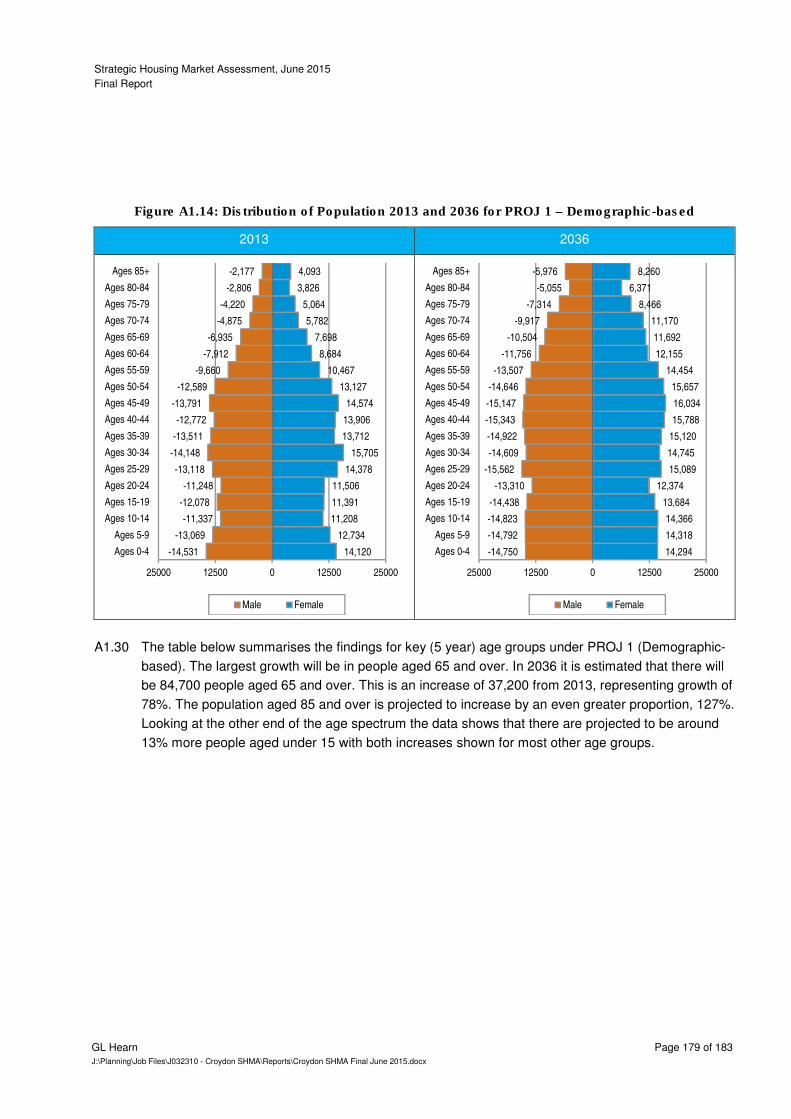
Strategic Housing Market Assessment, June 2015
Final Report
GL Hearn Page 179 of 183
J:\Planning\Job Files\J032310 - Croydon SHMA\Reports\Croydon SHMA Final June 2015.docx
Figure A1.14: Distribution of Population 2013 and 2036 for PROJ 1 – Demographic-based
2013 2036
A1.30 The table below summarises the findings for key (5 year) age groups under PROJ 1 (Demographic-
based). The largest growth will be in people aged 65 and over. In 2036 it is estimated that there will
be 84,700 people aged 65 and over. This is an increase of 37,200 from 2013, representing growth of
78%. The population aged 85 and over is projected to increase by an even greater proportion, 127%.
Looking at the other end of the age spectrum the data shows that there are projected to be around
13% more people aged under 15 with both increases shown for most other age groups.
14,120
12,734
11,208
11,391
11,506
14,378
15,705
13,712
13,906
14,574
13,127
10,467
8,684
7,698
5,782
5,064
3,826
4,093
-14,531
-13,069
-11,337
-12,078
-11,248
-13,118
-14,148
-13,511
-12,772
-13,791
-12,589
-9,660
-7,912
-6,935
-4,875
-4,220
-2,806
-2,177
25000 12500 0 12500 25000
Ages 0-4
Ages 5-9
Ages 10-14
Ages 15-19
Ages 20-24
Ages 25-29
Ages 30-34
Ages 35-39
Ages 40-44
Ages 45-49
Ages 50-54
Ages 55-59
Ages 60-64
Ages 65-69
Ages 70-74
Ages 75-79
Ages 80-84
Ages 85+
Male Female
14,294
14,318
14,366
13,684
12,374
15,089
14,745
15,120
15,788
16,034
15,657
14,454
12,155
11,692
11,170
8,466
6,371
8,260
-14,750
-14,792
-14,823
-14,438
-13,310
-15,562
-14,609
-14,922
-15,343
-15,147
-14,646
-13,507
-11,756
-10,504
-9,917
-7,314
-5,055
-5,976
25000 12500 0 12500 25000
Ages 0-4
Ages 5-9
Ages 10-14
Ages 15-19
Ages 20-24
Ages 25-29
Ages 30-34
Ages 35-39
Ages 40-44
Ages 45-49
Ages 50-54
Ages 55-59
Ages 60-64
Ages 65-69
Ages 70-74
Ages 75-79
Ages 80-84
Ages 85+
Male Female
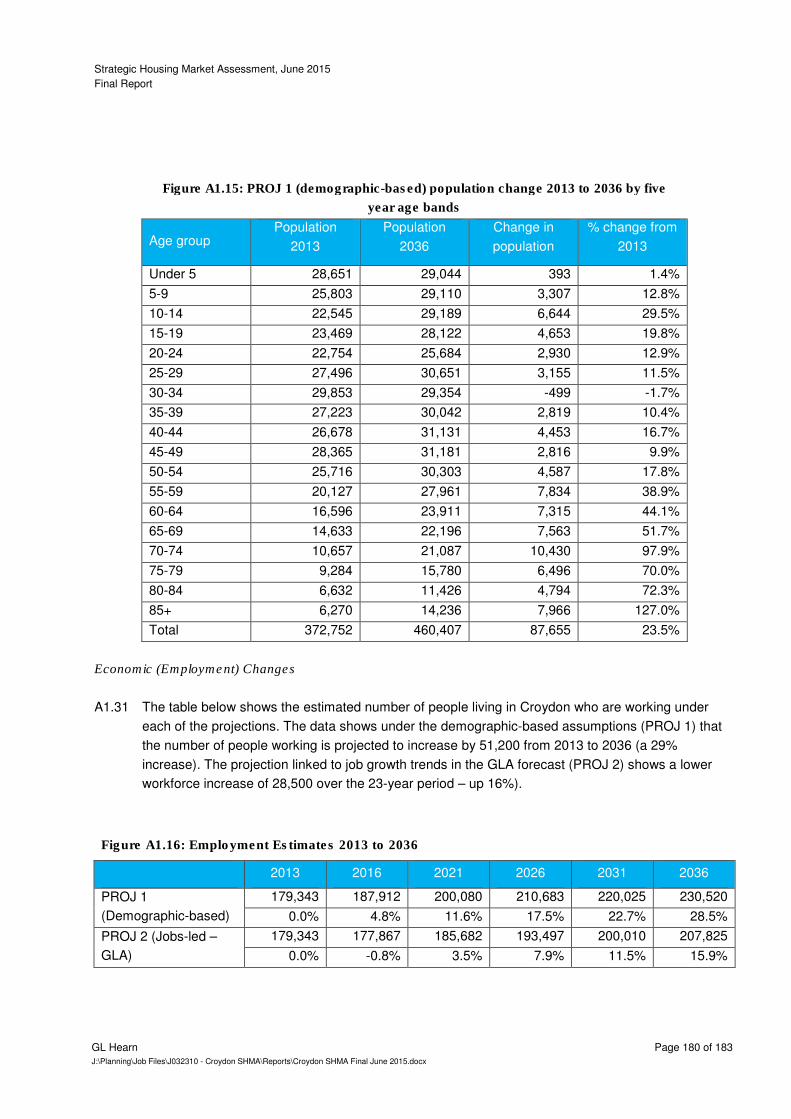
Strategic Housing Market Assessment, June 2015
Final Report
GL Hearn Page 180 of 183
J:\Planning\Job Files\J032310 - Croydon SHMA\Reports\Croydon SHMA Final June 2015.docx
Figure A1.15: PROJ 1 (demographic-based) population change 2013 to 2036 by five
year age bands
Age group Population
2013
Population
2036
Change in
population
% change from
2013
Under 5 28,651 29,044 393 1.4%
5-9 25,803 29,110 3,307 12.8%
10-14 22,545 29,189 6,644 29.5%
15-19 23,469 28,122 4,653 19.8%
20-24 22,754 25,684 2,930 12.9%
25-29 27,496 30,651 3,155 11.5%
30-34 29,853 29,354 -499 -1.7%
35-39 27,223 30,042 2,819 10.4%
40-44 26,678 31,131 4,453 16.7%
45-49 28,365 31,181 2,816 9.9%
50-54 25,716 30,303 4,587 17.8%
55-59 20,127 27,961 7,834 38.9%
60-64 16,596 23,911 7,315 44.1%
65-69 14,633 22,196 7,563 51.7%
70-74 10,657 21,087 10,430 97.9%
75-79 9,284 15,780 6,496 70.0%
80-84 6,632 11,426 4,794 72.3%
85+ 6,270 14,236 7,966 127.0%
Total 372,752 460,407 87,655 23.5%
Economic (Employment) Changes
A1.31 The table below shows the estimated number of people living in Croydon who are working under
each of the projections. The data shows under the demographic-based assumptions (PROJ 1) that
the number of people working is projected to increase by 51,200 from 2013 to 2036 (a 29%
increase). The projection linked to job growth trends in the GLA forecast (PROJ 2) shows a lower
workforce increase of 28,500 over the 23-year period – up 16%).
Figure A1.16: Employment Estimates 2013 to 2036
2013 2016 2021 2026 2031 2036
PROJ 1
(Demographic-based)
179,343 187,912 200,080 210,683 220,025 230,520
0.0% 4.8% 11.6% 17.5% 22.7% 28.5%
PROJ 2 (Jobs-led –
GLA)
179,343 177,867 185,682 193,497 200,010 207,825
0.0% -0.8% 3.5% 7.9% 11.5% 15.9%
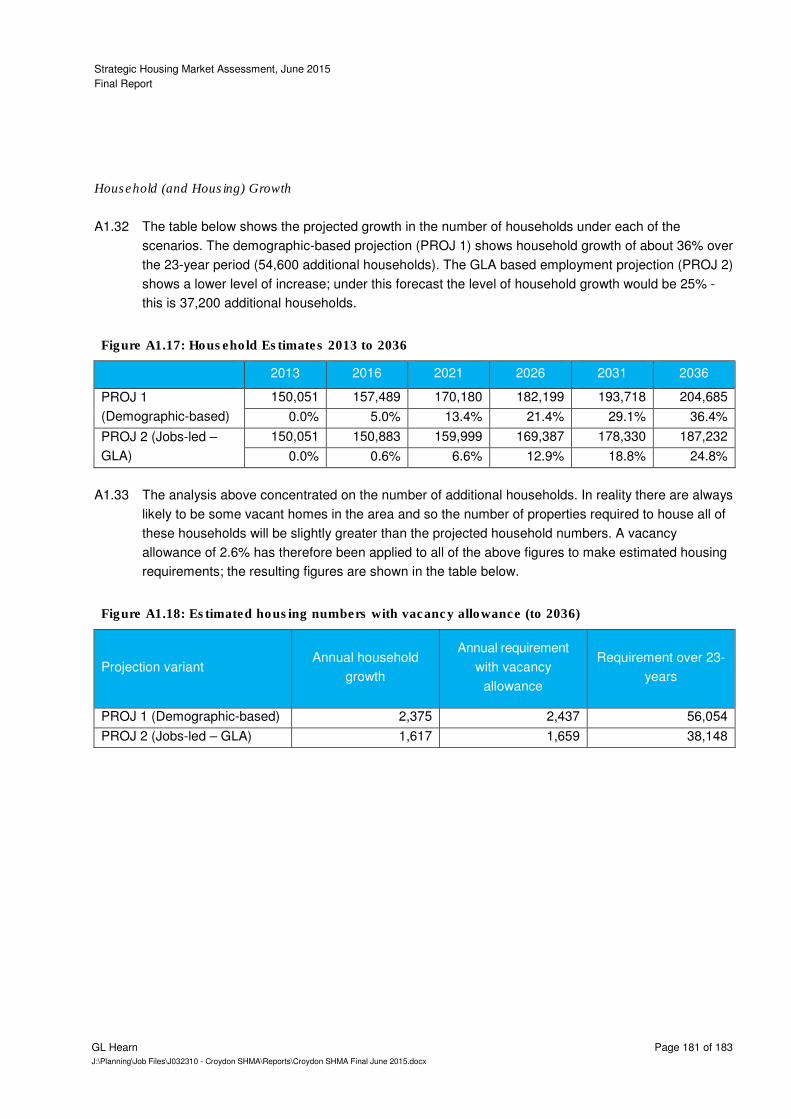
Strategic Housing Market Assessment, June 2015
Final Report
GL Hearn Page 181 of 183
J:\Planning\Job Files\J032310 - Croydon SHMA\Reports\Croydon SHMA Final June 2015.docx
Household (and Housing) Growth
A1.32 The table below shows the projected growth in the number of households under each of the
scenarios. The demographic-based projection (PROJ 1) shows household growth of about 36% over
the 23-year period (54,600 additional households). The GLA based employment projection (PROJ 2)
shows a lower level of increase; under this forecast the level of household growth would be 25% -
this is 37,200 additional households.
Figure A1.17: Household Estimates 2013 to 2036
2013 2016 2021 2026 2031 2036
PROJ 1
(Demographic-based)
150,051 157,489 170,180 182,199 193,718 204,685
0.0% 5.0% 13.4% 21.4% 29.1% 36.4%
PROJ 2 (Jobs-led –
GLA)
150,051 150,883 159,999 169,387 178,330 187,232
0.0% 0.6% 6.6% 12.9% 18.8% 24.8%
A1.33 The analysis above concentrated on the number of additional households. In reality there are always
likely to be some vacant homes in the area and so the number of properties required to house all of
these households will be slightly greater than the projected household numbers. A vacancy
allowance of 2.6% has therefore been applied to all of the above figures to make estimated housing
requirements; the resulting figures are shown in the table below.
Figure A1.18: Estimated housing numbers with vacancy allowance (to 2036)
Projection variant Annual household
growth
Annual requirement
with vacancy
allowance
Requirement over 23-
years
PROJ 1 (Demographic-based) 2,375 2,437 56,054
PROJ 2 (Jobs-led – GLA) 1,617 1,659 38,148

Strategic Housing Market Assessment, June 2015
Final Report
GL Hearn Page 182 of 183
J:\Planning\Job Files\J032310 - Croydon SHMA\Reports\Croydon SHMA Final June 2015.docx
APPENDIX B: Projected household formation rates by age of head of household – Croydon
15-24 25-34
35-44 45-54
55-64 65-74
0
0.05
0.1
0.15
0.2
CLG 2011-basedProjected (2008-based tracking)CLG 2008-based proejctionsCLG 2012-based
0.3
0.35
0.4
0.45
0.5
CLG 2011-basedProjected (2008-based tracking)CLG 2008-based proejctionsCLG 2012-based
0.5
0.55
0.6
0.65
0.7
CLG 2011-basedProjected (2008-based tracking)CLG 2008-based proejctionsCLG 2012-based
0.5
0.55
0.6
0.65
0.7
CLG 2011-basedProjected (2008-based tracking)CLG 2008-based proejctionsCLG 2012-based
0.5
0.55
0.6
0.65
0.7
CLG 2011-basedProjected (2008-based tracking)CLG 2008-based proejctionsCLG 2012-based
0.55
0.6
0.65
0.7
0.75
CLG 2011-basedProjected (2008-based tracking)CLG 2008-based proejctionsCLG 2012-based
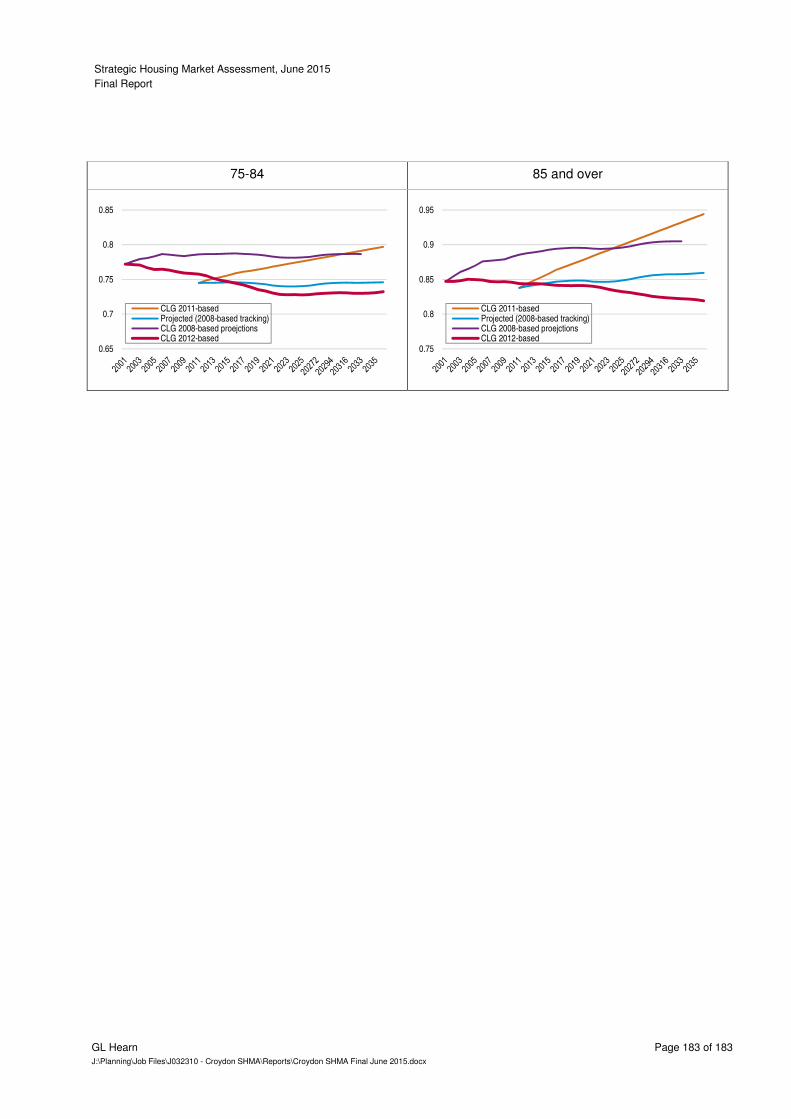
Strategic Housing Market Assessment, June 2015
Final Report
GL Hearn Page 183 of 183
J:\Planning\Job Files\J032310 - Croydon SHMA\Reports\Croydon SHMA Final June 2015.docx
75-84 85 and over
0.65
0.7
0.75
0.8
0.85
CLG 2011-basedProjected (2008-based tracking)CLG 2008-based proejctionsCLG 2012-based
0.75
0.8
0.85
0.9
0.95
CLG 2011-basedProjected (2008-based tracking)CLG 2008-based proejctionsCLG 2012-based


![BOXPARK CROYDON - Bars€¦ · BOXPARK CROYDON. INTRODUCTION [03] THE CONCEPT [05] BXPARKO SHOREDITCH [07] CROYDON [16] BXPARKO CROYDON [20] DETAILS [31] CONTENTs. ELUTIONTH EvO Of](https://img.pdfslide.us/doc/110x75/5f105a3e7e708231d448afca/boxpark-croydon-bars-boxpark-croydon-introduction-03-the-concept-05-bxparko.jpg)