Embed Size (px)
Citation preview

1
Strategic Enrollment Plan
2012-2020
Minot State University
Minot, North Dakota

2
Dear Colleagues and Friends of Minot State University:
The following report and enrollment plan is the result of Higher Learning Commission’s 2008 report of a
comprehensive evaluation visit. The accreditation team cited the need for an enrollment plan that
addresses student recruitment and retention, sets targets, assigns responsibilities, quantifies resource
requirements, and establishes timelines is necessary to stabilize, or grow, overall enrollment.
In 2011, Minot State University hired Noel-Levitz, a strategic planning consulting firm, to assist in the
development of an enrollment manage plan. Representatives from Noel-Levitz made visits to campus to
meet with members of the Minot State University community in October of 2010 and February of 2011.
Dr. Jim Hundrieser, planning consultant, led four on-site visitations throughout the 2011 calendar year.
Dr. Hundrieser first two visits were dedicated to compiling data and conducting situational analyses of all
aspects of recruiting, retention, and marketing. Following the second visit, action strategies were
prioritized, key performance indicators were selected to assess progress, and teams began to develop
action plans per strategy. The third and fourth visits were dedicated to synthesizing data studies, action
planning, and communicating with the campus community.
In January of 2012, Noel Levitz submitted their final report, action planning templates, data summaries,
and enrollment projection to Minot State University. In efforts to synthesize a multitude of strategies with
the report, I have taken the liberty to convert our action strategies from template form and have arranged
the plan in narrative form.
The strategic enrollment management council will oversee the planning phases of action plans,
communicate with the campus as a whole, and assess the progress of each strategy. This plan is designed
to be fluid and stand ready to systemically plan for future needs. New strategies will be selected during an
annual review for assessment.
A lot of hard work has been completed by many members of our campus community in the development
of this plan. However, the meaningful work still lies before us. This plan outlines many important
strategies that will ultimately grow and manage our enrollment. Some strategies are “low-hanging” and
easily achievable. Others may be perched high atop the canopy—this plan will allow us to climb the tree
and pick the fruit that is best for Minot State University and our students.
Respectfully submitted,
Kevin Harmon
Assistant Vice President for Enrollment Management

3
Table of Contents Section 1: Introduction – Rationale and Use of Strategic Enrollment Planning…………………...5 Three Fundamental Components of Enrollment Strategic Planning (SEP)…………………………6 Section 2: Organizational Structure and Procedures for Creating and Implementing the Strategic Enrollment Plan……………………………………………………………………7 Strategic Enrollment Planning Task Force………………………………………………………………………..8 Section 3: Institutional Mission, Vision, and Key Performance Indicators (KPIs)………………..8
Mission .............................................................................................................................................................8 Core Values .....................................................................................................................................................9
Core Purpose ........................................................................................................................9 Core Values ............................................................................................................................9
Great Plains Peers …………........................................................................................................................9 Data Analysis ..............................................................................................................................................10
Section 4: Situation Analysis, Planning Assumptions, and Key Performance Indicators……………………………………………………………………………………………………………………..10
Minot State Situation Analysis .............................................................................................................10 External Environmental Factors .........................................................................................10 Internal Institutional Factors ......................................................................................... ......12
Planning Assumptions…………………………………………………………………………………………………..14 Key Performance Indicators ..............................................................................................................15
Section 5: Strategies for Implementation……………………………………………………………………….15 Section 6: Enrollment Targets, Costs, and Projection……………………………………………………..16
Strategic Enrollment Goals………………………………………………………………………………….16 Enrollment Projections……………………………………………………………………………………….17 Institutional Investments to Implement Enrollment Plan……………………………………..18
Section 7: Monitoring the Plan and Ensuring Implementation………………………………………...19 Strategic Enrollment Management Council…………………………………………………………..19 Monitoring Benchmark Indicators……………………………………………………………………….19
Conclusions………………………………………………………………………………………………………………….19 Recruiting Strategies……………………………………………………………………………………………………20
Financial Aid Promotion Strategies……………………………………….………………………….…20 First Years Promotion Strategies………………………………………………………………………...21 Transfer Promotion Strategies……………………………………………………………………………23
Progress Report: Articulation Agreements………………………………………………………24 Non-traditional Promotion Strategies……………………………………………………………….....26 Native American Promotion Strategies………………………………………………………………..27
International Promotion Strategies……………………………………………………………………...29 Canadian Strategies………………………………………………………………………………………...30
Veterans Promotion Strategies……………………………………………………………………………33 Specific Place Recruiting Strategies……………………………………………………………………..35
Minot…………………………………………………………………………………………………………….35 NW North Dakota…………………………………………………………………………………………..36 Southern and Eastern North Dakota……………………………………………………………….37 Montana………………………………………………………………………………………………………...38
Data Metrics Promotion Strategies……………………………………………………………………...39
4
Com Flow Promotion Strategies………………………………………………………………………….40 Marketing Strategies……………………………………………………………………………………………………..41 Retention Strategies………………………………………………………………………………………………...……45 Roadmaps Promotional Strategies………………………………………………………………………45
Mentors Promotion Strategies…………………………………………………………………………….46 Grad Rates Promotion Strategies………………………………………………………………………...47
Undeclared Promotional Strategies..................................................................................................48 Professional Development Promotion Strategies……...……………….…………………………49 Parent Website Promotion Strategies………………………………………………………………….50 Early Alert Promotion Strategies………………………………………………………………………...51 Experiential Promotional Strategies……………………………………………………………………52 Red Alert Promotion Strategies.……………………………....…….……………………………..……..53
Appendix....................................................................................................................................................................54 Data Summary……………………………………..…………………………………………………………….55 KPIs…………………………………………………………………………………………………………………..62 Data Review………………………………………………………………………………………………………69
Enrollment Target Charts New Freshmen……………………………………………………………………………………………………………..22 New Transfer……………………………………………………………………………………………………………….25 Native Americans………………………………………………………………………………………………………….28 Non-Canadian International………………………………………………………………………………………….29 Canadian………………………………………………………………………………………………………………………30
Saskatchewan………………………………………………………………………….................................31 Manitoba……………………………………………………………………………………………………….31 Alberta…………………………………………………………………………………………………………..32 British Columbia…………………………………………………………………………………………….32
Veterans……………………………………………………………………………………………………………………….34 Ward Co……………………………………………………………………………………………………………………….36 NW North Dakota………………………………………………………………………………………………………….36 NW North Dakota Outside Ward Co……………………………………………………………………………….37 Southern and Eastern North Dakota………………………………………………………………………………37 Montana……………………………………………………………………………………………………………………….38

5
Strategic Enrollment Plan Minot State University, Minot, North Dakota
Section 1: Introduction – Rationale and Use of Strategic Enrollment Planning
In spring 2011, Minot State University launched a strategic planning process. The goal of this process
was to create a comprehensive enrollment plan to sustain and grow enrollment of undergraduate students.
The planning team appreciated the need to that graduate enrollment also needs a plan, but determined,
with cabinet level support, that the focus of this plan will be on increasing undergraduate student
enrollments offered on the main campus, satellite campuses, and through online enrollment and programs.
On-campus enrollment has been on a downward track for several years, only partially offset by the
increases in online course enrollment. At Minot, online enrollment encompasses not only traditional
online degree programs, but also a robust offering of online courses open to all undergraduate students.
While the university has done excellent work laying the foundation for its future and vision, much more
effort and focus are needed on enrollment management planning and strategies. The newly added Dean of
Enrollment Services position, filled by an internal candidate familiar with the University, shows both
promise and intentionality. However, a comprehensive enrollment management plan that addresses
student recruitment and retention, sets targets, assigns responsibilities, quantifies resource requirements,
and establishes timelines is necessary to stabilize, or grow, overall enrollment. It is understood that this is
a living plan and that updates and prioritization needs to occur annually to match a quickly changing
demographic in the Minot and North Dakota region. For example, all state and national data show
declines in high school graduates, yet, Minot and other neighboring areas have had tremendous
population increases due to the strong economic conditions bringing people (and families) to North
Dakota. No current data supports that this growth will reverse trend data available. The strategic
enrollment management council must continue to monitor these trends and align strategies set forth within
the plan or reprioritize strategies set forth in the plan as conditions may change.
As we look at the national data, according to leading higher education experts (e.g., Keller, 2008; Shapiro,
2005; and Kerr, 2001), as well as conclusions in recent national reports on trends and issues in higher
education (e.g., Knocking at the College Door [Western Interstate Commission for Higher Education
(WICHE), 2008]; America’s Perfect Storm: Three Forces Changing Our Nation’s Future [ETS, 2007]; A
Test of Leadership: Charting the Future of U.S. Higher Education [U.S. Department of Education,
2006]), America’s institutions of higher education are in the “midst of a perfect storm.”
During the 2010-11 academic year, many Minot State institutional leaders participated in two retreats.
These retreats focused on The Chronicle of Higher Education 2009 reported entitled The College of
2020. These retreats facilitated an enhanced awareness of the importance of retention in providing for the
overall fiscal health of the institution as well as the shifting demographic from traditional aged students to
an older aged student. Minot is well positioned to serve this slightly older population and in many ways
already is serving this population. The report also shaped numerous conversations related to growth of
online tools and services needed to support a growing on-line student population. To date, Minot State
now offers nine online degree programs with plans to provide a tenth program as soon as approval is

6
received. Additionally, 2350 students enrolled in at least one online course during the 2010-11 academic
year. As stated below, one of Minot State’s key strategies is to provide seamless services for all students.
This strategy, while planned to support all students, is geared to support the further development and
enhancement of tools and services needed for students enrolling at satellite sites and through online
programs.
North Dakota bucks some of the national downward trends, as it is currently in a particularly interesting
period of economic boom. Western North Dakota is experiencing dramatic increases in income through
service, oil, and geothermal sectors. Despite the economic boom and very low unemployment rate (almost
0 percent), demographic shifts for the next ten years show a decrease in the number of high school
graduates (traditional-aged college-seekers). For the next five years, all border states to North Dakota also
show a decrease in high school enrollments. Additionally, market trends show a decreased interest in
traditional academic delivery mode.
Competition remains and will continue to be very challenging for Minot State University (MSU) to reach
its long-term aspirational enrollment goals requiring aggressive strategies to maintain current enrollment
rates. This maintenance and potential growth will require continued partnership and expansion of satellite
or online programs to supplement the traditional program offerings at the main campus. Additionally,
despite increases in the campus admissions standards at entrance, campus data provide evidence of an
increasing gap in levels of preparedness. Overall, students are prepared for college-level work, but
demonstrate a deficiency in one or two subject areas limiting their longer term achievement as
demonstrated by declining graduation rates. As Minot prepares to identify strategic priorities to 2020, this
plan serves as a support document comprised of action-related strategies and tactics to ensure future
success.
Strategic Enrollment Planning (SEP) may be defined as an integrated, information-based, and ongoing
process that involves the campus in identifying, prioritizing, implementing, evaluating, and modifying
enrollment goals and strategies, and that effectively and efficiently:
Ensures the realization of the institutional mission and vision;
Represents a systems approach that integrally links planning, budgeting, and assessment;
Builds on the institution’s competitive advantage (i.e., maximizes institutional distinctiveness and
internal strengths, taking advantage of external environmental opportunities while mitigating the
effects of any internal challenges or external environmental threats) and addresses the changing
higher educational marketplace and environment;
Enhances the institution’s ability to attract and retain students and to meet students’ needs and
expectations, both currently and in the future; and
Embodies a continuous process of improvement, which is part of an ongoing, sustainable process that
is routinely refined and updated.
Indeed, campus institutionalization of SEP, which is designed to enable Minot State’s decision-makers to
learn and act faster than its competitors, may actually constitute one of the university’s main sustainable
competitive advantages.
Three Fundamental Components of Enrollment Strategic Planning (SEP)
The SEP process is composed of three fundamental components:
1. Creation of the plan, which focuses on “doing the right things” through identifying what is most
needed and prioritizing activities/programs/initiatives that will ensure success (premised on an
understanding of how the institution is characterized, differentiated, and competitively positioned
with a clear sense of what it does well, what it does not do well, and what it wants to become);

7
2. Implementation of the plan, which focuses on “doing things right” through employing the best
methods/procedures to accomplish enrollment goals and what the institution wants to become
(premised on an understanding of how the institution optimally functions as a coordinated system
with maximum campus involvement and engagement, shared leadership, and commitment to
educational excellence and institutional effectiveness); and
3. Institutionalization and systemic integration from a planning mode to a management mode of
operation, which focuses on an ongoing commitment to improvement by making strategic
enrollment management (SEM) part of the university’s routine planning structures. This ensures that
SEM continually informs and refines the university’s marketing tools and communication
approaches and improves operational effectiveness and efficiency of recruitment and retention
initiatives. Furthermore, SEM will inspire discussions surrounding curricular and co-curricular
innovations and state-of-the-art practices that meet or exceed students’ expectations (premised on an
understanding and appreciation of a university as a learning organization where all members
collectively learn and contribute to institutional improvement and student success).
From an institutional perspective, Minot State defines Strategic Enrollment Management (SEM) as an
integrated, information-based, and ongoing process focused on recruitment-, marketing-, and
persistence/completion-related strategies and goals. These enrollment goals and strategies seek to
effectively and efficiently:
Align with Minot State’s mission and vision;
Represent a systems approach that integrally links planning, budgeting, and assessment;
Build on MSU’s strengths (i.e., maximize institutional distinctiveness and internal strengths, taking
advantage of external environmental opportunities, while mitigating the effects of any internal
challenges or external environmental threats);
Seek to maintain new admissions standards while understanding the diversity of needs today’s
students bring with them to the campus (virtually or onsite);
Embody a continuous process of improvement which is part of an ongoing, sustainable process that is
routinely refined and updated; and
Focus more on growing enrollments in two ways: first through newly entering students (transfer or
new to college) and secondly, and perhaps more importantly, through improvements made in
persistence and degree completion rates while maintaining academic rigor, quality instruction, and
active student engagement.
The strategic enrollment planning task force identified numerous opportunities for growth and
enhancement presented in the following plan. In a future state, the task force also agreed that more needs
to be done to link SEM efforts with academic program offerings and introduction and/or elimination of
programs. New program launches (regardless of site) or significant redesigns need to integrate SEM with
these academic planning efforts. Currently academic initiatives do not link to any marketing, market
research, recruitment, or persistence to completion activities and thus programs are created or launched
with no integrated marketing and recruitment plans to attract students.
Section 2: Organizational Structure and Procedures for Creating and Implementing the Strategic Enrollment Plan
In spring 2011, Dean Kevin Harmon called for the creation of a strategic enrollment plan. This plan,
supported by a mandate from the Higher Learning Commission, is geared to focus on recruitment-,

8
marketing-, and retention-related efforts for students enrolled at the main campus as well as students
enrolled at satellite sites and online. The SEP task force is charged to:
Prepare for a changing environment with an enrollment plan that will fulfill Minot’s long-term goals.
Identify a shared set of overall enrollment goals and goals by key subpopulations.
Gather and evaluate relevant internal and external data that will reveal the optimal strategies and
actions to be included in the plan.
Recommend to the president a system to ensure Minot remains focused on enrollment management
through the creation of a strategic enrollment management council.
At the center of the planning organization is the strategic enrollment planning team. This team will lead
the process and champion the efforts. This working group activity includes the following:
Review data, past reports and PowerPoint presentations, and other materials related to the working
group’s charge.
Use the situation analysis, planning assumptions, key performance indicators, and Vision 2013 to
brainstorm specific action items/tactics that could be completed to meet the plan’s objectives.
Strategic Enrollment Planning Task Force
Kevin Harmon – Dean of Admissions (Chair)
Dr. Lenore Koczon, Provost
Dr. Kris Warmoth, Dean of CEL
Holly Major – Director of TRIO
Beth Odahelen – Director for the Center for Teaching and Learning (CETL)
Lynda Bertsch – Director of Student Success
Teresa Loftesness – Director of Marketing
Cari Olson – Director of Institutional Research
Dr. Erik Anderson – Faculty (Music)
Eric Bonness – Associate director of admissions
Kristen Wood – Transfer/Articulation advisor
Rebecca Porter - Registrar
Section 3: Institutional Mission, Vision, and Key Performance Indicators (KPIs)
This strategic enrollment plan is driven by Minot State University’s mission, core values, and vision, as
well as the university’s strategic plan . As a state public institution, the university is under a mandate to
achieve state goals and legislative mandates, as well as work in harmonious partnership with the North
Dakota University System, all of which have also been taken into account in the SEP process.
Mission
Minot State University is a regional, public institution located in the northwest region of North Dakota,
serving students from Minot, the region, state, nation, and other countries. Undergraduate and graduate
courses and programs are offered on campus and at a distance, through face-to-face, online, and
alternative modes of delivery. Non-credit and professional training and experiences are offered to students
and community members.

9
Committed to high academic standards and professional support for students, the university is dedicated
to student success, engaged and life-long learning, advancement of knowledge, effective student service,
and development of students of character. These commitments are grounded in effective and motivated
teaching and learning, scholarship, and service. General studies and a variety of programs are offered in
the arts and sciences, business, education, and health sciences. A wide range of student support services is
provided to on-campus and off-campus students.
The university values critical and creative thinking, vitality of communities and cultures, stewardship of
place, and the multicultural and global environment. The university honors and supports the dignity and
rights of diverse individuals, freedom of expression, academic freedom, ethical and moral behavior,
integrity, fairness, and honesty. Minot State University is first and foremost dedicated to the success of all
students: their growth and development as educated citizens, their confidence, and their life-long devotion
to the common good and the welfare of others.
Core Values
Core values are deeply imbedded in the minds of the people who serve and sustain the institution and are
readily recognized and appreciated by those served by the institution. Planning for the future depends on
the affirmation of Minot State University’s core values and core purpose. Minot State University is built
upon a core commitment to students, learning, service, and cooperation, and upon a respect for people and
place.
Core Purpose
Minot State University helps people appreciate life and learning and contribute meaningfully to the lives
of others.
Core Values
MSU cares deeply about its students, their learning, and their growth. The university is proud of its values
and long-term commitment to:
Teaching and learning with excellence, integrity, and engagement;
Serving students and others respectfully and responsibly;
Following high ethical and moral principles; and
Supporting the values of community and place, where all community members are valued and
respected for their work, contributions, and freedom of expression.
Great Plains Peers
The university seeks to become a premier, nationally recognized university. In doing so, the institution
created benchmarks by identifying Great Plains aspirant institutions. These institutions have a strong
regional presence throughout the Midwest and, as they seek to build a national and international presence,
Minot State plans to do the same. Key performance indicators used in the Great Plains comparison will be
the focus of the SEP project and include comparisons of retention and graduation rates, entering student’s
academic preparedness, and levels of selectivity. Additionally, performance indicators include athletic
membership and overall enrollments.
The goal of the SEP process is to aid the institution’s aspirations to become one of the premier public,
regional universities in the “great” Great Plains. Additionally, this project will work to support increases
in US News & World Report Rankings that are linked to enrollment management (recruitment,
marketing, retention/persistence, and completion).

10
Data Analysis
The process begins with a careful and thorough review of available data. The goal of the planning process
is to be data-informed and use data to understand the current state, the potential for the desired state, and
formulate strategies based on data to create enrollment goals. It should be noted that Minot has recently
added several new resources to its institutional research area. As such some longitudinal data was not
available to the planning team, but will begin to be collected as the University moves from planning to
manage the plan.
Section 4: Situation Analysis, Planning Assumptions, Key Performance Indicators
Minot State Situation Analysis
Minot State University is poised to move in a variety of directions related to enrollment. The current
strategic plan calls for a growth in enrollments. As the campus considers updating its strategic plan, the
Strategic Enrollment Planning Team has conducted a comprehensive review of the data to consider future
enrollment projections and goals. In general, three main themes pervaded the data discussion. The first is
the implications from a decrease in first-time full-time high school graduating population through 2020.
This decrease in high school graduates forces the University to increase enrollment practice strategies to
maintain current enrollments or expand adult, graduate, and remote site delivery. Second, employment
trends dictate a split in the need for college-level employment. In the short-term, North Dakota state and
national predictive models show an increase in low- and high-income jobs neither of which requires any
college-level degrees. Longer-term projections demonstrate a need for 70 percent of the work force to
need some type of associates, bachelor’s, or advanced degree by 2025 (Lumina Foundation, 2010). This
need demonstrates an opportunity for adult learners to either start and finish or complete their degree. The
North Dakota System has also seeking to build new systems that support previously enrolled students
who have completed 90 or more credit hours at any NDSU institution to complete their degree. Minot is
actively partnering with NDSU to support this effort. The last major theme found through the research
review was a need to focus significant resources towards improving the University graduation rate. At the
current rates (low to mid 30 percent), the University has launched several initiatives to support first- to
second-year completion rates. Several initiatives have been launched to support traditional-aged students
from entry to graduation. A review of all internal data supports large gaps between entrance and
completion for almost every major and few efforts being implemented to support students who are
enrolled in nontraditional-type programs. While support efforts will aid efforts to increase efforts, the
planning process did not include strong engagement from the academic program leaders. Best practice
data demonstrates the real opportunity for increased persistence is through stronger academic advising,
clear pathways towards degree through clear and comprehensive course management systems, and
increased supplemental support. These are beginning to be addressed through the new Provost.
External Environmental Factors
External Opportunities
Seventy-two percent of students who graduate from a North Dakota high school attend a post-secondary
education institution. A major percentage of those students attend a North Dakota college or university.
Of those graduates who do not enroll in a North Dakota institution, 17 percent enroll at an institution in
Minnesota and 2 percent attend an institution in South Dakota. North Dakota attracts 5.6 percent (1,895
actual students) of Minnesotans to North Dakota and 3 percent (187) of Montana students. Interestingly,
South Dakota has more students attending institutions in Minnesota and Nebraska than North Dakota.
These data combined with Minot State’s price is an opportunity. When examining affordability, U.S.
Census data show the average North Dakota family has a strong ability to pay for Minot State tuition at its
current cost. In fact, more (above half) American families have the ability to pay for Minot State at its
current price structure, particularly when adding in Pell grants. Minot is very affordable for students who

11
are from out-of-state. In examining the types of major interests and job opportunities, MSU provides the
majority of majors aligned with expected job growth within the state and region. In fact, there is a larger
need for education, management, health care, and computer specialties majors (students) than there is
interest. Through aggressive marketing and advising efforts, Minot State University faculty, advisors, and
success center staff should push students to explore these majors to support job needs within North
Dakota.
The university seeks to become a premier, nationally-recognized university. In doing so, the institution
created benchmarks by identifying Great Plains aspirant institutions. These institutions have a strong
regional presence throughout the Midwest. The data suggests Minot State University has an opportunity
to build a national and international presence. This will only happen through an aggressive and intentional
marketing and recruitment plan supplemented by a dynamic retention and student housing plan to further
engage these students upon arrival.
External Challenges
Data provided through comparison of Great Plains peer institutions show graduation, retention, and all
other benchmark comparisons determined by the institution using US News and World Report are below
peers, a fact known for many years throughout campus. Of particular interest is the fewer number of
students who are Pell eligible. This means more students attending Minot State University have the ability
to pay to attend college than Great Plains peers. Also of note was that while MSU provides very low in-
state tuition compared with peer in-state tuition, the average net cost per student is higher at Minot State
than Great Plains peers. Out-of-state tuition costs make MSU much more affordable and could provide a
competitive advantage as students seek Minot because of growing business opportunities within the
region. However, freshman attitudes data suggest that student interest to attend institutions more than 150
miles from home is less than 20 percent of the entire applicant pool. Given Minot’s location, attracting
out-of-state students will continue to be a challenge.
North Dakota significantly exceeds the national average in percent of students who graduate from high
school (81 percent compared to 60 percent national). Additionally, ACT data report that compared to
national averages of all students who attend college, nationwide ACT scores are slightly above average
for all college sub-test scores. Only 24 percent of college-bound students from North Dakota meet all four
ACT sub-test scores for preparedness, with science areas showing the lowest level of preparedness. Minot
State has a strong national and international reputation for its science program; yet, marginal support
systems that have lower science abilities, but are interested in sciences. The institution has a partnership
with Dakota College at Bottineau that can provide remedial courses. Initial data review suggests many
students may not be in need of remediation, but need additional tutorial or academic support in the
science areas. Further challenge exists in the institution’s mission to support students from more diverse
backgrounds. All North Dakota minority students (Native-American, Hispanic, Black, etc.) are below
national averages in college attendance and in college completion rates. Of particular challenge is that
only 11 percent of Native-Americans who started high school completed a high school degree in North
Dakota. Of those who do finish a high school degree, almost no students would meet the new admission
criteria for acceptance into Minot State.
In terms of ACT scores sent to universities, Minot State receives the fourth largest number of test scores
from North Dakota ACT test-takers, very closely followed by North Dakota State College of Science and
Minnesota State University Moorhead. Only 224 of the 2010 test-takers reported MSU as their number
one choice of attendance. This places a higher need to increase marketing efforts to the other 420 students
who send their test scores to MSU and a need to increase the number of test takers who express an interest
in Minot State.

12
Internal Institutional Factors
Recruitment and Marketing
Minot State University has numerous opportunities to enhance its enrollments. The first opportunities
exist through the refinement of recruitment practices including increased communications and systems to
connect with prospective students. Current systems are more of a general approach. MSU has invested in
a Customer Relation Management (CRM) provided through Hobsons. This system will allow the
Admission Office to build a robust communication system with students who inquire or are identified
through stratified name purchases. This new system will move towards a streamlined and targeted
approach to connect prospective students quickly and accurately with the information and resources
needed to demonstrate Minot State is the right institution for them. Second, the institution has financial
aid resources to support students in need, but does not leverage its financial aid packages to compete with
other institutions or compete for out of state students. Current systems within the financial aid office do
not calculate or estimate the role financial aid leveraging plays in helping the office of admission meets
its recruitment goals. These systems must become aligned to maximize institutional dollars spent when
enrolling students. Data suggests less than half of MSU students are Pell eligible (meaning a stronger
ability to pay for college compared to other institutions). Current financial aid model also do encourage
long-term (i.e., stay until graduation) enrollment. Third, the institution is a vibrant part of the Minot
community. Local employers are seeking more opportunities to partner with the University to provide
internships or practicum experiences. Fourth, national data suggest adults are looking for more flexible
options to complete their degree and Minot State offers some flexible options.
The University, through the Center for Extended Learning, has creatively added numerous online courses
in addition to providing nine full-time undergraduate programs. These programs serve a growing adult or
older-student market. With an average student age of 23, Minot is shifting from a “traditional” (ages 18-
22) campus to a campus that is serving a learners of a various ages through a variety of delivery means.
Through face-to-face, online, hybrid, and off-campus sites, Minot is serving the state at a variety of
centers. The enrollments at centers vary, and additional resources need to be added as well as additional
online programs to support the growth and need for even more flexibility in course delivery. Additionally,
the University could add an online Criminal Justice major by adding or converting two face-to-face
classes to online classes. This major shows growth opportunities and should be offered in this format,
particularly given the data which suggest active military interests in this major. Academic leaders are also
completing a review of academic programs with the goal of prioritizing programs for growth. This
analysis will allow the admissions team to further target students and increase advertising and marketing
efforts to attract students to programs with room to grow. In reality, almost all programs have room to
grow. Minot’s current faculty ratio is 14 to 1. For a mid-size institution, class size average should be
about 20-22 to 1.
The campus has begun an aggressive articulation agreement process. This will open the doors for many
potential transfer students by specific academic program. Many more articulation agreements need to be
completed. The Admissions Office has established a strong protocol to create these agreements, and this
process needs to continue to be expanded to create more agreements.
Additionally, the University is working to update the Web site, update its branding efforts, and seek new
ways to further engage students. Analytics need to be created and reviewed to identify individual visitors,
pages visited, and an understanding of what potential students (often not in our list of prospective
students) are visiting. The admission team is creating a communications flow for students with whom
they are not actively communicating. These “secret shoppers” or “stealth applicants” are a growing trend
and the web site must relay information to them which would normally be delivered through the CRM
system. Web pages need to be crisp, clean of clutter, and tell students from the initial search why they
should consider Minot and the strengths and outcomes of each major.

13
Retention/Graduation
The institution has realized the need to boost efforts to increase first-to-second and second-to-third year
retention rates, and four-, five-, and six-year graduation rates. The University has received a Title III
grant. This grant focuses on improving overall institutional efforts to increase retention and graduation
rates through advanced student success-related practices. A TRIO grant has also been obtained to focus
on first-year and first-time, full-time, higher ability first-generation students. The data suggest all of these
initiatives are moving to advanced best-practice strategies. However, these current efforts are for a small
part of Minot’s overall enrollment. While all efforts are to be commended, there is a gap in the institutions
efforts to increase persistence and completion of all students enrolling through the Passport program or at
the off-site programs. For example, the Title III grant calls for every student to have three types of
engagement during their academic experience. This is an excellent goal, but this goal currently focuses
only on first-time, full-time students enrolled at the main campus. First-time, full-time traditional students
make up a smaller proportion of Minot’s future state and more work needs to be done to support adults,
transfers, and students enrolled through satellite centers.
Another challenge is the new admissions standards. The state ACT data show entering students are
prepared overall but have a deficiency in one performance area. These students are not candidates for the
Passport program but are in need of remediation. The Enhanced Success Program has been created for fall
2011. This program will focus on supporting students with some need, but who are not eligible to
participate in the POWER program or Passport program. Enhanced Success Program supports will mirror
POWER-type services and are funded through institutional dollars. POWER and the Student Success
Center have some small pilot projects focused on addressing these issues and a growing tutoring program
which will help. Data suggests a much more aggressive institution-wide approach needs to be created to
ensure entering students obtain the skills needed to be successful through the four years of expected
academic rigor. From a global perspective, it would appear that the campus is engaging in many best
practices related to enhancing student enrollment and completion rates. Upon further analysis of usage
and actual numbers enrolled within programs or using services, a small percentage of students are actively
engaged in high- impact and highly-engaged activities. While SSI data do not identify large gaps in
academic advising, it would appear from every focused discussion about advising conducted with
Hobsons personnel that there are significant gaps and significant opportunities for improvement including
that only 9 percent of students have pre-registered for fall 2011 semester at the end of the academic year.
This leaves admissions, financial aid, registrar, and academic units unclear of how many students will
return and the amount of financial aid and class offerings to provide for the start of the fall term. Efforts
must be shifted to ensure a majority of currently enrolled students are registered prior to leaving the
spring term.
Early-warning systems have been drafted, but not implemented. In general, the campus culture continues
to remain non-intrusive and sees the new centers as the vehicle to solve the campus graduation challenge
rather than a campus approach to persistence and completion. Gardner, Kuh, and Manning have all
suggested that campuses such as Minot are the perfect location and size to intensively connect with
students and increase levels of engagement. This does not happen through a couple of support centers, but
rather through an intensive campus-wide effort committed to ensure every student accepted to Minot State
graduates from Minot State. Included in this expectation is the expanded role faculty must play through
increased levels of engagement and expanded relational activities such as academic advising. Measures
from the National Survey of Student Engagement (NSSE) also show lower levels of engagement and
active learning compared to national or peer institutions. NSSE data indicated that what Minot State says
it does is not happening at the level it should be happening compared to its peers, aspirants, or Great
Plains competitors.
Data collected through this planning process also represents majors or majors of interest at time of
enrollment where less than 30 percent of students who enroll persist to a third year and far fewer complete
a degree. This data also showed programs with higher retention and completion averages. The academic
14
deans and department chars must review this data and determine what is and is not working by academic
programs and determine academic strategies to support those programs with lower persistence to
completion rates.
Housing
While normally not a categorical area of a situation analysis, Minot State University’s housing is a
strategic issue which must be addressed. With the city of Minot’s booming economy, housing costs off-
campus are increasing at a rate far exceeding any national or regional averages. When students move off-
campus, their cost of attendance is increased compared to their first year of enrollment. With on-campus
housing at capacity, the University faces a great dilemma in that there is great opportunity to grow the
transfer student market, but no place to house them. Most students desire to live off-campus in their
second to fourth years and are now finding on-campus housing more reasonable or the only solution to
meet their flexible housing needs. The notion of growing more first-time, full-time students means
moving more second-year students off-campus and limiting even more the number of transfer students
from out of the area. Efforts to grow and expand international student numbers further complicates the
housing picture in that many of these students expect housing available from mid-August through mid-
May without a recess. In addition, the university is committed to increasing its six-year graduation rate
although this may be difficult for students who need to work more to pay for housing. For any of these
scenarios, the institution is not prepared in its current state to have an infrastructure where a student can
graduate within four years and find good paying part-time jobs to meet the housing costs while staying
enrolled in 15 to 18 hours per term which is required to complete the 128 semester hours required for
graduation.
Flood
During the planning process, the city of Minot had a major flood which significantly impacted the town
operations and available housing for all students – graduate and undergraduate. The planning processes
continued with strategy development and enrollment projecting attempting to incorporate trends and other
data that became available. Fall 2011 enrollment decreased by 5.5 percent most of which was a directly
related to the flood either within Minot or within the state. It is understood that there will be numerous
long-term (3 to 5 years) impacts from the flood that are difficult to predict. The need for housing is further
exacerbated by the flood in that many off-campus student housing options are no longer available. This
may slow or lessen efforts to recruit students from international or out-of-state locations.
Note: Numerous data was reviewed and summarized. Data summaries can be found in Appendix I.
Planning Assumptions
As the planning team began to create tactics aligned with strategies, the following planning assumptions
were considered:
• Strategies and tactics are focused on undergraduate enrollment;
• State funding formulas are not consistent with performance or budget surplus. Therefore,
additional revenues will likely need to come from within the institutional operations not from the
state;
• The strategic plan calls for a yearly enrollment goal of 650 new students by 2020 enrolled at the
Minot main campus, an additional new student yearly enrollment of 125 at the Air Force Base,
and 300 students enrolled at the additional satellite sites. Action items and tactics are created to
meet these expected new student enrollment targets;
• Mission, vision, core values, and the current 2013 strategic plan served as the foundation to create
planning strategies and action items;

15
• All initiatives are focused on increasing recruitment efforts and increasing retention and
graduation/completion rates;
• International and out-of-state student recruitment efforts are a priority;
• Serving the Native-American population remains a top priority;
• Adults and distance education programs supports need to increase to match overall enrollment
growth and increase institutional revenues;
• Economic conditions in the area show strong growth; however, much of that growth is for jobs
that do not require a college degree requiring enhanced marketing and outcome-oriented
messaging to perspective and currently enrolled students;
• Strategies are designed in consideration with Great Plaines Peer Institutions and US News and
World Report Rankings identifiers with an understanding that these need to continue to improve;
• New strategies, action items, and tactics will require additional budget allocations; and
• The current housing capacity is not expected to change within the next five years limiting
enrollment growth of transfer and international student.
Key Performance Indicators
As a part of the planning process, the planning team determined series of key performance indicators
(KPI) and numerous performance indicators (PI). The key performance indicators focus on enrollment,
student ability metrics at enrollment, student progress, fiscal health, and co-curricular student
engagement. Given additional resources added to support institutional research, it was agreed this list is a
starting point and over time will evolve to match institutional needs. It should be noted that several
departments did not track data points seeking to be analyzed. It is hoped that the president or cabinet will
require each department to establish the systems needed to monitor these performance indicators and
report these metrics twice a year.
KPIs and PIs will be monitored by the Strategic Enrollment Management Council (SEMC). This council
will track goal and strategy implementation. A listing of identified KPIs and PIs can be found in
Appendix II and III.
Section 5: Strategies for Implementation
The Key Enrollment Strategies identified in the Strategic Enrollment Plan will be basis for the future
direction of program development/enhancement and enrollment management and, consequently, in
realizing the strategic enrollment goals of the University. The implementation of these strategies is
important to optimizing the key performance indicators identified through the process. The success of
each of these strategies is predicated on the assumptions that they are appropriately funded, based on
market research and empirical data, assessed in terms of effectiveness, and continuously refined through
the Strategic Enrollment Management Council and through the updated strategic plan. Key strategies
identified are the following:
Implement systems for data analysis empowering planning and implementation of future
enrollment management strategies.
Design marketing campaign targeted towards the multiple place students can enroll (Minot, AFB,
Bismarck, Fargo, Dickinson, Native American, and Online).
Create a culture of student success that actively engages students, faculty, and staff to fulfill our
mission, vision, and values.
16
Expand funnel management strategies to maximize yield efforts of students.
Design and implement prospective and new student communications flow targeted to specific
populations; Domestic first year and transfer, international first year and transfer, veterans, Native
American, online, adult learner
Increase efforts to attract and graduate more Native American students
Increase efforts to attract and graduate more Veteran students.
Increase efforts to attract and graduate more international students.
Increase efforts to attract and graduate more transfer and traditional first year students.
Increase efforts to attract and graduate more adult learner students.
Integrate a culture of student success that actively engages students, faculty, and staff to fulfill
our mission, vision, and values
Create four and five year degree program plans to increase student completion rates.
Increase efforts to attract and graduate specific student population
Support enhanced faculty and staff development related towards student success
Design a comprehensive early alert system
Create parent and family programs including one designed for new students; a second designed
for continuing.
Create an Undecided Majors category at acceptance.
Provide seamless services for students regardless of place of enrollment.
Realign scholarship and financial aid strategies with documented best practices.
Within each of these strategies is a series of action items that have been prioritized over the next five
years towards completion. For year one, higher priorities include the implementation of the CRM, the
integration of performance indicators to realign practiced towards goal achievement or enhancing key
performance indicators, increasing the number of articulation agreements, implementation of an early
alert system, advancing branding efforts, improving the institutions website, preparing for the Centennial
campaign, launching the international recruitment plan, and establishing or further refining practices
outlined in the Title III grant. For year two, priorities include the advancement and supports necessary for
non-traditional students, integration of new financial aid strategies to leverage dollars throughout four-
year enrollments, and further advancements in recruitment strategies based on the results and refinements
within the CRM, and further advance retention related strategies. Depending on the outcomes of the
academic program demand study, actions may need to be shifted to support marketing and recruitment
efforts to align with demand study priorities. All action planning templates can be found in Appendix IV.
Section Six: Enrollment Targets, Costs, and Projection
In addition to conducting a comprehensive situational analysis, reaching agreement on the fundamental
planning assumptions, and determining key strategies geared toward enhanced enrollments, the planning
team established quantifiable enrollment goals and the costs needed to ensure strategies are implemented.
The planning team appreciates that institutional budgets are very limited, but also appreciates the need to
make prudent investments in order to grow enrollments. Several initiatives related to retention,
persistence and graduation are being funded through Title III funds. It should be noted that the planning
team expects these funds to continue as the grant funding ends.
Strategic Enrollment Goals
In a global sense, the campus is committed to increasing enrollment (at the main campus, through satellite
campuses, and expanded online programs), expanding geographic representation of students, and
improving student retention. Yet, few campus members have articulated the needed infra-structures,
faculty or staff needed, or desired future state of academic programs to align with growth expectations.
The planning team appreciates that due to a transition within the Provost’s Office the academic

17
prioritization exercise has been slowed, but cannot stress enough the need for this exercise to be
completed to shape the realities of enrollment goals set forth in this planning effort. The fall 2011 official
headcount was 3,371 students. This headcount included all full-time and part-time undergraduate
students. The official full-time equivalency (FTE) was 2591. New traditional first-time, full-time
freshmen entering in fall 2011 was 437 students. New transfer students were 251. Fall census data showed
expected decrease in enrollments believed to be a result of flood related challenges and off-campus
housing limitations. This decrease in enrollment was particularly hit in the first to second year retention
rate which decreased from 70 percent (fall 2010) to 63 percent (fall 2011). Everyone on the planning team
was disappointed and concerned by this decrease and realizes the need to focus efforts to increase
persistence rates.
Enrollment Projections
The enrollment goals stated here are focused on undergraduate enrollments. From an overall institutional
perspective, the SEMC may wish to add an enrollment projection model for graduate programs in the
2012-13 academic year to gather a total enrollment perspective.
In reviewing current enrollments with no growth, the current full-time enrollment will remain at about
2700 students. Part-time enrollment with no growth will remain at 1400. However, this does not calculate
the expected decrease in high school enrollments. If we assume half of the expected enrollment decrease
(8 percent decrease in new students; 4 percent decrease in transfer students), enrollment would dip to
2100 full-time students and 1000 part-time students. All data indicators suggest the dip in part-time and
transfer enrollment is very unlikely, but even keeping part-time enrollment FTE would decrease
significantly even further exacerbating potential budget challenges (i.e. decreased state funding support
based on FTE models).
The heart of increased revenues will likely come from increased retention of currently enrolled students.
The committee wants to emphasis that best practice research from Noel-Levitz states that we do not want
to decrease the levels of academic rigor or classroom engagement. The committee fully recommends the
need to ensure NSSE benchmarks and SSI benchmarks grow to reach national or peer averages and the
need to fully support and further expand efforts conducted through the Student Success Center, CETL,
and POWER and that these types of services need to be offered to all student types not only to traditional
first-time full-time students.
The planning team suggests two likely scenarios (see appendices). Scenario one is no growth in new
students and 2 percent growth every other year in first to second and second to third year persistence and
a 3 percent tuition increase.
Based on planning efforts being implemented, the second scenario is a 2 percent increase in first-time,
full-time freshmen and 4 percent increase in transfer students every other year with a 2 percent increase in
first to second year and second to third year persistence every other year. The planning team believes this
is the most likely enrollment projection.
It should be noted that this expectation assumes all initiatives will be funded, the financial aid model will
move from first-year scholarship awarding to four-year scholarship awarding, implementation of the
international recruitment plan, and the academic demand study will be completed and aligned with
marketing and recruitment practices, plus academic affairs (meaning all academic units) will play an
aggressive role in student retention, persistence, and completion efforts.

18
Institutional Investments to Implement Enrollment Plan
It should be noted that many of the key enrollment strategies listed in Section Six require little additional
funding. Many retention to graduation initiatives are being funded through Title III and TRIO grant funds.
The majority of dollars needed are linked to marketing efforts and to support the growth and development
of expanding new markets (Veterans, Transfers, International, and Native-Americans). Few of these
initiatives can be accomplished using existing staff and resources, (e.g., increasing the use of web-based
technologies to augment the recruitment process; enhancing effectiveness within existing operations). The
creation of a stronger focus on data collection, interpretation, and decision making will help focus the
campus efforts to make appropriate budget allocation and measure expected impact from these results.
This plan is focused on ways to increase enrollment.
Area Responsible Item needed Cost Year Needed
Admissions Junior Piece $10,000 2012-13
Admissions CRM Support $32,000 plus benefits
2013-14
Admissions Seamless Service Spring 2012
Admissions Student TeleCounselors
$10,000 2012 – 13
Admissions Tribal Camps $15,000 2014-15
Admissions/Marketing Name purchase $10,000 2013-14
CETL Peer Mentor Expansion
$5,000 2013-14
Student Success Parent Program $7,500 2013-14
Student Success CSI $1,500 2012-13
Marketing TV and Radio and Billboard
$50,000 $10,000 increase per year starting in 2012-13 if data warrants
Marketing Inigral $25,000 2012-13
Marketing Google / FB ads $35,000 $10,000 increase per year starting in 2012-13 if data warrants
Marketing CMS $50,000 2014-15
Marketing Writer $30,000 plus benefits
2013-14
Marketing Web Designer $45,000 plus benefits
Immediate (if possible)
Total Cost Outlined for 5 years $326,000 Excluding scholarship program
Total $111,500 2012-13 Fiscal Year
Admission/Financial Aid Scholarship/Grant Program
1,406,618 Start budget year July 2012 with $530,500
The committee appreciates that the scholarship dollars listed need further refinement will ask the financial
aid and business office to finalize these numbers. These estimates were provided from preliminary data
given to the planning team. Assuming a three percent increase in revenue and an increase in full-time

19
enrollment as projected; the institution should see an increase in revenue of $9,363,221 by 2019. The total
cost of the plan identified above is 1,732,618 creating a net revenue gain of $7,630,603. This revenue
increase does not account state allocations or part-time revenues which are expected to also increase
based on demographic and other state and national data which support the larger growth expected within
higher education will be in part-time markets.
Section 7: Monitoring the Plan and Ensuring Implementation
Strategic Enrollment Management Council
Upon the completion of the strategic enrollment planning process, a Strategic Enrollment Management
Council (SEMC) will be appointed to monitor and track implementation of the SEP. The council should
communicate with the campus-at-large regarding plan updates, recognize contributions and celebrate
achievements. Related to plan implementation, evaluation, and modification, the SEMC has specific
functions:
To monitor implementation including procedures to measure and track each benchmark indicator
identified in this plan;
To meet quarterly as a whole committee to assess the overall progress of the plan and approve
changes in the implementation of the plan for submission to the President and President’s staff;
To share with the campus-wide community periodic progress reports regarding the plan and its
effectiveness;
To sponsor special campus-wide events related to SEP (e.g., providing opportunities to share best
practices, organizing special meetings to discuss implications of student satisfaction inventory results
on retention, or sponsoring professional development activities connected with new initiatives);
To recognize campus contributions and celebrate accomplishments;
To develop a revised strategic enrollment plan at a minimum of once each year, and more often as
needed, based on new information and the identification of desirable new strategies.
Monitoring Benchmark Indicators
As the campus becomes more data-informed, the President’s staff, the Dean of Admissions, the Director
of Institutional Research, the Registrar and SEMC must conduct ongoing assessment of the benchmark
indicators and external factors, as well as monitor progress of implementation. The plan will be
continuously updated with new data (both internal and external) as it becomes available. This data will be
used to inform any adjustments to the plan and serve to guide the direction of implementation.
Conclusions
As this report is presented, the campus has been faced with two challenges that have limited recent
enrollment progress. The first is the flood which had a major impact on student persistence for fall 2011
and the readiness of campus staff to implement several new recruitment and retention related initiatives.
The planning team appreciates that this plan is likely a beginning step towards a fuller enrollment
management plan that will need to be updated after the university updates its strategic plan.
The staff is deeply committed to ensure Minot State University minimally maintains current enrollments
and works diligently to grow enrollments despite numerous indicators to the challenges ahead. The best
results will come from the strongest of collaboration between all campus units and a continued push from
the President’s Staff that everyone no matter title or job description is responsible for student enrollment.

20
Recruiting Strategies
Financial Aid Promotion Strategies
Realign scholarship and financial aid strategies with documented best practices
1.1 To redesign financial aid and scholarship leveraging to achieve expanding enrollment goals through
graduation—currently many students only receive a one-year scholarship, which is not renewable;
current practices use scholarship dollars to leverage students into the college and provide financial
support throughout all years of enrollment if students meet grade point average and academic
progress requirements.
1. CEL: Reevaluate the effectiveness of Emerging Scholars Award and the relationship with the
passport program (Fall 2011 and ongoing)
2. Develop a working group to determine new structure to leverage financial aid dollars to maximize
new student yields (December 2011)
3. Determine financial aid leveraging structure and financial implications of shifting from fist-year
only model to a four-year (or five-year) financial aid model (December 2011)
4. Determine yield expectation of a shifting financial aid model (December 2011)
5. Finalize changes to financial aid modeling for fall 2012 class (Note: the working group realizes
this change may be a multi-year process and that this new system may only be partially
implement to affect the fall 2012 class) (February 2012)
6. Develop a process where financial aid officers, admissions counselors, and/or work study
students contact communicate the process for filling out financial aid (FASFA) process and give
new students timeframe of when they should expect any need based award (institutional, state, or
federal) after they submit their completed FASFA (February 2012)
7. Communicate merit-based awards within two to three weeks following acceptance to admitted
scholars; although the source of funding would not be articulated, the early awards would vary
depending on academic eligibility of the students (March 2012)
8. Assess appropriateness of current financial aid distributions while actively seeking new funding
sources (April 2012)
9. Seek in allocation system mechanisms for admissions staff to see award amounts and letters sent
to prospective/applied students (April 2012)
10. Determine system to allow dean of admissions to review financial aid budget with director at key
points during admission cycle to maximize aid award to yield strongest applicants/admitted
students (September 2012)
11. Create a financial aid award calendar for internal uses (Fall 2012)
12. Make any necessary changes to Emerging Scholars review as identified by CEL (Fall 2012)
13. Implement changes in new financial aid structures and awarding (January 2013)
14. Refine mix of foundation and institutional financial aid and scholarship funds available in relation
to the timing of early offers (March 2013)
15. Determine effectiveness of fall packaging methods by subpopulations (2014 and beyond)
16. Determine transfer scholarship award process (2014 and beyond)
17. Determine retention awards for high achieving students (2014 and beyond)
ROI
21
First Years Promotion Strategies
Increase efforts to attract and graduate more traditional first year students
1.1 To tele-counsel prospects once they are in our funnel to begin a personal relationship and continue the
communication with the goal of enrolling and graduating—student to student recruiting
1. Utilize student to student recruiters for tele-counseling—match student workers or ambassadors
with recruiter/mentor for a paid position (Canadian student with Wade, North Dakota student
with Derek) this student worker will aid in following calls and recruitment process (December
2012 and ongoing)
2. Utilize current non-returning student data to recruit-back—calling non-returning students to find
out if there is an issue we can help with to get them re-enrolled (Spring 2012 and subsequent
semesters)
1.2 To enhance recruitment in surrounding areas
1. Develop comprehensive recruitment plan at off-campus retreat (December 2011)
2. Develop a written annual recruitment plan to include territory management strategies and specific
yield activities per subpopulation (July 2012)
3. Write recruitment plan to integrate with marketing plan to include territory management
strategies and specific yield activities per subpopulation (Spring 2013)
1.3 Develop existing campus events hosted by other departments to use as a recruiting tool
1. Partner with athletics to develop events to bring in prospective traditional first year students from
out of state to Minot State University; e.g., camps or meet the beavers invites (Spring 2012)
2. Host an event with the College of Business for High School students (Fall 2012)
3. Host a red carpet event for High School counselors (October 2012)
4. Partner with athletics to host events that will bring in prospective students from out of state (May
2012)
5. Evaluate new events and make adjustments for future events for example Super Saturday events
with athletics (December 2012)
6. Utilize athletics planned on campus events to promote Minot State University and recruit students
(December 2012)
7. Continue support of athletic events (2013 and beyond)
1.4 Write recruitment plan to integrate with marketing plan to include territory management strategies
and specific yield activities per subpopulation (Spring 2013)
1.5 Research potential partners or funnel schools with matching programs in the I-94 corridor (December
2012)

22
ROI
438
483
460
471
410
420
430
440
450
460
470
480
490
New FreshmanFall 2009
New FreshmanFall 2010
New FreshmanFall 2011
New FreshmanFall 2012
Minot State University Enrollment Target
New Freshman Fall 2009
New Freshman Fall 2010
New Freshman Fall 2011
New Freshman Fall 2012

23
Transfer Promotion Strategies
Increase efforts to attract and graduate more transfer students
1.1 To create new partnerships with other institutions to ease the transferring process for students
1. Develop articulation agreements with 2 and 4 colleges and universities throughout North Dakota
and across the country (ongoing)
2. Develop a transfer event for a local two year school where students can apply, register, and
receive advising (Spring 2012)
1.2 To increase enrollment of international and domestic transfer students by growing partnerships and
developing articulation agreements for seamless transfer
1. To gather all current articulation agreements and MOUs to ensure SBHE and NDUS compliance
2. Identify pending/unfinished agreements (Spring 2012)
1. Nullify expire or unutilized agreements (Spring 2012)
2. Finalize pending agreements currently under pursuit (LRSC, National Economics University in
Vietnam, and Lethbridge Community College) (Spring 2012)
3. Research the amendment process for articulation agreements and MOUs (Spring 2012)
4. Write the amendment process for reference purposes (Summer 2012)
1.3 To foster new relationships with areas identified in Hobsons report; I-94 corridor,
Wyoming, Texas community college system, Malaysia, Phillippians, and Libya
1. Research potential partners or funnel schools with matching programs in the I-94 corridor
(December 2011 and on)
2. Research potential partners or funnel school with matching programs in Wyoming Community
College System (January/February 2012)
3. Research potential partners or funnel schools with matching programs in the Texas Community
College System (January/February 2012)
4. Plan a visit to Wyoming Community College for Dr. Fuller (Spring 2012)
5. Dr. Fuller visits Wyoming Community College (Summer 2012)
6. Plan a visit to Texas Community College system schools (Summer 2012)
7. Visit Texas Community Colleges (Fall 2012)
1.4 Complete pending agreements with Lake Region State College, Lethbridge Community
College, and National Economics University in Vietnam
1. Complete articulation agreements with Lethbridge Community College BAS Business
Information Technology (Spring 2012)
2. Get LRSC and MSU Peace Officer Training agreement signed (Spring 2012)
3. Progress College of Business articulation agreement with National Economics University in
Vietnam (Spring 2012)
4. Complete and sign articulation agreement with National Economics University in Vietnam (Fall
2012)
1.5 To develop recruitment events targeting potential transfer students
1. Develop comprehensive recruitment plan at off-campus retreat (December 2011)
2. Develop a transfer event for local two-year school where students can apply, register, and receive
advising (Summer 2012)

24
3. Implement a transfer event for local two-year schools where students can apply, register, and
receive advising (Fall 2012)
1.6 Develop written annual recruitment plan to include specific yield activities for international and
domestic transfer students (July 2012)
1.7 Evaluate current and potential agreements (January 2013 and beyond)
1.8 To create on- and off-campus recruiting and enrollment events
1. Develop a transfer event with on the spot application, transcript review, and advising (Spring
2012)
2. Implement a transfer event for local two-year schools where students can apply, register, and
receive advising (Fall 2012)
1.9 Utilize current non-returning student data to recruit-back; calling non-returning students to find out if
there is an issue we can help with to get them re-enrolled (Spring 2012 and subsequent semesters)
1.10Research potential partners or funnel schools with matching programs in the I-94
corridor (December 2011)
1.11 Written recruitment plan to integrate with marketing plan to include territory management strategies
and specific yield activities per subpopulation (Spring 2013)
Progress Report: Transfer and Articulation Agreements
1.1 Complete agreements with schools in the Dakota Nursing Program
a. Lake Region State College—Completed
b. Williston State College—Completed, not signed
c. Dakota College at Bottineau—Completed
d. Bismarck State College—Completed (sent to Dr. Moen for approval to take next step)
e. Fort Berthold Community College—Initiated
1.2 Complete Criminal Justice agreements
a. Lake Region State College—Peace Officer Training Certificate; agreement is listed as
tentative in our catalogue but is being recognized
b. Dakota College at Bottineau—Completed
c. MSU, DCB, and TMCC (Wildlife Law Enforcement)—Completed, signing to be scheduled
1.3 Complete Dakota College agreement with Teacher Education—Completed
1.4 Grow relationships with Washington State 2 year colleges—Uncompleted due to lack of interest
from Highline Community College and Green River Community College
a. Keep ongoing email/phone conversations with Highline CC and Green River CC
b. Set up face-to-face meetings
c. Bring interested parties to our campus
1.5 Grow relationship with Lethbridge College/Briercrest
a. Keep ongoing email/phone conversations
b. Set up face-to-face meetings
c. Travel to Lethbridge
d. Multiple agreements underway with Briercrest
1.6 Grow relationship with North Dakota Community Colleges
a. Visit the campuses
b. Offer onsite registration campaign beginning in March

25
c. Onsite spring registration for MSU students on BSC’s campus completed in November 2011
1.7 Currently working with Libby and Dr. Ross on agreements with the National Economics
University in Vietnam and Shanxi University Business College in China
ROI
328 341
251 257
0
50
100
150
200
250
300
350
400
New TransferFall 2009
New TransferFall 2010
New TransferFall 2011
New TransferFall 2012
Minot State University Enrollment Target
New Transfer Fall 2009
New Transfer Fall 2010
New Transfer Fall 2011
New Transfer Fall 2012

26
Non-traditional (Adult Learner) Promotion Strategies
Increase efforts to attract and graduate more adult learner students
1.1 To develop greater exposure of Minot State University to area adults in order to generate interest and
increase enrollment
1. Attend all-schools informational events at the BX and various venues (Fall 2011 and ongoing)
2. Purchase table cloth and pull up banner for Minot Air Force Base and Bismarck State College
(December 2011)
3. Monthly information tables at BSC (ongoing)
4. Attend Gradfest on BSC’s campus to promote Minot State University programs available on
BSC’s campus (November 2011)
5. Post flyers and schedules at base locations and BSC campus locally and globally (ongoing)
6. Work with Veterans Center to have regular meetings with existing military personnel for advising
and information on VA benefits (Spring 2012)
7. Plan an informational day for veterans to be hosted in collaboration with the Veteran’s Affairs
office (February 2012)
1.2 To develop incentives for prospective students to pursue higher education
1. Research work experience credit best practice (December 2011)
2. Develop a proposal to take to academic affairs and other appropriate audiences that defines how
to grant work experience credit (Spring/Summer 2012)
Enrollment Projection
ROI

27
Native American Promotion Strategies
Increase efforts to attract and graduate more Native American students
1.1 To develop campus events to attract Native American students
1. Research and plan the “Bring a Buddy” initiative—a small gift is given to the Native American
student who brings a friend to MSU (free meal, t-shirt) (Spring 2012)
2. Implement the “Bring a Buddy” initiative—a small gift is given to the Native American student
who brings a friend to MSU (free meal, t-shirt) (Fall 2012)
3. Implement mini athletic camps in collaboration with the athletic department (Spring/Summer
2013)
4. Grow Native American on-campus cultural events (Spring and Fall 2013)
1.2 To deliver personal service to meet the needs of Native American recruits and have the support
systems to keep them here; make more home visits when necessary
1.3 To meet with Tribal members, including higher education programs, about concerns with young
people in their communities not pursuing higher education
1. Involve current Native American students and/or alumni in the recruitment process (Fall 2011
and ongoing)
2. Identify marketing materials needed for Native American students (2011)
3. Begin planning mini caps at Tribal locations for High School students in effort to curb the
high dropout rate and get students thinking about the next step (Spring 2012)
1.4 To create a specialized group of community and university members to develop the academic
relationship with Native American students
1. Plan a Round Table Event for Tribal members who deal with higher ed scholarships, MSU
Deans, and High School Counselors to hear issues and brainstorm ideas of how best to serve and
prepare our Native American Students (January 2012)
2. Host a Round Table Event for Tribal members who deal with higher ed scholarships, MSU
Deans, and High School Counselors to hear issues and brain storm ideas of how best to serve and
prepare our Native American Students (Fall 2012)
3. Develop a recruitment plan for Native American students (Spring 2013)
1.5 Conduct registration at each Tribal College every semester
1.6 Continue to develop articulation agreements
1.7 Evaluate current procedures and make necessary adjustment (Spring 2013)

28
ROI
147 142
98 100
0
20
40
60
80
100
120
140
160
NativeAmerican
Students Fall2009
NativeAmerican
Students Fall2010
NativeAmerican
Students Fall2011
NativeAmerican
Students Fall2012
Minot State University Enrollment Target
Native American Students Fall2009
Native American Students Fall2010
Native American Students Fall2011
Native American Students Fall2012

29
International Promotion Strategies
1.1 To grow articulation agreement with international partners
1. Develop a written international student recruitment plan with budget and location priorities as
well as specific communication flow plan to prospective students in each country (Spring and
Summer 2012)
2. Together with Kristin Wood, update “2+2 At a Glance” and determine goals regarding number of
students
1.2 To increase international student numbers by targeting specific countries identified by Hobson’s
1. Research international colleges/universities that match our offerings to plan future recruiting trips
(Fall 2011)
2. Plan recruiting trips for the year (Summer 2012)
1.3 To develop a targeted approach for recruiting and retaining international students
1. Hire additional international recruiter and admissions counselor (December 2011)
2. Develop fall welcome event for international students (Spring 2012)
3. Host fall welcome event for international students like our Canadian Thanksgiving but for more
than just Canadians (Fall 2012)
1.4 Define international student goals/benchmarks; “How many students do we want to recruit from the
places we go?” (Summer 2012)
1.5 Evaluate and adjust current procedures (Spring 2013)
1.6 Develop international student on-campus events (Fall 2013)
58
91
113 116
0
20
40
60
80
100
120
140
Non-CanadianInternational
2009
Non-CanadianInternational
2010
Non-CanadianInternational
2011
Non-CanadianInternational
2012
Minot State University Enrollment Target
Non-Canadian International2009
Non-Canadian International2010
Non-Canadian International2011
Non-Canadian International2012

30
Canada (Continuing and Ongoing)
1.1 Develop a memorandum of understanding with Chinook School District for international
high school students who attend in Saskatchewan under the international placement agency in
Vancouver—other international students come to Chinook school district for final two years
of high school and are looking for universities to continue their education (December 2011)
1.2 To continue, and possibly expand to the spring, Fall Discover MSU Evening events in Regina
and Saskatoon (March 2012)
1.3 To have a Preview Day specifically driven for Canadian students
1.4 To develop a strategy for regional colleges in Saskatchewan and Manitoba
1.5 To sponsor local sporting and arts events in rural Saskatchewan and Manitoba (Fall 2012)
293
309 312
319
280
285
290
295
300
305
310
315
320
325
CanadianStudents Fall
2009
CanadianStudents Fall
2010
CanadianStudents Fall
2011
CanadianStudents Fall
2012
Minot State University Enrollment Target
Canadian Students Fall 2009
Canadian Students Fall 2010
Canadian Students Fall 2011
Canadian Students Fall 2012

31
176 163
192 196
0
50
100
150
200
250
SaskatchewanStudents Fall
2009
SaskatchewanStudents Fall
2010
SaskatchewanStudents Fall
2011
SaskatchewanStudents Fall
2012
Minot State University Enrollment Target
Saskatchewan Students Fall2009
Saskatchewan Students Fall2010
Saskatchewan Students Fall2011
Saskatchewan Students Fall2012
61
59
65 66
54
56
58
60
62
64
66
68
ManitobaStudents Fall
2009
ManitobaStudents Fall
2010
ManitobaStudents Fall
2011
ManitobaStudents Fall
2012
Minot State University Enrollment Target
Manitoba Students Fall 2009
Manitoba Students Fall 2010
Manitoba Students Fall 2011
Manitoba Students Fall 2012

32
ROI
27
28
31
32
24
25
26
27
28
29
30
31
32
33
AlbertaStudents Fall
2009
AlbertaStudents Fall
2010
AlbertaStudents Fall
2011
AlbertaStudents Fall
2012
Minot State University Enrollment Target
Alberta Students Fall 2009
Alberta Students Fall 2010
Alberta Students Fall 2011
Alberta Students Fall 2012
5
14
9 9
0
2
4
6
8
10
12
14
16
BritishCollumbia
Students Fall2009
BritishCollumbia
Students Fall2010
BritishCollumbia
Students Fall2011
BritishCollumbia
Students Fall2012
Minot State University Enrollment Target
British Collumbia Students Fall2009
British Collumbia Students Fall2010
British Collumbia Students Fall2011
British Collumbia Students Fall2012

33
Veterans Promotion Strategies
Increase efforts to attract and graduate more Veteran students—Minot State University will be known as a
“Military Friendly” university for students, faculty, and staff. MSU Veterans Center will provide
exceptional service and advocacy for veterans and their families
1.1 To increase awareness through promotional materials and educational events
1. Work with CEL to have regular meetings with existing military personnel for advising and
information on VA benefits (Spring 2012)
2. Plan an informational day for Veterans to be hosted in collaboration with CEL (February 2012)
1.2 To increase accessibility and ease of enrollment for Veteran students
1. Review current procedures; include recent Veterans students in the review (November 2011)
2. Develop a process to grant credit for life and work experience for Veteran students
3. Review enrollment procedures from remote locations (December 2011)
4. Include Veteran question on the admission request with forward to Veterans Center (December
2011)
5. Review process for transferability of military credit (January 2012)
6. Develop process to improve enrollment for veterans students (March 2012)
7. Develop a process to grant work experience credit (June 2012)
8. Implement life experience credit (January 2013)
9. Review transferability of military credit process to ensure accountability (June 2013)
1.3 To offer better customer service by developing the Veterans Center on Minot State University’s
campus
1. Create a veterans center and lounge to have a place for the veterans to study (individually or in
groups)—include conference/meeting areas for organizations they belong to along with a
rest/relaxation area (Fall 2014)
a. The Veterans Center is necessary to comply with FERPA laws to provide privacy for
students to openly discuss specific situations with the veteran services coordinator and
fellow veterans
1.4 To develop an INT 299 course for veterans only based on INT 175—Transition to University Life—
for veterans transitioning to university life; this course will include subjects to assist the veteran
student to better integrate into university life—subjects such as campus resources, stress management,
communication, conflict resolution, money management, academic research, and study skills could be
included (Fall 2012)
1.5 To develop seminars for faculty and staff on the signs and symptoms of some issues veteran students
may have (PTSD, TBI, suicidal tendencies, etc.) After faculty and staff complete awareness training,
they could be identified as veteran friendly and a “Green Zone for Veterans” as the veteran knows
that a “green zone” is a safe place (Spring 2012)
1.6 To develop stronger relationship with active duty students at the Minot AFB to make MSU campus
more available (April 2012 and ongoing)
1.7 To develop recognition programs on campus
1. Present a Veterans Day program that will recognize veterans on campus and in the area and the
sacrifices they have made (2011 and ongoing)
2. Develop programs for other Veteran recognized days to include Memorial Day, Flag Day,
Military Spouse Appreciation Day, and other service oriented days (Spring 2012 and ongoing)

34
1.8 Evaluate and adjust current procedures (2013 and beyond)
**The target growth in 2012 was calculated at 10% instead of 2.3% by David Klassy based on
present enrollment trends among veteran students at Minot State
ROI
141
195
240
265
0
50
100
150
200
250
300
VeteranStudents Fall
2009
VeteranStudents Fall
2010
VeteranStudents Fall
2011
VeteranStudents Fall
2012
Minot State University Enrollment Target
Veteran Students Fall 2009
Veteran Students Fall 2010
Veteran Students Fall 2011
Veteran Students Fall 2012
35
Specific Place Promotional Strategies
Minot (Current and Ongoing)
1.1 To promote Minot State University through elementary, middle, and high school visits to
campus
1. Every student in the Minot Public Schools, Our Redeemers, and the Minot Catholic
Schools will visit the MSU campus three times before their graduation for a meaningful
event
2. Enrollment Services will work with departments to create experiences that engage
potential students of all ages (Harmon)
a. Plays for elementary students
b. Science Open house for middle schools students
c. Signature Experiences for high school students
i. $martz (Laurie Weber)
ii. Notstock (Harbot)
iii. Darwin Days (Beachy)
3. Enrollment Services will design creative experiences
1.2 Enrollment Services will redesign Ambassador Organization to maximize a clearly organized
recruiting effort and consistent message
1.3 Enrollment Services will design recruiting events that allow for more opportunities for
faculty and staff to participate
1. Open houses (Van Dyke)
2. Tours (Thom-Arens)
3. Community engagement (Harmon)
1.4 Enrollment Services will plan for increased alumni involvement in recruiting new students
(Harmon)
1. National Fairs
a. Detroit, Long Island, Milwaukee, Chicago, Minneapolis
b. California
2. Alumni recruiting events
a. Regina
b. Saskatoon
c. Denver
1.5 Every qualified junior and senior in Minot schools will have access to dual enrollment
coursework (Harmon, Seidl)
1. Office at Magic City campus
2. On MSU’s campus
a. Bishop Ryan
b. Summer Scholars (Harmon)
i. Common Core
ii. Signature Courses for Summer 2012
1.6 Every junior and senior in North Dakota will receive nine MSU informational mailings
(Harmon)
1. Customer response management plan (Bonness)

36
NW North Dakota (Current and Ongoing)
1.1 Signature experiences (Harmon)
1.2 Hometown Heroes outreach (Harmon, Van Dyke)
1.3 College Preparatory outreach (Harmon)
1.4 Discover MSU Family Night—Williston (Van Dyke)
1916
2022
1977
2022
1860
1880
1900
1920
1940
1960
1980
2000
2020
2040
Ward Co.(address) 2009
Ward Co.(address) 2010
Ward Co.(address) 2011
Ward Co.(address) 2012
Minot State University Enrollment Target
Ward Co. (address) 2009
Ward Co. (address) 2010
Ward Co. (address) 2011
Ward Co. (address) 2012
2511
2607
2358
2412
2200
2250
2300
2350
2400
2450
2500
2550
2600
2650
NW NorthDakota Fall
2009
NW NorthDakota Fall
2010
NW NorthDakota Fall
2011
NW NorthDakota Fall
2012
Minot State University Enrollment Target
NW North Dakota Fall 2009
NW North Dakota Fall 2010
NW North Dakota Fall 2011
NW North Dakota Fall 2012
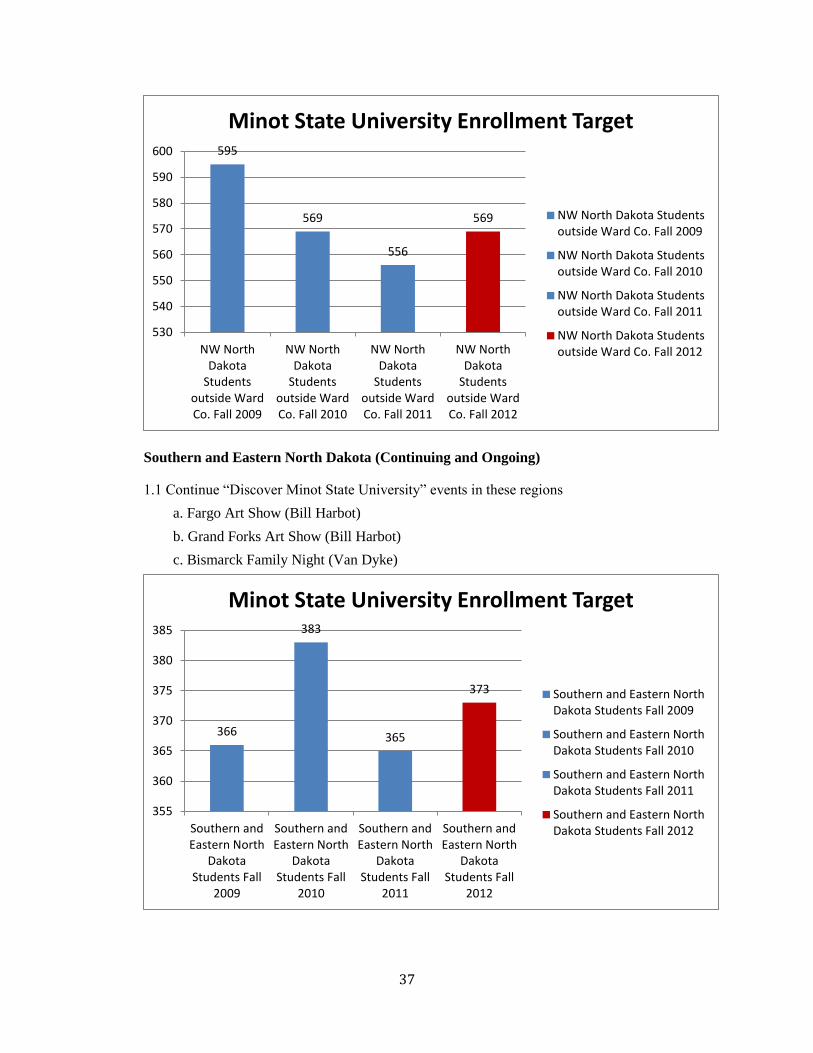
37
Southern and Eastern North Dakota (Continuing and Ongoing)
1.1 Continue “Discover Minot State University” events in these regions
a. Fargo Art Show (Bill Harbot)
b. Grand Forks Art Show (Bill Harbot)
c. Bismarck Family Night (Van Dyke)
595
569
556
569
530
540
550
560
570
580
590
600
NW NorthDakota
Studentsoutside WardCo. Fall 2009
NW NorthDakota
Studentsoutside WardCo. Fall 2010
NW NorthDakota
Studentsoutside WardCo. Fall 2011
NW NorthDakota
Studentsoutside WardCo. Fall 2012
Minot State University Enrollment Target
NW North Dakota Studentsoutside Ward Co. Fall 2009
NW North Dakota Studentsoutside Ward Co. Fall 2010
NW North Dakota Studentsoutside Ward Co. Fall 2011
NW North Dakota Studentsoutside Ward Co. Fall 2012
366
383
365
373
355
360
365
370
375
380
385
Southern andEastern North
DakotaStudents Fall
2009
Southern andEastern North
DakotaStudents Fall
2010
Southern andEastern North
DakotaStudents Fall
2011
Southern andEastern North
DakotaStudents Fall
2012
Minot State University Enrollment Target
Southern and Eastern NorthDakota Students Fall 2009
Southern and Eastern NorthDakota Students Fall 2010
Southern and Eastern NorthDakota Students Fall 2011
Southern and Eastern NorthDakota Students Fall 2012

38
Montana
1.1 To develop a greater relationship with Montana school counselors
a. Correspond with school counselors about recent events at Minot State through mail on
a monthly basis (ongoing)
1.2 To develop a presence and brand in eastern Montana
a. Double high school visits through the year—one visit per semester excluding fairs (Fall
2012)
1.3 To increase CMR to Montana high school students
a. Using Hobsons to improve the promotion of Minot State University through emails and
phone calls (ongoing)
1.4 To host a “fun-day” for eastern Montana high school students to advertise the appeal of Minot
State University (Fall 2013 and ongoing)
1.5 To host a retreat for eastern Montana high school counselors at Minot State University
campus to educate them on what Minot State has to offer their students (Fall 2013 and ongoing)
91 98
111 114
0
20
40
60
80
100
120
MontanaStudents Fall
2009
MontanaStudents Fall
2010
MontanaStudents Fall
2011
MontanaStudents Fall
2012
Minot State University Enrollment Target
Montana Students Fall 2009
Montana Students Fall 2010
Montana Students Fall 2011
Montana Students Fall 2012

39
Data Metrics Promotion Strategies
Implement systems for data analysis empowering planning and implementation of future enrollment
management strategies
1.1 To develop and sustain an accurate dashboard system to guide the university
1. Phase I of Hobsons Implementation—select offices/teams trained (November 2011)
2. Clean-up data and begin archive calendar (December 2011)
3. Identify data sources, current attributes, and missing attributes for conversion funnel, retention
and academic progression table, and graduation rate table (December 2011)
4. Develop conversion funnel (March 2012)
5. Develop a retention and academic progression table (May 2012)
6. Develop a graduation rate table for 4, 5, 6 year graduates (July 2012)
7. Develop conversion funnels by major mode of instruction, and location (October 2012)
8. Hobsons on-campus training (November 2012)
9. Develop retention and academic progression tables by major, mode of instruction, and location
(January 2013)
10. Develop graduation rate tables for 4, 5, 6 year graduates by major, mode of instruction, and
location (August 2013)
11. Identify metrics for student support services (December 2013)
12. Phase II of Hobsons Implementation—campus-wide implementation for deans, chairs, and
administrative assistants (December 2013)
13. Evaluate and expand funnels and tables to focus on other attributes (i.e., ethnicity, athletics,
international) (February 2014 and ongoing)
14. Develop metrics for student support services (July 2014 and ongoing)
ROI

40
Com Flow Promotion Strategies
Design and implement prospective and new student communication flow targeted to specific
populations—domestic first year and transfer, international first year and transfer, veterans, Native
American, online, adult learners
1.1 To work within Hobsons to create a cohesive targeted communications flow for each subpopulation
1. Gather and prioritize communications sent/made by all of the subpopulations; international first
year and transfer, veterans, Native Americans, domestic first year and transfer, online, the adult
learner (Ongoing)
2. Create a basic working checklist on VIP page (December 2011)
3. Identify non-returning students or stop outs each semester and use the information that we have
to contact them and “recruit-back” the student by offering solutions to issues that we can address
(February 2012 and ongoing)
4. Implement a cohesive and specific communication flow tailored to the students’ needs from our
Hobsons CRM tool (April 2012)
5. Support and collaborate with departments in creating communications for recruits they are
contacting; for example, the music department has specific students that it sends communications
to (Spring 2012)
6. Along with marketing, develop marketing communications for subpopulations (March 2012)
7. Begin process of determining best practices regarding the CRM tool (December 2012)
8. Grow and evaluate existing communication flow (Spring 2013 and ongoing)
9. Expand the internal use of Hobsons for ongoing communications with current students (Spring
2013 and ongoing)
ROI

41
Marketing Strategies
Design marketing campaign targeted towards the multiple places students can enroll (Minot, AFB,
Bismarck, Fargo, Dickinson, Native American, and Online)
1.1 To review current television and radio practices and determine future use
1. Utilize MSU’s KMSU station for advertising (November 2011)
2. Continue television and radio for Minot, Bismarck, MAFB, Williston, and Dickinson primarily
targeting adult students, parents, and alumni (December 2011)
3. Pilot commercials on cable TV—target parents/prospective students (December 2011)
4. Review usefulness of new URL for specific TV and radio advertisements (December 2011)
5. Assist the athletic department as needed (December 2011 and ongoing)
6. Continue trial with commercials on cable TV—target parents/prospective students (May 2012)
7. Purchase additional billboards in North Dakota, Montana, Saskatchewan, Manitoba (July 2012)
8. Develop long-term partnerships with businesses to market MSU (Spicy Pie, etc.) (July 2012)
9. Launch centennial marketing (keep in mind what MSU will be like in the next 100years)
(December 2012)
10. Utilize MSU’s KSMU station for advertising (December 2012)
11. Continue television and radio for Minot, Bismarck, MAFB, Williston, and Dickinson primarily
targeting adult students, parents, and alumni (December 2012)
12. Continue centennial marketing (December 2013)
13. Continue television and radio for Minot, Bismarck, MAFB, Williston, and Dickinson primarily
targeting adult students, parents, and alumni (December 2013)
14. Review 2012 tasks for effectiveness and modify as needed (December 2013)
15. Utilize MSU’s KMSU station for advertising (December 2013)
16. Continue centennial marketing (December 2014)
17. Review 2013 tasks for effectiveness and modify as needed (December 2014)
18. Utilize MSU’s KMSU station for advertising (December 2014)
1.2 To enrich the MSU social media marketing by expanding the usage of Google, Facebook, and
YouTube in addition to researching other media that may be beneficial for MSU
1. Create more interactive posts to engage our subpopulations (November 2011)
2. Determine new strategies (contests, etc.) via FB to gain more interest from our publics
(November 2011)
3. Research Smile Box and other similar programs to see what other photo options are available
(November 2011)
4. Continue with Google and FB target marketing—traditional, transfer, military, and non-
traditional students (December 2011)
5. Integrate Google and FB actions with Hobsons communications programs (December 2011)
6. Athletics will continue tweeting on the msubeavers.com website (December 2011 and ongoing)
7. Establish goals for social media with marketing team (December 2011)
8. Investigate Inigral’s Facebook options for prospective and current students (April 2012)
9. Attend professional development events to become updated on best practices of FB (June 2012)
10. Continue with Google and FB actions with Hobsons communications programs (December 2012)
11. Integrate Google and FB actions with Hobsons communication programs (December 2012 and
ongoing)

42
12. Create more interactive posts to engage our subpopulations (December 2012and ongoing)
13. Attend professional development event to stay abreast of rapidly changing technology
environments for all target markets (December 2012)
14. Athletics will continue tweeting on the msubeavers.com website (December 2012)
15. Continue with Google and FB target marketing—traditional, transfer, military, and non-
traditional students and review pay per click options for additional marketing and brand
awareness (December 2013 and ongoing)
1.3 To maintain accurate content for the website and incorporate electronic options
1. Hire a writer to create and/or update website content (December 2011)
2. Integrate academic photos with testimonials (December 2011)
3. Determine best use and begin development of university videos (YouTube, website, etc.)
(December 2011)
4. Determine if a kiosk at the mall, MAFB and/or Bismarck would be feasible (December 2011)
5. Implement interactive campus map (December 2011)
6. Research feasibility for mobile website for minotstateu.edu (msubeavers.com mobile ready)
(December 2011)
7. Continue specific target marketing via internet sources (December 2011 and ongoing)
8. When appropriate, create specific URLS and phone numbers for tracking data (December 2011)
9. Position cost calculator in prominent location and redesign cost and financial aid pages to be
prospective student centered with a separate link for current student information (December
2011)
10. Get complete list of articulation agreements on website (December 2011)
11. Review academic content for accuracy and branding (March 2012)
12. Analyze and incorporate the ability to deliver a mobile site (March 2012)
13. Analyze E-comm Hobson strategies to Google Analytics (May 2012)
14. Assist athletic department with transitions to NCAA to support recruitment efforts (June 2012)
15. Establish web content review schedule (January 2012)
16. Research WCM software for university’s website (July 2012)
17. Update interactive campus map (December 2012 and ongoing)
18. Continue specific target marketing via internet sources (December 2012)
19. Run academic videos (December 2012 and ongoing)
20. Review complete list of articulation agreements on website (December 2012 and ongoing)
21. Separate prospective student and current student information on website to enhance prospective
student pages (December 2012)
22. Using best practices, enhance parents and families website (July 2013)
23. Implement new WCM software for university’s website (new budget) (July 2013)
24. Collaborate with the athletic department to review website content for recruitment purposes
(December 2013 and ongoing)
25. Redesign parents and families website (December 2013)
26. Continue specific target marketing via internet sources (December 2014)
27. Get complete list of articulation agreements on website (December 2014)
1.4 To review, analyze, and investigate most effective means of various types of print advertising—
including identifying the respective target markets

43
1. Begin working on promotional piece for adult students (this will be done in tandem with whoever
is responsible for developing the one-stop shop for non-traditional students) (October 2011)
2. Place ads in print media that primarily target parents, alumni, and friends of MSU (December
2011)
3. Revise materials for Enrollment Services for prospective high schools to maximize the yield of
traditional aged students (December 2011)
4. Review and update academic content of printed materials (December 2011)
5. Continue placement of billboards in North Dakota and create specialized 800# to measure
billboard effectiveness (December 2011)
6. Refresh Student Life/Housing brochure (December 2011)
7. Complete promo piece for adult students (March 2012)
8. Research ways to get MSU’s branding on community items such as water bottles, pop bottles,
restroom walls, etc. (May 2012)
9. Prepare and re-launch new programs—Energy Economics and Finance & Bioinformatics (May
2012)
10. Determine usefulness and costs for billboards for ND, MN, and Canada (July 2012)
11. Continue producing materials for Enrollment Services for high schools (December 2012)
12. Review and update academic content of printed materials (December 2012)
13. Place ads in print media that primarily target parents, alumni, and friends of MSU (December
2013 and ongoing)
14. Continue partnerships with companies to attain real estate on water bottles, pop bottles, etc.
(December 2013)
15. Update materials for Enrollment Services for high schools with new viewbook piece and college
fair high school visit pieces (December 2013)
16. Create junior print piece (December 2013)
17. Review and update academic content (December 2013)
1.5 To hire additional personnel for marketing office
1. Contract a creative writer to update academic program information, website content, recruitment
pieces, and MSU publications (December 2011)
2. Utilize student employees to assist with tasks (December 2011 and subsequent semesters
according to budget)
3. Contract a creative writer, and consider full-time permanent position, to update academic
program information, website content, recruitment pieces, and MSU publications (July 2012)
4. Hire a full-time creative writer (benefitted position) for the university—this position will be
responsible for academic program information, website content, recruitment pieces, MSU
publications, and web content for the university’s website; this person will also review all
marketing materials for appropriate content prior to printing (July 2013)
5. Review, analyze, and evaluate success—revise the plan as needed (July 2014)
6. Evaluate positions and position descriptions for modification (July 2014)
1.6 To enhance and create new events, networking initiatives, and marketing strategies to strengthen
relationships
1. Marketing office will offer two internal “Be in the Know” (professional development seminars
for MSU employees) sessions each semester (December 2011 and subsequent semesters)

44
2. Create new academic program launch process in coordination with the Public Information office
(December 2011)
3. Expand “MSU at the Mall” to two events per year (April 2012 and ongoing)
4. Marketing an “In the Classroom” program that would take faculty, staff, and students to schools,
community groups, Native American reservations, etc. in all of our target markets noted above
sharing MSU’s stories—initially start out with two visits per semester; CETL may be a natural
partner in this endeavor (June 2012)
5. Implement/enhance community/high school education fairs in the target markets (use technology,
when appropriate—i.e., Skype, IVN, etc.) (June 2012)
6. Market new parent/family program (July 2012)
7. Link Centennial Committee activities to admission and other marketing events that further brand
the university and promote enrollment at Minot State (December 2012)
8. Provide support as needed for the athletic department with Game Day events (December 2012
and ongoing)
9. Continue to market “In the Classroom” program and expand to four visits per semester (June
2013)
10. Create comprehensive marketing plan that is data driven (December 2013)
11. Implement Centennial events and ensure where appropriate events are linked to admission,
recruitment activities—at a minimum, ensure each event brands Minot State as a place to enroll, a
place of quality, a place of strong outcomes (December 2013 and ongoing)
12. Modify marketing plan that is data driven (December 2014)
13. Continue to market “In the Classroom” program and expand to seven visits per semester
including visits to Bismarck and the Air Force Base (June 2014)
ROI

45
Retention Strategies
Roadmaps Promotional Strategies
Creating 3, 4, and 5 year degree plans to increase student completion rates
1.1 To create roadmaps for academic advisors
1. Identify advising plans already in place by each department (major) on campus (December 2011)
2. Departments create 3, 4, and 5 year plans, as appropriate, that only include the major
requirements—Gen Eds will be added when room is available each semester—department will
indicate where Gen Eds fit, but do not need to specify (not all departments will include a 3 year
plan, but ALL departments must create a 4 and 5 year plan) (January 15, 2012)
3. Verify all information required by department with the VPAA and Registrar’s office (February
2012)
4. Begin disbursement of verified roadmaps to all stakeholders on campus (March 2012)
5. Formal education for all stakeholders on campus (April 2012)
6. Creation of a website that indicates these plans—listed on Enrollment Services, Departments, and
other specific links (April 2012)
7. Marketing pan to promote 3, 4, and 5 year plans (May 2012)
8. Develop a formal evaluation process to assess advising session (June 2012)
9. Develop a formal evaluation process to assess effectiveness of plans (June 2012)
10. Use roadmaps for 2012-13 academic year when advising (ongoing)
11. Implement formal evaluation process to assess advising session (ongoing)
12. Add questions in student section of grad application regarding if a student used a grad year
program plan and assess if that student completed in the same timeframe as the plan (June 2012-
June 2013)
13. Implement formal evaluation process to assess effectiveness of plans (June 2013)
14. Evaluate success of roadmap, identify any problems, modify programs (July 2013 and beyond)
ROI

46
Mentors Promotion Strategies
Integrate a culture of student success . . . etc.
1.1 To strengthen mentoring program
1. Hold student focus group to determine mentoring needs and who they feel would be valuable
mentors (Fall 2011)
2. Determine if departments have built in mentoring programs and identify those departments—
analyze if those programs are working by holding focus groups within those areas (Fall 2011)
3. VPAA and VPSA meet to determine if there is funding to support academic / SGA peer
mentoring program (Fall 2011)
4. Take input from student focus group(s) and develop mentoring options—for example, hometown
mentors, student organization mentors, degree specific mentors (Spring 2012)
5. To encourage student mentor participation, develop an incentive program—for example, credit
toward textbook purchase, internship credit, experiential learning credit or monetary stipend (Fall
2012)
6. Have social events / friendly competitions for mentor / mentees (Fall 2012)
7. Develop satisfaction survey and solicit suggestions for improvement from mentors and mentees
(Fall 2012)
8. Review feedback from fall 2012 and make corrective action plan for fall 2013 (Spring 2013)
9. Institute revised program (Fall 2013)
10. Continue assessment piece (2013)
11. Discuss expanding the program to outreach students (online, MAFB, Bismarck) (2013)
12. Continue assessing and refining the program (2014)
ROI

47
Grad Rates Promotion Strategies
Increase efforts to attract and graduate specific student population
1.1 To increase efforts to graduate specific student populations
1. Implementation of POWER program (in progress)
2. Increase the number of these students enrolling in FYE (in progress)
3. Increase advising efforts for these students (in progress)
4. Implementation of Veterans Affairs Program (Summer 2011)
5. Hiring of new Native American Director (Summer 2011)
6. Work to enroll more students in the above named student success programs (in progress)
7. Collect available data of reason why students leave our institution (2011)
8. Hire adult learning coordinator and Transfer Student Coordinator (could be combined) (2012)
9. Start on Smartphone app. that appeals to all students (2012)
10. Creation of a Transition to University life (more of the basic 101 material that is specific to
populations) (2012)
ROI
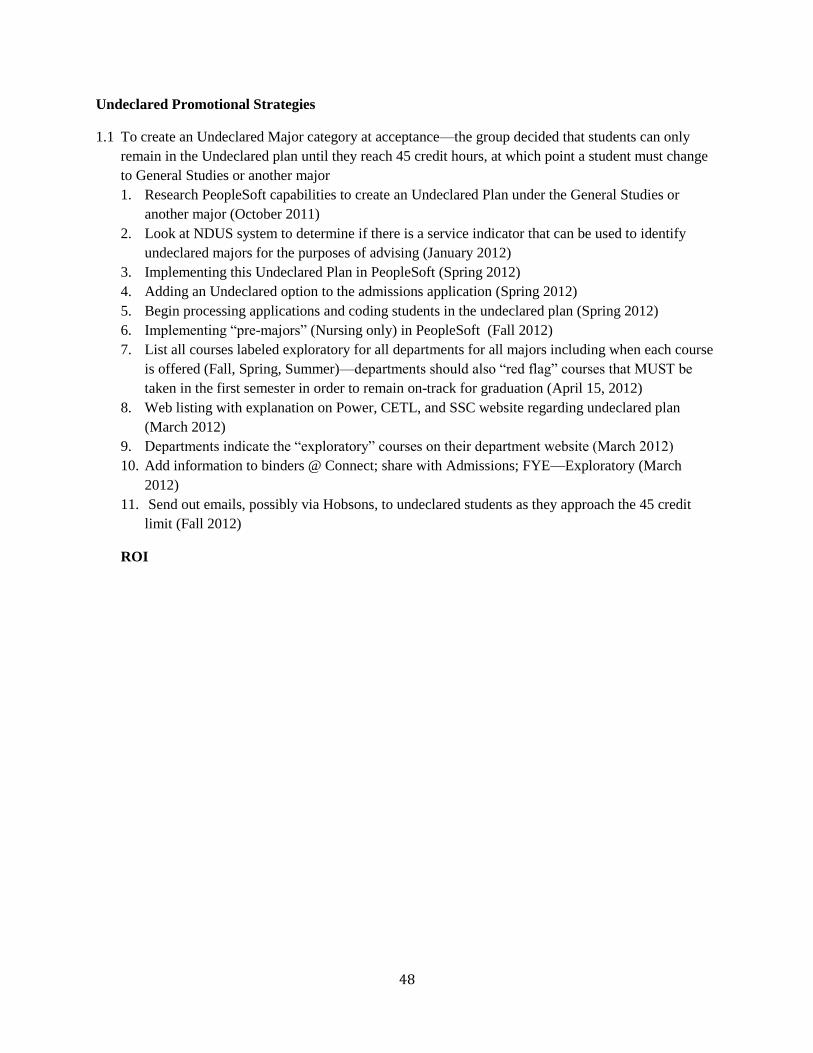
48
Undeclared Promotional Strategies
1.1 To create an Undeclared Major category at acceptance—the group decided that students can only
remain in the Undeclared plan until they reach 45 credit hours, at which point a student must change
to General Studies or another major
1. Research PeopleSoft capabilities to create an Undeclared Plan under the General Studies or
another major (October 2011)
2. Look at NDUS system to determine if there is a service indicator that can be used to identify
undeclared majors for the purposes of advising (January 2012)
3. Implementing this Undeclared Plan in PeopleSoft (Spring 2012)
4. Adding an Undeclared option to the admissions application (Spring 2012)
5. Begin processing applications and coding students in the undeclared plan (Spring 2012)
6. Implementing “pre-majors” (Nursing only) in PeopleSoft (Fall 2012)
7. List all courses labeled exploratory for all departments for all majors including when each course
is offered (Fall, Spring, Summer)—departments should also “red flag” courses that MUST be
taken in the first semester in order to remain on-track for graduation (April 15, 2012)
8. Web listing with explanation on Power, CETL, and SSC website regarding undeclared plan
(March 2012)
9. Departments indicate the “exploratory” courses on their department website (March 2012)
10. Add information to binders @ Connect; share with Admissions; FYE—Exploratory (March
2012)
11. Send out emails, possibly via Hobsons, to undeclared students as they approach the 45 credit
limit (Fall 2012)
ROI

49
Professional Development Promotion Strategies
Professional Development, Faculty
1.1 To get faculty together to establish the validity of and strategies for early engagement and assessment,
and share information about how and when to make use of the various support services
1. Implementation of “Partners in Learning” (PIL) program (Fall 2011)
2. Prepare a short presentation for January convocation, and then hold a few mini-sessions the
following day (January 2012)
3. Explore ways to get faculty together for exchange of ideas, either informally (coffee hours) or
more structured (meeting held by faculty featuring short presentations on our research, teaching,
or other professional projects—two or three per semester) (May 2012)
4. Consider guest presenters on aspects of professional development for August convocation—
follow up spring activity with convocation/mini-session presence (August 2012)
5. Finalize a schedule of faculty presentations / informal meetings for 2012-2013 year (August
2012)
6. Create plan for sessions / guests during January convocation and assessment days (October 2012)
7. Respond to the 2012 activities by firming up traditions of faculty development on campus
(August 2013)
ROI

50
Parent Website Promotion Strategies
Create parent and family programs
1.1 To create parent page with information regarding expectations of higher education, major programs,
etc.
1. Identify information (distinct categories) to be included on parents website (November 2011)
2. Write scripts specifically for each category (December 2011)
3. Work with IT to create this part of the website (January 2012)
4. Have website created and ready for launch (March 2012)
5. Launch parents part of MSU website (April 2012)
6. Update website with information for new academic year (ongoing 2012 and beyond)
ROI

51
Early Alert Promotion Strategies
Use of College Student Inventory to our Early Alert purposes and identification of drop-out prone
students
1.1 To establish an effective early alter system
1. Create an Early Alert Committee, which consists of advising staff, CETL, POWER, and
institutional research staff that will establish procedures and protocol for the MSU early alert
system (December 15, 2011)
2. All areas look to determine number of provisionally admitted students have dropout prone
indicators (2011)
3. Campus presentation on the procedures established by committee (April 2012)
4. Administration of CSI to all incoming freshmen students and transfer students (April-August
2012)
5. Creation of advisor packets that include detailed explanation of the CSI instrument and how to
use the CSI advisor report (August 2012)
6. Dissemination of advisor packets to advisors—identification of students on dropout list to be
provided to advisors and requirement of at least two one-on-one meetings before October 21,
2011 (August 2012)
7. Mid-term deficiency report to be gathered and compared to CSI advisor reports—students
appearing on deficiency report and CSI dropout prone report advisors must be contracted and
required to meet with student (October 2012)
8. Continue identifying measures to track student retention (February 2013)
9. Implementation of fully functioning early alert initiative with additional measures identified in
2013 (end of year 2013)
ROI

52
Experiential Promotional Strategies
Integrate a culture of student success that actively engages students, faculty, and staff to fulfill our
mission, vision, and values
1.1 Creating an Engaged Experiential Transcript that will include engagement activities as well as
courses with service-learning or “engaged” designations
1. Create an engagement committee, which consists of both faculty and staff whose purpose is to
examine what engagement experiences will be eligible for this transcript, how to create this
transcript, and coordinate with Gen Ed AD Hoc to determine what will be required and what will
be voluntary (December 15, 2011)
2. Campus passing a gen ed model that includes engagement experiences that are required for
graduation (Spring 2012)
3. Finalize list of engagement experiences that will be eligible and determine who will oversee these
activities (May 2012)
4. Develop and finalize the layout of transcript, which include a fluid system that will allow for
approval from departments, organizations, etc. (May 2012)
5. Marketing of this transcript to current students, first-year students, faculty, and staff (Beginning
May 2012)
6. Continue identifying experiences that would be eligible by meeting with all faculty, specifically
in departmental meetings (February 2013)
7. Implementation of Gen Ed Model for academic year of 2013-2014 that includes the first-year
engagement experience and a capstone experience as a graduation requirement (Fall 2013)
ROI

53
Red Alert Promotion Strategies
Integrate a culture of student success that actively engages students, faculty, and staff to fulfill our
mission, vision, and values—the goal of Red Alert is to bring MSU students together in a fun atmosphere
while leading a strong spirit group for our campus activities
1.1 To create Red Alert activities all around campus, not just athletics
1. Discuss mission of Red Alert with student life to see if they can incorporate theater, music,
campus speakers, etc. into the Red Alert calendar (October 2011)
2. Have Red Alert start promoting theater and music (etc.) productions (2011 and continuing)
3. Have a representative from Red Alert at all functions on campus (with a scanner) to keep
attendance records (2011 and continuing)
4. Have Red Alert continue promoting theater and music (etc.) promotions (2012 and continuing)
ROI

54
Appendix
Data Summaries
Key Performance Indicators
Data Review
Enrollment Projection Scenarios

55
Minot State College Data
Vision 2013
Strategy Seven: Ensuring future institutional viability, vitality, and Growth. Priority Three: Create a
highly effective and responsive recruitment and retention service in order to increase enrollments
strategically to ensure campus vitality and focus on mission and vision.
Minot State Fact Book (2010)
Of all state institutions, Minot has the fourth highest enrollment at 3,866 students. The data also
demonstrates that, while 70 percent of your first-year students return for a second year, many do not
return at sophomore status. The number of freshmen (under 30 hours) and seniors (over 90 hours)
demonstrates you have fewer students completing the required 30 hours in their first year, and more
students taking longer than four years to complete their degree. Females student enrollment has remained
the same for several years, at about 63 percent of all enrolled. 21 percent of students enrolled are from out
of state, of which 34 percent are students from Canada. Transfer student enrollment has dipped over the
past five years but enrollments are beginning to grow.
Common Data Set (2009-2010)
Common Data Set demonstrates the number of students and the diversity of degree offerings. Minot
offers a variety of academic programs. The common data set shows several programs do not graduate any
or very few students within their major. Majors with the highest number of graduates are criminal justice,
education, business, and health sciences.
Additionally, student enrollment mirrors state enrollments in that most students are white. An institutional
strength is the number of students enrolling from Canada, particularly in majors within the health sciences
areas.
Enrollment Patterns Data
Applications have increased in recent years after a slump from 2004 to 2008. As is a national trend, the
percentage of applicants enrolled continues to decrease. This phenomenon is troubling for all institutions
and reinforces the need to aggressively work with new application prospects as soon as they can be
identified. Despite application numbers of transfer students returning to previous averages, the percentage
of enrolled applicants has dropped dramatically over the past five years. Despite numerous efforts to draw
from a larger range of students from North Dakota, the majority of students who enroll are from the
northwest region and, in particular, from Ward County.
Retention Rates Trend Data
Approximately 70 percent of first-year students return for a second year. Using 2002 IPEDS graduation
data, only 13 percent of students graduated in four years, 26 percent graduated in five years, and 30
percent in six years. 2004 graduation data shows an improvement of the six-year graduation rate data to
39 percent.
Retention by 2008 Cohort by Program
Data was collected reviewing 2008 to 2009 retention by entering program. Programs with more than 10
students declared upon entry (corporate fitness, computer science, pre-elementary education, biology, and
communication disorders) retained above the institutional average (70 percent). Programs with 10 or more
students with a major declared upon entry (management, art, chemistry, and general studies) retained
below the institutional average.

56
Hobsons Minot State Report on Foreign Recruitment
The Hobsons report recommends a strong opportunity to grow international markets outside of Canada.
Tuition costs, safety, and diversity of programs that align with international interests are strengths for
Minot. Strategies identified within the Hobsons plan will be integrated into the SEP.
Great Plains Peer Institution Data and IPED Data Feedback with Peer Comparison (2010)
Data provided through a comparison of peer institutions shows graduation, retention, and all averages are
below peers, which has been known for many years throughout campus. Of particular interest is the fewer
number of students who are Pell-eligible. This means more students attending Minot have the ability to
pay to attend college then Great Plains peers. Also of note was that, while MSU provides very low in-
state tuition compared with peer in-state tuition, the average net cost per student is higher at Minot State
than Great Plains peers. Out-of-state tuition costs make MSU much more affordable and could provide a
competitive advantage as students seek Minot because of growing business opportunities within the
region.
Marketing Data
The Web site has seen some 60 million “hits” since 2009; 6,475 distinctive hits (i.e. individual user) have
visited through targeted market efforts. Data indicates strong usage and direct marketing efforts
(postcards and other media driving to specific URL sites) are strong and increasing. The ASK MSU site
has seen tremendous growth, particularly for prospective students from Canada. Through Google
Analytics, the “academic program of study” site is the top Web site hit from external Web searches. The
Webcam of construction projects continues to receive strong usage. Image campaigns have had mixed
results and usage to make changes. The last study of institutional image and perceptions was completed in
2004. Currently, there is little e-communication to parents of current or prospective students. Social
media mediums have been created and are updated regularly, but more intentional efforts to gather and
drive information through these mediums needs to be created.
Grow North Dakota
Of the students from North Dakota, 46 percent did not remain enrolled from 2010 to 2011. Additional
strategies, yet to be determine for effectiveness, are targeted in growing enrollments at Minot State from
outside of the state or country, as well as from within the state. The goal of this growth strategy is to
educate, and hopefully retain within the state, students who enroll at a North Dakota school.
Minot Air Force Base Data
Enrollment at the Air Force Base continues to decline with fierce competition being offered through Park
University and Central Michigan University. The number of “non-degree-seeking” students is very large
and a huge persistence risk, as these students may seek to matriculate at Park University rather than
Minot.
Transfer Student Feeder Programs
Of students who transfer from two-year institutions within the state, Minot enrolls the second or third
largest number of transfer students. However, number of enrollments is significantly lower than
Dickenson State (average 150 enrolled), who is enrolling three to four times the number of transfer
students compared to Minot (average 35 enrolled).
Athlete Graduation Rates
Athlete cohort graduation data has a five-year average of 35.8 percent, with increases in the 2002 and
2003 cohort. The graduation rate is slightly above the overall Minot average by 5.2 percent. As the
institution transitions from NAIA to NCAA II, this graduation rate will be below NCAA completion
averages. Additionally, new admissions standards (ACT of 22 or higher) are above the average ACT

57
score of the student athletes, which may also cause some competition and student-athlete recruitment
challenges.
Headcount by Academic Major (2011)
The 2010 fact book shows 13 majors in arts and sciences, two majors education and health sciences, and
one major in business with 10 or fewer students enrolled in the academic program. It should be noted that
virtual business and communication disorders education are newer majors.
Graduate Enrollments
Applications to graduate programs grew slightly over last year comparisons. Of the applications
completed, 23 percent are non-degree. The largest number of applications is for the communications
disorder program.
Student Age (2011)
Of the student total, approximately one-third of Minot students are over the age of 25. Of the full-time
students, approximately 23 percent are over the age of 25.
ACT Outcomes Survey – Minot Student
83 percent of respondents reported being employed full-time or continuing to pursue an advanced degree.
66 percent of graduates are earning at or above the average income in North Dakota ($32,000). 95 percent
of respondents believed their degree from Minot prepared them for their career. 82 percent of respondents
would enroll again. 70 percent would recommend Minot without reservation. While graduates reported
higher levels of satisfaction with their academic experience and outcomes, there were lower levels of
engagement overall.
North Dakota Data (External Collection)
North Dakota Employment Projections to 2017 – Job Service North Dakota
When examining North Dakota employment projections, numerous large-growth occupations (above
1,000 new or new and replacement openings) will not require any advanced-level degrees. When
examining employment predictions where a bachelor’s degree is required, the top five growth openings
(new and replacement) are areas where Minot offers the major needed for employment in that field. In
addition, employer data would indicate that both education major and business majors are well prepared
for employment upon earning a Minot degree. In examining employment that requires an advanced
degree, Minot offers four of the top ten employment opportunities.
North Dakota Occupational Growth Projection – ND State Demographics Web
Job growth data is easy to misinterpret. If looking at percentage of change (growth), some indicate large
growth rates. If looking at actual number of job opportunities, the actual numbers of jobs for positions
requiring a bachelor’s degree are less than 100. As Minot looks to market and link majors with job
opportunities, we have to delicately balance growth percentages with entering or graduating student
expectations related to the true number of job opportunities. Jobs with the largest number of actual jobs
needed are financial analysts, computer system analysis, accountants, and education-related majors.
North Dakota ACT State Report
Appreciating the Great Plains competitors when examining where students who apply to Minot also
apply, the majority of students are also applying to North Dakota State, University of North Dakota, and
Bismarck State. Of the total number of North Dakota test-score takers, Minot receives the fourth largest
amount of test scores, very closely followed by North Dakota State College of Science and Minnesota
State University Moorhead. Only 224 of the 2010 test-score takers reported Minot as their number one

58
choice of attendance. This places a higher need to increase marketing efforts to the other 420 students
who send their test scores to Minot.
ACT Averages of Major Interest and Minot Admission Criteria
ACT provides a list of student interest by major area and the average ACT score of all test-takers within
North Dakota. With Minot’s new admission criteria, four major areas of student interest meet the new
criteria (22 or above). Of those four major areas, Minot only offers two program categories (foreign
language [total number of interested students 34] and health sciences [total number of interested students
1,213]). Several other major areas have ACT averages between 20 and 21. While this is certainly an
average and there are students above the average, this new criteria makes the competition to yield strong
students even more difficult if admissions is expected to meet and grow enrollment targets.
North Dakota ACT Work Force Preparedness
Appreciating the MSU increase in admissions standards, the state ACT work force preparedness
demonstrates gaps in preparedness with entering students. Overall, students are prepared; by content area,
some students demonstrate a deficiency in one performance area. These students are not candidates for
the Passport program, but are in need of remediation.
Additionally, the report provides that there is a larger need for education, management, health care, and
computer specialties than there are interested students. Conversely, there are more students interested in
engineering majors than there are positions available or expected to be available through 2018.
Student Enrollment by County
Enrollment by top counties continues to fluctuate slightly. Ward County continues to provide the most
students. This places a higher level of vulnerability for Minot in that, while Ward County continues to see
growth related to the oil and geothermal industries, fewer jobs are being created within the county that
require a college degree.
Top 10 Counties that Students Come From
4. County 5. Fall 2009 6. Fall 2010 7. % Change
8. Ward 9. 1,979 10. 2,110 11. 7%
12. Burleigh 13. 146 14. 153 15. 5%
16. Williams 17. 77 18. 84 19. 9%
20. McHenry 21. 90 22. 79 23. -12%
24. Mountrail 25. 79 26. 72 27. -9%
28. Bottineau 29. 62 30. 67 31. 8%
32. Morton 33. 52 34. 55 35. 6%
36. Rolette 37. 59 38. 52 39. -12%
40. Cass 41. 40 42. 45 43. 13%
44. Renville 45. 41 46. 45 47. 10%
North Dakota College Enrollments by State
72 percent of students who graduated from a North Dakota high school and attend post-secondary
education attend a North Dakota school, followed by Minnesota (17%) and South Dakota (2%). North
Dakota attracts 5.6 percent (1,895 actual students) of Minnesotans to North Dakota and is second only to
Wisconsin. Of Montana students, North Dakota attracts 3 percent (187) of their students. Interestingly,

59
South Dakota has more students attending institutions in Minnesota and Nebraska than North Dakota. Of
those who attended college from Washington and Oregon, North Dakota did not make the top ten states
attended.
North Dakota Grade K-12 Enrollment Projections
Given Minot’s major feeder county is Ward County, current enrollment of residents from Ward Count is
as follows compared to the state.
Current Enrollment from Ward County
48. Education 49. Minot 50. State
51. Elementary 52. 3,527 53. 73,725
54. High School 55. 2,052 56. 41,564
57. College or Graduate 58. 2,999 59. 47,403
North Dakota K-12 – Enrollment Projection for Public Schools
In addition to decreases in high school enrollment, the overall pool of students from within North Dakota
is also very small, with current enrollments showing about 7,000 high school graduates and only 72
percent of those graduates attending post-secondary education immediately after completing high school.
In addition, the number of undeclared or undecided populations of those who attend is growing.
Numerous studies have shown this population is at risk of attrition.
North Dakota Graduation, Readiness, and College Graduation Rate – Alliance for Excellent
Education
North Dakota significantly exceeds the national average of high school graduates (81 percent compared to
60 percent national). Additionally, ACT data reports that students are slightly above average for all
college sub-test scores, but only 24 percent of college-bound students from North Dakota meet all four
sub-test scores for preparedness, with science areas showing the least level of preparedness. Conversely,
North Dakota students who start enrollment in post-secondary education complete college below the
national average. The graduation rate from post-secondary education is 46 percent compared to 56
percent nationally. Students in all classifications (white, Hispanic, Black, etc.) are all below national
averages, with only 11 percent of Native Americans who started post-secondary education completing a
college degree.
North Dakota 2010 Census Data – ND State Demographics Web
The diversity of students within North Dakota has remained almost stagnate. This trend disputes all
national averages. In particular, the completion rates of African-American, Hispanic, and Native-
American students are all less than half of those who enroll as a high school freshman. ACT test-score
averages also demonstrate that a great number of these diverse students do not meet new admission
criteria for Minot.
Student Affordability Report – North Dakota University System
11.3 percent of household average income is the cost of attending Minot State. This cost makes Minot
very affordable for the average family.
North Dakota NW Region Work Development Plan
The workforce plan is focused primarily on helping residents of North Dakota gain employment. Many of
the employment needs match the current state needs for residents without high education credentials.
However, the data indicates this demand will change and opportunities for future partnerships may exist.

60
Degree Needs to 2018 – Lumina 2010
70 percent of North Dakota’s jobs will require postsecondary education by 2018. Between now and 2018,
North Dakota will need to fill about 120,000 vacancies resulting from job creation, worker retirements,
and other factors. Of these job vacancies, 80,000 will require postsecondary credentials, while only
40,000 are expected to be filled by high school graduates or dropouts.
National Data (External Collection)
ACT Projection in High School Graduates (2008, 2010)
According to updated ACT data, the 2018 projection of the number of high school students is expected to
decrease by 18 percent. In addition, all border states will see a decrease in high school enrollments, with
Montana and Wyoming also reporting double-digit declines. Looking to 2020, North Dakota continues to
have a decrease in high school graduates (despite overall population growth) with a decrease of 13
percent. All border states, though, see an increase in high school graduates, with Minnesota (4 percent)
and Wyoming (5 percent) having the largest increase. It should be noted that Wisconsin only expects to
see a one percent increase, and Illinois (-4 percent) and Michigan (-10 percent) expect to see decreases.
Some recent enrollment projections predict Michigan will see an even larger decrease requiring upper-
Michigan institutions to push harder for increased out-of-state markets (Wisconsin and Minnesota).
WICHE (Western Interstate Commission for Higher Education) Enrollment and Diversity
Projection and Noel-Levitz Projection Data
Both WICHE and Noel-Levitz have conducted studies to review enrollment trends and diversity patterns
nationwide. Data confirms some states will continue to see noticeable decreases in high school enrollment
and increases in potential adult markets. Of particular note from the Noel-Levitz study is that, in several
states where enrollment increases or remains about the same, the diversity and level of preparedness is not
the same, with fewer students prepared for college-level work and even fewer students able to afford
college.
Ability to Pay and Trends in College Pricing 2010 – The College Board and 2009 US Census Bureau
US Census data shows the average North Dakota family has strong ability to pay for Minot State at its
current cost. In fact, more (above half) American families have the ability to pay for Minot State at its
current price structure, particularly when adding in Pell grants, compared to other in-state schools (for
students enrolling in their home state, aka not North Dakota).
ACT Retention and Graduation Rates (2010)
Given Minot’s new admission criteria (22 or above), the first-to-second year retention rate is
approximately 10 percentage points below the national average (71 percent Minot; 81 percent national).
Graduation rate averages are approximately 15 percentage points below national averages (39 percent
Minot; 54 percent national).
Canada Data (External Collection)
Alberta Employment Rate Data and Employment Demand to 2017
Alberta employment data shows robust employment and increased number of grade 11 or 12 students
attending post-secondary education. Numerous employment data needs match Minot State’s offerings,
with a strong need for employees and managers in the health-related area. Additionally, Alberta continues
to see growth in post-secondary diplomas and degrees. Of those who complete a university degree, 85
percent are actively employed.

61
Saskatchewan Labour Market Demand Ministry of Advanced Education, Employment, and
Labour 2009-10 Report
Saskatchewan Labour reports are similar to Alberta. Costs for Saskatchewan post-secondary institutions
are below Minot for two-year diploma programs and slightly higher for students enrolled in university.

62
Minot State University Key Performance Indicators
Table One: Summary of Enrollment Key Performance Indicators (KPIs)
KPIs Three-year Mean
2010-2011 Metric/Empirical Definition
Inquiries N/A N/A Total number
Applicants 735 1163 Total number
Applicants – two-year N/A N/A Total number of applicants who identify on application that they intend to transfer to another institution and not complete a degree from Minot
Acceptance rate 557=76% 672=58% Percent admitted students
Yield rate 453=81% 462=69% Percent of students accepted who enrolled
Undergraduate freshman cohort 429 437 Total number of first-time, full-time freshman enrolled at census date
Undergraduate new student count 765 711 Total number of new students enrolled at all campuses
Undergraduate new student count - AFB
127 111 Total number of new students enrolled through AFB center
Undergraduate new student count - Bismarck
30 32 Total number of new students enrolled through Bismarck center
Undergraduate new student count - online
184 146 Total number of new students enrolled and taking courses exclusively online
Undergraduate headcount 3356 3321 Total number
Undergraduate FTE 2672 2596 Total number of units attempted divided by 15 enrolled in bachelor- level program
New transfers 313 251 Total number of students entering from another institution enrolling in a bachelor level program
Nontraditional (Minot Campus) 1725 1588 New nontraditional students (students above the age of 22) enrolled in bachelor degree program with 12+ credit hours
Passport 10 30 Number of students enrolled in passport program enrolled in 12+ credit hours
Enhancement Center N/A 43 Number of students enrolled in the Enhancement program enrolled in 12+ credit hours
Gender – Female 265 249 Total number of female freshmen entering at bachelor degree level
Gender – Male 163 188 Total number of male freshmen entering at bachelor degree level
Ethnicity 96 106 Percent of freshmen students who identify non-white at application enrolled in bachelor degree programs

63
Ethnicity – Native American 3 1 Percent of freshmen students who identify as Native-American at application enrolled in bachelor degree programs
Athlete 75 67 Number of new students entering as a student athlete
Athlete (Transfer) 16 17 Number of new students entering as a student athlete with transfer status
Table Two: Summary of Student Quality KPIs
KPIs Three-year Mean
2010-2011 Metric/Empirical Definition
Average high school GPA 3.3 3.33 High school cumulative grade point average
Top high school quartile N/A 35 Percent of students who enter graduating in the top quarter of their high school graduating class
ACT range 14-32 15-34 Range of ACT scores for students enrolling in bachelor degree program
ACT average 21 22 ACT average score of freshmen enrolling in bachelor degree program
GPA average – transfer 2.5 2.6 Average GPA of entering transfer student
Credit average – transfer 65 51 Average number of credit hours earned from previous institution(s) prior to enrolling at Minot State
CSI – transfer rate 63 65 Number of students who reported on CSI plans to transfer from institution upon entry
CSI – first-generation 19 21 Number of students who reported on CSI that he/she is a first-generation college student
Table Three: Summary of Student Progress KPIs
KPIs Three-year Mean
2010-2011 Metric/Empirical Definition
Undergraduate first- to second-year return rate
70 63 Percent of freshman cohort returning for a second year
Undergraduate second- to third-year return rate
N/A Percent of freshmen cohort returning for a third year
Undergraduate third- to fourth-year return rate
N/A Percent of freshmen cohort returning as fourth year
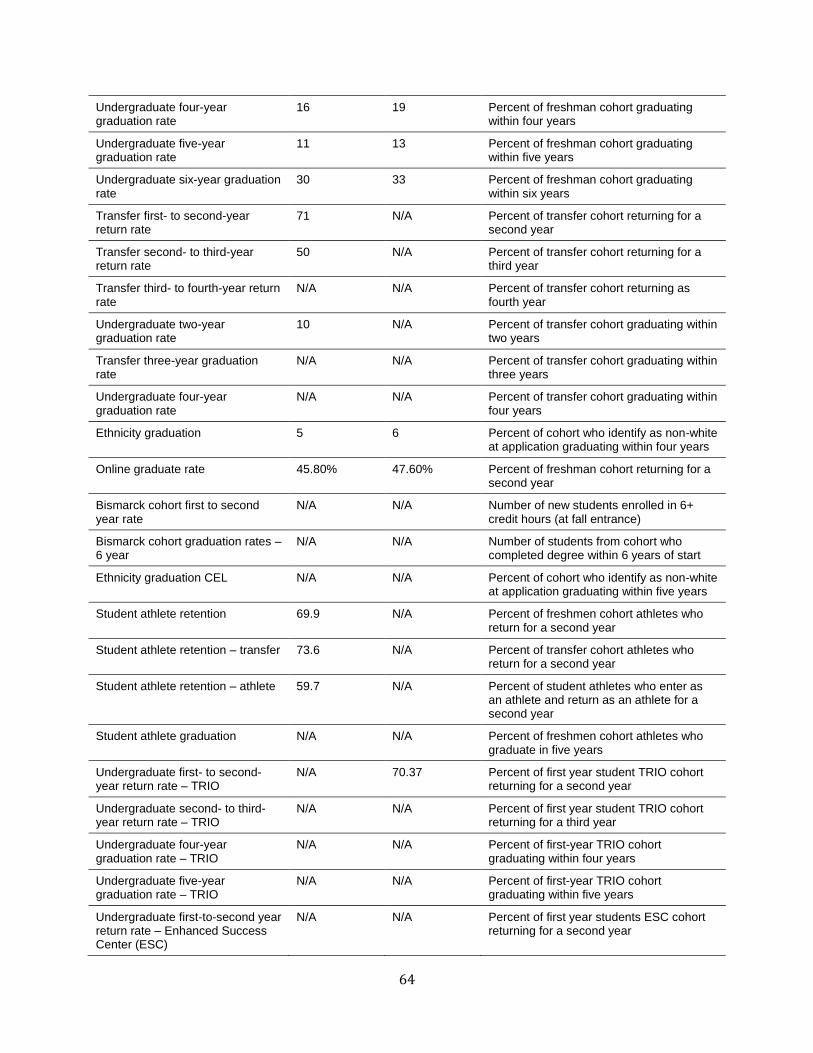
64
Undergraduate four-year graduation rate
16 19 Percent of freshman cohort graduating within four years
Undergraduate five-year graduation rate
11 13 Percent of freshman cohort graduating within five years
Undergraduate six-year graduation rate
30 33 Percent of freshman cohort graduating within six years
Transfer first- to second-year return rate
71 N/A Percent of transfer cohort returning for a second year
Transfer second- to third-year return rate
50 N/A Percent of transfer cohort returning for a third year
Transfer third- to fourth-year return rate
N/A N/A Percent of transfer cohort returning as fourth year
Undergraduate two-year graduation rate
10 N/A Percent of transfer cohort graduating within two years
Transfer three-year graduation rate
N/A N/A Percent of transfer cohort graduating within three years
Undergraduate four-year graduation rate
N/A N/A Percent of transfer cohort graduating within four years
Ethnicity graduation 5 6 Percent of cohort who identify as non-white at application graduating within four years
Online graduate rate 45.80% 47.60% Percent of freshman cohort returning for a second year
Bismarck cohort first to second year rate
N/A N/A Number of new students enrolled in 6+ credit hours (at fall entrance)
Bismarck cohort graduation rates – 6 year
N/A N/A Number of students from cohort who completed degree within 6 years of start
Ethnicity graduation CEL N/A N/A Percent of cohort who identify as non-white at application graduating within five years
Student athlete retention 69.9 N/A Percent of freshmen cohort athletes who return for a second year
Student athlete retention – transfer 73.6 N/A Percent of transfer cohort athletes who return for a second year
Student athlete retention – athlete 59.7 N/A Percent of student athletes who enter as an athlete and return as an athlete for a second year
Student athlete graduation N/A N/A Percent of freshmen cohort athletes who graduate in five years
Undergraduate first- to second-year return rate – TRIO
N/A 70.37 Percent of first year student TRIO cohort returning for a second year
Undergraduate second- to third-year return rate – TRIO
N/A N/A Percent of first year student TRIO cohort returning for a third year
Undergraduate four-year graduation rate – TRIO
N/A N/A Percent of first-year TRIO cohort graduating within four years
Undergraduate five-year graduation rate – TRIO
N/A N/A Percent of first-year TRIO cohort graduating within five years
Undergraduate first-to-second year return rate – Enhanced Success Center (ESC)
N/A N/A Percent of first year students ESC cohort returning for a second year

65
Undergraduate four-year graduation rate – ESC
N/A N/A Percent of ESC cohort graduating within four years
Undergraduate five year graduation rate – ESC
N/A N/A Percent of ESC cohort graduating within five years
Provisional Credits A N/A 34 20-21/ 940-1010 SAT and 2.5-3.249 GPA
Students in this category will be accepted with enrollment provisions including a 17 credit enrollment limit
Provisional Credits B N/A 74 18-19/ 860-930 SAT and 3.0-3.249
Students in this category will be accepted with enrollment provisions including a 15 credit enrollment limit
Major retention rate Remove per Dr. Koczon Retention by College
Graduation rate by major Remove per Dr. Koczon 3, 4, 5, 6 year graduation rates
Transfer to another NDSU System Institution
76 N/A Of those who transferred the percent who transferred to another institution within the NDSU system
Pre-major program - retention rate For students identified in pre-major program, the number (or percent) of students who returned for a second year
Pre-major program – graduation rate
For students identified in pre-major program, the number (or percent) of students who graduated in 6 years
Table Four: Summary of Program Quality KPIs
KPIs Three-year Mean
2010-2011 Metric/Empirical Definition
Student/faculty ratio 13 14 FTE divided by # of full-time faculty
Average undergraduate class size 15 15 Number of students enrolled in classroom type class divided by the number of full time faculty
Average experiential/lab size Number of students enrolled in lab or experiential related courses divided by the number of faculty who teach these courses
Percent of full-time faculty 59 56.88 Percent of faculty teaching full-time compared to total number of faculty
Academic Advising Ratio Average number of students per full-time faculty advisor
Full-time Special Contract 13.48 11.93 Percent of faculty teaching full-time load with special contract status
Teaching Overload 53.08 54.3 Percent of faculty teaching overload (above expected course delivery load)
Adjunct 41 43.12 Percent of instruction being taught by adjunct faculty
Student engagement summary scores (NSSE)
See NSSE Tab See NSSE Tab Scores reported at or above national or institutional type mean average

66
Student satisfaction summary score from the Student Satisfaction Inventory (SSI)
See SSI Tab See SSI Tab Majority of satisfaction scores in top quartile compared to peer average
Placement of graduates 87% Percent of graduates employed or enrolled in graduate school six months after graduation
Internships 0 19 Number of students who participated in a for-credit internship
Capstone Course Exit Survey Information to gather course outcomes (Note: Survey results link will be embedded into this document)
Table Five: Fiscal Health KPIs
KPIs Three-year Mean 2010-2011 Metric/Empirical Definition
Revenue increases based on retention
N/A N/A Percent of next year budget increased based on retention increase assumptions using retention estimator
Tuition as percentage of revenue
30.41 28.74 Percent of tuition earned of total budget
Undergraduate Research 1,050,549.01 564,652.43 Dollars collected from external grants conducted as a part of undergraduate research projects
Entering student discount Not Reported Not Reported Percent of overall award amount discounted from tuition (as defined by NACUBO) for entering students
Returning student discount
Not Reported Not Reported Percent of overall award amount discounted from tuition (as defined by NACUBO) for all returning students
All Student tuition discount Not Reported Not Reported Percent of overall award amount discounted from tuition (as defined by NACUBO) for all students
Award gap between student need and actual financial aid awards
60.01% 54.58% Amount of dollars not awarded (or gap) between student need and amount awarded
Default rate 2.8 N/A for 2011 Percent of past students who default on student loan payments
State appropriations Not Reported Not Reported Percent of state award per student
State appropriations – Grow North Dakota
Not Reported Not Reported Percent of state award per new student enrolled for “Grow North Dakota” initiative
Recruitment costs – Minot Campus
$224,000 $347,000 Average cost per student to recruit students who enroll to census
Recruitment costs – AFB and Satellite Campuses
0 0 Average costs per student to recruit students who enroll to census

67
Scholarship/Grants AFB and Satellite Campuses
0 0 Percentage of student who receive an institutional scholarship or state or federal aid
Marketing expenses 237,248 229,405 Percent of total budget allocated to marketing expenses (exclusive to marketing department, not dollars within recruitment/admissions budget)
Academic expenses 4.41 6.7 Percent of total budget allocated to academic expenses
Student life expenses 6.4 7.26 Percent of total budget allocated to student life/co-curricular expenses (excluding residence halls)
TRIO expenses N/A $132,772.02 Amount of dollars spent on TRIO program in alignment with grant allocation
Title III expenses $58,530.57 $431,617.31 Amount of dollars spent on Title III programs in alignment with grant allocation
Student Success Center expenses
N/A N/A Percent of total institutional budget allocated towards student success center operations
Expanded Student Success
N/A N/A Percent of total institutional budget allocated toward
CEL expenses 43.28 41.01 Percent of total institutional budget allocation towards CEL operations
Athletic expenses 4.96 5.05 Percent of total budget allocated to athletic related expenses (excluding intramurals)
Residence life revenue 5.86 6.51 Percent of total budget revenue received from room rate
Residence life expense 8.24 9.52 Percent of total budget allocated to residence life related expenses
Table Six: Summary of Co-Curricular Student Engagement Key Performance Indicators (KPIs)
KPIs Three-year Mean
2010-2011 Metric/Empirical Definition
Student organization 105 108 Number of student organizations
Active student organizations 53 56 Number of student organizations registered and active
Work study 119 96 Number of students working in a work study position (actual number of students, not work study positions)
Number of campus programs 75 78 Number of programs sponsored by student activities programming board

68
Attendance N/A N/A Average number of students attending campus wide programming events
Attendance – On-campus N/A N/A
Average number of students attending campus wide programming events who reside on-campus
CETL 32 5 Number of student programs/activities offered per year
CETL 0 1500 Average number of students attendance by program/activity offered per year
Number of campus community service programs
N/A 1 Number of programs sponsored by campus wide efforts
Student participation in community service programs
N/A 5 Total number of actual students participating in campus wide community service efforts
Study abroad 5.33 9 Number of students who participated in a fall, spring, or summer study abroad experience
Study trips 2.33 4 Number of study trips completed
Study trip participation 13 15 Total number of individual students who completed study trip experience
Residence halls 12.65 16.19 Percent of students who live in residence halls
Residence hall retention 43.9 49.4 Percent of students who lived in residence and returned to institution for a second year
Residence hall retention 74.43 73.79 Percent of students who lived in residence hall and returned to the residence halls for a second year
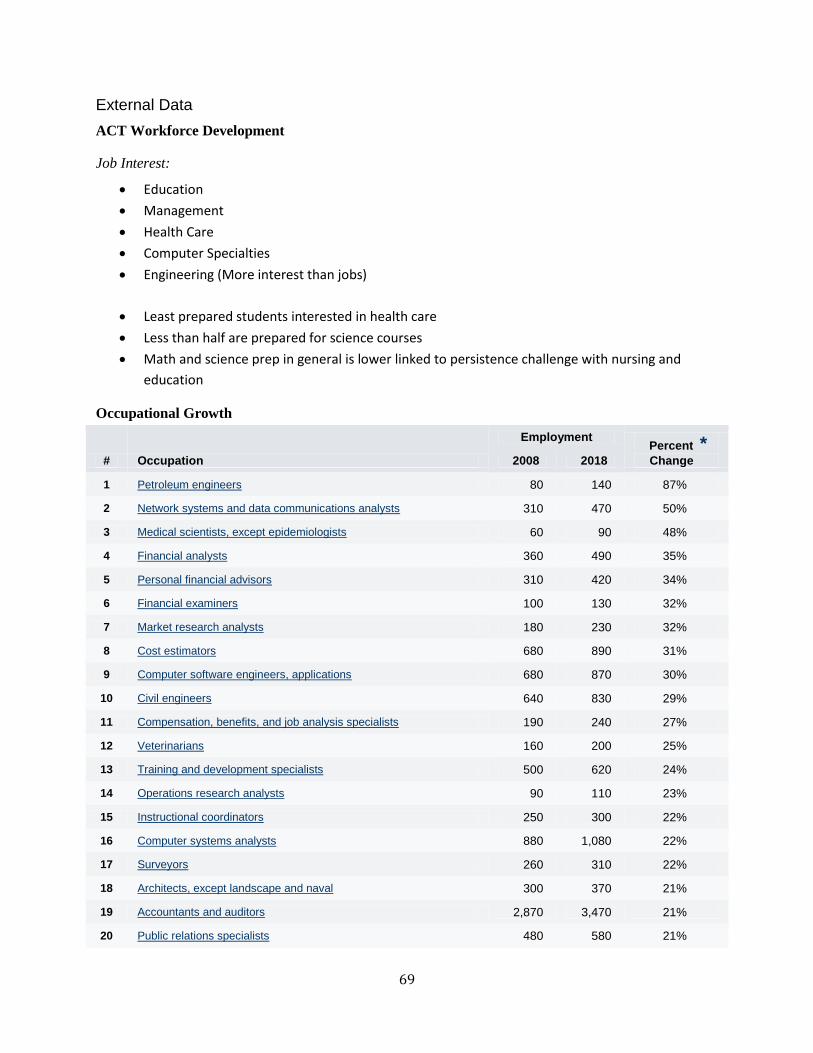
69
External Data
ACT Workforce Development
Job Interest:
Education
Management
Health Care
Computer Specialties
Engineering (More interest than jobs)
Least prepared students interested in health care
Less than half are prepared for science courses
Math and science prep in general is lower linked to persistence challenge with nursing and
education
Occupational Growth
# Occupation
Employment Percent *
Change 2008 2018
1 Petroleum engineers 80 140 87%
2 Network systems and data communications analysts 310 470 50%
3 Medical scientists, except epidemiologists 60 90 48%
4 Financial analysts 360 490 35%
5 Personal financial advisors 310 420 34%
6 Financial examiners 100 130 32%
7 Market research analysts 180 230 32%
8 Cost estimators 680 890 31%
9 Computer software engineers, applications 680 870 30%
10 Civil engineers 640 830 29%
11 Compensation, benefits, and job analysis specialists 190 240 27%
12 Veterinarians 160 200 25%
13 Training and development specialists 500 620 24%
14 Operations research analysts 90 110 23%
15 Instructional coordinators 250 300 22%
16 Computer systems analysts 880 1,080 22%
17 Surveyors 260 310 22%
18 Architects, except landscape and naval 300 370 21%
19 Accountants and auditors 2,870 3,470 21%
20 Public relations specialists 480 580 21%

70
# Occupation
Employment Percent *
Change 2008 2018
21 Employment, recruitment, and placement specialists 370 440 20%
22 Network and computer systems administrators 470 570 20%
23 Sales managers 830 1,000 20%
24 Postsecondary teachers 3,980 4,770 20%
25 Computer and information systems managers 490 580 19%
North Dakota State Employment Projections
Handout pages from North Dakota Employment Projections Report 2008-2018
What connections have we made with Workforce Training Centers?
Demographic High School Projection Data
Education Minot State
Elementary 3527 73725
High School 2052 41564
College or Graduate 2999 47403
Educational Attainment
High school 27.8% 27.9%
AA 8% 9.4%
Bachelors 18.2% 16.5%
Graduate 5.9% 5.5%
Graduating High School
84% White
47% AA
33% Hispanic
44% Native American
Major Interests from ACT Test Report
Planned Educational Major N1 ACT Avg Agriculture Sciences & Technologies 200 3 19.4 Architecture & Environmental Design 121 2 21.4
Business & Management 415 7 21.4
Business & Office 36 1 20.5
Marketing & Distribution 36 1 21.4 Communications & Comm. Technologies 82 1 21.6
Community & Personal Services 150 3 19.2
Computer & Information Sciences 148 3 22.3
Cross-Disciplinary Studies 3 0 17.7

71
Education 227 4 21.0
Teacher Education 183 3 21.7
Engineering 240 4 23.0
Engineering-Related Technologies 191 3 22.5
Foreign Languages 34 1 25.7 Health Sciences & Allied Health Fields 1,213 21 21.9 Human, Family & Consumer Science 68 1 20.4
Letters 30 1 24.8
Mathematics 31 1 25.6
Philosophy, Religion & Theology 30 1 22.8
Sciences (Biological & Physical) 294 5 23.8
Social Sciences 277 5 22.9
Trade & Industrial 300 5 18.4
Visual & Performing Arts 311 5 21.6
Undecided 1,018 18 21.4
No Response 153 3 19.0
Sending Test Reports
Number of
Students
Name State Total 1st
Choice
2nd
to 6th
Choice
NORTH DAKOTA STATE
UNIVERSITY
North
Dakota
2,321 956 1,365
UNIVERSITY OF NORTH DAKOTA North
Dakota
2,088 740 1,348
BISMARCK STATE COLLEGE North
Dakota
1,060 526 534
MINOT STATE UNIVERSITY North
Dakota
644 224 420
NORTH DAKOTA STATE
COLLEGE OF SCIENCE
North
Dakota
642 265 377
MINNESOTA STATE UNIVERSITY
MOORHEAD
Minnesota 628 149 479
UNIVERSITY OF MARY North
Dakota
555 103 452
UNIVERSITY OF MINNESOTA-
TWIN CITIES
Minnesota 502 121 381
DICKINSON STATE UNIVERSITY North
Dakota
361 112 249
CONCORDIA COLLEGE-
MOORHEAD
Minnesota 339 69 270

72
Demographics

73

74

75

76
Diversity of Students
Remains basically same
Importance of serving Native-American Population
2015 – Hispanic high school grads 5% of ND; African-American 2 %
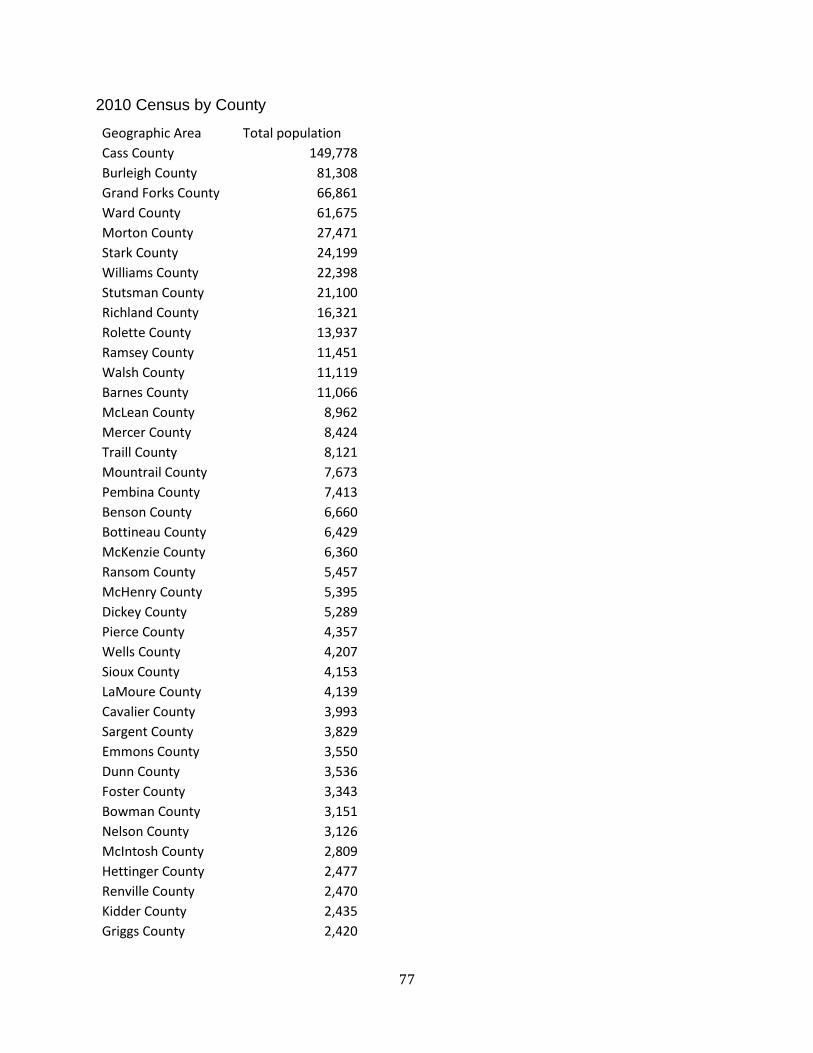
77
2010 Census by County
Geographic Area Total population
Cass County 149,778
Burleigh County 81,308
Grand Forks County 66,861
Ward County 61,675
Morton County 27,471
Stark County 24,199
Williams County 22,398
Stutsman County 21,100
Richland County 16,321
Rolette County 13,937
Ramsey County 11,451
Walsh County 11,119
Barnes County 11,066
McLean County 8,962
Mercer County 8,424
Traill County 8,121
Mountrail County 7,673
Pembina County 7,413
Benson County 6,660
Bottineau County 6,429
McKenzie County 6,360
Ransom County 5,457
McHenry County 5,395
Dickey County 5,289
Pierce County 4,357
Wells County 4,207
Sioux County 4,153
LaMoure County 4,139
Cavalier County 3,993
Sargent County 3,829
Emmons County 3,550
Dunn County 3,536
Foster County 3,343
Bowman County 3,151
Nelson County 3,126
McIntosh County 2,809
Hettinger County 2,477
Renville County 2,470
Kidder County 2,435
Griggs County 2,420
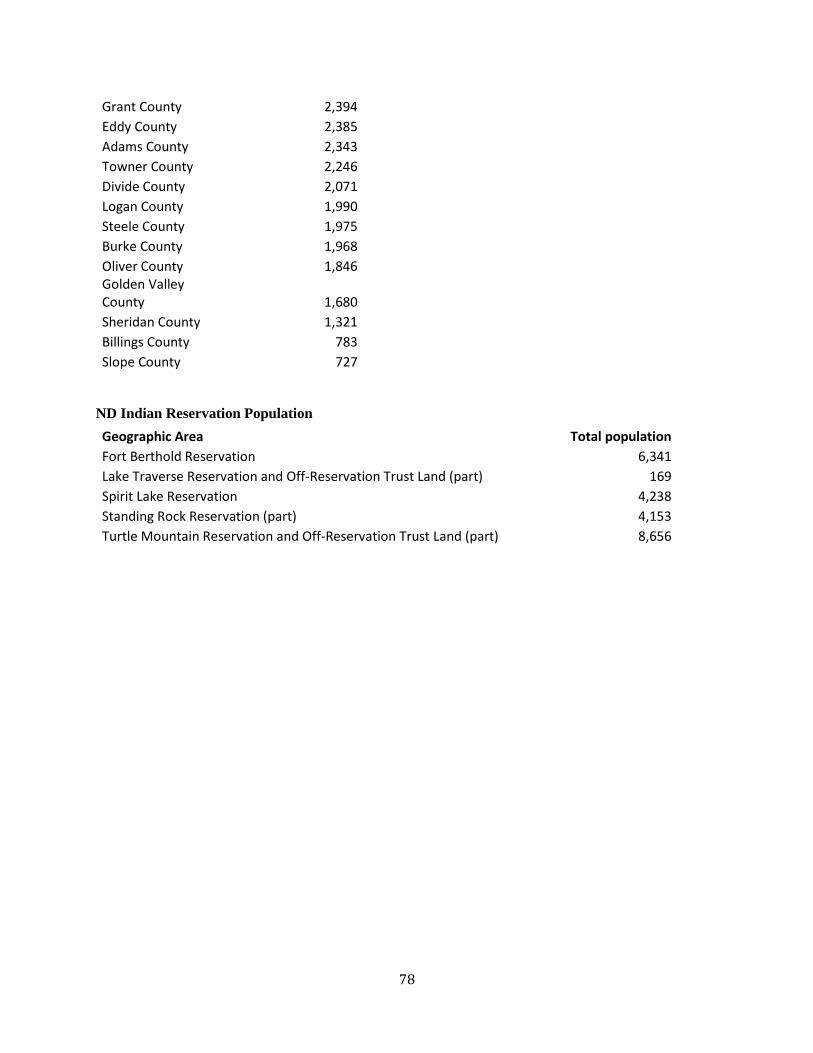
78
Grant County 2,394
Eddy County 2,385
Adams County 2,343
Towner County 2,246
Divide County 2,071
Logan County 1,990
Steele County 1,975
Burke County 1,968
Oliver County 1,846 Golden Valley County 1,680
Sheridan County 1,321
Billings County 783
Slope County 727
ND Indian Reservation Population
Geographic Area Total population
Fort Berthold Reservation 6,341
Lake Traverse Reservation and Off-Reservation Trust Land (part) 169
Spirit Lake Reservation 4,238
Standing Rock Reservation (part) 4,153
Turtle Mountain Reservation and Off-Reservation Trust Land (part) 8,656

79
Ability to pay – nationally

80
Student Affordability – State System Data
Student loan volume has increased consistently from year-to-year, with over a 100 percent increase
over the past ten years at UND, NDSU and the two-year colleges, while grant volume during the same
period has increased between 60-75 percent.
Minot gives
$2,739,810 (Federal aid)
$289,981 (State Aid)
$312,596 (Institutional)
Transfer enrollment
Increasing population
Bismarck and Bottineau largest feeders
Transfer enter into what programs?
Management-BS 36
Social Work-BSW 30
General Studies-BGS 29
Criminal Justice-BS 28

81
Elementary Education - Pre 20
Communication Disorders-BS 17
Nursing-Pre 16
Biology-BA 13
Nursing-RN to BSN 13
Accounting-BS 12
Art-BA 11
Mgmt Info System-BS 10
Retention Data
See Sheet of Freshmen 2008 Cohort

82
Canadian Statistics
Alberta
Table 1 – Demand shortage – more jobs than qualified people
C02 - Life science professionals -74 -1235 2007 A14 - Facility operation and maintenance managers -61 -1338 2007 D01 - Physicians, dentists and veterinarians -81 -3,402 2007 G98 - Other elemental service occupations 132 -1,121 2008 D03 - Pharmacists, dietitians and nutritionists -89 -978 2007 A34 - Managers in art, culture, recreation and sport -12 -320 2007 C15 - Technical occupations in architecture, drafting and surveying 29 -2,133 2008 D11 - Nurse supervisors and registered nurses -861 -5,184 2007 G72 - Tour and recreational guides and casino occupations 36 -223 2009 C11 - Technical occupations in physical sciences 194 -950 2011 Data Source: E&I’s Occupational Demand Outlook Model, E&I’s Occupational Supply Outlook Model
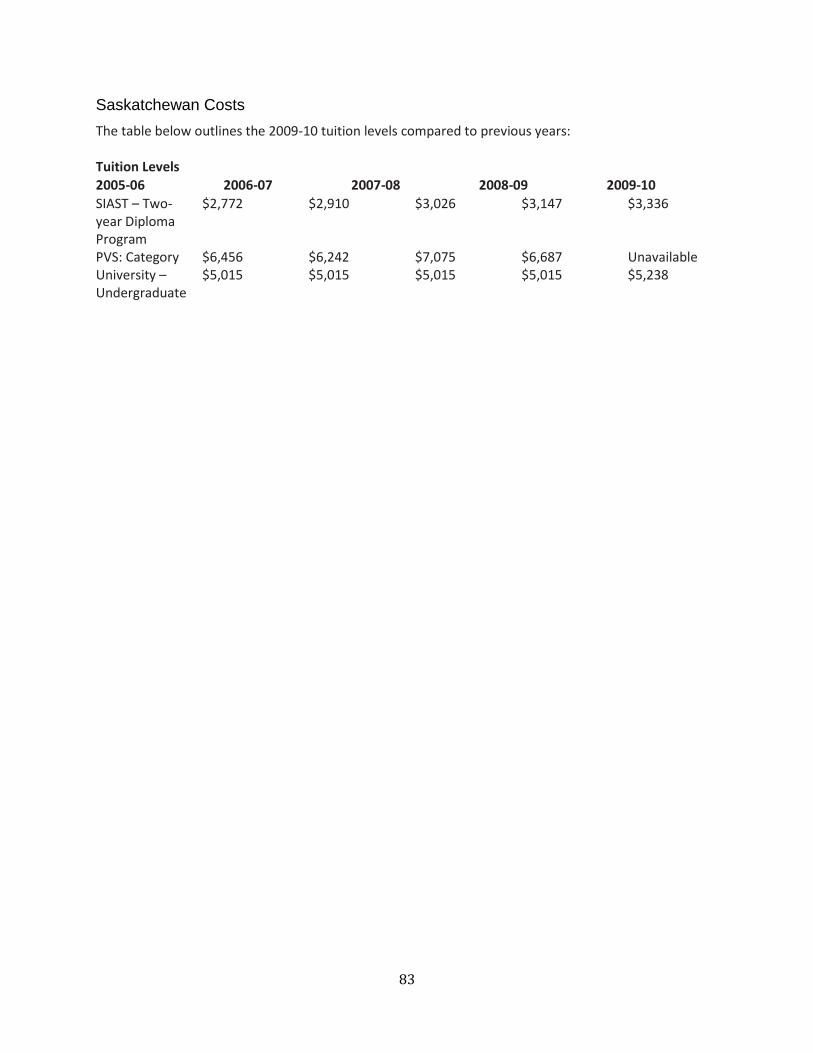
83
Saskatchewan Costs
The table below outlines the 2009-10 tuition levels compared to previous years: Tuition Levels 2005-06 2006-07 2007-08 2008-09 2009-10
SIAST – Two-year Diploma Program
$2,772 $2,910 $3,026 $3,147 $3,336
PVS: Category $6,456 $6,242 $7,075 $6,687 Unavailable University – Undergraduate
$5,015 $5,015 $5,015 $5,015 $5,238