Embed Size (px)
Citation preview
Strategic Direction for ADF-14
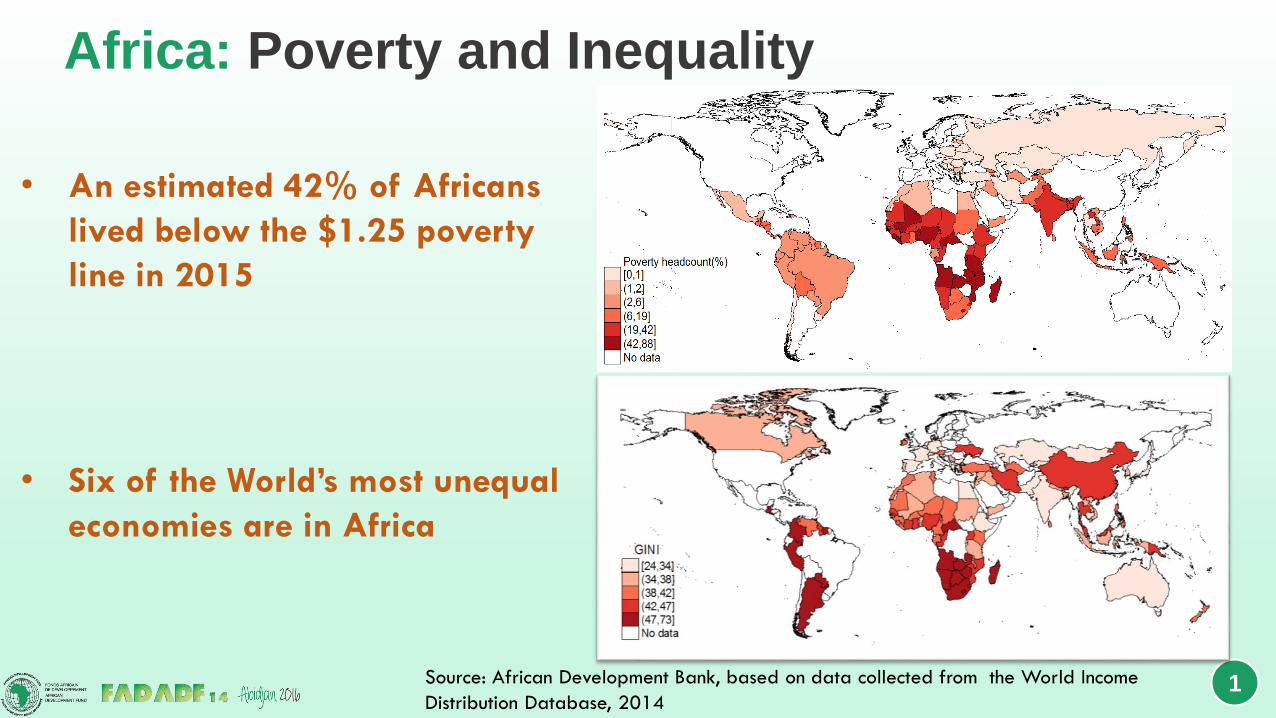
Africa: Poverty and Inequality
1
• An estimated 42% of Africans
lived below the $1.25 poverty
line in 2015
• Six of the World’s most unequal
economies are in Africa
Source: African Development Bank, based on data collected from the World Income
Distribution Database, 2014
2
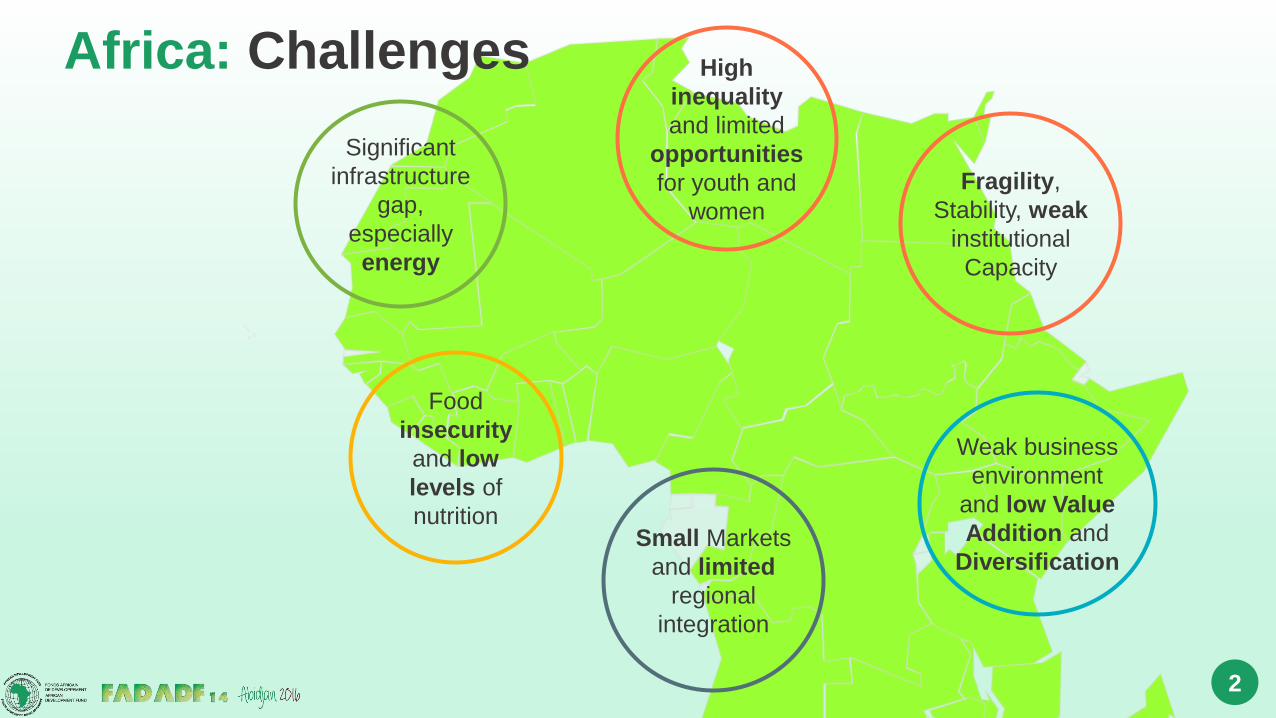
Significant
infrastructure
gap,
especially
energy
Weak business
environment
and low Value
Addition and
Diversification
Food
insecurity
and low
levels of
nutrition
High
inequality
and limited
opportunities
for youth and
women
Fragility,
Stability, weak
institutional
Capacity
Small Markets
and limited
regional
integration
Africa: Challenges
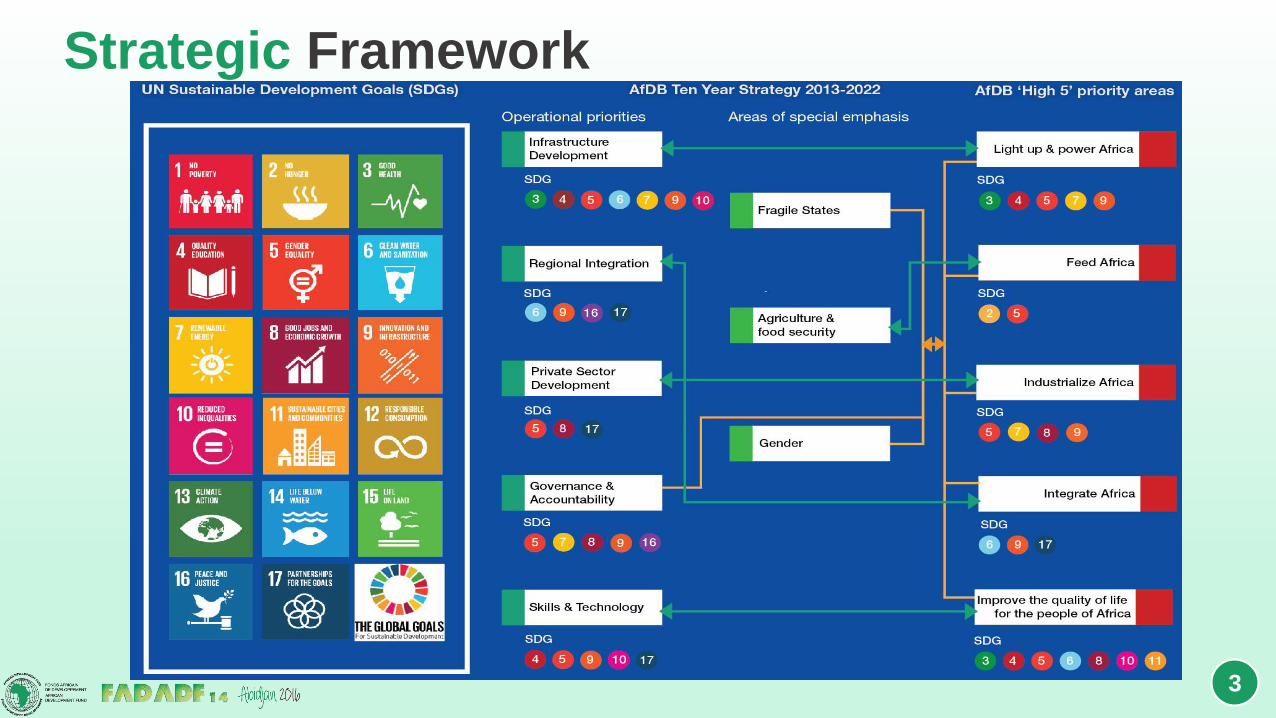
Strategic Framework
3

Light up and Power Africa: The Challenge
4
Tier 1 <50%
Tier 2: 50 to 69%
Tier 3: 70 to 89%
Tier 4: > 90%
730 million people in Sub-Saharan Africa rely on the traditional use of solid biomass for cooking
Households using solid biomass for
cooking, % of total population, 2013
640 million of Africans (53% ) still have no access to electricity
<25%
50% to 75%
25% to 49%
>75%
Access to electricity, % of total
population, 2013
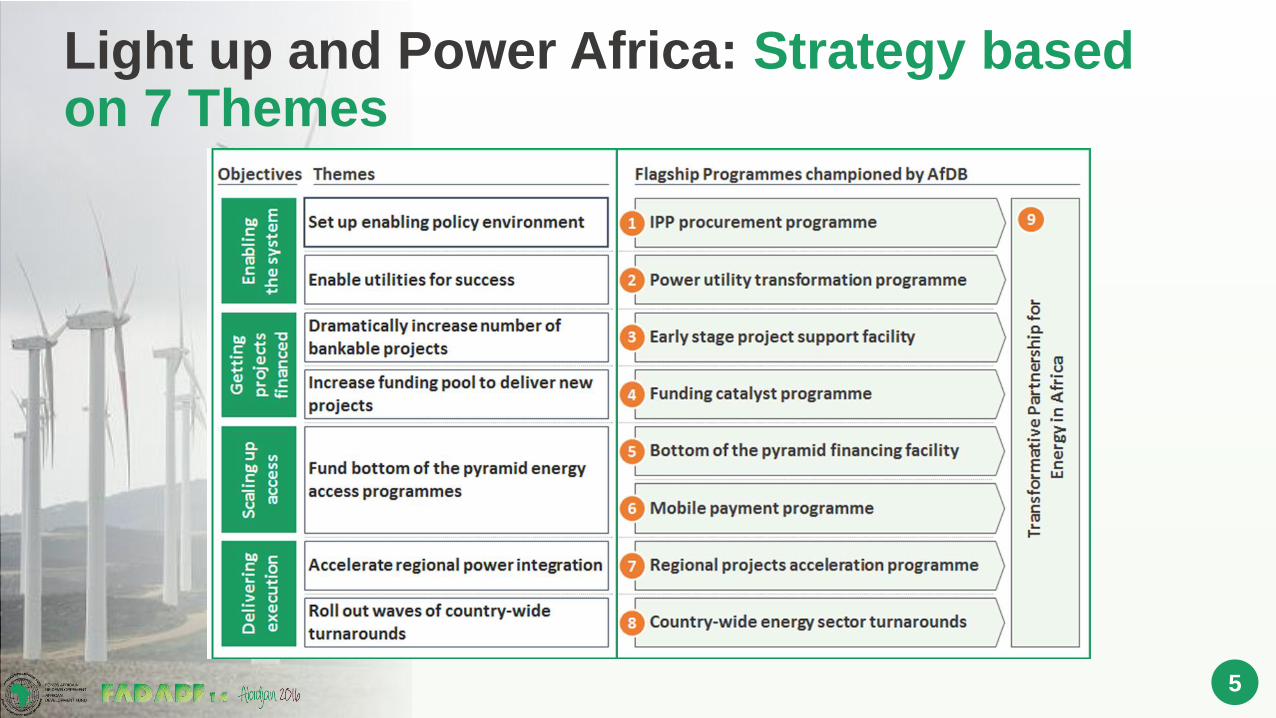
Light up and Power Africa: Strategy based on 7 Themes
5
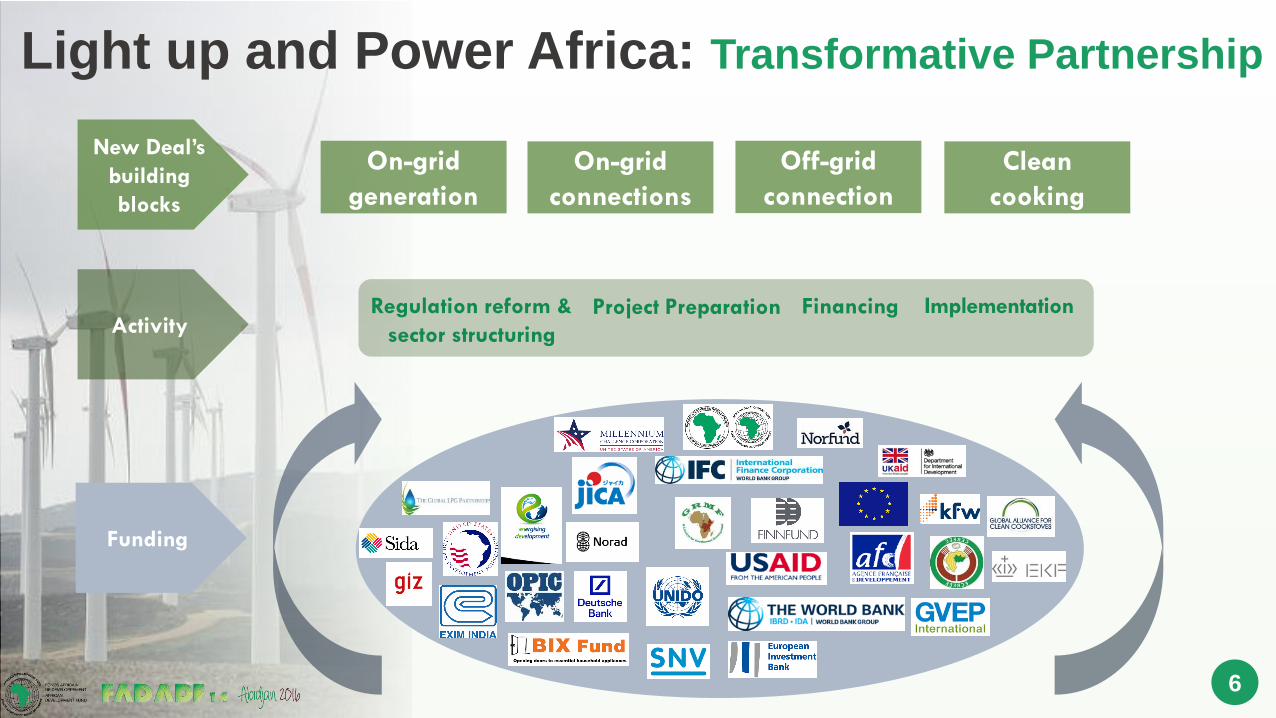
Light up and Power Africa: Transformative Partnership
6
Funding
Regulation reform &
sector structuring
Project Preparation Financing ImplementationActivity
On-grid
generation
On-grid
connections
Off-grid
connection
Clean
cooking
New Deal’s
building
blocks
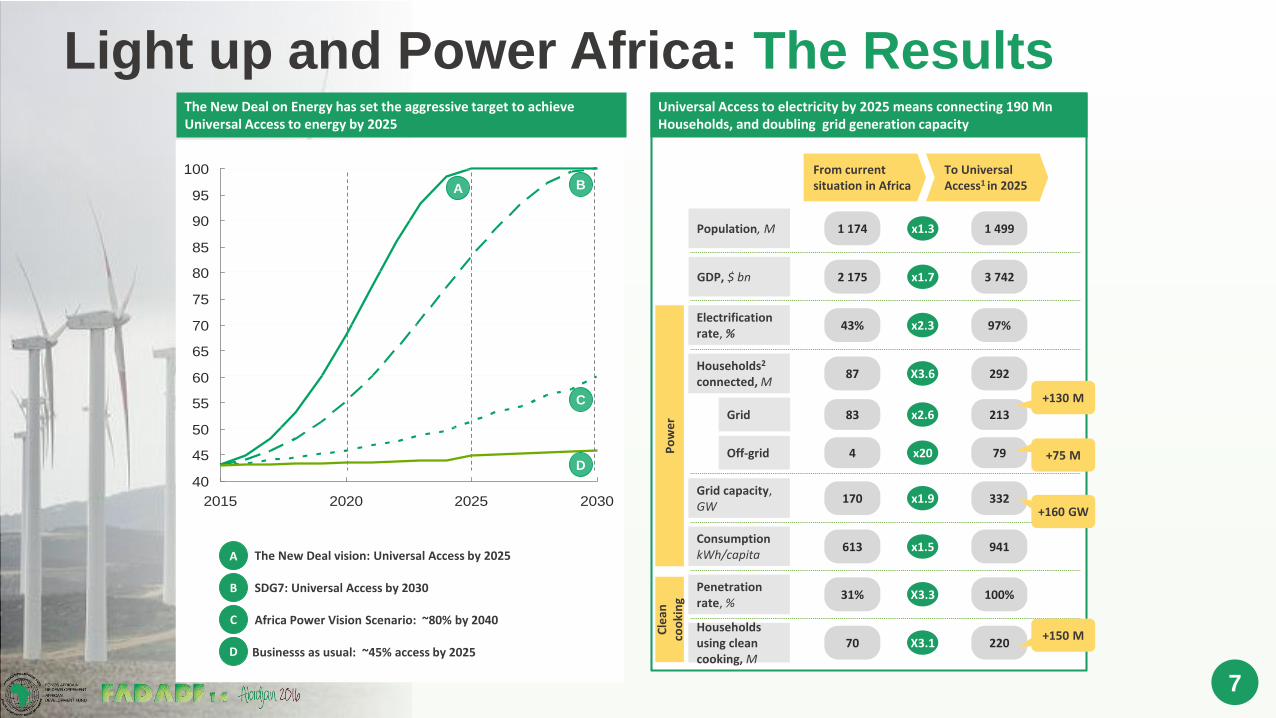
Light up and Power Africa: The Results
7
From current situation in Africa
To Universal Access1 in 2025
Households2
connected, M87 292X3.6
83Grid 213x2.6
4Off-grid 79x20
Electrification rate, %
43% 97%x2.3
Grid capacity, GW
170 332x1.9
ConsumptionkWh/capita
613 941x1.5
Population, M 1 174 1 499x1.3
GDP, $ bn 2 175 3 742x1.7
Po
we
rC
lean
co
oki
ng
Penetration rate, %
31% 100%X3.3
Households using clean cooking, M
70 220X3.1
Universal Access to electricity by 2025 means connecting 190 Mn Households, and doubling grid generation capacity
+130 M
+75 M
+160 GW
+150 M
The New Deal on Energy has set the aggressive target to achieve Universal Access to energy by 2025
Businesss as usual: ~45% access by 2025
Africa Power Vision Scenario: ~80% by 2040
SDG7: Universal Access by 2030
The New Deal vision: Universal Access by 2025
D
C
B
A
40
45
50
55
60
65
70
75
80
85
90
95
100
2015 2020 2025 2030
A B
C
D
8
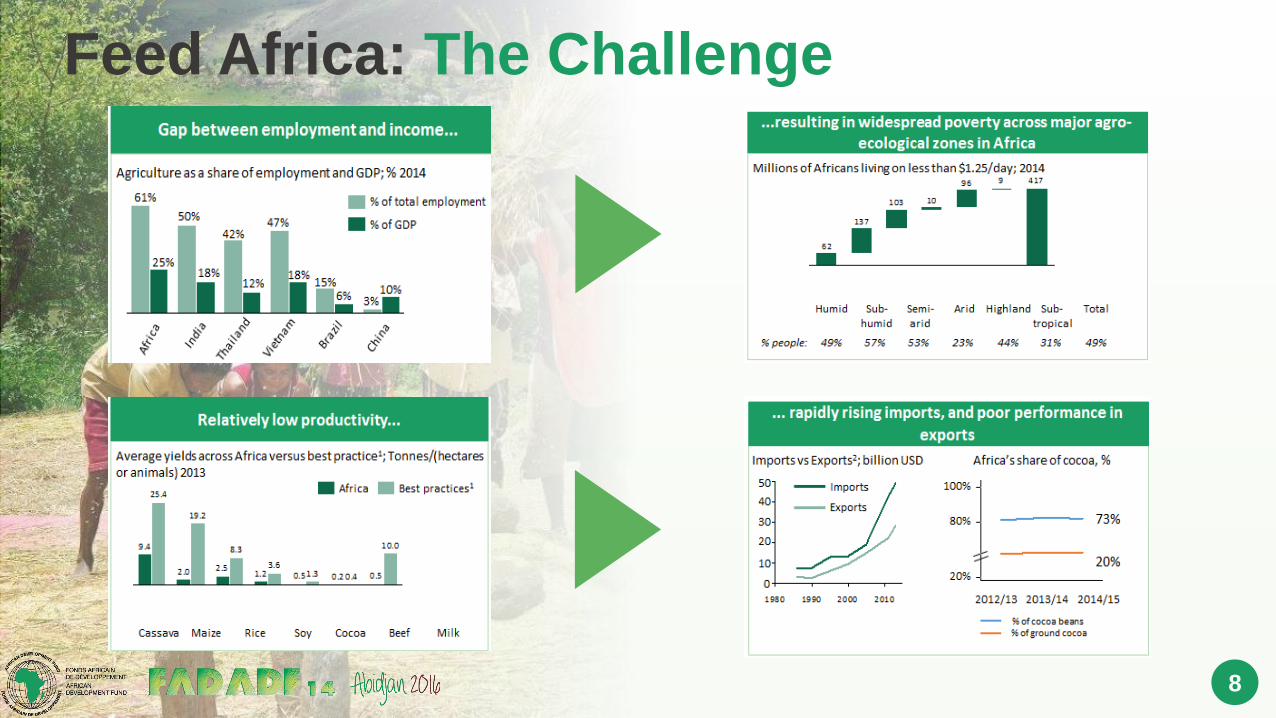
Feed Africa: The Challenge
9
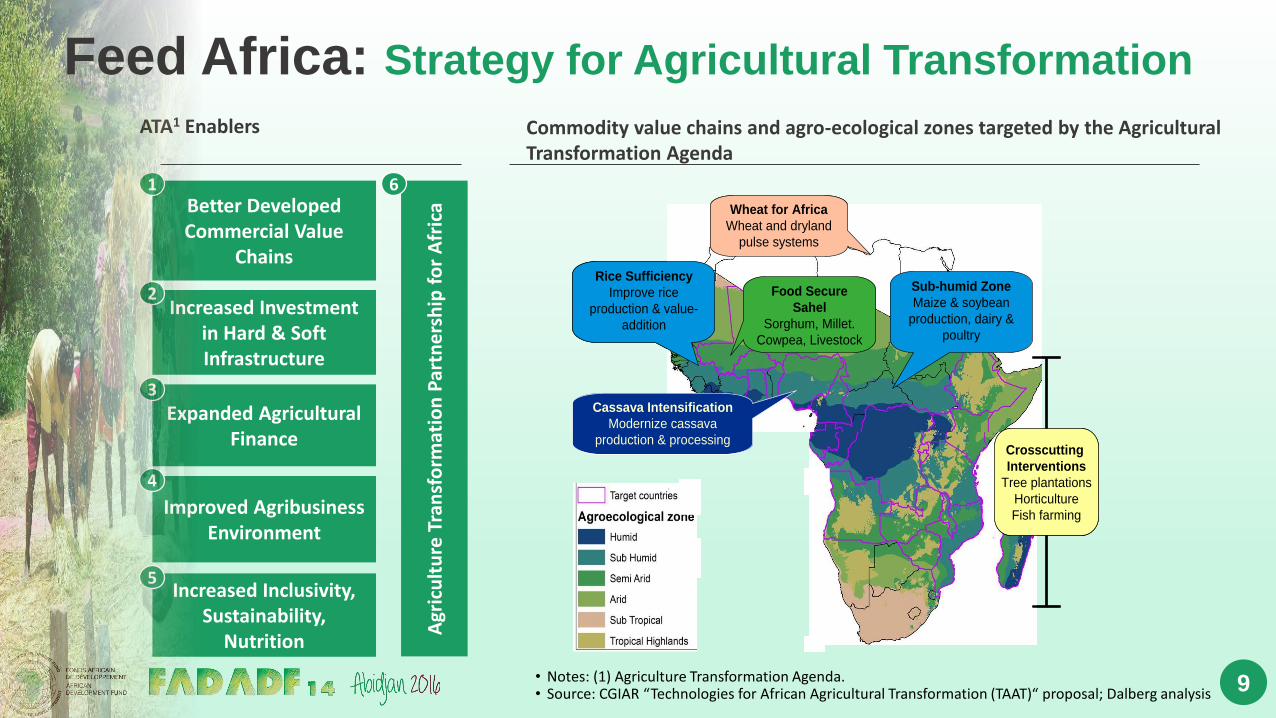
Better Developed Commercial Value
Chains
Increased Investment in Hard & Soft Infrastructure
Expanded Agricultural Finance
Improved Agribusiness Environment
Increased Inclusivity, Sustainability,
Nutrition
1
2
3
4
5
Agr
icu
ltu
re T
ran
sfo
rmat
ion
Par
tne
rsh
ip f
or
Afr
ica
6
ATA1 Enablers
Food Secure
Sahel
Sorghum, Millet.
Cowpea, Livestock
Sub-humid Zone
Maize & soybean
production, dairy &
poultry
Cassava Intensification
Modernize cassava
production & processing
Wheat for Africa
Wheat and dryland
pulse systems
Crosscutting
Interventions
Tree plantations
Horticulture
Fish farming
Rice Sufficiency
Improve rice
production & value-
addition
Food Secure
Sahel
Sorghum, Millet.
Cowpea, Livestock
Sub-humid Zone
Maize & soybean
production, dairy &
poultry
Cassava Intensification
Modernize cassava
production & processing
Wheat for Africa
Wheat and dryland
pulse systems
Crosscutting
Interventions
Tree plantations
Horticulture
Fish farming
Crosscutting
Interventions
Tree plantations
Horticulture
Fish farming
Rice Sufficiency
Improve rice
production & value-
addition
Commodity value chains and agro-ecological zones targeted by the Agricultural Transformation Agenda
• Notes: (1) Agriculture Transformation Agenda.• Source: CGIAR “Technologies for African Agricultural Transformation (TAAT)“ proposal; Dalberg analysis
Feed Africa: Strategy for Agricultural Transformation
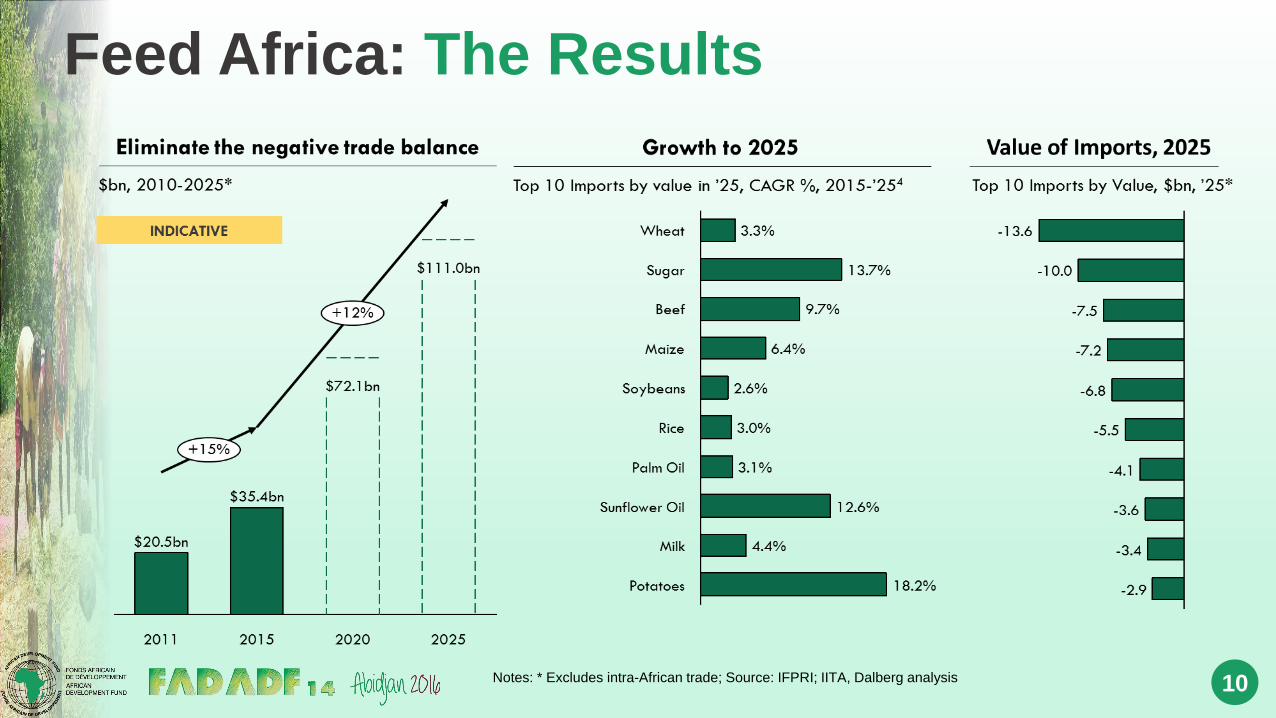
Feed Africa: The Results
10Notes: * Excludes intra-African trade; Source: IFPRI; IITA, Dalberg analysis
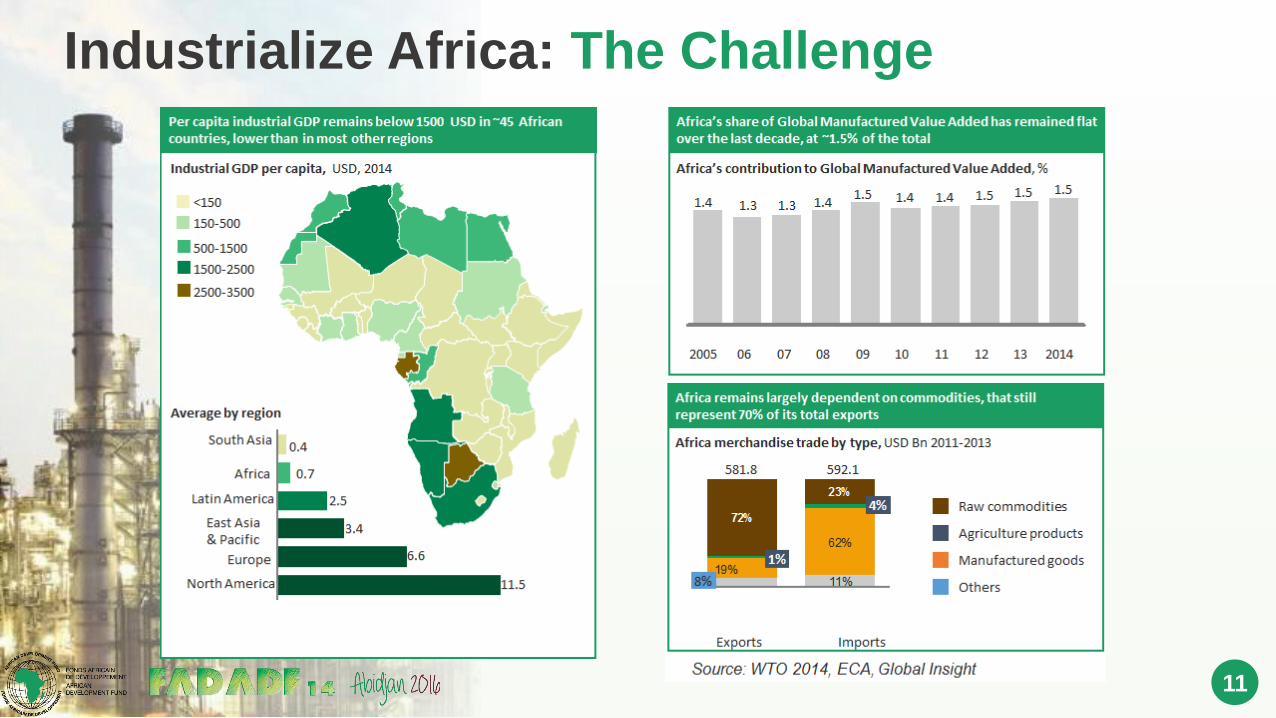
Industrialize Africa: The Challenge
11
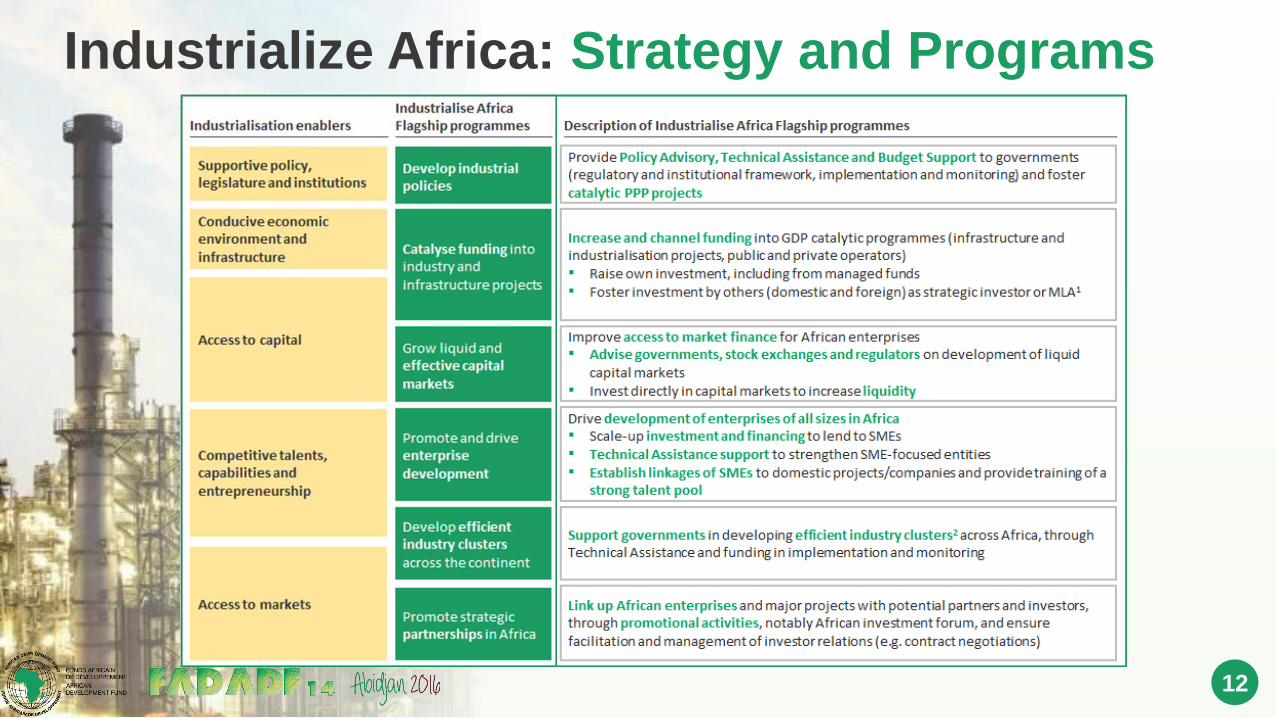
Industrialize Africa: Strategy and Programs
12
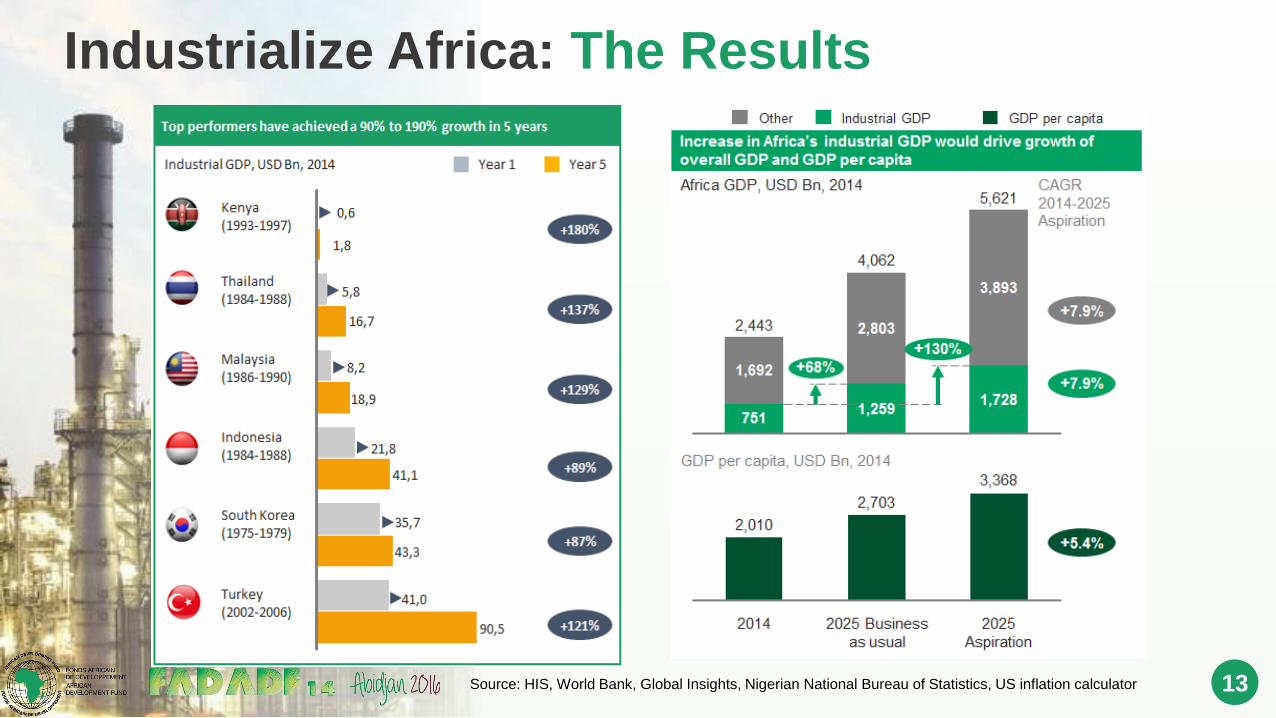
Industrialize Africa: The Results
13
3,893
1,2591,728
2,803
Source: HIS, World Bank, Global Insights, Nigerian National Bureau of Statistics, US inflation calculator
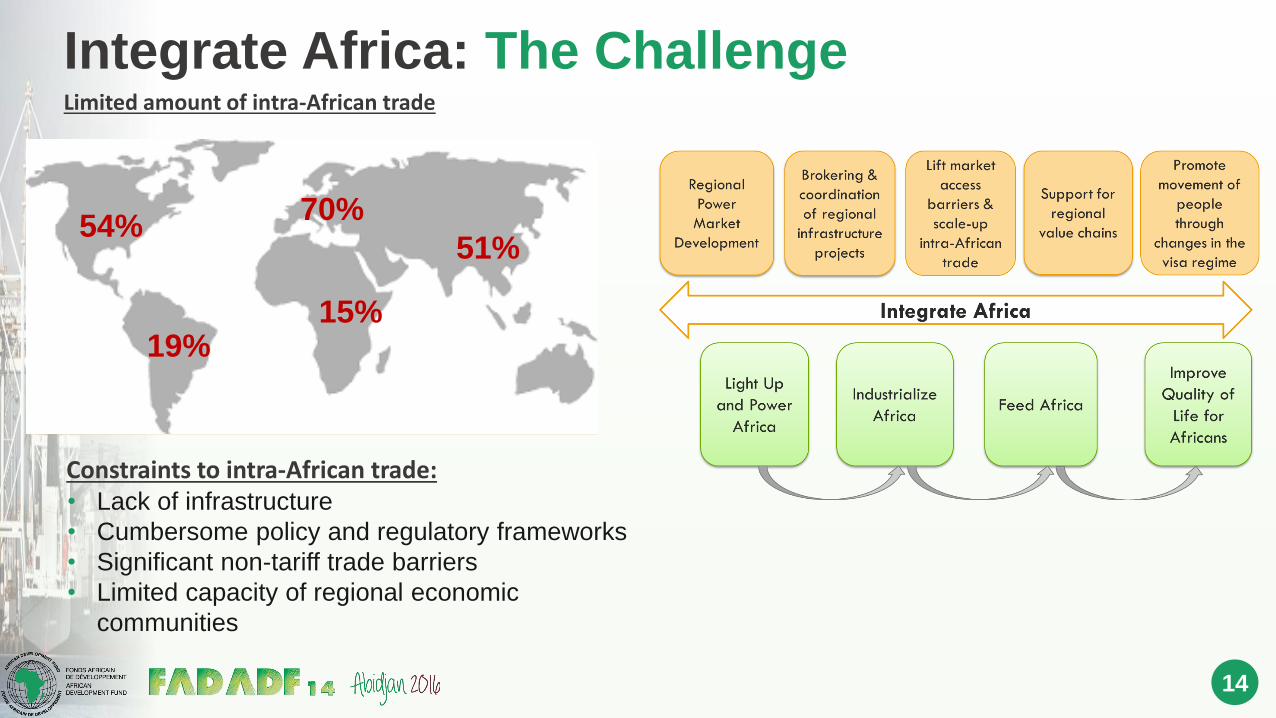
Integrate Africa: The Challenge
14
Constraints to intra-African trade:• Lack of infrastructure
• Cumbersome policy and regulatory frameworks
• Significant non-tariff trade barriers
• Limited capacity of regional economic
communities
15%
70%
51%54%
19%
Limited amount of intra-African trade
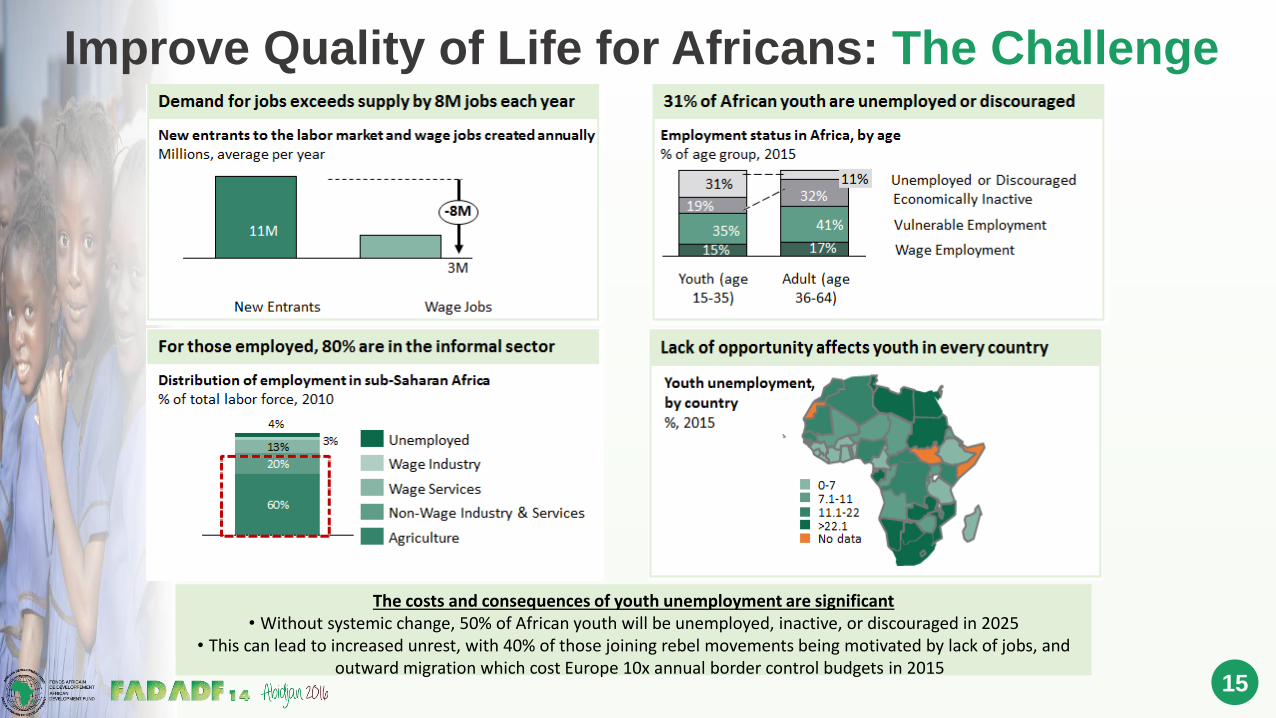
Improve Quality of Life for Africans: The Challenge
15
17%15%
The costs and consequences of youth unemployment are significant• Without systemic change, 50% of African youth will be unemployed, inactive, or discouraged in 2025
• This can lead to increased unrest, with 40% of those joining rebel movements being motivated by lack of jobs, and outward migration which cost Europe 10x annual border control budgets in 2015
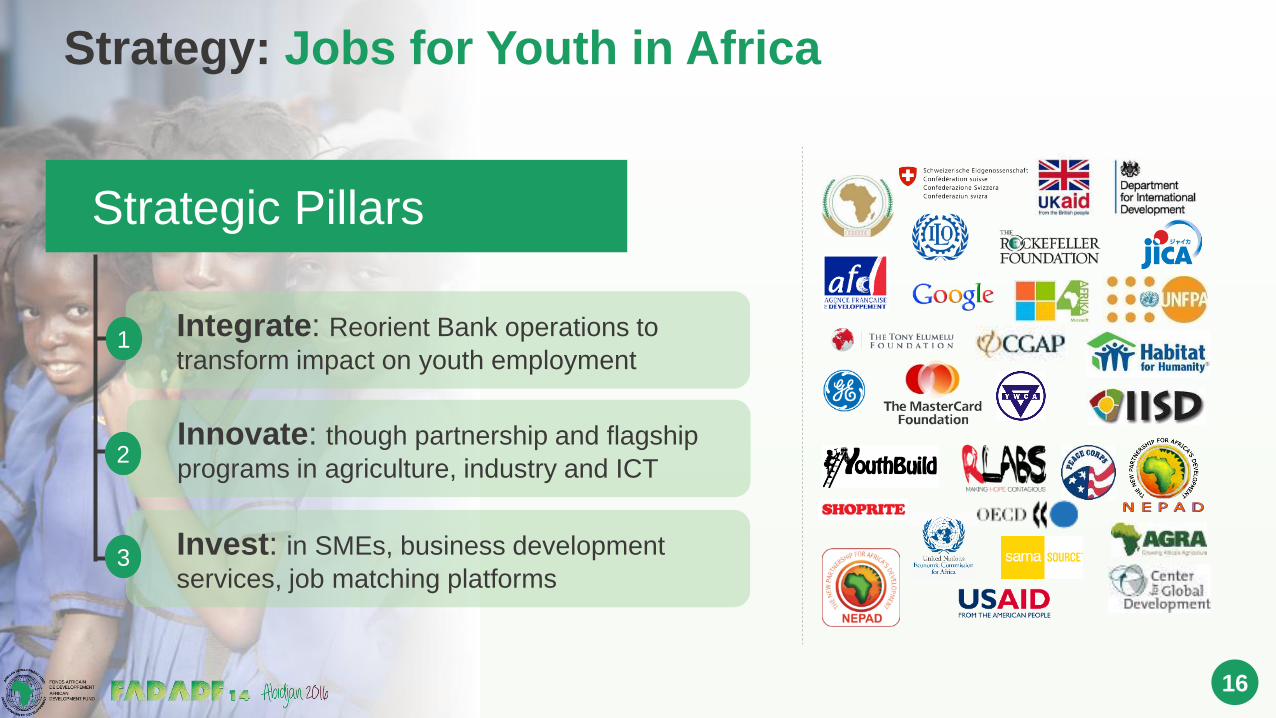
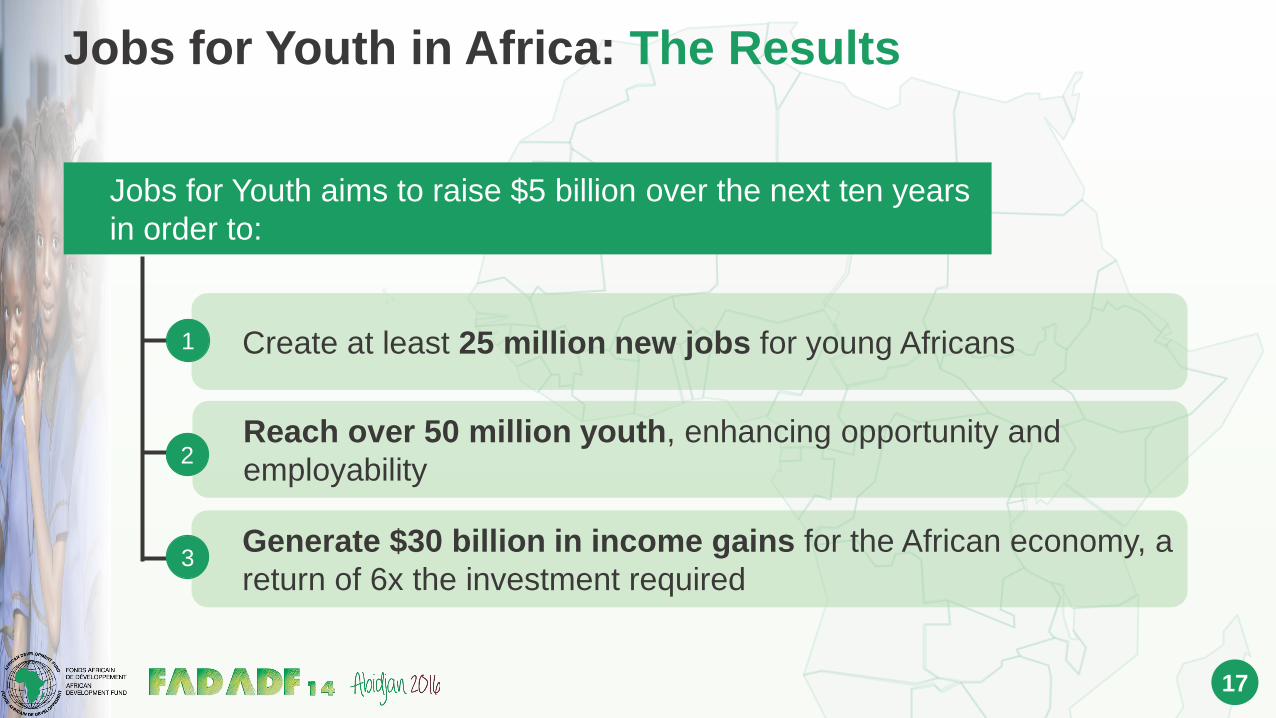
Strategy: Jobs for Youth in Africa
16
Integrate: Reorient Bank operations to
transform impact on youth employment
Innovate: though partnership and flagship
programs in agriculture, industry and ICT
Invest: in SMEs, business development
services, job matching platforms
Strategic Pillars
1
2
3
17
Jobs for Youth in Africa: The Results
Create at least 25 million new jobs for young Africans
Reach over 50 million youth, enhancing opportunity and
employability
Generate $30 billion in income gains for the African economy, a
return of 6x the investment required
Jobs for Youth aims to raise $5 billion over the next ten years
in order to:
1
2
3
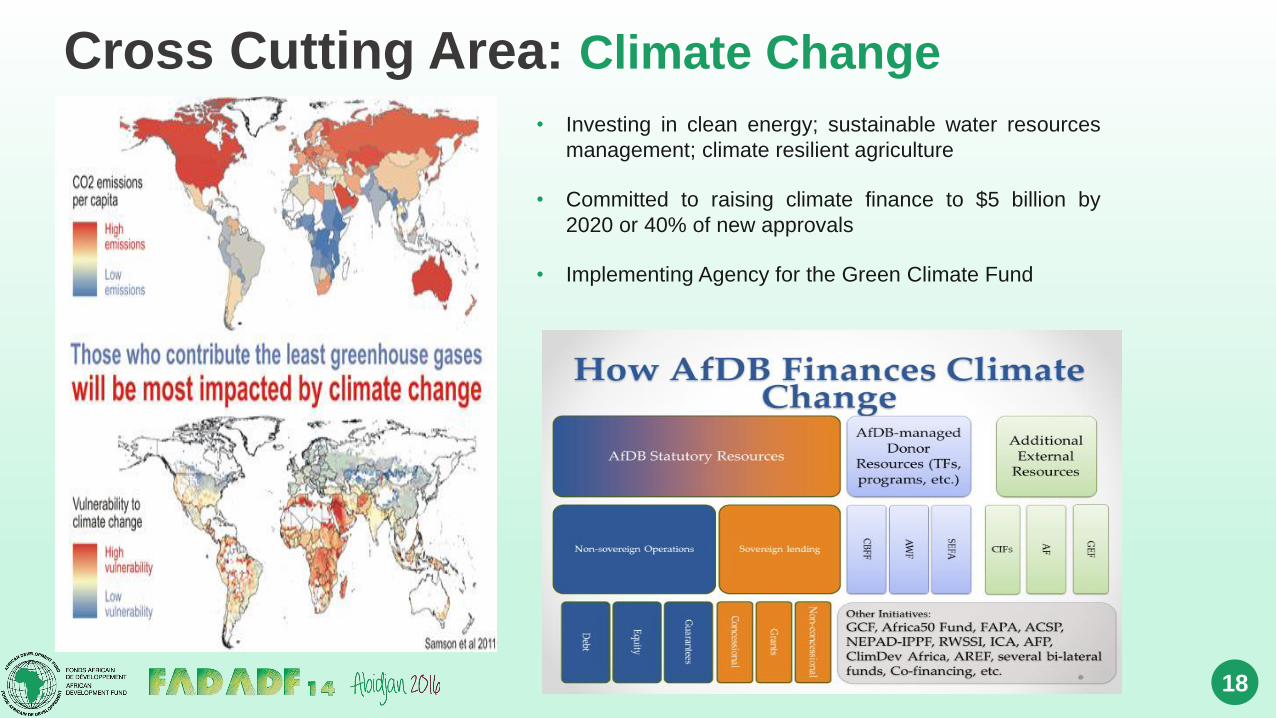
Cross Cutting Area: Climate Change
18
• Investing in clean energy; sustainable water resources
management; climate resilient agriculture
• Committed to raising climate finance to $5 billion by
2020 or 40% of new approvals
• Implementing Agency for the Green Climate Fund
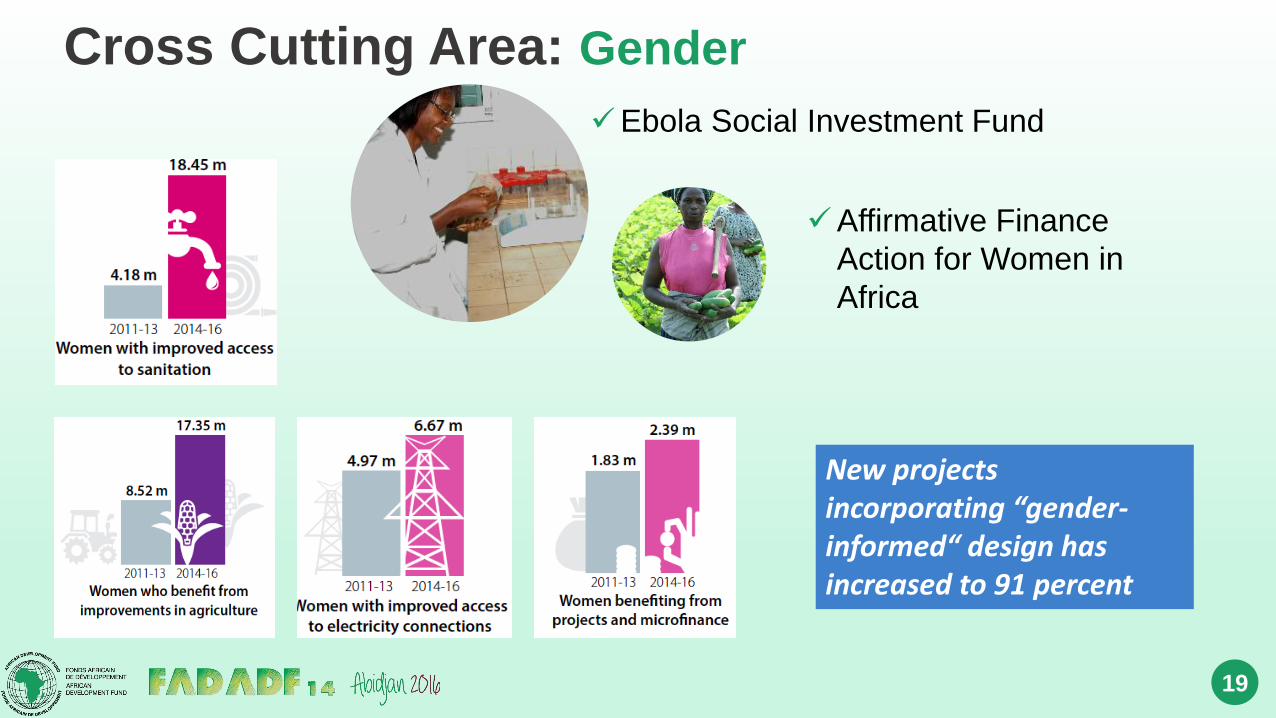
Cross Cutting Area: Gender
19
New projects incorporating “gender-informed“ design has increased to 91 percent
Ebola Social Investment Fund
Affirmative Finance
Action for Women in
Africa
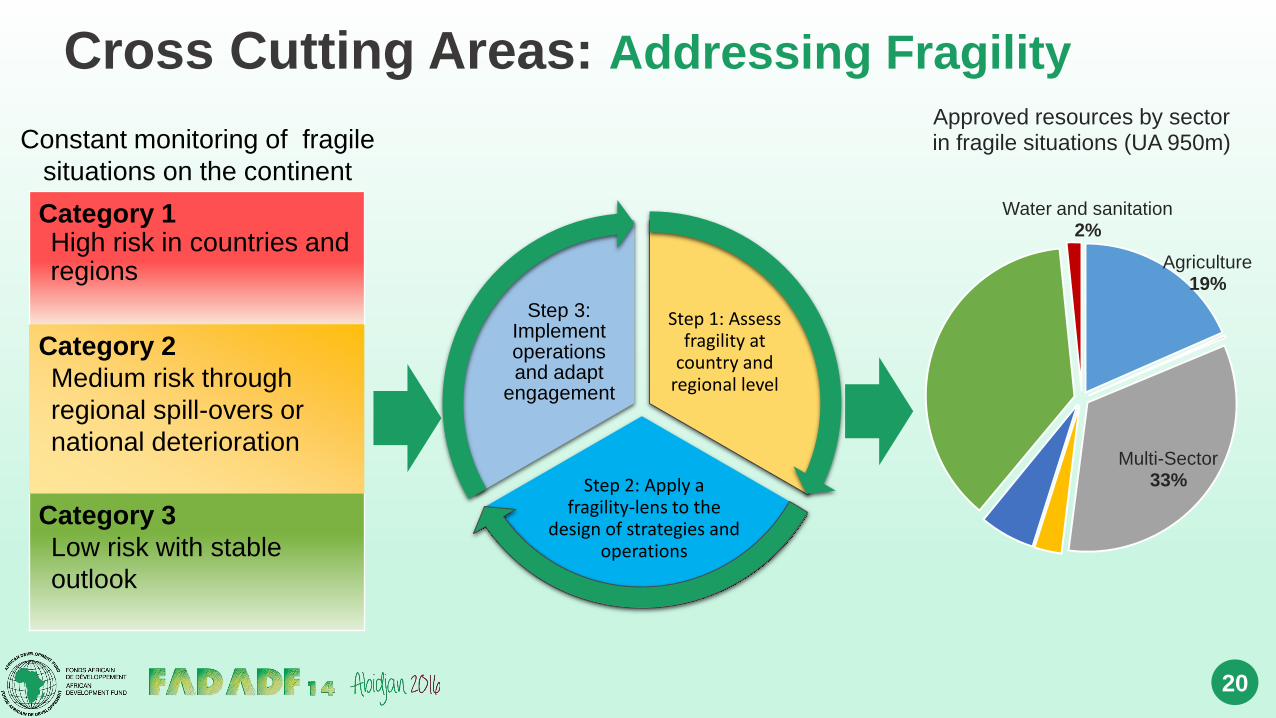
Cross Cutting Areas: Addressing Fragility
20
Step 1: Assess fragility at
country and regional level
Step 2: Apply a fragility-lens to the
design of strategies and operations
Step 3: Implement operations and adapt
engagement
Agriculture19%
Multi-Sector33%
Water and sanitation2%
Approved resources by sector in fragile situations (UA 950m)
Category 1High risk in countries and regions
Category 2
Medium risk through
regional spill-overs or
national deterioration
Category 3
Low risk with stable
outlook
Constant monitoring of fragile
situations on the continent
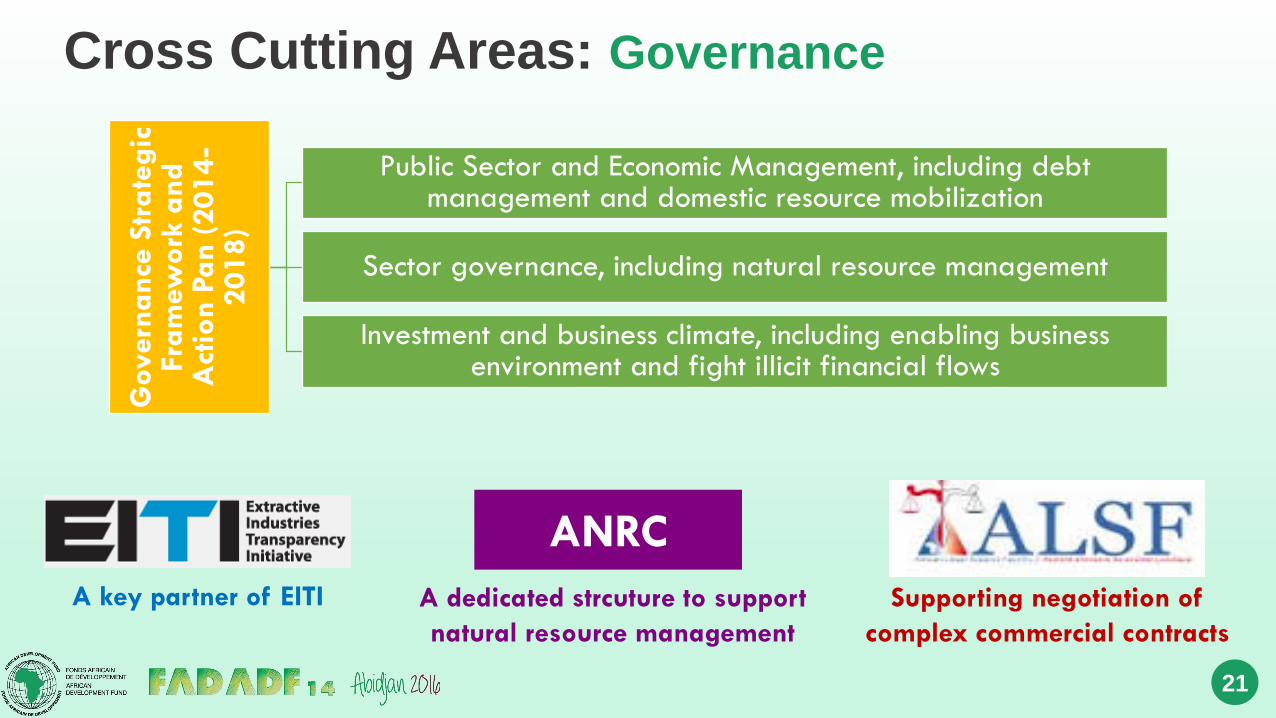
Cross Cutting Areas: Governance
21
Govern
ance
Str
ate
gic
Fra
mew
ork
and
Act
ion P
an (
2014-
2018)
Public Sector and Economic Management, including debt management and domestic resource mobilization
Sector governance, including natural resource management
Investment and business climate, including enabling business environment and fight illicit financial flows
A key partner of EITI
ANRC
A dedicated strcuture to support
natural resource management
Supporting negotiation of
complex commercial contracts
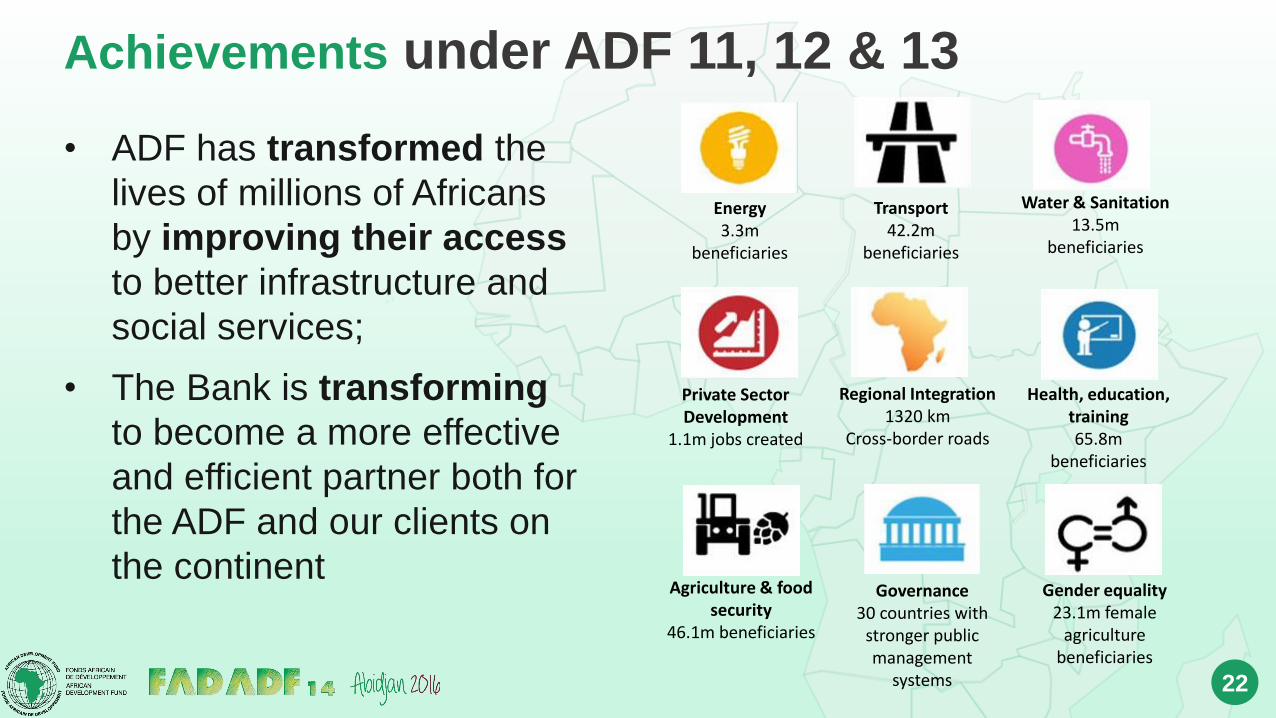
Achievements under ADF 11, 12 & 13
22
• ADF has transformed the
lives of millions of Africans
by improving their access
to better infrastructure and
social services;
• The Bank is transforming
to become a more effective
and efficient partner both for
the ADF and our clients on
the continent
Energy3.3m
beneficiaries
Transport42.2m
beneficiaries
Water & Sanitation13.5m
beneficiaries
Private Sector Development
1.1m jobs created
Regional Integration1320 km
Cross-border roads
Health, education, training65.8m
beneficiaries
Agriculture & food security
46.1m beneficiaries
Governance30 countries with
stronger public management
systems
Gender equality23.1m female
agriculture beneficiaries
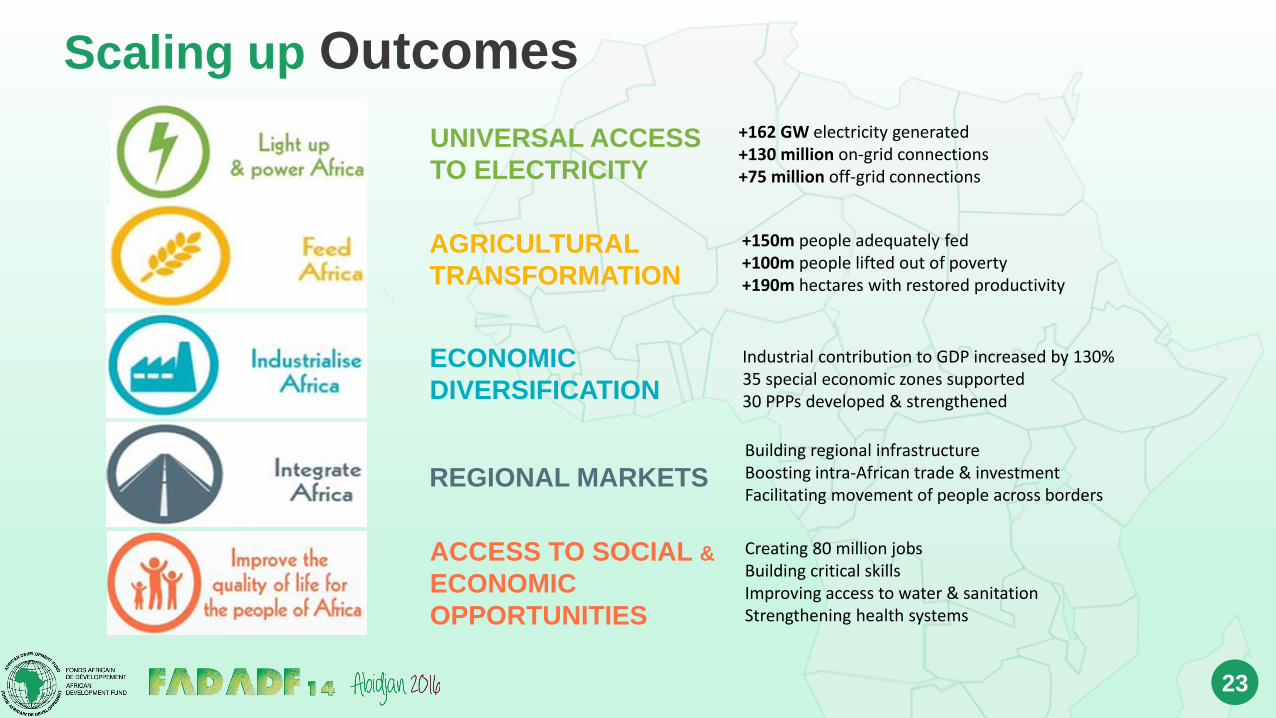
Scaling up Outcomes
23
+162 GW electricity generated+130 million on-grid connections+75 million off-grid connections
+150m people adequately fed+100m people lifted out of poverty+190m hectares with restored productivity
Industrial contribution to GDP increased by 130%35 special economic zones supported30 PPPs developed & strengthened
Building regional infrastructureBoosting intra-African trade & investmentFacilitating movement of people across borders
Creating 80 million jobs Building critical skillsImproving access to water & sanitationStrengthening health systems
UNIVERSAL ACCESS
TO ELECTRICITY
AGRICULTURAL
TRANSFORMATION
ECONOMIC
DIVERSIFICATION
REGIONAL MARKETS
ACCESS TO SOCIAL &
ECONOMIC
OPPORTUNITIES
Conclusion
24
• The ADF-14 replenishment is taking place at a
critical moment.
• Commendable progress but ADF countries remain
vulnerable to critical challenges and threats.
• Achieving SDGs will require significant scaling up in
resources and this will not happen without a
significant increase in ADF resources.
• The Bank is restructuring itself and introducing a
new Business Development Model to deliver this
scaling up and improve its financial health.
• Scaling up contributions and allowing innovative
use of ADF resources will transform the continent.