Embed Size (px)
Citation preview

Strategic basin and delta planning increases theresilience of the Mekong Delta underfuture uncertaintyR. J. P. Schmitta,b,1, M. Giulianic, S. Bizzic,d, G. M. Kondolfe, G. C. Dailya,b,1, and Andrea Castellettic,f
aNatural Capital Project, Stanford University, Stanford, CA 94305; bThe Woods Institute for the Environment, Stanford University, Stanford, CA 94305;cDepartment of Electronics, Information, and Bioengineering, Politecnico di Milano, 20133 Milano, Italy; dDepartment of Geosciences, University of Padova,35122 Padova, Italy; eDepartment of Landscape Architecture and Environmental Planning, University of California, Berkeley, CA 94720; and fInstitute ofEnvironmental Engineering, ETH Zurich, 8049 Zurich, Switzerland
Contributed by G. C. Daily, July 26, 2021 (sent for review December 18, 2020; reviewed by Frances E. Dunn and Daniel Peter Loucks)
The climate resilience of river deltas is threatened by rising sealevels, accelerated land subsidence, and reduced sediment supplyfrom contributing river basins. Yet, these uncertain and rapidlychanging threats are rarely considered in conjunction. Here weprovide an integrated assessment, on basin and delta scales, toidentify key planning levers for increasing the climate resilience ofthe Mekong Delta. We find, first, that 23 to 90% of this unusuallyproductive delta might fall below sea level by 2100, with the largeuncertainty driven mainly by future management of groundwaterpumping and associated land subsidence. Second, maintainingsediment supply from the basin is crucial under all scenarios formaintaining delta land and enhancing the climate resilience of thesystem. We then use a bottom-up approach to identify basin de-velopment scenarios that are compatible with maintaining sedi-ment supply at current levels. This analysis highlights, third, thatstrategic placement of hydropower dams will be more importantfor maintaining sediment supply than either projected increases insediment yields or improved sediment management at individualdams. Our results demonstrate 1) the need for integrated planningacross basin and delta scales, 2) the role of river sediment man-agement as a nature-based solution to increase delta resilience,and 3) global benefits from strategic basin management to main-tain resilient deltas, especially under uncertain and changingconditions.
Mekong | river deltas | resilience | sediment | global environmental change
By 2050, 1 billion people will live in low-lying coastal zonesand river deltas (1), areas that are also of paramount im-
portance for regional and global food security (2–4). The ma-jority of the world’s most productive and densely populatedcoastal areas, such as the deltas of the Mekong (5–7), Irrawaddy(8), Ganges-Brahmaputra (9), Nile (10), and Mississippi (11), areexperiencing significant subsidence and land loss as a result ofreduced sediment supply from upstream basins, unsustainablemanagement of water and sediment in the deltas, and global sea-level rise (12, 13). The subsidence of these major deltas relativeto rising sea levels foreshadows fundamental failures of criticalfood systems and livelihoods (1, 2, 12–14).Hard engineering approaches maintain some heavily subsided
deltas (4) but come at the cost of major capital investments andlock-ins into nonsustainable conditions (3, 15). An alternative isto maintain or increase the natural resilience of river deltas,i.e., their ability to recover from shocks and adapt to changethrough natural processes (3). The resilience of river deltas de-pends on a balance between processes that accelerate subsidenceof the delta surface, sea-level rise, and land accretion driven bysediment supply from upstream rivers (2, 5, 13, 16, 17). Anthro-pogenic change is altering most of these processes, and impactswill increase in the future (1, 2, 12, 17, 18). For example, globalsea levels are rising (1), unsustainable groundwater extraction is
widespread (10, 19, 20), and basin development is reducing sedi-ment supply to many deltas (5, 16, 17, 21, 22).As basin- and delta-scale processes are connected, an inte-
grated perspective would be key to identifying strategies forimproving the resilience of delta land and livelihoods. Basin anddelta scales are still mostly disconnected, however, in both sci-entific studies and management plans. While some delta-scalestudies have attempted to translate reduced sediment supply intomeasures of sea-level rise relative to the subaerial delta surface(relative sea-level rise, rSLR) (5, 16, 21), they were limited to fewscenarios or qualitative assessments to estimate future sedimentsupply from contributing river basins. Moreover, they neitherexplored multiple possible futures of basin development noraccounted for the uncertain and competing drivers of sedimentgeneration and transport in large river basins. More granularstudies of basin development have, in turn, produced quantita-tive estimates of changing sediment supply from (sub)basin toglobal scales but were not coupled to models of delta morphol-ogy, key to translating changing sediment supplies into endpointmeasures of rSLR and delta resilience (17, 18, 23–26).Importantly, previous studies did not evaluate uncertainty in
future sediment supply arising from competing and highly uncer-tain drivers. Available evidence suggests that sediment trapping in
Significance
Globally, river deltas, which support some of the planet’s mostproductive agroeconomic systems and half a billion liveli-hoods, are at risk of being drowned by rising sea levels andaccelerated subsidence. Whether delta land falls below sealevel will depend on land and water management in the delta,sediment supply from the upstream basin, and global climatechange. Those drivers cover multiple scales and domains andare rapidly changing, uncertain, and interconnected, whichmakes finding robust strategies to increase the resilience ofriver deltas challenging. Herein, we demonstrate an approachto identify planning levers that can increase the resilience ofriver deltas under a wide range of future conditions for the40,000-km2 Mekong Delta in Southeast Asia.
Author contributions: R.J.P.S., M.G., S.B., G.M.K., G.C.D., and A.C. designed research;R.J.P.S., M.G., and S.B. performed research; R.J.P.S. and M.G. contributed new reagents/analytic tools; R.J.P.S. and M.G. analyzed data; and R.J.P.S., M.G., S.B., G.M.K., G.C.D., andA.C. wrote the paper.
Reviewers: F.E.D., Utrecht University; and D.P.L., Cornell University.
The authors declare no competing interest.
This open access article is distributed under Creative Commons Attribution-NonCommercial-NoDerivatives License 4.0 (CC BY-NC-ND).1To whom correspondence may be addressed. Email: [email protected] or [email protected].
This article contains supporting information online at https://www.pnas.org/lookup/suppl/doi:10.1073/pnas.2026127118/-/DCSupplemental.
Published September 2, 2021.
PNAS 2021 Vol. 118 No. 36 e2026127118 https://doi.org/10.1073/pnas.2026127118 | 1 of 9
ENVIRONMEN
TAL
SCIENCE
SSU
STAINABILITY
SCIENCE
Dow
nloa
ded
by g
uest
on
Janu
ary
26, 2
022

past and future dams will outweigh increased sediment yields fromclimate and land-use change for most basins (17, 18). While this isan important finding, it comes from studies focused on full de-velopment of global hydropower potentials (27). This is a limita-tion, because decreasing prices of alternative renewables will likelyreduce the demand for hydropower, thereby enabling strategichydropower planning with least cumulative impacts (24, 25, 28,29). Sediment trapping could also be reduced by optimized designand management of individual dam projects (30, 31). However,the cumulative benefits of such approaches have not been dem-onstrated at the scale of large basins, with many planned dams andunder changing environmental conditions.A framework that integrates basin and delta processes and
accounts for their interactions and uncertainty in their futuremagnitude and direction could be used to design robust strate-gies to minimize rSLR and increase delta resilience. Here, wepresent such an integrated framework and demonstrate its ap-plication to the Mekong Basin and Delta (Fig. 1A). The frame-work combines a basin and delta component and builds onconcepts of exploratory modeling and decision scaling (32–34).We use this framework to identify key drivers of rSLR in theMekong Delta. Mostly less than 2 m above sea level (6), theMekong Delta is globally outstanding in terms of supportedlivelihoods and food production (35). The Mekong Delta is alsooutstanding in terms of imminent threats across scales, fromunsustainable groundwater use and land management (19, 20,36–39) in the delta to upstream hydropower development (22,40) and global climate change (5, 41), thus presenting a chal-lenging and relevant case study.Our framework helps to address three main research gaps.
First, we study the sensitivity of rSLR to delta-scale drivers(DSDs, e.g., sea level rise and accelerated subsidence) and basin-scale drivers (sediment supply). Second, we analyze differentscenarios of hydropower development in the basin with regard totheir impacts on sediment supply. Using a basin model (25) wesubject each hydropower scenario to many realizations of sedi-ment yields and sediment trapping in dams. Third, we perform abottom-up analysis linking sediment supply to hydropower de-velopment as well as to other basin-scale drivers, e.g. climate andland-use change (42, 43). Instead of prescribing a few scenarioswe map the response of sediment supply to a wide range ofbasin-scale drivers and identify which combinations of thosedrivers are compatible with certain levels of sediment supply (42,43) and thus certain levels of future resilient delta land.
ResultsFirst, we explore different scenarios of DSDs and sedimentsupply (Methods) for the Mekong Delta. We then model for eachof those scenarios how much of the delta surface would remainsubaerial (i.e., above sea level) and how much would fall belowsea level by 2100. For that, we deploy a conceptual model ofdelta morphodynamics (Methods), which translates DSDs andsediment supply into an aggregate measure of rSLR. The resultsallow us to explore if rSLR is more sensitive to DSDs or tosediment supply. Using recent topographic data (6), we also mapwhich parts of the delta would fall below sea level for differentvalues of rSLR.Our estimates of rSLR range from 0.23 m to 1.39 m by 2100.
Because of the extremely low topography of the delta, such rSLRwould result in 7.4 to 89% loss of the subaerial delta land(i.e., land above sea level) (Fig. 1B). Relative sea level (rSLR) isinfluenced by DSDs more than by sediment supply, such thateven with pristine sediment supply for the basin (∼160 Mt/y)subaerial land would change by −7.4 and −76.2% (Fig. 1B, Top).However, sediment supply modulates how much delta land re-mains above sea level within each DSD scenario. Varying sedi-ment supply between 160 and 5 Mt/y results in −7.4 to −26.9%(best-case DSD), −37.7 to −63.5% (central-case DSD), and −76.2
to −89.2% (worst-case DSD) of land above sea level (Fig. 1 B andC). Thus, rSLR is most sensitive to sediment supply for the centralcase of DSDs, for which changes in sediment supply from 160Mt/y(natural load) down to 5 Mt/y [with sediment trapping by full dambuildout (22)] produce a 25.8% variation in land above the sealevel (37.7 to 63.5%). The same variation in sediment supply withthe best-case DSD scenario results in a 19.5% variation (−7.4 to26.9%), and the worst-case DSD scenario results in a 13% vari-ation (76.2 to 89.2%). For the central-range DSD scenario, sedi-ment supply makes the difference between large swaths of landalong the southeastern shorelines and in the northeastern centerof the delta falling below or remaining above the sea level.Stretches of the eastern delta would fall below sea level evenunder best-case DSDs (Fig. 1D, green). Worst-case DSDs wouldincreasingly drown higher-lying areas along the distributarychannels (Fig. 1D, light purple to orange).Thus, rSLR and land above sea level is mostly controlled by
delta-scale management of accelerated subsidence. However,sediment supply also plays an important role. Sediment supplywill be reduced by dams (35), but the magnitude of reductiondepends on where and how dams are built and operated (24, 25,30, 31). Similarly, sand mining in the lower Mekong will reducesediment supply (51), but how much depends on locations andrates of mining [subject to market forces and enforcement ofgovernment regulations (35)]. Also, road construction (44) andchanging land use and climate (42, 43, 45) might alter sedimentyields and thus how much sediment is supplied to rivers. How-ever, especially for climate drivers the direction of change isuncertain and might differ throughout the basin (41).To model joint impacts of changing sediment yields and dam
siting we considered 17 different scenarios of dam siting. Each ofthe 17 scenarios represents a different portfolio of dams, i.e., adifferent set of dam sites, and is associated with one of 11 levelsof increasing hydropower generation, referred to as generationlevels 1 to 11 (GL1 to GL11). GL6 is the status quo, i.e., GL1 toGL5 represent the past construction of dams up to the currentgeneration of 140,000 GWh/y at GL6 (Fig. 2 A and B, purple).Starting from the existing dams at GL6, we analyzed two di-verging trajectories for the future. The first trajectory resultsfrom a business-as-usual future of hydropower development (Fig.2 A and B, red). As an alternative, we analyzed dam portfoliosoptimized for connectivity between the delta and the basin, re-ferred to as the Mekong Delta connectivity (MDC) sequence (25)(blue in Fig. 2 A and B). We then subjected each of the 17portfolios (one historic portfolio for GL1 to GL5 and two each forGL6 to GL11) to 130,000 Monte Carlo analysis (MCA) runs ofthe CASCADE network sediment model (25). In each run, wevaried parameters for sediment yield from seven geomorphicprovinces (22, 25) and for sediment trapping in the dams of fiveriparian countries (25) (Methods).Our analysis advances studies of sediment trapping in Mekong
dams (22, 25, 40), constraining the possible range of sedimentsupply for any dam portfolio (Fig. 2A). We estimate that sedi-ment delivery to the delta with current dams can be around 58 ±17 Mt/y (mean ± 1 SD over the 130,000 MCA runs) (Fig. 2A,GL6), with the variability originating from uncertain sedimentsupply and uncertain sediment trapping in existing dams. Thisreduction in sediment supply to the delta would result in anestimated −23 to −87% change in subaerial delta land by 2100(Fig. 2A, GL6, right y axis).Current plans for expanding hydropower focus on large dams
in the lower Mekong tributaries and the mainstem of theMekong in Laos and Cambodia (Fig. 2B, e.g., GL8, red mark-ers). This would increase generation to around 194,000 GWh/y(GL8) but decrease sediment supply to 31 ± 13 Mt/y, with thetail of the distribution reaching 5 Mt/y. For full hydropowerdevelopment (GL11) the mean sediment delivery to the delta isreduced to 9 ± 1.5 Mt/y. Such a reduction in sediment supply to
2 of 9 | PNAS Schmitt et al.https://doi.org/10.1073/pnas.2026127118 Strategic basin and delta planning increases the resilience of the Mekong Delta under
future uncertainty
Dow
nloa
ded
by g
uest
on
Janu
ary
26, 2
022

the delta would result in a 27 to 90% change in subaerial deltaland. With more dams in the lower Mekong Basin sedimentsupply to the delta becomes less sensitive to changing sedimentyields from hillslope processes and sediment trapping in dams(Fig. 2, see more and more narrow “violins” for GL8 to GL12).Thus, for the planned dam sequence even future increases insediment yields and decreases in sediment trapping would notresult in more sediment supply to the delta. This is because cu-mulative sediment trapping in large dams on the lower Mekongmainstem would outweigh additional sediment from changingcatchment processes and better sediment passage throughupstream dams.The optimized dam portfolio for GL8 would consist mostly of
dams upstream of existing dams, both in China and on lower
Mekong tributaries (Fig. 2B, GL8, blue markers). With that damportfolio, sediment supply could be maintained at or slightlybelow the current rate. Beyond GL8, even optimized damportfolios will lead to decreasing sediment supply. However, upto GL10, sediment supply is significantly higher for the MDCthan for the currently planned sequence (compare violin plot forGL8, GL9, and GL10 for the MDC vs. planned sequence).Reaching GL8 following the MDC sequence would reduce thesurface of the subaerial delta by −23 to −87%, compared toaround −27 to −90% for the planned sequence (both for thecentral estimates of sediment supply).The proliferation of dams in the basin not only reduces total
sediment supply but also changes the sensitivity of sedimentsupply to basin-scale processes. In the past, when there were few
N
China
Burma
Thailand
Viet Nam
India
Cambodia
Laos
1
2
3 45
6
7
Hydropower DamsStatus
Build/Under construction
Potential
Major rivers
Sediment Yield[t/km2/yr]
0
40
160
200
250
280
290
450
National Border
Elevation [m] 6852
0
Mekong Delta
0 200 400km
1 Lancang (LCG)
2NorthernHighlands (NH)
3 Loei Fold Belt (LFB)
4 Mun-Chi Basin (MCB)
5Annamite Mountains (AM)
6 Kon Tum Massif (KTM)
7Tertiary VolcanicPlateau (TVP)
Best estimates
Central estimates
Worstestimates
Delta Scale Drivers (DSDs)
0 50 100% land below sea level
by 2100
0.23
0.33
0.41
0.45
0.48
0.62
0.72
0.82
0.87
0.90
1.04
1.15
1.26
1.33
1.39-7.4 % -37.7 % -76.2 %
-17.3 % -46.3 % -83.6 %
-22.5 % -54.9 % -87.0 %
-24.9 % -60.3 % -88.3 %
-26.9 % -63.5 % -89.2 %
160
100
50
25
5
Se
dim
en
t S
up
ply
[M
t/y]
Re
lati
ve
Se
a L
ev
el R
ise
(rS
LR)
by
21
00
[m
]
panel d0.2
3
0.33
0.41
0.45
0.48
0.62
0.72
0.82
0.87
0.90
1.04
1.15
1.26
1.33
1.39
Below sea level for rSLR of [m]
>2
DSD
s: Best estimates
DSD
s: Central estimates
DSD
s: Worst estim
ates
PPPPPPPPPPPPPPPPPPPPPPPPP)))))))))))))))))))))VVVVVVVVVVVVVVVVVVVVVVTTTTTTTT
MMMM))KKKTTTTK MMMMMMMMMMMMMMMM
MMMMMMMMMMMM
)))))))))))))))))))LLLLL
((((((((((((((((((((((((((((((Nhhhhhhhhhhhhhhhhhhhhhhhhhllllllllllllll
A B C
D
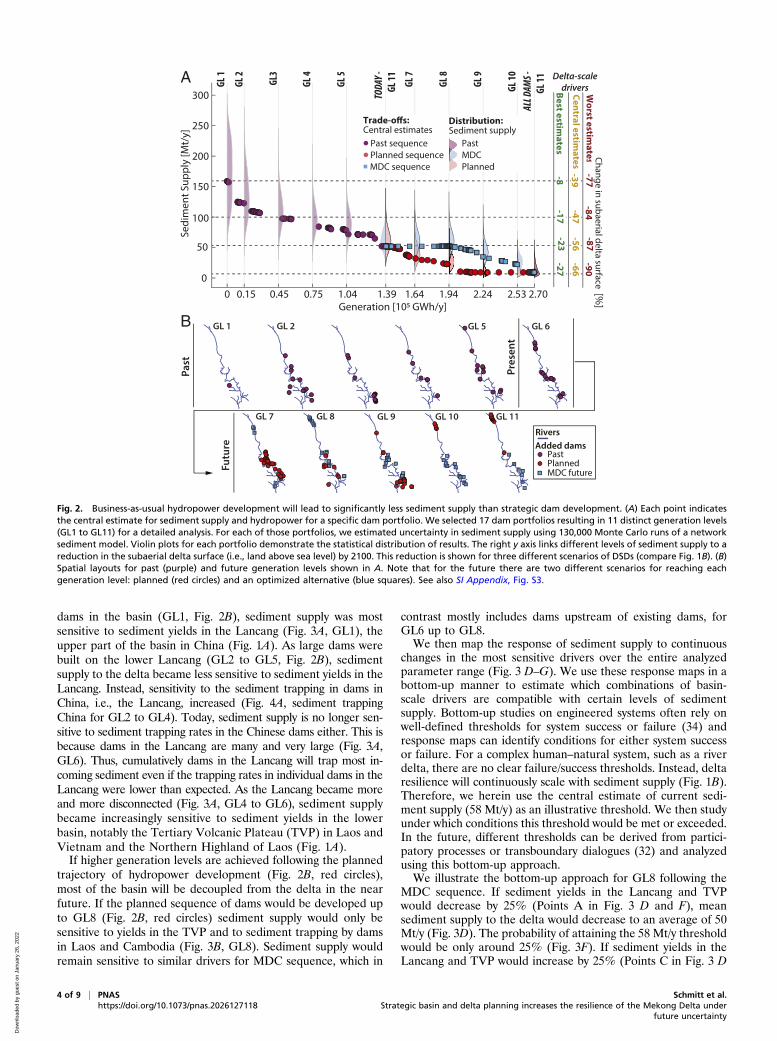
Fig. 1. Up to 90% of the Mekong Delta might fall below sea level by 2100. (A) The 800,000-km2 Mekong basin can be divided into distinct geomorphicprovinces (22) (numbers 1 to 7), each with a different contribution to the sediment budget of the basin. (B) Different levels of sediment supply from the basin(rows) together with different scenarios for DSDs (columns) result in different levels of rSLR (colors) and thus different fractions of the current delta surfaceremaining subaerial, i.e., above sea level (percentages). (C) The change in subaerial delta surface for each level of rSLR in B based on most recent topographicdata (6). (D) These topographic data are used to locate areas below sea level. Refer to SI Appendix, Fig. S2 for trajectories of subaerial delta surface from 2020to 2100 and for continuous levels (0 to 160 Mt/y) of sediment supply. Note that colors in B, C, and D are corresponding.
Schmitt et al. PNAS | 3 of 9Strategic basin and delta planning increases the resilience of the Mekong Delta underfuture uncertainty
https://doi.org/10.1073/pnas.2026127118
ENVIRONMEN
TAL
SCIENCE
SSU
STAINABILITY
SCIENCE
Dow
nloa
ded
by g
uest
on
Janu
ary
26, 2
022
dams in the basin (GL1, Fig. 2B), sediment supply was mostsensitive to sediment yields in the Lancang (Fig. 3A, GL1), theupper part of the basin in China (Fig. 1A). As large dams werebuilt on the lower Lancang (GL2 to GL5, Fig. 2B), sedimentsupply to the delta became less sensitive to sediment yields in theLancang. Instead, sensitivity to the sediment trapping in dams inChina, i.e., the Lancang, increased (Fig. 4A, sediment trappingChina for GL2 to GL4). Today, sediment supply is no longer sen-sitive to sediment trapping rates in the Chinese dams either. This isbecause dams in the Lancang are many and very large (Fig. 3A,GL6). Thus, cumulatively dams in the Lancang will trap most in-coming sediment even if the trapping rates in individual dams in theLancang were lower than expected. As the Lancang became moreand more disconnected (Fig. 3A, GL4 to GL6), sediment supplybecame increasingly sensitive to sediment yields in the lowerbasin, notably the Tertiary Volcanic Plateau (TVP) in Laos andVietnam and the Northern Highland of Laos (Fig. 1A).If higher generation levels are achieved following the planned
trajectory of hydropower development (Fig. 2B, red circles),most of the basin will be decoupled from the delta in the nearfuture. If the planned sequence of dams would be developed upto GL8 (Fig. 2B, red circles) sediment supply would only besensitive to yields in the TVP and to sediment trapping by damsin Laos and Cambodia (Fig. 3B, GL8). Sediment supply wouldremain sensitive to similar drivers for MDC sequence, which in
contrast mostly includes dams upstream of existing dams, forGL6 up to GL8.We then map the response of sediment supply to continuous
changes in the most sensitive drivers over the entire analyzedparameter range (Fig. 3 D–G). We use these response maps in abottom-up manner to estimate which combinations of basin-scale drivers are compatible with certain levels of sedimentsupply. Bottom-up studies on engineered systems often rely onwell-defined thresholds for system success or failure (34) andresponse maps can identify conditions for either system successor failure. For a complex human–natural system, such as a riverdelta, there are no clear failure/success thresholds. Instead, deltaresilience will continuously scale with sediment supply (Fig. 1B).Therefore, we herein use the central estimate of current sedi-ment supply (58 Mt/y) as an illustrative threshold. We then studyunder which conditions this threshold would be met or exceeded.In the future, different thresholds can be derived from partici-patory processes or transboundary dialogues (32) and analyzedusing this bottom-up approach.We illustrate the bottom-up approach for GL8 following the
MDC sequence. If sediment yields in the Lancang and TVPwould decrease by 25% (Points A in Fig. 3 D and F), meansediment supply to the delta would decrease to an average of 50Mt/y (Fig. 3D). The probability of attaining the 58 Mt/y thresholdwould be only around 25% (Fig. 3F). If sediment yields in theLancang and TVP would increase by 25% (Points C in Fig. 3 D
0 0.15 0.45 0.75 1.04 1.39 1.64 1.94 2.24 2.53 2.70
0
50
100
150
200
250
300
Se
dim
en
t S
up
ply
[M
t/y]
-39
1LG
2LG
3LG
4LG
5LG
7LG
8LG
9LG
01LG-S
MADLLA1LG1 Delta-scale
drivers Best estimates
Central estimates
Worst estim
ates-47
-56-66
-8-23
-27
Ch
an
ge
in su
ba
eria
l de
lta su
rface
[%]
-17
Past
Futu
re
GL 1 GL 2 GL 5 GL 6
Added damsPastPlanned MDC future
Rivers
GL 7 GL 8 GL 9 GL 10 GL 11
Pres
ent
-77-84
-87-90
-YADOT11LG
Central estimates
MDC sequence
Planned sequence
Distribution: Sediment supply
MDC
Planned
Past sequence Past
B
A
Fig. 2. Business-as-usual hydropower development will lead to significantly less sediment supply than strategic dam development. (A) Each point indicatesthe central estimate for sediment supply and hydropower for a specific dam portfolio. We selected 17 dam portfolios resulting in 11 distinct generation levels(GL1 to GL11) for a detailed analysis. For each of those portfolios, we estimated uncertainty in sediment supply using 130,000 Monte Carlo runs of a networksediment model. Violin plots for each portfolio demonstrate the statistical distribution of results. The right y axis links different levels of sediment supply to areduction in the subaerial delta surface (i.e., land above sea level) by 2100. This reduction is shown for three different scenarios of DSDs (compare Fig. 1B). (B)Spatial layouts for past (purple) and future generation levels shown in A. Note that for the future there are two different scenarios for reaching eachgeneration level: planned (red circles) and an optimized alternative (blue squares). See also SI Appendix, Fig. S3.
4 of 9 | PNAS Schmitt et al.https://doi.org/10.1073/pnas.2026127118 Strategic basin and delta planning increases the resilience of the Mekong Delta under
future uncertainty
Dow
nloa
ded
by g
uest
on
Janu
ary
26, 2
022

and F) mean sediment supply to the delta would increase to anaverage of 66 Mt/y (Fig. 3D). The probability of attaining the 58Mt/y threshold would be 60%. Similar reasoning can be appliedto sediment trapping in Laos and Cambodia. If sediment trap-ping in dams in both countries is 25% less (Point D in Fig. 3 Eand G) the central estimate of sediment supply would increase toaround 64 Mt/yr (Point D in Fig. 3E) and the probability ofattaining 58 Mt/y would be around 55%.We can further analyze if the MDC sequence robustly results
in a higher probability to attain the 58 Mt/y threshold comparedwith the planned sequence even under future uncertainty. Withthe planned sequence of dam construction, there is a very low
probability of attaining the 58 Mt/y threshold for most combi-nations of basin-scale drivers (Fig. 4 A and B). The only possiblecase would be if sediment trapping in dams in Laos were lessthan half the central estimates and 58 Mt/y could be attainedwith around 50% probability (point A in Fig. 4B). By contrast,the MDC sequence would attain the 58 Mt/y threshold with thesame probability for central estimates of sediment trapping(marker CE in Fig. 4 C and D).Fig. 4 E and F show the difference in probabilities between the
MDC and the planned sequence. This comparison highlightsconditions of sediment yield and sediment trapping under whichthe MDC sequence would perform better than the planned
A B C
D E
F G
Probability of attaining sediment
Fig. 3. Infrastructure decisions alter the impact of basin-scale drivers on sediment supply to the Mekong Delta. Sensitivity of sediment supply to the MekongDelta and sediment trapping parameters for the past (A), the planned future (B), and the optimized MDC scenario (C). Sensitivity is measured as Sobol index,ranging from 0 (no sensitivity) to 1 (high sensitivity) computed over 130,000 MCA realizations for each dam portfolio (Fig. 2B). (D–G) The response of sedimentsupply to continuous changes in the most sensitive drivers for GL8 for the MDC sequence in terms of resulting mean sediment supply (D, E) and in terms ofattaining at least the current level of supply (58 Mt/y). Points A and C mark a 25% decrease or increase in sediment yields compared to central estimates (PointB). Points D and F mark a 25% decrease or increase in sediment trapping compared to central estimates (Point E).
Schmitt et al. PNAS | 5 of 9Strategic basin and delta planning increases the resilience of the Mekong Delta underfuture uncertainty
https://doi.org/10.1073/pnas.2026127118
ENVIRONMEN
TAL
SCIENCE
SSU
STAINABILITY
SCIENCE
Dow
nloa
ded
by g
uest
on
Janu
ary
26, 2
022

sequence. Notably, the likelihood of the MDC sequence out-performing the planned sequence increases with more optimisticestimates of sediment yield and sediment trapping (yellow andpurple in Fig. 4 E and F). Importantly, we find no conditions underwhich the planned sequence outperforms the MDC sequence.To constrain potential future changes in sediment yield, we
analyzed projections of sediment yields by 2030 (43) and by 2070(42) (SI Appendix, Supplemental Methods). Each assessment in-cluded different climate and land-use projections. Cross and starmarkers in Fig. 4 A, C, and E indicate the projected relativechange in sediment yields from the Lancang and the TVP. Whilethere is considerable variability in projected sediment yields bothdatasets indicate a decrease in sediment yield in the Lancang andan increase for the TVP for moderate emission scenarios, e.g.,RCP2.6 (Representative Concentration Pathway 2.6). Projec-tions for RCP4.5 by Borelli et al. (42) (Fig. 4A, B_4.5) indicate amajor increase in sediment yield from the TVP (+ 70%), whileyields in the Lancang remain mostly stable (+8%). Projectionsfrom the same study for RCP8.5 (Fig. 4A, B_8.5) indicate insteada major increase in sediment yields from the Lancang (+40%)and a smaller increase in sediment yields in the TVP (+ 25%).Chuenchum et al.’s projections for RCP4.5 and RCP8.5 (Fig. 4,C_4.5 and C_8.5) indicate lower sediment yields from the Lan-cang (−22 and –11%) and increases in sediment yield from theTVP (+46 and +51%) (43).Under B_4.5 and B_8.5, optimized dam portfolios would at-
tain a sediment supply of 58 Mt/y with around 80% (B_4.5) and65% probability (B_8.5) (Fig. 4B). Compared to our baseline(Fig. 4E, point CE) most projections (except B_2.6) would in-crease the probability of attaining the 58 Mt/y threshold. Nota-bly, the MDC sequence has an even greater benefit for B_4.5 andB_8.5 than for the baseline conditions. Thus, changing sedimentyields increase the advantage of the MDC sequence over theplanned sequence in terms of attaining the 58 Mt/y threshold(B_4.5 and B_8.5 in Fig. 4E). Only if much less sediment issupplied to rivers does this advantage decrease (light blue in
Fig. 4E). Those conditions could occur if extreme weather eventsdecrease in magnitude and frequency (41).There are no projections of future sediment trapping in dams.
On the one hand, stricter environmental safeguards might leadto designing and operating future dams for less sediment trappingcompared our central estimates (31). On the other hand, manydams in the Mekong were built without large bottom outlets orother features needed for sediment management, which hindersfuture implementation of sediment management in existing dams(30). If improved sediment management in dams is possible in thefuture, the cumulative benefits of those dam-scale measures needto be leveraged by strategic hydropower planning. The relativeadvantage of the MDC sequence (Fig. 4D) over the planned se-quence (Fig. 4B) increases from 40% (Fig. 4F, CE) to nearly 60%if sediment trapping in dams is reduced by 25% compared to thecentral estimate (Fig. 4F, B).
DiscussionGlobally, coastal populations are growing (1, 2), and climatechange (1) and major infrastructure plans (14, 17, 27) threatenthe resilience of many large river deltas. Our results from theMekong Delta, which supports more than 17 million livelihoodsand food systems of global importance (35), point to the need forsustainable land, water, and sediment management on delta andbasin scales. While river basin and delta processes are commonlydisconnected in research and management, our findings high-light the importance of integrating assessments across scales toestimate future rSLR and to identify effective management le-vers for achieving delta resilience in a robust manner.Our results from integrating basin- and delta-scale models
emphasize that rSLR in the Mekong Delta will be driven byaccelerated subsidence from nonsustainable groundwater abstrac-tions (5, 19, 20, 36, 38). The area of the delta remaining aboveraising sea levels will change by −23 to −87% by 2100, even ifsediment supply stays at or close to current levels (around 58 Mt/y).Delta planning must consider this imminent threat to agricultureand other livelihoods and the potential for permanent land loss.
A
B
C
D
E
F
Fig. 4. Strategic planning is essential to leverage lower sediment trapping in dams and higher sediment yields for more sediment supply to the delta. (A andB) Probability of attaining current levels of sediment supply (58 Mt/y) with the planned dam sequence. (C and D) Same as A and B, but for the strategic MDChydropower sequence. (E) Difference between A and C. (F) Difference between B and D. Cross and asterisk markers indicate projections of sediment yieldfrom Borelli et al. (42) (+ markers) for the year 2070 and by Chuenchum et al. (43) (* markers) for the year 2030 using different RCPs and land-use scenarios.Numbers indicate the RCPs, prefixes “C_” and “B_” indicate projections from either Borrelli et al. (42) or Chenchum et al. (43). Square markers A and B arediscussed in the text.
6 of 9 | PNAS Schmitt et al.https://doi.org/10.1073/pnas.2026127118 Strategic basin and delta planning increases the resilience of the Mekong Delta under
future uncertainty
Dow
nloa
ded
by g
uest
on
Janu
ary
26, 2
022

Despite the dominance of DSDs, maximizing sediment supply iscrucial to maintain at least some delta land above sea level (3, 4,12), especially if DSDs are managed more sustainably in the future.Integrated planning is thus needed to evaluate future decisions inthe basin regarding their impacts on delta resilience and comparingmonetary benefits from development activities, e.g., hydropower orsand mining, to costs of adaptation, relocation, and coastalengineering in the delta.Strategic infrastructure planning is paramount for maintaining
sediment supply to the Mekong Delta (22, 24, 25, 40) and thusfor maximizing its resilience. Specifically, further business-as-usualdam development is not compatible with maintaining sedimentsupply even at the current levels, which are strongly reducedcompared to the basin’s pristine state. Only strategic dam planningacross all riparian countries could produce a modest increase inhydropower generation while maintaining sediment supply closeto current levels. Our analyses highlight that strategic infrastruc-ture planning on a portfolio level is a robust strategy to minimizecumulative environmental impacts of dams even under majoruncertainty. This finding has implications beyond the Mekongbecause most of the global hydropower potential is in large andpoorly studied basins, where origins of sediment and other naturalvalues are poorly constrained and subject to change, and wherethe design and operation of future dams is highly uncertain (27).For the Mekong, our results indicate that better design and
management of individual dams is unlikely to translate into bettersediment supply if dams are not developed in a strategic manner.Of course, environmental safeguards on the scale of individualdams can alleviate local negative externalities and might seemmore practical from a political perspective than a basin-scaleplanning process. However, our results show that only strategicplanning on a portfolio level ensures that local safeguards, such asbetter sediment management, result in basin-scale improvementsin environmental objectives.Our analyses relied on a multistage exploratory process to
constrain most significant drivers of rSLR and to focus the analysison drivers with the greatest relative uncertainty. However, futureresearch could include the entire connected system model,i.e., including both basin and delta processes, into the bottom-upanalysis. Ideally, future analyses would also improve process rep-resentation in the delta to capture the spatial heterogeneity ingroundwater extraction and natural compaction (19, 20, 38, 46), aswell as feedbacks between delta management and sediment ac-cretion (39). Results could then be used by regional stakeholdersto negotiate trade-offs and to develop adaptation plans (47) thatconsider realistic levels of future rSLR and acknowledge the in-trinsic links between processes on delta, basin, and global scales.Making deltas more resilient will require navigating conflicting
objectives on multiple scales, within overarching uncertaintiesand shocks from global climate change and collapse of nature.Integrating parsimonious models that jointly represent deltasand their contributing basins can provide critical information tomake delta management robust to future uncertainty and help inestablishing delta resilience as a crucial objective in river basinmanagement.
MethodsWe base our analyses on three main components. First, we developed aconceptual morphodynamic model of the Mekong Delta, which, in contrastto previous iterations (5), considers dynamic feedbacks between land lossand aggradation. This model allows us to transfer basin and DSDs into acommon metric of rSLR. We then use the latest topography of the MekongDelta (6) to identify which areas would fall below sea level for different ratesof rSLR (e.g., Fig. 1). Throughout the paper, this model is used to translatesediment supply rates into estimates delta surface below sea level by the endof the century.
Second, we use a network-scale sediment routing model (25, 48) to an-alyze impacts of changing sediment yields and dam sediment trapping onsediment supply. We use the model to simulate different scenarios of dam
development. For each scenario, we perform an MCA, consisting of 130,000runs of the basin model. In each run, the model implements a new combi-nation of sediment yields from seven geomorphic provinces and dam sedi-ment trapping in five riparian countries.
Finally, we implement a variance-based sensitivity analysis (49, 50) todetermine sensitivity of sediment supply to a total of 12 different parame-ters for each of the 17 dam portfolios.
Delta Plane Model. The delta plane model (5) is used to estimate futuresubaerial land in the Mekong Delta for different combinations of basin andDSDs. The delta plane model is based on a sediment mass balance for thedelta, which then allows us to put changes in sediment supply (in megatonsper year) and accelerated subsidence (in millimeters per year) into a commonmetric of rSLR (in millimeters per year). The model is run with annualtimesteps to 2100.
In each year, subsidence of the delta plane because of local drivers isdetermined as
SUBS(t) = CMP(t) + PMP(t),where SUBS is total subsidence, CMP is natural compaction, and PMP issubsidence from groundwater pumping (all in millimeters per year) at time t[years]. Subsidence is counteracted by sediment supply from the basin, whichaccretes delta land as it spreads out over the delta surface. The effect of thisland building is expressed as
ACC(t) = SED*(t)ρS
*1
ADelta(t),
where SED* is the sediment supply (tons per year), ρS is the density of de-posited material (tons per cubic meter), ADelta is the subaerial extend of thedelta (square meters), and ACC is the resulting accretion. Note that SED*considers for the effect of sand mining
SED* = max(0, SED(t) −MNG(t)).Thus, if rates of mining (MNG) exceed sediment supply, there will be no moresupply to the delta, but the rate of supply cannot become negative. In realityerosion could replace parts of the mined sediment, i.e., increasing sedimentsupply at the cost of incision and lateral erosion of river channels and as-sociated negative externalities (51, 52).
For both mining and pumping, we assume that rates will decrease overtime, both because of stricter environmental regulations and possible landloss and decreasing agricultural area, so that
PMP(t) = PMP(t = 0)*mt
and
MNG(t) = MNG(t = 0)*mt ,
where m < 1 denotes a rate factor [−].Finally, rates of rSLR in each time step can be determined as
rSLR(t) = SLR(t) + SUBS(t) − ACC(t)and the cumulative rSLR is then
rSLRtot(t) = ∑k∈{1...t−1}
rSLRtot(k),
which can be compared to recent topographic data (Fig. 1E) (6) and a hyp-sometric curve of the delta (SI Appendix, Fig. S1) to identify which parts ofthe delta fall below sea level, and where those parts are located.
Dynamic versus Static Delta Plane Model. As indicated above, accretion rateswill depend upon the subaerial delta surface on which sediment can accrete.In a static formulation, we assume that ADelta(t) = const = 40,000*10
6m2. In a
dynamic formulation, we assume that the area of the subaerial delta isvariable, decreasing with increasing cumulative rSLR. As the supplied sedi-ment will then spread over less area, the marginal accretion (i.e., in milli-meters per ton) resulting from sediment supply will increase as the deltashrinks (5, 21, 53).
To estimate the subaerial delta land, we use the gridded digital elevationmodel of the delta provided by Minderhoud et al. (6) (SI Appendix, Fig. S1shows the hypsometric curve of the delta plane). We calculate delta landremaining above sea level as
Schmitt et al. PNAS | 7 of 9Strategic basin and delta planning increases the resilience of the Mekong Delta underfuture uncertainty
https://doi.org/10.1073/pnas.2026127118
ENVIRONMEN
TAL
SCIENCE
SSU
STAINABILITY
SCIENCE
Dow
nloa
ded
by g
uest
on
Janu
ary
26, 2
022

ADelta(t) = ∑h(i)>rSLR tot(t)
i*ci ,
where i denotes a cell in the digital elevation model of the delta and ci is thecell size of that cell (square meters). Thus, we form the sum of all cells thatabove the sea level rise for time t.
We derive a value of rSLR for both dynamic and static model formulationsrSLRtot,dyn(t) and rSLRtot,stat(t) by the year 2100 (SI Appendix, Fig. S2). Resultsare reported as the mean of the two models in the year 2100. We take thisapproach because neither the static nor the dynamic models is more realisticper se. Rather, we propose that the two models present an extreme enve-lope for accretion. Thus, rSLR is calculated as
rSLRtot(2100) = rSLRtot,dyn(2100) + rSLRtot,stat(2100)2
.
We separately report the outcomes of each model in SI Appendix, Fig. S2.Similar to ref. 5, we propose three different scenarios for global and local
drivers of subsidence. These drivers are natural subsidence, pumping, sandmining, and sea level rise. Each of the scenarios combines either a minimum,maximum, or central estimate value for each driver, all derived fromreviewing pertinent published data (5). The ambition of this analysis is not tomodel the detailed morphologic development of the future delta but ratherto provide a backdrop for how different rates of sediment supply, whichcouple the basin and the delta models, together with DSDs, will create verydifferent futures for the delta.
The delta plane model comes with some relevant simplifications. First, weassume that sediment is spread across the entire delta surface. In a natural delta,areas closer to rivers and depressionswould receivemore deposition. In a heavilymodified delta, sediment deposition is further altered by infrastructure for ir-rigation and flood protection (39). Second, we assume that DSDs are constant inspace. Instead, new research indicates spatial variability, e.g., in natural com-paction and pumping-related subsidence (19, 20, 36, 37, 46). Third, the modelconsiders neither the role and dynamics of different grain sizes, e.g., sand fromnatural bed-load transport versus finer sediment from hillslope processes, noroff-shore sediment transport (54). These points call for efforts to build spatiallyexplicit models for delta management, which could draw on recent spatialdatasets of subsidence (6, 36, 38, 46). Finally, estimates for some drivers mightseem dire but are still optimistic with regard to local management, as we as-sume decreasing trends of unsustainable groundwater use and sand mining.While this assumption is in line with mitigation scenarios proposed in otherpapers (36), irrigation abstractions are still increasing in parts of the delta (55),highlighting the need for better water management in the delta.
Sediment Routing and Trapping Model. The functioning of the model used forthis analysis is described elsewhere (25). In a nutshell, the model uses a graph-based routing scheme to represent transport of sediment from each node inthe river network to the basin outlet. The sediment supply (in tons per year)at each source node ς [denoted y(ς)] is determined by the local sedimentyield (in tons per square kilometer per year) and the area supplying sedi-ment to the node (in square kilometers). The local sediment yield is deter-mined by its location within one of seven geomorphic provinces.
Sediment trapping rates for each dam are determined by applying theBrune curve (56). According to the nonlinear Brune model, sediment trapefficiency in a dam, TE(d), is a function of hydraulic residence time in theassociated reservoir, which can be derived for current and future dams fromavailable regional datasets (25).
Thus, the sediment routing model has a total of 131 parameters. First,there are 124 estimates of trap efficiency in dams. Then, there are estimatesof sediment yield at each node in the river network, but as sediment yield is
assumed constant in each geomorphic province, yield parameters collapse toseven values, one for each geomorphic province.
Global Sensitivity Analysis. To test model sensitivity to these parameters, weapplied a Sobol sensitivity analysis, a variance decomposition approach thatattributes variance in the simulated model output to individual input pa-rameters and their interactions (49, 50). Sampling the full space of all 131input parameters would have resulted in an infeasibly large number ofmodel simulations. Thus, we grouped the dams of each country togetherand defined a country-specific multiplier for the trap efficiency of dams ineach country c. Using this multiplier, eTE(c), also reflects that environmentalregulations for dam design and operation and requirements for sedimentpassage would potentially be enacted on a national level. Thus, for thesensitivity analysis, sediment trapping in a dam is determined by
TE’(d) = eTE(c)*TE(d),i.e., the central estimate of sediment trapping derived from dam-specificparameters and a country-specific multiplier. It should be noted that moredetailed future studies for, e.g., smaller dam portfolios on specifictributaries, could adopt a similar approach on a single-dam level.
Similarly, the sediment yield at each node is modified by amultiplier that isspecific to the geomorphic province, g. Using this multiplier, ey (g), allows usto modify the central estimates of sediment yield so that
y ’(ς) = ey (g)*y(ς),where g is the geomorphic province in which source node ς is located.
Scenarios of sediment supply and sediment trapping are then generatedthrough a two-step scheme to sample the 12-dimensional parameter space(five countries and seven geomorphic provinces). For that, we used Sobolquasi-random sampling coupled with Saltelli’s cross-sampling method (57)aimed at uniformly covering the multidimensional input space of e param-eters (49). We set the range of eTE to 0.25 to 1.5 and the range of ey to 0.2 to2. Note that higher values of eTE represent more sediment trapping and thusless supply to the delta, while higher values of ey will lead to more sedimentsupply to the delta. Note that we capped eTE at a lower value (1.5) than ey
(2.0). This is mostly because we propose that most uncertainty in sedimenttrapping is due to the unknown design and operation of run-of-river damson the lower Mekong. For those dams, which might be partially drawn downduring the flood season, sediment trapping is likely to be lower than theestimates derived from the Brune curve.
In total, we generated 130,000 inputs sets from the Sobol sequence andsimulated the resulting sediment supply to the delta for 17 portfolios (fiveportfolios representing past dam development, six for the planned future,and six for MDC futures), for a total of 2,210,000 runs.
We then use Sobol indices to determine the sensitivity of the responsevariable (sediment supply) to each of the 12 model parameters. Both theinput sampling and the Sobol sensitivity analysis were implemented using theMOEA Framework (50).
Data Availability. Data on dam location and design (25), delta topography (6),and global projections of sediment yields (42) are available from repositoriesassociated with the respective publications. Color maps for Fig. 4 are avail-able from Crameri (58). New geospatial data (geomorphic provinces) and codeand data required to reproduce the robust analysis for future dam portfoliosare available from Zenodo at https://doi.org/10.5281/zenodo.5138143 (59). Allother study data are included in the article and/or SI Appendix.
1. IPCC, “Summary for policymakers” in IPCC Special Report on the Ocean and Cryo-
sphere in a Changing Climate, H.-O. Pörtner et al., Eds. (International Panel on Cli-
mate Change, 2019), pp. 3–35.2. Z. D. Tessler et al., ENVIRONMENTAL SCIENCE. Profiling risk and sustainability in
coastal deltas of the world. Science 349, 638–643 (2015).3. A. J. F. Hoitink, et al., Resilience of river deltas in the Anthropocene. J Geophys. Res.
Earth Surface 125, e2019JF005201 (2020).4. D. P. Loucks, Developed river deltas: Are they sustainable? Environ. Res. Lett. 14,
113004 (2019).5. R. J. P. Schmitt, Z. Rubin, G. M. Kondolf, Losing ground—Scenarios of land loss as
consequence of shifting sediment budgets in the Mekong Delta. Geomorphology 294,
58–69 (2017).6. P. S. J. Minderhoud, L. Coumou, G. Erkens, H. Middelkoop, E. Stouthamer, Mekong
delta much lower than previously assumed in sea-level rise impact assessments. Nat.
Commun. 10, 3847 (2019).
7. E. J. Anthony et al., Linking rapid erosion of the Mekong River delta to human ac-
tivities. Sci. Rep. 5, 14745 (2015).8. D. Chen et al., Recent evolution of the Irrawaddy (Ayeyarwady) Delta and the impacts
of anthropogenic activities: A review and remote sensing survey. Geomorphology
365, 107231 (2020).9. M. Becker et al., Water level changes, subsidence, and sea level rise in the
Ganges-Brahmaputra-Meghna delta. Proc. Natl. Acad. Sci. U.S.A. 117, 1867–1876
(2020).10. E. Gebremichael et al., Assessing land deformation and sea encroachment in the Nile
Delta: A radar interferometric and inundation modeling approach. J. Geophys. Res.
Solid Earth 123, 3208–3224 (2018).11. J. A. Nittrouer, E. Viparelli, Sand as a stable and sustainable resource for nourishing
the Mississippi River delta. Nat. Geosci. 7, 350–354 (2014).12. J. P. M. Syvitski et al., Sinking deltas due to human activities. Nat. Geosci. 2, 681–686
(2009).
8 of 9 | PNAS Schmitt et al.https://doi.org/10.1073/pnas.2026127118 Strategic basin and delta planning increases the resilience of the Mekong Delta under
future uncertainty
Dow
nloa
ded
by g
uest
on
Janu
ary
26, 2
022

13. L. Giosan, J. Syvitski, S. Constantinescu, J. Day, Climate change: Protect the world’sdeltas. Nature 516, 31–33 (2014).
14. C. Hill et al., “Hotspots of present and future risk within deltas: Hazards, exposure andvulnerability” in Deltas in the Anthropocene, C. W. Hutton, R. J. Nicholls, S. Hanson,Eds. (Palgrave Macmillan, Cham, 2020), pp. 127–151.
15. A. C. Welch, R. J. Nicholls, A. N. Lázár, Evolving deltas: Coevolution with engineeredinterventions. Elementa 5, 49 (2017).
16. Z. D. Tessler, C. J. Vörösmarty, I. Overeem, J. P. M. Syvitski, A model of water andsediment balance as determinants of relative sea level rise in contemporary and fu-ture deltas. Geomorphology 305, 209–220 (2018).
17. F. E. Dunn, et al., Projections of declining fluvial sediment delivery to major deltasworldwide in response to climate change and anthropogenic stress. Environ. Res. Lett.14, 084034 (2019).
18. J. P. M. Syvitski, C. J. Vörösmarty, A. J. Kettner, P. Green, Impact of humans on the fluxof terrestrial sediment to the global coastal ocean. Science 308, 376–380 (2005).
19. P. S. J. Minderhoud et al., Impacts of 25 years of groundwater extraction on subsi-dence in the Mekong delta, Vietnam. Environ. Res. Lett. 12, 064006 (2017).
20. L. E. Erban, S. M. Gorelick, H. A. Zebker, Groundwater extraction, land subsidence,and sea-level rise in the Mekong Delta, Vietnam. Environ. Res. Lett. 9, 084010 (2014).
21. M. D. Blum, H. H. Roberts, Drowning of the Mississippi Delta due to insufficientsediment supply and global sea-level rise. Nat. Geosci. 2, 488–491 (2009).
22. G. M. Kondolf, Z. K. Rubin, J. T. Minear, Dams on the Mekong: Cumulative sedimentstarvation. Water Resour. Res. 50, 5158–5169 (2014).
23. F. E. Dunn et al., Projections of historical and 21st century fluvial sediment delivery tothe Ganges-Brahmaputra-Meghna, Mahanadi, and Volta deltas. Sci. Total Environ.642, 105–116 (2018).
24. R. J. P. Schmitt, S. Bizzi, A. Castelletti, G. M. Kondolf, Improved trade-offs of hydro-power and sand connectivity by strategic dam planning in the Mekong. Nat. Sustain.1, 96–104 (2018).
25. R. J. P. Schmitt, S. Bizzi, A. Castelletti, J. J. Opperman, G. M. Kondolf, Planning damportfolios for low sediment trapping shows limits for sustainable hydropower in theMekong. Sci. Adv. 5, eaaw2175, 10.1126/sciadv.aaw2175 (2019).
26. G. Grill et al., Mapping the world’s free-flowing rivers. Nature 569, 215–221 (2019).27. C. Zarfl, A. E. Lumsdon, J. Berlekamp, L. Tydecks, K. Tockner, A global boom in hy-
dropower dam construction. Aquat. Sci. 77, 161–170 (2014).28. G. Ziv, E. Baran, S. Nam, I. Rodríguez-Iturbe, S. A. Levin, Trading-off fish biodiversity,
food security, and hydropower in the Mekong River Basin. Proc. Natl. Acad. Sci. U.S.A.109, 5609–5614 (2012).
29. R. J. P. Schmitt, N. Kittner, G. M. Kondolf, D. M. Kammen, Joint strategic energy andriver basin planning to reduce dam impacts on rivers in Myanmar. Environ. Res. Lett.,in press.
30. T. B. Wild, D. P. Loucks, Managing flow, sediment, and hydropower regimes in the SrePok, Se San, and Se Kong Rivers of the Mekong basin. Water Resour. Res. 50,5141–5157 (2014).
31. T. B. Wild, P. M. Reed, D. P. Loucks, M. Mallen-Cooper, E. D. Jensen, Balancing hy-dropower development and ecological impacts in the Mekong: Tradeoffs for SamborMega Dam. J. Water Resour. Plan. Manage. 145, 05018019 (2019).
32. N. L. Poff et al., Sustainable water management under future uncertainty with eco-engineering decision scaling. Nat. Clim. Chang. 6, 25–34 (2016).
33. T. Hashimoto, D. P. Loucks, J. R. Stedinger, Robustness of water resources systems.Water Resour. Res. 18, 21–26 (1982).
34. C. Brown, Y. Ghile, M. Laverty, K. Li, Decision scaling: Linking bottom-up vulnerabilityanalysis with climate projections in the water sector. Water Resour. Res. 48, W09537(2012).
35. G. M. Kondolf et al., Changing sediment budget of the Mekong: Cumulative threatsand management strategies for a large river basin. Sci. Total Environ. 625, 114–134(2018).
36. P. S. J. Minderhoud, H. Middelkoop, G. Erkens, E. Stouthamer, Groundwater extrac-tion may drown mega-delta: Projections of extraction-induced subsidence and ele-vation of the Mekong delta for the 21st century. Environ. Res. Commun. 2, 011005(2020).
37. K. de Wit et al., Identifying causes of urban differential subsidence in the VietnameseMekong Delta by combining InSAR and field observations. Remote Sens. 13, 189(2021).
38. P. S. J. Minderhoud et al., The relation between land use and subsidence in theVietnamese Mekong delta. Sci. Total Environ. 634, 715–726 (2018).
39. A. D. Chapman, S. E. Darby, Dams and the economic value of sediment in the Viet-namese Mekong Delta. Ecosyst. Serv. 32, 110–111 (2018).
40. M. Kummu, X. X. Lu, J. J. Wang, O. Varis, Basin-wide sediment trapping efficiency ofemerging reservoirs along the Mekong. Geomorphology 119, 181–197 (2010).
41. S. E. Darby et al., Fluvial sediment supply to a mega-delta reduced by shifting tropical-cyclone activity. Nature 539, 276–279 (2016).
42. P. Borrelli et al., Land use and climate change impacts on global soil erosion by water(2015-2070). Proc. Natl. Acad. Sci. U.S.A. 117, 21994–22001 (2020).
43. P. Chuenchum, M. Xu, W. Tang, Predicted trends of soil erosion and sediment yieldfrom future land use and climate change scenarios in the Lancang–Mekong River byusing the modified RUSLE model. Int. Soil and Water Cons. Res. 8, 213–227 (2020).
44. R. C. Sidle, A. D. Ziegler, The dilemma of mountain roads. Nat. Geosci. 5, 437–438(2012).
45. B. Shrestha, T. A. Cochrane, B. S. Caruso, M. E. Arias, Land use change uncertaintyimpacts on streamflow and sediment projections in areas undergoing rapid devel-opment: A case study in the Mekong Basin. Land Degrad. Dev. 29, 835–848 (2018).
46. C. Zoccarato, P. S. J. Minderhoud, P. Teatini, The role of sedimentation and naturalcompaction in a prograding delta: Insights from the mega Mekong delta, Vietnam.Sci. Rep. 8, 11437 (2018).
47. J. H. Kwakkel, M. Haasnoot, W. E. Walker, Developing dynamic adaptive policypathways: A computer-assisted approach for developing adaptive strategies for adeeply uncertain world. Clim. Change 132, 373–386 (2015).
48. R. J. P. Schmitt, N. Kittner, G. M. Kondolf, D. M. Kammen, Joint strategic energy andriver basin planning to reduce dam impacts on rivers in Myanmar. Environ. Res. Lett.16, 054054 (2021).
49. I. M. Sobol, Global sensitivity indices for nonlinear mathematical models and theirMonte Carlo estimates. Math. Comput. Simul. 55, 271–280 (2001).
50. D. Hadka, P. Reed, Borg: An auto-adaptive many-objective evolutionary computingframework. Evol. Comput. 21, 231–259 (2013).
51. C. R. Hackney et al., River bank instability from unsustainable sand mining in thelower Mekong River. Nat. Sustain. 3, 217–225 (2020).
52. M. G. Kondolf, Geomorphic and environmental effects of instream gravel mining.Landsc. Urban Plan. 28, 225–243 (1994).
53. W. I. Van De Lageweg, A. B. A. Slangen, Predicting dynamic coastal delta change inresponse to sea-level rise. J. Mar. Sci. Eng. 5, 24 (2017).
54. M. Besset, E. J. Anthony, G. Brunier, P. Dussouillez, Shoreline change of the MekongRiver delta along the southern part of the South China Sea coast using satellite imageanalysis (1973-2014). Géomorphologie: relief, processus, environnement 22, 137–146(2016).
55. T. Hamer, C. Dieperink, V. P. D. Tri, H. S. Otter, P. Hoekstra, The rationality ofgroundwater governance in the Vietnamese Mekong Delta’s coastal zone. Int.J. Water Resour. Dev. 36, 127–148 (2020).
56. G. M. Brune, Trap efficiency of reservoirs. Eos (Wash. D.C.) 34, 407–418 (1953).57. A. Saltelli, et al., Global Sensitivity Analysis: The Primer (John Wiley & Sons, 2008).58. F. Crameri, Scientific colour maps. Zenodo. https://zenodo.org/record/4491293#.YQ7-
B7UBOlPY. Accessed 17 May 2021.59. R. J. P. Schmitt, Strategic basin and delta planning increases the resilience of the
Mekong Delta under future uncertainty [Data set]. Zenodo. https://doi.org/10.5281/zenodo.5138143. Deposited 26 July 2021.
Schmitt et al. PNAS | 9 of 9Strategic basin and delta planning increases the resilience of the Mekong Delta underfuture uncertainty
https://doi.org/10.1073/pnas.2026127118
ENVIRONMEN
TAL
SCIENCE
SSU
STAINABILITY
SCIENCE
Dow
nloa
ded
by g
uest
on
Janu
ary
26, 2
022