Embed Size (px)
Citation preview

DECISION SUPPORT FOR DESIGN, IMPLEMENTATION, AND FEASIBILITY OF AN ADMISSION LOUNGE
Author: Wouter Veneklaas

i

ii
Author
Ir. Wouter Veneklaas
Educational institution
University of Twente
Faculty of Behavioural Management and Social Sciences
Department of Industrial Engineering and Business Information Systems
Centre for Healthcare Operations Improvement and Research
Educational program
Industrial Engineering and Management, Operations Management in Healthcare
Host organisation
ChipSoft BV
Orlyplein 10
1043 DP Amsterdam
PH. (020) 493 9000
Master Thesis
Decision support for design, implementation, and feasibility of an Admission Lounge
Supervisory committee
Internal supervisors
University of Twente Dr. ir. A.G. Maan-Leeftink
University of Twente Prof. dr. ir. E.W. Hans
External supervisors
ChipSoft Ir. P.H.C.M. van Boekel
ChipSoft Ir. Y.A. van Dijk
Number of pages without appendices: 61
Number of pages with appendices: 78
Number of appendices: 5

iii

iv
PREFACE
Before you lies my master thesis, a document that marks the end of my time as a student at the
University of Twente. A time that lasted seven years. After trying to pursue the career of an
industrial designer for two years, I had to switch up my game five years ago. Apparently, industrial
design was not my strong suit. Coming to the realisation that industrial engineering was more up
my alley, I soon discovered that my interest belonged to the field of operations research in
healthcare. Erwin, you may not know this, but you sparked this interest right at the beginning of
my IEM bachelor’s program. And now, I have reached the moment that I finish my master’s
program in that particular field of research, partially under your supervision. The past six months
of my life have largely involved around this final part of my time as a student, and I want to thank
those who have helped me getting to where I am now. Without selling anyone short, I want to thank
several people in particular.
Gréanne, thank you for all the times you were available for giving me feedback. After our calls and
meetings I always felt motivated and focussed. Without your supervision I would not have managed
to go through this process as quick and confidently as I did. I admire your wordiness and capability
to translate the streams of consciousness I produced every now and then. Erwin, as my second
supervisor, you were not as much in the picture. However, during the last phase of this project, you
helped me a great deal with bringing my research to its essence. Both during the preparation for
my CHOIR presentation, and during the green light meeting.
Puck, I have been very lucky to have you as my supervisor at ChipSoft. During our meetings we
switched back and forth between focussed, in-depth discussions, and making the weirdest,
stupidest jokes. Yke, thank you for giving me the opportunity to do my research at ChipSoft, and
for allowing me the freedom to find a project that both ChipSoft and the university saw great
potential in. I also thank the other members of the capacity management team at ChipSoft, for the
fun times, elaborate lunches, and useful discussions. And my fellow interns, thanks for our weekly
meetings that allowed us to complain about the life of a thesis student every now and then.
Of course, I thank my family and friends for the love and support, in particular mom and dad.
Jeroen, thank you for your patience and loving support, helping me to keep calm, and reminding
me to enjoy the freedoms that the student life has to offer. I look forward to the adventures we will
be facing together, especially now that I have successfully jumped this hurdle.
Wouter
Amsterdam, July 2019

v
MANAGEMENT SUMMARY
Background Dutch hospitals are transforming the elective patient admissions process with a
new type of ward: the Admission Lounge (AL). The AL facilitates elective patient admissions for
relatively low-complex high-volume patient populations. With the AL, hospitals reduce the number
of patient admissions that take place at the Clinical Ward (CW). Thereby improving the efficacy
and efficiency of the perioperative process. In a preliminary field study we found that while many
hospitals in the Netherlands have established or are establishing the AL, there is no systematic
approach for its implementation. This raises the opportunity to improve the establishment of an
AL through systematic strategic decision support. Potentially, this could lead to improved
operational performances, better patient satisfaction, cost savings, and better care.
As the Dutch market leader in the field of hospital information systems, ChipSoft sees
opportunities to implement methods from the field of operations research and management sciences
into their hospital information system HiX. Part of their mission is to increase the efficiency and
efficacy of hospitals. ChipSoft facilitates this research project to support hospital managers in the
decision making process involved with the implementation process of an AL.
Goal and method The goal of this research is to facilitate systematic decision making regarding
design, implementation and feasibility of an AL. We aim to quantify those decisions and give
insights into the relations between the patient selection criteria, the potential bed reduction for the
CW, and the required number of AL beds.
We use the taxonomic classification of planning decisions of Hulshof et al. (2012) to propose a five
phase stepwise approach for strategic decision making. Using data visualisation we demonstrate
the effects of inclusion and exclusion criteria for the AL on the volume and complexity of the AL’s
patient population. On the basis of the attributes priority, age, ASA classification, and specialty,
patients are assigned to the AL or CW. Patients fall within a grey area when they could be assigned
to both. With literature research, we find the Erlang loss model (see e.g., De Bruin et al. (2010)) as
the most suitable model to determine the potential bed reduction for the CW. Inputs for the bed
reduction are the patient assignments to the AL or CW, and a blocking probability of 5% for the
CW. The potential bed reduction for the CW is determined for a risk pooling strategy. We assess
the AL bed requirements and performance for a set service level, using our own deterministic
model. By enumeration of the possible patient assignment rules for patients assigned to the grey
area, we give suggestions for improved efficacy and efficiency of the AL and CW.
Our proposed five phase stepwise approach and the described algorithms are integrated into a
decision support system (DSS) and we provide a mock-up design of the DSS in the HiX environment.
For validation purposes, we perform two case studies: the first to verify and validate our algorithms,
and the second to validate interpretability and use of the DSS at the strategic level.
Results The proposed stepwise approach consists of the following phases:
1. Set up inclusion and exclusion criteria for the AL
2. Determine appropriate staff, equipment, and supporting processes for the AL and CW
3. Analysis of potential bed reductions for the CW and required capacity for the AL
4. Analysis of feasibility within the facility layout
5. Optimisation: assignment of the grey area patients to the AL or CW
In the first case study we provide the inputs for Phase 1. In the second case study, the case hospital’s
representatives provide the input. The visualisation of the inclusion and exclusion criteria for the

vi
AL provides insights about the impact of the criteria for each attribute on the distribution of AL,
CW, and grey area patients. In the first case study, the patient population contains 19% AL
patients, and 12% grey area patients. In the second case study, the population contains 44% AL
patients, and 35% grey area patients. During Phase 2, hospital management derives the
appropriate staff, equipment, and supporting process in correspondence with the complexity
profiles of AL and CW patients.
In Phase 3 of the first case study, the CW can potentially reduce its capacity by 4 beds while the
AL requires 2 required beds, resulting in an overall reduction of 2 beds. For the second case study,
the CW bed reduction amounts 2 while the AL requires 3 beds, resulting in an overall increase of 1
bed. Hospital management assesses the feasibility of the AL requirements in Phase 4.
During Phase 5, we enumerate the assignment of patients of 1 specialty, 1 ASA class, and 3 age
ranges from the grey area to the AL. In both case studies, the outcomes of the enumeration indicate
potential for improved performance of the AL and CW by assigning patients from the grey area to
the AL. For the first case study, we find a solution that reduces the CW capacity by 5 beds, while
the AL requires 3 beds. For the second case study, we find a solution that reduces the CW’s capacity
by 3 beds while the AL requires 4 beds. In both case studies, the AL gets assigned a bigger patient
population. This indicates a bigger effect on the hospital’s efficiency than the solution before
enumeration. The runtime of the DSS, performing the enumeration for 12 assignment
combinations, is shorter than one minute. The results of the first case study are presented in a
mock-up design in the ChipSoft’s HiX environment.
Conclusions and recommendations The DSS facilitates systematic strategic decision making
by following the developed five phase stepwise approach. The visualisation of the results
successfully provides insights into the relations between patient selection and capacity
requirements for both the AL and CW. The optimisation method in our DSS enumerates AL
assignment rules successfully and is able to indicate a solution that is effective and efficient for
both the AL and the CW. Insights generated by the DSS are well interpretable and useful, according
to hospital management. Moreover, ChipSoft sees potential in the developed tool.
In our case studies we consider one specialty for assignment to the AL. Consideration of more
(sub)specialties or a variety of other patient selection criteria for the AL can exponentially increase
the solution space and runtime for the enumeration method. However, the current short runtime
allows enumerating relatively large solution spaces. This indicates potential for application of our
algorithms to bigger instances.
We recommend ChipSoft to relate the DSS to the tools that are currently developed for forecasting
the outflow of the operating room to the clinical wards and other hospital units, as a result of the
master surgery schedule. Our model is capable of determining the expected inflow of the AL with
a relatively simple method. This method could be refined with more accurate forecasts that are
related to the outflow of the OR as a results of the MSS. Another recommendation is to include a
field within the preoperative screening form of the anaesthesiologist which automatically indicates
whether a patient is suitable for AL admission in compliance with the patient’s characteristics.
For further research, we recommend to explain the variability of the load on the AL and CW using
discrete event simulation. We also see potential in applying a time-dependent Erlang loss model to
determine the potential bed reduction at the CW. For AL patients, arrival at the CW is prolonged,
meaning that the peak load is potentially reduced. The time-dependent loss model allows to
incorporate peak and off peak arrival rates for the CW and thereby the effect of the AL on the CW
can be explained further.

vii
CONTENTS
Preface ................................................................................................................................................. iv
Management summary ...................................................................................................................... v
List of Acronyms ............................................................................................................................. viii
Chapter 1: Introduction .................................................................................................................... 2
1.1. Context description ................................................................................................................ 2
1.2. Problem description ............................................................................................................... 3
1.3. Research objective .................................................................................................................. 5
1.4. Scope ....................................................................................................................................... 6
1.5. Research questions ................................................................................................................. 7
Chapter 2: Trade-offs and decisions for the Admission Lounge and Clinical Ward ........ 10
2.1. System description ............................................................................................................... 10
2.2. Strategic planning decisions ................................................................................................ 15
2.3. Tactical decisions ................................................................................................................. 20
2.4. Conclusions ........................................................................................................................... 21
Chapter 3: Analytical models for the AL and CW ..................................................................... 24
3.1. Job shops ............................................................................................................................... 24
3.2. Models for bed capacity management ................................................................................. 25
3.3. Erlang loss model for the CW .............................................................................................. 25
3.4. The AL’s dimensions and performance ............................................................................... 28
3.5. Case mix optimisation ......................................................................................................... 30
3.6. Conclusions ........................................................................................................................... 30
Chapter 4: Decision support solution design ............................................................................ 32
4.1. DSS methodology ................................................................................................................. 32
4.2. Data preparation .................................................................................................................. 33
4.3. Phase 1: patient mix decision support ................................................................................ 33
4.4. Phase 2: care unit partitioning decision support ............................................................... 35
4.5. Phase 3: capacity dimensioning decision support .............................................................. 35
4.6. Phase 4 and 5: feasibility and optimisation ....................................................................... 40
4.7. Conclusions ........................................................................................................................... 41
Chapter 5: Implementation and use of the DSS ........................................................................ 44
5.1. Implementation of the DSS ................................................................................................. 44
5.2. Sustainability of the DSS .................................................................................................... 47
5.3. Conclusions ........................................................................................................................... 47
Chapter 6: Case study for solution tests ..................................................................................... 50
6.1. Context description .............................................................................................................. 50
6.2. Preparation ........................................................................................................................... 50
6.3. Five phase DSS approach .................................................................................................... 51
6.4. Comments from the case hospital’s representatives .......................................................... 56
6.5. Conclusions ........................................................................................................................... 56
Chapter 7: Conclusions and recommendations ........................................................................ 58
7.1. Conclusion ............................................................................................................................ 58
7.2. Discussion and recommendations ....................................................................................... 60
7.3. Further research .................................................................................................................. 61
Bibliography ...................................................................................................................................... 63
Appendices …………………………………………………………………………………………………...67
viii
LIST OF ACRONYMS
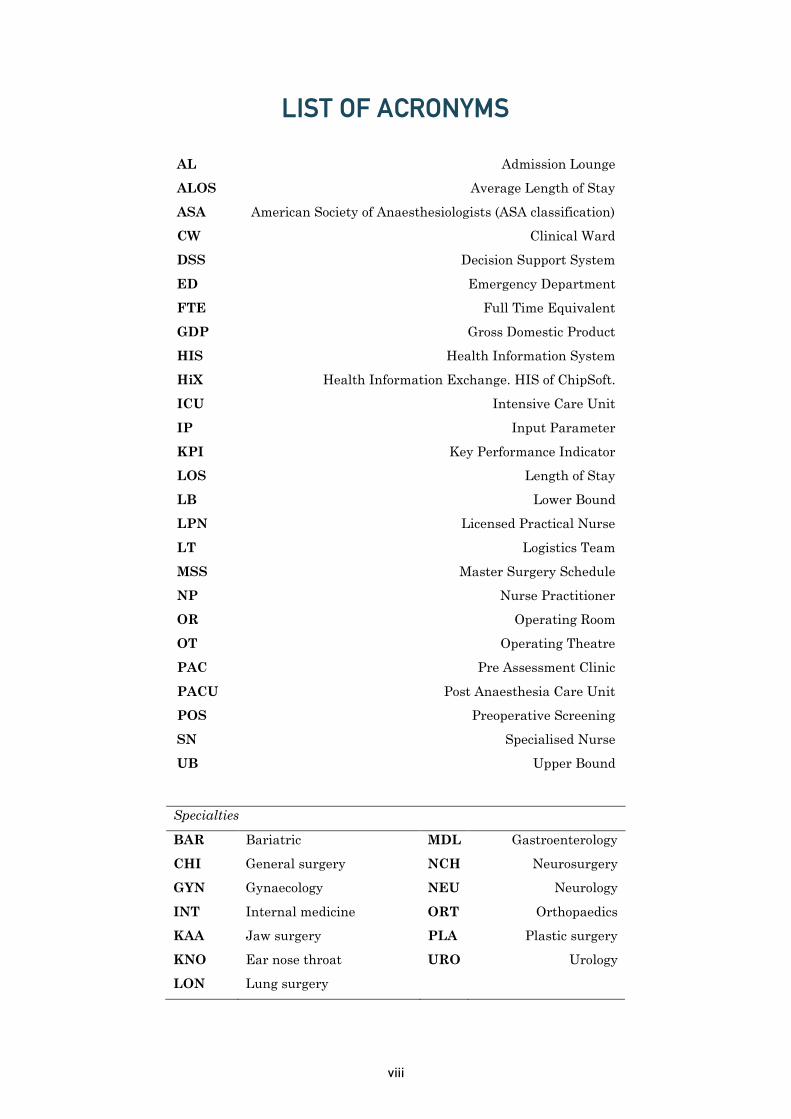
AL Admission Lounge
ALOS Average Length of Stay
ASA American Society of Anaesthesiologists (ASA classification)
CW Clinical Ward
DSS Decision Support System
ED Emergency Department
FTE Full Time Equivalent
GDP Gross Domestic Product
HIS Health Information System
HiX Health Information Exchange. HIS of ChipSoft.
ICU Intensive Care Unit
IP Input Parameter
KPI Key Performance Indicator
LOS Length of Stay
LB Lower Bound
LPN Licensed Practical Nurse
LT Logistics Team
MSS Master Surgery Schedule
NP Nurse Practitioner
OR Operating Room
OT Operating Theatre
PAC Pre Assessment Clinic
PACU Post Anaesthesia Care Unit
POS Preoperative Screening
SN Specialised Nurse
UB Upper Bound
Specialties
BAR Bariatric MDL Gastroenterology
CHI General surgery NCH Neurosurgery
GYN Gynaecology NEU Neurology
INT Internal medicine ORT Orthopaedics
KAA Jaw surgery PLA Plastic surgery
KNO Ear nose throat URO Urology
LON Lung surgery

1
2
CHAPTER 1 INTRODUCTION
Hospitals are addressing the efficacy and efficiency of the admission process with the new policy
admissions without beds which is done in a new type of ward: the Admission Lounge (AL). We
introduce a decisions order for systematic decision making in setting up the AL. This first chapter
serves as a general introduction for the rest of this thesis. Section 1.1 describes the research context.
This is followed by the problem description in Section 1.2, which is based on semi-structured
interviews with three hospitals. Section 1.3 contains the research objective for solving the core
problem and Section 1.4 sets the scope for the research. The chapter closes with Section 1.5, which
gives the research questions and a reading guide for the thesis.
1.1. Context description The pressure on healthcare systems rises as both the demand for healthcare and expenditures are
increasing (Hulshof, Kortbeek, Boucherie, Hans, & Bakker, 2012). In 2017, health and welfare costs
in the Netherlands totalled 97.5 billion euros, which was 13.3% of the Dutch GDP. Hospitals and
care institutes alike account for 28% of all Dutch health expenditures, therefore it is possible to
significantly reduce healthcare costs through increased efficacy and efficiency of their processes
(CBS, 2018).
1.1.1. ChipSoft and HiX
ChipSoft is an IT company that develops IT solutions for health institutes. ChipSoft is the Dutch
market leader in the field of Health Information Systems and Electronic Patient Records
(abbreviated HIS). ChipSoft’s innovative software supports care and facilitates the delivery of the
right care to the patient. The ambition of ChipSoft is to make care more efficient, such that care
providers optimally utilise their limited time and resources.
The main product of ChipSoft is their HIS, called HiX, which stands for health information
exchange. HiX is a comprehensive solution for a wide range of care institutes such as hospitals,
general practitioners, and pharmacies. There are three core components to HiX: the electronic
patient record, administration, and patient logistics.
Through each of the core components of HiX and other HISs, care institutes register a substantial
amount of patient data that can be utilised to make care more efficient, in particular in hospitals.
Currently, ChipSoft sees opportunities to implement methods from the operations management
and logistics field that help hospitals utilise their own data and increase efficiency and efficacy of
care (ChipSoft, 2019).
1.1.2. Admission Lounge
Within hospitals, there is a promising development termed admissions without beds. The new
approach addresses both efficacy and efficiency of care through physical separation of the
preoperative and postoperative elective patient processes and by letting elective patients spend less
time in bed before surgery. Elective patients are patients with a planned admission and surgery,
unlike emergency patients. The new admission process takes place at a new type of ward: the
Admission Lounge (AL). The process replaces elective patient admissions at the Clinical Ward

3
(CW), which also situates recovering postoperative patients. Figure 1A depicts the traditional
patient admission process. Introduction of the AL goes along with the introduction of the admission
process in Figure 1B. The lighter coloured process arrows depict steps in the process where the
patient is in an assigned bed.
Hospitals generally require patients to arrive approximately 2 hours before surgery is scheduled.
Both processes above start at the moment the patient is called from the waiting room. Figure shows
that traditional admissions take place at the CW, where, after the patient intake, a staff member
assigns a patient to a bed. The patient waits in bed until the Operating Theatre (OT) is ready for
that patient. The OT refers to the complex with the holding, Operating Rooms (ORs), and the Post
Anaesthesia Care Unit (PACU). When the OT is ready, the patient is transferred to the holding. At
the holding, the OT staff performs a last check with the patient. When the OR is ready, an OT staff
member transfers the patient to the OR where the OR staff puts the patient on the operating table.
Then the patient undergoes surgery. After surgery, the OR staff puts the patient back in bed again.
Next, the patient is transferred to the PACU to wake up from anaesthesia. Finally, the patient is
transferred to the CW, where the CW staff monitors the patient until the patient is discharged from
the hospital. Figure 1B shows that the first two process steps for AL admissions differ from those
in the traditional admission process. After intake, the patient is not assigned to a bed until shortly
before the transfer to the holding. As a result, the patient spends less time in bed and more beds
are available.
There are differences within the nomenclature of the AL, as Dutch hospitals come up with their
own name for this department themselves, such as Electieve Opname Afdeling or Nuchtere Opname
Afdeling, which translate to Elective Admission Department and Sober Admission Department,
respectively. The absence of a single nomenclature is not the only problem with the AL. While many
hospitals in the Netherlands have established, or are establishing, the AL, there is no indication
that there is one systematic approach for doing so. This raises an opportunity to improve the
establishment of an AL through systematic strategic decision support. More systematic
implementation of an AL could lead to improved operational performances, better patient
satisfaction, cost savings, and most importantly, better care.
1.2. Problem description In a preliminary field study, we conducted semi-structured interviews (see Appendix A) with three
hospitals to identify their expected effects of the AL, and their strategic decisions. Two hospitals
were about to start a pilot for the AL and the other hospital was using the AL for approximately
one year already. Each of the hospitals noted that there are three main desired effects of the AL:
- lower workload on the CW staff through separation of the preoperative and postoperative
elective patients;
- lower staffing costs through the reduction of bed reservations and separation the
aforementioned processes;
- increased patient friendliness through a more comfortable admission environment.
Patient intake at CW
Patient waits in
bed
Patient to holding
SurgeryPatient to
PACUPatient to
CW
Patient intake at AL
Patient waits at AL
Patient to holding
SurgeryPatient to
PACUPatient to
CW
Figure 1A – Traditional admission process.
Figure 1B – Admission Lounge (AL) admission process.

4
Strategic decisions in setting up the AL have an influence on whether the desired effects occur.
Hulshof et al. (2012) introduced a taxonomic classification for planning decisions in healthcare,
including inpatient care services. Hulshof et al. (2012) suggest that when the regional coverage and
service mix offered by a hospital is determined, management ideally decides on case mix selection,
care unit partitioning, capacity dimensioning, and facility layout (Figure 2). We clarify these
concepts in the context of the AL and the CW. First, case mix selection refers to the types and
volumes of patients that the AL serves (and the types of volumes of patients that are admitted via
the CW accordingly). Second, care unit partitioning refers to the decision upon the medical care
units in which the complete admission facility, so the AL and the CW, is divided. It addresses both
the creation of the AL and CW, and the question which patient groups to consolidate in either the
AL or CW. Thereby, affecting the decisions on designated staff, equipment and beds for each unit.
Third, in conjunction with care unit partitioning, capacity dimensioning decisions consider the size
of the AL and CW. The capacity is usually expressed in staffed beds, but equipment and staff are
also considered. Then lastly, the facility layout concerns the positioning of the AL and the CW,
based on which facilities should be close to each of the units.
The strategic decisions are ideally taken in the order depicted in Figure 2, but it is undeniable that
decisions on care unit partitioning and capacity dimensioning should be taken in conjunction with
each other. Furthermore, restrictions within the facility layout may lead to new insights related to
the other strategic decisions. This implies that the decision-making process may consist of several
iterations and that decisions can be taken in a different order at various stages of the process.
Figure 3 shows all possible decision orders.
We found that the reference hospitals’ order of decision making does not correspond with the ideal
order that Hulshof et al. (2012) suggest. Alternatively, these hospitals let physical characteristics
of their facility constraint the capacity dimensioning, case mix selection and care unit partitioning,
respectively; in the complete opposite order compared to Hulshof et al., (2012). That is, when
hospital management decides to set up an AL, they look for a free or rarely used area in the hospital,
preferably near the OT, to locate the AL. This decision restricts the number of beds that the AL can
situate, and thereby the capacity dimensioning decision. Following, there is a restriction on both
the number of patients due to the capacity, and the types of patients due to the location, which
means that there is a restriction on the case mix selection as well. Following from the case mix
selection and the capacity dimensioning, the hospitals determine the size and required skills of the
staff for both the AL and CW. While this line of decision making appears logical, it could lead to
multiple problems. The variability of AL and CW utilisation due to sub-optimal case mix selection,
causes sub-optimal care unit partitioning and capacity dimensioning, as a result of the restrictive
facility layout decision.
Figure 2 – Ideal strategic decision order in planning the AL and CW.
Figure 3 – All possible strategic decision orders.

5
From our preliminary field study, we conclude that resource utilisation variability could either
result in overutilisation or underutilisation of beds and staff at the AL, CW, or both. Overutilisation
of the facilities causes patient dissatisfaction and a workload that is too high. Additionally, it leads
to a bed shortage at either the AL or the CW. This bed shortage reinforces the high workload on
nursing staff. A too high workload brings along the risk of situations that are unsafe for patients,
which must be avoided as much as possible. Ultimately, the staff is prone to make more mistakes
when the workload is too high, and together with low patient satisfaction, the positive effects of the
AL might be unnoticeable.
Underutilisation of the facilities, and mainly the AL, leads to a bed surplus, meaning that too many
patient admissions take place at the CW instead of the AL. It also leads to overstaffing, because a
high nurse to patient ratio occurs. Another example of underutilisation is a staff skill imbalance
when overqualified staff treats preoperative patients. One of the incentives for the AL is a financial
advantage, which has decreased effect when management fails to utilise its resources in a balanced
manner.
One of the hospitals in our preliminary field study explained that the CW staff experienced a higher
workload after the introduction of the AL. This higher workload occurred because the nurse to
patient ratio for the CW remained the same as before the introduction of the AL, while a large
fraction of all patient admissions did not take place at the CW anymore. As a result, CW staff
treated relatively more postoperative patients, which require more care than preoperative patients.
On the other hand, for the AL the perceived workload is significantly lower, another hospital
claimed. Because preoperative patients require less care and monitoring, there are fewer care
activities for the AL staff, compared to the CW staff. The experiences described by both hospitals,
reaffirm the earlier introduced effects of overutilisation and underutilisation. This leads us to the
core problem:
There is a lack of insight into the relations between the expected performance of the
Admission Lounge and the Clinical Ward, and decisions on case mix selection,
capacity dimensioning, care unit partitioning and the facility layout.
By solving the core problem, we enable hospitals to make planning decisions in the ideal order of
Hulshof et al. (2012). As a result, hospitals can systematically decide what strategic decisions to
the desired effects related to efficacy and efficiency. In this thesis, we use the decision order
depicted by Figure 4. The proposed order respects the ideal order of Hulshof et al. (2012) but allows
for feedback loops within the decision-making process when new information becomes available
and for making decisions on care unit partitioning and capacity dimensioning in conjunction with
each other.
1.3. Research objective The objective of this research is to solve the core problem. We propose the following research
objective:
To design a decision support system for case mix selection, capacity dimensioning,
care unit partitioning and the facility layout, showing their relation with the
expected performance of the Admission Lounge and the Clinical Ward.
Figure 4 – Iterations in the ideal order for strategic decision making.

6
As mentioned in Section 1.1, hospitals register a vast amount of data that can be utilised for the
implementation of methods from the field of operations research and logistics. Decision support
systems (DSS) are common tools for complex and non-routine decisions, such as the establishment
and configuration of an AL. Historical hospital data can serve as an input for future expectations
given management decisions. We must represent the expected performances of the AL and CW with
objective Key Performance Indicators (KPIs), from which hospital managers can derive conclusions
that support their strategic decision-making process towards desired goals. While some hospitals
may decide to stick with an economic line of reasoning, others prefer decisions that are entirely
patient oriented. We want to provide insights to support decisions for both strategies. In addition
to strategic decision support, the system should be able to support tactical decisions to some extent,
making it a sustainable solution.
1.4. Scope This research concerns strategic and tactical resource capacity planning (Figure 5), as stated by
Hans, Houdenhoven, & Hulshof (2011). The decisions for the establishment of an AL are strategic,
but to maintain the desired performance, management requires tactical decision support over time.
Furthermore, the research solely focuses on elective patient admissions.
The strategic resource planning in Figure 5 shows the aspects we elaborated on in previous sections,
namely the case mix selection and capacity dimensioning. Strategic planning decisions span a time
period of 1 to 3 years and concern structural decision making. Tactical planning addresses the
organization of the operations as a result of the strategic decisions. Tactical planning distinguishes
itself from operational planning by the planning horizon. The planning horizon for tactical planning
is between the operational and strategic level, which in the case of the AL and CW, would be several
months. Tactical planning enables decisions such as temporary capacity expansions or reductions
due to seasonality effects of patient arrivals (Hans et al., 2011). This is not possible in operational
planning, as the workforce scheduling is already decided upon, and not up for adjustment.
Medical planning Resource capacity
planning Materials planning Financial planning
h
iera
rchica
l de
com
po
sitio
n
Strategic Research, development
of medical protocols
Case mix planning, capacity dimensioning,
workforce planning
Supply chain and warehouse design
Investment plans, contracting with
insurance companies
Tactical Treatment selection,
protocol selection
Block planning, staffing, admission
planning
Supplier selection, tendering
Budget and cost allocation
Offline operational
Diagnosis and planning of an individual
treatment
Appointment scheduling, workforce
scheduling
Materials purchasing, determining order sizes
DRG billing, cash flow analysis
Online operational
Triage, diagnosing emergencies and
complications
Monitoring, emergency coordination
Rush ordering, inventory replenishing
Billing complications and changes
managerial areas
Figure 5 – Scope within the framework for healthcare planning and control (Hans et al., 2011).
Elective patient admissions are planned admissions for patients that require surgery, as we
established earlier. Patients who are already admitted to the hospital and require surgery that was
not planned or scheduled in advance, sometimes termed as semi-elective, are outside of the scope
for the AL. The same counts for emergency patients. However, our model has to account for the
effect that non-elective and non-surgical patients have on the occupancy of the CW.

7
1.5. Research questions This first chapter answers the sub-questions ‘What is the core problem?’ and ‘What is the research
objective?’. The following chapters are structured towards attaining the research objective and
thereby solving the core problem, by answering the main question:
How should a decision support system that presents the relations between case mix
decisions and capacity dimensioning of the Admission Lounge and Clinical Ward
be designed?
We emphasise on the relations between case mix and capacity dimensioning decisions and leave
the concepts care unit partitioning and facility layout out of the main question. The former two
concern decisions that are mostly quantitative and inside the scope; the latter mainly concern
supporting qualitative decisions. Each chapter answers sub-questions that will lead to the answer
to the main research question. The reading guide below lists the sub-questions per chapter and
briefly describes the methodologies used per chapter.
Chapter 2: Strategic and tactical planning decisions
1. How are the admission processes regulated before and after the establishment of the AL?
2. What are the patient flows in the AL and the CW?
3. What capacity strategies are currently used for the AL and the CW?
4. What performance measures should be considered for the AL and CW?
5. What are the concrete decisions concerned with the establishment of the AL and which of
them need quantitative support?
6. What are the key trade-offs in establishing the AL?
Chapter 2 identifies what changes are required to establish an AL and makes the reader familiar
with concepts used throughout this thesis. The relevant stakeholders, processes, and patient flows
throughout the perioperative process are identified. Followed by a description of the concrete
decisions, key trade-offs, and desired performance measures for the establishment of the AL. The
chapter concludes with a structured approach for the design of an AL.
Chapter 3: Analytical models for AL and CW performance
7. What logistical system matches with the patient flows in the AL and CW?
8. What analytical models are often used in the literature to measure performance for the
identified logistical system?
9. What algorithms are appropriate to model the required capacities for the AL and the CW?
In Chapter 3, we perform literature research to describe both the underlying logistical system of
the perioperative process and the analytical models to measure the performance of the logistical
system. The chapter determines what models are most suitable for making the quantitative
decisions described in Chapter 2.
Chapter 4: Decision support solution design
10. How should the algorithms for capacity dimensioning be integrated into a DSS?
11. How can we model the case mix decision in relation to capacity dimensioning and the
performance for the AL and CW?
12. How can the DSS algorithm be verified and validated?
In Chapter 4, we apply the algorithms from Chapter 3 to hospital data from the development
database of ChipSoft. We validate the algorithms and discuss their performance. After Chapter 4
we have all the building blocks to create a mock up for the DSS in Chapter 5.

8
Chapter 5: Implementation of a DSS
13. How can the DSS be integrated into HiX?
14. How can hospital managers and end-users use and interpret the DSS in practice?
15. How can the DSS be used at the strategic and tactical planning level?
Chapter 5 describes what the DSS looks like in the environment of HiX and how the DSS is used.
We also provide insights about the use of the DSS for strategic and tactical decision making after
the AL is implemented.
Chapter 6: Case study for solution tests
16. What is the performance of the DSS at the strategic level?
Chapter 6 tests the models and DSS architecture that follow from Chapter 3, 4, and 5 for a medium
sized general hospital. We assess the performance of our models in order to give an indication of
the decision support capabilities of the systematic decision making approach and DSS.
Chapter 7: Conclusions and recommendations
Chapter 7 summarises the findings of its preceding chapters and answers the main research
question. Furthermore, we give recommendations for further research and reflect on the research
process.

9

10
CHAPTER 2 DECISIONS AND TRADE-OFFS FOR THE ADMISSION
LOUNGE AND CLINICAL WARD
This chapter describes the concrete decisions and trade-offs concerning the implementation of an
AL and works towards a structured approach for the implementation of an AL. To understand the
effects of the AL, it is necessary to know the patient flows in the perioperative process without the
AL and how those flows change when the AL is introduced. Various strategic decisions define how
the new patient flows can be supported. We provide an overview of the concrete decisions and trade-
offs that are relevant for a hospital in order to follow their strategy and achieve their goals. Section
2.1 identifies the relevant stakeholders, describes the perioperative process in detail, and
introduces concepts used in bed capacity management. Section 2.2 provides an overview of strategic
decisions concerning the establishment of an AL and Section 2.3 discusses planning tactics for the
AL. In Section 2.4, we give our conclusions and define a stepwise approach to determine the design
and feasibility of the AL.
2.1. System description This section describes the systematics surrounding the admission and discharge processes to make
the reader familiar with the majority of the concepts used throughout this thesis. First, we
introduce the relevant stakeholders. Second, we look at the perioperative process without the AL.
Third, we give the perioperative process after introducing the AL. And fourth, we introduce
concepts used in bed capacity management.
2.1.1. Stakeholders
Many stakeholders participate or have interest in the perioperative process. Below we describe the
most relevant stakeholders: patients, secretaries, clinicians, planners, the logistics team (LT), and
the hospital management.
Patients The patients within the perioperative process require surgery and want fast recovery.
Surgery can be an intimidating concept to patients, therefore the patient needs to be informed,
comforted, and treated with attention. We distinguish three types of patients: CW patients, AL
patients, and non-elective patients. CW (AL) patients are elective patients with admission at the
CW (AL). Non-elective patients are patients without an appointment. They can be divided into
emergency patients and urgent patients. Emergency patients require surgery as soon as possible;
urgent patients can wait up to a day until surgery.
Secretaries The first contact that patients have in a hospital is usually with the secretaries of
the patient’s designated department. Secretaries welcome the patient to the department and
register the patient’s arrival.
Clinicians There is a wide variety of clinicians that take part in the perioperative process. The
most relevant clinicians are specialists, nurses, anaesthesiologist, and surgeons.
Specialist – When a patient goes to an outpatient clinic they are consulted by a specialist. The
specialist indicates whether a patient requires surgery or not. If the patient requires surgery, the
specialist requests an appointment for surgery.

11
Nurses – There is a wide variety of nurses, with various degrees of competencies and
responsibilities. We distinguish three types of nurses in the order lowest degree to highest degree:
the licensed practical nurse (LPN), nurse practitioner (NP), and specialised nurse (SN)
(Patiëntenfederatie Nederland, 2019). The more skills and responsibilities a nurse has, the higher
the staffing costs are for that nurse. Compared to the SN, the LPN has a limited set of skills. This
makes the LPN the cheapest nurse to employ.
Anaesthesiologist – The anaesthesiologist determines what type of anaesthesia the patient requires
for surgery before surgery can take place. The anaesthesiologist is responsible for sedating the
patient.
Surgeon – The surgeon is the most expensive human resource involved in the perioperative process.
Surgeons are also specialists. They can be bottleneck resources due to their limited availability,
which can be a limiting factor for surgical scheduling.
Planners The patient appointment planning, scheduling, and sequencing is determined by
planners. Planners have the task to define an appointment schedule that is beneficial for the
patient and clinicians and corresponds with available capacity.
Logistics team Hospitals are employing LT personnel to handle the transportation of patients,
beds, goods, medicines, et cetera. The advantage of having an LT is that indirect care activities are
executed by non-care-givers.
Management Hospital management makes decisions on strategies and tactics in order to achieve
the hospital’s goal. Board and management practices are both strongly related to a hospital’s
performance on quality of care and operational performance and efficiency (Huckman et al., 2015).
In order to improve the performance of the perioperative process, it is important that hospital
management gives clear direction during the introduction of a new department or process, such as
the AL.
2.1.2. Perioperative process without the AL
The perioperative period is the period that starts with contemplation about the need for surgery
and ends with patient discharge. Figure 6 gives an overview of the perioperative process phases
and where each phase takes. The process overview identifies the relevant patient flows and how
the patient flows affect care unit occupancies.
Figure 6 – Perioperative process with patient flows for CW patients and non-elective patients.
The perioperative process (Figure 6) consists of five phases: indication, preoperative screening,
preparation, surgery, and recovery. These phases take place at dedicated care units. What care unit
is appropriate, depends on the patient’s urgency, and whether the patient is elective.
Indication During the indication phase, the specialist determines whether the patient requires
surgery. For CW patients, this indication is given during, for example, an outpatient clinic
appointment. The patient knows about the indication at least two weeks prior to surgery. These

12
two weeks are also a requirement for hospital planners in order to schedule the patient at a fitting
time slot in the Master Surgery Schedule (MSS). The MSS serves as a blueprint for the OT planning
and scheduling. The blueprint dictates what types of surgeries can take place in which OR and at
what moment. The blueprint can be divided into dedicated time slots that reserve time for
particular surgery specialties. Planners can assign patients to a time slot, and thereby schedule an
appointment. After the time slots are filled, planners can adjust the sequence of surgeries to attain
a preferred order. Sequencing rules have multiple effects on the operational efficiency of the OR
(Leeftink, 2017). Because the OR is an expensive resource, the MSS is often a leading factor for
elective patient planning. For non-elective patients, the indication is known shortly before the day
or time of surgery at either the CW or the Emergency Department (ED). Most hospital’s OT
schedules reserve time for non-elective surgeries for scheduling the non-elective patients on short
notice. Many hospitals have one or more emergency ORs to reduce the impact on the OR schedule
caused by the arrivals of non-elective patients (Borgman, 2017).
Screening In addition to the appointment for surgery, the CW patient receives an appointment
for preoperative screening (POS). Screening takes place at the pre assessment clinic (PAC), where
the patient receives in-depth preoperative teaching, and medical and anaesthesia consultations.
The purpose of the POS is to ensure patients are well prepared and fit for surgery and to identify
the patient’s ASA classification. The American Society of Anaesthesiologists classification system
(ASA classification) is a measure to indicate the health status of a patient. ASA classification
distinguishes six levels of the physical status of a patient:
I) healthy patient;
II) mild systematic disease without functional limitation;
III) severe systematic disease with definite functional limitation;
IV) a severe systematic disease that is a constant threat to life;
V) moribund patient unlikely to survive 24 hours with or without operation
VI) declared brain-dead patient whose organs are being removed for transplantation (Deyo,
Cherkin, Ciol, & ASA, 2014).
The decisions for the ASA classification are based on several indicators. Doyle & Garmon (2018)
explain that anaesthesiologists sometime vary significantly in ASA classification assigned to
patients, on the influence of factors such as age, anaemia, and obesity. They also note that the ASA
classification implicitly assumes that age is unrelated to physiological fitness. This is not true since,
e.g., neonatal and elderly are far more fragile in their tolerance of anaesthetics compared to young
adults. The ASA classification, and other information on health status, can help with giving an
estimate of the duration of the patient preparations before surgery; what type of nurse is required
to perform the preparations; whether complications could be expected during surgery; how long the
expected recovery period – in capacity management terms, the patient’s Length of Stay (LOS) – will
be; and what the required after care might be (Doyle & Garmon, 2018).
After the preoperative screening, the patient goes home. A few days before the day of surgery, the
patient receives the details of the appointment, regarding the starting time and location of the
admission.
Preparation The preparation phase generally starts on the day of surgery. A few days before
the day of surgery, the schedule of the OT is ready and the time of surgery is known. Our reference
hospitals explained if the surgery is at the start of an OR day, it is the first surgery that takes place
in the scheduled OR. In that case the CW patient is expected to arrive at the hospital 1.5 hours
before surgery. At other times, the CW patient is asked to arrive 2 hours before the scheduled time,
13
to ensure that the patient is ready for surgery in time. Urgent patients are located at the CW before
surgery and emergency patients go to the holding directly to start surgery as quickly as possible.
The CW patient takes place in the waiting room of the CW before the intake. When a bed is
available at the CW, the intake of the patient takes place at the CW. The patient is then placed in
bed and the CW nurse prepares the patient for surgery. Part of the preparations is a final briefing
about the surgery to inform the patient and to assess whether the patient is fit for surgery. Some
surgical procedures require additional preparations, such as injection of medication. When the OT
is ready, the patient is transferred to the holding by either a nurse or a member of the LT,
depending on the hospital’s policy. The holding serves as a sterile environment and a buffer before
the OR.
Surgery During surgery, the OR team is challenged to perform surgery with maximum efficiency
and efficacy. There is a risk at the occurrence of complications that lead to a longer recovery period,
the requirement for extra surgery, or death. The outcome of surgery determines the patients LOS;
the OR team aims to maximise the patient’s health and thereby implicitly minimise the patient’s
LOS (Collins, Daley, Henderson, & Khuri, 1999).
Recovery After surgery, the patient’s recovery starts. If the patient is in a bad condition it might
be necessary to transfer the patient to the Intensive Care Unit (ICU), which is done by a group of
clinicians. Otherwise, the patient wakes up at the Post Anaesthesia Care Unit (PACU). After
waking up, nurses or the logistics team brings the patient to the CW to recover from surgery. The
CW staff aims to comfort and treat the patient and to ensure that the patient can leave the hospital
as soon as possible, minimising the patient’s LOS. Collins et al. (1999) give five indicators for
prolonged LOS, summarising the indicators mentioned earlier in this subsection:
1. poor preoperative patient condition or health status;
2. high-complex surgery;
3. long surgery duration;
4. the occurrence of complications during surgery;
5. postoperative complications, as a result of prolonged LOS.
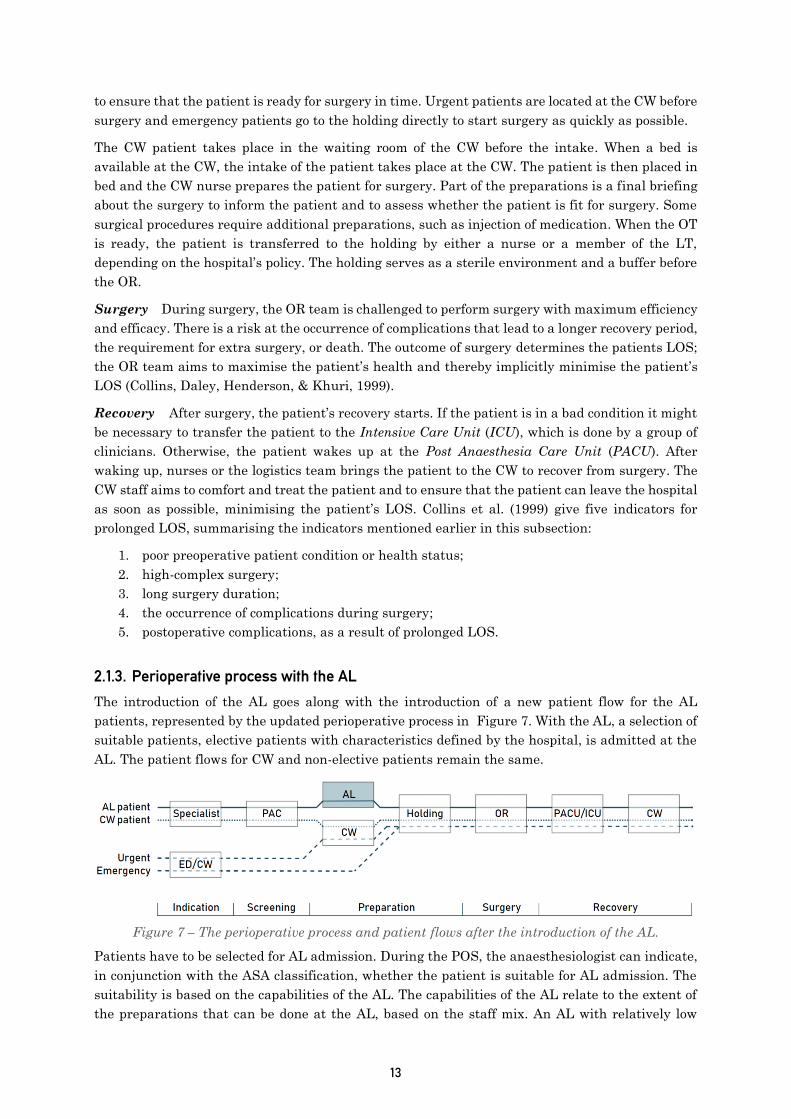
2.1.3. Perioperative process with the AL
The introduction of the AL goes along with the introduction of a new patient flow for the AL
patients, represented by the updated perioperative process in Figure 7. With the AL, a selection of
suitable patients, elective patients with characteristics defined by the hospital, is admitted at the
AL. The patient flows for CW and non-elective patients remain the same.
Figure 7 – The perioperative process and patient flows after the introduction of the AL.
Patients have to be selected for AL admission. During the POS, the anaesthesiologist can indicate,
in conjunction with the ASA classification, whether the patient is suitable for AL admission. The
suitability is based on the capabilities of the AL. The capabilities of the AL relate to the extent of
the preparations that can be done at the AL, based on the staff mix. An AL with relatively low

14
skilled staff can host low-complex patients, while a higher skilled staff could host higher-complex
patients.
Planners are able to adjust the sequence of surgeries in order to match the inflow and outflow of
the AL, OT, and CW (Steiner et al., 2016). Between the screening and the preparation phase,
planners decide whether all patients selected for AL admission can be admitted to the AL, or
whether they should be admitted to the CW due to capacity constraints. If on a given day there are
too many potential AL patients, then some of those preselected patients are appointed for CW
admission instead of AL admission, in compliance with overflow rules that management agrees
upon (Hulshof et al., 2012). Similarly to the process without the AL, patients receive an
appointment time, now along with a location that is either the AL or CW, a few days before surgery.
The admission procedure of the AL is similar to admission for the CW, except that the patient is
not placed in bed until shortly before transfer to the holding. Instead of staying in bed, the patient
can take place in an area that has a relaxing effect on the patient, except when the patient requires
preparations that need to be done at the AL. For the AL nursing staff, there is a considerable
difference compared to the CW, because there are no postoperative patients at the department. The
AL staff only has to take care of new elective admissions and therefore has no work interventions
caused by postoperative patients or non-elective admission.
The bed that the patient is placed in remains assigned to the patient during the perioperative
process. This means that when the patient is transferred to the holding, by the AL staff or the LT,
a new bed for a new admission must be available at the AL. The supply of beds has been a challenge
for the hospitals in our preliminary research because the supply of beds was the responsibility of
the AL staff, and the AL and CW were located relatively far away from each other. In one case, the
AL and CW were not even on the same floor level, meaning that beds – with and without patients
– had to be transported with an elevator. Giving the responsibility for bed transport to the LT solves
the problem partially because AL and CW staff are not participating in the indirect care activity of
bed transport, but still requires long transportation times and distances between the units. The
proximity of the AL with respect to the CW and OT is a requirement for efficient intra-hospital
transport.
After surgery, the patient does not return to the AL but is transferred to the CW. From then on,
the AL patients follow the same steps as the CW patients.
2.1.4. Concepts used in bed capacity management
Before presenting the strategic and tactical decisions for the AL and CW in the following sections,
we need to introduce some concepts used in (bed) capacity management. For capacity management
in general, the objective is to minimise costs or maximise productivity while attaining a specified
service level. In bed capacity management, the productivity is represented by bed occupancy rate
and the service level by the rejection rate (Hulshof et al., 2012). The bed occupancy rate is the
fraction of the time that a staffed bed is occupied by a patient. The rejection rate is the fraction of
patient admissions that have to be rejected due to overutilisation. When all staffed beds are
occupied, there is no room for new patient admissions and the patient must be rejected. The
probability that such a rejection occurs is called the blocking probability (De Bruin, Van Rossum,
Visser, & Koole, 2007).

15
2.2. Strategic planning decisions Strategic planning decisions involve the hospital’s mission to translate the decisions into the
design, dimensioning and the development of healthcare delivery process. Strategic planning has a
long planning horizon and is based on highly aggregated information and forecasts. The decisions
on case mix, care unit partitioning, capacity dimensioning, and facility layout, set a baseline for the
hospital’s vision and potential performance. It answers the hospital’s questions such as: “What kind
of hospital are we?”, and “What is our mission?”. The answers to these questions can be
operationalised through goals like best accessible hospital or most cost-efficient hospital. The
strategic decisions also set a scope for the downstream tactical and operational planning decisions
(Hulshof et al., 2012).
We use the iterative decision order in Figure 4 to create a systematic stepwise approach for strategic
decision making. The stepwise approach addresses the concrete decisions and trade-offs that are
relevant to the establishment of an AL. For each subsection we identify the KPIs to measure
performance and input parameters (IPs) that management must decide upon.
2.2.1. Case mix
Case mix selection refers to the types and volumes of patients that the AL serves
(and the types of volumes of patients that are admitted via the CW accordingly).
During the case mix decision, hospital management determines what types and volumes of patients
the hospital wants to serve with the AL and the CW. Traditionally, all elective patient admissions
take place at the CW, and the variety of CW units have to be strategically filled with patients to
exploit pooling effects through the patients’ LOS and service level requirements (Hulshof et al.,
2012). The AL can exploit the same effects through strategic case mix selection that ensures that
most patients that go through the AL have similar characteristics. The AL’s inclusion and exclusion
criteria below are a combination of the criteria listed by the reference hospitals of our preliminary
research. Note that the criteria can vary per type of hospital since hospitals have their own specific
service mix. Some hospitals only serve children or focus on a specific specialty such as orthopaedics
while other, general, hospitals have a broader service mix. We propose inclusion and exclusion
criteria for patient characteristics that are applicable to general hospitals.
Priority Patients that use the AL are strictly elective patients. Elective patients undergo a
preoperative screening one or two weeks prior to surgery. During the preoperative screening,
relevant information about the patient is gathered, which is required to determine whether a
patient is suitable for AL admission, i.e. admission in a facility where the preparation phase is
carried out rapidly. Without an appointment, thus without preoperative screening, there are too
many uncertainties about the patient, which makes the patient unfit for AL admission. The elective
status of a patient is registered in HiX.
Age In our reference hospitals, patients that are 18 years or older are candidates for AL
admission. Patients under the age of 18 are admitted to a children’s ward. Relatively old patients
are admitted to the CW. The selection of patients on the basis of age differs per hospital, based on
a hospital’s service mix, as we introduced in this subsection. Boundaries for the age selection can
be set accordingly. The patient’s age can be derived from the date of birth registered in HiX.
Health status During the preoperative screening, the anaesthesiologist can register the patient’s
ASA classification. Our reference hospitals use the ASA classification system as a patient selection
method for the AL. All three hospitals agree that patients with classification I and II are fit for AL
admission, one hospital also includes ASA III patients. The ASA classification is registered in HiX.

16
0%
10%
20%
30%
40%
50%
60%
70%
80%
90%
100%
Priority Age ASA Specialty Total
CW
Grey area
AL
Specialty There are specialties that contain a majority of high-complex surgeries. A patient with
a high-complex surgical procedure is likely to require a more extensive admission procedure and
preparation phase (Heuven & Rene, 2018). Incorporating high-complex patients in the AL case mix
may require staffing adjustments similar to the adjustments incurred by the health status. The
specialty that a patient is assigned to is registered in HiX with an acronym.
Figure 8 – Examples of patient selection criteria for the AL, CW, or the grey area in a “general”
hospital, created with dummy data.
The patient selection criteria discussed in this subsection are summarised by Figure 8. It presents
the decisions for inclusion and exclusion criteria for the AL and trade-offs (the grey area) per patient
characteristic and gives insight into the relation between patient complexity and volume. The
decisions in Figure 8 give bounds for the number of AL and CW patients; the lower bound (LB) is
the fraction of patients directly suitable for AL admission; the upper bound (UB) is the LB combined
with a fraction of patients that belong to the grey area. The range between the upper and lower
bound shows the impact of the complexity within the case mix on the AL’s patient volume. If that
range is large, management can make stronger decisions for some characteristics and eliminate
their grey area or our model could determine what patient groups within the grey area are
interesting for AL assignment.
Case mix decisions and trade-offs
Patient selection for the AL ideally follows the hospital’s mission, but is a trade-off between
patient complexity and volume. Patients that require high-volume low-complex surgery are the
most economical to select for AL admission, due to low staff skill requirements. Whether a
hospital does low-complex surgeries in high volumes is dependent on the hospital’s service mix.
Management may require the inclusion of patients with higher-complex surgeries to attain
higher patient volumes. The key trade-off in the patient selection is to weigh out the volume of
patients that can profit from the AL against the costs of accompanying a higher-complex patient
mix with higher-skilled staff. The LB and UB that arise from the selection criteria give an
indication of the impact of the criteria for either AL or CW admission and the trade-offs that
make patients fall within the grey area.
After the patient selection, the following KPIs are evaluated:
KPI 1 Lower bound for the average number of admissions per facility
KPI 2 Upper bound for the average number of admissions per facility
Non-elective < 18 IV & V -
- ≥ 75 III NCH
Elective ≥ 18 I & II CHI, ORT, PLA

17
2.2.2. Care unit partitioning
Care unit partitioning refers to the decisions upon the medical care units in which
the complete admission facility is divided.
The admission facility will be partitioned into the AL and the CW. Elective patients are admitted
to the AL or to the CW, in compliance with the selection criteria. Although we refer to the CW as
one unit, the CW is regularly divided into a set of specialty-specific wards. In Figure 9A this
property is shown. Usually, these wards serve a selection of specialties. As our reference hospitals
noted, a large part of the CW capacity is used for surgery-related admissions.
Figure 9B gives an exaggerated example of the distribution of capacities used for either admissions
or recovery of patients for the entire CW and specialty-specific wards. Section 2.2.1 explained the
classification of AL patients and CW patients. Figure 9C represents what portion of the capacity is
required for AL (and CW) patient admission in our graphical example. When the AL is introduced,
the physical partition shown in Figure 9D occurs.
With the care unit partitioning, management must determine how to facilitate the admissions for
the derived patient profile. The goal of this subsection is to present the requirements for serving
the patient mix and supporting the physical partitioning with appropriate types of staff, equipment,
and additional processes at the AL and CW. Eventually, our systematic approach can be used for
supporting the optimal subdivision for the variety of wards depicted in Figure 9A as well, but that
is outside of the scope of this research. For the readers with interest in an approach for optimal
department clustering, we refer to Van Essen, Van Houdenhoven, & Hurink (2015).
Staff skill mix From the case mix decision health professionals can derive what types of staff
members are required for the AL, based on the health status and the surgery complexity (Harper,
Powell, & Williams, 2010). For example, ASA II patients require an LNP, while ASA III patients
require an NP. The higher the complexity of the patient mix, the higher the staff skill requirements.
Internal transport The admission process contains several moments where transportation plays
a role. We distinguish three types of transport: of patients, empty beds, and personal belongings.
Management must decide what type of transport is executed by the staff of the dedicated care units
or by LT staff.
Figure 9 – Graphical representation of care unit partitioning.

18
Equipment It is possible to assess what patients require special equipment during the admission
process. For example, patients that are not capable of walking on their own may require a lifting
device. Whether the hospital wants to facilitate AL admission to patients that require special
equipment, is up to the management. The required equipment can be derived from the patient mix,
through assessment of the patient and surgery types covered by the patient inclusion and exclusion
criteria, but that is outside of the scope of this research.
Care unit partitioning decisions and trade-offs
The staff skill mix requirements indicate what skills should be present within the entire staff; it
does not set a minimum for one individual staff member. The staff can consist of a mix of lower
and higher skilled nurses (LNPs, RNs, and SNs), as Section 2.1.1 states. The key trade-off in
staffing is to provide good quality of care at an acceptable price; the higher the skill mix, the
more expensive the staff becomes, as is the case when the staff size increases. Regarding internal
transport, hospital management must decide whether the burden of indirect care activities is
acceptable for the nursing personnel, or whether such activities must be carried out by a
dedicated LT.
Hospital management decides upon the following IPs to quantify the staffing decisions related
to care unit partitioning:
IP 1 Staff skill division per facility
IP 2 Nurse-to-patient ratio per facility
2.2.3. Capacity dimensioning
In conjunction with care unit partitioning, capacity dimensioning decisions
consider the size of the AL and CW.
Care unit partitioning determines what type of resource is supposed to be allocated to the different
care units. Capacity dimensioning expresses in what amount these resources are allocated to the
units. The size of a care unit is generally expressed in staffed beds (Hulshof et al., 2012). A good
estimation of the required capacity is essential to address congestion; a threat for the quality of
care. Congestions could lead to the need for transfers to another hospital when all wards are
completely full; temporarily misplacement of patients at departments that are not fully capable of
treating them as required; a potential backlog at the emergency department (when a patient cannot
be admitted) or the PACU (when the patient cannot recover at the CW); postponement of elective
surgeries followed by an increased surgery waiting list because there is no room for additional
admissions; or the need to pre-discharge patients to make room for new admissions (Dobson, Lee,
& Pinker, 2010; Hulshof et al., 2012).
Beds and equipment The number of staffed beds is based on the volumes of patients the AL and
CW have to situate on a daily basis, and the LOS characteristics of various patient types. In
Chapter 3 we determine what analytical models are most suitable to determine the correct number
of beds for the AL and CW given the desired blocking probability and occupancy rate set by
management. The number of resources and amount of equipment to situate the volumes and types
of patients can be related to the number of beds (Cochran & Bharti, 2006). If a care unit contains
bottleneck resources other than staffed beds, it is relevant to estimate what amount of that resource
is satisfactory. In our preliminary research, we asked about bottleneck resources during the
admission process, but none of the hospitals could indicate any – beds aside. Equipment estimations
are therefore outside of the scope of our research and up to hospital management to decide after
the number of beds is estimated.
19
Waiting area The AL does not only consist of beds, but also of waiting places; the lounge aspect
of the admission lounge. The waiting area should be sufficiently large to accommodate AL patients
throughout the day and a certain level of comfort is desired. If the case mix includes patients that
require guidance by, for example, a partner, the waiting area must also reserve capacity for them.
Hospital management must decide on the size and comfort of the AL’s waiting room in compliance
with the determined number of beds.
Staff volume Virtually, the amount of staff required for the AL varies throughout the day, since
the staff size can be derived from the number of staffed beds and the bed occupancy is generally
not constant throughout the day. However, on a strategic level, we assume a constant staff size per
day. Section 2.2.2 states that a department can staff LPNs, RNs, SN, or a mix of those. Staff size
can be derived by multiplying the nurse-to-patient ratio set by management with the number of
staffed beds (Harper et al., 2010). Determining the size of the LT staff, to support the indirect care
activities, is outside of the scope of this research.
Capacity dimensioning decisions and trade-offs
In bed capacity management, the biggest trade-off is between bed occupancy and service level;
the subsequent chapters will elaborate on this. Hospital management must decide what the size
of the AL and the CW is going to be in terms of bed capacity. The staff volume will be derived
from the number of staffed beds using a nurse-to-patient ratio. With a lower nurse-to-patient
ratio, there are more nurses per patient, which may improve quality of care, but will increase
cost, compared to a higher nurse-to-patient ratio.
We monitor the following KPIs for the capacity dimensioning decisions:
IP 3 Desired service level per unit
KPI 3 Average rejection rate per unit
KPI 4 Average bed occupancy rate per unit
KPI 5 Average number of staffed beds per unit
2.2.4. Facility layout
The facility layout concerns the positioning of the AL and the CW, based on which
facilities should be close to each of the units.
In this subsection, we want to emphasise that some choices or restrictions within the facility layout
can have a limiting effect on all preceding decisions. Long distances increase transportation and
travel times between facilities, which lead to an increase in indirect care activities and limits
certain decision:
- Between the AL and CW leads to increased empty bed transportation time;
- Between the AL and OT increases preoperative patient transportation time;
- Between the OT and CW increases pre- and postoperative patient transportation time;
- Between the lab and the AL and CW affects the decision whether, e.g., blood tests can be
carried out during the admission process.
There is a wide range of methods to solve the facility layout problem of optimally locating all care
units and facilities within the hospital. The literature contains models that solve the facility layout
problem, in which the multitude of trips from and to facilities is minimised and penalised with the
distance travelled. We refer to Hahn & Krarup (2001) and Özcan (2009) for examples of such
models.
20
Besides the proximity to other units, it is necessary to assess whether the capacity requirements
for the AL are feasible within the facility layout. The AL will experience a high rejection rate if
there is not enough space to facilitate all AL admissions. However, this rejection rate does not result
in a rejected patient, but admission to the CW. Hospital management must decide whether to accept
this high rejection rate, or to reset the inclusion and exclusion criteria for the AL more strictly,
limiting the AL patient volume. In the latter situation the rejection rate for the AL will drop, and
the planner assigning patients to the AL or CW has to make less decisions about rejecting, or giving
access to, a potential AL patient.
Facility layout decisions and trade-offs
The key trade-offs for the facility layout is to let the facility layout restrict the preceding decisions
if needed or to rearrange existing facilities within the hospital to realise the strategy. If the
preceding strategic decisions fail to fit within the facility layout and a redesign of the layout is
unwanted, there is a need for readjustment of the decisions according to the ideal order in Figure
4. This means that the case mix should be reconsidered. The case mix can be adjusted manually,
but it is also possible to optimise the case mix. In Chapter 3 we elaborate on the case mix
optimisation algorithms.
Hospital management can set a goal for the capacity of the AL with the following IP:
IP 3 Minimum or maximum bed capacity AL
2.3. Tactical decisions After the strategic decision in which the location and capacity of the AL are fixed, there is a need
for tactical planning in order to account for variability. Strategic decisions cover averages,
maximums and minimums over the course of multiple years, while tactical decisions account for
the variability that occurs over the course of several months. More than strategic planning, tactical
planning incorporates decisions on medium-term demand. We elaborate on the tactics temporary
bed capacity changes, admission control, and staff shift scheduling, based on Hulshof et al. (2012).
2.3.1. Temporary bed capacity change
The bed capacity does not only have to be adjusted by physical reallocation of beds. It is also possible
to temporarily close beds if staff levels are reduced. Incentives for such staff level reductions can
be demand-driven due to seasonality or events, supply-driven through external staffing
restrictions, or both demand and supply-drive in the case of a flu wave. If a bed is closed, admissions
should not take place in that bed, meaning that there is a virtual capacity reduction.
2.3.2. Admission control
The MSS is an internal driver that causes variability in demand. In the MSS states what types of
patients can receive surgery at a given moment. The arrivals that result from the scheduling within
the MSS are highly variable for smaller sets of patients. Therefore, it is necessary to match demand
and supply with different tactics for a variety of situations. This means that there may be a need
for bed reservations. In bed reservations, admissions can be refused for certain patient types when
the bed census exceeds a threshold. This ensures that patients from another type can also still use
the AL if there is a sudden increase in arrivals for patients that belong to the type that exceeded
the bed census. In such cases, there is a need for overflow rules that determine where a patient
admission may take place if there is no place for them at either the AL or the CW.

21
2.3.3. Staff shift scheduling
By adjusting staff levels, hospitals can reduce care costs efficiently, as staff is an expensive
bottleneck resource. Shift scheduling refers to the adjustment of staff levels in compliance with
expected patient (type) inflow dictated by the MSS. Staff levels can be adjusted in either full time
equivalents (FTE), skill mix, or both.
2.4. Conclusions This chapter discusses the perioperative process its stakeholders and how to facilitate an effective
and efficient admission and discharge process.
System analysis We distinguish patient flows of four groups of patients around the AL and CW:
AL patients, CW patients, urgent patients and emergency patients. The AL is only affected by AL
patients, while the CW can expect patients from all four patient flows. If we compare the admission
processes of the AL and CW patients there is one main difference: the location of admission. The
AL is ideally situated close to the holding such that the logistical advantages of the AL are
exploited. We expect that the patients most suitable for AL admission are low-complex patients,
because the staffing for the AL could be relatively cheap due to a lower staff skill mix.
Stepwise approach Throughout this chapter we listed KPIs for performance measurements and
IPs for management interventions or decisions throughout the design process of the AL. We can
reduce the critical decisions and trade-offs to a structured design process, consisting of five phases.
The phases resonate with the proposed decision order in Chapter 1.
Phase 1 Set up inclusion and exclusion criteria for the AL
Inputs: Inclusion and exclusion criteria for the AL set up by a project group consisting
of, e.g., hospital managers, clinicians, and planners. The criteria are preferably in line
with the hospital strategy and depend on the hospital’s service mix.
Outputs: Visualisation of the effects of the case mix selection criteria. Patients are
categorised as AL patient, CW patient, or grey area patient.
Phase 2 Determine the appropriate staff, equipment, and supporting processes for the AL and
CW
The project group determines the required staff skill mix, an appropriate nurse-to-
patient ratio, and special equipment requirements for the AL and the CW. In this
phase, the project group can also decide upon the need of a logistics team to handle
the transport and reduce indirect care activities.
Phase 3 Analysis of potential bed reductions for the CW and required capacity for the AL
Inputs: Desired service levels for the AL and the CW.
Outputs: Chapter 3 introduces the algorithms for the performance analysis. The
performance measures are: average rejection rate and occupancy rate per unit, and
the corresponding required number of beds. Following, the inputs from Phase 2 can
be used to derive the staff size for the AL and the CW.
Phase 4 Analysis of feasibility within the facility layout
After Phase 3 the required capacities to facilitate admissions for the AL patients are
known. The project group determines whether the overall performance is acceptable
and the required capacities are feasible within the facility layout. If the required

22
capacity is not feasible because of limited space there are two options for the project
group. The first option is to stick to the set patient selection criteria and accept a high
rejection rate for the AL. The second option is to manually limit the inclusion criteria
in Phase 1.
Phase 5 Optimisation: assignment of the grey area patients to the AL or CW
To research whether the assignment from patients within the grey area results in
better performance of the AL and the CW, we give the option to optimise the grey area.
Hospital management can decide upon final inclusion and exclusion criteria for the
AL that are both effective and efficient, as well as in line with the hospital’s strategy.
Chapter 3 introduces the optimisation algorithm.
Inputs: All possible assignment combinations following from the inclusion and
exclusion criteria for the attributes age, ASA, and specialty.
Outputs: Ranked outcomes with outputs also found in Phase 3.

23

24
CHAPTER 3 ANALYTICAL MODELS FOR THE AL AND CW
The AL is a new concept hardly described by the literature and to determine its dimensions and
performance we need to research appropriate models for performance measurement. This chapter
describes all algorithms used for the quantitative decision support. We first describe the logistical
system of the admission and discharge processes in Section 3.1. Then we select appropriate
analytical models from the literature (Section 3.2) to determine the capacity requirements and the
performance for the CW (Section 3.3) and AL (Section 3.4). In Section 3.5 we discuss the case mix
optimisation method, and we close the chapter with our conclusions in Section 3.6.
3.1. Job shops The logistical system of the admission and discharge process can be related to a job shop system
with strong precedence constraints. In manufacturing, a job shop system is typically designed for
manufacturing a broad spectrum of products in relatively small quantities. The job shop is suitable
for a wide variety of processes; typically for each process on or more universal machines are
installed. Job shops are often largely process-oriented and are characterised by a functional layout.
Job shops are typically found in make-to-order environments. In a job shop, many different jobs
each have their own routing and jobs have to be sequenced on all individual work stations or a
subset of those workstations, resulting in a complex problem with a large number of possible
schedules. A primary goal, especially in make-to-order manufacturing systems, is often to meet due
dates set on the higher production job planning and resource group loading level (Zijm, 2000).
Figure 10 gives a simplified graphical representation of a job shop consisting of three machines A,
B, and C. Three different products each have to be processed by the three machines. The products
have different process flows; the solid arrow follows the production order B-C-A; the striped arrow
B-A-C; the dotted arrow C-B-A. The job shop allows the processing of various classes of products
with capacity limitations inherent to the control and handling of the products and the preparation
times of the machines. The machines of the system can perform operations on different classes of
products which involve differing setup-times, lead-times, and levels of work in progress (Barreiros,
2013). This is similar to the system of the perioperative process and other hospital processes where
each patient has to follow a given route and has to be treated at a number of different facilities
while going through the system (Pinedo, 2009).
In the job shop system, patients can undergo the complete set of activities or a subset of the
activities that are applicable to them (Leeftink, 2017). In the perioperative process, patients
Figure 10 – A job shop system with three workstations and
three products

25
undergo roughly the same activities, but at different facilities. One facility can be used for multiple
types of activities; the CW is a facility where patients can undergo multiple types of activities,
namely admission and recovery. The characteristics of patients relate to the required preparation
time (setup-times and lead times), and the patient’s LOS at the CW (work in progress). The
properties of the perioperative process correspond with the system descriptions by Barreiros (2018),
Pinedo (2009) and Zijm (2000).
Most research on job shops considers detailed scheduling, where the performance of a prespecified
set of sequencing rules on a particular job shop with a particular job mix is measured. This field of
research relies heavily on simulation studies (Graves, 1986). Models that consider the broader
issues of planning, at the strategic and tactical level, were first introduced by Jackson (1957, 1963).
Barreiros (2013) also models a job shop plant with the use of queueing techniques; a technique that
is often employed in hospitals for bed capacity dimensioning (Hulshof et al., 2012; Zijm, 2000). The
use of queueing techniques allows the estimation of the impact of changes in demand, and the
planning of the necessary steps to optimise the system response (Barreiros, 2013). These properties
are relevant for modelling the perioperative process as patient demand also fluctuates over time,
both on an hourly level as on a weekly, monthly, seasonal or a yearly level (Hulshof et al., 2012).
3.2. Models for bed capacity management Both job shops and inpatient services are often dimensioned with queueing theory, simulation, or
a combination of both, as a basis (Green, 2006; Hulshof et al., 2012). The taxonomic classification
of Hulshof et al. (2012) gives an overview of the modelling techniques used for bed capacity
management; the two most referred modelling techniques are computer simulation (29 references)
and queueing techniques (18 references). Queueing and simulation models can be useful in
identifying appropriate levels of staff, equipment, and beds.
Queueing models require little data and result in relatively simple expressions for predicting
performance measures such as mean delay or probability of waiting more than a given amount of
time before being served. They are easier and cheaper to use than simulation models, which require
substantially more data and computation time (Green, 2006). Robinson (2014) confirms that
simulation modelling is expensive because the software for simulation modelling is expensive, the
modelling process is time-consuming and the models are data hungry. However, simulation models
have the ability to cope with more variability and require fewer assumptions than queueing models
(Robinson, 2014). Due to their adaptability, interpretability, and short computation time, queueing
models are easier to implement into HiX.
We continue by researching the most suitable queueing model for our analysis. For the collection
of literature for our study, we performed a backward and forward search on the article by Hulshof
et al. (2012), looking further into queueing models. Appendix B contains the performed search
method which resulted in 30 articles for our review.
3.3. Erlang loss model for the CW
In our selection of articles, 14 out of the 30 references mention the Erlang loss model. This model
was first introduced for the assessment of queues in telecommunications and later applied to
industries and healthcare (Barreiros, 2013; Green, 2006; Jackson, 1957, 1963). There is a variety
of model formulations available; we follow the formulation of De Bruin, Bekker, van Zanten, &
Koole (2010) because it is the most cited recent article in our selection.

26
3.3.1. Model assumptions
The Erlang loss model assumes that patient arrivals are Poisson distributed. Many authors have
shown that arrival processes, especially unscheduled, can be approximated by a Poisson process
(Cochran & Bharti, 2006; De Bruin et al., 2010, 2007; Green, 2006). For practical purposes, it is not
required that the number of admissions follows the laws of a Poisson distribution exactly. The key
point for practical modelling purposes is that the variability in the number of admissions is
generally well captured by the Poisson distribution, making this a reasonable assumption for the
arrival distributions that do not follow the Poisson distribution very well. Several studies have
shown that unscheduled arrivals perform better under the Poisson distribution than scheduled
arrivals (De Bruin et al., 2010; Green & Nguyen, 2001). However, scheduled arrivals can be
modelled under the Poisson assumption as well (De Bruin et al., 2010; Gorunescu, Mcclean, &
Millard, 2002; Li, Beullens, Jones, & Tamiz, 2007), especially if the results are solely required for
strategic and tactical decision making (De Bruin et al., 2010). For decisions on the operational level,
more accurate approximations may be required (Bai, Fügener, Schoenfelder, & Brunner, 2018;
Bekker & De Bruin, 2010; Bhattacharjee & Ray, 2014). The model does not account for a time-
dependent arrival pattern, mainly for a practical purpose: simplicity. A time-dependent model may
be used for decisions on the operational level, e.g. to model weekly bed occupancy to determine the
nurse rostering.
De Bruin et al. (2010) indicate that the average length of stay (ALOS) can be highly variable, across
clinical wards. The indicator for variability used is the coefficient of variation, defined as the ratio
of the standard deviation to the mean. For a perfectly Poisson-distributed LOS, the average and
the mean are equal, so the coefficient of variation equals 1. De Bruin et al. (2010) and Green &
Nguyen (2001) found that the coefficient of variation is greater than 1 for the vast majority of wards
in their study, showing the high variability of the LOS at clinical wards. To cover this variable
characteristic, the LOS distribution can be characterised by Lorenz curves and the related Gini
coefficient. Lorenz curves are useful in identifying patients with prolonged stay and their
disproportional resource consumption. Moreover, it illustrates the difference in LOS-characteristics
between clinical wards. We note that in general, a model based on a fixed length of stay is not
capable of describing complex and dynamic inpatient flow. This would give misleading results,
termed the flaw of averages (De Bruin et al., 2010, 2007). For a more refined estimation, simulation
modelling could be considered, because it is capable to incorporate more variability.
The occupancy determined with the Erlang loss model is defined as found in operations research
and management science and differs from the definition of occupancy used in Dutch hospitals. The
Dutch national definition of occupancy is based on hospitalised days, which is an administrative
financial parameter (De Bruin et al., 2007). Under the latter definition, it is not uncommon that
occupancy rates greater than 100% occur, because multiple patients may occupy a bed per day. The
occupancy rate defined by the Erlang loss model gives better insight into the actual utilisation of
the available capacity and is therefore used in our study (De Bruin et al., 2010).
3.3.2. Model description
We describe the Erlang loss M/G/c/c model because it incorporates sufficient detail for strategic
and tactical decision making. We use the model definition by De Bruin et al. (2010). In the M/G/c/c
model patients arrive according to a Poisson process (Markovian or memoryless arrivals, denoted
by M) with parameter λ. The LOS of an arriving patient is independent and identically distributed
with expectation µ. In the queueing model formulation the LOS distribution type is denoted by G,
which stands for a general distribution. Often, the average service time is defined 1 / µ*, where µ*

27
is the service rate in the case of an exponential service time distribution (De Bruin et al., 2010). In
the case of patients, the service time distribution is estimated using the LOS distribution. The
number of operational (occupied) beds equals c. The model assumes that there is no waiting area,
which means that an arriving patient who finds complete occupancy at the CW is blocked. The
blocking probability is given by:
𝑃𝑐 =(𝜆µ)𝑐/𝑐!
∑ (𝜆µ)𝑘/𝑘!𝑐𝑘=0
(1)
This model is insensitive for the LOS-distribution and is valid for general service times. The
occupancy rate is defined as:
𝑂𝑐𝑐𝑢𝑝𝑎𝑛𝑐𝑦 𝑟𝑎𝑡𝑒 =(1 − 𝑃𝑐)𝜆 ⋅ µ
𝑐 (2)
which is equivalent to:
𝑂𝑐𝑐𝑢𝑝𝑎𝑛𝑐𝑦 =𝐴𝑣𝑒𝑟𝑎𝑔𝑒 𝑛𝑢𝑚𝑏𝑒𝑟 𝑜𝑓 𝑜𝑐𝑐𝑢𝑝𝑖𝑒𝑑 𝑏𝑒𝑑𝑠
𝑁𝑢𝑚𝑏𝑒𝑟 𝑜𝑓 𝑜𝑝𝑒𝑟𝑎𝑡𝑖𝑜𝑛𝑎𝑙 𝑏𝑒𝑑𝑠
The term λ⋅µ is often referred to as the offered load to the system. A mistake that is often made is
to set the capacity equal to the offered load, resulting in high rejection rates. With expression (1)
we are able to assess the blocking probability for a set number of beds to avoid high rejection rates.
3.3.3. Arrivals approximation for the CW
De Bruin et al. (2010) note that we need to quantify the number of patient arrivals (λ) in order to
apply the Erlang loss model and for purposed of validation later on. Hospital systems, such as HiX,
only register the number of admissions; the number of refused admissions is generally unknown.
De Bruin et al. (2010) state that it is necessary to make an educated guess about λ due to this
probable administrative flaw. To do so, they use the historical average number of occupied beds
and the number of beds that were present at a ward. ChipSoft, however, experiences that these
figures are not trustworthy in HiX due to the many workarounds made in administration. The
averages are unreliable because the registered number of opened beds in HiX is usually higher
than its realisation. Therefore, one requires insights from capacity managers within the hospital
for accurate interpretation of these figures. Moreover, the description of blocking by De Bruin et al.
(2010) – meaning that a patient does not enter the system when all beds in a ward are occupied –
does rarely occur in hospitals. Our reference hospitals confirm this. The blocking of patients usually
results in patient allocation to other units within the hospital, increased access time for the surgery.
Both are unwanted, as described in Chapter 1, but do not result in a loss of patient arrivals.
Therefore we will use the average daily arrival rate as λ in our analysis.
3.3.4. Length of stay estimation
De Bruin et al. (2010) model the LOS with a hyper exponential distribution, using the Gini
coefficient to represent the extent of variability in the LOS distribution. The M/G/c/c model,
however, only uses the ALOS as input for the LOS distribution. De Bruin et al. (2010) validated
that the assumptions for modelling the LOS distribution with the hyper exponential distribution
holds for most of the clinical wards in their case study, like the assumptions regarding the arrival
process. Figure 11 shows how the LOS at the CW can be calculated for CW and AL patients. The
LOS for CW patients (LOSCW) is measured from the start of the admission to the CW until the
discharge from the CW. The LOS for AL patients (LOSAL) starts when the AL patient arrives at the
CW for the first time.

28
Figure 11 – Determining the LOS at the CW for AL and CW patients.
Given that a CW patient only has a LOSCW,CW and an AL patients only has a LOSAL,CW – meaning
that for each patients there is one LOS estimation – the ALOS µ for a set of nAL AL patients and
nCW CW patients is given by:
𝐴𝐿𝑂𝑆 =1
𝑛𝐴𝐿∑𝐿𝑂𝑆𝐴𝐿𝑛𝐴𝐿
+1
𝑛𝐶𝑊∑𝐿𝑂𝑆𝐶𝑊𝑛𝐶𝑊
3.4. The AL’s dimensions and performance Contrary to the CW, the AL most likely does not reach a steady state; the AL is filled with patients
in the morning and is empty by the time it closes. Therefore the Erlang loss model cannot be applied
to the dimensioning of the AL. Because we can treat the AL as a another type of workstation in the
job shop system, it is possible to apply other analytical models to assess the performance of the AL.
To dimension the AL we determine the load that the AL has to process daily and relate that offered
load to a set number of beds, using basic techniques from the field of operations research and
management sciences.
3.4.1. Arrivals approximation for the AL
AL arrivals will occur according to the appointment schedule and are therefore strongly related to
the MSS. The MSS determines how much OR time is to be assigned to the variety of surgery groups
– on the highest level represented by specialties – on each weekday (Hof, Fügener, Schoenfelder, &
Brunner, 2017). Because capacity dimensioning decisions mainly focus on assigning OR time to
disciplines, resulting in the MSS (Riet et al., 2016), the MSS is leading in the arrivals
approximation for the AL.
As stated in Section 2.1.2, the MSS is often a cyclic timetable consisting of blocks assigned to
specialties or sub-specialties. Hospitals have an incentive to utilise their ORs to a maximum
because they are the most expensive components within the hospital. Accordingly, ORs experience
little down time in times of high staff availability, and the MSS often plans to the maximum
capacity of the OR.
We relate the arrivals of the AL patients to the daily total planned OR time for the specialties
within the AL case mix. The daily total planned OR time for a specialty is the total duration of
sessions within the MSS dedicated to the surgeries scheduled for a specialty. HiX registers the
session, and its duration, an admission is linked to; sessions usually last from several hours up to
eight hours. For one specialty, multiple sessions may take place on a day. To assess the arrivals on
a given day, it is relevant to link the expected arrivals to the total session duration for a specialty.

29
Per specialty, the total planned time on days that allocate time to the specialty does not change
often. So it is possible to estimate the expected arrival rate of patients from e.g., the specialty
orthopaedics on days where the dedicated OR time amounts 8 hours, if that is a common session
duration. We call days on which common amounts of OR time are allocated to a specialty
representative days and use those days as a benchmark for the AL performance assessment.
3.4.2. The AL’s required beds
Because there is no straightforward mathematical formulation to determine the patients’ LOS at
the AL, we have to use findings from our preliminary research to make assumptions on the LOS.
Using basic techniques from the field of operations research we determine the offered load of the
AL. The general consensus of our reference hospitals was to have the patient arrive at the AL two
hours prior to the scheduled start of surgery. Based on the average hourly arrivals on
representative days, we calculate the offered hourly load during working hours.
We define time buckets 𝑡 = (0,1,2,… , 𝑇) with duration 𝑑 (in minutes) in which arrivals occur at the
AL. The expected admission duration of 𝐷 is a multiple of 𝑑 and represents the time that patients
spend at the AL. The opening time of the AL is at the beginning of 𝑡 = 0, the opening time of the
OT 𝑠𝑡𝑎𝑟𝑡𝑂𝑇 ∈ 𝑇 is in time bucket 𝑡 and marks the moment that patients can leave the AL for
transfer to the holding. Figure 12 gives a graphical representation of t, d, D, and 𝑠𝑡𝑎𝑟𝑡𝑂𝑇 on a
timeline.
Figure 12 – Graphical example of time buckets t, the time bucket duration d (60 minutes), and the
admission duration D (120 minutes) on a timeline. The AL is opened from 06:00 to 17:00.
Before 𝑠𝑡𝑎𝑟𝑡𝑂𝑇 , the arrivals 𝜆𝑡 during 𝑡 = (0,1,2, … , 𝑠𝑡𝑎𝑟𝑡𝑂𝑇) remain in the AL. If the patient has
spent 𝐷
𝑑 time buckets at the AL and the OT is open (𝑠𝑡𝑎𝑟𝑡𝑂𝑇 < 𝑡), the patient leaves the AL. The
offered load on the AL 𝜌𝑡 during time bucket t on a given day is determined by:
𝜌𝑡
{
∑ 𝜆𝑡
𝑡
𝑡=0
∑ 𝜆𝑡𝑡
𝑡=𝑡−(𝐷𝑑)
, 0 ≤ 𝑡 ≤ 𝑠𝑡𝑎𝑟𝑡𝑂𝑇
, 𝑠𝑡𝑎𝑟𝑡𝑂𝑇 < 𝑡 ≤ 𝑇
The average load per time bucket 𝜌𝑡 for a set of n representative days is obtained through:
∑ 𝜌𝑡𝑛
𝑛
, ∀𝑡
Meaning that the average number of required beds to accommodate all daily AL arrivals amounts
𝑚𝑎𝑥⌈ 𝜌𝑡⌉.
We assess the performance of the AL for a set number of beds, also for 𝑚𝑎𝑥⌈ 𝜌𝑡⌉, to determine how
the AL would have performed on representative days. To do so, we compare the historical load on
the AL by patients that would be assigned to the AL based their characteristics and the AL
inclusion criteria. Whenever the load 𝜌𝑡 exceeds the set number of beds, a patient must have been
rejected. We term the percentage of the opening hours of the AL on which rejections took place, for

30
all representative days, the rejected hours rate. We can also measure the fraction of days on which
at least one rejection took place, termed the rejected days rate.
3.5. Case mix optimisation Section 2.2.1 indicates how the inclusion and exclusion criteria for the AL and CW can result in a
grey area of patient selection. We want to develop a method that helps choosing the most effective
and efficient assignments for the AL and the CW. In our literature study we did not come across
methods to optimise the case mix for the AL or comparable job shop elements.
We assign patients within the grey area to either the AL or CW by enumerating the assignment
possibilities in the grey area. The AL and CW selection criteria serve as bounds for the optimisation
method. The selection criteria for the dimensions age, specialty, and ASA can be up to discussion in
the context of a general hospital. The case mix optimisation can have two objectives: optimal use of
the AL and a maximal bed reduction for the CW.
We propose to divide the age category into subcategories, because enumerating for all ages within
the grey area is too extensive and unlikely results in significant improvements. We expect that
dividing age in categories of 5 years will suffice. The category ASA will consist of a small amount
of assignment possibilities as well, since there are only three relevant ASA classifications (I, II, III)
for the AL. If a hospital has a wide variety of specialties, or the model is refined towards sub-
specialties, the solution space may increase rapidly, by a factor of 2k, k being the number of
specialties within the grey area. This can be a problem if the model has a long runtime for small
solution spaces.
After the enumeration we compare the overall performance of the all assignment rule sets. Because
there is a wide variety of available performance indicators we apply a scoring method to assess each
configuration’s performance. Hence, we can direct DSS users towards effective and efficient
outcomes, and enable them to make comparisons relatively easy.
The scoring method weighs out efficiency and service level. Efficiency is represented by the
occupancy ratios and the required numbers of beds for the AL and the CW. Service level is
represented by the blocking probability for the CW and the hourly acceptance rate for the AL. For
the analysis we are interested in configurations that may lead to a reduction in the total number
of required beds; where the bed reduction for the CW exceeds the number of beds required for the
AL. This is an economic point of view. We use the following objective function to weigh out
effectiveness and efficiency of the solution:
𝑃𝑒𝑟𝑓𝑜𝑟𝑚𝑎𝑛𝑐𝑒 = (𝐵𝑒𝑑 𝑟𝑒𝑑𝑢𝑐𝑡𝑖𝑜𝑛 𝐶𝑊 ∗ 𝑂𝑐𝑐𝑢𝑝𝑎𝑛𝑐𝑦 𝑟𝑎𝑡𝑒 𝐶𝑊) − (𝐵𝑒𝑑𝑠 𝐴𝐿 ∗(1−𝑟𝑒𝑗𝑒𝑐𝑡𝑒𝑑 ℎ𝑜𝑢𝑟𝑠 𝑟𝑎𝑡𝑒)+𝑂𝑐𝑐𝑢𝑝𝑎𝑛𝑐𝑦 𝑟𝑎𝑡𝑒 𝐴𝐿
2).
The objective is a good overall performance. That is, effectiveness and efficiency are weighed for
both the AL and the CW. Effectiveness of the CW is measured by the blocking probability, which
indicates the service level. For the AL, effectiveness is measured by the accepted hours rate, (1 –
rejected hours rate), which serves as an indicator for the service level of the unit.
There are many ways to put a formula like this together; there is not one right answer. To make
this approach more robust we like to point out the possibility to assign weights to each component
of the ranking equation. This way, the user can emphasize on a variety of performance measures:
the effectiveness and efficiency of both units, or either for one unit.
3.6. Conclusions We summarise the findings for this chapter below.

31
Logistical system The admission and discharge process for the AL and CW resemble a job shop.
The AL and CW process patients coming from various flows. The processing time of the AL is the
time that it takes for the admission and preparation of a patient before surgery. For the CW it is
the LOS of the patients; the period starting when the patient arrives at the CW for the first time
and ending when the patient is discharged from the hospital. We found that job shops are often
analysed with queueing models or simulation modelling.
Capacity algorithms We first determined the most suitable model that determines the size and
the potential bed reduction for the CW. We select the M/G/c/c Erlang Loss model (see e.g. De
Bruin et al., (2010)) for analysis of the CW. The Erlang loss model requires little data and
computation time, and its results are easy to interpret. With the Erlang loss model we can derive
the required number of beds and the occupancy ratio for a set blocking probability. Because the
Erlang loss model assumes a Poisson arrival process we have to validate the goodness-of-fit of the
model on the data in Chapter 4. Another assumption of the Erlang loss model is that the wards
reach a steady state. The arrival and discharge moments at the CW, however, follow a clear pattern
throughout the day. The capacity required for early patient admission probably exceeds the
potential bed reduction that we will identify. Nevertheless, we expect that the model will effectively
indicate the effects of a decreased length of stay at the CW for AL patients.
Because the AL most likely does not reach a steady state, we define a deterministic model that
determines the load on the AL. The model assumes that patients stay at the AL for a fixed duration
of, e.g., 1.5 or 2 hours. This complies with reality to a certain extent, because hospitals require
patients to arrive 1.5 or 2 hours before surgery is set to start (see Chapter 1 and Appendix A). The
algorithm determines the performance of the AL by comparing a set number of beds to the load on
the AL on representative days. The KPIs for the AL’s performance are the rejected hours rate and
the rejected days rate. The former indicates the proportion of all hours on representative days on
which one or more AL admissions had to be rejected because the load exceeded the number of beds.
The latter indicates the proportion of days on which one or more AL admissions had to be rejected
because the load exceeded the set number of beds on some hour of the day.
Case mix optimisation From the patient inclusion and exclusion criteria for the AL follows
patient categorisation into AL patient, CW patients and grey area patients. The optimisation
methods assigns patients from the grey area to the AL or the CW by resetting the inclusion and
exclusion criteria for the AL. All possible combinations of attribute values within the grey area are
enumerated. With a ranking function that balances efficacy and efficiency for the AL and CW we
provide an overview of de top performing assignment combinations.

32
CHAPTER 4 DECISION SUPPORT SOLUTION DESIGN
For this chapter we use hospital data from ChipSoft’s development database to test the algorithms
of Chapter 3. We refer to this dataset as the ChipSoft development data. The development data
represents a medium sized general hospital. The data is extracted from the ChipSoft database using
an SQL query, after which it is loaded into RStudio for implementation of the algorithms. This is
common practice for ChipSoft’s R&D team for capacity management. This chapter shows how the
algorithms are integrated into the DSS and how the available information will be presented.
Section 4.1 shows the DSS methodology, which resembles stepwise approach introduced in Chapter
2 and relates it to the decision order introduced in Chapter 1. The sections following the five phases
of the stepwise approach: patient selections (4.3), staffing decisions (4.4), capacity dimensioning
(4.5), and – two phases in one section – a check for feasibility and case mix optimisation (0).
4.1. DSS methodology The DSS requires data input to present relevant outputs. We summarised the DSS methodology
drawing inspiration for the BPMN notation. Figure 13 presents this methodology, consisting of a
sequence of calculations within the DSS, in correspondence with the sequence of the decision order
in Figure 4 and the phases given in Section 2.4. The boxes with a script icon represent the steps
within the DSS, the boxes with a person icon represent decisions or inputs by the DSS users.
Figure 13 – DSS methodology overview.

33
4.2. Data preparation Data preparation requires the users of the DSS to actively think about the relevant admissions
within the scope of the project. For ChipSoft it is uncommon to actively show the data preparation
step. We think that by presenting the results of the scoping decisions in the first phase, there is
more understanding about the potential effects and impact of the project.
The data structure is defined by ChipSoft and it forms the backbone of HiX. Data extraction for our
model will be similar for all hospitals that use HiX. However, different hospitals use different
methods for data registration. This means that not all fields within the data structure are filled the
same way for every hospital. Hence, the query must always be slightly tailored to the methods of
the hospital that uses our DSS. Running the SQL query takes up 4 seconds and results in a dataset
containing 85,060 patient admissions that took place during the years 2015, 2016 and 2017.
The data covers multiple departments. Four wards that mostly situate surgical specialties are
selected, any admissions outside of these four departments are filtered out of the dataset (62,777
exclusions). We also solely select clinical patients, day care patients are hence filtered out (34,614
exclusions). Moreover, we only select admissions that took place during weekdays; any patient
admissions that took place during the weekend, are filtered out (6,656 exclusions) as well as
patients with a registered unfinished treatment (1,386 exclusions). Lastly, patients from
specialisms that represent less than 1% of the admissions in the selected wards are not considered
in the analysis (227 exclusions). Eventually, the dataset is reduced to 16,730 admissions, which
sets the scope to a coverage of approximately 20% of all admissions in the virtual hospital. The
specialties included in this analysis are:
- 25% General surgery (CHI);
- 4% Gynaecology (GYN);
- 16% Internal medicine (INT);
- 2% Ear nose throat medicine (KNO);
- 12% Lung medicine (LON);
- 6% Gastroenterology (MDL);
- 11% Neurology (NEU);
- 14% Orthopaedics (ORT);
- and 11% Urology (URO).
The data preparation step contributes to the hospital’s understanding of the model’s use because
management must consider what the relevant wards are and it helps to understand the effects
presented by the DSS later on. We show that the analysis in this chapter covers 20% of all patient
admissions, which is useful for management because it addresses the scope of the project.
4.3. Phase 1: patient mix decision support The patient mix decision support is presented in a way that resembles the example in Figure 8.
The users of the tool decide on the patient profiles of the AL and CW patients. The model determines
what proportion of patients belongs to the groups CW, grey, and AL. We supplied the model with
the inputs in Table 1, which we assign using an educated guess. The resulting figure (Figure 14)
gives an idea of the effects on the patient allocation. More information about the effects of the
patient mix becomes available when users hoover over the figure in the DSS tool (Figure 15). With
the current selection criteria, 22% of the admissions can take place in the AL, 67% have to take
place at the CW, and 11% of the admissions fall within the grey area.

34
Table 1 – AL and CW selection criteria for the
ChipSoft development dataset.
Variable AL criteria CW criteria
Priority Elective Non-elective
Adult 1 0
Age 18-75 0-17, 86-105
ASA 1,2 4, 5, 6
Specialties CHI, URO,
GYN, ORT
KNO, LON,
NEU
Figure 14 – Visualised effects of patient selection criteria in the DSS.
(ChipSoft development data, 2015-2017, n = 16,730)
Figure 15 – Additional information about the effects of the patient selection
criteria in the DSS. (ChipSoft development data, 2015-2017, n = 16,730)
From these results we can already tell that the size of the AL will be relatively small, since the
lower bound for the AL population is 19% of 16,730 patients over the course of three years, which
adds up to 3,180 patients. The upper bound of the AL population, with inclusion of the grey area,

35
amounts 5,190 patients. The attribute priority has a significant influence on the size of the AL
population, since roughly 65% of the patients is non-elective. This shows that the hospital has to
process a lot of semi-urgent patients. The grey area is the largest for the attribute age, the
attributes specialty and ASA have a relatively small grey area.
4.4. Phase 2: care unit partitioning decision support As Chapter 1 mentions, the care unit partitioning step is carried out in conjunction with capacity
dimensioning. The qualitative requirements for the equipment, staff and supporting processes are
(re)considered based on the patient selection criteria. The case mix selection criteria indicate the
care required by selected patient groups which help the users decide on the equipment and staff
skills required for the care demanded. In addition to these qualitative aspects, the staff size can be
quantified by setting a nurse-to-patient ratio for the AL and the wards of the CW. This
quantification is in line with qualitative requirements for attaining a desired service level for the
patient and a pleasant workload for the staff.
4.5. Phase 3: capacity dimensioning decision support In Chapter 1 we established that one of the incentives of the AL was to release CW beds. In the
capacity dimensioning step we first show the admission and discharge moments of patients with
and without an AL. Second, we determine the expected bed reduction for the CW. Third, we
determine the bed requirements for the AL.
When many admissions and discharges occur at the same time, the workload on CW staff can be
very high. Figure 16 shows the admission and discharge moments at the CW in the situation
without the AL (left) and a situation with the AL (right). With the AL, the moment that AL patients
arrive at the CW is postponed on the day, resulting in a better distribution of the admissions over
the course of the day, as the graph on the right shows. Moreover, the highest peak is slightly
reduced. The following subsections show what the required beds are to facilitate this positive effect.
Figure 16 – Moments when admissions (light) and discharges (dark) take place at the CW of the
fictive hospital. On the left without an AL and on the right with an AL (ChipSoft development
data, 2015-2017, n=16730).
4.5.1. CW capacity
We apply the Erlang loss model described in Chapter 3. The Erlang loss model assumes that
arrivals occur according to a Poisson process. To demonstrate that this assumption holds, we plot
the arrivals of each specialty and perform a Chi-squared goodness-of-fit test in Appendix C. The
Poisson assumption holds for 3 out of 10 specialties.

36
The Erlang loss model requires the inputs mean arrival rate 𝜆 (arrivals per day) and ALOS µ
(days). The DSS determines the required number of beds, given a chosen blocking probability, for
each speciality separately, as well as for the pooled specialties. In a hospital with multiple CW’s
the real bed requirements for the CW will lie between requirements per specialty and the pooled
requirements. Table 2 gives an overview of the bed requirements for the CW given a blocking
probability of 5% and 1% for the situation with and without the AL. Figure 17 illustrates the
blocking probability and the occupancy rate as a function of the number of beds for the individual
specialties. Figure 18 plots both lines in one plot for the pooled situation. These graphical
representation can be consulted by the users of the DSS. In the functional design, more information
becomes available when the user hoovers over the lines.
Table 2 – Required number of beds and occupancy (occ.) with a blocking
probability (Pb) of 1% and 5% (ChipSoft development data 2015-2017).
Current situation With the admission lounge
Pb = 0.05 Pb = 0.01 Pb = 0.05 Pb = 0.01
Specialty 𝜆 µ Beds Occ. Beds Occ. µ Beds Occ. Beds Occ.
CHI 5.4 4.13 28 76% 32 68% 4.02 27 76% 32 67%
GYN 1.5 2.34 7 48% 9 39% - - - - -
INT 3.5 6.09 27 77% 31 68% - - - - -
KNO 1.5 1.30 5 37% 6 31% - - - - -
LON 3.1 4.46 19 70% 23 62% - - - - -
MDL 1.9 4.06 12 62% 15 52% - - - - -
NEU 2.5 4.78 17 68% 20 60% - - - - -
ORT 3.1 3.62 16 67% 19 59% 3.47 16 65% 19 57%
URO 2.9 3.27 14 66% 17 56% 3.19 14 64% 17 55%
Pooled 21.4 4.36 99 90% 110 84% 4.17 95 90% 106 84%
We can validate that the required number of beds for a blocking probability of 5% by counting the
portion of historical days on which the peak load on the CW for the specialty CHI exceeded 28 beds
(see Appendix D). Because the load on the CW exceeded 27 for less than 5% of the days, we conclude
that 28 is a slight overestimation.
The required number of beds for the CW decreases by 4 in the pooled situation, from 99 to 95 when
the blocking probability is 5% and from 110 to 106 when the blocking probability is 1%. When all
specialties are assigned to their own wards, the required number of beds for the CW decreases by
1 (Pb = 0.05) and 0 (Pb = 0.01). We initially find this a surprisingly low result. This result can,
however, be explained by looking at the ALOS and the arrival rate. The ALOS for each specialty
reduces marginally, and since the arrival rate and ALOS are multiplied with each other in the
Erlang loss formula, the change in 𝜆µ is very slight. For the pooled situation, the ALOS also reduces
slightly. But because the pooled arrival rate is quite large, the effect on 𝜆µ is significantly greater
– resulting in quite large reductions for the CW.

37
We also see that the number of beds strongly increases when the blocking probability is reduced
from 5% to 1%, along with a decrease of the occupancy ratio. The decreasing occupancy ratio is
easily explained by the increase in the number of beds. For the specialties, the occupancy ratio
drops by 8% (for the larger specialties) or 10% (for the smaller specialties). In the pooled situation
the decrease in occupancy is less extreme: the occupancy ratio decreases by 6% in the situation
without and with the admission lounge.
Figure 17 – Blocking probability (top) and occupancy ratio (bottom)
for a set number of beds for the CW, without the AL. Calculated
with the Erlang loss model.
Figure 18 – Blocking probability (dark) and occupancy ratio
(light) for a set number of beds in the pooled situation.

38
This analysis shows that there is an added benefit if patients from the same ward are assigned to
the AL, because of the risk pooling effects. The first benefit we found is a larger bed reduction. The
pooling effects also lead to a higher occupancy ratio that it is less sensitive for changes in the
number of beds.
4.5.2. AL capacity
To decide on the number of beds for the AL, we first determine the representative days for arrivals
for the AL, followed by calculating the load on the AL on those representative days. We assess the
utilisation of the AL using two KPIs: the percentage of days and hours that all AL admissions can
be fulfilled in the AL.
The load on the AL is only assessed for representative days. A representative day is a day on which
the total OR time allocated to an AL specialty is a recurring amount of hours. We found that using
a threshold of 15% as the fraction of days that a certain amount of hours of OR time is allocated to
a specialty gives useful results for the development dataset. Table 3 shows the recurring time
allocations per specialty. For CHI we assess days on which 8, 12 and 16 hours were allocated to
CHI surgeries. The other specialties show more consistency in time allocation within the MSS; we
assess days on which and 8 hours were allocated to ORT or URO.
Table 3 – Recurring OR times allocated to AL specialties.
(ChipSoft development data, 2015-2017, n=16730).
Specialty Allocated OR
time (hours)
Days
fraction
Cumulative
days fraction
CHI 8 0.34 0.34
12 0.30 0.64
16 0.25 0.89
ORT 8 0.86 0.86
URO 8 0.64 0.64
Figure 19 shows the average hourly load on representative days with time buckets with duration
d=60 minutes, the t=0 is at 6:00 and startOT occurs at 8:00, in t=2. D=120 minutes. Meaning the AL
patients stay at the AL for 2 hours before they are transferred to the OT. The AL closes at 13:00 so
T=7. We choose 13:00 as the closing time for the AL, since the mean arrivals strongly decline after
11:00. We used time buckets of 1 hour and an admission period of two hours because smaller ranges
for both indicators results in higher variability in the load, while the results may not be more
accurate. The figure shows that 𝑚𝑎𝑥⌈ 𝜌𝑡⌉ = 2 and occurs around 11:00. The second busiest period is
at 7:00. Between 7:00 and 11:00 the load on the AL is relatively low. The peak load at 11:00 suggests
that most AL patients undergo surgery in the afternoon. The overall pattern of the load suggests
that the hospital schedules most elective surgeries for around 9:00 and 13:00, at the beginning of a
session. To balance the variability of the load on the AL, the hospital can consider spreading elective
patient surgeries across the morning more.
We determine the rejected hours rate and the rejected days rate for the AL, as well as the occupancy
rate of the AL with a set number of beds varying from 1 to 5 beds. This indicates whether the choice
for the number of AL beds based on 𝑚𝑎𝑥⌈ 𝜌𝑡⌉ = 2 is sensible. Table 4 gives an overview of the
performance indicators. We see that with 2 beds, rejections would take place at 6.5% of all hours
and 30.5% of all representative days. The occupancy rate would be 43.7%.

39
Figure 19 – Expected average hourly load on the AL
(ChipSoft development data, 2015-2017, n=16730).
The rejected days rate is higher than the rejected hours rate, because a rejection on a day could
have occurred at one hour, while the load at all other hours was lower than or equal to the set
number of beds. The rejected days rate also decreases faster than the rejected hours rate as the
number of beds increase. With 5 beds, there would not have been any rejections, as the load never
exceeds 5. This would have resulted in an occupancy rate of 50%. A higher occupancy rate goes
hand in hand with a lower acceptance rate (higher blocking probability), an effect also experienced
by the CW. We think that an appropriate number of AL beds is 2 or 3. If the hospital values
occupancy ratio greatly, the appropriate choice would be 2 beds. For a higher patient friendliness,
3 beds would be more appropriate.
Table 4 – Daily and hourly acceptance rate, and occupancy for the AL on
representative days (ChipSoft development data, 2015-2017, n=16730).
Beds Rejected hours
(%)
Rejected days
(%)
Occupancy
(%)
1 21.1 67.2 64.2
2 6.5 30.5 43.7
3 1.5 9.5 31.2
4 0.2 1.5 23.7
5 0 0 19.0
4.5.3. Decisions and trade-offs
There are several trade-offs in the capacity dimensioning decision. The main trade-off is between
service level and occupancy rate; we see this for both the CW and the AL. The service level is
represented by the blocking probability in the Erlang loss model for the CW and the rejection rates
in the deterministic model for the AL. The occupancy rate is a measure used for both units. It is up
to hospital management to decide what balance between service level and occupancy rate is desired.
We like to point out the a low occupancy rate for the AL seems more acceptable than for the CW,
since the AL starts and ends empty every day, while the CW is assumed to reach a steady state at
a certain point.

40
4.6. Phase 4 and 5: feasibility and optimisation Because the logistical aspects and the layout of the hospital are unknown, we cannot check whether
the AL would fit in the current layout. We assume that there is no need to reset the patient selection
criteria to create a smaller set of AL patients and reduce the load on the AL. On the contrary, we
try to add patients to the AL patient mix by relaxing the selection criteria and adding criteria for
the grey area to the inclusion criteria for the AL. We enumerate all possible allocations, resulting
in twelve options, as Table 5 shows.
Option 7, the option for allocating no extra patients, is denoted by an asterisk, because it is concerns
the inclusion and exclusion criteria used in the previous phases. We let the model reassess the bed
reductions for the CW and the bed requirements for the AL, and the performance of both units. The
results are compared using the goal function from Section 3.5:
𝑃𝑒𝑟𝑓𝑜𝑟𝑚𝑎𝑛𝑐𝑒 = (𝐵𝑒𝑑 𝑟𝑒𝑑𝑢𝑐𝑡𝑖𝑜𝑛 𝐶𝑊 ∗ 𝑂𝑐𝑐𝑢𝑝𝑎𝑛𝑐𝑦 𝑟𝑎𝑡𝑒 𝐶𝑊) − (𝐵𝑒𝑑𝑠 𝐴𝐿 ∗(1−𝑟𝑒𝑗𝑒𝑐𝑡𝑒𝑑 ℎ𝑜𝑢𝑟𝑠 𝑟𝑎𝑡𝑒)+𝑂𝑐𝑐𝑢𝑝𝑎𝑛𝑐𝑦 𝑟𝑎𝑡𝑒 𝐴𝐿
2).
The higher the performance score, the higher the option is ranked. For the required number of CW
beds, we look at the first number of beds that results in a blocking probability of 5% or less. For the
required number of AL beds, we look at the first number of beds that results in a rejected hours
rate of 10% or less. We allow the rejected hours rate for the AL to be higher than the blocking
probability for the CW because a rejection at the AL is less disruptive, for both the staff and the
patient, than blocking at the CW. When a patient is blocked at the AL, it is known in advance of
the admission, and the admission is scheduled at the CW. Blocking at the CW induces the need for
ad hoc decision making.
Table 5 – Options for assignment from the grey area to the AL
(ChipSoft development data, 2015-2017, n=16730).
Option ASA Age Specialty
1 III - -
2 III 76-80 -
3 III 76-85 -
4 III - GYN
5 III 76-80 GYN
6 III 76-85 GYN
7* - - -
8 - 76-80 -
9 - 76-85 -
10 - - GYN
11 - 76-80 GYN
12 - 76-85 GYN
Table 6 shows that the top ranked option is option 5, followed by option 6. Both options lead to the
largest CW bed reduction (5) and the most beds required for the AL (3). They also lead to higher
bed occupancy rates for the AL than the other configurations, while attaining the highest CW
occupancy rates. Performance wise, the top two options are the best assignment rules for the AL.
If the hospital is able to facilitate the admissions for the AL patients with the staffing decisions
made in phase 2, and if three beds in the AL is feasible within the constraints of the facility layout,
we would recommend to select AL patients according to the highest ranked option, option 5.

41
Table 6 – Top 5 ranked options for AL patient assignment
(ChipSoft development data, 2015-2017, n=16730).
Rank Option Beds CW
with AL
Reduction
CW
Occupancy
CW (%)
Beds
AL
Rejected hours
AL (%)
Occupancy AL
(%)
1 5 94 5 90.1 3 6.2 52.6
2 6 94 5 90.0 3 7.8 56.1
3 7 95 4 90.0 2 6.5 43.7
4 1 95 4 89.9 2 8.0 47.8
5 8 95 4 89.9 2 8.6 48.8
4.7. Conclusions In this section we reflect on the validation of the Erlang loss model’s assumptions and the most
important findings of each phase. The DSS methodology helped with structured performance
assessment of the many results generated.
Erlang loss model The Erlang loss model assumes that patients arrive with according to a
Poisson process. We showed that the Poisson assumption holds for 3 out of 10 specialties, which
may appear too low to accept the Erlang loss model as an appropriate model for modelling the CW.
The elective arrivals at the CW, however, occur according to a pattern that is dictated by the MSS.
Moreover, supply and demand are tightly related in the context of a hospital, especially if the
hospital has long waiting lists. As we mentioned in Chapter 3, the Erlang loss model gives quick
insights about the CW’s strategic requirements and is easy to implement, which we showed in this
chapter.
Phase 1 The visualisation of the patient selection criteria helps to gain insights about the effects
of inclusion and exclusion criteria for the AL. The size of the grey area also shows the potential of
the optimisation in Phase 5.
Phase 2 For this chapter it was not possible to set up qualitative criteria for the staff, equipment
and supporting processes, because these are decisions for the hospital to make.
Phase 3 We see an overestimation of the required number of pooled beds for the CW. It is unclear
whether the calculated bed reduction is over- or underestimated. Because peak loads on the CW
generally occur in the morning, when most admission take place, we suspect that the bed reduction
is underestimated. We suspect a larger bed reduction because our formulation of the Erlang loss
model is only able to take into account the reduced ALOS in the calculations for the bed reduction.
Because the peak load can be reduced significantly by letting a majority of the admissions take
place at the AL, we expect that the bed reduction may be higher than we quantified.
We set the opening hours of the AL between 6:00 and 13:00. The load on the AL peaks during the
beginning of the morning and by the end of the morning, indicating that most AL patients arrive
for the first surgeries of the morning shift and the first surgeries of the afternoon shift. The
occupancy ratio for the AL is, with around 50%, relatively low compared to the CW. The low
occupancy is caused by the peak loads. The peak loads also lead to a relatively high rejected hours
rate. Because blocking at the AL is less disruptive, for both the staff and the patient, than for the
CW, we accept a rejected hours rate that is higher than the blocking probability. From the
development data we conclude that the hospital can reduce their CW beds by 4 in the pooled
situation and that the AL requires 2 or 3 beds.

42
Phase 4 and 5 We compare the 12 assignment rules for the AL by enumeration of the possible
assignments for patients within the grey area. To give an indication of the most effective and
efficient configurations, we use a scoring function and present the results for the top 5
configurations. We conclude that the top 2 results are suitable for the hospital. The top 2 result in
a bed reduction of 5 CW beds and require 3 AL beds to facilitate admissions with a rejected hours
rate below 7% for the CW and a blocking probability below 5% for the CW. Both solutions are a
good choice if it is feasible to allocate 3 beds to the AL within the limits of the facility layout.

43

44
CHAPTER 5 IMPLEMENTATION AND USE OF THE DSS
5.1. Implementation of the DSS The implementation of the DSS is twofold: requirements for implementation into HiX and
implementing the DSS into the hospital’s planning methods. To give an idea of what the DSS will
look like in HiX we present mock-ups for the DSS. In the mock-ups we show how the decision
parameters can be selected and used to create the graphs and tables that can be seen in Chapter 4.
5.1.1. Mock-up design
We created a mock-up design of the DSS in HiX. The design encourages the use of the stepwise
approach for decision making; the three main tabs concern case mix selection and visualisation,
bed requirement calculations, and optimisation. Figure 20 shows the mock-up of the first tab Case
mix. All figures are created with ChipSoft development data used in Chapter 4. For a larger image,
see Appendix E.
Figure 20 - Case mix tab of the DSS mock-up for HiX.
The input fields under the header Input are for the scope of the analysis. The user can enter the
admission types (type opname), the wards (afdeling) and the start and end date of the analysis
period (periode). In the case mix tab the user can insert the patient selection criteria for the AL
(opnamelounge) and the CW (kliniek) on the attributes priority (prioriteit), adult (volwassen), age
(leeftijd), ASA classification (ASA), and specialties (specilismen). The DSS derives what attribute
values fall within the grey area (grijs gebied) and automatically fills the corresponding fields. Below
the input fields the user sees the plot for the effects of the patient selection criteria. On the right
side the DSS shows the plots for events at the CW (events kliniek) for the current situation (huidige
situatie) and the new situation (met OL). When the patient selections are completed, the user can
switch to the next tab Bedden (Figure 21).

45
The most relevant information of the bed calculations are shown in the top of the tab Bedden: the
required number of beds for the CW (below the header kliniek) and the AL (below the header
opnamelounge). The user can select a desired blocking probability (weigeringskans) for the CW. The
results for each specialty (specialisme) and the pooled situation (gepoold) are given for the situation
without the AL (zonder opnamelounge) and with the AL (met opnamelounge). The results concern
the required number of beds (bedden) and the expected occupancy ratio (bezetting). For the AL, the
DSS shows the results reported in Table 4; the rejected hours rate (uren geweigerd), rejected days
rate (dagen geweigerd) and the occupancy rate (bezetting) corresponding with a set number of beds
(bedden).
Next to the results table of the AL, the DSS shows the plot of the average load for the AL on
representative days (gemiddelde drukte opnamelounge). Beneath both results tables, the DSS
shows the plots for the CW blocking probabilities and occupancy rates as a function of the number
of beds. The graphical results are useful for visual inspection of the behaviour of the blocking
probability and occupancy ratio. We choose to show the graphical results without the AL (zonder
OL) and with the AL (met OL) in separate tabs, because an overview of all results would result in
an overload of information. Moreover, comparisons of the results are also given in the results table
above. If the users want to use our enumeration method, they can head to the tab Optimalisatie
(Figure 22)
In the Optimalisatie tab, the user can give inputs for the service levels (weigeringskans) of the AL
(opnamelounge) and CW (kliniek). For simplicity, we do not include the option to assign weights for
the goal function. By clicking on the optimisation button (optimaliseer), the user makes the DSS
enumerate all the assignment rules, as is done in Phase 5 of our five phase stepwise approach. We
present the top 5 ranked options of the enumeration in a results table. When the user selects one
of the solutions in the top 5, the tabs Case mix and Bedden are filled accordingly, showing the
results of the chosen assignment rule.
ChipSoft is working on a link between models developed in RStudio and the HiX environment. To
implement the DSS in HiX, ChipSoft can use our DSS model developed in RStudio.
Figure 21 – Bedden tab of the DSS mock-up for HiX.

46
Figure 22 – Optimalisatie tab of the DSS mock-up for HiX.
5.1.2. Hospital implementation
The DSS is designed to be used by capacity managers or hospital managers with a general
understanding of capacity management. To correctly use the DSS, the user should be able to
interpret all indicators correctly. Our stepwise approach, however, does not only consider
quantitative decisions; qualitative aspects regarding, e.g., essential staff skills and special
equipment should also be considered during AL design process. Therefore, a clinician should also
be part of the team that does the decision making. It is not up to ChipSoft to facilitate this
multidisciplinary decision making, but we do recommend that hospital management is urged to set
up a multidisciplinary team for the AL design process.
As goes for every ChipSoft implementation process, it is important that the data used in the DSS
is retrieved from the correct data field within HiX. This check is always necessary because hospitals
use different data fields to register the same type of information. Incorrect data retrieval leads to
incorrect and misleading results, which must be avoided. For the planning and scheduling of
patients, the planner should know if a to be scheduled patient has access to the AL. We recommend
ChipSoft to consider creating a field in the preoperative assessment form that automatically fills
in whether the patient must be admitted to the AL or the CW, based on the patient characteristics.
The anaesthesiologist is not bothered with filling out extra information, because the field is filled
automatically. Nevertheless, if the anaesthesiologist disagrees with the automatic assessment
there should be a possibility to change the automatic indication. If the planner sees that the patient
can be assigned to the AL, the planner can act upon that knowledge and assign the patient to the
AL if it also fits the AL’s capacity.
5.1.3. Coupling opportunities
ChipSoft is currently developing tools for capacity management for each planning level. There are
three components that our DSS could be linked to: the tactical forecasting module, the strategic
demand assessment tool, and the day-care planning module.

47
The tactical forecasting module forecasts the outflow of the OR to subsequent departments visited
by patients. This outflow is a result of the configuration of the MSS and the forecasted demand. We
suggest to forecast the inflow of the AL and the CW similarly to give a more accurate expectation
of the load on the AL within a planning horizon of 12 to 15 weeks.
The strategic demand assessment tool (Knoben, 2019) translates hospital production budgets to
required capacities. Significant changes in production could also affect the AL and its required
capacity. Consequently, coupling of our developed DSS and the strategic demand assessment tool
could lead to increased insights into the relations between production budgets and required
capacities.
This thesis does not consider the effects of the AL on the day-care department. However, the day-
care department is a hospital unit that experiences high demand from low complex high volume
patient populations. Van Boekel (2018) researched the variability of resource utilisation of the day-
care department and proposed the development of a tool for HiX. The proposed tool considers a
variety of planning and scheduling heuristics to balance resource utilisation and is almost ready
for implementation. By coupling the calculations for the load on the AL with the variability
assessments of the day-care department there the opportunity arises to define an objective that
addresses the utilisation variability of both units.
5.2. Sustainability of the DSS We want to indicate that our models are also useful after the AL is introduced to the hospital.
Therefore, we show how changing the input parameters can give additional insights. There are two
main inputs that hospital management can adjust to get insights that are useful for strategic or
tactical support. First we explain the use of adjusting the period for the data analysis. And then we
make some notes on adjusting the inclusion and exclusion criteria manually.
By adjusting the period for the data analysis, the user can compare how AL performs during various
periods. Hospital demand and supply is affected by seasonality, such as the reduction weeks during
the summer period. During these weeks, the demand and supply are generally lower than during
the rest of the year and therefore the occupancy ratio of the AL could be too low to keep all AL beds
opened. If that is the case, the hospital can decide to close some beds, which we termed temporary
bed capacity change (Section 2.3.1). We do note that the risk of selecting smaller time periods is
that there is a higher variability in the data and that this could lead to less accurate results.
DSS users can assess the inflow of smaller patient groups, e.g. from one specialty, by only selecting
that group for analysis in the model. In combination with selection of the periods, hospital can
identify the inflow patterns of typical sets of patients during a chosen period or season. Generally,
hospital management can foresee several patterns over the year, such as an increase in broken hips
during the winter that leads to an increase of non-elective surgeries for the specialty orthopaedics.
By adjusting the periods for analysis, and isolating particular specialties, users can assess whether
the inflow of a certain patient group may become so high that the need for admission control
(Section 2.3.2) arises.
5.3. Conclusions This chapter shows the mock-up design of the DSS in the HiX environment of ChipSoft. In the top
of the screen, the user gives inputs for the data preparation, regarding relevant wards for the
analysis and the period of the data collection. Below those inputs, we placed the core of the DSS,
which can be divided into three tabs. We describe DSS tabs, called case mix, bedden, and
48
optimalisatie. Furthermore, we indicate the functionalities of the DSS after establishment of the
AL.
Tab 1 The first tab is used for Phase 1 and 2 of our stepwise approach. The user can enter the
inclusion criteria for the AL and the CW, and the model determines what patients belong to the
grey area. The DSS shows the visualisation of the patient selection effects and the effects on the
admission and discharge moments at the CW.
Tab 2 In the second tab we give all the outputs required for the decision support in Phase 3. On
the left side of the screen, the user can select a blocking probability to their liking in the assessment
of bed reductions for the CW. Below the results table for the CW we show the relevant plots for the
blocking probability and occupancy ratio as the result of the number of beds. The user can switch
between tabs to show the plots for the situation without and with the AL. On the right side of the
screen, we show the results table for the AL’s service level and occupancy, together with the plot
for the load on the AL.
Tab 3 The third tab can be used for the enumeration in Phase 5 of the five phase stepwise
approach. The user can give inputs for the desired service levels of the AL and the CW. For
simplicity, we do not include the option to assign weights for the goal function. The DSS presents
the top 5 results of the enumeration in a table. After selecting a configuration of interest, the user
can switch to tab 1 and tab 2 to see the detailed performance.
Sustainability The user selects periods for analysis in the input field at the top of the DSS.
Selection of a typical period, for example during a period with a historically high demand, can give
insights about the expected performance of the AL and CW during an expected increase in demand.
Furthermore, the user can select a patient group of interest, to assess how that specific patient
groups affects the performance of the AL and the CW.

49

50
CHAPTER 6 CASE STUDY FOR SOLUTION TESTS
In this chapter we conduct a case study with a regional hospital. What is different from Chapter 4
is that the case hospital can give inputs during the five phases, opposed to the educated guesses we
made earlier. We can also assess whether the generated results for the DSS are interpretable and
useful for making management decisions. This chapter is arranged as follows. Section 6.1 gives a
short description of the case hospital. In Section 6.2, we explain the steps and effects of the data
preparation. This is followed by use of the DSS methodology in Section 6.3. Section 6.4 gives some
additional insights from the management of the case hospital. In Section 6.5 we draw conclusions
from the case study and compare the results found in this chapter to the results in Chapter 4.
6.1. Context description For the case study, we spoke with two health managers of the hospital, who are also involved with
capacity management. The hospital uses one ward to situate all surgical specialties. This is a useful
feature for validation of the outcomes, since the pooled bed capacities then reflect the capacity of
the CW of interest.
The hospital is certain that there is a need for an AL, the main reason being the decrease of work
interventions at the CW caused by new admissions during peak hours. The hospital already uses a
separate room at the ward for the admissions in the morning, but this room can also be used as an
overflow room for the CW. The CW is situated one floor beneath the OT. Management is unsure
about the required number of AL beds, but expects that they will need three or four beds. Because
the hospital is planning an expansion in the next year, there is not yet an indication for the
potential location of the AL.
6.2. Preparation We analyse the admissions that took place during the years 2015, 2016, and 2017 and apply the
same data preparations as we did in Chapter 4. For the data preparation we select admissions of
clinical patients, during weekdays, from one ward. This one ward is the destination for all adult,
elective, surgical patients. Irregularities are removed from the dataset by applying a threshold of
0.5% of all admissions per specialty. This leaves us with seven surgical specialties in the dataset:
- Bariatric (BAR)
- General surgery (CHI)
- Jaw surgery (KAA)
- Neuro-surgery (NCH)
- Orthopaedics (ORT)
- Plastic surgery (PLA)
- Urology (URO)
From all 101900 admissions in the hospital, 7565 remain up for analysis. This makes the scope of
the study relatively small (7.5% of all the hospital’s admissions).

51
6.3. Five phase DSS approach We apply the DSS methodology (Figure 13) to the case hospital. We recite the five phases as a
reminder:
1. Set up inclusion and exclusion criteria for the AL
2. Determine the appropriate staff, equipment, and supporting processes for the AL and CW
3. Analysis of potential bed reductions for the CW and required capacity for the AL
4. Analysis of feasibility within the facility layout
5. Optimisation: assignment of the grey area patients
6.3.1. Phase 1
The case hospital indicates that patients that are allowed access to the AL are elective patients,
aged between 18 and 75, with ASA classification I or II, and from every specialty of the surgical
ward, except BAR patients. BAR patients are generally overweight and diabetic, meaning that
special equipment is required during the admission process. Because the hospital is interested in
the difference in performance of the AL with or without the BAR patients, the specialty is assigned
to the grey area. Other inclusion and exclusion criteria can be seen in Table 7.
Table 7 – Patient inclusion and exclusion criteria for the AL, set up with the case hospital.
Category Status Age ASA Specialties
CW Non-elective ≥ 86 IV, V -
Grey - 76-85 III BAR
AL Elective 18-75 I, II CHI, KAA,
NCH, ORT,
PLA, URO
The patient mix decisions classifies the patients into 44% AL patients, 35% grey are patients, and
23% CW patients. Figure 23 shows that only adult patients are admitted to the ward, and that a
small portion of the patients is non-elective. The attribute ASA has the largest grey area. With a
large portion of patients in the grey area, there is a lot of room for optimisation in Phase 5. The
lower bound for the number of AL patients is 44% and the upper bound is 77%.
Figure 23 – Distribution of the patient mix as a result of the inclusion and
exclusion criteria for the AL. (Case hospital data, 2015-2017, n=7565).

52
6.3.2. Phase 2
Phase 2 focusses on the selection of the appropriate staff, equipment and supporting processes for
the AL. The hospital does not employ LPNs (the nurse type with the least qualifications), which
indicates that practically all their available staff is qualified to admit higher-complex patients with,
e.g., an ASA III classification. Clinicians indicated that an appropriate nurse-to-patient ratio for
the admission process is 2 to 1 if the admissions have to take place over a short period of time. With
a lower nurse-to-patient ratio the nurse has to hurry. In that case, the workload becomes too high,
and the patient friendliness decreases.
The hospital has special equipment (larger beds and heavier mattresses) and facilities (wider doors
and standing toilets) for the BAR patients. For the other patients, there is no indication of special
requirements. We shortly discussed the transportation of patients from the AL to the holding. The
current practice is that a nurse brings the patient to the holding. Because the CW is one floor level
beneath the OT, the nurse has to use an elevator to transfer the patient to the holding. Sometimes
the use of the elevator can be time consuming. The case hospital is not yet thinking about an
logistics team for the transportation of patients. This might be reconsidered when the plans for the
hospital’s expansion are more concrete and the need for a logistics team arises.
6.3.3. Phase 3
In Phase 3, we first look at the plot of the admission and discharge moments at the CW, with and
without the AL (Figure 24). The case hospital experiences a prominent peak load on the CW in the
morning, caused by new patient admission. After the introduction of the AL, that peak load can be
strongly reduced and the admission of patients are spread more evenly across the day.
Figure 24 – Admission and discharge moments at the CW, with and without the AL.
(Case hospital data, 2015-2017, n=7565).
Next we dimension the CW without and with the AL. Table 8 shows that the CW can reduce the
required number of beds by 2 for a blocking probability of 5% and 1% in the pooled situation. The
case hospital noted that a pooled capacity of 37 beds could be an accurate estimation for the
assessed period. Because all surgical specialties are situated in one CW, it makes little sense to
compare the results for the individual specialties. However, it is relevant to note that the individual
specialties show the same behaviour as seen in Chapter 4: the occupancy rates are relatively low,
and drop around 8% to 10% for the larger specialties when the lower blocking probability of 1% is
selected instead of 5%.

53
Table 8 – Inputs for the Erlang loss models and the corresponding required beds and
corresponding occupancy (occ.) ratios (Case hospital data, 2015-2017, n=7565).
Current situation With the admission lounge
Pb = 0.05 Pb = 0.01 Pb = 0.05 Pb = 0.01
Specialty 𝜆 µ Beds Occ. Beds Occ. µ Beds Occ. Beds Occ.
BAR 1.38 1.87 6 42% 8 32% - - - - -
CHI 3.36 4.57 21 70% 25 61% 4.47 20 72% 24 62%
KAA 0.07 1.19 2 4% 2 4% 1.03 2 4% 2 4%
NCH 0.29 1.17 2 16% 3 11% 1.09 2 15% 3 10%
ORT 1.97 3.03 10 57% 13 46% 2.94 10 56% 12 48%
PLA 1.66 2.14 7 49% 9 39% 1.92 7 44% 9 35%
URO 1.12 2.21 6 40% 7 35% 2.14 6 39% 7 34%
Pooled 9.86 3.17 37 80% 43 72% 3.08 35 80% 41 71%
We also plot the blocking probability and occupancy ratio (Figure 25 an Figure 26) as a function of
the number of CW beds. The plots are available for the situation without the AL (given in this
thesis) and with the AL. The curves show the same behaviour for both situations, except with a
quicker convergence for the situation without the AL. The case hospital states that the additional
information given by hoovering over the lines is a helpful extension of the plots , because it increases
the readability of the plots. This is possible in the functional mock-up.
Figure 25 – Curves for the blocking probability (top) and occupancy
ratio (bottom) as a function of the number of beds for the individual
specialties, without the AL (Case hospital data, 2015-2017, n=7565).

54
Figure 26 – Blocking probability (dark) and occupancy ratio
(light) as a function of the number beds calculated with the
Erlang loss model (Case hospital data, 2015-2017, n=7565).
With the current patient selection criteria, the performance of the AL will be as shown in Table 9
(on representative days), with opening hours from 6:30 to 11:00. With the current criteria we would
recommend to open the AL with three or four beds. When the hospitals chooses to assign four beds
to the AL, they may have to close beds during periods with lower demand, because the expected
occupancy ratio of 41 percent is relatively low. With three beds, the occupancy ratio is over 10%
higher (51.8%), and the rejected hours rate increases by only 2.2%.
Table 9 – Performance of the AL in the case hospital calculated with
our deterministic model (Case hospital data, 2015-2017, n=7565).
Beds Rejected hours
(%)
Rejected days
(%)
Occupancy
(%)
1 25.1 71.4 82.9
2 12.3 41.9 65.5
3 5.1 20.4 51.8
4 2.9 8.1 41.4
5 0.4 2.1 33.9
6 0 0.2 28.4
7 0 0 24.3
Table 9 shows that the occupancy ratio is relatively low for a relatively high rejection rate,
compared to the performance of the CW. This can be explained by the peak load on the AL early in
the morning, seen in Figure 27. After 8:00, the load on the AL quickly decreases, which is a result
of the planning and scheduling methods of the case hospital. AL patients are scheduled early in the
morning and arrive accordingly.

55
Figure 27 – Expected hourly load on the AL
(Case hospital data, 2015-2017, n=7565).
6.3.4. Phase 4 and 5
The hospital is planning on an expansion in the next year, as we mentioned earlier in this chapter.
It is still unclear where the AL will be situated, and therefore there are no limits to the maximal
size of the AL for our analysis. We enumerate the patient selection criteria to find improvements
on our current solution.
Together with the initial case mix selection there are 12 selection options to assess (Table 10),
similar to the optimisation in Section 0. We use the goal function introduced in Section 3.5 to
determine the top 5 performing configurations. We do not apply weights to the goal function to
search for a more economical or patient friendly outcome. Due to time constraints we did not have
time to assess these outcomes with our case hospital.
Table 10 – Patient assignment options for the AL, 7
being the assignment rules used in the previous phases.
Option ASA Age Specialty
1 III - -
2 III 76-80 -
3 III 76-85 -
4 III - BAR
5 III 76-80 BAR
6 III 76-85 BAR
7* - - -
8 - 76-80 -
9 - 76-85 -
10 - - BAR
11 - 76-80 BAR
12 - 76-85 BAR
The goal function (see section 3.5) highlights the top 5 performing assignment options: 1, 2, 4, 6,
and 12 respectively. The number of CW beds is the number of beds that corresponds with a blocking
probability of 5%. The number of AL beds is the number of beds that first leads to a rejected hours

56
rate less than 10%. The option we examined in the previous phases, option 7, is not part of the top
5 performing assignment rules. The top 3 consists of similar results. Option 1, the best performing
configuration, has the lowest patient complexity profile, lowest rejection rate, and the lowest
occupancy rate for the AL. It is noteworthy that option 6, ranked fourth, causes the largest bed
reduction for the CW, with a reduction of 3 beds. The CW bed reduction goes along with 4 required
beds for the AL. The higher number of beds also comes at the price of the second lowest occupancy
ratio for the AL. Given the nurse to patient ratio of 2:1 (see Section 6.3.2), we think that option 4
could have the most potential and impact in the hospital. If inclusion of BAR patients is not wanted,
we recommend using option 1.
Table 11 – Top 5 performing assignment options for the AL’s patient assignment enumeration
(Case hospital data, 2015-2017, n=7565).
Rank Option Beds CW
with AL
Reduction
CW
Occupancy
CW (%)
Beds
AL
Rejected hours
AL (%)
Occupancy AL
(%)
1 1 35 2 79.6 3 6.9 56.0
2 2 35 2 79.3 3 9.1 59.8
3 4 35 2 79.3 3 9.7 60.1
4 6 34 3 80.1 4 7.5 56.2
5 12 35 2 79.8 3 7.9 57.0
6.4. Comments from the case hospital’s representatives The case hospital states that the findings from this study are useful and easy to interpret for a
manager that is familiar with capacity management. Because the hospital is relatively small, and
the surgical specialties are situated at a single CW, it is relatively easy to come to the same results
of four beds by experience. More so, the number of AL beds that we come up with (3 or 4) is equal
to the number of beds in the current dedicated admission room of the CW.
Besides the usefulness of the results, the case hospital indicates that there is more to managing
projects like this besides offering the right set of tools. It is also important that the project is
executed by a group with focus and clear direction. We also indicated this in Section 2.1.1.
6.5. Conclusions We conducted a case study for a medium sized general hospital and requested their input during
the use of the five phase DSS approach. The hospital locates all the surgical specialties at one ward,
which makes the interpretation of the pooled capacity easier. The case hospital can reduce the
pooled CW capacity by two beds, but needs at least three AL beds to facilitate admissions with an
acceptable rejected hours rate (lower than 10%). Because the hospital is planning on an expansion
in the next year, there are no limitations by the facility layout. We use the optimisation method to
look for additional insights.
During the enumeration of 12 assignment options for the AL’s patient mix we find a top 5 consisting
of options different from the options discussed in the preceding phases. With a nurse to patient
ratio of 2:1 the hospital is comfortable with using 4 AL beds, an outcome of the fourth ranked option.
For this option, we see a decrease for the CW amounting 3 beds. The occupancy ratio for the CW is
the highest of the top 5, and the rejected hours rate and occupancy ratio are acceptable.

57
In this case study and the case study in Chapter 4 we assessed the models for medium sized general
hospitals. The main differences between this case study and the one in Chapter 4 is that the latter
performed an analysis over multiple wards and that it used other opening hours of the AL. The
AL’s opening hours were from 6:00 to 13:00 in Chapter 4, because the AL experienced a peak load
at the beginning and end of the morning. The AL’s opening hours in this chapter were from 6:00 to
11:00 because the AL would not have substantial inflow after 11:00. In both case studies we find
improved performance after enumeration of the grey area.
The managers of the case hospital were able to interpret the results of the analysis. They did
remark that it is relatively easy to estimate the AL requirements for their hospital while it is more
complex for a larger hospital with more departments and (sub)specialties.

58
CHAPTER 7 CONCLUSIONS AND RECOMMENDATIONS
In this last chapter we answer the main question (Section 7.1). We give our points of discussion and
recommendations in Section 7.2. Further research suggestions close the chapter in Section 7.3.
7.1. Conclusion The previous chapters have contributed to finding the answer to the main question introduced in
Chapter 1: “How should a decision support system that presents the relations between case mix
decisions and capacity dimensioning of the Admission Lounge and Clinical Ward be designed?”. We
start this section by giving an answer to the main question and we indicate the theoretical and
practical value of our findings.
7.1.1. Findings
We identified that the AL can have an added benefit because of three reasons: reduced staffing
costs, increased logistical efficiency, and increased patient friendliness. These benefits should be
exploited as much as possible. We designed a stepwise approach for structured decision making,
supported by a DSS. The DSS shows the potential performance of both the AL and the CW as a
result of the inputs of the decision makers. The models use historical data to estimate the
performance. Our approach covers five phases:
Phase 1 Set up inclusion and exclusion criteria for the AL
Phase 2 Determine appropriate staff, equipment, and supporting processes for the AL and CW
Phase 3 Analysis of potential bed reductions for the CW and required capacity for the AL
Phase 4 Analysis of feasibility within the facility layout
Phase 5 Optimisation: assignment of the grey area patients to the AL or CW
In Phase 1, we present the relation between the case mix selection criteria and the expected patient
volumes for the AL. The case mix selection criteria are based on the attributes elective status, age,
ASA classification, and specialty. Inclusion and exclusion criteria determine whether patients are
assigned to the AL or the CW. Patients that can be assigned to both, fall within the grey area for
patient selection. In Phase 2, management determines the qualitative requirements to facilitate
admissions for the patients in the AL selection.
We assumed that the CW reaches a steady state and patients arrive according to a Poisson process.
Therefore, the M/G/c/c Erlang loss model was found appropriate for modelling the required
number of beds for the CW. In Phase 3, patient admissions are evaluated during weekdays, because
patient arrival intensity generally drops during the weekend. We compared the number of beds for
a blocking probability of 5% to the peak load on weekdays to validate the outcome of the Erlang
loss model. We concluded that the Erlang loss model overestimates the required number of CW
beds by 1 bed for the specialty CHI and therefore assumed that the model gives an accurate
estimation of the bed requirements.
In Phase 3 we also model the capacity for the AL as a function of the opening hours of the AL, the
arrivals during those opening hours, and the expected admission duration. Arrivals for the AL were
assessed for days on which the MSS allocates a common amount of OR time to specialties that have
59
access to the AL, termed representative days. Using the rejected hours rate, we assessed the
fraction of hours in which the load on the AL exceeded a set number of beds. We found a rejected
hours rate of 10% as an appropriate service level for the AL. This rejection rate is found acceptable
since the AL experiences peak loads that are a result of the morning and/or afternoon starting times
of the OT. Slight decreases of the rejected hours rate lead to a disproportional drop of the occupancy
rate for the AL. In both case studies (Chapter 4 and 6) we found that 50% is an acceptable occupancy
rate for the AL, because the AL experiences peak loads and does not reach a steady state.
After management uses the model to determine the required capacities for their selection criteria,
they determine whether the requirements for the AL and CW are feasible within their facility
layout in Phase 4. In Phase 5, management can optimise the grey area for patient assignments to
the AL. The DSS enumerates all possible combinations of assignments of patients in the grey area
to the AL. The attributes age, specialty, and ASA classification each contained a grey area. In both
case studies, we could assess 12 assignment combinations. With a goal function that weighs out the
efficiency and efficacy of both the AL and the CW, we selected the top 5 assignment rules. In both
cases we found assignment rules for the AL that outperformed the initial assignment rules
determined in Phase 1. The new assignments lead to better utilisation of the AL and a significant
bed reduction for the CW. In the first case study we find that the bed reduction for the CW exceeds
the required number of AL beds. In the second case study, the hospital overall requires an
additional bed to accommodate the AL admissions.
We made a mock-up of the DSS in the environment of HiX, ChipSoft’s hospital information system.
The mock-up can be seen in Figure 20, Figure 21, and Figure 22. Management of the case study
hospital indicated that the tool is easily interpretable for a capacity manager.
7.1.2. Contribution to operations research
We developed a model to determine the load of an AL. The AL most likely does not reach a steady
state. We also developed a case mix optimisation method, which we did not come across in the
literature.
Mainly the use of the grey area with undecided patient allocations appears to be unique. The grey
area sets bounds for the solution space, and enables hospitals to optimise within their strategic
scope. The enumeration is mainly useful in situations where management is hesitant about the
qualitative impacts of the assignment of a patient, and needs quantitative support to justify
complex decisions.
Our modelling approach for the AL and CW can be applied other hospital units or job shop systems
with similar characteristics. For example, the hospital’s lab, can be modelled with the deterministic
model. Clinicians at our case study hospital explained that the lab experiences peak load during
the morning, short before elective surgeries take place. The peak load of the lab may be reduced by
using other opening hours, which our model can assess.
7.1.3. Contribution to practice
ChipSoft can integrate the DSS with the models that are currently under development. We enable
users of the DSS to systematically make decisions about the implementation of the AL. After the
AL is implemented, the DSS can be used for tactical planning purposes by resetting inputs such as
the wards for analysis, the analysis period, or the patient selection criteria.

60
7.2. Discussion and recommendations We went into this analysis with the idea that the Erlang loss model would be applicable to analysis
of the AL. However, the assumptions for a steady state Poisson arrivals make the Erlang loss model
useless for the AL. We ended up using a deterministic approach with the assumption that patients
stay at the AL during two time buckets of one hour each. In practice, this is less strict and there is
more variability in the duration between the moment of a patient’s arrival. We stand by this
approach because we noticed that the use of smaller time buckets resulted in more variable arrival
patterns. Although it is important to assess the variability in arrivals over the course of the opening
hours of the AL, the decisions regarding dimensions of the AL is strategic. For the strategic decision
we need a general indication of the (maximum) load on the AL. There are other methods such as
simulation modelling that are better at capturing the variability patterns on an operational level.
The Erlang loss model leads to an overestimation of the required number of beds. It is unclear
whether the calculated bed reductions were true to the real potential bed reductions. Nevertheless,
we used the calculated bed reduction, a result from the shortened ALOS for selected patients, to
quantify the potential advantages of the introduction of an AL. There is also a wide variety of
qualitative aspects that influence the benefit of the AL. The main driver for hospitals will initially
be the improved logistics and patient friendliness, while the bed reductions might be of marginal
interest.
We visualised the admission and discharge events for the CW, but we did not incorporate the
opening hours of the AL in this visualisation. Hence, AL patients that arrived outside opening
hours of the AL were also modelled to arrive later at the CW, like patients arriving during opening
hours. To make a more accurate visualisation of the events we recommend ChipSoft to incorporate
the AL’s opening hours in the visualisation of arrivals and discharges at the CW.
With the use of representative days one can wonder whether the flaw of averages is reduced or not.
With representative days we automatically exclude outliers from the analysis of the AL. This means
that we potentially over- or underestimate the number of days or hours on which patients are
rejected. To gain more insights about the operational performance of the AL and the CW combined,
a simulation study may be required. Another remark on the use of representative days for the
analysis of the AL is that they might be non-existent when the MSS changes drastically. We
recommend ChipSoft to link the calculations for the inflow of the AL to the models that are
currently under development.
If a hospital wants to maximise the utilisation of the AL there are several options. Our first
recommendation is to use the empty space as an overflow facility for e.g. the day care department
of the CW. Our second recommendation would be to take in balancing the inflow of the AL into
consideration when constructing the MSS. Our model for calculating the load of the AL could be
used for assessment of the effects of the new inflow.
Enumeration of the case mix was done for a relatively small solution space. Let us assume that
ASA classification 3 is the only classification up for debate, and that the age range for the grey area
will be divided into a maximum of five categories. Then those combination already form 2 x 5 = 10
options to asses. The number of (sub)specialties within the grey area then has substantial influence
on the size of the solution space. The number of combinations is then multiplied by 2s, s being the
number of specialties within the grey area. With 10 (sub)specialties within the grey area, there are
then 2 x 5 x 210 = 10,240 combinations to assess. Assuming that the runtime shows linear behaviour,
we then require 10,240 / 12 * 3.8 seconds runtime = 54 minutes of runtime, which is acceptable for
strategic decision making. However, when the number of (sub)specialties keeps adding up, the
runtime quickly increases. With 15 (sub)specialties, the runtime of the model amounts 91 hours.

61
This numerical example shows the importance of setting boundaries in the patient inclusion and
exclusion criteria.
We assumed all AL-classified patients are allowed to be admitted to the AL. By setting a limit to
the maximal number of admissions from a certain patient type or group, it is possible to take
admission control tactics into account. We recommend ChipSoft to integrate this into the model for
extended tactical planning capabilities.
The model generates many outputs. This means that there is a wide variety of results that may not
be interpretable for all users. We assessed the usability of the DSS with experienced developers
from ChipSoft and one hospital in the case study and all respondents are people with a technical
background. Someone with less technical knowledge may experience more difficulty with the
interpretation of these results. However, hospitals that may consider using this tool from ChipSoft
are already (slightly) experienced with the use of a DSS and hence we may have incorrectly
assumed the usability and interpretability of the tool.
During preoperative screening it is already possible to determine the location of admission for the
patient. We recommend ChipSoft to add a field to the preoperative screening document that
indicates whether the admission can take place at the Al. This field can be filled automatically
when the patient’s characteristics comply with the AL selection criteria. This way there is no extra
action for the screening anaesthesiologist, but there is more information about the patient
available. When the AL is used for a longer period of time it is also easier to assess the performance
of the AL, since it is know which patients used the AL at what times.
7.3. Further research We used the Erlang loss model formulation by De Bruin et al. (2007) to determine the potential bed
reduction for the CW. To account for the variability in arrivals at the CW, which is more useful for
tactical planning, we recommend expanding the model with the time-dependent Erlang loss model
(Bekker & De Bruin, 2010). The impact of the AL could also be quantified if the time dependent
arrivals at the CW are based on the visualised admission patterns we incorporated in our DSS.
To further determine the extent of variability in the arrivals of AL patients, and the effects thereof,
simulation modelling might be required. In simulation modelling it is possible to incorporate other
details that we did not incorporate, such as the waiting room of the AL, the time that the patient
spends at the holding, or the variability in admission duration. If the AL, CW and OT are modelled
as one complex it is also possible to get more insights about the effects of changing the MSS.
One of the hot topics in operations management for health care is to balance the care burden across
wards. The AL does this to a certain extent; the preoperative patients are no longer amongst the
postoperative patients and therefore the care burden at both the AL and CW is more balanced than
it would be without the AL. A way to exploit the effects of a balanced care burden would be to assign
patients to the AL or CW on the basis of potential care burden.
We applied case studies to data of small general hospitals. Application to a larger of other type of
hospital will result in more knowledge about the usability of the DSS. We expect that the DSS can
be valuable for larger hospitals where the decisions for patient selection and ward selection are
more complex than the contexts we studied. In a specialised hospital, the patient selection decisions
might focus on other attributes than in our study. In that case, the attribute specialty may be
replaced by, e.g., treatment type.

62

63
BIBLIOGRAPHY
Bai, J., Fügener, A., Schoenfelder, J., & Brunner, J. O. (2018). Operations research in intensive
care unit management: a literature review. Health Care Management Science, 21(1).
https://doi.org/10.1007/s10729-016-9375-1
Barreiros, A. (2013). Modelling a Job-Shop Plant Using Queuing Networks Techniques. Journal of
Materials Science and Engineering B, 3(9). https://doi.org/10.17265/2161-6221/2013.09.010
Bekker, R., & De Bruin, A. M. (2010). Time-dependent analysis for refused admissions in clinical
wards. Annals of Operations Research, 178(1), 45–65. https://doi.org/10.1007/s10479-009-
0570-z
Bhattacharjee, P., & Ray, P. K. (2014). Patient flow modelling and performance analysis of
healthcare delivery processes in hospitals: A review and reflections. Computers and Industrial
Engineering, 78, 299–312. https://doi.org/10.1016/j.cie.2014.04.016
Borgman, N. (2017). Managing urgent care in hospitals. https://doi.org/10.3990/1.9789036543606
CBS. (2018). StatLine - Zorguitgaven; kerncijfers. Retrieved February 11, 2019, from
https://opendata.cbs.nl/statline/#/CBS/nl/dataset/84047NED/table?ts=1549880326470
ChipSoft. (2019). ChipSoft - Over ons. Retrieved February 11, 2019, from
https://www.chipsoft.nl/organisatie/1/Over-ons
Cochran, J. K., & Bharti, A. (2006). Stochastic bed balancing of an obstetrics hospital. Health Care
Management Science, 9(1), 31–45. https://doi.org/10.1007/s10729-006-6278-6
Collins, T. C., Daley, J., Henderson, W. H., & Khuri, S. F. (1999). Risk factors for prolonged length
of stay after major elective surgery. Annals of Surgery, 230(2), 251–259.
https://doi.org/10.1097/00000658-199908000-00016
De Bruin, A. M., Bekker, R., van Zanten, L., & Koole, G. M. (2010). Dimensioning hospital wards
using the Erlang loss model. Annals of Operations Research, 178(1), 23–43.
https://doi.org/10.1007/s10479-009-0647-8
De Bruin, A. M., Van Rossum, A. C., Visser, M. C., & Koole, G. M. (2007). Modeling the emergency
cardiac in-patient flow: an application of queuing theory. Health Care Management Science,
10(2), 125–137. https://doi.org/10.1007/s10729-007-9009-8
Deyo, R. A., Cherkin, D. C., Ciol, M. A., & ASA. (2014). ASA Physical Status Classification System.
American Society of Anesthesiologists, 45(10), 1–2. https://doi.org/10.1016/0895-
4356(93)90104-9
Dobson, G., Lee, H.-H., & Pinker, E. (2010). A Model of ICU Bumping. Operations Research, 58(6),
1564–1576. https://doi.org/10.1287/opre.1100.0861
Doyle, D. J., & Garmon, E. H. (2018, January 19). American Society of Anesthesiologists
Classification (ASA Class). https://doi.org/10.1097/00132582-198203000-00028
Gorunescu, F., Mcclean, S. I., & Millard, P. H. (2002). A queueing model for bed-occupancy
management and planning of hospitals. Journal of the Operational Research Society, 53, 19–
24. https://doi.org/10.1057=palgrave=jors=2601244
Graves, S. C. (1986). A Tactical Planning Model for a Job Shop. Operations Research, 34(4), 522–
533. https://doi.org/10.1287/opre.34.4.522
Green, L. (2006). Queuing analysis in healthcare. Queueing Analysis In Healthcare.
https://doi.org/10.1007/978-0-387-33636-7
Green, L. V, & Nguyen, V. (2001). Strategies for Cutting Hospital Beds: The Impact on Patient
Service. HSR: Health Services Research, 36(2), 421–442. Retrieved from
https://www.ncbi.nlm.nih.gov/pmc/articles/PMC1089232/pdf/hsresearch00003-0128.pdf
Hahn, P., & Krarup, J. (2001). A hospital facility layout problem finally solved. Journal of

64
Intelligent Manufacturing, 12(5), 487–496. https://doi.org/10.1023/A:1012252420779
Hans, E. W., Houdenhoven, M. Van, & Hulshof, P. J. H. (2011). Chapter 12 A Framework for
Healthcare Planning and Control. Handbook of Healthcare System Scheduling. Boston, MA:
Springer. https://doi.org/10.1007/978-1-4614-1734-7_12
Harper, P. R., Powell, N. H., & Williams, J. E. (2010). Modelling the size and skill-mix of hospital
nursing teams. Journal of the Operational Research Society, 61(5), 768–779.
https://doi.org/10.1057/jors.2009.43
Heuven, I. I. Van, & Rene, V. S. (2018). Stochastic Scheduling Techniques for Integrated
Optimization of Catheterization Laboratories and Wards. Retrieved from
http://patatconference.org/patat2018/files/proceedings/paper45.pdf
Hof, S., Fügener, A., Schoenfelder, J., & Brunner, J. O. (2017). Case mix planning in hospitals: a
review and future agenda. Health Care Management Science, 20(2), 207–220.
https://doi.org/10.1007/s10729-015-9342-2
Huckman, R. S., Bloom, N., Sadun, R., Tsai, T. C., Gawande, A. A., & Jha, A. K. (2015). Hospital
Board And Management Practices Are Strongly Related To Hospital Performance On Clinical
Quality Metrics. Health Affairs, 34(8), 1304–1311. https://doi.org/10.1377/hlthaff.2014.1282
Hulshof, P. J. H., Kortbeek, N., Boucherie, R. . J., Hans, E. W., & Bakker, P. J. M. (2012). Taxonomic
classification of planning decisions in health care: a structured review of the state of the art
in OR/MS. Health Systems, 1(2), 129–175. https://doi.org/10.1057/hs.2012.18
Jackson, J. R. (1957). Networks of Waiting Lines. Operations Research, 5(4), 518–521.
https://doi.org/10.1287/opre.5.4.518
Jackson, J. R. (1963). Jobshop-like queueing systems. Los Angeles. Retrieved from
https://apps.dtic.mil/dtic/tr/fulltext/u2/296776.pdf
Knoben, J. P. M. (2019). From health insurance to patient treatment Supporting the translation of
agreements between health insurers and hospitals from yearly numbers to weekly capacity with
an IT-tool. TU Eindhoven. Retrieved from
https://pure.tue.nl/ws/portalfiles/portal/120753294/Master_Thesis_Juul_Knoben.pdf
Leeftink, G. (2017). Why wait? Organizing integrated processes in cancer care.
https://doi.org/10.3990/1.9789036544115
Li, X., Beullens, P., Jones, D., & Tamiz, M. (2007). An integrated queuing and multi-objective bed
allocation model with application to a hospital in China. Journal of the Operational Research
Society, 60(3), 330–338. https://doi.org/10.1057/palgrave.jors.2602565
Özcan, Y. (2009). Quantitative Methods in Health Care Management: Techniques and Applications.
Technometrics (Vol. 36). Retrieved from
http://books.google.com/books?hl=en&lr=&id=EXD1O7KwfD0C&oi=fnd&
pg=PR19&dq=Quantitative+Methods+in+Health+Care+Management+-
+Techniques+and+Applications&ots=n9jU4MiTtb&sig=MOTVtu1x-
YkezuLnpwQYkgSi9FE
Patiëntenfederatie Nederland. (2019). Bevoegdheden gespecialiseerde verpleegkundige,
verpleegkundig specialist en physician assistant. Retrieved March 6, 2019, from
https://kennisbank.patientenfederatie.nl/app/answers/detail/a_id/2140/~/bevoegdheden-
gespecialiseerde-verpleegkundige%2C-verpleegkundig-specialist-en
Pinedo, M. L. (2009). Machine Scheduling and Job Shop Scheduling. In Planning and Scheduling
in Manufacturing and Services (pp. 83–115). New York, NY: Springer New York.
https://doi.org/10.1007/978-1-4419-0910-7_5
Riet, V. C., Samudra, M., Van Riet, C., Demeulemeester, E., Cardoen, B., Vansteenkiste, N., …
Cardoen, B. (2016). Scheduling operating rooms: achievements, challenges and pitfalls.
Journal of Scheduling, 19(5), 493–525. Retrieved from
https://core.ac.uk/download/pdf/34660173.pdf
Robinson, S. (2014). Simulation : the practice of model development and use (2nd ed.).

65
Steiner, F., Kolisch, R., Fügener, A., Schiele, J., Edenharter, G. M., Blobner, M., … Mayr, U. (2016).
Improving Intensive Care Unit and Ward Utilization by Adapting Master Surgery Schedules.
A & A Case Reports, 6(6), 172–180. https://doi.org/10.1213/xaa.0000000000000247
Van Boekel, P. H. C. M. (2018). Stable resource utilization at day-care departments through
integrated scheduling and sequencing an IT tool for planning support. TU Eindhoven.
Retrieved from
https://pure.tue.nl/ws/portalfiles/portal/101137487/Master_Thesis_Puck_van_Boekel.pdf
van Essen, J. T., van Houdenhoven, M., & Hurink, J. L. (2015). Clustering clinical departments for
wards to achieve a prespecified blocking probability. OR Spectrum, 37(1), 243–271.
https://doi.org/10.1007/s00291-014-0368-5
Zijm, W. H. M. (2000). Towards intelligent manufacturing planning and control systems. OR
Spektrum (Vol. 22). Springer-Verlag. Retrieved from
https://pdfs.semanticscholar.org/3917/cf19f7ea99a99dde4c2553f9c949c11fca24.pdf
1. End of main text

APPENDIX A INTERVIEW RESULTS
This appendix contains the interview questions used for our conversations with three hospitals.
The questions are in Dutch, as is the summary of the findings. We let the hospitals review the
summaries of their conversations, in Dutch. Due to possible translation errors we decide to
maintain the questions and summary in Dutch.
Table 12 – Questions, and key words to pay attention to, used for conversation with hospitals.
Nummer Vraag Steekwoorden
1 Hoe kwam het idee voor de OOA tot stand?
1a Welke problemen heeft de OOA (niet) opgelost?
Verbeteringen;
teleurstellingen;
problemen; ziekenhuis;
patiënt
1b
Hoe verliep de analyse/het ontwerptraject voor de OOA
en met welke factoren is destijds rekening gehouden?
Berekeningen; aantal
bedden; kosten/baten
1c Hoe verliep de implementatie fase?
Tijdsduur; stappen;
opbouw
1d Wat is er veranderd op de kliniek? Variatie; aantal patiënten
2 Hoe ziet een dag op de OOA eruit?
2a Perspectief personeel/management Werkdruk; inzicht verloop
2b Perspectief patiënt Verloop; tijden; comfort
3 Wat zijn de karakteristieken van de OOA?
3a
Welke type patiënt mag wel/niet gebruik maken van de
OOA en waarom?
Klinische patiënt;
poliklinische patiënt;
spoed
3b
Hoeveel personeel is er dagelijks werkzaam op de OOA
en hoe worden zij ingepland?
V:P ratio; dagvariatie;
planningsmethodiek
3c
Wat is de capaciteit en benutting van de OOA en hoe
maken jullie die inzichtelijk?
Aantal bedden; patiënten
per dag; dashboard;
benutting; KPIs;
management; rapporten
3d Wat zijn de wacht-/verblijf-/doorlooptijden op de OOA?
Samenvatting; sturing;
verandering over tijd
3e
Wat beschouwen jullie als de resources van de OOA en
welke daarvan zijn schaars/vormen een bottleneck?
Bedden; stoelen;
loungeplekken; ruimtes
3f Welke planningsmethodieken gebruiken jullie? Heuristieken; software
4
Hoe worden onderstaande handelingen/uitdagingen
ondervangen?
4a Beddenvervoer en -reserveringen Van/naar OK
4b Spreiding van de drukte Variabele inzet personeel
4c Tijdig oproepen van de patiënt Software; WT
4d Opbergen/vervoer van persoonlijke spullen Kluisjes; doos; afdeling
4e Begeleiding en bezoek voor patiënt Min/max begeleiding
4f
Welke technische oplossingen zijn extra nodig voor het
mogelijk maken van de OOA?
HiX; aanmeldzuil;
entertainment

5
Als jullie het opnieuw zouden kunnen doen, wat zouden
jullie dan anders doen in het opzetten van de OOA?
Bonus 1 Wat waren onvoorziene barrières? Tegenslagen; personeel
Bonus 2 Wat waren onvoorziene voordelen? Financiële meevallers
Bonus 3
Wat is het takenpakket van het
afdelingshoofd/capaciteitsmanager?
Monitoring; planning;
coördinatie
Bonus 4
Wat voor manieren voor continue verbetering van de
OOA passen jullie toe?
Bonus 5 Maximale benutting van de ruimte (andere doeleinden?) Andere programma's
Bonus 6 Privacy van patiënten Andere kamers
Summary of the findings
Aanleiding voor de OOA
Er werd een hoge druk op de bedden in de ochtend waargenomen.
o Veel patiënten komen vroeg in de ochtend.
o Patiënten gaan ook weg in de ochtend.
De OOA houdt preoperatieve patiënten bij de verpleegafdeling vandaan en daarmee
wordt de ochtenddrukte verminderd op de verpleegafdeling.
Veel van de capaciteit van de verpleging wordt gebruikt voor het faciliteren van opnames
en kan dus efficiënter ingericht worden.
Het probleem rondom de ontvangst van electieve patiënten met klinische opname kwam
in eerste instantie uit een capaciteitsvraagstuk.
o Er was meer verplegend personeel nodig wegens het reserveren van bedden voor
patiënten. De patiënten worden in de oude situatie in een bed gelegd (grofweg)
zodra ze het ziekenhuis binnenkomen en op de kliniek ontvangen worden. Dat
vraagt om beddenreserveringen voor de preoperatieve fase. Als er bedden
gereserveerd worden wordt daar ook personeel voor gereserveerd, wat soms tot
een lage bedbezetting leidt. Er is dus veel variatie in bezetting van verpleging.
o Personeel moet efficiënter ingezet worden wegens een beperkt aantal
verpleegkundigen. Als alternatief moest worden gekeken hoe Verzorgenden
Individuele Gezondheidszorg (VIG’ers) en Ziekenverzorgers (ZV’ers) hun taken
deels over kunnen nemen.
Daarnaast is er een financiële incentive.
Het capaciteitsvraagstuk kan vertaald worden naar een vraag voor patiëntvriendelijkheid
en vermindering van benodigde verpleegkundigen.
o In de oude situatie worden patiënten ontvangen op de verpleegafdeling, waar
zowel de pre- als postoperatieve patiënten liggen. Zodra de patiënt aankomt wordt
diegene in een bed gelegd ter voorbereiding op de OK-sessie. De patiënt kan
zodoende een aantal uur in bed liggen voordat de operatie uitgevoerd wordt, wat
een negatieve werking heeft op de gezondheid van de patiënt. De preoperatieve
ligduur is deels noodzakelijk wegens het voorbereiden van de patiënt, maar dit
betreft vaak slechts 30 minuten.
o Er ontstaat een duidelijk scheiding tussen twee verschillende processen: het
preoperatieve en het postoperatieve. Een groot voordeel is dat preoperatieve
verzorging minder specialistisch personeel vereist dan postoperatief. Daardoor is
het mogelijk om het personeel in te zetten zoals het op de huidige manier gedaan
wordt.
Sterktes OOA:
o Er komen meer bedden vrij op de verpleegafdelingen omdat bijna alle nuchtere
opnames via de OOA gaan
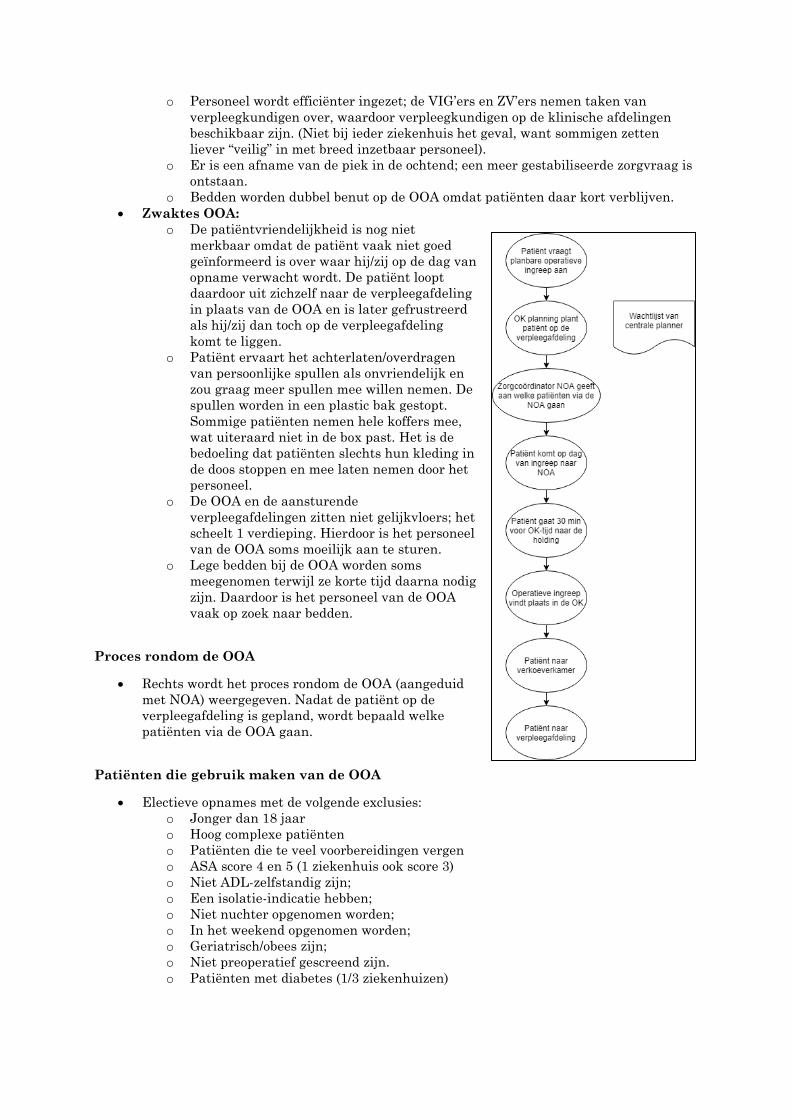
o Personeel wordt efficiënter ingezet; de VIG’ers en ZV’ers nemen taken van
verpleegkundigen over, waardoor verpleegkundigen op de klinische afdelingen
beschikbaar zijn. (Niet bij ieder ziekenhuis het geval, want sommigen zetten
liever “veilig” in met breed inzetbaar personeel).
o Er is een afname van de piek in de ochtend; een meer gestabiliseerde zorgvraag is
ontstaan.
o Bedden worden dubbel benut op de OOA omdat patiënten daar kort verblijven.
Zwaktes OOA:
o De patiëntvriendelijkheid is nog niet
merkbaar omdat de patiënt vaak niet goed
geïnformeerd is over waar hij/zij op de dag van
opname verwacht wordt. De patiënt loopt
daardoor uit zichzelf naar de verpleegafdeling
in plaats van de OOA en is later gefrustreerd
als hij/zij dan toch op de verpleegafdeling
komt te liggen.
o Patiënt ervaart het achterlaten/overdragen
van persoonlijke spullen als onvriendelijk en
zou graag meer spullen mee willen nemen. De
spullen worden in een plastic bak gestopt.
Sommige patiënten nemen hele koffers mee,
wat uiteraard niet in de box past. Het is de
bedoeling dat patiënten slechts hun kleding in
de doos stoppen en mee laten nemen door het
personeel.
o De OOA en de aansturende
verpleegafdelingen zitten niet gelijkvloers; het
scheelt 1 verdieping. Hierdoor is het personeel
van de OOA soms moeilijk aan te sturen.
o Lege bedden bij de OOA worden soms
meegenomen terwijl ze korte tijd daarna nodig
zijn. Daardoor is het personeel van de OOA
vaak op zoek naar bedden.
Proces rondom de OOA
Rechts wordt het proces rondom de OOA (aangeduid
met NOA) weergegeven. Nadat de patiënt op de
verpleegafdeling is gepland, wordt bepaald welke
patiënten via de OOA gaan.
Patiënten die gebruik maken van de OOA
Electieve opnames met de volgende exclusies:
o Jonger dan 18 jaar
o Hoog complexe patiënten
o Patiënten die te veel voorbereidingen vergen
o ASA score 4 en 5 (1 ziekenhuis ook score 3)
o Niet ADL-zelfstandig zijn;
o Een isolatie-indicatie hebben;
o Niet nuchter opgenomen worden;
o In het weekend opgenomen worden;
o Geriatrisch/obees zijn;
o Niet preoperatief gescreend zijn.
o Patiënten met diabetes (1/3 ziekenhuizen)
Uiteindelijk hopen ziekenhuizen dusdanig te kunnen plannen dat ze in weten te spelen op
verwachte drukte bij verpleegafdeling, maar tijdens deze pilotfase is het nog moeilijk in te
schatten in hoeverre dat gaat lukken
Logistiek en resources
Het zal hoogstwaarschijnlijk zo zijn dat een aantal bedden die klaarstaan bij de NOA (als
buffer) in de nacht weggepakt worden en de volgende dag verdwenen zijn. Het is lastig
hier een oplossing voor te vinden.
Er moeten voldoende (Computers on Wheels) COWs bij de NOA aanwezig zijn.
De logistiek in het ziekenhuis wordt door een logistiek team geregeld in een van de
ziekenhuizen. Dit team verzorgt zowel het vervoer van patiënten als van goederen. In
andere ziekenhuizen wordt het patiëntenvervoer uitgevoerd door verpleegkundigen of
ZV’ers.
o In een van de ziekenhuizen wordt het logistiek team via een app aangestuurd.
Deze houdt rekening met het toewijzen van taken aan de dichtstbijzijnde logistiek
medewerker en bepaalt de optimale route voor het vervoer. De app zorgt ervoor
dat het logistiek team productiever is dan voorheen en biedt echt uitkomst voor de
oudere inefficiënte werkwijze.
o Uiteindelijk is er een wens om vervoer naar de verkoeverkamer (vanaf de OK) ook
door het logistiek team te laten doen, maar dat is lastig wegens het
overdrachtsmoment dat normaalgesproken plaatsvindt
o Dit overdrachtsmoment kan ook vervangen worden door goede documentatie in
HiX, maar dit zal niet gauw geaccepteerd worden onder verpleegkundigen.
Wensen
Een koppeling met de holding is gewenst, maar nu nog niet mogelijk omdat de holding en
OOA niet direct aan elkaar gelinkt zitten. De koppeling met de holding zou moeten zorgen
dat sommige patiënten van de OOA direct naar de OK kunnen (waar een sluis tussen
OOA en OK gewenst is) en sommige patiënten van de OOA via de holding naar de OK
gaan, wat vraagt om een sluis tussen de OOA en de holding. Dit vraagt om een
uitgebreide verbouwing van de afdeling, wat er voorlopig nog niet aan zit te komen.
De wachtkamer van de OOA kan worden uitgebreid en dichter bij de OOA geplaatst
worden, maar om dat te realiseren moet de OOA naar een andere locatie verplaatst
worden of er moeten een verbouwing plaatsvinden. Hiervan is bij alle ziekenhuizen nog
geen sprake omdat het om een pilot gaat.
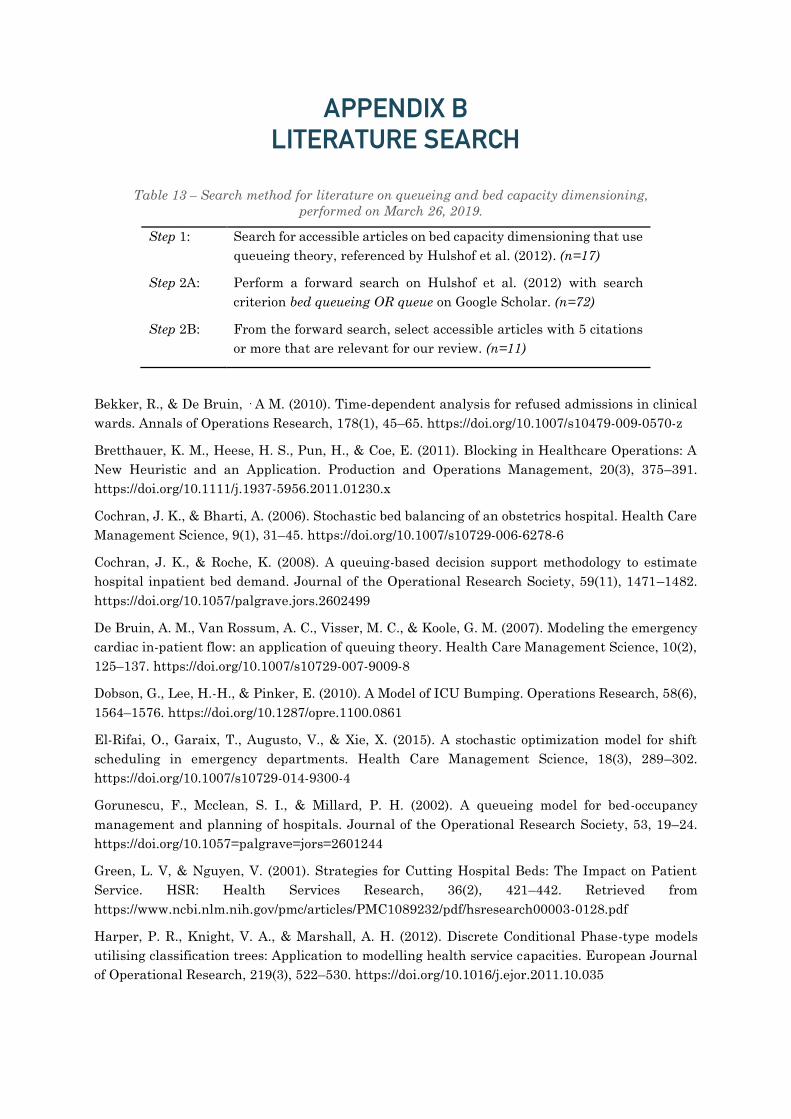
APPENDIX B LITERATURE SEARCH
Table 13 – Search method for literature on queueing and bed capacity dimensioning,
performed on March 26, 2019.
Step 1: Search for accessible articles on bed capacity dimensioning that use
queueing theory, referenced by Hulshof et al. (2012). (n=17)
Step 2A: Perform a forward search on Hulshof et al. (2012) with search
criterion bed queueing OR queue on Google Scholar. (n=72)
Step 2B: From the forward search, select accessible articles with 5 citations
or more that are relevant for our review. (n=11)
Bekker, R., & De Bruin, · A M. (2010). Time-dependent analysis for refused admissions in clinical
wards. Annals of Operations Research, 178(1), 45–65. https://doi.org/10.1007/s10479-009-0570-z
Bretthauer, K. M., Heese, H. S., Pun, H., & Coe, E. (2011). Blocking in Healthcare Operations: A
New Heuristic and an Application. Production and Operations Management, 20(3), 375–391.
https://doi.org/10.1111/j.1937-5956.2011.01230.x
Cochran, J. K., & Bharti, A. (2006). Stochastic bed balancing of an obstetrics hospital. Health Care
Management Science, 9(1), 31–45. https://doi.org/10.1007/s10729-006-6278-6
Cochran, J. K., & Roche, K. (2008). A queuing-based decision support methodology to estimate
hospital inpatient bed demand. Journal of the Operational Research Society, 59(11), 1471–1482.
https://doi.org/10.1057/palgrave.jors.2602499
De Bruin, A. M., Van Rossum, A. C., Visser, M. C., & Koole, G. M. (2007). Modeling the emergency
cardiac in-patient flow: an application of queuing theory. Health Care Management Science, 10(2),
125–137. https://doi.org/10.1007/s10729-007-9009-8
Dobson, G., Lee, H.-H., & Pinker, E. (2010). A Model of ICU Bumping. Operations Research, 58(6),
1564–1576. https://doi.org/10.1287/opre.1100.0861
El-Rifai, O., Garaix, T., Augusto, V., & Xie, X. (2015). A stochastic optimization model for shift
scheduling in emergency departments. Health Care Management Science, 18(3), 289–302.
https://doi.org/10.1007/s10729-014-9300-4
Gorunescu, F., Mcclean, S. I., & Millard, P. H. (2002). A queueing model for bed-occupancy
management and planning of hospitals. Journal of the Operational Research Society, 53, 19–24.
https://doi.org/10.1057=palgrave=jors=2601244
Green, L. V, & Nguyen, V. (2001). Strategies for Cutting Hospital Beds: The Impact on Patient
Service. HSR: Health Services Research, 36(2), 421–442. Retrieved from
https://www.ncbi.nlm.nih.gov/pmc/articles/PMC1089232/pdf/hsresearch00003-0128.pdf
Harper, P. R., Knight, V. A., & Marshall, A. H. (2012). Discrete Conditional Phase-type models
utilising classification trees: Application to modelling health service capacities. European Journal
of Operational Research, 219(3), 522–530. https://doi.org/10.1016/j.ejor.2011.10.035

Kim, S.-C., Horowitz, I., Young, K. K., & Buckley, T. A. (1999). Analysis of capacity management
of the intensive care unit in a hospital. European Journal of Operational Research, 115(1), 36–46.
Retrieved from https://ac-els-cdn-com.ezproxy2.utwente.nl/S0377221798001350/1-s2.0-
S0377221798001350-main.pdf?_tid=00bb76f2-98f7-4a9e-ad51-
5a49f08a3ba7&acdnat=1552385270_895f6ecbf4d722e6b4ca1c60979affd7
Li, X., Beullens, P., Jones, D., & Tamiz, M. (2007). An integrated queuing and multi-objective bed
allocation model with application to a hospital in China. Journal of the Operational Research
Society, 60(3), 330–338. https://doi.org/10.1057/palgrave.jors.2602565
Ridge, J. C., Jones, S. K., Nielsen, M. S., & Shahani, A. K. (1998). Capacity planning for intensive
care units. European Journal of Operational Research, 105(2), 346–355. Retrieved from https://ac-
els-cdn-com.ezproxy2.utwente.nl/S0377221797002403/1-s2.0-S0377221797002403-
main.pdf?_tid=91cfefa9-f2c5-4d2e-8070-
31adf342e756&acdnat=1552385375_b064093a22fefeb399d841de2d7765aa
Thierry, A. ·, Chaussalet, J., & Robertson, N. J. (2010). A loss network model with overflow for
capacity planning of a neonatal unit. Annals of Operations Research, 178(1), 67–76.
https://doi.org/10.1007/s10479-009-0548-x
Utley, M., Gallivan, S., Davis, K., Daniel, P., Reeves, P., & Worrall, J. (2003). Estimating bed
requirements for an intermediate care facility. European Journal of Operational Research, 150(1),
92–100. https://doi.org/10.1016/S0377-2217(02)00788-9
Van Dijk, N. M., & Kortbeek, · N. (2009). Erlang loss bounds for OT-ICU systems. Queueing
Systems, 63(1), 253–280. https://doi.org/10.1007/s11134-009-9149-2

APPENDIX C GOODNESS-OF-FIT TESTS
We use a Chi2-test to determine the goodness-of-fit of the Poisson distribution for the arrivals of
each specialty of the ChipSoft development data. With a P-value of 0.1, the Poisson fit is accurate
for 3 out of 10 specialties.
Poisson fit accepted for p-value ≤ 0.1 Poisson fit rejected.
Poisson fit accepted for p-value ≤ 0.25 Poisson fit rejected.
Poisson fit accepted for p-value ≤ 0.1 Poisson fit rejected.
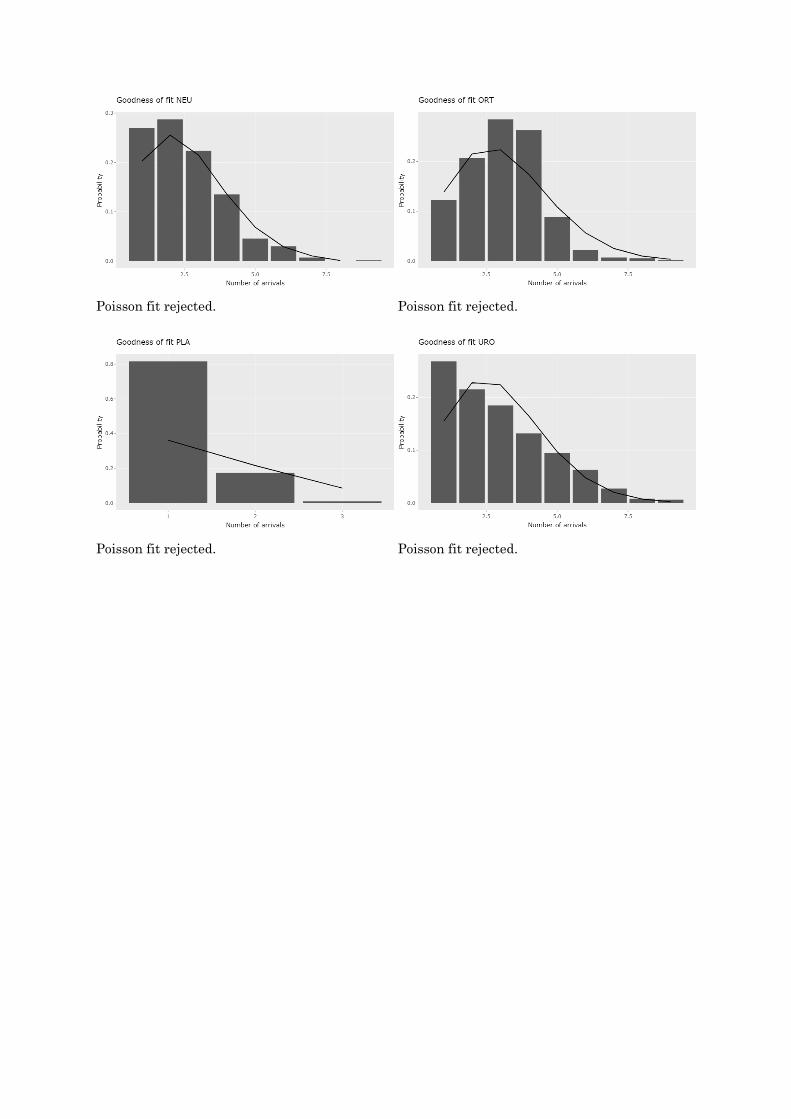
Poisson fit rejected. Poisson fit rejected.
Poisson fit rejected. Poisson fit rejected.

APPENDIX D VALIDATION OF THE BLOCKING PROBABILITY
The figure below shows the peak load on the CHI beds for every weekday during the years 2015,
2016, and 2017 in the hospital of ChipSoft’s development data. The load exceeds 27 beds for less
than 5% of the days, which indicates that the blocking probability for the specialty CHI amounts
approximately 5% for 27 beds. We make this conclusion under the assumption that blocking only
occurs during moments that the peak load exceeds the strategically set number of beds.
Peak loads on the CHI beds. maxAdmissions = the peak load during the day, count = number of
days.

APPENDIX E LARGE MOCK-UPS HIX