Embed Size (px)
Citation preview
Master thesis
Authors:
MSc. Finance and International Business
Tural Ismayilov
MSc. Finance
Vladlens Proskurovs
Academic supervisor:
Baran Siyahhan
Strategic Analysis and Corporate Valuation
of IC Companys A/S
1st November 2012
Aarhus School of Business and Social Sciences
Aarhus University
Page 2 of 157
Executive summary
In order to make comprehensive corporate valuation of targeted IC Companys A/S in
the first part of the thesis is performed thorough strategic analysis. Then the second part
mainly deals with various corporate valuation theories and models.
IC Companys has been formed in the merger of Carly Gry International A/S and
InWear Group A/S in 2001. Since that the company has been concentrating on being the
best developer of sports and fashion brands in the apparel industry in different markets
worldwide. Through the last 10 years IC Companys has grown mainly relying on
Merger & Acquisitions and the geographical expansion achieved by operating own
shops and franchising. Currently IC Companys has 11various upper-mid and middle
class brands in the apparel market and a successful implementation of the multi-brand
strategy permits the Group to create more value.
The strategic analysis conducted in this paper mainly divided into two groups - external
and internal analyses. External analysis includes PESTEL and Porter’s five forces where
the first defines macro factors that influence the company’s business, and then Porter’s
five forces determines industry criteria and intensity. While external analysis identifies a
company’s threats and opportunities, internal analysis defines the company’s strengths
and weaknesses through the implementation of Porter’s value chain and Core
competences. The sum-up of strengths, weaknesses, opportunities and threats is done in
SWOT analysis.
The second part of the thesis consists of main and supportive valuation tools. The main
valuation model in this paper is considered to be discounted cash flow which is
accompanied with the sensitivity and scenario analyses. As a part of weighted average
cost of capital, cost of equity is calculated according to the CAPM model.
Then in order to verify results that are derived from DCF model, economic profit model
has been applied. Following these models, real option valuation is implemented to
reveal additional value to the company’s underlying assets. In real option valuation
expansion option is used in the Brazilian.
Finally, multiples analysis is applied with the aim to evaluate whether the results
obtained from the DCF and real option valuation are reasonable.
Page 3 of 157
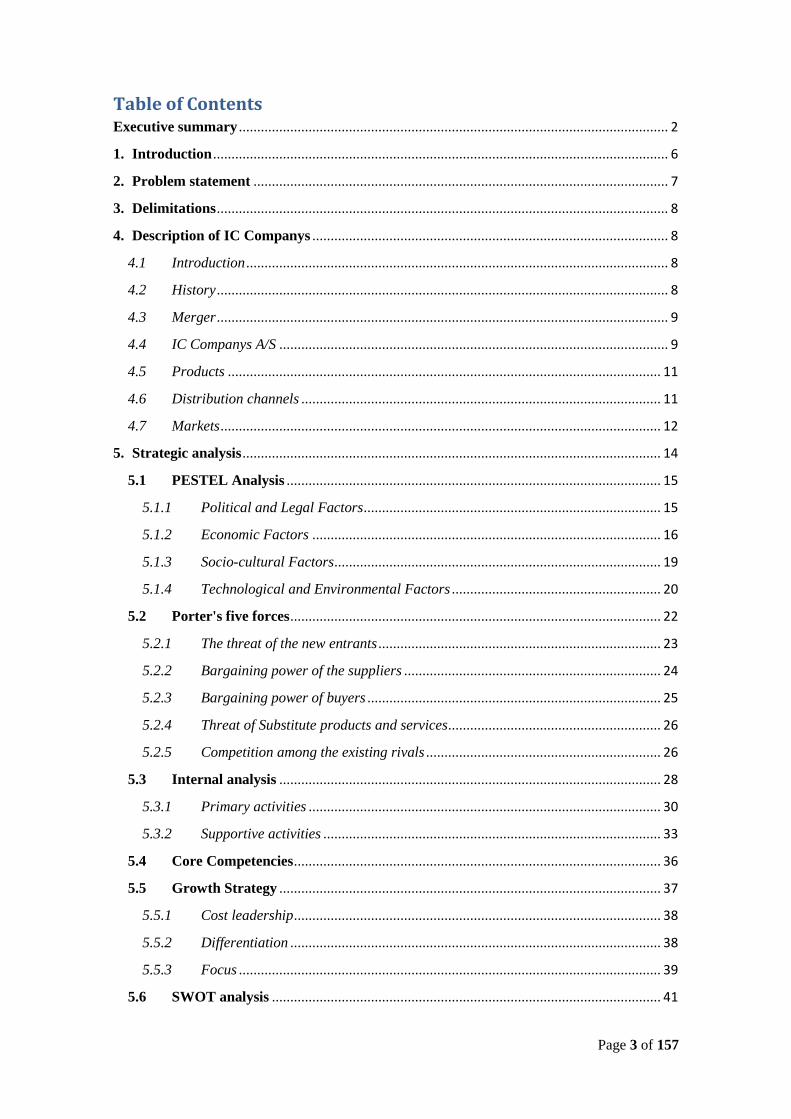
Table of Contents Executive summary ..................................................................................................................... 2
1. Introduction ............................................................................................................................ 6
2. Problem statement ................................................................................................................. 7
3. Delimitations ........................................................................................................................... 8
4. Description of IC Companys ................................................................................................. 8
4.1 Introduction ................................................................................................................... 8
4.2 History ........................................................................................................................... 8
4.3 Merger ........................................................................................................................... 9
4.4 IC Companys A/S .......................................................................................................... 9
4.5 Products ...................................................................................................................... 11
4.6 Distribution channels .................................................................................................. 11
4.7 Markets ........................................................................................................................ 12
5. Strategic analysis .................................................................................................................. 14
5.1 PESTEL Analysis ...................................................................................................... 15
5.1.1 Political and Legal Factors ................................................................................. 15
5.1.2 Economic Factors ............................................................................................... 16
5.1.3 Socio-cultural Factors ......................................................................................... 19
5.1.4 Technological and Environmental Factors ......................................................... 20
5.2 Porter's five forces ..................................................................................................... 22
5.2.1 The threat of the new entrants ............................................................................. 23
5.2.2 Bargaining power of the suppliers ...................................................................... 24
5.2.3 Bargaining power of buyers ................................................................................ 25
5.2.4 Threat of Substitute products and services .......................................................... 26
5.2.5 Competition among the existing rivals ................................................................ 26
5.3 Internal analysis ........................................................................................................ 28
5.3.1 Primary activities ................................................................................................ 30
5.3.2 Supportive activities ............................................................................................ 33
5.4 Core Competencies .................................................................................................... 36
5.5 Growth Strategy ........................................................................................................ 37
5.5.1 Cost leadership .................................................................................................... 38
5.5.2 Differentiation ..................................................................................................... 38
5.5.3 Focus ................................................................................................................... 39
5.6 SWOT analysis .......................................................................................................... 41
Page 4 of 157
5.7 Expansion Strategy ................................................................................................... 43
6. Evaluation of the corporate valuation theories ................................................................. 45
6.1 The Discounted Cash Flow (DCF) Method ............................................................. 46
6.1.1 Variables in the DCF Model ............................................................................... 47
6.1.2 The Weighted Average Cost of Capital ............................................................... 48
6.2 Economic profit model .............................................................................................. 56
6.3 Multiples ..................................................................................................................... 58
6.4 Real Option Valuation (ROV) .................................................................................. 61
6.4.1 The Binomial lattice model ................................................................................. 63
7. IC Companys valuation using DCF model ........................................................................ 67
7.1 The reformulated balance sheet ............................................................................... 67
7.2 The reformulated income statement ........................................................................ 69
7.3 Trend analysis ............................................................................................................ 69
7.4 Operating Leases, Taxes, NOPLAT and Invested Capital .................................... 71
7.4.1 Operating Leases ................................................................................................. 71
7.4.2 Taxes ................................................................................................................... 72
7.4.3 NOPLAT .............................................................................................................. 73
7.4.4 Invested Capital ................................................................................................... 74
7.5 Free Cash Flow .......................................................................................................... 75
7.6 The Weighted Average Cost of Capital of IC Companys ...................................... 76
7.7 Forecasting of the IC Companys’ free cash flow .................................................... 81
7.8 Calculation of the IC Companys’ continuing value ............................................... 84
7.9 Calculation of the IC Companys’ share price ......................................................... 85
7.10 Scenario analysis ....................................................................................................... 86
7.11 Sensitivity analysis..................................................................................................... 88
8. IC Companys valuation using Economic Profit Model .................................................... 90
9. Real Options Valuation of IC Companys ........................................................................... 92
9.1 Expansion option ....................................................................................................... 92
9.2 Binomial lattice approach for IC Companys .......................................................... 94
9.2.1 Step 1: Evaluation of IC Companys’ underlying asset without flexibility .......... 94
9.2.2 Step 2: Event tree ................................................................................................ 94
9.2.3 Step 3: Decision tree ........................................................................................... 97
9.2.4 Step 4: Expansion option for IC Companys’ decision tree with flexibility ......... 98
10. Valuation by multiples ....................................................................................................... 100
Page 5 of 157
11. Discussion of the results ..................................................................................................... 102
11.1 DCF analysis ............................................................................................................. 102
11.2 EVA analysis ............................................................................................................. 103
11.3 Real Options valuation .............................................................................................. 103
11.4 Multiples .................................................................................................................... 104
12. Conclusion........................................................................................................................... 104
References ................................................................................................................................ 108
Appendices ............................................................................................................................... 115
Page 6 of 157
1. Introduction
The aim of this paper is to focus on different theories and methods in order to make a
thorough corporate valuation concerning chosen multi-brand apparel enterprise IC
Companys A/S. The theoretical knowledge acquired during Corporate Valuation course
is applied to real life case by using publicly available data such as company’s annual
reports and published articles.
It could be assumed that after the harsh economic crisis in the past 2007/08 that hit
almost all markets and businesses, corporate valuation of different companies becomes
more interesting and challenging due to the recession period.
The main reason of the selection of IC Companys is its multi-brand strategy, where each
brand has separate design and management team. The company’s strong position creates
intensive competition environment for the rivals in the fashion industry. IC Companys
A/S is a Danish fashion and clothing company with relatively short history, but very
colorful and turbulent one. The group was formed on 30 April 2001 by the merger of
two Danish clothing and fashion companies InWear Group A/S and Carly Gry
International A/S. Indeed, newly formed fashion group has experienced some
challenges and difficulties especially within the top management team. As in fact in
2004 it has been realized that in the year 2003/04 company was in turmoil and large
deficit resulted in deposing of CEO and chairman. After some internal changes in the
management team, in the upcoming year of 2004/05 company achieved a surplus and IC
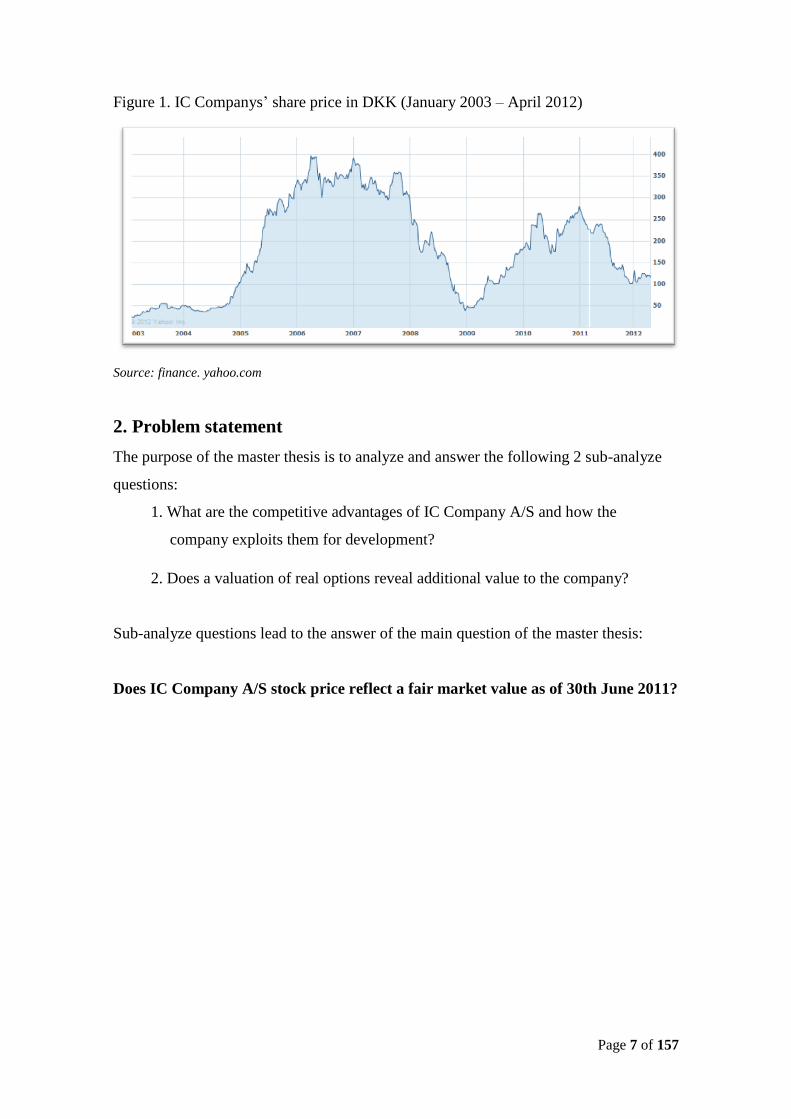
Companys stock price increased from 50 DKK to 400 DKK in spring 2006. This
increase in stock price was indication of positive turnover and IC Companys’ business
in overall. However, it was a temporary rise of stock price, in fact, economic crisis of
2007/08 resulted in turmoil and downturn in almost all kinds of businesses. IC
Company was not an exemption.
Page 7 of 157
Figure 1. IC Companys’ share price in DKK (January 2003 – April 2012)
Source: finance. yahoo.com
2. Problem statement
The purpose of the master thesis is to analyze and answer the following 2 sub-analyze
questions:
1. What are the competitive advantages of IC Company A/S and how the
company exploits them for development?
2. Does a valuation of real options reveal additional value to the company?
Sub-analyze questions lead to the answer of the main question of the master thesis:
Does IC Company A/S stock price reflect a fair market value as of 30th June 2011?
Page 8 of 157
3. Delimitations
The dissertation must be considered to be written for a potential investor of IC
Companys and thus it is based on the publically available information such as
company’s annual reports, websites, newspapers, articles, etc. Due to a selected target
group, interviews of company’s employees are not conducted as it is assumed that, first
of all, they are unable to disclose internal information and, secondly, it is always prevail
the fact that employees’ statements contain bias and therefore are subjective.
The thesis is founded on the application of definite theories and models relevant to the
case company. Strategic analysis models are discussed shortly as the main purpose of
the dissertation is a financial valuation of IC Companys. Financial theories are analyzed
in more details, however, only those which are applied in the thesis.
4. Description of IC Companys
4.1 Introduction
IC Company A/S is a Danish fashion group listed on the OMX Copenhagen Stock
Exchange. IC Companys is one of the major players in the fashion industry operating
across much of the world. IC Companys designs and sells apparel in a Scandinavian
style for conscious and self-confident men and women. The enterprise’s eleven brands
are distributed via two main channels: wholesale and retail. In details, wholesale
segment is compounded of wholesale customers and franchise partners, while retail
distribution channel consists of few types: group’s retail stores, concessions, franchises
and outlet stores and e-commerce (IC Companys’ annual report 2010/2011).
4.2 History
IC Companys was founded by the merger of Carli Gry International A/S and Inwear
Group A/S in 2001 (IC Companys, the history of IC Companys).
Carli Gry International A/S
Carli Gry International A/S was one part of the merger that created the IC Companys
A/S. The company was founded in 1940 and introduced Jackpot for women and
Cottonfield for men. Both brands still operate in the IC Companys brand portfolio and
Jackpot itself enters into the composition of five key brands which generate the major
Page 9 of 157
part of the company’s earnings. Carli Gry was listed in 1996 on the Copenhagen Stock
Exchange. In 1998, the company acquired the Swedish fashion and sports company
Peak Performance, while Carli Gry was also listed on the Stockholm Stock Exchange.
Towards the late 90s the actual results were promising and in 1997 Carli Gry obtained
the largest ever profit before tax of DKK 136 million. The following year the company
experienced growth in revenues, while decreasing profit margins. The development has
been explained by short-sighted focus on margin over long-term focus on IT and
marketing. In order to reverse negative trends, Carli Gry dislocated its sales from
unprofitable stores and increased focus on marketing, branding, logistics and factory
outlets.
Inwear Group A/S
InWear Group A/S was established by Niels Martinsen in 1969, who nowadays is the
major shareholder and chairman of IC Companys. InWear’s primary brands were
InWear focused on young women as the target group, the male counterpart Matinique
and Part Two. InWear and Carli Gry faced some financial troubles before the merger
with deteriorating profit margins in a stressed market. Such difficulties made InWear to
liquidate unprofitable stores and led to further adjustments.
4.3 Merger
Clothing sector experienced the worst times in the late 90s due to a fierce competition.
After evaluation of the strategic and economic considerations of economies of scale, the
merger of Carli Gry and InWear was an obvious decision in order to capture strong
market position, distribution channels, product portfolio and operational synergies. On
12th
March 2001, the companies made the joint announcement where the directors
recommended the merger of Carli Gry and InWear. The merger was approved on 30th
April 2001 with Carli Gry as the continuing corporation under the name of IC
Companys A/S (IC Companys, Fusionsprospekt, 2001).
4.4 IC Companys A/S
After the merger, IC Companys had product portfolio of 13 brands, and in the following
years some additional brands were added to the portfolio. In 2002 IC Companys bought
the Danish company Saint Tropez that was founded in 1993 and specialized in
designing and selling clothes for younger women. At the same year new brand
Page 10 of 157
Designers Remix Collection was introduced. IC Companys has also established the
cooperation with the Danish haute couture designer Isabell Kristensen who has
launched collection "O", but later her designs were launched under the brand name of
Soaked in Luxury.
In 2003 IC Companys also signed a collaboration agreement with the Danish designer
Malene Birger under the brand By Malene Birger. Later that year IC Companys bought
the dominant brand of clothes for young people in Sweden - Sir Tiger Modebolag.
In October 2003 the CEO and the entire board was replaced, with the exception of Niels
Martinsen, due to disappointing results.
In 2006 IC Companys started to expand business in the emerging markets and
Cottonfield that provides clothing for males has been launched in Chinese market. It
must be mentioned that IC Company has already been introduced in China by InWear
brand for few years.
In 2008 IC Companys has experienced the third major change in management in the
company's short history. Due to depressing growth in bottom line, Niels Mikkelsen was
appointed as a new CEO, and Donald Cleemann and Chris Bigler got promoted to fire
director and CFO (RB-Børsen, 2008), respectively. Therefore IC Companys appears as
the company with a relatively short and turbulent history with several changes in
management, but also as a group with a portfolio of brands covering fashion market
today.
Page 11 of 157
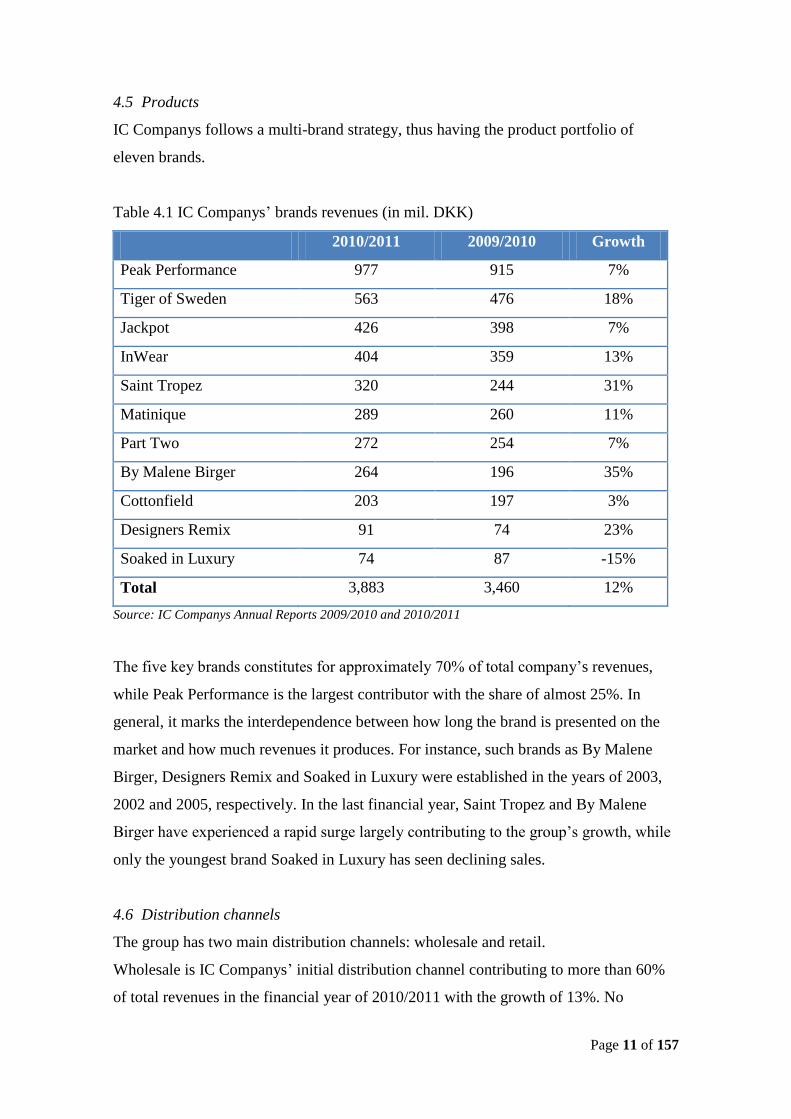
4.5 Products
IC Companys follows a multi-brand strategy, thus having the product portfolio of
eleven brands.
Table 4.1 IC Companys’ brands revenues (in mil. DKK)
2010/2011 2009/2010 Growth
Peak Performance 977 915 7%
Tiger of Sweden 563 476 18%
Jackpot 426 398 7%
InWear 404 359 13%
Saint Tropez 320 244 31%
Matinique 289 260 11%
Part Two 272 254 7%
By Malene Birger 264 196 35%
Cottonfield 203 197 3%
Designers Remix 91 74 23%
Soaked in Luxury 74 87 -15%
Total 3,883 3,460 12%
Source: IC Companys Annual Reports 2009/2010 and 2010/2011
The five key brands constitutes for approximately 70% of total company’s revenues,
while Peak Performance is the largest contributor with the share of almost 25%. In
general, it marks the interdependence between how long the brand is presented on the
market and how much revenues it produces. For instance, such brands as By Malene
Birger, Designers Remix and Soaked in Luxury were established in the years of 2003,
2002 and 2005, respectively. In the last financial year, Saint Tropez and By Malene
Birger have experienced a rapid surge largely contributing to the group’s growth, while
only the youngest brand Soaked in Luxury has seen declining sales.
4.6 Distribution channels
The group has two main distribution channels: wholesale and retail.
Wholesale is IC Companys’ initial distribution channel contributing to more than 60%
of total revenues in the financial year of 2010/2011 with the growth of 13%. No
Page 12 of 157
customer accounts for more than 3% of the group’s wholesale revenues, meanwhile the
largest single supplier constitutes for 7% of the total production value (IC Companys’
annual report 2010/2011). Therefore, there is no significant dependence on customers
and supplier.
Retailing is the group’s second major distribution channel which accounts for 1,530.6
mil. DKK in the financial year of 2010/2011 that is equivalent to 40% of total turnover.
As of 30th
June 2011, IC Companys runs 289 retail stores, therefore being presented in
20 countries, primarily in Denmark, Sweden, Benelux countries and Eastern Europe.
Retail revenues experienced an increase of 11% in comparison with the previous
financial year.
The network of outlets is an integral part of the company’s distribution channel as they
allow for more flexibility – any product that cannot be sold through own outlets are sold
to brokers for resale outside the company’s established markets (IC Companys’ annual
report 2009/2010). As of 30th
June 2011, the group runs 28 outlets giving 184 mil. DKK
in total earnings with an increase of 11%.
4.7 Markets
IC Companys’ sales made through its own sales subsidiaries and exports to more than
40 different countries through agents and distributors. Responsibility for the sale is
embedded locally in the respective countries, while in Denmark fire management has an
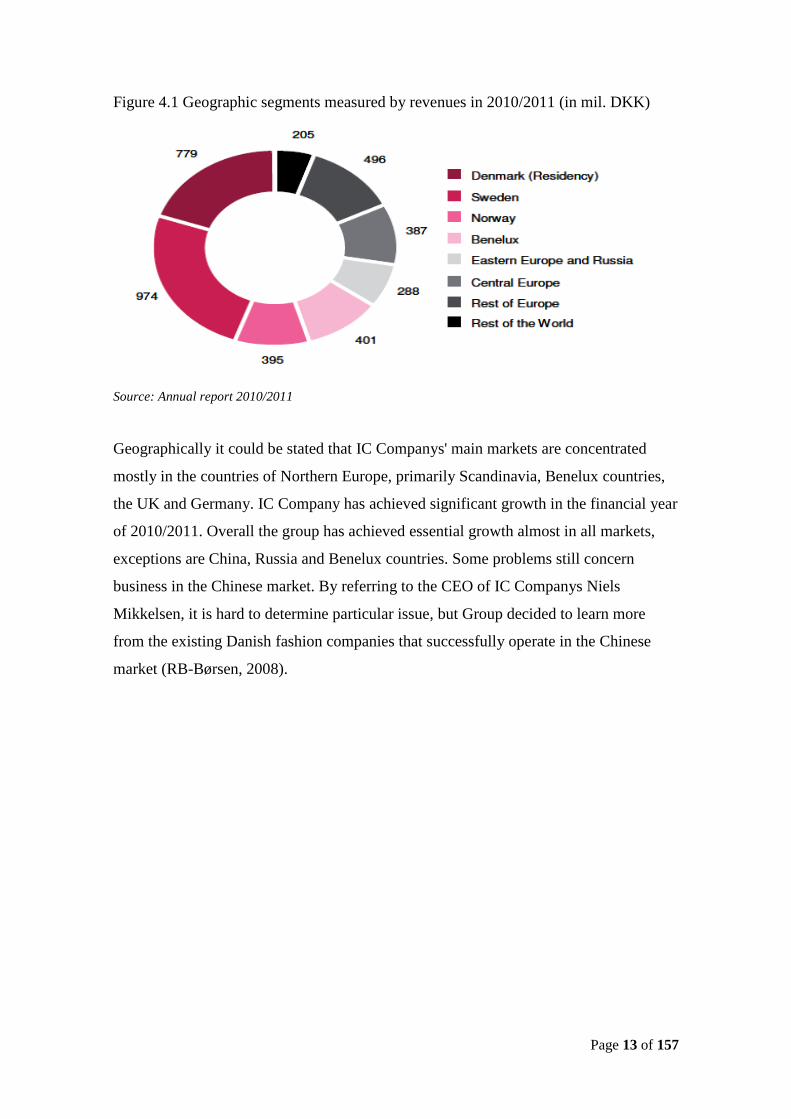
overall global responsibility. By referring to figure 4.1 it could be calculated that the
group's total turnover is 80% outside Denmark and 45% outside Scandinavia.
Page 13 of 157
Figure 4.1 Geographic segments measured by revenues in 2010/2011 (in mil. DKK)
Source: Annual report 2010/2011
Geographically it could be stated that IC Companys' main markets are concentrated
mostly in the countries of Northern Europe, primarily Scandinavia, Benelux countries,
the UK and Germany. IC Company has achieved significant growth in the financial year
of 2010/2011. Overall the group has achieved essential growth almost in all markets,
exceptions are China, Russia and Benelux countries. Some problems still concern
business in the Chinese market. By referring to the CEO of IC Companys Niels
Mikkelsen, it is hard to determine particular issue, but Group decided to learn more
from the existing Danish fashion companies that successfully operate in the Chinese
market (RB-Børsen, 2008).
Page 14 of 157
5. Strategic analysis
In order to identify state of the company in relation to external and internal drivers it is
decided to conduct main models in strategic analysis. As an external analysis it is
referred to PESTEL model with the aim to identify the macro-environmental factors that
influence IC Companys’ business in all aspects. Additionally, Porter’s five forces model
is applied to conduct an industry analysis.
PESTEL analysis is mainly used to examine 6 different aspects of the macro-
environment which are Political, Economic, Socio-cultural, Technological,
Environmental and Legal.
Main target of Porter's five forces is to identify the overall industry attractiveness and its
aspects of profitability. There are five general points to examine industry conditions and
they are: the competitive rivalry among existing competitors, the bargaining power of
the suppliers, the bargaining power of the customers, the threat of the substitute
products and services, and the threat of new entrants.
Beside the external analysis it has been planned to go through internal analysis with the
aim to examine the chosen company's strengths and weaknesses. That is why Value
Chain analysis, which has been developed by Michael Porter in 1985, is conducted.
Value chain analysis mainly discusses issues concerning generic value-adding activities
of an organization. The primary activities include: inbound logistics,
operations/production, outbound, marketing & sales and service; while supportive
activities consist of infrastructure, human resource management, technology
development and procurement.
In the conclusion results from both external and internal analysis are summarized,
where the output of external analysis allows identifying threats and opportunities, and
internal analysis results determine a company’s strengths and weaknesses.
Both results are combined in the SWOT analysis in order to perform the clear and
objective image of the target company.
Page 15 of 157
5.1 PESTEL Analysis
The purpose of the following analysis is to investigate IC Companys’ macro-economic
aspects that could have an impact on the group’s opportunities and threats as well as its
capability of adjusting to particular environmental factors. PEST analysis reviews the
macro-environment that has the supreme influence on the apparel industry and therefore
on the Group’s strategic position since the clothing industry is considered to be highly
cyclical sector. Specifically, the factors reviewed in this model are Political, Economic,
Socio-cultural, Technological, Environmental and Legal (Kotler & Keller, 2006).
Despite the fact that originally the model reviews each part individually, it is widely
assumed to combine Political and Legal parts of the model in one as well as Technology
and Environment since there have many similarities.
5.1.1 Political and Legal factors
Stability and predictability of a political system any company operates in are vital
requirements for an enterprise to succeed. As IC Companys is an international
company, the Group is highly exposed to political and legal changes in various
countries and thus production, distribution and sales could be extremely influenced by
these factors.
The major part of the company’s sales are conducted in Northern and Western Europe
(IC Companys’ annual report 2010/2011), which are characterized by a steadfast
political environment and relatively similar legal factors. Furthermore, Denmark’s
membership in the EU leads to the uniformity in the legislation. Therefore, it is unlikely
that the Group could face any political and/or legal issues negatively affecting sales.
On the other hand, the major portion of the company’s production is located in China
(including Hong Kong), which accounts for 69%, whereas rest of Asia and Europe
provide 18% and 13%, respectively (IC Companys’ annual report 2010/2011). Thus, the
Group is exposed to risks of political and cultural aspects; meanwhile the main reason
for outsourcing to the Asian region is favorable wage levels and a specialization in
production of clothing. In favor of China says the fact that both Denmark and China are
the members of the World Trade Organization, which actively tries to eliminate trade
barriers among member countries, thereby the EU did not extend the quota system for
goods manufactured in China, which had been introduced in the summer of 2005,
replacing it by a continuous supervision in 2008 (IC Companys’ annual report
2007/2008). Therefore, there are no artificial bureaucratic barriers to Chinese import.
Page 16 of 157
The outsourcing might be exposed to certain commercial risks. One of them is a steadily
increasing wage level in Asian region. Though, it is still lower than in Europe, but it is
just the question of time and the outsourcing to Asian companies might become
deterrent in the foreseeable future.
To sum up, there are not any serious political or legal issues that might affect the Group
negatively.
5.1.2 Economic factors
As it was mentioned before, the garment industry is highly cyclical and primarily
depends on the level of consumer disposable income that in turn follows economic
conditions. In the following part, economic conditions in the company’s main markets
are examined: Scandinavia (Denmark, Sweden and Norway) and two major and growth
potential markets (Russia and China).
Denmark
According to Nordea’s Economic and Market Outlook for May 2012, the Danish
economy is heading to prosper times. Unemployment is decreasing and consumers are
sensing the rise of better things. The Danish economy is expected to expand gradually
throughout 2012, principally driven by higher consumer spending and firm public
investments. In 2013, the growth must accelerate more broadly grounded on a growing
demand from other countries and higher domestic investment activity. Thus, the
economic outlook for GDP is positive: 1.25% and 1.75% in 2012 and 2013,
respectively.
Housing market trends will be crucial for the Danish economy going forward.
Unfortunately, the price declines in the Danish housing market have accelerated again
in recent months. However, there is a strong belief that house prices will stabilize
towards the end of this year converging to the long-term equilibrium level. Thus,
housing market activity looks to make a positive net contribution to growth of the
Danish economy in the coming years.
Macroeconomic situation is kept in proper perspective by the Danish government which
has managed to sustain robust balances in the form of a record-high current account
surplus, low gross public debt and historically large currency reserves. Having the status
of safe haven, Denmark has been taking advantage of this by luring historically cheap
funding of the government debt (Nordea Markets, 2012).
Page 17 of 157
Sweden
Sweden is the major market for IC Company, thus economic conditions there are very
significant. Data in the first couple of months of 2012 give a mixed picture. Export has
increased by 6.8% in 2011 and the unemployment rate declined to 7.5% in 2011
compared to 8.4% in 2010; however, it is still essentially higher than what the Swedish
Central Bank considers normal of about 6.5% (Nordea Markets, 2012).
As export-oriented country, Sweden is highly vulnerable to external economic
conditions and uncertainty concerning international developments negatively affects
further recovery following the financial crisis in 2008-2009. Thereby, the GDP growth
for 2012 is expected at 0.5%, while the forecast for the next year is more optimistic and
GDP is predicted to rise 2.2%.
Due to the weak external environment, the main growth engine might be domestic
demand, in particular, private consumption. Real household disposable income is
forecast to grow 2.0% and 2.1% in 2012 and 2013, respectively, what is a reassuring
factor for consumption sectors and particularly for the Group (Swedbank, 2012).
Norway
In the near future, the Norwegian economy undergoes a modest increase of GDP at
2.7% in 2012 and 2013, respectively. The major contribution comes from private
consumption and petroleum investments.
In recent years, high real wage growth has been supported by strong expansion in terms
of trade and partly also by growing productivity, but going forward these drivers have
been depleting. However, it is projected that annual real wage growth will stay at 4.0%
through 2013 what is below the average level over the last 12 years.
Oil and energy related sectors are booming again mainly driven by high oil prices. It is
expected that in coming years a barrel price stays much higher than 100.0 USD, thus
improving prospects for the Norwegian economy.
The unemployment rate will stay low with moderate rise in coming years, but below
4.0% what is the lowest level in Scandinavia (DnB Nor, 2012).
Russia
The Russian economy is performing satisfactory, but it encounters some difficulties
going forward. In 2011, the economy expanded by 4.3% while the unemployment rate
Page 18 of 157
lowered reaching 6.5% and inflation stayed at surprisingly high level of 8.4% (IMF,
2012).
Amid the global economic slowdown, growth is likely to be somewhat slower in
coming years, but seems to be sustained at reasonable levels backed by still-high oil
prices (OECD, 2012). Slower growth in Europe fighting debt contagion and China
trying to switch to domestic consumption will have a negative impact on the volume of
exports, where about two-thirds of exports consists of energy related goods.
Wage growth has been higher than inflation that also contributed to rising consumer
spending. In addition, a rising value of the currency has played a disinflationary role
boosting consumption. Moreover, fiscal policy has recently been expansionary before
the presidential election. On the one hand, it will contribute to economic growth; on the
other hand, budget deficit will become obvious if oil prices suffer from sharp decline
(Deloitte, 2012).
To sum up, prospects for economic growth remain positive with GDP expansion of
4.0% in 2012 and 3.9% in 2013 and decreasing jobless rate to 6.0% in both 2012 and
2013.
China
In the years following the financial crunch of 2008-2009, China has become the engine
of the world economy contributing the major share to the global growth. Therefore, the
scenario of a sharp tumble in Chinese economic activity is a significant risk, especially
with Europe already in downturn (Royal Bank of Canada, 2012). However, these
prospects are highly unfeasible unless the world economy experiences new turmoil
compared to what happened in 2008-2009.
Growth has continued to ease in emerging Asia largely attributable to weak foreign
demand particularly from advanced countries. China’s first-quarter GDP numbers
(+8.1%) were gently weaker than anticipated due to deteriorating foreign demand, but it
is expected that the Chinese economy has experienced temporary issues and should pick
up in the coming years expanding by 8.2% and 8.8% in 2012 and 2013, respectively
(IMF, 2012).
Meantime, inflation has receded as the result of monetary and lending steps, thus it is
projected to trend down to 3.3% in 2012 and 3.0% in 2013 what is significantly lower
than 5.4% in 2011 (IMF, 2012). Unfortunately, consumer prices have little room to ease
further due to high oil prices (Banco Bilbao Vizcaya Argentaria, 2012).
Page 19 of 157
Summary
The Northern Europe accounts for the major part in IC Companys sales and economic
conditions in this region are of great significance for the company. According to various
prospects, 2012 and 2013 are the years of continuing recovery and the same issues
coming from the Southern Europe. Scandinavian countries which are highly vulnerable
to external sentiment in terms of export volume have been staying a safe haven in times
of extreme turbulence and it seems that necessary adjustments have been made in order
to get back on the growth rails.
Russia and China are two enormous markets with unrealized potential and the Group’s
management has to develop appropriate strategies to succeed there. Meanwhile the
steady growth in China is also a challenge for the company since production expenses
might jump as a result of general wage level increase.
Foreign Currency Exposure and Interest rate risks
IC Companys is exposed to essential exchange rate risks which arise through purchase
of supplies and sale of goods in foreign currencies. The major part of the company’s
purchase of supplies comes from the Far East and denominated in USD and USD-
related currencies while the main share of the sales and capacity expenses are expressed
in DKK, SEK, NOK and EUR. Given currency model causes concerns especially in the
times of financial crises since USD often appreciates and revenue currencies (SEK,
NOK and PLN) depreciate (IC Companys’ annual report 2010/2011).
Therefore, the Group hedges all material transaction risks on a trailing 15-month
horizon, primarily using foreign exchange forwards and/or options (IC Companys’
annual report 2010/2011).
The company’s interest rate risks are related to the Group’s interest-bearing assets and
liabilities. Those risks are managed by acquiring loans with a floating or fixed rate
and/or financial instruments such as forward rate agreement and/or interest rate swaps
with typical neutral maturity of 2 months (IC Companys’ annual report 2010/2011).
5.1.3 Socio-cultural factors
Nowadays, consumer behavior has been changing swiftly; however, it is quite often
occurs that fashion trends recur with some new features. Moreover, boundaries between
male and female fashions have been blurring. Low customer loyalty and allegiance to
brands are common (McKinsey & Company, 2011).
Page 20 of 157
Another trend in the fashion world that proves low customer devotion is mix of
products from different price segments. For instance, depending on consumers’
preferences in the fashion the mix of cheap no-name clothes with high-priced high-end
garment is more frequent.
Therefore, it is vital that the Group persists to concentrate on innovation, diversity and
brand development. The company’s collections change at a minimum of four times a
year. For example, Saint Tropez develops 10 collections a year with ongoing deliveries
and just 3 months from sketch to store rack allowing the design team to respond to the
latest trends (IC Companys’ annual report 2010/2011).
Another positive aspect which plays in favor of IC Companys is its multi-brand
strategy. The following model allows determining various target groups’ needs.
Though, in the fashion industry it could be problematic to focus on a specific target
group as the behavior of specific target groups is not always predictable. Furthermore,
various groups sometimes overlap.
Thus, these aspects have been taken into account by IC Companys while creating its
multi-brand strategy which leads to a brand portfolio correction and managing in regard
to price, consumer taste and behavior.
5.1.4 Technological and Environmental Factors
Technology
In the apparel production, the technological level and thus quality is an essential aspect.
Since the Group’s production primarily occurs in developing countries of Asia and
Eastern Europe, it mainly relies on manual tailoring. In the foreseeable future,
production of high volume will be realized by usage of machinery when workflow
could be facilitated and quality ameliorated.
Moreover, in regard to retail business adapting of next-generation technologies is
almost unlimited and might give a competitive advantage. Such innovations as
electronic shelf labeling, digital promotional displays, self-checkout and sales kiosks
could change how fashion companies relate to their customers (McKinsey & Company,
2011).
IC Companys is technologically dependent on reliable IT systems for the day-to-day
business operations as well as to ensure control of product sourcing and to enhance
efficiency throughout the company’s supply chain. IT support in all aspects of sourcing,
Page 21 of 157
distribution, logistics, administration and sales makes it possible for the individual
brands to focus on the creative and commercial development aspects (IC Companys’
annual report 2010/2011).
The other aspect of technological factor is e-commerce. The idea that the Group’s
websites are used for both sale and demonstration is essential for enhancing company’s
performance. Currently, all company’s eleven brands have their websites where any
customer may get necessary information, compare prices and conduct purchase.
In general, online trade in Denmark has been experiencing two-digit growth in last
couple of years reaching 46 bil. DKK in 2011 (Ekstrabladet.dk, 2012) from 20 bil. DKK
in 2007 (Computerworld.dk, 2008). Thus, e-commerce becomes an essential
distribution channel with massive potential and direct customer contact. Therefore, IC
Companys has been investing substantial amounts of funds in developing IT systems to
enhance its online sales.
Environment
Since August 2011, IC Companys has participated in the United Nation’s Global
Compact working on Corporate Social Responsibility (CSR). It is a voluntary initiative
for private businesses that are committed to dealing with some of the major social and
environmental challenges. Therefore, the Group has been focusing on five areas: human
rights, labor, anti-corruption, animal welfare and environment. The environmental part
implies the company’s policy regarding environment exploiting and supporting of the
prevention of pollution and use of harmful chemicals in products undertaking initiatives
for promoting greater environmental responsibility and encouraging the development
and diffusion of environmentally friendly technologies (IC Companys’ annual report
2010/2011).
Furthermore, IC Companys has decided to undertake a number of comprehensive
measures to ensure that consumers feel safe when wearing company’s garments.
Therefore, the Group performs a set of strict procedures (IC Companys, 2011):
1) Increase of tests number to test whether company’s products have a risk of
increased permitted values of chemical residues. Furthermore, performance of
spot checks on remaining products will be implemented;
2) Transfer of tests to the production countries implying that the products will
never reach the consumers if findings indicate chemical residues above the
Page 22 of 157
permitted values. Until the new procedures have been undertaken in, for
instance, India and China, the test products will be transported to Denmark by
plane to have the tests performed before the product lines leave the production
countries;
3) Enforcement of new stringent requirements on suppliers. The number of
suppliers will be reduced in the nearby future leading to working with only the
most responsible ones enhancing even better quality.
5.2 Porter's five forces
After defining the industry’s boundaries for the target company, above mentioned
Porter’s five forces analysis allows managers to identify competitive advantages in
order to operate more efficiently. By referring to Michael Porter (1980), it could be
stated that if each force intensifies and gets stronger that limits an ability of established
companies to raise prices and increase its earnings. It indicates the fact that if
competitive forces intensify that increases a threat factor for existing companies in an
industry. The power of these forces changes over time by creating new opportunities
and threats which is challenging for managers to formulate relevant strategic planning
with attempt to minimize the threats and to take advantage of the opportunities (Hill &
Jones, 2010). Each of the five forces in relation to the chosen IC Companys and the
industry it operates in are elaborated below.
Page 23 of 157
5.2.1 The threat of the new entrants
There are several requirements for the new entrants to establish their business in the
particular industry. It is assumed to introduce more relevant requirements for the
apparel industry such as investment, brand name, production and distributions
channels. Apparel industry might be assumed as fragmented industry where
standardized fashion is produced in large volume, exclusive collection and high-end
fashion products are produced in low volumes. A barrier overcoming for the new
entrant mainly depends on which end of scale to launch the apparel business from. By
capturing correct trends at the right time, might be possible to enter the market without
having high capital or preferred brand. The ones who want to enter the standardized end
of the apparel market targets a price sensitive customer group that prefers the cheapest
product than expensive high-quality and well-known brand. The existing competitors in
such a segment are those leading in cost leadership, which have expertise in that field
and well-established cheap production facilities. Apparel companies that target price
sensitive customers mostly focus on cost-cutting management and strive to produce
with very low expenses in order to fit into cheap and affordable less expensive products
price interval.
Threat of the new entrants at the low end of apparel industry assumed not to be so
strong in sense of creating high competition since the low end apparel producers
compete not with quality, but with quantity and have already established stable
distribution channels and the cheapest supplies by gaining discounts what might be
complicated for new entrants at the beginning.
On the other end of the apparel industry where prices are too high or mid-upper
segment, existing competitors strive to differentiate their products as differentiation
counts as one of the main barriers for new entrants. By altering its products
manufacturing a company might achieve a premium price and additional cost might
occur if a company has higher quality, better brand or design than its rivals. Indeed,
these factors require significant capital as brand loyalty builds up on customers’
perceptions by investing and using its experience that is earned throughout the years of
satisfaction of customers’ needs and desires. There are already some customer groups
who have defined their preferable brand. It might be assumed that capital is not very
important factor in the high-end price segment since the differentiation and brand image
are more essential.
Page 24 of 157
Concerning the Group, IC Companys mostly operates in the high premium and upper-
mid class segment. Referring to annual reports, IC Companys’ management sets up a
target to be the best developer of sports and fashion brands what means the Group has
decided to focus mostly on building strong brands for high-end customers (IC
Companys’ annual report 2011/2012). It is assumed that the threat of the new entrants
carries less risk for IC Companys since new entrants usually are small businesses or
companies that probably will not be able to compete directly and might capture only a
small market share. However, on the other side, it has to be supposed that the threat
might come from the other bigger competitors who have significant capital and
expertise in the apparel industry. For example, American apparel company, GAP Inc., is
the one of the world's largest apparel retailers that operates four other brands: Banana
Republic, Old Navy, Piperlime and Athleta. Despite the fact that GAP operates
internationally, they have not entered Scandinavian apparel market yet. It might be
assumed that these kinds of potential new entrants are the threat for the IC Companys. It
has to be mentioned that there are few large companies that might be able to capture
significant share in the Scandinavian apparel market.
5.2.2 Bargaining power of the suppliers
In apparel market the bargaining power of the suppliers has been declining due to the
fact that main textile manufactures and producers have been dislocating their businesses
to the emerging markets where production costs are low. China is one of those countries
that lures with lower cost supplier channels. Mentioning IC Companys’ supplier
channels, it could be stated that the major part of supplies comes from IC Companys’
own shared sourcing offices in China, Bangladesh, Vietnam, India and Romania. 69%
of the production belongs to Chinese supply, with 18% to the rest of Asia and just 13%
to European market. By using its own shared sourcing offices IC Companys has made it
possible to handle geographic sourcing options safely and quickly. Indeed, the Group
could easily move its production wherever the combination of price, quality and supply
stability is the best (IC Companys’ annual report 2010/2011). There are usually some
risks of switching suppliers in relation to quality and credibility. In fact, IC Companys’
management stands for credibility of the production in its own shared sourcing offices.
It has to be mentioned that IC Companys has recently implemented a new sourcing
structure of which the object is to reduce the number of suppliers and improve
efficiency and flexibility. The key element of this new structure is the systematization of
Page 25 of 157
the Group's sourcing while at the same time adapting it to the efficiency and flexibility
required by the organization’s new set up (fibre2fashion.com, 2011). But independence
of suppliers has been reducing IC Companys’ power and influence on the suppliers in
terms of volume discounts, improved credit term, etc. Still suppliers’ bargaining power
is very limited. That is why it has been concluded that in the apparel industry, suppliers
have very insignificant influence on the price regulation and thereby has relatively weak
bargaining power.
5.2.3 Bargaining power of buyers
In order to analyze the bargaining power of the buyers it is decided to define customer
segment that IC Companys deals with. That is why, first of all, IC Companys’
distribution channels must be reviewed. There are two distribution channels, wholesale
and retail (franchise, e-commerce, outlets). Wholesale accounts for 61% of revenues in
2011, while retail captures the rest of sales. Both have showed significant growth of
13% and 11%, respectively (IC Companys’ annual report 2010/2011). IC Companys’
customers do not account more than 3% of the wholesale revenue which means total
sales are independent of particular customer as a result of diversity in the strategic
management. As it has already been stated IC Companys belongs to the upper-mid
segment and high premium brands. That is why its target customers also represent
higher or upper-mid class, which is not usually price sensitive comparing with preferred
high-quality and defined brands. It could be assumed that IC Companys’ apparel
belongs to luxury category where buyers usually do not have significant bargaining
power. Buyer might have bargaining power if other rivals in the wholesale market
intensify competition producing similar apparel, but with lower price. By implementing
the multi-brand strategy IC Companys focuses on each brand and educates its
employees to perform high service and expertise relating to each brand. But still there
are some buyers that might switch from preferred brands to other apparel products in
case of personal image changes and design preferences. As it is supposed even though
IC Companys strives to build strong and valuable brands, their buyers are not counted to
be "brand loyal" customers which means that brands from various producers might also
satisfy IC Companys buyers. In that case such buyers will have some degree of the
bargaining power.
Page 26 of 157
5.2.4 Threat of Substitute products and services
As competition intensifies and buyer becomes more price sensitive, the threat of
substitute products and services increases in major markets. By taking into
consideration the existence of such rivals as Inditex, Bestseller, BTX Group, which
produce upper-mid and middle class garments that might substitute products of IC
Companys' respective brands. Indeed, four out of eleven brands (Tiger of Sweden, Peak
Performance, Designers Remix Collection and By Malene Birger) stand for affordable
luxury, where the rest seven brands (Part Two, InWear, Cottonfield, Jackpot, Matinique,
Saint Tropez and Soaked in Luxury) present less expensive modern clothing. On the
high-end the threat of substitute assumed to be less significant as this group of buyers is
not price sensitive, therefore it is unlikely that they could switch to another seller due to
price difference. Indeed, consumers’ needed design and taste might change over time,
thereby influencing a switching from one brand to another. In order to reduce the
switching threat IC Companys educates its labor to focus on premium service that
creates strong brand image among the other competitors’ brands. It might be assumed
that if to consider both middle class and affordable luxury segments, to some extent the
threat of substitutes significantly exists.
5.2.5 Competition among the existing rivals
There are some vital factors that influence behavior of the players in the apparel market.
Industry concentration and growth have direct impact on competition intensity.
Industry concentration
Apparel market is one of the markets characterized by many suppliers with various
market sizes. The global apparel market consists of numerous smaller enterprises
operating internationally and several major companies that operate globally. Owing to
many entities in the apparel industry even the major market participants such as US
GAP, Swedish H&M and Spanish Inditex have relatively low global market shares that
indicates the high industry concentration. High industry concentration intensifies
competition and increases the market attractiveness.
Industry growth
Market growth for the apparel industry could be examined from different aspects.
Through the historical data it could be seen that the global apparel industry had total
Page 27 of 157
revenues of $1,175.4 billion in 2011, representing a compound annual growth rate
(CAGR) of 2.7% between 2007 and 2011. According to forecasts, the global apparel
retail industry is forecasted to earn a value of $1,348.1 billion in 2016 with an
anticipated CAGR of 2.8% for the five-year period (Companiesandmarkets.com, 2012).
The female wear segment was the industry´s most lucrative in 2011, with total revenues
of $600.5 billion, equivalent to 51.1% of the industry´s overall value.
Beside the hard data calculations and historical financial numbers there are many other
external factors that have an impact on the future growth prospects of the whole apparel
industry. Some external influencing drivers which increase uncertainty about positive
outcomes might be political, economic, technological and environmental issues that
have been already described in the PESTEL model. Report, published in Stitch Times in
2011, states that "The apparel industry and market really are at a tipping-point" meaning
that apparel industry has reached a level where the scenarios of stagnation, growth and
recession are quite real.
In order to identify the level of competition among the main rivals of IC Companys it
has to be determined the main target customer groups and respective geographic areas.
As it is stated in the company’s report, IC Companys focuses on the development of
fashion brands and sport apparel, meanwhile 65% of the annual turnover is created from
sales in Scandinavian and Benelux countries. Main competitors in the defined market
sector are Bestseller, Zara from Inditex group, Hennes & Mauritz AB.
Even though each rival strives to add value to its brand portfolio by increasing quality
and concentrating on modern fashion, the target customer groups still are not considered
as loyal customers what means a brand switching and mixing is a normal tendency for
the middle class and affordable luxury class consumers. That is why in order to gain
share in the apparel market through rough competition, the company might use an
expansion strategy and try to operate more new stores in the emerging markets.
There are some issues concerning the Chinese market where IC Companys’ sales have
been decreasing and the company experiences a relatively negative pace of business
development.
It could be concluded that there is harsh competition in the apparel industry and IC
Companys strives to capture market share by using growth strategy in the potential
emerging markets.
Page 28 of 157
5.3 Internal analysis
With the aim to create a clear picture and to better understand the activities through
which IC Companys develops a competitive advantage and creates value to its
shareholders, it is decided to proceed with value chain analysis, which defines a
company's strengths and weaknesses.
In his book "Competitive Advantage" published in 1985, Michael Porter presents
generic value chain model which consists of primary and supportive activities
(Netmba.com)
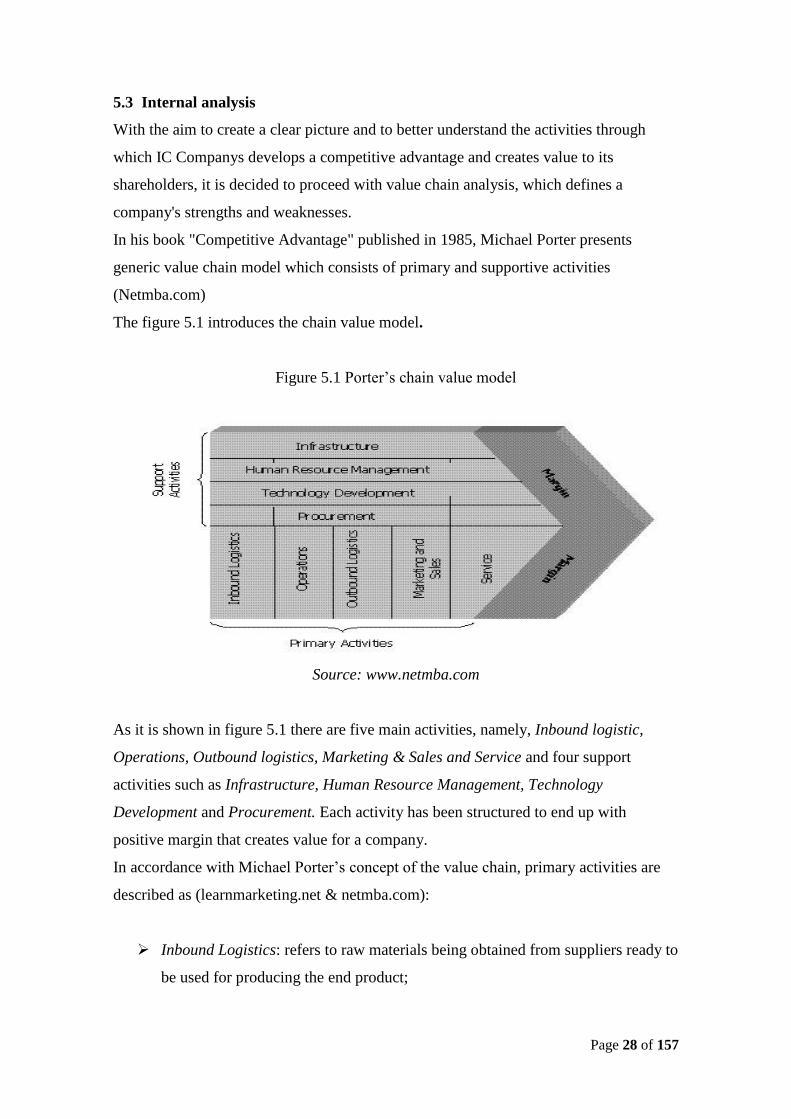
The figure 5.1 introduces the chain value model.
Figure 5.1 Porter’s chain value model
Source: www.netmba.com
As it is shown in figure 5.1 there are five main activities, namely, Inbound logistic,
Operations, Outbound logistics, Marketing & Sales and Service and four support
activities such as Infrastructure, Human Resource Management, Technology
Development and Procurement. Each activity has been structured to end up with
positive margin that creates value for a company.
In accordance with Michael Porter’s concept of the value chain, primary activities are
described as (learnmarketing.net & netmba.com):
Inbound Logistics: refers to raw materials being obtained from suppliers ready to
be used for producing the end product;
Page 29 of 157
Operations: include processes of transforming raw materials into finished
products and services;
Outbound Logistics: once the products have been manufactured they are ready to
be warehoused and distributed to customers;
Marketing and Sales: identification of needs targeted towards the correct
customer group. Marketing is used to establish an efficient strategy, thus
enhancing the generation of sales;
Service: after the product has been sold, the organization has to offer support
services. They might include such activities as after sales training, warranties
and guarantees.
The supportive activities assist the primary activities in aiding the organization to
achieve its competitive advantage. Aforementioned activities are supported by:
Firm Infrastructure: it is the set of various activities such as organizational
structure, control systems, company culture, etc., to ensure that the entity’s
finances, legal structure and management structure works efficiently enhancing
value creation;
Human Resource Management: in order to succeed in its objectives, the
organization needs to hire, train and develop its employees. Staff has to be
motivated and compensated properly if they are to stay with an organization and
add to it;
Technology Development: technologies are exploited to support value-creating
activities. It is used to reduce cost thus adding value; in research and
development to evolve new products and via the use of the Internet so customers
have access to online facilities;
Procurement: purchasing inputs such as raw materials and equipment obtaining
the best combination of price and quality.
To summarize, the value chain covers the whole entity and focuses on how primary and
supportive activities could cooperate together effectively in helping the organization to
gain an exceptional competitive advantage.
According to the Group’s operational model, it has been decided to adjust its primary
activities with the aim to comply with the steps of the value chain model.
Page 30 of 157
The first modification is the examination of the additional activity taking place before
Inbound Logistics such as Design. The main reason to start with this phase is related to
specific features of the fashion industry. Before placing orders in manufactures, garment
companies have to develop design of new collection.
5.3.1 Primary activities
5.3.1.1 Design
The design process includes designers’ creativity and inspiration coming alongside with
analysis of sales in stores. By examining data from individual stores, designers might
track customers’ preferences observing sales in each individual store. Following this
procedure, designers analyze fashion trends and gather inspiration for implementing
acquired ideas in new collection, therefore, to satisfy consumers’ desires.
5.3.1.2 Inbound Logistics and Operations
Inbound Logistics and Operations combine Outsourcing and Quality Control stages due
to the fact that IC Companys does not have its own production facilities. Instead of it,
the Group employs suppliers through its own shared sourcing offices which conduct
preliminary research with the aim to develop a unique flexibility. It implies the handling
of geographic sourcing alternatives safely and quickly, thereby moving production to
the most beneficial facilities in Eastern Europe and Asian countries.
As the final step just before manufactured apparel leaves production lines, some
examples of apparel have to pass quality tests conducted in Denmark. If apparel meets
quality requirements, it is ready to be delivered.
5.3.1.3 Outbound Logistics
Fashion industry is heavily dependent on delivery of products at the appropriate time
with convenient circumstances. There are two main distribution channels in IC
Companys, wholesale and retail, where the Group is liable by contract to deliver
finished goods from the sourcing countries directly to the wholesale customers within
the determined time range. In a case when demanded products do not reach the store
shelves at the right time, issues arise concerning the returned and surplus products that
create negative impact on sales thereby resulting in write-downs.
Page 31 of 157
Products to be realized through the Group’s retail channels are transported on container
lines to Europe where IC Companys has three large warehouses. Modern warehouse in
Brøndby that deals with the flat packages, a warehouse at Raffinaderivej, which handles
the Group’s hanging products, both located in Denmark, and a warehouse in Lódz,
Poland, responsible for surplus products and marketing material.
In general, the company’s products are handled in two ways: either distributed in flat
packages or hanging. The majority, approximately 90% of goods sourced in Asia, is
transported on container liners to Europe while the rest is sent by air freight. All the
merchandise sourced in Europe is transported by truckage (IC Companys’ annual report
2010/2011).
5.3.1.4 Marketing and Sales
Marketing
As stated before, IC Companys follows the multi-brand strategy when each brand has a
market-oriented management that handles market positioning, product development and
marketing – the activities that are essential to the development of each brand identity
and constitute the decisive factors for the customer’s decision to buy (IC Companys’
annual report 2009/2010).
Needless to say that the multi-brand strategy provides great opportunities, when brand
managers could concentrate on respective brand positioning and development acting in
line with a thoroughly planned brand strategy with a clearly defined fashion position
and market approach in accordance with the company’s business principles which
reduces the total business exposure. Moreover, each brand adds value by being a part of
IC Companys’ portfolio thus delivering financial results to the Group (IC Companys’
annual report 2010/2011).
Brands position themselves differently with respect to consumer groups, price horizon
and quality. In return, the Group covers various parts of the fashion market since brands
supplement each other. Therefore, brands could market themselves into various
segments and price levels thus boosting sales.
With the aim to gain more awareness, IC Companys has created showrooms for all its
eleven brands for displaying new collections to current and potential customers.
Over several years, the Group has been headquartered on Amager, in an area that is now
transforming into a regular fashion district in Copenhagen, where more than 30 different
Page 32 of 157
Danish and international brands are presented in 16 individually designed showrooms
(modebranchen.nu, 2012).
Sales
The key focus for all brands is to achieve sales growth and build equity while
prioritizing investments with respect to return on investment and enforcing tight cost
control (IC Companys’ annual report 2010/2011). The strategy of multi-branding
implies the supplement so that customers associate the individual product with IC
Companys. That gives the company a better position in the fashion market where single
brands do possess a tiny fraction of the total market, but a multi-brand company holds a
substantial market share.
As mentioned above, IC Companys uses two channels of distribution, namely,
wholesale and retail. Wholesale dealers sell other brands apart from the Group’s ones.
As a part of wholesale activities, they include franchise stores which pay to IC
Companys to be under the company’s umbrella. The second type of distribution channel
is retail. It involves own stores, outlet stores and e-commerce.
There are shops that only sell individual brands as well as multi-brand stores selling all
the Group’s brands under shops named “IC Companys”. The network of outlets stores
surplus products and sell them during the year as the main purpose of such stores is to
realize out-of-date apparel from previous collections. Furthermore, any products that
cannot be sold through own outlets are sold to brokers for resale outside the Group’s
established markets (IC Companys’annual report 2010/2011). More hard data regarding
distribution channels are given in the Introduction under Products, Distribution
channels and Markets parts.
5.3.1.5 Service
According to authors’ experience and a short interview with IC Companys’ shop seller
who operates in Fisketorv shopping mall in Copenhagen, it could be stated that products
bought in IC Companys' shops have different service options. For example, in the shop
that operates in Fisketorv, it is possible to return product within 3 days if a receipt is
shown; however, this service does not cover products bought with discount. It also has
to be mentioned that according to the seller, other IC Companys shops have different
obligations and periods for refunding, which might vary from 3 days to 2 weeks. All in
Page 33 of 157
all, it could be concluded that service concerning warranties is different from shop to
shop.
5.3.2 Supportive activities
5.3.2.1 Firm Infrastructure
Despite quite short history, IC Companys has undergone through turbulent periods.
Since the origin of the Group, there were various changes such as the implementation of
the multi-brand strategy, the adjustment of organizational structure and the appointment
of new management team.
After the merger of Inwear Group A/S and Carli Gry International A/S, the newly
created IC Companys has followed centralized form of organization. It implies that the
common company’s management was in charge of all operations both external and
internal ones.
In 2004 the Group has adopted a new multi-brand strategy, with the objective to
maximize the return on a portfolio of independent fashion brands. A market-oriented
management of each brand became responsible for market positioning, product
development and sales. At the same time, there was launched a shared platform for the
brand portfolio which handles and supports all the supply activities that are not relevant
for each particular brand, which included such activities as sourcing, sales, production,
logistics, administration, IT, finance and HR (IC Companys’ annual report 2004/2005).
The starting financial crisis in 2007 had a negative influence on the Group’s
performance as on the whole economy. In such a challenging environment, IC
Companys has failed in cost reduction policy with respect to revenues development.
Therefore, it might be assumed that it was the main reason for the IC Companys to
change its management team.
The new management team has continued the decentralization path what resulted in
giving all 11 brands a full responsibility and power of decision making. It involves full
amenability of entire value chain, including distribution (just-style.com, 2010).
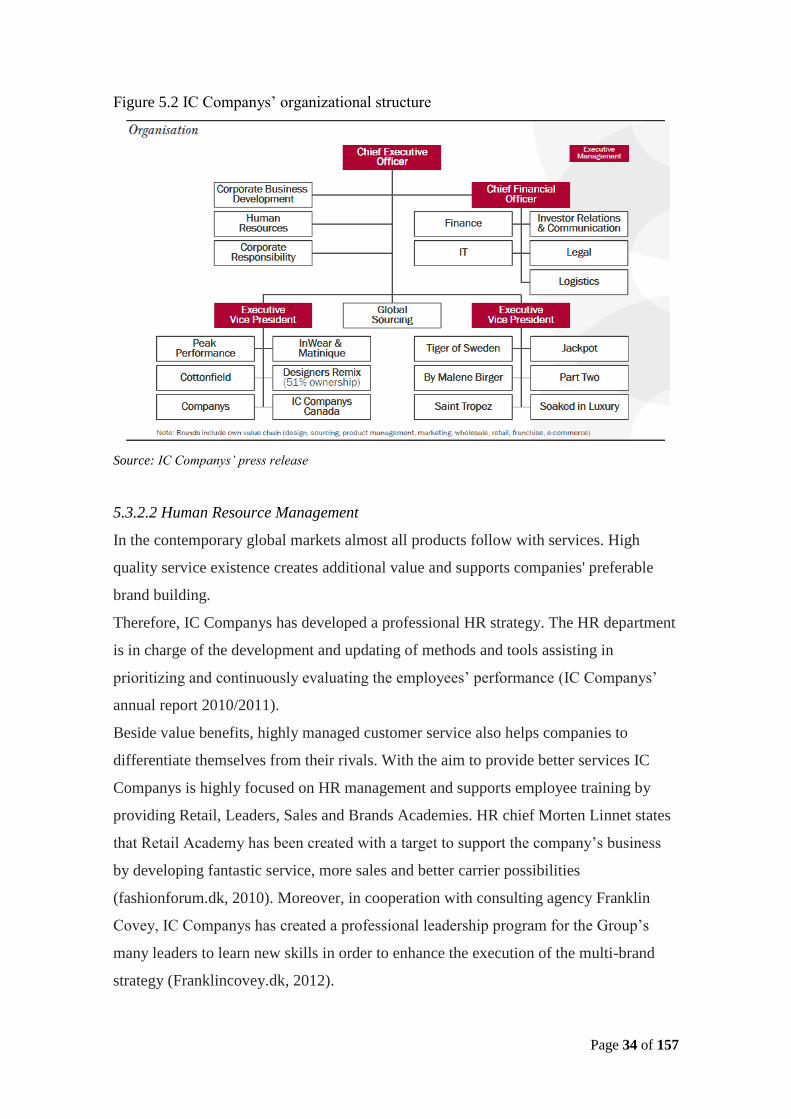
Currently, IC Companys has a two-layer organizational structure: shared service
platform and multi-brand strategy. Figure 5.2 shows separate brand organizations with
full responsibility of own value chain (IC Companys, Corporate presentation, 2012):
Page 34 of 157
Figure 5.2 IC Companys’ organizational structure
Source: IC Companys’ press release
5.3.2.2 Human Resource Management
In the contemporary global markets almost all products follow with services. High
quality service existence creates additional value and supports companies' preferable
brand building.
Therefore, IC Companys has developed a professional HR strategy. The HR department
is in charge of the development and updating of methods and tools assisting in
prioritizing and continuously evaluating the employees’ performance (IC Companys’
annual report 2010/2011).
Beside value benefits, highly managed customer service also helps companies to
differentiate themselves from their rivals. With the aim to provide better services IC
Companys is highly focused on HR management and supports employee training by
providing Retail, Leaders, Sales and Brands Academies. HR chief Morten Linnet states
that Retail Academy has been created with a target to support the company’s business
by developing fantastic service, more sales and better carrier possibilities
(fashionforum.dk, 2010). Moreover, in cooperation with consulting agency Franklin
Covey, IC Companys has created a professional leadership program for the Group’s
many leaders to learn new skills in order to enhance the execution of the multi-brand
strategy (Franklincovey.dk, 2012).
Page 35 of 157
5.3.2.3 Technology Development
Besides the factors mentioned in the PESTEL analysis, such as online sales of apparel
and descriptive websites which refer to each brand, a well-developed IT system ensures
more synchronization in the company’s operations. In fact, IC Companys has been
investing substantial funds in IT systems, specifically in SAP Enterprise Resource
Planning (ERP). The Group’s previous IT architecture consisted of several independent
systems, which were not supportive of business activity and needs for quick and
accurate financial reporting (sap.com, 2011). Thus, the two-phase implementation of
SAP ERP in the years of 2007 and 2008, has allowed IC Companys to gain control of
all economic processes in the Group such as financial management, reporting and
accounting.
As a part of SAP ERP system, IC Companys has implemented SAP Business
Communications Management to improve its customer relationships with business
communications. It implies providing efficient sales service to retail and franchise
partners (ecenta.com, 2009).
5.3.2.4 Procurement
The implementation of the multi-brand strategy led to the shifting of purchasing
function to individual brand managers. As the next step, brand managers make
purchases through the Group’s own shared sourcing offices in China (including Hong
Kong), Bangladesh, Vietnam, India and Romania and to a limited extent by the use of
agents. Therefore, it is no longer a supportive activity, but part of the primary activities
under Inbound and Operations.
More specifically, procurement activities might involve purchasing of commercial
premises, tangible goods and transport services that are related to the shared platform,
however, are not clearly related to the individual brands.
Page 36 of 157
Summary
All activities directly relating to the each brand are under the responsibilities of
respective brand managers, whereas the activities which have no relevance to brand
identity are handled through the shared service platform. Therefore, the multi-brand
strategy allows brand managers to focus on the development of the individual brand.
All in all, authors find IC Companys’ value chain optimal. There cannot be determined
any activities which do not create value and thus should be outsourced. It is reasonable
that the Group has outsourced the manufacturing function and in result could free
additional funds for creating a greater value in the value chain.
However, there is always a room for improvement in already working principles. In
order to succeed in its multi-brand strategy, each brand should overhaul all its value
chain activities. For instance, an individual brand management has to keep track of sales
to determine which products are less attractive to consumers and thus to change next
collection design ideas.
5.4 Core Competencies
According to Prahalad and Hamel, core competencies are defined as (Prahalad &
Hamel, 2009):
“…the company’s collective knowledge about how to coordinate diverse production
skills and technologies… creating unique, integrated systems that reinforce fit among
your firm’s diverse production and technology skills – a systemic advantage your
competitors can’t copy…”
After the examination of the Group’s value chain, authors have found out three core
competencies of the company: sourcing activities, the multi-brand strategy and human
resource management. These three distinguishing features are the pillars of the Group’s
business which create value and help to compete in an intensive apparel market.
Now, authors will briefly introduce each core competence. First of all, there comes the
multi-brand strategy idea to delegate brand-building activities to the individual brand
management. These individual units enjoyed autonomy in design, sales and marketing,
thus forming dedicated brand teams for the respective functions. This was combined
with a shared service platform to gain efficiencies through the joint operations of
sourcing, distribution, sales logistics, HR, IT, PR, finance, legal and administration.
Page 37 of 157
Furthermore, the multi-brand strategy allowed IC Companys to diversify risks.
Accurately predicting consumer tastes and preferences is essential to success. To reduce
risk, each brand implements the commercial and fact-based development of its
collections (Foss, Pedersen, Pyndt & Schultz, 2012).
The second core competence is sourcing activities which increase efficiency and
flexibility in the way that the brands produce in the right countries and collaborate with
the best suppliers. As a key element of the interaction with suppliers is the company’s
own shared sourcing offices which are located in the manufacturing countries
(npinvestor.dk, 2011).
Following the introduction of the multi-brand strategy, IC Companys emphasized HR as
a key focus area that could drive retail sales, enhance leadership development and
strengthen talent management efforts. The idea was realized by establishing four
academies: leaders, sales, retail and brands; meanwhile working more actively with
employee development, internal recruitment and succession planning. Such initiatives
improved internal planning, created awareness about internal career paths and as a result
strengthened the Group’s ability to retain talented employees (Foss, Pedersen, Pyndt &
Schultz, 2012).
5.5 Growth Strategy
In order to grow and generate profit a company might follow internal and/or external
growth strategies. That is why the growth strategy has been divided into two parts
where the external growth is achieved by implementing horizontal, vertical and
diversification strategies and is discussed in section 5.7.
Then the internal growth strategy, which mainly depends on companies’ strengths, is
described according to Porter’s generic framework.
Porter’s Generic Framework
One of the main and traditional growth models, Porter’s generic framework, is applied
to introduce IC Companys’ chosen growth strategy and ability of the company to
perform in the best way by using its core competencies. It is reasonable how Porter
called the model since it is not industry dependent, but mostly reflects a company’s
strengths and weaknesses. Prior to analyzing IC Company's growth strategies, it is
decided to introduce three main strategies from the model that help to define IC
Companys’ market prospects.
Page 38 of 157
By referring to Porter’s generic framework wide range of companies use one or some
combinations of the three strategies: Cost leadership, Differentiation and Focus. He
states that a company must implement one of these strategies or it might get stuck in the
middle (Porter, 1980).
5.5.1 Cost leadership
Firms that have a cost leadership strategy strive to become the low cost producer in the
industry. The sources of cost advantage vary and depend on the structure of a firm's
industry. It could range from the pursuit of economies of scale in the manufacturing
industries to the lowest overhead costs in human recourse intensive industries, e.g.
security guard services (Porter, 1980).
IC Companys’ market it operates in is highly attractive and thereby an intensive
competition force companies such as IC Companys, Inditex, Bestseller and H&M to
implement more than one strategy. IC Companys operates in the middle and upper-mid
class and its seven brands that operate in the middle class usually are targeted to price
sensitive customer groups. In order to produce with low cost IC Companys successfully
uses its own shared sourcing offices that particularly are in the charge of finding low
cost, but still corresponding to companies required quality level, manufacturing
facilities. IC Companys new strategy that has been implemented in 2010 gave more
responsibility to each brand and now sourcing is also under control of brand
management teams. It has to be noticed that besides middle price segment brands,
Group also holds high-end brands. That is why the company has to be careful with its
cost reduction strategy in order not to deteriorate product quality of IC Companys’
affordable luxury brands.
5.5.2 Differentiation
According to Porter (1980) differentiation strategy creates unique image for a company
within its industry along dimensions that consumers are less price sensitive and willing
to pay price premium. By focusing on superior product quality, product design and
other services such as delivery and marketing approach company might establish brand
loyalty, thus enhancing higher sales margin (Porter, 1980).
Going through IC Companys’ brands, it becomes clear that the Group has been applying
more than one strategy due to its different brands’ market positions. On the high-end,
brands like Peak Performance, Tiger of Sweden, By Malene Birger and Designers
Page 39 of 157
Remix Collection introduce high quality, preferable product design combined with high
service with the aim to develop unique brand identity for consumers. It could be stated
that the Group gives outmost importance to the differentiation strategy by proceeding
activities such as eliminating or reducing the risk of consumers wearing products which
might contain too many chemicals or dye substances (CEO Niels Mikkelsen, 2011).
Implementation of the multi-brand strategy allows the Group's different brands to use
the shared business platform and increase focus on brand differentiation, customer
loyalty and economies of scale. Recently, each brand took the responsibility of the value
chain with the aim to improve its core competencies and operate more efficiently.
As a part of the differentiation strategy the Group has also been enhancing HR
management to create intelligent employee base that could support high-level service
and customer relations. It has already been mentioned about IC Companys’ academies
for employee training in section 5.4.
5.5.3 Focus
Companies adopting a narrow competitive scope and targeting particular customer base
use the third focus strategy. This niche could be either "a certain kind of customers, a
limited geographic market, or a narrow range of products" (Miller & Friesen, 1986).
The narrow focus in itself though not sufficient for competitive advantage. The firm
needs to optimize the strategy on two variants: cost focus and differentiation focus.
Then by exploiting differences in cost behavior and using differentiation strategy
companies might take advantage of the customer's specific needs.
IC Companys’ relation to the focus strategy might be discussed in different aspects. It
could sound wrong if one would argue that IC Companys does not apply focus strategy
as its products cover broader range than a niche market. However, on the other hand, IC
Companys operates various brands and some of the brands such as Peak Performance
which targets active people who demand extremely functional products with a unique
design and uncompromising quality (IC Companys’ annual report 2010/2011). In that
case, it might be assumed that particularly Peak Performance brand uses the focus
strategy where its mission is to continue developing functionally designed active/casual
wear and holding its leading positions. It could be argued to some degree whether Peak
Performance is just affordable luxury that builds a strong brand name by using the
differentiation strategy or it satisfies customers of the niche market who are extremely
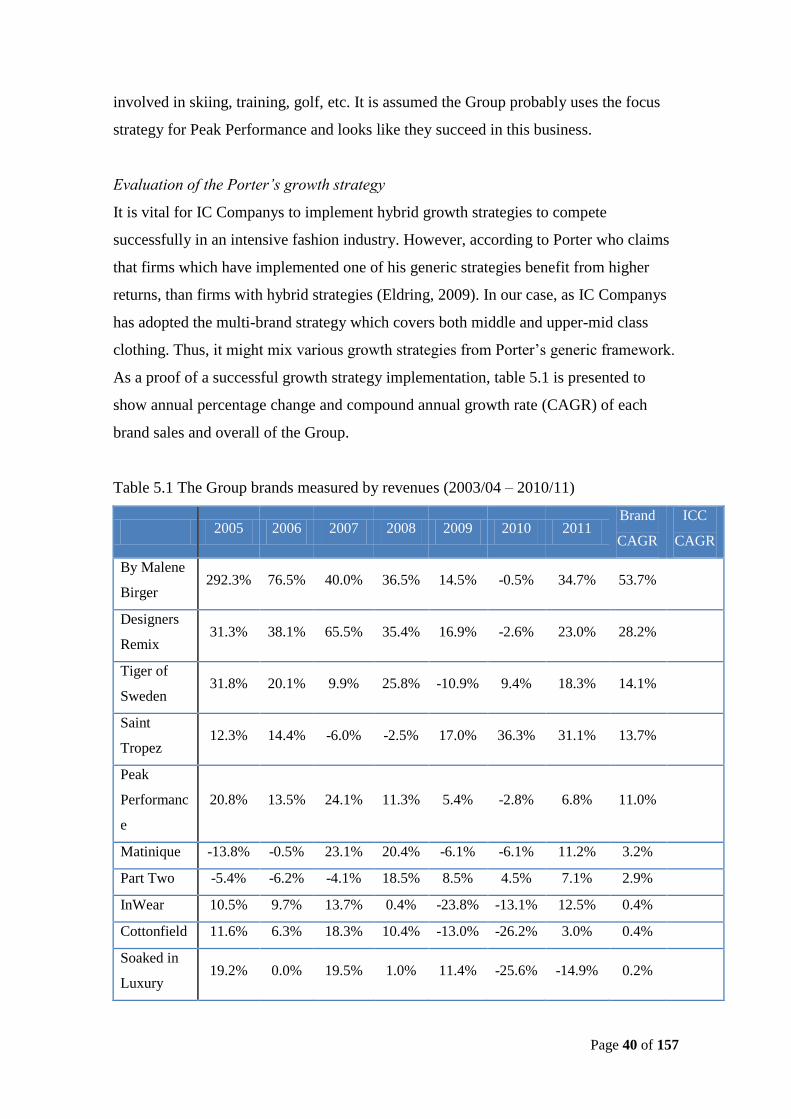
Page 40 of 157
involved in skiing, training, golf, etc. It is assumed the Group probably uses the focus
strategy for Peak Performance and looks like they succeed in this business.
Evaluation of the Porter’s growth strategy
It is vital for IC Companys to implement hybrid growth strategies to compete
successfully in an intensive fashion industry. However, according to Porter who claims
that firms which have implemented one of his generic strategies benefit from higher
returns, than firms with hybrid strategies (Eldring, 2009). In our case, as IC Companys
has adopted the multi-brand strategy which covers both middle and upper-mid class
clothing. Thus, it might mix various growth strategies from Porter’s generic framework.
As a proof of a successful growth strategy implementation, table 5.1 is presented to
show annual percentage change and compound annual growth rate (CAGR) of each
brand sales and overall of the Group.
Table 5.1 The Group brands measured by revenues (2003/04 – 2010/11)
2005 2006 2007 2008 2009 2010 2011 Brand
CAGR
ICC
CAGR
By Malene
Birger 292.3% 76.5% 40.0% 36.5% 14.5% -0.5% 34.7% 53.7%
Designers
Remix 31.3% 38.1% 65.5% 35.4% 16.9% -2.6% 23.0% 28.2%
Tiger of
Sweden 31.8% 20.1% 9.9% 25.8% -10.9% 9.4% 18.3% 14.1%
Saint
Tropez 12.3% 14.4% -6.0% -2.5% 17.0% 36.3% 31.1% 13.7%
Peak
Performanc
e
20.8% 13.5% 24.1% 11.3% 5.4% -2.8% 6.8% 11.0%
Matinique -13.8% -0.5% 23.1% 20.4% -6.1% -6.1% 11.2% 3.2%
Part Two -5.4% -6.2% -4.1% 18.5% 8.5% 4.5% 7.1% 2.9%
InWear 10.5% 9.7% 13.7% 0.4% -23.8% -13.1% 12.5% 0.4%
Cottonfield 11.6% 6.3% 18.3% 10.4% -13.0% -26.2% 3.0% 0.4%
Soaked in
Luxury 19.2% 0.0% 19.5% 1.0% 11.4% -25.6% -14.9% 0.2%
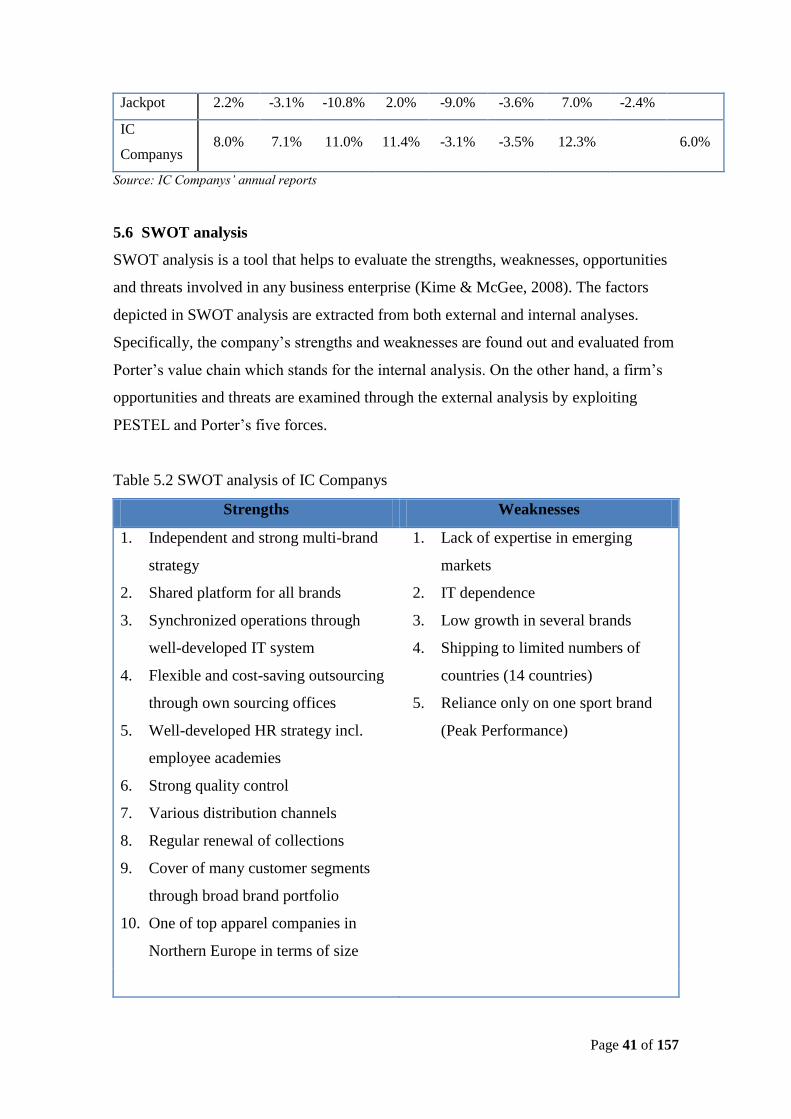
Page 41 of 157
Jackpot 2.2% -3.1% -10.8% 2.0% -9.0% -3.6% 7.0% -2.4%
IC
Companys 8.0% 7.1% 11.0% 11.4% -3.1% -3.5% 12.3% 6.0%
Source: IC Companys’ annual reports
5.6 SWOT analysis
SWOT analysis is a tool that helps to evaluate the strengths, weaknesses, opportunities
and threats involved in any business enterprise (Kime & McGee, 2008). The factors
depicted in SWOT analysis are extracted from both external and internal analyses.
Specifically, the company’s strengths and weaknesses are found out and evaluated from
Porter’s value chain which stands for the internal analysis. On the other hand, a firm’s
opportunities and threats are examined through the external analysis by exploiting
PESTEL and Porter’s five forces.
Table 5.2 SWOT analysis of IC Companys
Strengths Weaknesses
1. Independent and strong multi-brand
strategy
2. Shared platform for all brands
3. Synchronized operations through
well-developed IT system
4. Flexible and cost-saving outsourcing
through own sourcing offices
5. Well-developed HR strategy incl.
employee academies
6. Strong quality control
7. Various distribution channels
8. Regular renewal of collections
9. Cover of many customer segments
through broad brand portfolio
10. One of top apparel companies in
Northern Europe in terms of size
1. Lack of expertise in emerging
markets
2. IT dependence
3. Low growth in several brands
4. Shipping to limited numbers of
countries (14 countries)
5. Reliance only on one sport brand
(Peak Performance)
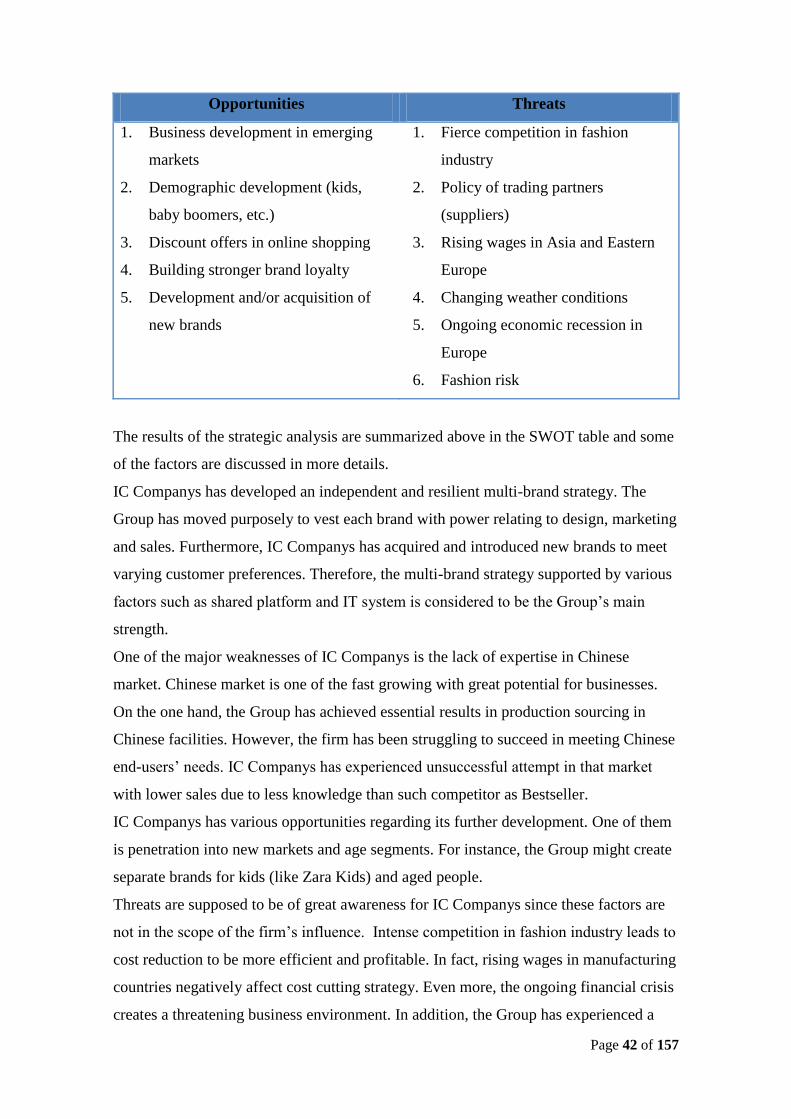
Page 42 of 157
Opportunities Threats
1. Business development in emerging
markets
2. Demographic development (kids,
baby boomers, etc.)
3. Discount offers in online shopping
4. Building stronger brand loyalty
5. Development and/or acquisition of
new brands
1. Fierce competition in fashion
industry
2. Policy of trading partners
(suppliers)
3. Rising wages in Asia and Eastern
Europe
4. Changing weather conditions
5. Ongoing economic recession in
Europe
6. Fashion risk
The results of the strategic analysis are summarized above in the SWOT table and some
of the factors are discussed in more details.
IC Companys has developed an independent and resilient multi-brand strategy. The
Group has moved purposely to vest each brand with power relating to design, marketing
and sales. Furthermore, IC Companys has acquired and introduced new brands to meet
varying customer preferences. Therefore, the multi-brand strategy supported by various
factors such as shared platform and IT system is considered to be the Group’s main
strength.
One of the major weaknesses of IC Companys is the lack of expertise in Chinese
market. Chinese market is one of the fast growing with great potential for businesses.
On the one hand, the Group has achieved essential results in production sourcing in
Chinese facilities. However, the firm has been struggling to succeed in meeting Chinese
end-users’ needs. IC Companys has experienced unsuccessful attempt in that market
with lower sales due to less knowledge than such competitor as Bestseller.
IC Companys has various opportunities regarding its further development. One of them
is penetration into new markets and age segments. For instance, the Group might create
separate brands for kids (like Zara Kids) and aged people.
Threats are supposed to be of great awareness for IC Companys since these factors are
not in the scope of the firm’s influence. Intense competition in fashion industry leads to
cost reduction to be more efficient and profitable. In fact, rising wages in manufacturing
countries negatively affect cost cutting strategy. Even more, the ongoing financial crisis
creates a threatening business environment. In addition, the Group has experienced a
Page 43 of 157
sales slowdown in the first half of its fiscal year of 2011 due to unusually warm weather
during the autumn and winter and partly the worsened financial crisis (IC Companys,
Press release, 2012).
5.7 Expansion Strategy
Expansion strategy is mainly subdivided into three categories (Dringoli, 2011):
1. Horizontal expansion: expansion in domestic markets or entering in different
geographical markets, producing the same or new products. A company
continues to operate in the same industry or business with the same product.
The extension to different market segments through new types and models of
the same basic product is also considered as a horizontal expansion;
2. Vertical integration: expansion along the value chain. It refers to direct
operations or phases of activity or services which before were acquired from
other firms;
3. Product diversification: expansion entering different industries producing
substantially different products related or unrelated to the existing ones.
According to IC Companys’ strategy and operations, it has been adopting principally
the horizontal expansion so far, where vertical integration and product diversification
are not in the scope of the Group’s interests.
Among many modes of horizontal expansion, the Group has executed geographic and
Mergers & Acquisitions (M&A) expansions. Geographic expansion is one of the key
factors for the Group to expand since more than 80% of total revenues come from
outside of Danish market. Therefore, if IC Companys is eager to boost its sales, it needs
to open stores in the form of franchising, concessions and own shops.
As of June 2011, IC Companys had 214 retail stores including an opening of 22 new
stores and closing of 14 old ones. 8 stores were opened in Central Europe while 2 shops
were closed. Furthermore, 7 and 5 stores were opened in Denmark and Sweden,
respectively. In the form of retail concessions, IC Companys had 75 stores with 5 new
shops opened and 58 stores closed. Such huge number of concessions was closed due to
the fact that 51 shops were unprofitable in Canada. Moreover, the Group opened 3
concessions in Denmark; while 6 shops were closed in Sweden with only 1 store
opened.
Page 44 of 157
IC Companys was more active in opening of franchise stores with 33 new shops and
closing of 17 ones. It includes 6 new stores in both Sweden and Eastern Europe and
Russia, 5 new franchises in Rest of Europe and 4 new stores in both Denmark and
Benelux countries.
The other essential distribution channel element is e-commerce where IC Companys has
been investing substantial funds resulting in opening of online shops for each brand.
Currently, the company offers delivery only to 14 countries located in Western Europe
and Scandinavia, namely, Germany, Austria, Netherlands, Italy, France, Belgium,
United Kingdom, Spain, Ireland, Switzerland, Sweden, Denmark, Finland and Norway.
It might be beneficial for the Group to offer delivery to countries where the company is
already presented and new markets.
The second mode of horizontal expansion is M&A. IC Companys has been quite
aggressive in acquisition of fashion brands to cover more consumer segments and
increase the market share. In fact, IC Companys has been created in the result of the
merger of InWear Group A/S and Carli Gry International A/S in 2001.
In 2002, IC Companys has acquired Saint Tropez aimed at girls and women. Key values
such as sound business practice and a customer-centric mindset have served as the
foundation of the brand’s success and became the reason to take it under the wing of the
Group (IC Companys, history of Saint Tropez, 2012). In 2003, IC Companys created
the joint venture with Malene Birger with the vision of being recognised as a highly
respected and prominent player on the global fashion arena (IC Companys, history of
By Malene Birger, 2012). The same year, IC Companys acquired Tiger of Sweden
positioned as a high attitude brand in the mid-price segment (IC Companys, history of
Tiger of Sweden, 2012). In 2006, the Group acquired Adventure Sport & Leisure AS,
the Peak Performance distributor in Norway. The acquisition has given Peak
Performance full control of sales and a strong and smoothly functioning platform for
continued growth in the Norwegian market (IC Companys’ annual report 2005/2006).
In 2010, IC Companys gained a full control of By Malene Birger purchasing a minority
interest of 49%. Malene Birger stated that she had decided to leave the business side of
the company to concentrate on all the existing creative challenges (IC Companys, Press
release, 2010).
Page 45 of 157
6. Evaluation of the corporate valuation theories
Many different models and methods exist for valuing a company. Some are used only in
specific situations, some are always more or less part of a valuation, and others are used
mostly in conjunction with other models (Frykman & Tolleryd, 2003). These models
often make very different assumptions about the fundamentals that define value, but
they do share some common features and could be classified in broader terms
(Damodaran, 2006).
According to Damodaran (2006) and Ryan (2007), there are four approaches to
valuation, namely, discounted cash flow valuation, asset valuation, relative valuation
and contingent claim valuation. Discounted cash flow valuation relates the value of an
asset to the present value of expected future cash flows on that asset. Asset valuation
implies a method where a summary of the assets less the liabilities of the firm are
valued on some agreed basis. Relative valuation evaluates the value of an asset by
considering the pricing of “comparable” assets relative to a common variable like
earnings, cash flows, book value or sales. Finally, contingent claim valuation exploits
option pricing models to determine the value of assets. These approaches could lead to
various results contingent on assumptions employed in each model.
Benninga and Sarig (1997) recommend to conduct the double-check of estimates the
one has made since there are too many guesstimates involved in calculations. It might
be done by using several methods of calculating the values and if different techniques
give similar outcomes it implies that the one might be sure of the estimated value.
Therefore, several methods are examined and used for the IC Companys valuation.
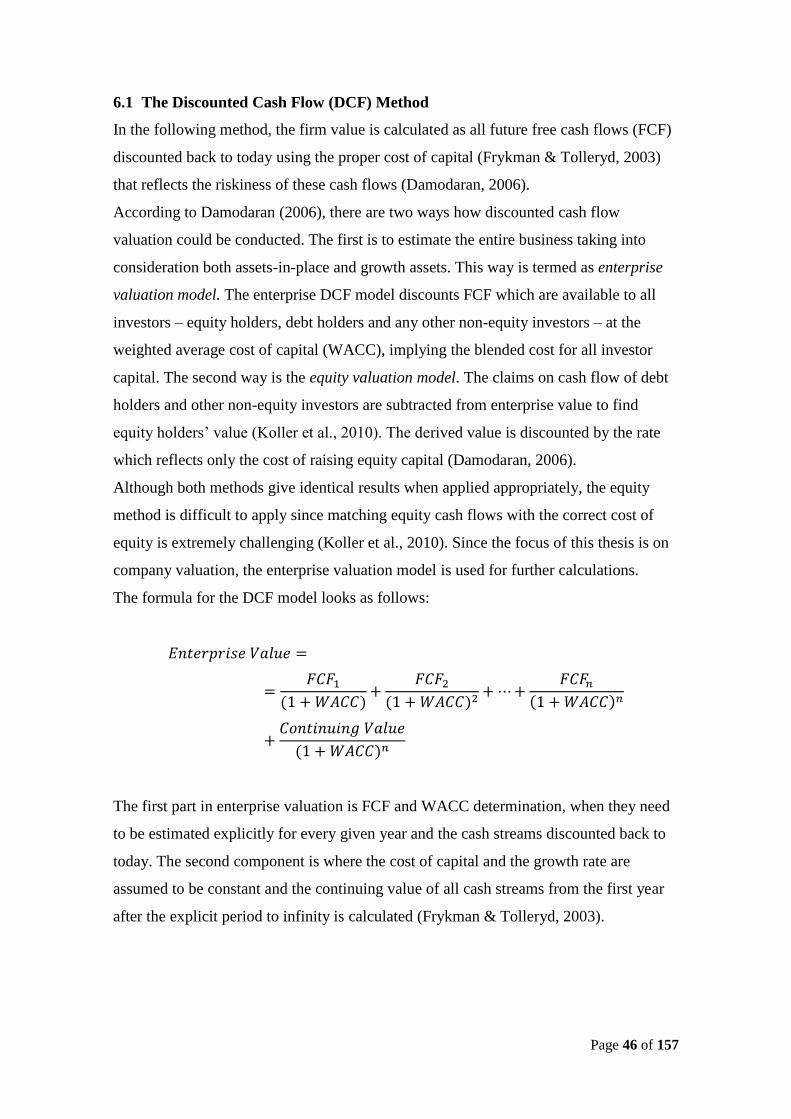
Page 46 of 157
6.1 The Discounted Cash Flow (DCF) Method
In the following method, the firm value is calculated as all future free cash flows (FCF)
discounted back to today using the proper cost of capital (Frykman & Tolleryd, 2003)
that reflects the riskiness of these cash flows (Damodaran, 2006).
According to Damodaran (2006), there are two ways how discounted cash flow
valuation could be conducted. The first is to estimate the entire business taking into
consideration both assets-in-place and growth assets. This way is termed as enterprise
valuation model. The enterprise DCF model discounts FCF which are available to all
investors – equity holders, debt holders and any other non-equity investors – at the
weighted average cost of capital (WACC), implying the blended cost for all investor
capital. The second way is the equity valuation model. The claims on cash flow of debt
holders and other non-equity investors are subtracted from enterprise value to find
equity holders’ value (Koller et al., 2010). The derived value is discounted by the rate
which reflects only the cost of raising equity capital (Damodaran, 2006).
Although both methods give identical results when applied appropriately, the equity
method is difficult to apply since matching equity cash flows with the correct cost of
equity is extremely challenging (Koller et al., 2010). Since the focus of this thesis is on
company valuation, the enterprise valuation model is used for further calculations.
The formula for the DCF model looks as follows:
The first part in enterprise valuation is FCF and WACC determination, when they need
to be estimated explicitly for every given year and the cash streams discounted back to
today. The second component is where the cost of capital and the growth rate are
assumed to be constant and the continuing value of all cash streams from the first year
after the explicit period to infinity is calculated (Frykman & Tolleryd, 2003).
Page 47 of 157
6.1.1 Variables in the DCF Model
Free Cash Flow calculation
There are several key drivers in a company’s valuation such as the return on invested
capital (ROIC), the growth rate and free cash flow (Koller et. al., 2010).
According to Penman (2003), free cash flow (FCF) is the part of the cash from
company’s operations left over after the firm conducted new investments. A firm
reduces its FCF by investing and increases it by cutting its investments. However, a
company is worth more if it invests successfully.
To conduct a robust valuation, a reorganizing of financial statements is needed. ROIC
and FCF are essential to the valuation process, however, it is impossible to calculate
them directly from a firm’s financial reports. Therefore, it is necessary to reorganize the
financial statements into the new ones that separate operating items, non-operating
items and financial structure.
When the firm’s financial reports are completed, the company’s historical financial
performance must be analyzed. Analyzing the past, the one could find out if the firm has
created value, whether it has expanded and how it collates with its competitors. Getting
the sense how key drivers performed in the past assists in making more robust forecast
of future cash flows.
Once the reorganization is completed, two new terms pop out, namely, invested capital
and net operating profit less adjusted taxes (NOPLAT). Return on invested capital
(ROIC) shows the return on the total investments a company has made (Follett, 2012).
ROIC is a better tool for forecasting comparing to return on asset (ROA) and return on
equity (ROE) as it puts equity and debt financing on an identical basis when, for
example, highly leveraged companies may look very profitable valued only by ROE
(Dorsey, 2004). In turn, NOPLAT means the total after-tax operating income generated
by the firm’s invested capital available to all capital investors.
The next step is the calculation of FCF which is derived directly from NOPLAT and the
change in invested funds (Koller et al., 2010).
Forecasting the Growth rate, ROIC and Free Cash Flow
When the company’s historical financial performance has been examined and FCF
derived, the next stage in the DCF valuation is to estimate revenues growth, ROIC and
FCF for an explicit period into the future. In order to forecast FCF, the one should start
Page 48 of 157
with NOPLAT and invested capital. Over the short period (for instance, the first five
years), it must be estimated such financial statement line items as gross margin, selling
expenses, accounts receivable and inventory. Projecting further into the future becomes
a difficult task. Consequently, considering the medium horizon (five to ten years), the
more emphasis must be put on the firm’s key value drivers such as operating margin
and tax rate as well as capital efficiency. Finally, forecasting beyond the medium
horizon leads to the valuing of a continuing value (Koller et al., 2010).
Forecasting Continuing Value
According to Koller et al. (2010), estimating key drivers on a year-by-year basis
becomes meaningless if the projecting extends far into the future. Therefore, it is
reasonable to apply a perpetuity-based continuing valuation which links cash flow
directly to growth rate and ROIC:
Where
6.1.2 The Weighted Average Cost of Capital
The WACC represents the average cost of each dollar of financing that the company
uses to purchase assets. Therefore, WACC might be considered as the minimum return
the company must earn on its investments to maintain its current well-being (Besley &
Brigham, 2011).
As it has been mentioned earlier, WACC is used to discount FCF. Consequently, slight
changes in WACC might result in significant swings in the company’s value (Bragg,
2009). WACC could be calculated by estimating its three components: the cost of debt
(incl. operating leases), the cost of equity and the target capital structure (Frykman &
Tolleryd, 2003). Thus, the formula for WACC looks as follows (Koller et al., 2010):
Page 49 of 157
Where
V – enterprise value
D – debt value
L – operating leases value
E – equity value
kd – rate of return required by debt holders
kl – rate of return required by operating leases holders
ke – rate of return required by equity holders
Tm – marginal tax rate
From the formula appears that in order to calculate WACC, the one should follow a
step-by-step process which is divided into four steps (Rosenbaum & Pearl, 2009 &
Koller et al., 2010):
1. Identify Target Capital Structure;
2. Evaluate The Cost of Debt (kd) including The Cost of Operating Lease (kl);
3. Evaluate The Cost of Equity (ke);
4. Calculate WACC.
Identification of the Target Capital Structure
Target Capital Structure consists of the debt-to-total capitalization (D/V), operating-
lease-to-total capitalization (L/V) and equity-to-total capitalization (E/V) ratios
(Rosenbaum & Pearl, 2009 & Koller et al., 2010). Debt, operating lease and equity must
be calculated based on market value. In more details, the market value of all outstanding
debt must be taken into account, involving fixed- and floating-rate debt. However, if
needed information is unavailable, the book value of debt is a sensible proxy when the
likelihood of default is low or interest rates have not changed significantly since the
issue of the debt (Koller et al., 2010). The value of a company’s leased assets must be
estimated using market interest rates, if a company does not disclose it (Koller et al.,
2010). Next step is to derive market value of equity. For this purpose, the price per
share given by the stock market might be considered. The market value of equity is
Page 50 of 157
usually called “market capitalization” and is calculated by multiplying price per share
with number of shares outstanding (Rosenbaum & Pearl, 2009).
Determination of the Cost of Debt
The cost of debt shows the current cost to the company of borrowing money to finance
its investments in assets. The cost of debt is a function of three components: the risk
free rate, the default spread and the marginal tax rate (Damodaran, 2006).
The risk free rate will be elaborated in the section The Cost of Equity in relation to the
CAPM.
The second component, the default spread, is directly related to lenders and their
perception of the default risk embedded in the firm. In turn, the default risk is a function
of two factors: the firm’s capability to generate cash flows and current financial
obligations. Companies that generate significant cash flows exceeding its financial
obligations must have lower default risk and vice versa. The default spread could be
determined in several ways, among others: 1) for publicly traded debt it could be
determined by the current yield on all outstanding issues (Rosenbaum & Pearl, 2009),
2) bond rating assigned by independent rating agencies and corresponding to associated
default spreads, 3) if the company’s debt is private, the one might examine recent
borrowings made by a firm to get a sense of default spreads or assign its own rating
based on financial ratios (Damodaran, 2006).
The third component is the marginal tax rate. Interest paid on debt is tax deductible
resulting in reduction of the cost of borrowing. Usually, most companies report an
effective tax rate on taxable income which is calculated by dividing the taxes paid by
the net taxable income. Effective tax rate might be different from marginal tax rate.
Therefore, the marginal tax rate might be found in the tax code of the country where the
company earns its operating income. For companies paying taxes in multiple tax
locations, the marginal tax rate should be calculated as the average of the various
marginal tax rates weighted by operating income earned from respective location
(Damodaran, 2006).
All in all, the formula for the cost of debt looks as follows (Damodaran, 2006):
Page 51 of 157
Furthermore, Koller et al. (2010) state that from an economic perspective, operating
lease is no different from traditional debt; investors, lenders and rating agencies treat it
the same as loan or bond. Thus, operating leases must be included in the enterprise
value and the WACC calculation. Since operating leases are secured by the underlying
asset and are less risky than the company’s unsecured debt, the cost of operating leases
could be estimated by AA-rated yields. Finally, as operating leases is the form of debt,
it implies the effect of tax shield.
Determination of the Cost of Equity
The cost of equity is based on the three components: the risk-free rate, the market risk
premium and a company-specific risk adjustment. The most widely used model to
project the cost of equity is the capital asset pricing model (CAPM) (Koller et al.,
2010).
CAPM is built on the condition that equity investors must be compensated for taking
systematic risk in the form of a risk premium or, in other words, the return in excess of
a risk-free rate. Systematic risk is the one that relates to the overall market and is not
diversifiable. In contrast, unsystematic risk is company-specific and could be avoided
through diversification. Therefore, equity investors are not rewarded for it (Rosenbaum
& Pearl, 2009). Despite the critics, the CAPM model remains the general method for
estimating an expected rate of return of a security. Although the model relies on strong
assumptions, it is based on solid theory about risk and return (Koller et al., 2010).
According to Damodaran (2006), the major advantage of the CAPM is that it captures
an asset’s exposure to all market in one number – the security’s beta – while the rest of
models might need a determining of other factors such as illiquidity, default risk,
macroeconomic indices, etc. Thus, the identification of specific factors directly
affecting a company’s cost of equity might cause a bias in the valuation.
The formula for CAPM calculation looks as follows (Koller et al., 2010):
Where
E(Ri) – expected return of security i
rf – risk-free rate
βi – stock’s sensitivity to the market (the stock’s beta)
Page 52 of 157
E(Rm) – expected return of the market
In the CAPM, the risk-free rate and market risk premium, defined by [E(Rm) – rf], are
similar for every company being traded in the respective market, whereas stock’s beta is
purely individual.
Further sections delve into factors affecting the application of CAPM and calculation of
the cost of equity.
Risk-free rate
The risk-free rate usually refers to the expected rate of return received by investing in a
riskless asset (Rosenbaum & Pearl, 2009). In turn, a government bond or a treasury bill
in the home country of the firm being valued is considered to be a risk-free security.
Furthermore, a risk-free asset being used for valuation must have a duration that
matches the investor’s investment horizon (Frykman & Tolleryd, 2003). For example, a
cash flow generated 10 years from today must be discounted by WACC derived from a
10-year zero-coupon government bond. For U.S. companies, the most general proxy is
10-year STRIPS (long-term zero-coupon bond). When considering European
companies, the 10-year German Eurobond is embedded in valuation as the most liquid
and least risky than any other European country’s bond (Koller et al., 2010).
Market Risk Premium
The market risk premium is the spread between the expected market return and the risk-
free rate. The history shows that investors have to be rewarded in terms of a risk
premium for holding risky assets instead of riskless government bonds (Brealey et al.,
2001). According to Koller et al. (2010), there are several methods to estimate the
market risk premium; however, none of them is precise model.
In the following paper, historical market risk premium is used as a tool for determining
market risk premium. This method implies that if the level of risk aversion has not
changed over the past century, then historical excess returns must be an appropriate
proxy for future premiums. Koller et al. (2010) suggest the following guidelines in
historical market risk premium calculation:

Page 53 of 157
1) Compute premiums in relation to long-term government bonds. For the
calculation of premiums, historical market returns must be compared with the
return on 10-year government bonds;
2) Consider the longest period possible. In order to reduce estimation error, a
longer history should be considered to estimate market risk premium;
Furthermore, market risk premium could be computed using either an arithmetic
average or a geometric average. An arithmetic average sums each year’s premium and
divides by the number of observations:
∑
A geometric average compounds each year’s premiums and takes the root of the
resulting product:
(∏
)
Koller et al. (2010) state that the arithmetic average is the best unbiased estimator to
determine a security’s one-period expected return, but a company with many years of
cash flows cannot be valued by this tool. Instead, long-term cash flows must be
discounted by a compounded rate of return. In turn, compounded historical arithmetic
average leads to a biased discount factor. In order to amend the bias caused by
estimation error and negative autocorrelation in returns, the one might use an estimator
proposed by Marshall Blume:
(
) (
)
Where
T – number of observations in the sample
N – forecast period being discounted
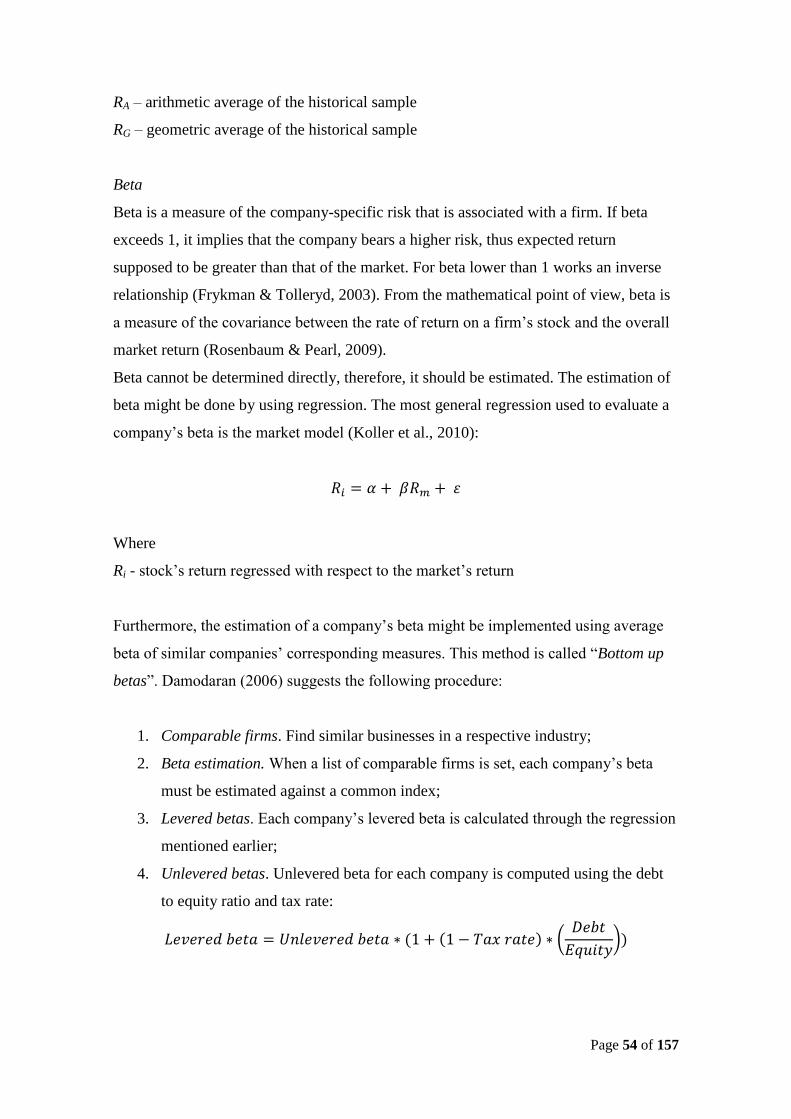
Page 54 of 157
RA – arithmetic average of the historical sample
RG – geometric average of the historical sample
Beta
Beta is a measure of the company-specific risk that is associated with a firm. If beta
exceeds 1, it implies that the company bears a higher risk, thus expected return
supposed to be greater than that of the market. For beta lower than 1 works an inverse
relationship (Frykman & Tolleryd, 2003). From the mathematical point of view, beta is
a measure of the covariance between the rate of return on a firm’s stock and the overall
market return (Rosenbaum & Pearl, 2009).
Beta cannot be determined directly, therefore, it should be estimated. The estimation of
beta might be done by using regression. The most general regression used to evaluate a
company’s beta is the market model (Koller et al., 2010):
Where
Ri - stock’s return regressed with respect to the market’s return
Furthermore, the estimation of a company’s beta might be implemented using average
beta of similar companies’ corresponding measures. This method is called “Bottom up
betas”. Damodaran (2006) suggests the following procedure:
1. Comparable firms. Find similar businesses in a respective industry;
2. Beta estimation. When a list of comparable firms is set, each company’s beta
must be estimated against a common index;
3. Levered betas. Each company’s levered beta is calculated through the regression
mentioned earlier;
4. Unlevered betas. Unlevered beta for each company is computed using the debt
to equity ratio and tax rate:
(
)
Page 55 of 157
5. Averaging approach. The average beta across the comparable firms is the
estimator of the target company’s beta, which must be adjusted in the same way
to derive a levered beta.
In detail, concerning the estimation of beta, Koller et al. (2010) suggest several
guidelines:
1) The minimum estimation period should be 60 data points. The following number
of observations originated as a rule of thumb during early tests of CAPM;
2) Regression should be built on monthly returns. In that case, the one might avoid
a systematic biases;
3) Company’s stock returns should be regressed against a well-diversified market
portfolio. The most common proxy is the S&P 500, a value-weighted index of
large U.S. companies. In some cases, it is reasonable to use MSCI World Index
which captures more than 1,600 stocks across 24 developed markets (MSCI Inc.,
2012). However, two indices had a 95.8% correlation between 2000 and 2009.
Liquidity premium (LP)
Liquidity has always been a significant factor in corporate valuation, however, investors
usually pay less attention to that. One of the reasons is that liquidity premium is hard to
measure and it does not pose troubles in the most active markets. In opposite, liquidity
factor may lead to essential valuation imprecisions if a company is traded in less liquid
market. Moreover, liquidity premium is distinguished between large and small market
capitalization companies, where premiums for small market capitalization companies
may be much higher than those for large market capitalization companies (Xue &
Zheng, 2010).
Damodaran (2006) states few determinants of illiquid stock among others:
1. Bid-Ask spread;
2. Price Impact: the effect that an investor could create by trading an asset in
significant volume.
IC Companys belongs to middle capitalization (mid-cap) companies traded on
Copenhagen Stock Exchange (CSE). The Bid-Ask spread for IC Companys varies
Page 56 of 157
around 0.5%, while the same measure for large-cap companies equals to 0.2%. In terms
of trading volume, IC Companys significantly underperforms comparing to other mid-
cap companies having been traded averagely 8,000 shares a day from 30 June 2010 to
30 June 2011. Moreover, an absence of liquidity provider or market maker in IC
Companys stock leads to greater volatility when a large trade may create an inadequate
price change. As a result, it has been decided to add a liquidity premium of 2%
(Petersen et al., 2006) to the computation of IC Companys’ cost of equity. Thus, the
cost of equity formula for IC Companys looks as follows:
[ ]
6.2 Economic profit model
Besides the DCF model, it is intended to apply also Economic Profit Model in order to
confirm the results from the DCF model. In fact, when both models applied accurately
they perform different, but complementary benefits, thus results from both valuation
models have to be equal. The economic profit valuation model has become popular due
to its close link to economic theory and competitive advantage (Koller et al., 2010).
Economic Profit Model is also called Economic Value Added (EVA) which has been
commercially developed in 1982 by the corporate advisory team of Joel Stern and G.
Bennet Stewart III. One of the main reasons of EVA to become more favorable as a
valuation tool is the fact that unlike traditional measures of profit such as EBIT,
EBITDA, and net operating income, EVA looks at the firm's residual profitability, net
of both the directs cost of debt and the indirect cost of equity capital. Generally, three
famous economists Irving Fisher during the 1930s and Franco Modigliani and Merton
Miller in the late 1950s focused and elaborated on meaning of economic profit in
corporate valuation context (Grant, 2003). By referring to the economists’ aspects, the
theory of EVA relies on two principle assertions which are stated below:
1. A company is not truly profitable if its opportunity cost of capital is higher than
company's return on invested capital;
2. In order to create wealth for the shareholders, firm's managers have to make
positive NPV investment decision.
Page 57 of 157
According to Grant (2003), EVA might be defined by two operational ways, accounting
and financial. From the accounting perspective EVA could be calculated as difference
between the firm's net operating profit less adjusted taxes (NOPLAT) and its weighted
average cost of capital (WACC). Accounting based approach relies on conventional
accounting income and balance sheets, footnotes to financial statements and additional
external data concerning beta that is used in CAPM also has to be included.
From the finance perspective, EVA is defined in terms of its relation to firm’s market
value added (MVA) or net present value (NPV) which equals to the present value of the
firm's expected future EVA. On the other hand, while dealing with EVA from the
finance perspective, it is necessary to note that key drivers for the financial approach are
primarily discounting or present value process with the aim of determining market value
added, enterprise value and stock price.
Main distinction between EVA and MVA is that when interpreting MVA, market data
is primarily used in the calculation while using EVA it is referred to firm's financial data
and adjustments to firms accounting profit (Fabozzi & Peterson Drake, 2009).
The economic profit model examines how and when the company gains value and
introduces identical valuation process as enterprise DCF (Koller et al., 2010). Single
period value creation by the company is measured by economic profit formula below:
Where ROIC stands for return on invested capital and WACC is the weighted average
cost of capital, thereby their difference might be defined as economic spread. Instead of
using economic spread multiplied by invested capital, ROIC might be replaced by
NOPLAT divided by invested capital (Koller et al., 2010).
In order to deliver the full meaning of the economic profit and its role in a company’s
value, it is intended to demonstrate the formula that encompasses comprehensive
valuation tool. The formula below is economic-profit-based key value driver model
which has been transformed from cash flow perpetuity formula.
Page 58 of 157
∑
The formula above states that operating value of a company is the sum of its book value
of invested capital and present value of all future value created. It also confirms that if
company's sum of future economic profit equals to zero, the value of company
operations equals to invested capital. But there are two main aspects in the above
mentioned formula that economists have to draw attention to. These factors are WACC
and ROIC. The main issue might occur while discounting company’s projects at
constant cost of capital and forecasting economic profit for the future years in order to
calculate a continuing value with the same ROIC. The inconsistency of using constant
WACC is that a company might change its financial structure. Thereby, WACC has also
to be changed, for example, deleverage has direct impact on company's cost of capital.
That is why, companies that plan to change its capital structure and debt-to-value ratios,
have to adjust their WACC on annual basis in order to handle fluctuations in the capital
structure. Then, calculating continuing value by using economic-profit-based key value
driver, it is necessary to examine whether return on new invested capital (RONIC)
equals to historical ROIC in the continuing value formula. In the case when RONIC
differs from the last year ROIC, the equation has to be transformed by separating into
current and future economic profits (Koller et al., 2010).
6.3 Multiples
There are some other ways of valuing firms beside DCF which could be referred to two
additional valuation techniques such as multiples and real options (Koller et al., 2010).
In this section it is decided to describe the role of multiples analysis for a company
valuation. Before starting to elaborate on particular multiples it has to be stated that
market multiples have two primary classifications, analytical tools and valuation tools.
Multiples for analytical tools introduce the relative valuation per dollar of book value or
per dollar of earnings. Such multiples measure share price relative to a key accounting
numbers that enable analytics to draw illation concerning firm's comparative market
capitalization, to observe fluctuations in firm's valuation over time and compare value
across the firms. Advantage of market multiples over analytical is the ability to conduct
time-series and cross-sectional analyses in order to compare how capital markets value
Page 59 of 157
stocks (Wahlen et al., 2010). For example, according to Jerald et al. (2010), it could be
stated that by multiplying benchmark value of the price-to-earnings (P/E) ratio with the
estimate of a particular company's earnings per share (EPS) presents quick estimate of
the chosen company's stock that makes it able to compare with the stock's market price.
Multiples could also be used efficiently as a valuation tool, but it must be applied and
interpreted carefully concerning relevant peer group, industry definition, firm's expected
return, profitability growth and risk (Wahlen et al., 2010). Multiples in valuation
process might play very supportive role in two aspects, as the method of comparable
and the method based on forecasted fundamentals (Pinto et al., 2010).
The method of comparable could be easily applied to enterprise value multiples with
purpose to evaluate the market value of the whole company with the specific value
measures that provide relevant results concerning both equity and debt holders. If the
appropriate multiple has been assessed then finance manager might use it to check their
results from the DCF method. Koller et al. (2010) highly suggest starting with
enterprise value to earnings before interest tax and amortization (EBITA) multiples as it
determines more accurate company's value than any other multiples. In the equation
below is introduced commonly used multiple EV/ EBITA:
The formula above is quite similar to the P/E ratio, but the main difference is to
calculate enterprise value, not the share price.
According to Koller et al. (2010), there are three main requirements that have to be
fulfilled in order to achieve more plausible and efficient multiple comparable:
1. Collecting the right multiples. More relevant multiples for the valuation analysis
are assumed to be the EV/EBITDA, EV/EBITA. Despite the fact that price-to-
earnings (P/E) is commonly used, it is distorted by capital structure and non-
operating gains and losses;
2. Apply compatible calculation manner. The most correct mode is defining the
numerator with value and the denominator with earnings taken from the
particular underlying assets. It has also to be mentioned that if an analytic
Page 60 of 157
excludes surplus cash from value, then interest income on such cash has also to
be subtracted from the earnings;
3. The best chosen peer group. It is one of the main aspects in the multiple
analysis to choose the right peer group that corresponds to the target company's
long-term growth and return on invested capital (ROIC).
Application of method based on forecasting or use of forward-looking multiples is
another efficient method that has been broadly applied in forecasting of a company's
long-term cash flows by avoiding one-time past charges.
Even though the DCF analysis is assumed to present the most accurate and flexible
method for valuing project, the credibility and accuracy of the DCF valuation model
highly depends on reliable forecast numbers that have significant impact on final
company’s value. The main difference between forward-looking multiples and
backward-looking multiples is the fact that in constructing forward-looking multiples
denominator should use a forecast of profits rather than historical profits. Indeed,
empirical evidence informs that forward-looking multiples are more robust predictors of
value than historical multiples. In order to construct forward-looking multiples it has to
be chosen forecast year for EBITA which introduces the most relevant long-term
prospects. In periods of stable growth and profitability future years estimates are more
plausible.
Evaluation of multiples
Multiples method is quite easy and simple to use in a company’s valuation, but in fact
multiples are usually misinterpreted and mislead. Main confusion might arise while
building multiples for particular target. Majority of books concerning multiples analysis
suggest to use commonly accepted price-to-earnings multiples where the numerator
presents market price which is easy to determine and interpret, but the denominator is
related to earnings-per-share ratio which is based on the complex rules of accrual
accounting and presents significant interpretation issues (Pinto et al., 2010). Koller et al.
(2010) also argue between the choice of EV/EBITA and P/E by stating that P/E
multiples have two major flaws. P/E might mislead as it is affected by a company's
capital structure, but not only by its operating performance. Then, the second flaw
occurs in calculating net income by subtracting or adding non-operating loss or gain
what affects the final result of earnings and has direct effect on P/E fluctuations.
Page 61 of 157
Other issues might arise in selecting a sample of comparable firms. According to
Benninga and Sarig (1997), the selection of the comparable firms has to be based on
tight restrictions such as gathering firms whose market price are averaged in order to be
less different from the firm being valued, however, peculiarity of each firm is not
considered in the valuation prospects. With aim to reduce uncertainty concerning
idiosyncrasy within each firm, sample size has to be large enough to average out such
phenomenon. In a conclusion it could be stated that due to its simplicity and
convenience multiples might provide rapid valuable "sanity check", but being simple
refers to sweeping many factors that create problems associated with less certainty. All
in all, as the main valuation tool DCF is considered to be the preferable technique while
multiples analysis is secondary or supportive method in valuation of companies.
6.4 Real Option Valuation (ROV)
Real option valuation is another appropriate method for valuation of companies'
underlying non-financial assets and capital investment projects. An option itself is the
right, but not the obligation, to take an action in the future and options are valuable
when the market is highly uncertain or volatile (Amram & Kulatilaka, 1999). According
to the authors, the real option approach is the extension of financial option theory to
options on real assets. Financial options might be divided into two classes where
American option is allowed to be executed before and at the expiration date, while
European option might be executed only at the expiration date or never. There are some
similarities between financial and real options such as both options are more valuable
while uncertainty increases and also both types of options provide companies with a
tool that limits their downside risk while also gaining from advantage to upside
opportunities in the future. But the main difference between these two approaches is
that, unlike financial options, real options are applied in such opportunities which were
created by company's strategic investments (Boyer et al., 2003).
It is decided to use the extension of financial options – real options, which are broadly
used in the academic world. However, implementation of the real options in the
contemporary corporate world has been proceeding slower than expected (Amram &
Kulatilaka, 1999).
By having in mind that contemporary business market involves high degree of
uncertainty and risks due to recent economic fluctuations, development of real options
Page 62 of 157
theory might be used as an important tool that describes and evolves relationship
between risk and value (Boer, 2002).
According to Mun (2002), the main difference of real option valuation method from the
traditional valuation approaches lies in the fact that the DCF model underestimates the
value of a project by excluding its value of flexibility. Traditional way of project
appraisal within the capital budgeting where the DCF method is used, assumes that a
company follows rigid and inflexible path forward by ignoring and failing to respond
and adjust to any fluctuations in the market place. Thereby, traditional methods ignore
the risk pattern for the specific project that might change over time (Brach, 2003). The
main value-added component in applying real options is the fact that it considers
management's ability to create, execute and abandon strategic and flexible options
(Mun, 2002).
By referring to Mun (2002), it could be stated that real option approach is applied by
considering multiple decision abilities according to issues arising due to high
uncertainty complied with management’s flexibility in selecting the optimal strategies
or execution of an option might change due to new observed information.
It has to be mentioned that real option analysis does not necessarily preclude or replace
traditional DCF and NPV analyses. According to Brach (2003), the DCF model
considers cash flows which are based on past data while the further implication of the
real options might create value in constructing and adjusting cash flows for the future
investment projects.
Real options, according to Mun (2002), might be calculated in various ways, by taking
into consideration the use of path-dependent simulation, closed-form models, partial-
differential equations, and multinomial and binomial approaches. In practice of real
option valuation, analytics mainly use mainstream methods which consist of closed-
form solutions, partial-differential equations and the binomial lattice tree. As an
example for closed-form solutions it could be referred to Black-Scholes model where
equation is solved by forming set of input assumptions. Even though the
implementation of the model might be quick and exact by using some programming
knowledge, difficulties occur while explaining the results as they tend to involve highly
technical stochastic calculus mathematics. The disadvantage of Black-Scholes model
concerning the flexibility is limited due to its nature. Another model of closed-form
equations as it has already been mentioned above is binomial lattice model which is
very simple and explicit in aspects of implementation and explanation. Unlike Black-
Page 63 of 157
Scholes model, Binomial lattice is highly flexible, but demands significant computing
ability and might consist of plural time steps in order to obtain relevant approximation.
Due to appropriateness of the latter model, it is decided to implement it in connection to
IC Companys’ possible option valuation.
6.4.1 The Binomial lattice model
First time in 1979 Cox Ross and Rubinstein have created the binomial option pricing
model which is a discrete model for valuing European and American options. Indeed,
there are various possible ways of solutions for real options including other lattice
approaches, but the binomial lattice is considered to be the most robust, simple and
mature in its implementation. According to Mun (2002), the binomial lattice model
results might be achieved by using two different ways of calculations. The first way of
such calculation is based on market-replicating portfolio and the second approach might
be achieved by using risk-neutral probabilities. In fact, use of replicating portfolio
approach is assumed to be more complicated considering both understanding and
implementation. Despite the difference in calculations the results obtained from both
replicating portfolio and risk-neutral probabilities approaches are identical.
Furthermore, elaboration on the binomial lattice model considers risk-neutral
probabilities which are mainly based on four-step process according to Koller et al.
(2010). It is assumed that due to its simplicity in implementation and explanation of the
process, binomial tree with risk-neutral probabilities might be relevant tool kit for
valuation of IC Companys’ possible future activities. The main purpose of
implementation of four-step process in ROV approach with straight forward binomial
lattice is to assess flexibility tendency which is consistently driven by non-diversifiable
risk.
Figure 6.1 introduces Koller et al. (2010) four-step binomial lattice approach in real
option valuation:
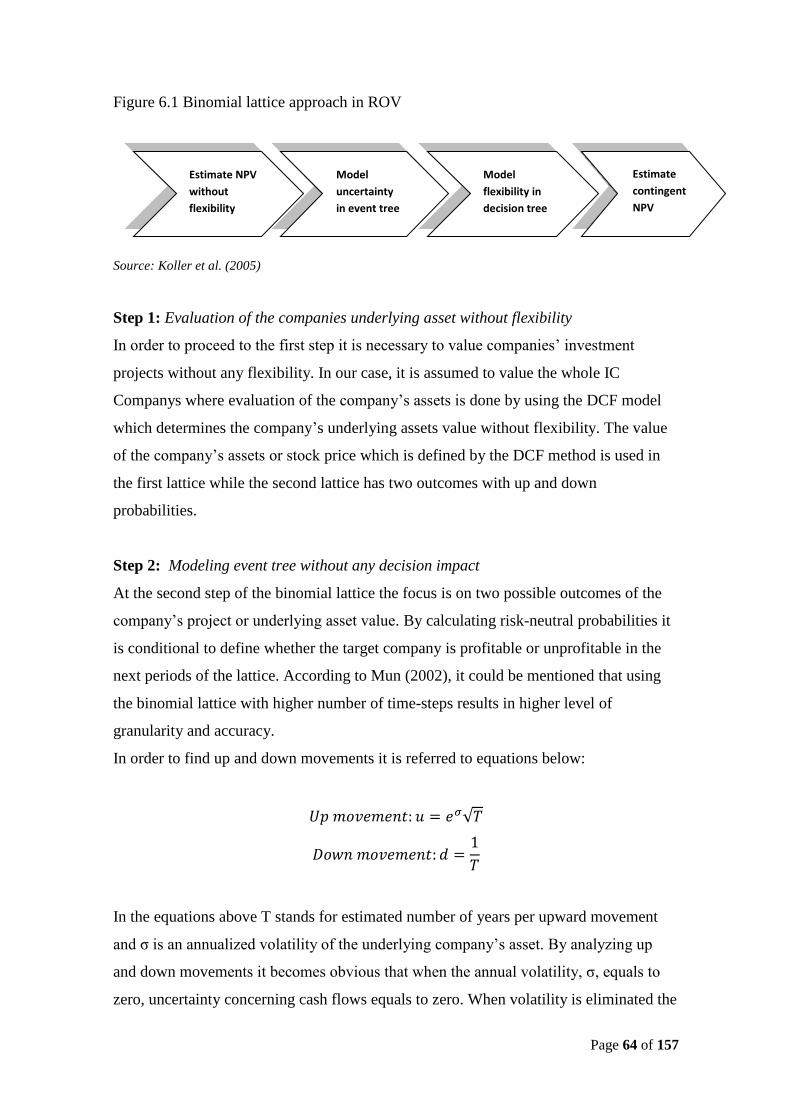
Page 64 of 157
Figure 6.1 Binomial lattice approach in ROV
Source: Koller et al. (2005)
Step 1: Evaluation of the companies underlying asset without flexibility
In order to proceed to the first step it is necessary to value companies’ investment
projects without any flexibility. In our case, it is assumed to value the whole IC
Companys where evaluation of the company’s assets is done by using the DCF model
which determines the company’s underlying assets value without flexibility. The value
of the company’s assets or stock price which is defined by the DCF method is used in
the first lattice while the second lattice has two outcomes with up and down
probabilities.
Step 2: Modeling event tree without any decision impact
At the second step of the binomial lattice the focus is on two possible outcomes of the
company’s project or underlying asset value. By calculating risk-neutral probabilities it
is conditional to define whether the target company is profitable or unprofitable in the
next periods of the lattice. According to Mun (2002), it could be mentioned that using
the binomial lattice with higher number of time-steps results in higher level of
granularity and accuracy.
In order to find up and down movements it is referred to equations below:
√
In the equations above T stands for estimated number of years per upward movement
and σ is an annualized volatility of the underlying company’s asset. By analyzing up
and down movements it becomes obvious that when the annual volatility, σ, equals to
zero, uncertainty concerning cash flows equals to zero. When volatility is eliminated the
Estimate NPV
without
flexibility
Model
uncertainty
in event tree
Model
flexibility in
decision tree
Estimate
contingent
NPV
Page 65 of 157
result of the binomial lattice is equal to results from discounted cash flow model since
the volatility elimination excludes any gains of flexibility. It could be briefly stated that
referring to up movement formula, when σ=0, the binomial lattice model becomes
useless as up and down movements are equal to one.
After determination of up and down movements, risk-neutral probabilities have to be
calculated by the following formula below:
Where
down probability is
In the formula above r is the cost of capital of a company's underling asset.
According to Koller et al. (2010), when using PV formula it is possible to verify that the
present value concerning a company’s assets in the event tree has to be equal to
expected payout at a company's cost of capital. The formula below introduces PV
calculation for a chosen node in the event tree:
Step 3: Using flexibility in decision tree
Unlike the step 2, underlying asset’s value in the future periods of binomial lattice
includes flexibility where event tree transforms to decision tree. Decisions concerning
company’s future aspects might be various by referring to management options such as
expansion, abandonment, delay, etc. After adding decision points to the event tree, it is
necessary to estimate percentage increase in a company’s value and expenses, for
example, due to expansion or growth strategy. After implementation of chosen strategy,
management might define new estimated cash flow due to new circumstances by
discounting payouts backward through the time. If an observed value with added
flexibility due to accepted decision points is higher than the value without flexibility,
the company tends to exercise its option and gain from the value increase of a
company’s assets.
Page 66 of 157
Step 4: Final value of the real option with flexibility
In the last step of ROV it is intended to use risk-neutral probabilities in order to value
company’s assets with flexibility. According to Koller et al. (2005), risk-neutral
valuation includes risk adjustment as a part of scenario analysis rather than the discount
rate. In the process of option valuation instead of implementing actual scenario
probabilities, it is considered to weight the future cash flows by risk-adjusted
probabilities. After determination of probability-weighted average cash flow, it is
assumed to discount the cash flows by risk-free rate to define the current value of the
company’s assets. The formula below demonstrates how to find the probabilities of
upside and downside movements:
Then by applying probabilities determined from the formula above it is possible to
define option values in each node, then, to discount them with risk-free rate doing
backward calculations or just simply discounting them from right to the left.
Page 67 of 157
7. IC Companys valuation using DCF model
As mentioned before, the key drivers of a company’s value are the return on invested
capital (ROIC), the growth rate and free cash flow (FCF), which cannot be directly
derived from financial statements.
The balance sheet blends operating assets, non-operating assets and financing sources,
while the income statement consolidates operating profits with financing costs.
Therefore, financial statements need to be reorganized for unbiased assessments of a
company’s value (Koller et al., 2010).
To compute ROIC and FCF, the balance sheet has to be reformulated to create invested
capital as well as reorganize the income statement to establish net operating profit less
adjusted taxes (NOPLAT) (Koller et al., 2010).
7.1 The reformulated balance sheet
The reformulation of the balance sheet leads to the definition of invested capital which
represents the total investor capital needed to fund operations without reference to
sources of capital. In detail, a company’s operating assets need to be separated from its
non-operating assets, while the same has to be done for items related to liabilities
(Koller et al., 2010).
Principally, operating assets (OA) consist of items such as receivables, inventory and
property, plant and equipment. Operating liabilities (OL) are mainly compounded of
accounts payable, accrued salaries and interest-bearing debt. When a balance sheet is
properly reorganized, it leads to net operating assets (NOA) and other long-term assets
(OLTA), and, finally, to invested capital (Koller et al., 2010):
Where
It has been decided to examine five IC Companys’ financial statements starting from the
year of 2006/2007 and ending with the year 2010/2011. Throughout the observing
period, IC Companys had net financial obligations rather than net financial assets.
According to Penman (2010), if a company has financial obligations exceeding financial
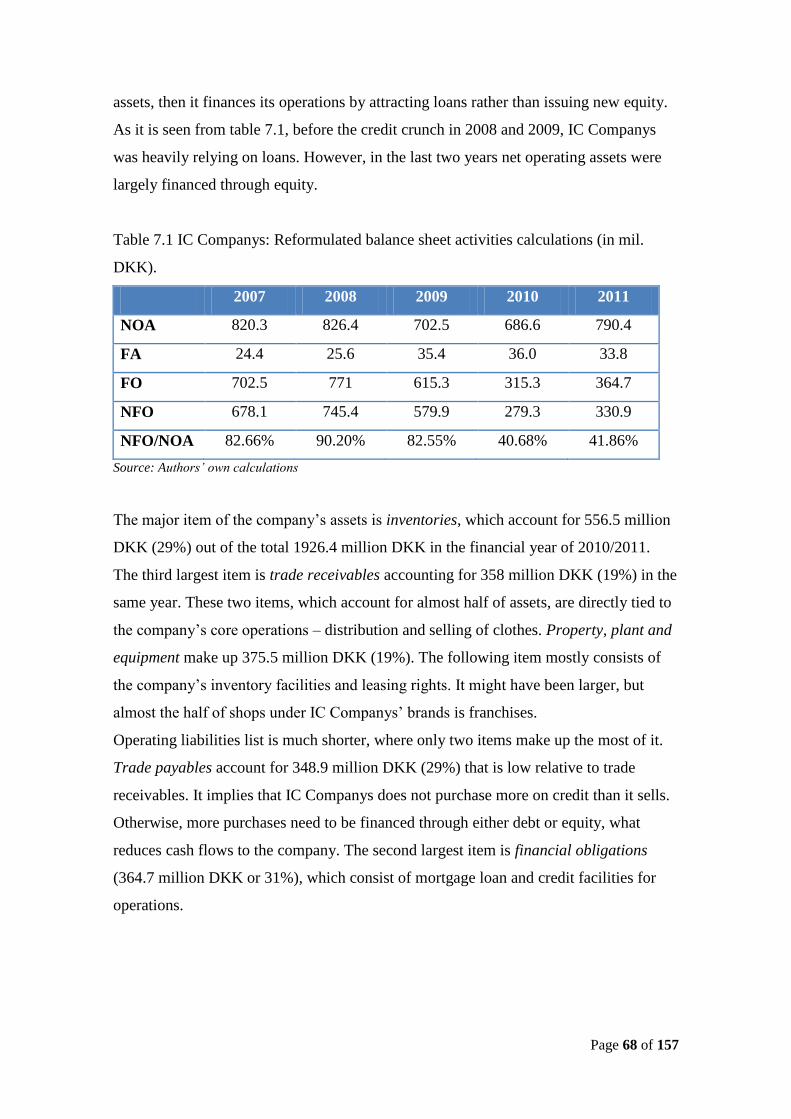
Page 68 of 157
assets, then it finances its operations by attracting loans rather than issuing new equity.
As it is seen from table 7.1, before the credit crunch in 2008 and 2009, IC Companys
was heavily relying on loans. However, in the last two years net operating assets were
largely financed through equity.
Table 7.1 IC Companys: Reformulated balance sheet activities calculations (in mil.
DKK).
2007 2008 2009 2010 2011
NOA 820.3 826.4 702.5 686.6 790.4
FA 24.4 25.6 35.4 36.0 33.8
FO 702.5 771 615.3 315.3 364.7
NFO 678.1 745.4 579.9 279.3 330.9
NFO/NOA 82.66% 90.20% 82.55% 40.68% 41.86%
Source: Authors’ own calculations
The major item of the company’s assets is inventories, which account for 556.5 million
DKK (29%) out of the total 1926.4 million DKK in the financial year of 2010/2011.
The third largest item is trade receivables accounting for 358 million DKK (19%) in the
same year. These two items, which account for almost half of assets, are directly tied to
the company’s core operations – distribution and selling of clothes. Property, plant and
equipment make up 375.5 million DKK (19%). The following item mostly consists of
the company’s inventory facilities and leasing rights. It might have been larger, but
almost the half of shops under IC Companys’ brands is franchises.
Operating liabilities list is much shorter, where only two items make up the most of it.
Trade payables account for 348.9 million DKK (29%) that is low relative to trade
receivables. It implies that IC Companys does not purchase more on credit than it sells.
Otherwise, more purchases need to be financed through either debt or equity, what
reduces cash flows to the company. The second largest item is financial obligations
(364.7 million DKK or 31%), which consist of mortgage loan and credit facilities for
operations.
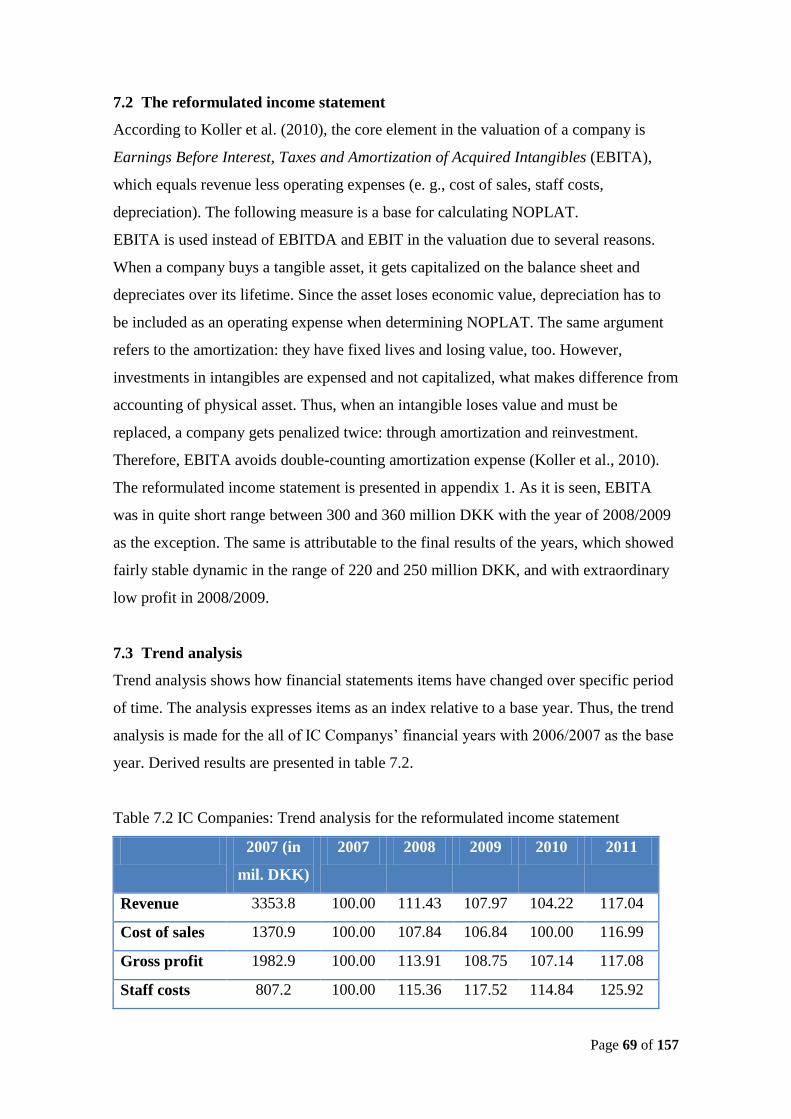
Page 69 of 157
7.2 The reformulated income statement
According to Koller et al. (2010), the core element in the valuation of a company is
Earnings Before Interest, Taxes and Amortization of Acquired Intangibles (EBITA),
which equals revenue less operating expenses (e. g., cost of sales, staff costs,
depreciation). The following measure is a base for calculating NOPLAT.
EBITA is used instead of EBITDA and EBIT in the valuation due to several reasons.
When a company buys a tangible asset, it gets capitalized on the balance sheet and
depreciates over its lifetime. Since the asset loses economic value, depreciation has to
be included as an operating expense when determining NOPLAT. The same argument
refers to the amortization: they have fixed lives and losing value, too. However,
investments in intangibles are expensed and not capitalized, what makes difference from
accounting of physical asset. Thus, when an intangible loses value and must be
replaced, a company gets penalized twice: through amortization and reinvestment.
Therefore, EBITA avoids double-counting amortization expense (Koller et al., 2010).
The reformulated income statement is presented in appendix 1. As it is seen, EBITA
was in quite short range between 300 and 360 million DKK with the year of 2008/2009
as the exception. The same is attributable to the final results of the years, which showed
fairly stable dynamic in the range of 220 and 250 million DKK, and with extraordinary
low profit in 2008/2009.
7.3 Trend analysis
Trend analysis shows how financial statements items have changed over specific period
of time. The analysis expresses items as an index relative to a base year. Thus, the trend
analysis is made for the all of IC Companys’ financial years with 2006/2007 as the base
year. Derived results are presented in table 7.2.
Table 7.2 IC Companies: Trend analysis for the reformulated income statement
2007 (in
mil. DKK)
2007 2008 2009 2010 2011
Revenue 3353.8 100.00 111.43 107.97 104.22 117.04
Cost of sales 1370.9 100.00 107.84 106.84 100.00 116.99
Gross profit 1982.9 100.00 113.91 108.75 107.14 117.08
Staff costs 807.2 100.00 115.36 117.52 114.84 125.92
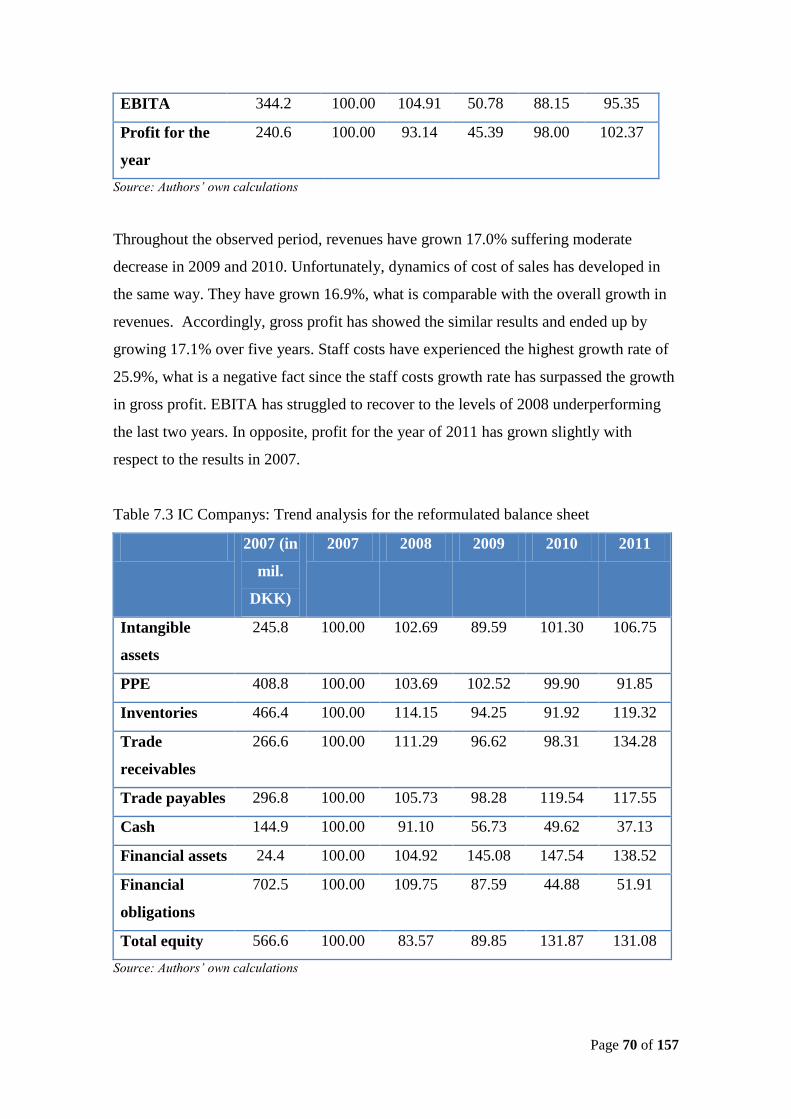
Page 70 of 157
EBITA 344.2 100.00 104.91 50.78 88.15 95.35
Profit for the
year
240.6 100.00 93.14 45.39 98.00 102.37
Source: Authors’ own calculations
Throughout the observed period, revenues have grown 17.0% suffering moderate
decrease in 2009 and 2010. Unfortunately, dynamics of cost of sales has developed in
the same way. They have grown 16.9%, what is comparable with the overall growth in
revenues. Accordingly, gross profit has showed the similar results and ended up by
growing 17.1% over five years. Staff costs have experienced the highest growth rate of
25.9%, what is a negative fact since the staff costs growth rate has surpassed the growth
in gross profit. EBITA has struggled to recover to the levels of 2008 underperforming
the last two years. In opposite, profit for the year of 2011 has grown slightly with
respect to the results in 2007.
Table 7.3 IC Companys: Trend analysis for the reformulated balance sheet
2007 (in
mil.
DKK)
2007 2008 2009 2010 2011
Intangible
assets
245.8 100.00 102.69 89.59 101.30 106.75
PPE 408.8 100.00 103.69 102.52 99.90 91.85
Inventories 466.4 100.00 114.15 94.25 91.92 119.32
Trade
receivables
266.6 100.00 111.29 96.62 98.31 134.28
Trade payables 296.8 100.00 105.73 98.28 119.54 117.55
Cash 144.9 100.00 91.10 56.73 49.62 37.13
Financial assets 24.4 100.00 104.92 145.08 147.54 138.52
Financial
obligations
702.5 100.00 109.75 87.59 44.88 51.91
Total equity 566.6 100.00 83.57 89.85 131.87 131.08
Source: Authors’ own calculations
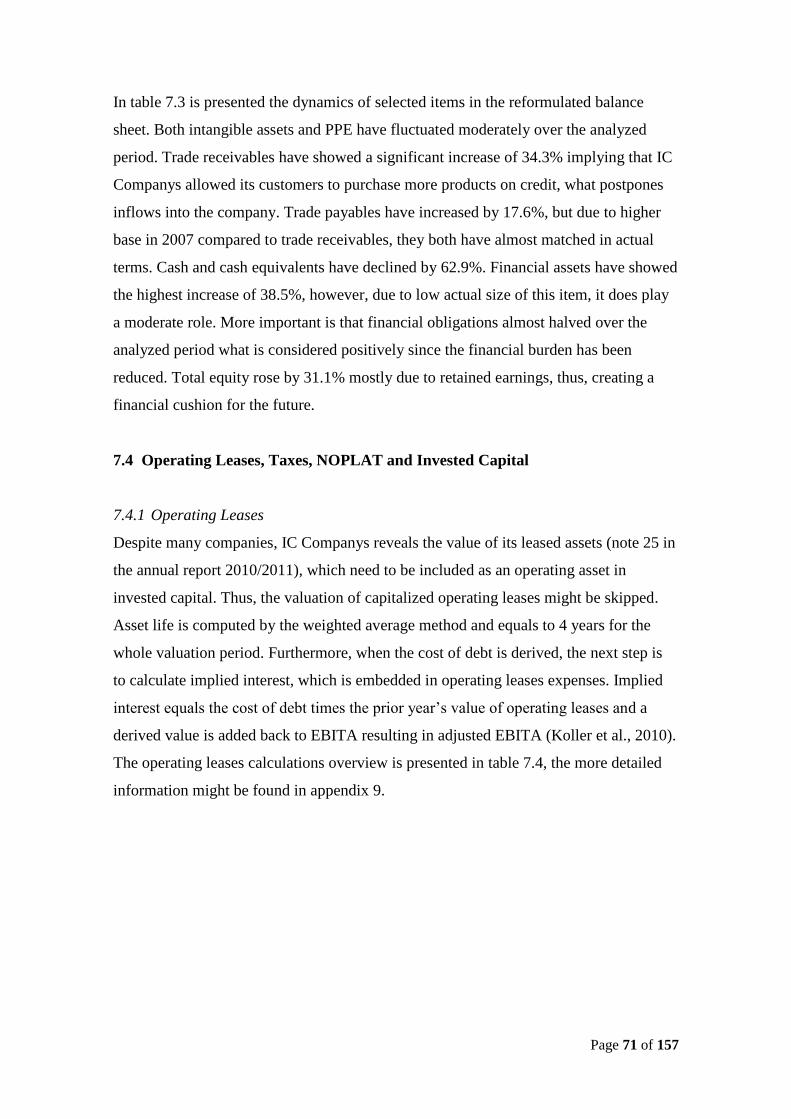
Page 71 of 157
In table 7.3 is presented the dynamics of selected items in the reformulated balance
sheet. Both intangible assets and PPE have fluctuated moderately over the analyzed
period. Trade receivables have showed a significant increase of 34.3% implying that IC
Companys allowed its customers to purchase more products on credit, what postpones
inflows into the company. Trade payables have increased by 17.6%, but due to higher
base in 2007 compared to trade receivables, they both have almost matched in actual
terms. Cash and cash equivalents have declined by 62.9%. Financial assets have showed
the highest increase of 38.5%, however, due to low actual size of this item, it does play
a moderate role. More important is that financial obligations almost halved over the
analyzed period what is considered positively since the financial burden has been
reduced. Total equity rose by 31.1% mostly due to retained earnings, thus, creating a
financial cushion for the future.
7.4 Operating Leases, Taxes, NOPLAT and Invested Capital
7.4.1 Operating Leases
Despite many companies, IC Companys reveals the value of its leased assets (note 25 in
the annual report 2010/2011), which need to be included as an operating asset in
invested capital. Thus, the valuation of capitalized operating leases might be skipped.
Asset life is computed by the weighted average method and equals to 4 years for the
whole valuation period. Furthermore, when the cost of debt is derived, the next step is
to calculate implied interest, which is embedded in operating leases expenses. Implied
interest equals the cost of debt times the prior year’s value of operating leases and a
derived value is added back to EBITA resulting in adjusted EBITA (Koller et al., 2010).
The operating leases calculations overview is presented in table 7.4, the more detailed
information might be found in appendix 9.
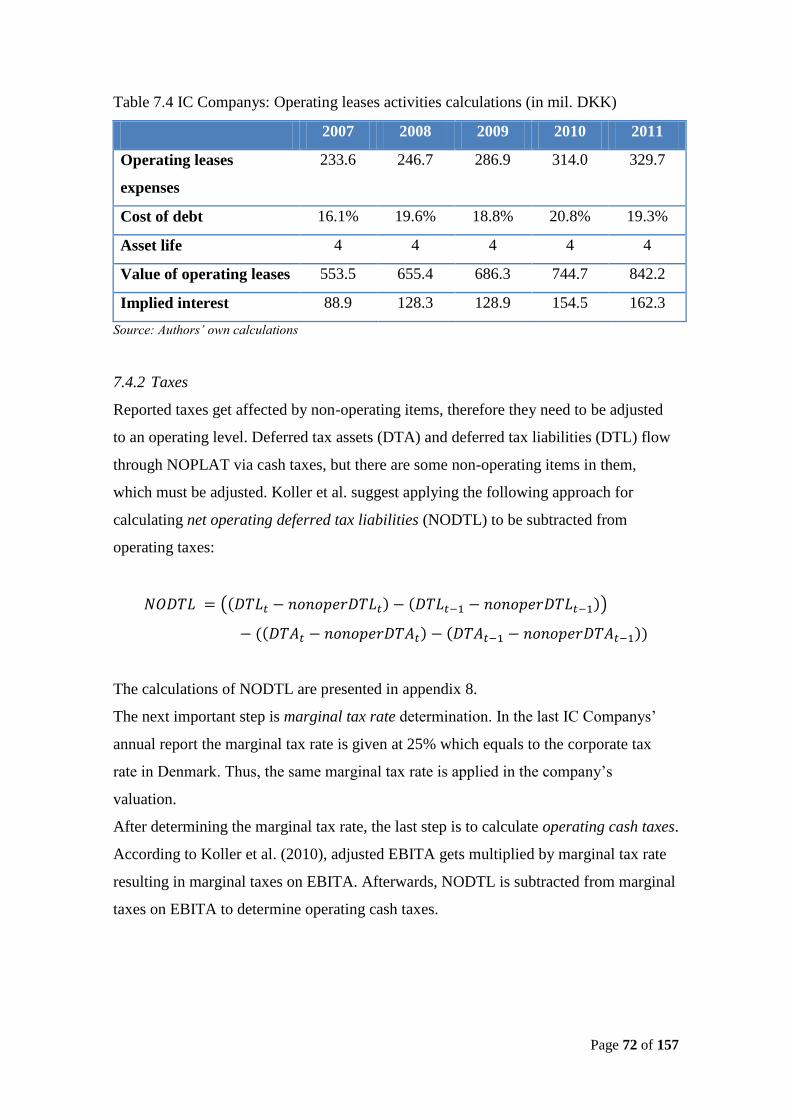
Page 72 of 157
Table 7.4 IC Companys: Operating leases activities calculations (in mil. DKK)
2007 2008 2009 2010 2011
Operating leases
expenses
233.6 246.7 286.9 314.0 329.7
Cost of debt 16.1% 19.6% 18.8% 20.8% 19.3%
Asset life 4 4 4 4 4
Value of operating leases 553.5 655.4 686.3 744.7 842.2
Implied interest 88.9 128.3 128.9 154.5 162.3
Source: Authors’ own calculations
7.4.2 Taxes
Reported taxes get affected by non-operating items, therefore they need to be adjusted
to an operating level. Deferred tax assets (DTA) and deferred tax liabilities (DTL) flow
through NOPLAT via cash taxes, but there are some non-operating items in them,
which must be adjusted. Koller et al. suggest applying the following approach for
calculating net operating deferred tax liabilities (NODTL) to be subtracted from
operating taxes:
( )
The calculations of NODTL are presented in appendix 8.
The next important step is marginal tax rate determination. In the last IC Companys’
annual report the marginal tax rate is given at 25% which equals to the corporate tax
rate in Denmark. Thus, the same marginal tax rate is applied in the company’s
valuation.
After determining the marginal tax rate, the last step is to calculate operating cash taxes.
According to Koller et al. (2010), adjusted EBITA gets multiplied by marginal tax rate
resulting in marginal taxes on EBITA. Afterwards, NODTL is subtracted from marginal
taxes on EBITA to determine operating cash taxes.
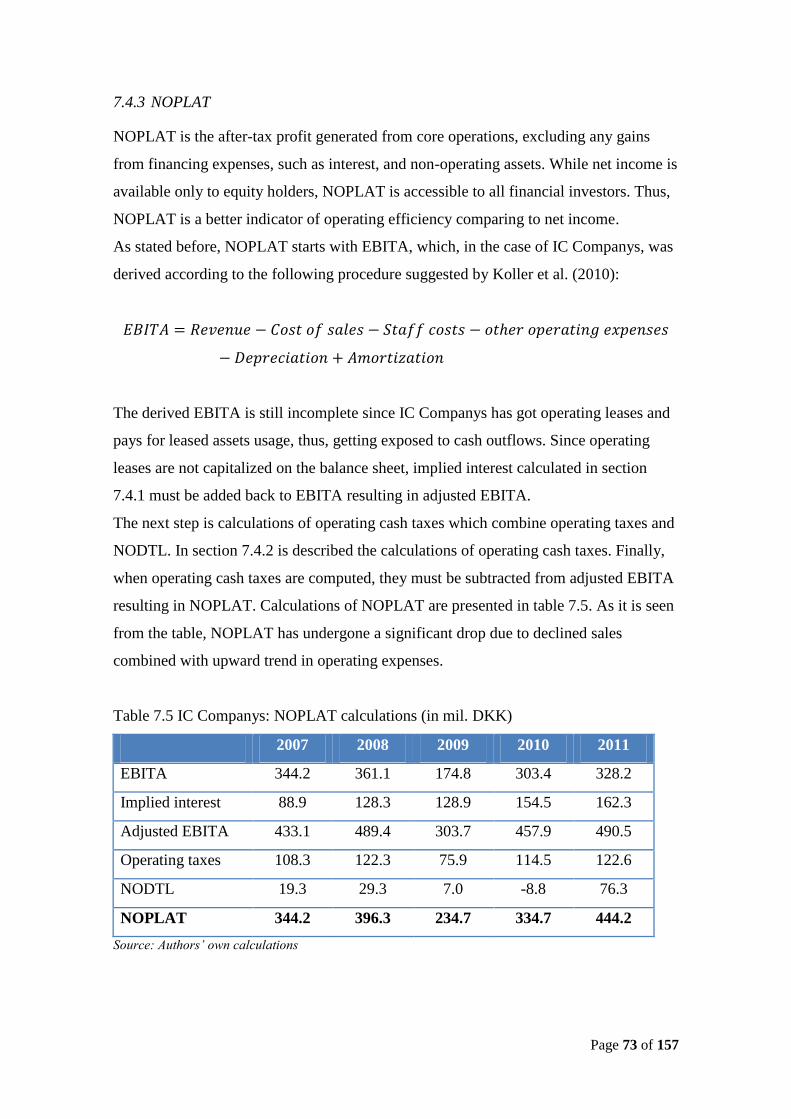
Page 73 of 157
7.4.3 NOPLAT
NOPLAT is the after-tax profit generated from core operations, excluding any gains
from financing expenses, such as interest, and non-operating assets. While net income is
available only to equity holders, NOPLAT is accessible to all financial investors. Thus,
NOPLAT is a better indicator of operating efficiency comparing to net income.
As stated before, NOPLAT starts with EBITA, which, in the case of IC Companys, was
derived according to the following procedure suggested by Koller et al. (2010):
The derived EBITA is still incomplete since IC Companys has got operating leases and
pays for leased assets usage, thus, getting exposed to cash outflows. Since operating
leases are not capitalized on the balance sheet, implied interest calculated in section
7.4.1 must be added back to EBITA resulting in adjusted EBITA.
The next step is calculations of operating cash taxes which combine operating taxes and
NODTL. In section 7.4.2 is described the calculations of operating cash taxes. Finally,
when operating cash taxes are computed, they must be subtracted from adjusted EBITA
resulting in NOPLAT. Calculations of NOPLAT are presented in table 7.5. As it is seen
from the table, NOPLAT has undergone a significant drop due to declined sales
combined with upward trend in operating expenses.
Table 7.5 IC Companys: NOPLAT calculations (in mil. DKK)
2007 2008 2009 2010 2011
EBITA 344.2 361.1 174.8 303.4 328.2
Implied interest 88.9 128.3 128.9 154.5 162.3
Adjusted EBITA 433.1 489.4 303.7 457.9 490.5
Operating taxes 108.3 122.3 75.9 114.5 122.6
NODTL 19.3 29.3 7.0 -8.8 76.3
NOPLAT 344.2 396.3 234.7 334.7 444.2
Source: Authors’ own calculations
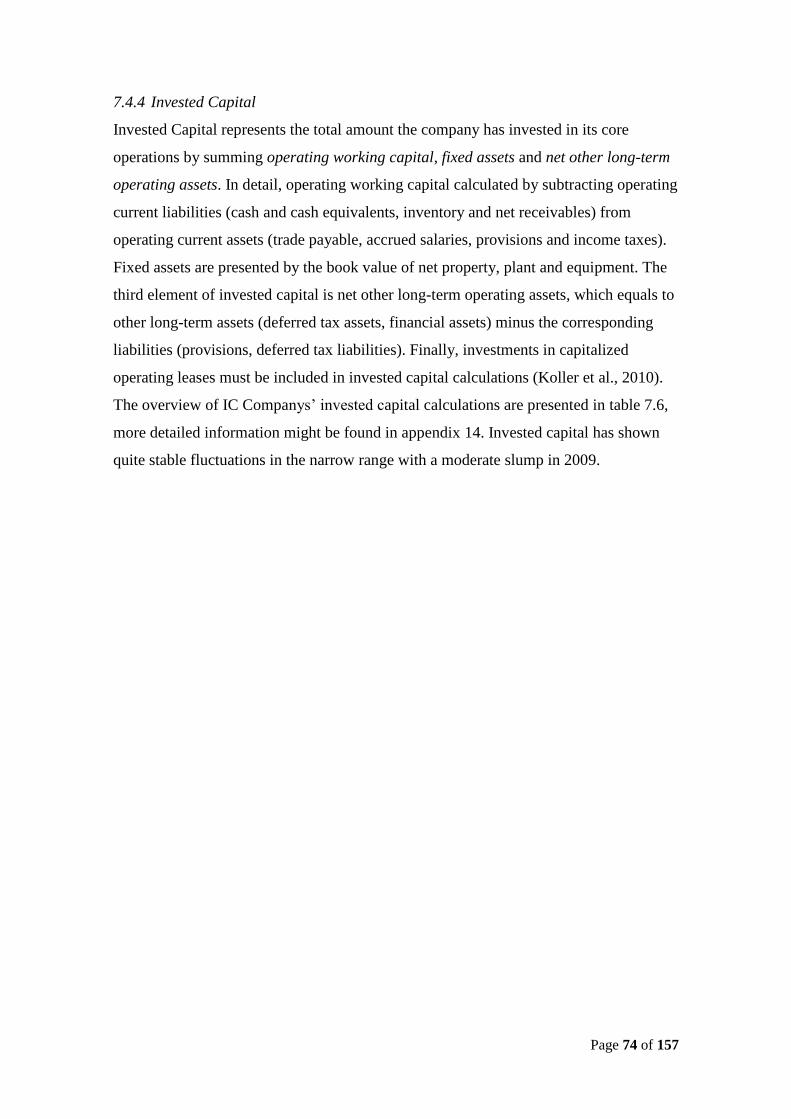
Page 74 of 157
7.4.4 Invested Capital
Invested Capital represents the total amount the company has invested in its core
operations by summing operating working capital, fixed assets and net other long-term
operating assets. In detail, operating working capital calculated by subtracting operating
current liabilities (cash and cash equivalents, inventory and net receivables) from
operating current assets (trade payable, accrued salaries, provisions and income taxes).
Fixed assets are presented by the book value of net property, plant and equipment. The
third element of invested capital is net other long-term operating assets, which equals to
other long-term assets (deferred tax assets, financial assets) minus the corresponding
liabilities (provisions, deferred tax liabilities). Finally, investments in capitalized
operating leases must be included in invested capital calculations (Koller et al., 2010).
The overview of IC Companys’ invested capital calculations are presented in table 7.6,
more detailed information might be found in appendix 14. Invested capital has shown
quite stable fluctuations in the narrow range with a moderate slump in 2009.
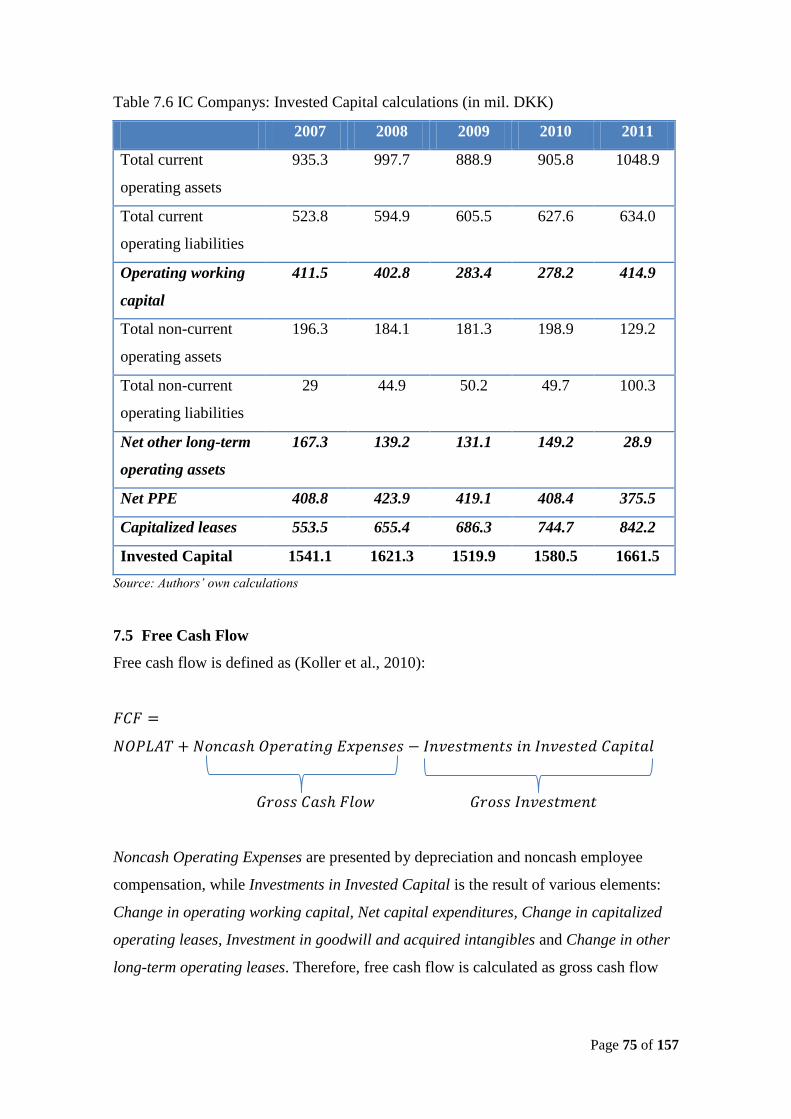
Page 75 of 157
Table 7.6 IC Companys: Invested Capital calculations (in mil. DKK)
2007 2008 2009 2010 2011
Total current
operating assets
935.3 997.7 888.9 905.8 1048.9
Total current
operating liabilities
523.8 594.9 605.5 627.6 634.0
Operating working
capital
411.5 402.8 283.4 278.2 414.9
Total non-current
operating assets
196.3 184.1 181.3 198.9 129.2
Total non-current
operating liabilities
29 44.9 50.2 49.7 100.3
Net other long-term
operating assets
167.3 139.2 131.1 149.2 28.9
Net PPE 408.8 423.9 419.1 408.4 375.5
Capitalized leases 553.5 655.4 686.3 744.7 842.2
Invested Capital 1541.1 1621.3 1519.9 1580.5 1661.5
Source: Authors’ own calculations
7.5 Free Cash Flow
Free cash flow is defined as (Koller et al., 2010):
Noncash Operating Expenses are presented by depreciation and noncash employee
compensation, while Investments in Invested Capital is the result of various elements:
Change in operating working capital, Net capital expenditures, Change in capitalized
operating leases, Investment in goodwill and acquired intangibles and Change in other
long-term operating leases. Therefore, free cash flow is calculated as gross cash flow
Page 76 of 157
minus gross investment. The overview of IC Companys’ free cash flow is presented in
table 7.7 and appendix 16.
Table 7.7 IC Companys: Free Cash Flow calculations (in mil. DKK)
2008 2009 2010 2011
NOPLAT 396.3 234.7 334.7 444.2
Depreciation 95.5 123.5 108.8 109.6
Gross Cash Flow 491.8 358.2 443.5 553.8
Gross Investment 174.8 -0.1 184.7 196.6
Free Cash Flow 317.0 358.3 258.8 357.2
Source: Authors’ own calculations
Free cash flow clearly shows the drop in sales affecting NOPLAT earned in 2009-2010.
Furthermore, operating working capital has decreased substantially during the financial
turmoil through cash and inventory, while operating liabilities slightly increased.
7.6 The Weighted Average Cost of Capital of IC Companys
As mentioned in section 6.1.2, WACC could be calculated by estimating its three
elements: the cost of debt, the cost of equity and the target capital structure of the
company (Frykman & Tolleryd, 2003). Thus, the formula for WACC looks as follows
(Koller et al., 2010):
Determination of the risk free rate
As stated in section 6.1.2, it is general technique to use the yield-to-maturity (YTM) of
the German Government Bonds as the risk free rate for companies based in Europe
taking into account that those securities are assumed to be the most liquid and of higher
credit quality than bonds of other European countries. However, since IC Companys’
sales mostly come from Scandinavian countries including almost 20% of Danish share,
it has been decided to take the YTM of the 10-year Danish Government Bonds, which is
2.98% as of 30 June 2011 (Bloomberg.com). Therefore, this YTM is used as the riskless
rate in the WACC calculation.
Page 77 of 157
Determination of the IC Companys’ cost of debt
As stated in section 6.1.2, the cost of debt could be determined by three components:
the risk free rate, the default spread and the tax rate. IC Companys has not issued any
debt obligations, but relies solely on loans from credit institutions. Thus, the company’s
debt is not traded on open market and the interest rate on those obligations is directly
derived from the company’s annual report. In the last financial statement (Note 29), IC
Companys states that it holds two loans from credit institutions: 224.7 mil. DKK in
current liabilities and 140.0 mil. DKK in non-current liabilities with the effective
interest rates of 2.99% and 2.02%, respectively. Thus, it has been decided to calculate
the weighted average cost of debt (WAECD). The calculation looks as follows:
Thus, the WACD already combines the risk free rate and the default spread. The derived
cost of debt is lower than the risk free rate. First of all, the difference could arise due to
timing reasons – the risk free rate was determined after the loans had been taken.
Secondly, the loan accounted in non-current liabilities is the mortgage loan, thus it is
pledged by the security in the form of the company’s headquarters. The loans accounted
in current liabilities are operating and short-term ones. Thirdly, both interest rates are
floating taking into account that in recent years interest rates have been on their
historically low levels.
By using IC Companys’ marginal tax rate of 25%, the after tax cost of debt is calculated
as follows:
Determination of the IC Companys’ cost of operating leases
IC Companys’ does not provide any information in its annual reports concerning the
level of the cost of operating lease. Thus, Koller et al. (2010) suggest estimating the cost
of operating leases using AA-rated corporate bond yields. The next step is to determine
the maturity of corporate bonds in order to match it with operating asset life. For the
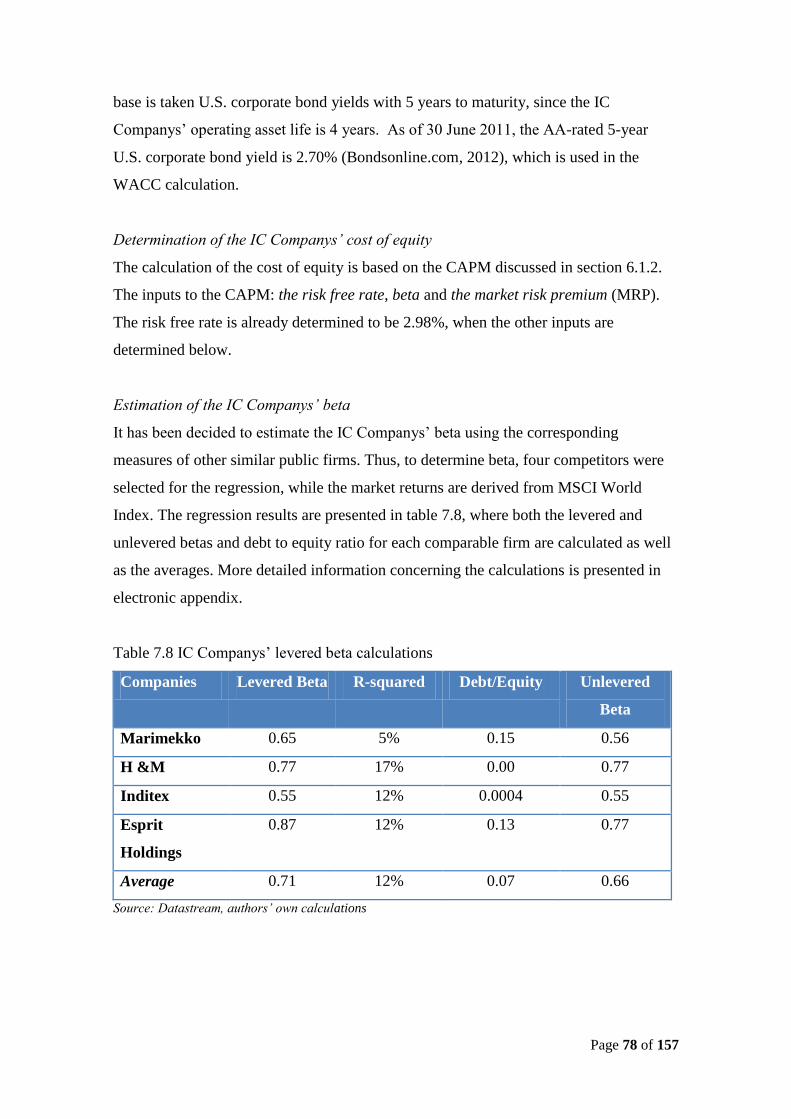
Page 78 of 157
base is taken U.S. corporate bond yields with 5 years to maturity, since the IC
Companys’ operating asset life is 4 years. As of 30 June 2011, the AA-rated 5-year
U.S. corporate bond yield is 2.70% (Bondsonline.com, 2012), which is used in the
WACC calculation.
Determination of the IC Companys’ cost of equity
The calculation of the cost of equity is based on the CAPM discussed in section 6.1.2.
The inputs to the CAPM: the risk free rate, beta and the market risk premium (MRP).
The risk free rate is already determined to be 2.98%, when the other inputs are
determined below.
Estimation of the IC Companys’ beta
It has been decided to estimate the IC Companys’ beta using the corresponding
measures of other similar public firms. Thus, to determine beta, four competitors were
selected for the regression, while the market returns are derived from MSCI World
Index. The regression results are presented in table 7.8, where both the levered and
unlevered betas and debt to equity ratio for each comparable firm are calculated as well
as the averages. More detailed information concerning the calculations is presented in
electronic appendix.
Table 7.8 IC Companys’ levered beta calculations
Companies Levered Beta R-squared Debt/Equity Unlevered
Beta
Marimekko 0.65 5% 0.15 0.56
H &M 0.77 17% 0.00 0.77
Inditex 0.55 12% 0.0004 0.55
Esprit
Holdings
0.87 12% 0.13 0.77
Average 0.71 12% 0.07 0.66
Source: Datastream, authors’ own calculations
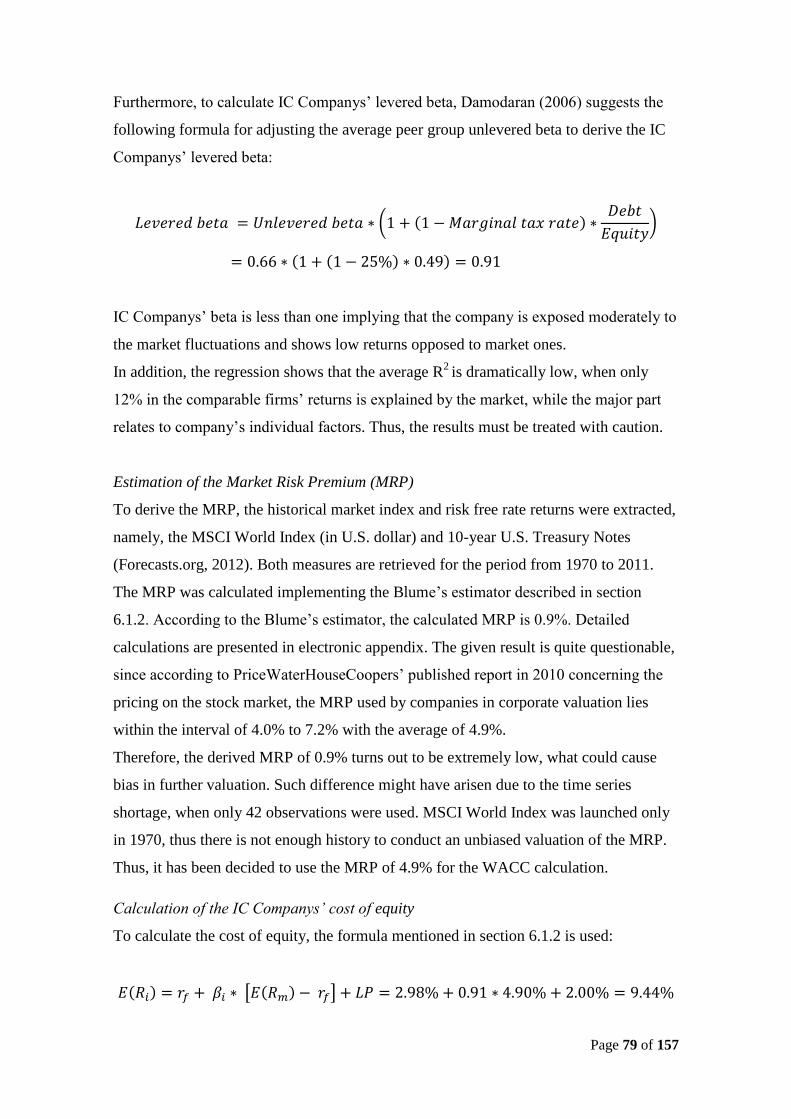
Page 79 of 157
Furthermore, to calculate IC Companys’ levered beta, Damodaran (2006) suggests the
following formula for adjusting the average peer group unlevered beta to derive the IC
Companys’ levered beta:
(
)
IC Companys’ beta is less than one implying that the company is exposed moderately to
the market fluctuations and shows low returns opposed to market ones.
In addition, the regression shows that the average R2 is dramatically low, when only
12% in the comparable firms’ returns is explained by the market, while the major part
relates to company’s individual factors. Thus, the results must be treated with caution.
Estimation of the Market Risk Premium (MRP)
To derive the MRP, the historical market index and risk free rate returns were extracted,
namely, the MSCI World Index (in U.S. dollar) and 10-year U.S. Treasury Notes
(Forecasts.org, 2012). Both measures are retrieved for the period from 1970 to 2011.
The MRP was calculated implementing the Blume’s estimator described in section
6.1.2. According to the Blume’s estimator, the calculated MRP is 0.9%. Detailed
calculations are presented in electronic appendix. The given result is quite questionable,
since according to PriceWaterHouseCoopers’ published report in 2010 concerning the
pricing on the stock market, the MRP used by companies in corporate valuation lies
within the interval of 4.0% to 7.2% with the average of 4.9%.
Therefore, the derived MRP of 0.9% turns out to be extremely low, what could cause
bias in further valuation. Such difference might have arisen due to the time series
shortage, when only 42 observations were used. MSCI World Index was launched only
in 1970, thus there is not enough history to conduct an unbiased valuation of the MRP.
Thus, it has been decided to use the MRP of 4.9% for the WACC calculation.
Calculation of the IC Companys’ cost of equity
To calculate the cost of equity, the formula mentioned in section 6.1.2 is used:
[ ]
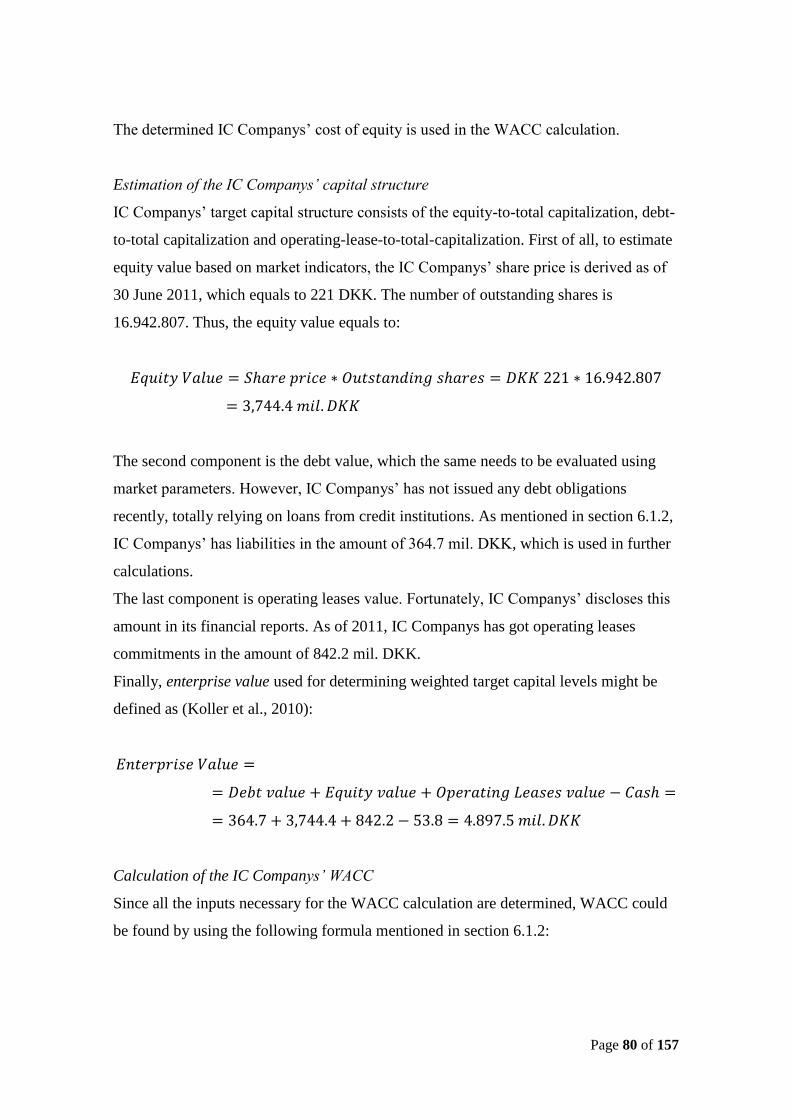
Page 80 of 157
The determined IC Companys’ cost of equity is used in the WACC calculation.
Estimation of the IC Companys’ capital structure
IC Companys’ target capital structure consists of the equity-to-total capitalization, debt-
to-total capitalization and operating-lease-to-total-capitalization. First of all, to estimate
equity value based on market indicators, the IC Companys’ share price is derived as of
30 June 2011, which equals to 221 DKK. The number of outstanding shares is
16.942.807. Thus, the equity value equals to:
The second component is the debt value, which the same needs to be evaluated using
market parameters. However, IC Companys’ has not issued any debt obligations
recently, totally relying on loans from credit institutions. As mentioned in section 6.1.2,
IC Companys’ has liabilities in the amount of 364.7 mil. DKK, which is used in further
calculations.
The last component is operating leases value. Fortunately, IC Companys’ discloses this
amount in its financial reports. As of 2011, IC Companys has got operating leases
commitments in the amount of 842.2 mil. DKK.
Finally, enterprise value used for determining weighted target capital levels might be
defined as (Koller et al., 2010):
Calculation of the IC Companys’ WACC
Since all the inputs necessary for the WACC calculation are determined, WACC could
be found by using the following formula mentioned in section 6.1.2:
Page 81 of 157
More comprehensive information concerning the WACC calculation might be found in
appendix 18 and electronic appendix.
As mentioned in section 6.1.2, slight changes in WACC could lead to significant swings
in the company’s value. Therefore, the sensitivity analysis is conducted in section 7.11
to examine how changes in WACC affect the company’s value parameters.
7.7 Forecasting of the IC Companys’ free cash flow
The enterprise DCF valuation model solely relies on forecasted free cash flow.
However, free cash flow should be created implicitly by first forecasting the income
statement and balance sheet (Koller et al., 2010).
To forecast the income statement, Koller et al. (2010) suggest a three-step process in
relation to each line item:
1. Decide what economic relationships drive the line item;
2. Estimate the forecast ratio;
3. Multiply the forecast ratio by an estimate of its driver.
Furthermore, Koller et al. (2010) advise typical forecast driver for few line items. For
example, revenues are a common driver of cost of goods sold and staff. Prior-year net
property, plant, and equipment and prior-year intangible assets are typical drivers of
depreciation and amortization, respectively.
To forecast the balance sheet, Koller et al., (2010) favor the relationship between the
balance sheet accounts and revenues being the most stable. Thus, the most of the IC
Companys’ operating items are forecasted based on revenues, while non-operating
accounts are fixed throughout the forecasting period. For example, revenues are typical
driver of accounts receivable and PP&E. The complete information concerning
forecasting of the income statement and balance sheet might be found in appendixes 4
and 6, respectively.
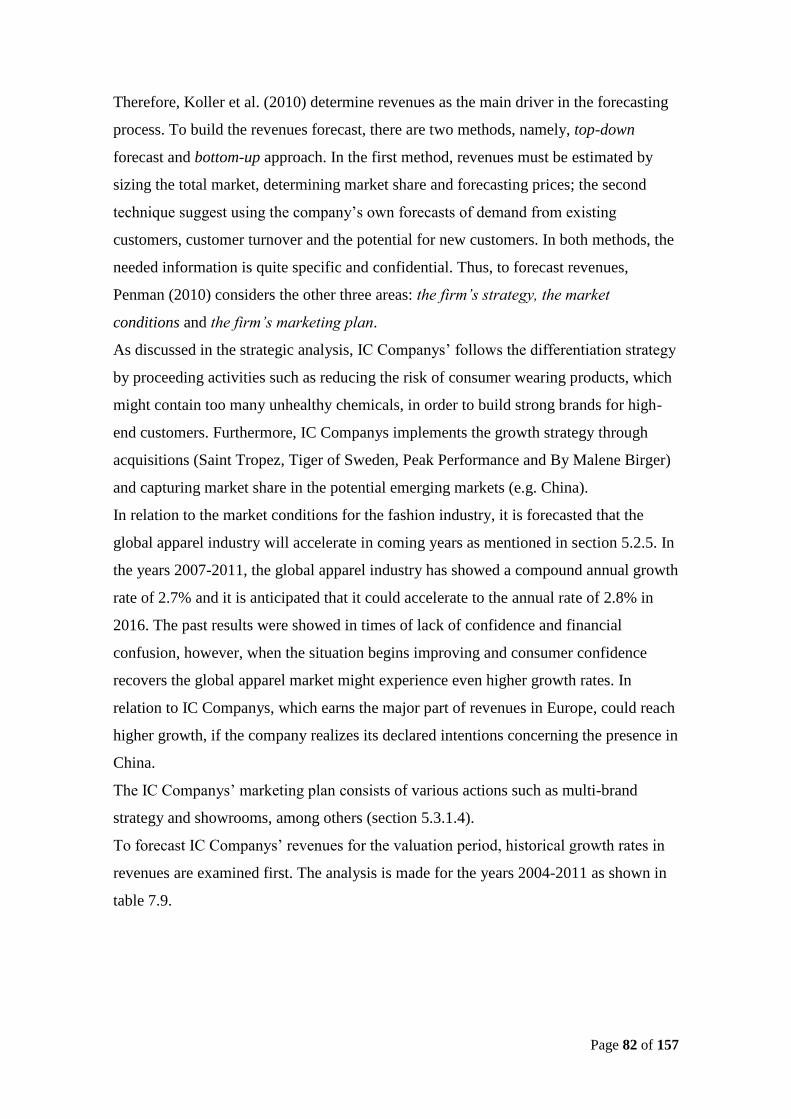
Page 82 of 157
Therefore, Koller et al. (2010) determine revenues as the main driver in the forecasting
process. To build the revenues forecast, there are two methods, namely, top-down
forecast and bottom-up approach. In the first method, revenues must be estimated by
sizing the total market, determining market share and forecasting prices; the second
technique suggest using the company’s own forecasts of demand from existing
customers, customer turnover and the potential for new customers. In both methods, the
needed information is quite specific and confidential. Thus, to forecast revenues,
Penman (2010) considers the other three areas: the firm’s strategy, the market
conditions and the firm’s marketing plan.
As discussed in the strategic analysis, IC Companys’ follows the differentiation strategy
by proceeding activities such as reducing the risk of consumer wearing products, which
might contain too many unhealthy chemicals, in order to build strong brands for high-
end customers. Furthermore, IC Companys implements the growth strategy through
acquisitions (Saint Tropez, Tiger of Sweden, Peak Performance and By Malene Birger)
and capturing market share in the potential emerging markets (e.g. China).
In relation to the market conditions for the fashion industry, it is forecasted that the
global apparel industry will accelerate in coming years as mentioned in section 5.2.5. In
the years 2007-2011, the global apparel industry has showed a compound annual growth
rate of 2.7% and it is anticipated that it could accelerate to the annual rate of 2.8% in
2016. The past results were showed in times of lack of confidence and financial
confusion, however, when the situation begins improving and consumer confidence
recovers the global apparel market might experience even higher growth rates. In
relation to IC Companys, which earns the major part of revenues in Europe, could reach
higher growth, if the company realizes its declared intentions concerning the presence in
China.
The IC Companys’ marketing plan consists of various actions such as multi-brand
strategy and showrooms, among others (section 5.3.1.4).
To forecast IC Companys’ revenues for the valuation period, historical growth rates in
revenues are examined first. The analysis is made for the years 2004-2011 as shown in
table 7.9.
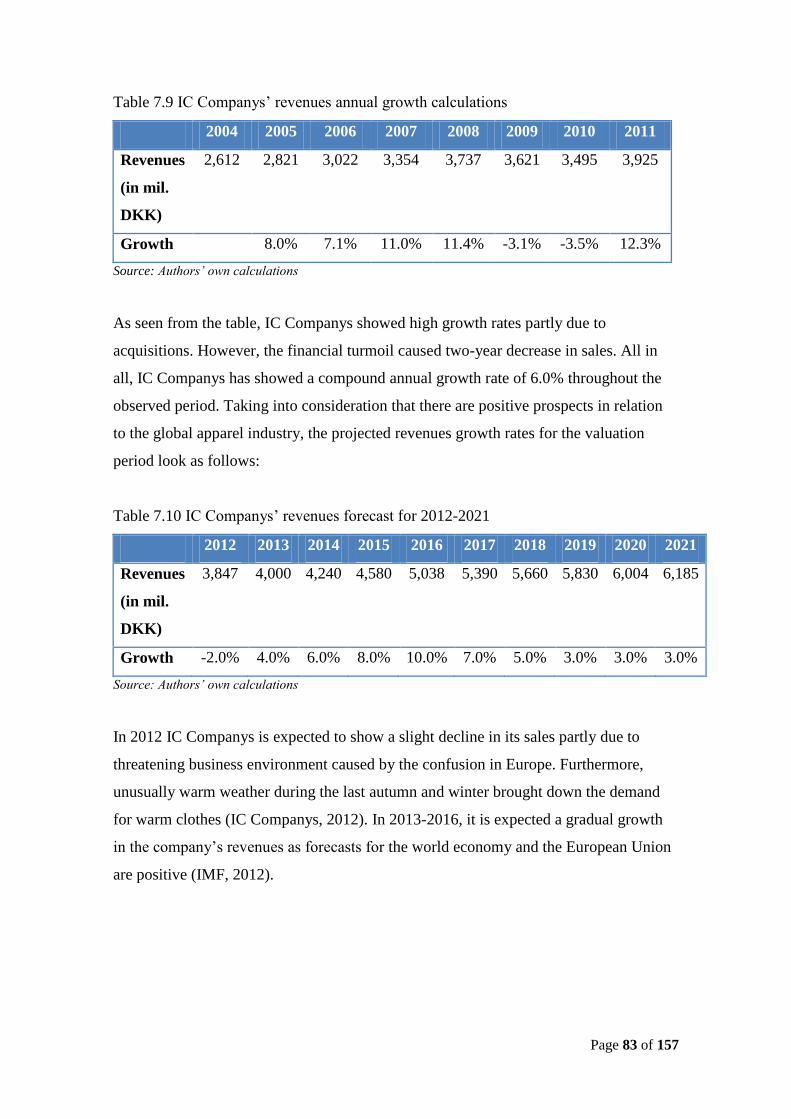
Page 83 of 157
Table 7.9 IC Companys’ revenues annual growth calculations
2004 2005 2006 2007 2008 2009 2010 2011
Revenues
(in mil.
DKK)
2,612 2,821 3,022 3,354 3,737 3,621 3,495 3,925
Growth 8.0% 7.1% 11.0% 11.4% -3.1% -3.5% 12.3%
Source: Authors’ own calculations
As seen from the table, IC Companys showed high growth rates partly due to
acquisitions. However, the financial turmoil caused two-year decrease in sales. All in
all, IC Companys has showed a compound annual growth rate of 6.0% throughout the
observed period. Taking into consideration that there are positive prospects in relation
to the global apparel industry, the projected revenues growth rates for the valuation
period look as follows:
Table 7.10 IC Companys’ revenues forecast for 2012-2021
2012 2013 2014 2015 2016 2017 2018 2019 2020 2021
Revenues
(in mil.
DKK)
3,847 4,000 4,240 4,580 5,038 5,390 5,660 5,830 6,004 6,185
Growth -2.0% 4.0% 6.0% 8.0% 10.0% 7.0% 5.0% 3.0% 3.0% 3.0%
Source: Authors’ own calculations
In 2012 IC Companys is expected to show a slight decline in its sales partly due to
threatening business environment caused by the confusion in Europe. Furthermore,
unusually warm weather during the last autumn and winter brought down the demand
for warm clothes (IC Companys, 2012). In 2013-2016, it is expected a gradual growth
in the company’s revenues as forecasts for the world economy and the European Union
are positive (IMF, 2012).
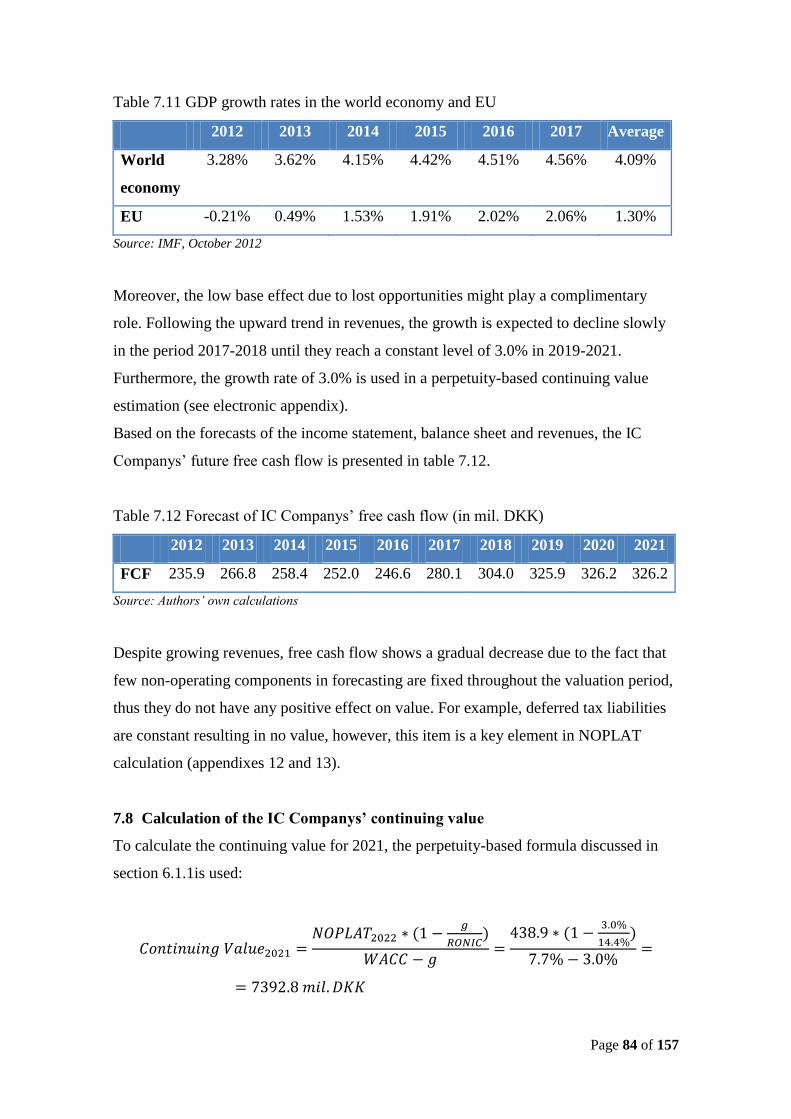
Page 84 of 157
Table 7.11 GDP growth rates in the world economy and EU
2012 2013 2014 2015 2016 2017 Average
World
economy
3.28% 3.62% 4.15% 4.42% 4.51% 4.56% 4.09%
EU -0.21% 0.49% 1.53% 1.91% 2.02% 2.06% 1.30%
Source: IMF, October 2012
Moreover, the low base effect due to lost opportunities might play a complimentary
role. Following the upward trend in revenues, the growth is expected to decline slowly
in the period 2017-2018 until they reach a constant level of 3.0% in 2019-2021.
Furthermore, the growth rate of 3.0% is used in a perpetuity-based continuing value
estimation (see electronic appendix).
Based on the forecasts of the income statement, balance sheet and revenues, the IC
Companys’ future free cash flow is presented in table 7.12.
Table 7.12 Forecast of IC Companys’ free cash flow (in mil. DKK)
2012 2013 2014 2015 2016 2017 2018 2019 2020 2021
FCF 235.9 266.8 258.4 252.0 246.6 280.1 304.0 325.9 326.2 326.2
Source: Authors’ own calculations
Despite growing revenues, free cash flow shows a gradual decrease due to the fact that
few non-operating components in forecasting are fixed throughout the valuation period,
thus they do not have any positive effect on value. For example, deferred tax liabilities
are constant resulting in no value, however, this item is a key element in NOPLAT
calculation (appendixes 12 and 13).
7.8 Calculation of the IC Companys’ continuing value
To calculate the continuing value for 2021, the perpetuity-based formula discussed in
section 6.1.1is used:
Page 85 of 157
To estimate the present value, the calculated continuing value must be discounted back
to the end of 2011 by 10 years:
7.9 Calculation of the IC Companys’ share price
According to Koller et al. (2010), the first step in the company’s valuation is the
determination of value of operations, where the standard formula of DCF model
described in section 6.1 is used:
When the value of operations is determined, the enterprise value might be calculated by
adding non-operating assets. In the case of IC Companys, tax loss carry-forwards are
summed to the value of operations resulting in the enterprise value:
When enterprise value is derived, other non-equity claims must be identified and
subtracted from the enterprise value in order to find equity value. IC Companys has
several non-equity claims to deduct from the enterprise value: debt, capitalized
operating leases, stock options, retirement-related liabilities and minority interest. The
calculation of the IC Companys’ equity value is presented below:
Page 86 of 157
Finally, to estimate price per share, the equity value needs to be divided by the number
of shares outstanding:
Since the forecasting of the company’s revenues involves relying on the assumptions
concerning the growth in the world economy, regional economies and global apparel
industry, it is obvious that these forecasts contain some degree of uncertainty. Thus, to
address that uncertainty, the scenario and sensitivity analyses are performed in sections
7.10 and 7.11, respectively.
7.10 Scenario analysis
According to Koller et al. (2010), valuation requires a forecast, however, the future
might take many paths. Therefore, since the future is never actually knowable, it is
reasonable to consider financial projections under different scenarios.
The valuation of IC Companys is based on projecting the company’s revenues growth,
thus, it has been decided to examine how changes in the revenues growth affect the
company’s value and share price. The scenario analysis implies considering three paths
– best case, base case and worst case. The comprehensive information concerning the
scenario analysis is presented in appendix 26. The results obtained in the DCF valuation
are considered as the base scenario, therefore, are not elaborated further. The best and
worst case scenarios are described below.
Best case scenario
The best case scenario assumes that IC Companys could avoid negative effects of the
European financial contagion and repeat the last year results. With the anticipation that
the world economy will find the way to recovery, the growth might accelerate reaching
more than 4.0% annually until 2017 (IMF, 2012). In addition, IC Companys will
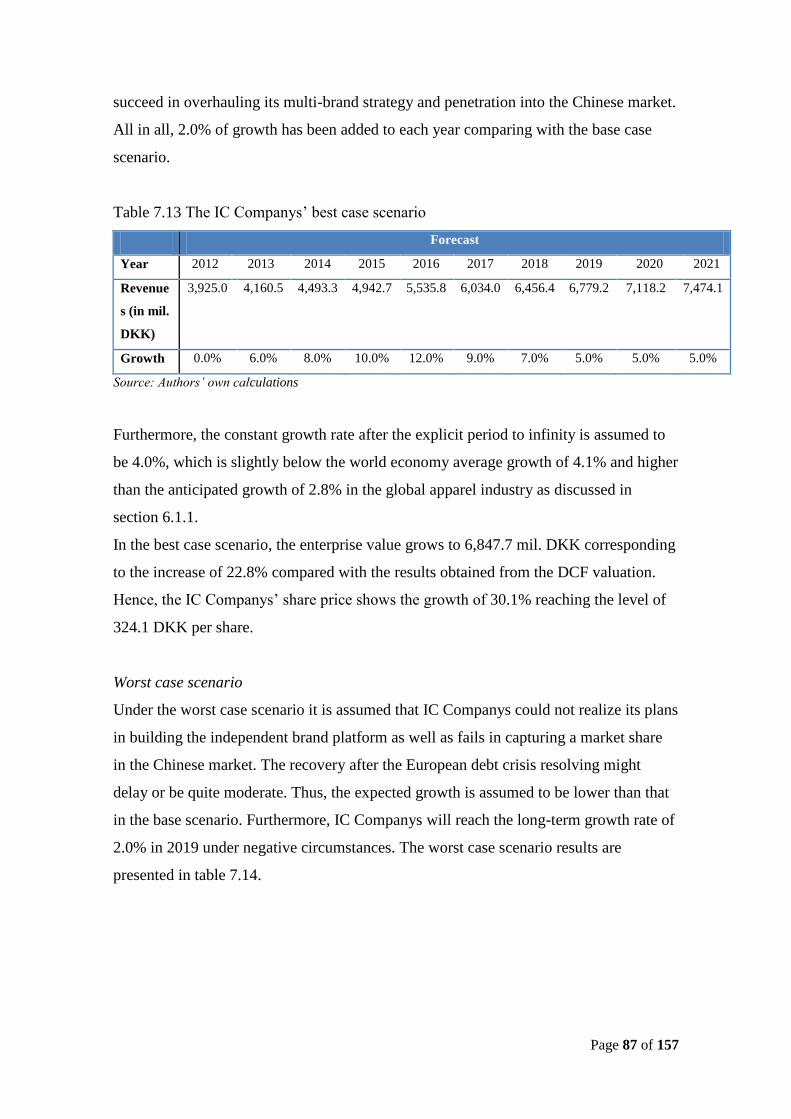
Page 87 of 157
succeed in overhauling its multi-brand strategy and penetration into the Chinese market.
All in all, 2.0% of growth has been added to each year comparing with the base case
scenario.
Table 7.13 The IC Companys’ best case scenario
Forecast
Year 2012 2013 2014 2015 2016 2017 2018 2019 2020 2021
Revenue
s (in mil.
DKK)
3,925.0 4,160.5 4,493.3 4,942.7 5,535.8 6,034.0 6,456.4 6,779.2 7,118.2 7,474.1
Growth 0.0% 6.0% 8.0% 10.0% 12.0% 9.0% 7.0% 5.0% 5.0% 5.0%
Source: Authors’ own calculations
Furthermore, the constant growth rate after the explicit period to infinity is assumed to
be 4.0%, which is slightly below the world economy average growth of 4.1% and higher
than the anticipated growth of 2.8% in the global apparel industry as discussed in
section 6.1.1.
In the best case scenario, the enterprise value grows to 6,847.7 mil. DKK corresponding
to the increase of 22.8% compared with the results obtained from the DCF valuation.
Hence, the IC Companys’ share price shows the growth of 30.1% reaching the level of
324.1 DKK per share.
Worst case scenario
Under the worst case scenario it is assumed that IC Companys could not realize its plans
in building the independent brand platform as well as fails in capturing a market share
in the Chinese market. The recovery after the European debt crisis resolving might
delay or be quite moderate. Thus, the expected growth is assumed to be lower than that
in the base scenario. Furthermore, IC Companys will reach the long-term growth rate of
2.0% in 2019 under negative circumstances. The worst case scenario results are
presented in table 7.14.
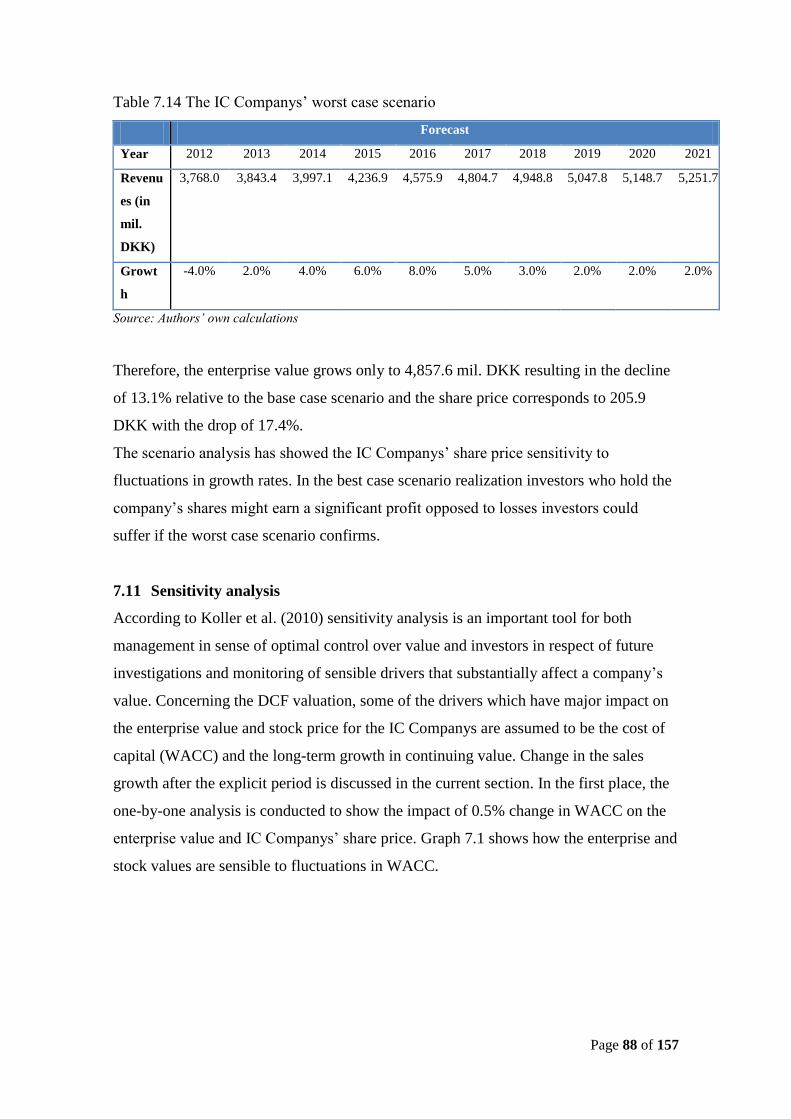
Page 88 of 157
Table 7.14 The IC Companys’ worst case scenario
Forecast
Year 2012 2013 2014 2015 2016 2017 2018 2019 2020 2021
Revenu
es (in
mil.
DKK)
3,768.0 3,843.4 3,997.1 4,236.9 4,575.9 4,804.7 4,948.8 5,047.8 5,148.7 5,251.7
Growt
h
-4.0% 2.0% 4.0% 6.0% 8.0% 5.0% 3.0% 2.0% 2.0% 2.0%
Source: Authors’ own calculations
Therefore, the enterprise value grows only to 4,857.6 mil. DKK resulting in the decline
of 13.1% relative to the base case scenario and the share price corresponds to 205.9
DKK with the drop of 17.4%.
The scenario analysis has showed the IC Companys’ share price sensitivity to
fluctuations in growth rates. In the best case scenario realization investors who hold the
company’s shares might earn a significant profit opposed to losses investors could
suffer if the worst case scenario confirms.
7.11 Sensitivity analysis
According to Koller et al. (2010) sensitivity analysis is an important tool for both
management in sense of optimal control over value and investors in respect of future
investigations and monitoring of sensible drivers that substantially affect a company’s
value. Concerning the DCF valuation, some of the drivers which have major impact on
the enterprise value and stock price for the IC Companys are assumed to be the cost of
capital (WACC) and the long-term growth in continuing value. Change in the sales
growth after the explicit period is discussed in the current section. In the first place, the
one-by-one analysis is conducted to show the impact of 0.5% change in WACC on the
enterprise value and IC Companys’ share price. Graph 7.1 shows how the enterprise and
stock values are sensible to fluctuations in WACC.
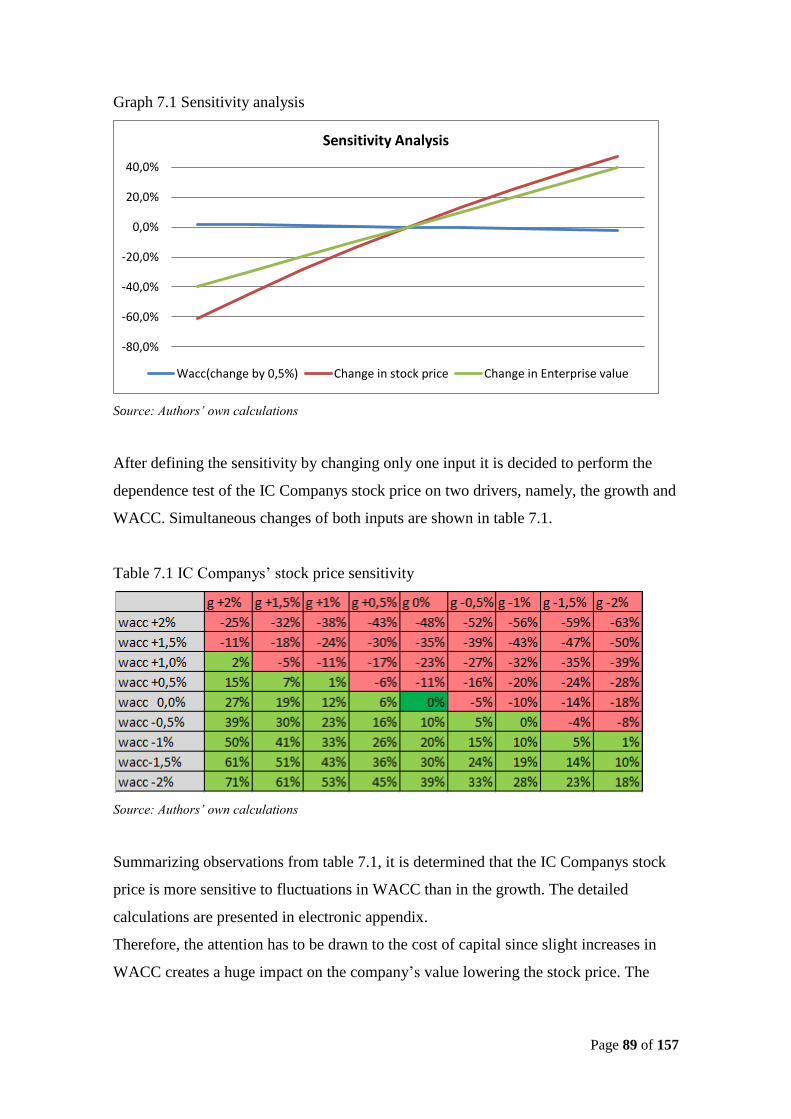
Page 89 of 157
Graph 7.1 Sensitivity analysis
Source: Authors’ own calculations
After defining the sensitivity by changing only one input it is decided to perform the
dependence test of the IC Companys stock price on two drivers, namely, the growth and
WACC. Simultaneous changes of both inputs are shown in table 7.1.
Table 7.1 IC Companys’ stock price sensitivity
Source: Authors’ own calculations
Summarizing observations from table 7.1, it is determined that the IC Companys stock
price is more sensitive to fluctuations in WACC than in the growth. The detailed
calculations are presented in electronic appendix.
Therefore, the attention has to be drawn to the cost of capital since slight increases in
WACC creates a huge impact on the company’s value lowering the stock price. The
-80,0%
-60,0%
-40,0%
-20,0%
0,0%
20,0%
40,0%
Sensitivity Analysis
Wacc(change by 0,5%) Change in stock price Change in Enterprise value
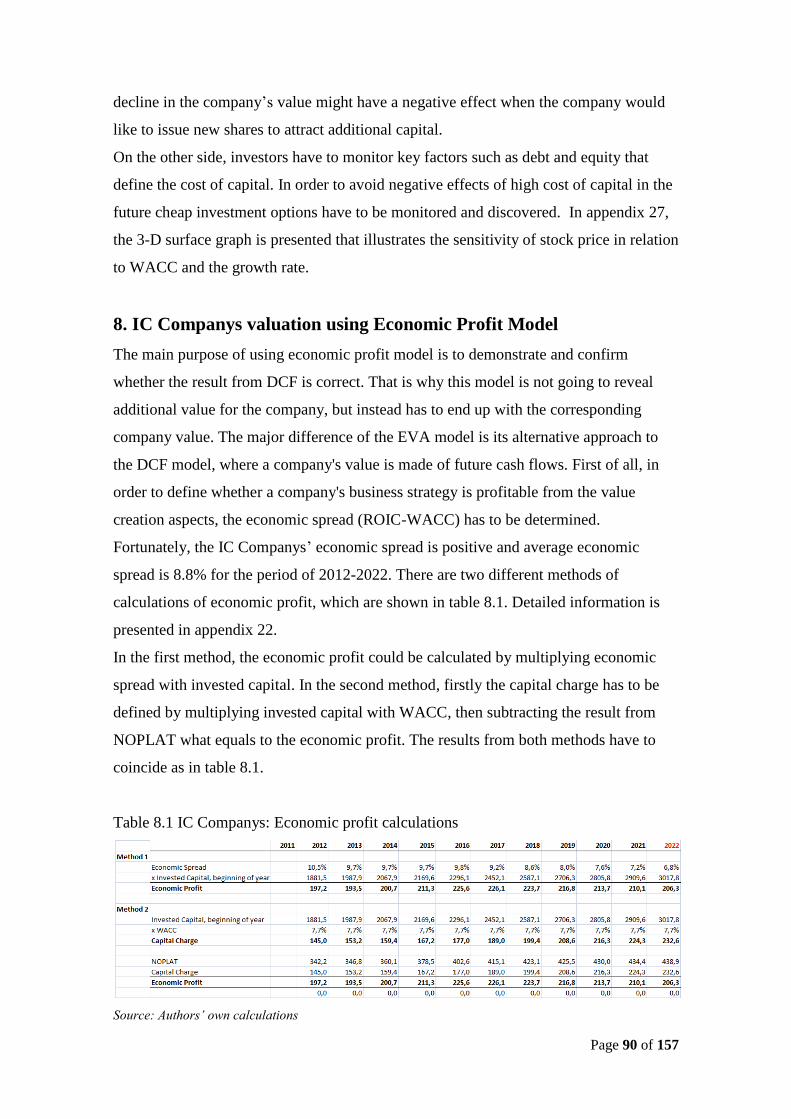
Page 90 of 157
decline in the company’s value might have a negative effect when the company would
like to issue new shares to attract additional capital.
On the other side, investors have to monitor key factors such as debt and equity that
define the cost of capital. In order to avoid negative effects of high cost of capital in the
future cheap investment options have to be monitored and discovered. In appendix 27,
the 3-D surface graph is presented that illustrates the sensitivity of stock price in relation
to WACC and the growth rate.
8. IC Companys valuation using Economic Profit Model
The main purpose of using economic profit model is to demonstrate and confirm
whether the result from DCF is correct. That is why this model is not going to reveal
additional value for the company, but instead has to end up with the corresponding
company value. The major difference of the EVA model is its alternative approach to
the DCF model, where a company's value is made of future cash flows. First of all, in
order to define whether a company's business strategy is profitable from the value
creation aspects, the economic spread (ROIC-WACC) has to be determined.
Fortunately, the IC Companys’ economic spread is positive and average economic
spread is 8.8% for the period of 2012-2022. There are two different methods of
calculations of economic profit, which are shown in table 8.1. Detailed information is
presented in appendix 22.
In the first method, the economic profit could be calculated by multiplying economic
spread with invested capital. In the second method, firstly the capital charge has to be
defined by multiplying invested capital with WACC, then subtracting the result from
NOPLAT what equals to the economic profit. The results from both methods have to
coincide as in table 8.1.
Table 8.1 IC Companys: Economic profit calculations
Source: Authors’ own calculations
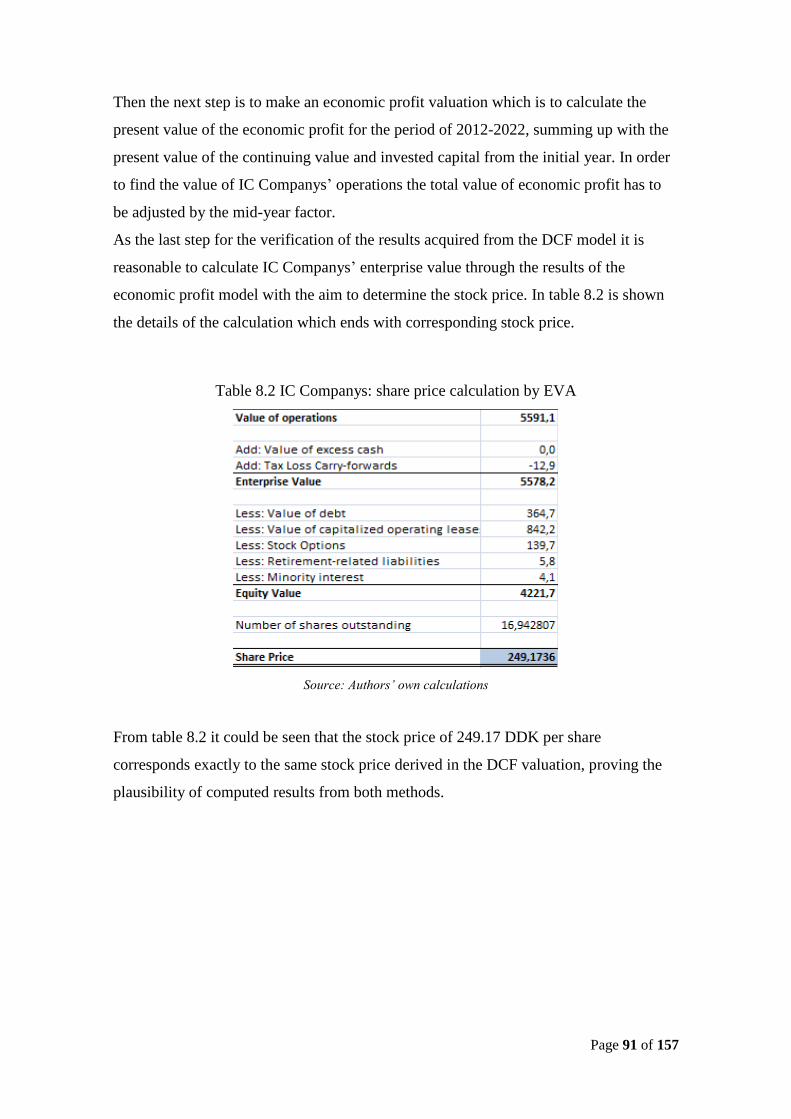
Page 91 of 157
Then the next step is to make an economic profit valuation which is to calculate the
present value of the economic profit for the period of 2012-2022, summing up with the
present value of the continuing value and invested capital from the initial year. In order
to find the value of IC Companys’ operations the total value of economic profit has to
be adjusted by the mid-year factor.
As the last step for the verification of the results acquired from the DCF model it is
reasonable to calculate IC Companys’ enterprise value through the results of the
economic profit model with the aim to determine the stock price. In table 8.2 is shown
the details of the calculation which ends with corresponding stock price.
Table 8.2 IC Companys: share price calculation by EVA
Source: Authors’ own calculations
From table 8.2 it could be seen that the stock price of 249.17 DDK per share
corresponds exactly to the same stock price derived in the DCF valuation, proving the
plausibility of computed results from both methods.
Page 92 of 157
9. Real Options Valuation of IC Companys
In the theoretical part related to real options valuation it has already been discussed that
by using traditional DCF model, valuation does not include a management flexibility
concerning a company’s opportunities in the future investment prospects. Valuation
based on the DCF model usually results with lower company value which excludes any
possible alternatives regarding future growth investments. Proceeding from
aforementioned it is decided to include real options valuation of IC Companys in order
to reveal comprehensive company value.
IC Companys’ growth strategy might be divided into two entities. On the one hand, for
the last ten years company has been growing by mergers and acquisitions as an example
it could be mentioned the acquisition of By Malene Birger, Saint Tropez, etc. On the
other hand, according to IC Companys’ annual reports, growth of the company for the
recent years was based on operating new shops and franchising mainly in Europe and
slightly in the emerging markets. By making some observations it could be stated that
there are great opportunities within the apparel sector for the growth option in the
emerging markets which is not actively adopted in the IC Companys. Even though IC
Companys has experienced negative progress in the Chinese market, it is decided to
implement expansion option in the potentially relevant emerging markets other than
China.
9.1 Expansion option
In order to implement option to expand in the first place it has to be identified business
environment in the emerging markets as in fact there are many countries in the different
continents that need specific approach. The most popular emerging markets are
considered to be the BRIC (Brazil, Russia, India and China) countries. The intention is
to determine country where business environment for apparel market is more
convenient and economically beneficial. In order to observe those characteristics in the
determined country it is very important to have access to the publicly traded companies'
hard data with the aim to calculate markets volatility. Then the next step is to exclude
those countries where IC Companys is already operating. Based on above mentioned
assumptions, it was decided to focus on the Brazilian apparel market. According to the
market potential index that is developed by Global Edge (globaledge.msu.edu, 2011) for
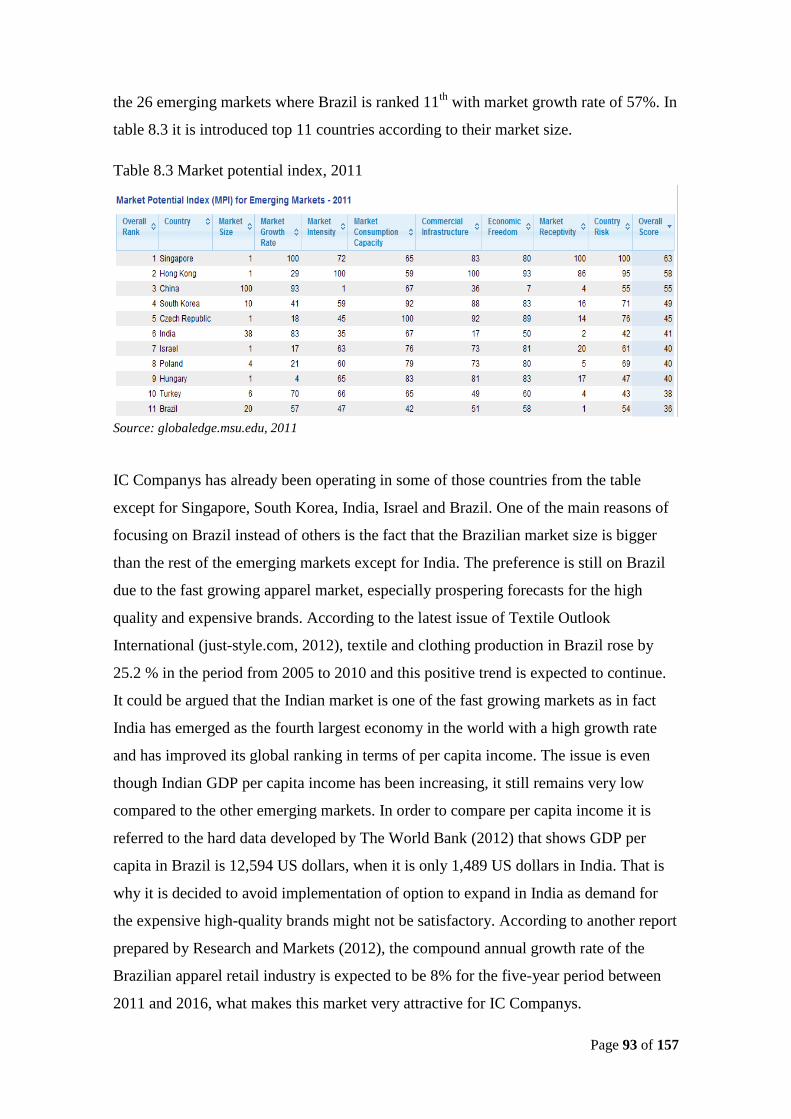
Page 93 of 157
the 26 emerging markets where Brazil is ranked 11th
with market growth rate of 57%. In
table 8.3 it is introduced top 11 countries according to their market size.
Table 8.3 Market potential index, 2011
Source: globaledge.msu.edu, 2011
IC Companys has already been operating in some of those countries from the table
except for Singapore, South Korea, India, Israel and Brazil. One of the main reasons of
focusing on Brazil instead of others is the fact that the Brazilian market size is bigger
than the rest of the emerging markets except for India. The preference is still on Brazil
due to the fast growing apparel market, especially prospering forecasts for the high
quality and expensive brands. According to the latest issue of Textile Outlook
International (just-style.com, 2012), textile and clothing production in Brazil rose by
25.2 % in the period from 2005 to 2010 and this positive trend is expected to continue.
It could be argued that the Indian market is one of the fast growing markets as in fact
India has emerged as the fourth largest economy in the world with a high growth rate
and has improved its global ranking in terms of per capita income. The issue is even
though Indian GDP per capita income has been increasing, it still remains very low
compared to the other emerging markets. In order to compare per capita income it is
referred to the hard data developed by The World Bank (2012) that shows GDP per
capita in Brazil is 12,594 US dollars, when it is only 1,489 US dollars in India. That is
why it is decided to avoid implementation of option to expand in India as demand for
the expensive high-quality brands might not be satisfactory. According to another report
prepared by Research and Markets (2012), the compound annual growth rate of the
Brazilian apparel retail industry is expected to be 8% for the five-year period between
2011 and 2016, what makes this market very attractive for IC Companys.
Page 94 of 157
It has been decided if IC Companys intends gaining from expansion option by focusing
on the Brazilian apparel market then real option has to be realized in the period of 2011-
2016, when market is estimated to demonstrate high growth. IC Companys might
successfully implement expansion option by operating its own stores and using
franchising. The other alternative to penetrate into the Brazilian market is to acquire a
local brand. In this case, IC Companys gets the expertise in the Brazilian market that
might support the promotion of the IC Companys’ own brands.
According to IC Companys’ annual report 2011 it could be stated that the company is
able to invest 3% of the annual revenues which is around 120.0 mil. DKK in order to
support growing business.
It is estimated initially to invest 100.0 mil. DKK into the Brazilian market within the
next five years and it is assumed that the company's operating revenues will increase by
0.8 % until 2016, then it will slow down in 2017 to 0.6%, then in 2018 estimated growth
might be 0.4% and in the period of 2018-2021 the growth increase is around 0.3% and
finally the long-term growth rate is 0.1%. By using expansion option the increase in
operating revenues will boost the company’s enterprise value by 5.49%. Calculations
regarding increase in the operating revenues are shown in appendixes 28 and 29.
9.2 Binomial lattice approach for IC Companys
9.2.1 Step 1: Evaluation of IC Companys’ underlying asset without flexibility
In the first step according to real option theories a company value has to be calculated
without any flexibility. Required company's underlying asset value has been calculated
by using the DCF valuation method in section 7.9. The value which is considered to use
in ROV is 5,578.20 mil. DKK.
9.2.2 Step 2: Event tree
As it has already been stated in the theoretical part of ROV, in the second step in order
to fulfil requirements of expansion option, up-down movements of binomial lattice has
to be determined by using annual volatility of the emerging market. Before calculating
volatility, beta and variance must be estimated by implementing the CAPM model:
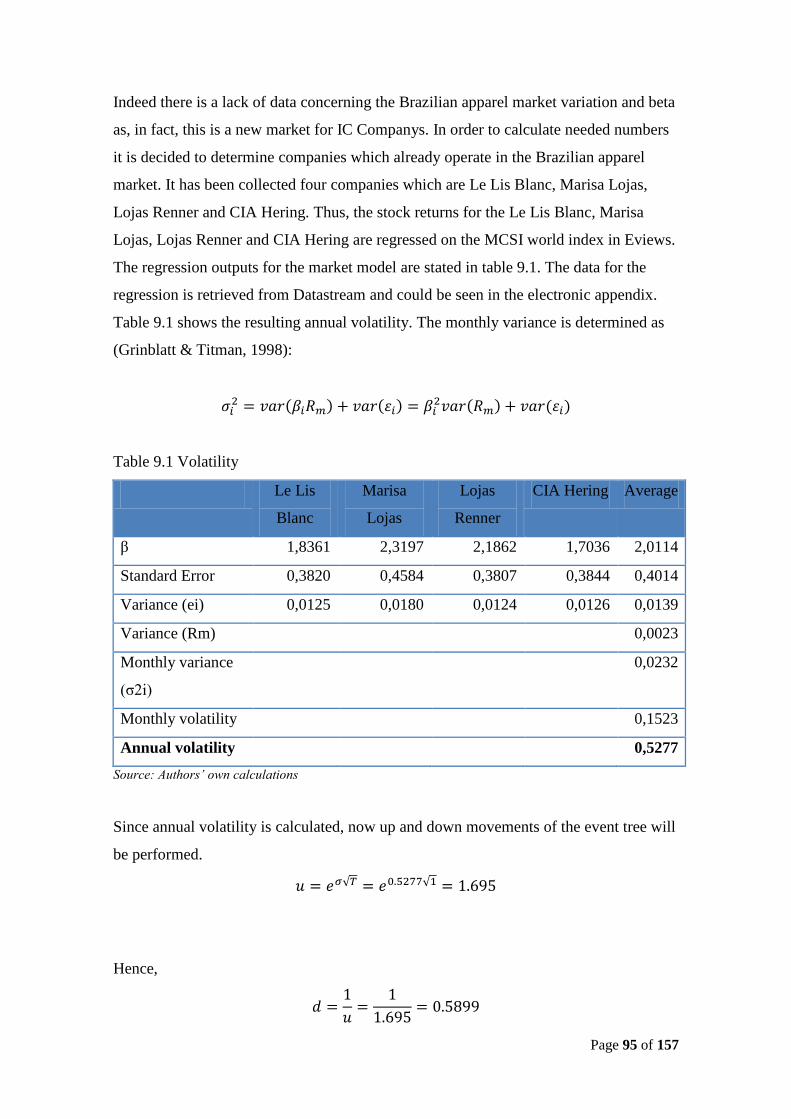
Page 95 of 157
Indeed there is a lack of data concerning the Brazilian apparel market variation and beta
as, in fact, this is a new market for IC Companys. In order to calculate needed numbers
it is decided to determine companies which already operate in the Brazilian apparel
market. It has been collected four companies which are Le Lis Blanc, Marisa Lojas,
Lojas Renner and CIA Hering. Thus, the stock returns for the Le Lis Blanc, Marisa
Lojas, Lojas Renner and CIA Hering are regressed on the MCSI world index in Eviews.
The regression outputs for the market model are stated in table 9.1. The data for the
regression is retrieved from Datastream and could be seen in the electronic appendix.
Table 9.1 shows the resulting annual volatility. The monthly variance is determined as
(Grinblatt & Titman, 1998):
Table 9.1 Volatility
Le Lis
Blanc
Marisa
Lojas
Lojas
Renner
CIA Hering Average
β 1,8361 2,3197 2,1862 1,7036 2,0114
Standard Error 0,3820 0,4584 0,3807 0,3844 0,4014
Variance (ei) 0,0125 0,0180 0,0124 0,0126 0,0139
Variance (Rm) 0,0023
Monthly variance
(σ2i)
0,0232
Monthly volatility 0,1523
Annual volatility 0,5277
Source: Authors’ own calculations
Since annual volatility is calculated, now up and down movements of the event tree will
be performed.
√ √
Hence,
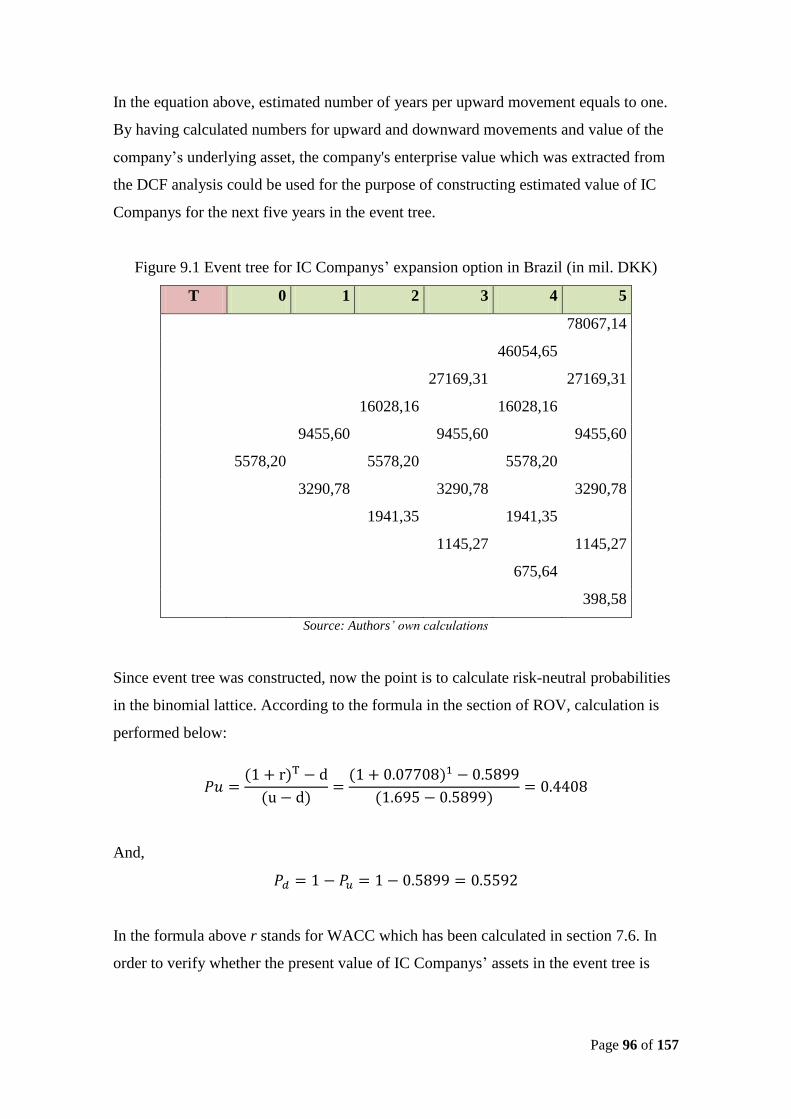
Page 96 of 157
In the equation above, estimated number of years per upward movement equals to one.
By having calculated numbers for upward and downward movements and value of the
company’s underlying asset, the company's enterprise value which was extracted from
the DCF analysis could be used for the purpose of constructing estimated value of IC
Companys for the next five years in the event tree.
Figure 9.1 Event tree for IC Companys’ expansion option in Brazil (in mil. DKK)
T 0 1 2 3 4 5
78067,14
46054,65
27169,31
27169,31
16028,16
16028,16
9455,60
9455,60
9455,60
5578,20
5578,20
5578,20
3290,78
3290,78
3290,78
1941,35
1941,35
1145,27
1145,27
675,64
398,58
Source: Authors’ own calculations
Since event tree was constructed, now the point is to calculate risk-neutral probabilities
in the binomial lattice. According to the formula in the section of ROV, calculation is
performed below:
And,
In the formula above r stands for WACC which has been calculated in section 7.6. In
order to verify whether the present value of IC Companys’ assets in the event tree is
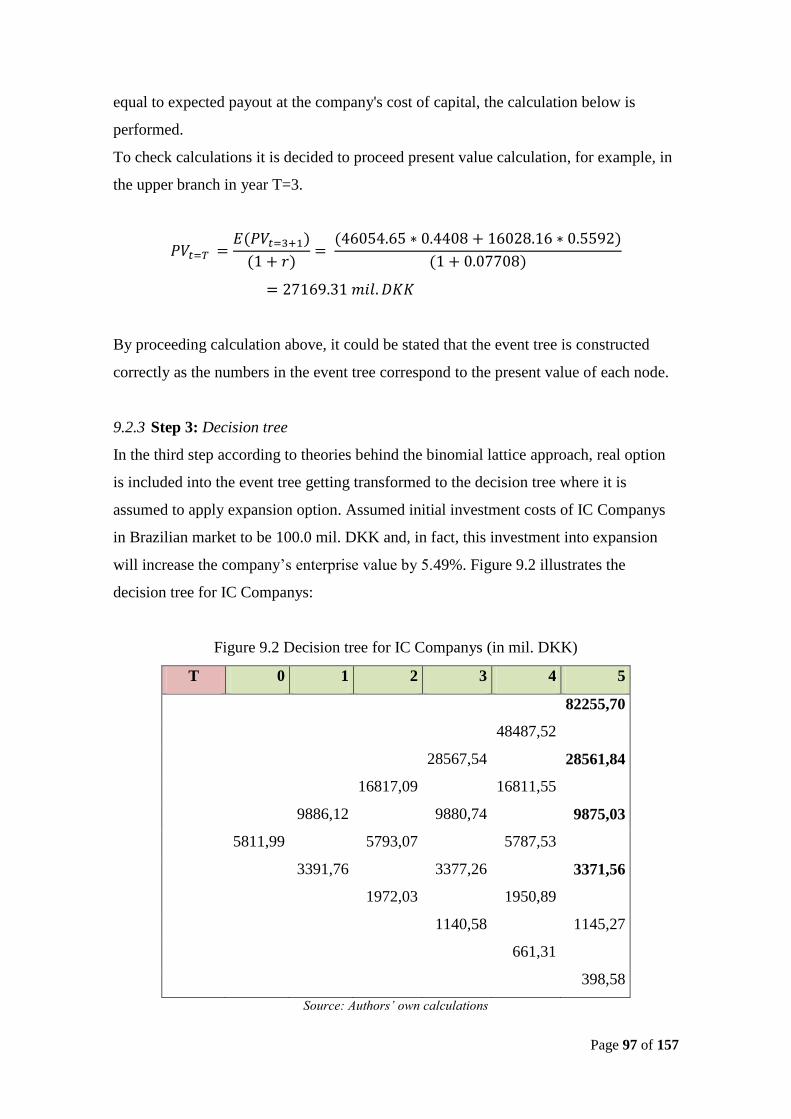
Page 97 of 157
equal to expected payout at the company's cost of capital, the calculation below is
performed.
To check calculations it is decided to proceed present value calculation, for example, in
the upper branch in year T=3.
By proceeding calculation above, it could be stated that the event tree is constructed
correctly as the numbers in the event tree correspond to the present value of each node.
9.2.3 Step 3: Decision tree
In the third step according to theories behind the binomial lattice approach, real option
is included into the event tree getting transformed to the decision tree where it is
assumed to apply expansion option. Assumed initial investment costs of IC Companys
in Brazilian market to be 100.0 mil. DKK and, in fact, this investment into expansion
will increase the company’s enterprise value by 5.49%. Figure 9.2 illustrates the
decision tree for IC Companys:
Figure 9.2 Decision tree for IC Companys (in mil. DKK)
T 0 1 2 3 4 5
82255,70
48487,52
28567,54
28561,84
16817,09
16811,55
9886,12
9880,74
9875,03
5811,99
5793,07
5787,53
3391,76
3377,26
3371,56
1972,03
1950,89
1140,58
1145,27
661,31
398,58
Source: Authors’ own calculations
Page 98 of 157
In order to show the difference between the event tree and decision tree in year 5 it is
decided to perform following calculation where the value of the upper node in year 5 in
the event tree has to be increased by 5.49% as a result of exercising of expansion option.
Since the values with option are calculated, now the main point is to verify that the
values in the fifth year are higher with expansion option than without it. By checking
out the values it shows up that in the last two years in the two lowest nodes the value is
less with option than without it.
And,
These kinds of calculations for the all nodes in the fifth year have been applied. Besides
the lowest node in the last year all other outcomes of the decision tree with exercising
expansion option estimated to be profitable for IC Companys.
9.2.4 Step 4: Expansion option for IC Companys’ decision tree with flexibility
In the last step of the real options valuation it is important to apply risk-neutral
probabilities with the aim to value the company's underlying assets with flexibility. The
risk-neutral probabilities allow weighting company's future cash flows with risk-
adjusted probabilities which extracts more feasible numbers than the random scenario
probabilities. After proceeding calculation of probability-weighted average cash flows,
the final calculation is to discount those cash flows from right to the left or just
backwards what results in the current value of the company including real option. The
calculations below introduce the risk-neutral probabilities:
And,
Page 99 of 157
After determining the risk-neutral probabilities, now cash flows could be weighted by
the following formula:
Cash flows discounting with risk free rate goes backwards starting from the year 5.
By discounting cash flows until year 0, the company's underlying asset value is
5,803.62 mil. DKK. The rest of the calculation is performed in the electronic appendix.
In order to understand whether to exercise expansion option in the Brazilian apparel
market, it is important to compare the numbers that were extracted from the DCF
method without ROV and including ROV. IC Companys’ enterprise value with ROV is
5,811.99 mil. DKK and the value without ROV is 5,578.20 mil. DKK. It could be
concluded that if IC Companys exercises its expansion option within the next five years,
the company's enterprise value will increase by 233,79 mil. DKK (5,811.99 - 5,578.20).
In table 9.2 presented obtained numbers from the company valuation:
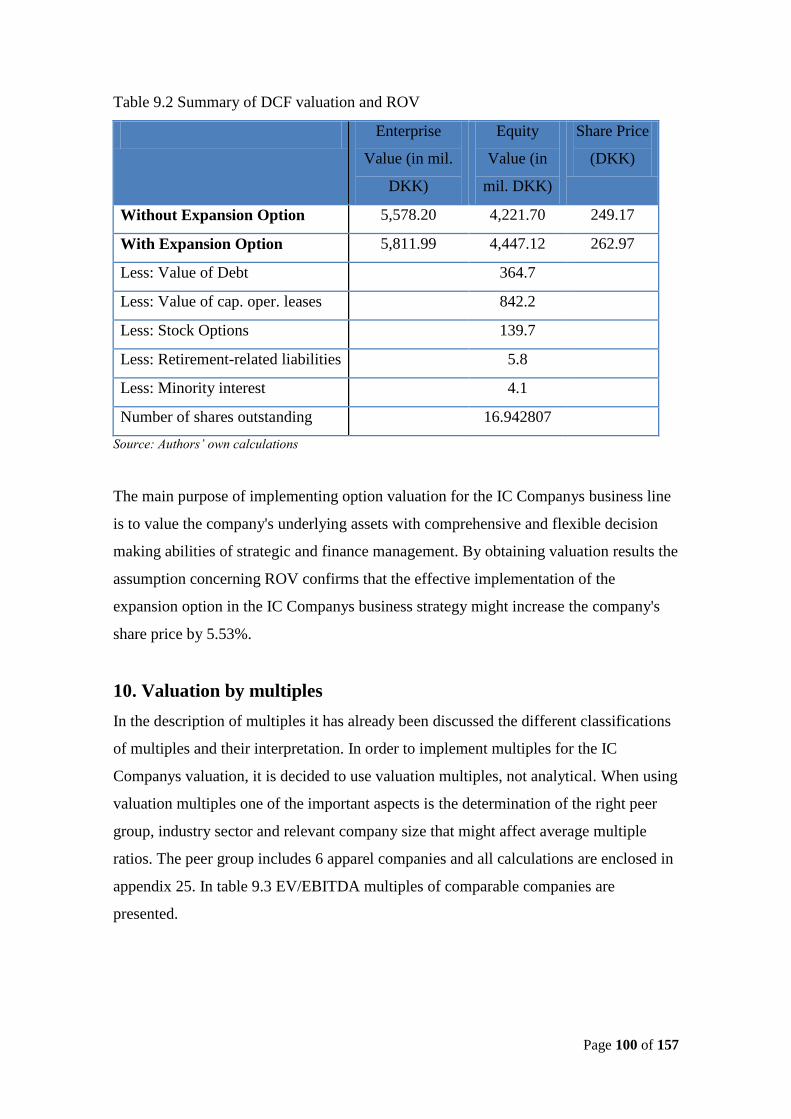
Page 100 of 157
Table 9.2 Summary of DCF valuation and ROV
Enterprise
Value (in mil.
DKK)
Equity
Value (in
mil. DKK)
Share Price
(DKK)
Without Expansion Option 5,578.20 4,221.70 249.17
With Expansion Option 5,811.99 4,447.12 262.97
Less: Value of Debt 364.7
Less: Value of cap. oper. leases 842.2
Less: Stock Options 139.7
Less: Retirement-related liabilities 5.8
Less: Minority interest 4.1
Number of shares outstanding 16.942807
Source: Authors’ own calculations
The main purpose of implementing option valuation for the IC Companys business line
is to value the company's underlying assets with comprehensive and flexible decision
making abilities of strategic and finance management. By obtaining valuation results the
assumption concerning ROV confirms that the effective implementation of the
expansion option in the IC Companys business strategy might increase the company's
share price by 5.53%.
10. Valuation by multiples
In the description of multiples it has already been discussed the different classifications
of multiples and their interpretation. In order to implement multiples for the IC
Companys valuation, it is decided to use valuation multiples, not analytical. When using
valuation multiples one of the important aspects is the determination of the right peer
group, industry sector and relevant company size that might affect average multiple
ratios. The peer group includes 6 apparel companies and all calculations are enclosed in
appendix 25. In table 9.3 EV/EBITDA multiples of comparable companies are
presented.
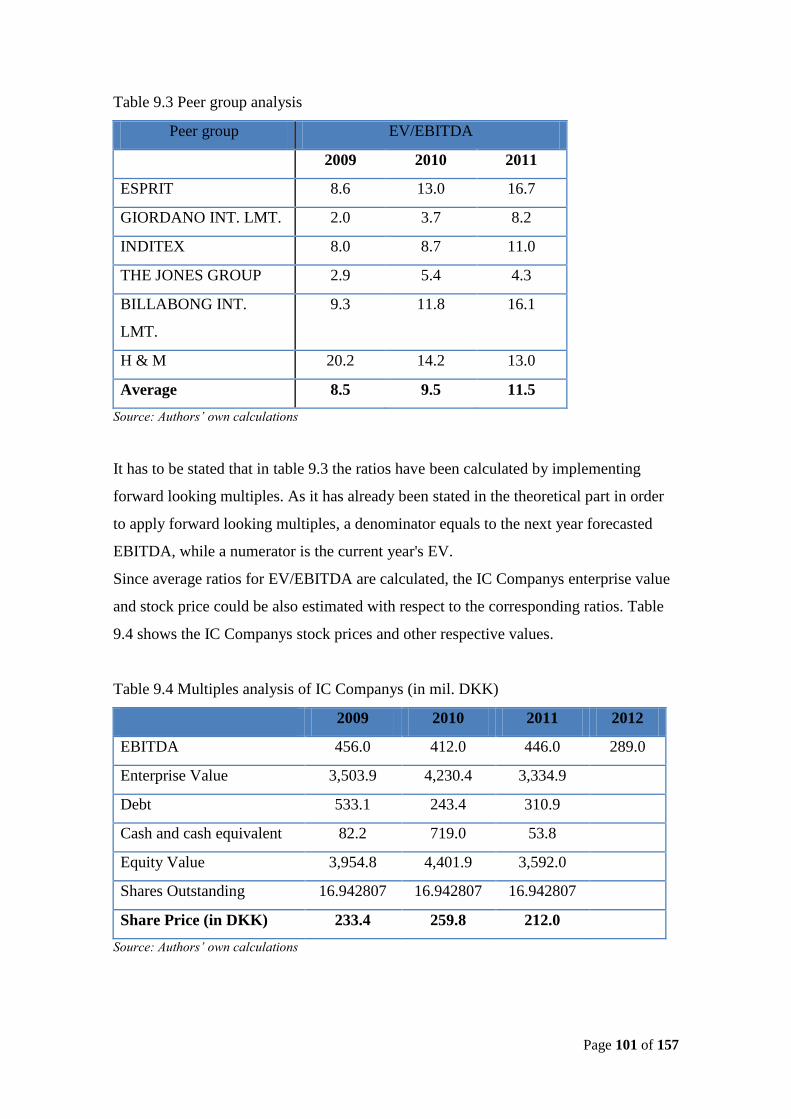
Page 101 of 157
Table 9.3 Peer group analysis
Peer group EV/EBITDA
2009 2010 2011
ESPRIT 8.6 13.0 16.7
GIORDANO INT. LMT. 2.0 3.7 8.2
INDITEX 8.0 8.7 11.0
THE JONES GROUP 2.9 5.4 4.3
BILLABONG INT.
LMT.
9.3 11.8 16.1
H & M 20.2 14.2 13.0
Average 8.5 9.5 11.5
Source: Authors’ own calculations
It has to be stated that in table 9.3 the ratios have been calculated by implementing
forward looking multiples. As it has already been stated in the theoretical part in order
to apply forward looking multiples, a denominator equals to the next year forecasted
EBITDA, while a numerator is the current year's EV.
Since average ratios for EV/EBITDA are calculated, the IC Companys enterprise value
and stock price could be also estimated with respect to the corresponding ratios. Table
9.4 shows the IC Companys stock prices and other respective values.
Table 9.4 Multiples analysis of IC Companys (in mil. DKK)
2009 2010 2011 2012
EBITDA 456.0 412.0 446.0 289.0
Enterprise Value 3,503.9 4,230.4 3,334.9
Debt 533.1 243.4 310.9
Cash and cash equivalent 82.2 719.0 53.8
Equity Value 3,954.8 4,401.9 3,592.0
Shares Outstanding 16.942807 16.942807 16.942807
Share Price (in DKK) 233.4 259.8 212.0
Source: Authors’ own calculations
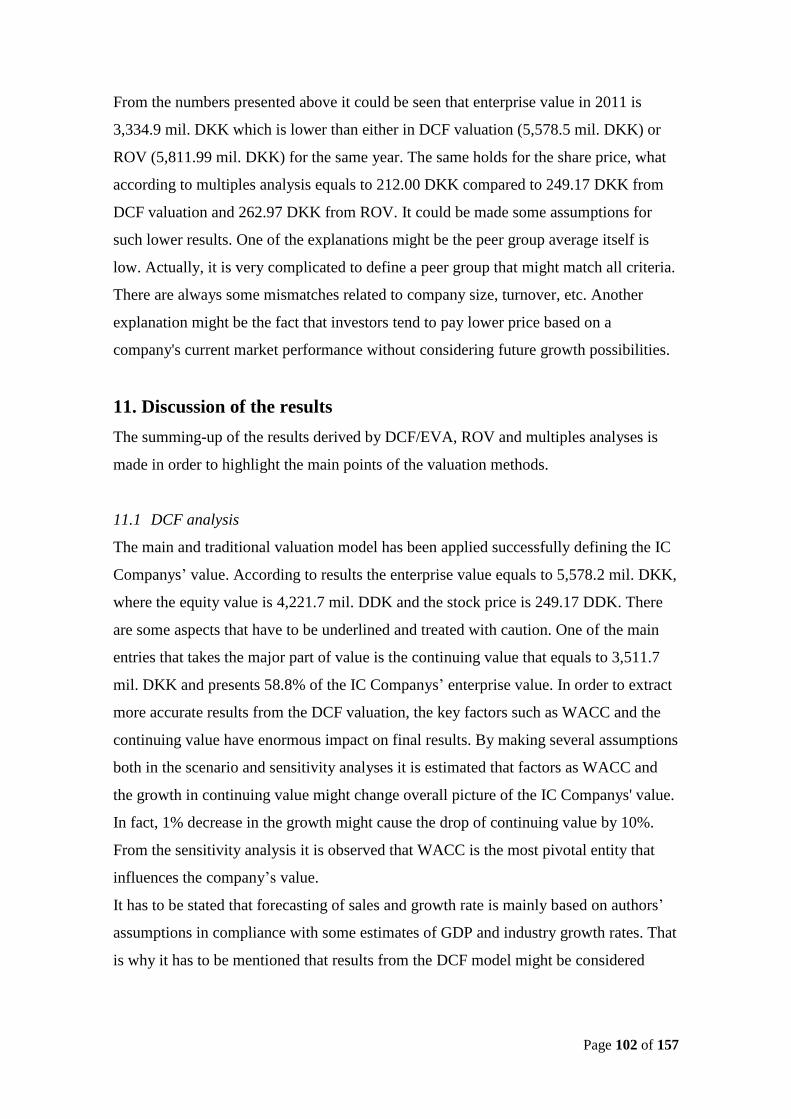
Page 102 of 157
From the numbers presented above it could be seen that enterprise value in 2011 is
3,334.9 mil. DKK which is lower than either in DCF valuation (5,578.5 mil. DKK) or
ROV (5,811.99 mil. DKK) for the same year. The same holds for the share price, what
according to multiples analysis equals to 212.00 DKK compared to 249.17 DKK from
DCF valuation and 262.97 DKK from ROV. It could be made some assumptions for
such lower results. One of the explanations might be the peer group average itself is
low. Actually, it is very complicated to define a peer group that might match all criteria.
There are always some mismatches related to company size, turnover, etc. Another
explanation might be the fact that investors tend to pay lower price based on a
company's current market performance without considering future growth possibilities.
11. Discussion of the results
The summing-up of the results derived by DCF/EVA, ROV and multiples analyses is
made in order to highlight the main points of the valuation methods.
11.1 DCF analysis
The main and traditional valuation model has been applied successfully defining the IC
Companys’ value. According to results the enterprise value equals to 5,578.2 mil. DKK,
where the equity value is 4,221.7 mil. DDK and the stock price is 249.17 DDK. There
are some aspects that have to be underlined and treated with caution. One of the main
entries that takes the major part of value is the continuing value that equals to 3,511.7
mil. DKK and presents 58.8% of the IC Companys’ enterprise value. In order to extract
more accurate results from the DCF valuation, the key factors such as WACC and the
continuing value have enormous impact on final results. By making several assumptions
both in the scenario and sensitivity analyses it is estimated that factors as WACC and
the growth in continuing value might change overall picture of the IC Companys' value.
In fact, 1% decrease in the growth might cause the drop of continuing value by 10%.
From the sensitivity analysis it is observed that WACC is the most pivotal entity that
influences the company’s value.
It has to be stated that forecasting of sales and growth rate is mainly based on authors’
assumptions in compliance with some estimates of GDP and industry growth rates. That
is why it has to be mentioned that results from the DCF model might be considered
Page 103 of 157
subjectively and highly dependent on authors’ future expectations from both the world
economy and apparel industry especially.
11.2 EVA analysis
The main purpose of implementing the EVA analysis is to ensure the plausibility of the
results that are extracted from the DCF analysis. The difference of EVA from other two
methods (real options and multiples) is that EVA does not reveal additional value;
instead of using free cash flows, the alternative computation method estimates the
present value of economic profit to derive the final stock price. The main difference
between the EVA and DCF valuation methods is their approach to the valuation. DCF is
more applicable for practitioners and academics as it defines in-out cash flow streams of
company. On the other hand, EVA is related to economic theory and competitive
strategy, highlighting whether company's earnings cover its cost of capital and how
company's financial performance behaves over time.
In fact, WACC, NOPLAT and ROIC used in the EVA calculations are solely excerpted
from the DCF valuation. Resulted stock price of 249.17 DKK from the EVA valuation
corresponds to the same stock price that is found via the DCF valuation. According to
Koller et al. (2010) both methods yield the same result if applied correctly.
11.3 Real Options valuation
The main purpose of implementing ROV is to unveil an additional value for IC
Companys by including management's flexibility, which has been abandoned in the
DCF valuation. The IC Companys' enterprise value with the 5-year expansion option in
Brazil equals to 5,811.9 mil. DKK, while the equity value and share price are 4,455.4
mil. DKK (+4.2%) and 262.9 DKK (+5.5%), respectively. The calculated results imply
that the expansion option creates an additional value for IC Companys.
The robustness of results obtained in ROV solely depends on correct estimates of the
underlying asset value and variance. Underlying asset value has been taken from the
DCF valuation and, hence, is exposed to subjectivity. Since IC Companys plans to
operate in an unfamiliar market, the estimate of variance is based on the corresponding
values of the potential competitors in the Brazilian apparel market. Therefore, the value
of expansion option might be approximate, rather than precise.
Page 104 of 157
11.4 Multiples
As elaborated in section 6.3, the multiples analysis is performed to estimate the
company value based on peer group fundamentals and market perception of target
industry. Hence, results obtained from the analysis must be interpreted with caution
since it is quite challenging to select perfectly matching competitors.
The multiples analysis shows that the IC Companys’ enterprise value and stock price
are highly overpriced in both the DCF valuation and ROV. For example, stock price
derived by the multiples analysis is 17.5% lower than in the DCF valuation and 24.0%
lower than in ROV.
12. Conclusion
The main purpose of the thesis is to estimate the value of IC Companys. It has been
done by conducting two comprehensive analyses – strategic and corporate valuation.
Strategic analysis identifies the state and future perspectives of the company in relation
to external and internal factors. To determine IC Companys’ opportunities and threats,
PESTEL and Porter’s five forces analyses are implemented. Value chain and Core
competencies analyses allow identifying the company’s strengths and weaknesses. The
obtained results are summarized in SWOT analysis to build the overall company’s
conditions.
The implementation of the strategic analysis gave an answer to the question mentioned
in Problem statement section concerning the competitive advantages of IC Companys
and how the company exploits them for development.
PESTEL analysis investigates macro-economic aspects that influence market
environment from various angles. Since IC Companys is closely tied to the
Scandinavian market, such factors as economics, legislation and socio-culture are more
familiar and predictable compared to emerging markets.
To move from macro-economic environment to the industry, Porter’s five forces
analysis is conducted. It has been concluded that there is a slight risk coming from the
new competitors, due to their relatively small size and portfolio of unknown brands, as
well as the bargaining power of the suppliers and buyers, which is limited to moderate
levels through diversification. Modern apparel market is assumed to be highly saturated,
thus the risk of substitute products and intense competition is significant.
Page 105 of 157
Turning to the internal aspects, the value chain analysis examines the IC Companys’
capabilities to develop a competitive advantage and improve the efficiency. IC
Companys has vested its brand managers with wide responsibilities in market
positioning, product development and sales in relation to every individual brand. In
addition, the activities with no relevance to brand identity are handled through the
shared service platform what fastens the information interchange within the company.
Core competencies analysis underlines the aforementioned strengths and mentions the
emphasis IC Companys puts on HR as a key focus area to drive retail sales and enhance
leadership.
The results derived from external and internal analyses are summarized in SWOT
analysis. The main IC Companys’ strength lies in the independent and resilient multi-
brand strategy. The quality control of clothes has become another important focus area
to improve the brand image. Furthermore, the company has achieved significant results
in production sourcing in China; however, this expertise has not given any boost in
meeting Chinese end-users’ needs.
In the corporate valuation, four various methods are applied, namely, Discounted cash
flow model, Economic profit model, Real option valuation and multiples.
The DCF valuation of IC Companys is based on the corporate valuation book by Koller
et al. (2010). According to the DCF method, IC Companys’ financial statements for the
period 2007-2011 are reformulated to derive historical free cash flows. The company’s
free cash flows forecast for the period 2012-2021 relies on Porter’s five forces analysis
and historical results from reformulated financial statements. As the result, IC
Companys’ enterprise value equals to 5,578.2 mil. DKK, which combines the present
value of free cash flow of 1,875.6 mil. DKK and the continuing value of 3,511.7 mil.
DKK. Thus, the share price derived by the DCF valuation is 249.17 DKK. Since
forecasting of free cash flows are highly dependent on market conditions, possible
fluctuations are analysed by conducting the scenario analysis. In the best case scenario
IC Companys share price increases by 30.1% to 324.1 DKK due to anticipation in
improving European economic conditions and success in emerging markets. Then in the
worst case scenario, recovery from debt crisis in Europe might extend for longer period
that estimated and IC Companys might not succeed in emerging markets. Respective
Page 106 of 157
share price for the worst case scenario is calculated to be 205.9 DKK which shows
17.4% decrease from the base case scenario.
IC Companys enterprise value and stock price are highly vulnerable to slight
fluctuations in the company’s cost of capital. In order to create a clear picture the
sensitivity analysis demonstrates that 1% increase in WACC leads to drop in stock price
by 23% while decline of 1% in WACC boosts company stock price by 20% resulting in
312.8 DKK.
Economic profit model that is used in this thesis is mainly implemented to verify results
extracted from DCF. By applying different method of measuring company’s enterprise
value and stock price via economic profit model, analysis ended with the same
corresponding enterprise and stock values from DCF. It proves the robustness of
proceeded valuation models.
The main purpose of implementing real option valuation in the thesis is to reveal
additional value to the underlying asset value that is captured in the DCF valuation.
According to the authors research it is assumed that the Brazilian apparel market is one
of the most attractive in the world. Therefore, IC Companys might get advantage of the
fast growing fashion sector by exercising option to expand within the next five years.
The initial investment is estimated to be 100.0 mil. DKK in order to operate new shops
in the prestigious shopping malls and downtowns. This embedded expansion option
results in increase of enterprise value by 5.49%. Management of IC Companys might
reveal additional value to the company’s underlying assets of 233.79 mil. DKK by
implementing ROV. The final results of ROV for enterprise value and share price are
5,811.99 mil. DKK and 262.97 DKK, respectively. This increase in both values
confirms that real option valuation might create an additional value to the company.
As the last valuation method, multiples analysis is considered to value IC Companys
with respect to market based ratios. Share price that is found from multiples analysis is
lower than both DCF and ROV and equals to 212.0 DKK.
Finally, with the aim to answer the main question in the problem statement whether IC
Companys A/S stock price reflects a fair market value as of 30th
June 2011, share
market price at that date needs to be compared with the obtained results from DCF and
ROV. As of 30th
June 2011 share market price was 221.0 DKK which lower than both

Page 107 of 157
DCF and ROV stock prices of 249.17 DKK and 262.97 DKK, respectively. It could be
concluded that IC Companys share price is undervalued by the market. The explanation
of that might be the recent turbulence in financial markets that still has negative effect
on stock prices. In fact IC Companys had demonstrated higher price levels before 2008
when the share value was over 300 DKK.
The conclusion is that the combined value from DCF and ROV is considered to be the
fair value and is estimated at 262.97 DKK.
Page 108 of 157
References
Amram M. & Kulatilaka N. 1999, Real Options: Managing Strategic Investment in an
Uncertain World, Harvard Business School Press
Banco Bilbao Vizcaya Argentaria 2nd
quarter 2012, Global Economic Outlook
http://www.bbvaresearch.com/KETD/fbin/mult/1205_Situacion_Global_tcm348-
325521.pdf?ts=1052012
Benninga S. & Sarig O. 1997, Corporate Finance: A Valuation Approach, McGraw-Hill
Besley S. & E. Brigham 2011, Principles of Finance, 5th edition, Cengage Learning
Boer F. P. 2002, The Real Options Solution: Finding Total Value in a High-Risk World, John
Wiley & Sons
Boyer M., Christoffersen P., Lasserre P. & Pavlov A. 2003, Value Creation, Risk Management
and Real Options, CIRANO
Brach M. A. 2003, Real Options in practice, John Wiley & Sons, Hoboken, New Jersey
Bragg S. 2009, Mergers & Acquisitions: A Condensed Practitioner’s Guide, John Wiley &
Sons, Inc.
Brealey R., Myers S. & Marcus A. 2001, Fundamentals of Corporate Finance, 3rd
ed.,
McGraw-Hill
Damodaran A. 2006, Damodaran on Valuation: Security Analysis for Investment and Corporate
Finance, 2nd
ed., John Wiley & Sons, Hoboken, New Jersey
Deloitte 2nd
quarter 2012, Global Economic Outlook, A collective sigh of relief
http://www.deloitte.com/assets/Dcom-
Ecuador/Local%20Assets/Documents/General%202012/Estudios/GEO_Q2_2012.pdf
DnB Nor 23 April 2012, Economic Outlook, Updated macro forecasts
https://www.dnb.se/portalfront/nedlast/no/markets/analyser-rapporter/engelske/economic-
outlook/EO120423.pdf
Dorsey P. 2004, The Five Rules for Successful Stock Investing, John Wiley & Sons, Inc
Dringoli A. 2011, Corporate Strategy and Firm Growth: Creating Value for Shareholders,
Edward Elgar Publishing Limited, UK
http://books.google.dk/books?id=OHokWYnUo_AC&printsec=frontcover&dq=expansion+strat
egy&hl=en&sa=X&ei=1FTXT8fDKo7bsgbEpLCWDw&redir_esc=y#v=onepage&q=expansio
n%20strategy&f=false
Ekstrabladet.dk 7 February 2012, Nethandel gik frem med 15 procent i 2011
http://ekstrabladet.dk/kup/dinepenge/article1704451.ece
Page 109 of 157
Eldring J. 2009, Porter’s (1980) Generic Strategies, Performance and Risk. An Empirical
Investigation with German Data, Diplomica Verlag GmbH, Hamburg
http://books.google.dk/books?id=QB-
vrEKKCn8C&pg=PA6&dq=porter%27s+three+generic+strategies&hl=da&sa=X&ei=eZPPT7
mBD4Tcsgb24JisCw&redir_esc=y#v=onepage&q&f=true
Fabozzi F. J. & Peterson Drake P. 2009, Finance. Capital Markets, Financial Management and
Investment Management, John Wiley & Sons
Follett R. 2012, How to keep score in business, 2nd
ed., FT Press
Foss N.J., Pedersen T., Pyndt J. & Schultz M. 12 January 2012, Innovating Organization and
Management: New sources of competitive advantage, Cambridge University Press
Franklin Covey 2012, IC Companys. Business Case (in Danish)
http://www.franklincovey.dk/$-1/7gv-8v-4d-xq-businesscase-ic-companys-dk.pdf
Frykman D. & Tolleryd J. 2003, Corporate Valuation: an easy guide to measuring value,
Pearson Education Limited
Globaledge 2012, Market potential index 2011
http://globaledge.msu.edu/Knowledge-Tools/MPI
Grant J. L. 2003, Foundations of Economic Value Added, 2nd
ed., John Wiley & Sons
Hill C. W.L. & Jones G. 2010, Strategic Management: an integrated approach, 9th ed., Cengage
Learning
IC Companys, Annual report 2004/2005
http://en.iccompanys.com/reports.cfm
IC Companys, Annual report 2007/2008
http://en.iccompanys.com/reports.cfm
IC Companys, Annual report 2009/2010
http://en.iccompanys.com/reports.cfm
IC Companys, Annual report 2010/2011
http://en.iccompanys.com/reports.cfm
IC Companys, Annual report 2011/2012
http://en.iccompanys.com/reports.cfm
IC Companys April 2001, Fusionsprospekt
http://npinvestor.dk/boersmeddelelser/genmab-announce-cancer-antibody-product-
collaboration-with-scancell-2-34504/34636-pdf-34763.aspx
Page 110 of 157
IC Companys January 2012, Press release, IC Companys A/S issues profit warning due to
challenging market conditions
http://www.iccompanys.com/releasedetail.cfm?releaseid=640629
IC Companys 25 October 2010, Press release, IC Companys A/S acquires a minority interest of
49% in the company By Malene Birger A/S
http://en.iccompanys.com/releasedetail.cfm?releaseid=522106
IC Companys March 2012, Corporate presentation
http://files.shareholder.com/downloads/ABEA-4B4UYT/1883864593x0x568914/b0926493-
e06b-4ee7-92a1-ac804605af32/ABGSC%20-%20Stockholm%2022.%20marts.pdf
IC Companys, The history of IC Companys
http://en.iccompanys.com/history.cfm
IC Companys, Press announcement 10 August 2011, The consumers must feel safe when
wearing our products
http://www.iccompanys.com/releasedetail.cfm?releaseid=598335
International Monetary Fund (IMF) 2012, GDP, Inflation and Unemployment forecasts for
China
http://www.imf.org/external/pubs/ft/weo/2012/01/weodata/weorept.aspx?pr.x=48&pr.y=7&sy=
2010&ey=2017&scsm=1&ssd=1&sort=country&ds=.&br=1&c=924&s=NGDP_RPCH%2CPC
PIPCH%2CLUR&grp=0&a=
International Monetary Fund (IMF) 2012, GDP, Inflation and Unemployment forecasts for
Russian Federation
http://www.imf.org/external/pubs/ft/weo/2012/01/weodata/weorept.aspx?pr.x=64&pr.y=8&sy=
2010&ey=2017&scsm=1&ssd=1&sort=country&ds=.&br=1&c=922&s=NGDP_RPCH%2CPC
PIPCH%2CLUR&grp=0&a=
International Monetary Fund (IMF) 2012-2017, GDP percent change for world economy and
the European Union
http://www.imf.org/external/pubs/ft/weo/2012/02/weodata/weorept.aspx?pr.x=47&pr.y=6&sy=
2010&ey=2017&scsm=1&ssd=1&sort=country&ds=.&br=1&c=001%2C998&s=NGDP_RPCH
&grp=1&a=1
International Monetary Fund (IMF) 2012-2017, GDP percent change in constant prices in
Belgium, Denmark, Luxembourg, Netherlands, Norway, Sweden
http://www.imf.org/external/pubs/ft/weo/2012/02/weodata/weorept.aspx?pr.x=33&pr.y=5&sy=
2010&ey=2017&scsm=1&ssd=1&sort=country&ds=.&br=1&c=137%2C124%2C138%2C142
%2C128%2C144&s=NGDP_RPCH%2CNGDP&grp=0&a=
Kime L. F. & McGee W.W. 2008, SWOT analysis: A tool for making better business decisions,
United States Department of Agriculture, Risk Management Agency
http://books.google.dk/books?id=NkYLbgFrPZYC&printsec=frontcover&dq=SWOT+Analysis:
+A+Tool+for+Making+Better+Business+Decisions&source=bl&ots=ounm0PUc14&sig=-
R_Als0_EcxHAc6NtVeChzi4oLE&hl=en&sa=X&ei=5DB0UO-
WCYbNswbEoYCADA&redir_esc=y#v=onepage&q&f=false
Page 111 of 157
Jones V. R. 2008, Limited Liabilities Companies for Dummies, John Wiley & Sons, Hoboken,
New Jersey
Koller T., Goedhart M. & Wessels D. 2005, Valuation: Measuring and Managing the Value
Companies, 4th ed., John Wiley & Sons, Hoboken, New Jersey
Koller T., Goedhart M. & Wessels D. 2010, Valuation: Measuring and Managing the Value
Companies, 5th ed., John Wiley & Sons, Hoboken, New Jersey
Kotler P. & Keller K. L. 2006, Marketing Management, 12th ed., Prentice Hall
McKinsey & Company October 2011, Fast fashion: Navigating the global apparel market
http://csi.mckinsey.com/Knowledge_by_region/Global/Navigating_the_global_apparel_market
Miller D. & Friesen P. H. 1986, Generic strategies and performance: An empirical examination
with American data Part I: Testing Porter, Organization Studies
MSCI Inc. 31 May 2012, MSCI World Index Fact Sheet
http://www.msci.com/resources/factsheets/index_fact_sheet/msci-world-index.pdf
MSCI Inc., MSCI World Index (in U.S. dollar) monthly prices
http://www.msci.com/products/indices/country_and_regional/dm/performance.html
Mun J. 2002, Real Options Analysis: Tools and techniques for Valuing Strategic Investments
and Decisions, John Wiley & Sons, Inc., Hoboken, New Jersey
Nordea Markets 3 May 2012, Nordea Economic and Market Outlook, Europe heats up over the
summer
http://newsroom.nordeamarkets.com/en/2012/05/03/nemo/
Npinvestor.dk 18 August 2011, IC Companys styrker koncernens sourcing (in Danish)
http://npinvestor.dk/nyheder/ic-companys-styrker-koncernens-sourcing-230262.aspx
Organization for Economic Co-operation and Development (OECD) May 2012, Russian
Federation – Economic forecast summary
http://www.oecd.org/eco/economicoutlookanalysisandforecasts/russianfederation-
economicforecastsummarymay2012.htm
Penman S. H. 2003, Financial Statement Analysis and Security Valuation, 2nd
ed., McGraw-Hill
Penman S.H. 2010, Financial Statement Analysis and Security Valuation, 4th ed., McGraw -Hill
Petersen C., Plenborg T. & Schøler F. 2006, Hvordan værdiansættes unoterede virksomheder i
praksis?, Copenhagen Business School
http://rauli.cbs.dk/index.php/loge/article/view/686/718
Pinto J. E., Henry E., Robinson T. R. & Stowe J. D. 2010, Equity Asset Valuation, 2nd
ed., John
Wiley & Sons
Page 112 of 157
Porter M.E. 1980, Competitive Strategy, Free Press, New York
http://books.google.dk/books?id=QB-
vrEKKCn8C&pg=PA6&dq=porter%27s+three+generic+strategies&hl=da&sa=X&ei=eZPPT7
mBD4Tcsgb24JisCw&redir_esc=y#v=onepage&q=porter's%20three%20generic%20strategies
&f=false
Prahalad C.K. & Hamel G. 2009, The core competence of the corporation, Harvard Business
Review
http://www.jeremym.fr/blog/wp-
content/uploads/2009/11/C.K.Prahalad_G.Hamel_CoreCompetenceOfTheCorp.pdf
PriceWaterHouseCoopers 2010, Prisfastsættelsen på aktiemarkedet (in Danish)
http://www.pwc.dk/da_DK/dk/vaerdiansaettelse/assets/prisfastsaettelse-paa-aktiemarkedet.pdf
RB-Børsen 17 September 2008, Vi kan lære af andre i Kina (in Danish),
http://www.business.dk/investor/iccceo-vi-kan-laere-af-andre-i-kina
Research and markets February 2012, Apparel retail in Brazil
http://www.researchandmarkets.com/reports/2094330/apparel_retail_in_brazil
Rosenbaum J. & Pearl J. 2009, Investment Banking: Valuation, Leveraged Buyouts, and
Mergers & Acquisitions, John Wiley & Sons, Inc.
Royal Bank of Canada (RBC) March 2012, Economic and Financial Market Outlook
http://www.rbc.com/newsroom/pdf/fcst-03-2012.pdf
Ryan B. 2007, Corporate Finance and Valuation, Thomson Learning
Swedbank 24 April 2012, Swedbank Economic Outlook, Continuing on the road to recovery
http://newsroom.swedbank.com/en/Publications/2012/Swedbank-Economic-Outlook----April-
24-2012/
Wahlen J. M., Baginski S. P. & Bradshaw M. T. 2010, Financial Reporting, Financial
Statement Analysis, and Valuation: A Strategic Perspective, 7th ed., South-Western Cengage
Learning
World Bank 2012, GDP per capita (current US$)
http://data.worldbank.org/indicator/NY.GDP.PCAP.CD
www.bloomberg.com 30 June 2011, Denmark Government Bonds 10 Year Note Generic Bid
Yield
http://www.bloomberg.com/quote/GDGB10YR:IND/chart
www.bondsonline.com 30 June 2011, US Corporate bond yield curve
http://www.bondsonline.com/Corporate_Bond_Yield_Index.php?type=C
http://yieldandincome.com/graphing/yieldCurve.aspx?fileDate=6/30/2011§or1=C_AA&sec
tor2=§or3=§or4=&width=600
www.companiesandmarkets.com 21 February 2012, Global Apparel Retail - Market Research
Page 113 of 157
http://www.companiesandmarkets.com/Market/Retail/Market-Research/Global-Apparel-Retail-
Market-Research/RPT886623?aCode=f3fb3973-dfd8-4f19-aea0-5d2ad31cb891
www.computerworld.dk 22 January 2008, Danskerne nethandler for 22 milliarder kr. om året
http://www.computerworld.dk/art/43817/danskerne-net-handler-for-22-milliarder-kr-om-aaret
www.ecenta.com 12 September 2009, IC Companys (in German)
http://www.ecenta.com/we_realize_it/de/aktuell/aktuell-detail?rid=90225273-bdfc-2c10-1b99-
c45fd2ee4c99
www.fashionforum.dk 22 December 2010, IC Companys har succes med eget Retail Academy
(in Danish)
http://fashionforum.dk/2010/12/22/ic-companys-har-succes-med-eget-retail-academy/
www.fibre2fashion.com 2 November 2011, Global apparel industry at a ‘Tipping
point’
http://www.fibre2fashion.com/industry-article/38/3701/global-apparel-industry-at-a-
tipping-point1.asp
www.fibre2fashion.com 19 August 2011, IC Companys enhances the group’s sourcing
http://www.fibre2fashion.com/news/apparel-news/newsdetails.aspx?news_id=102226
www.forecast.org , 10-year Treasury Constant Maturity Rate
http://www.forecasts.org/data/data/GS10.htm
www.just-style.com 17 January 2012, Economic growth boosts Brazil’s textile and clothing
industry
http://www.just-style.com/analysis/economic-growth-boosts-brazils-textile-and-clothing-
industry_id113241.aspx
www.just-style.com 18 November 2010, IC Companys to reorganize brands
http://www.just-style.com/news/ic-companys-to-reorganise-brands_id109521.aspx
www.learnmarketing.net, Value Chain Analysis (on a base of the book by Porter M. E. 1985,
Competitive Advantage, Free Press, New York)
http://www.learnmarketing.net/valuechain.htm
www.modebranchen.nu, Showrooms in Lindgreens Allé 12 (in Danish)
http://www.modebranchen.nu/wp-content/uploads/NU1/NU_NO1_LindgreensAlle12.pdf
www.netmba.com, The Value Chain
http://www.netmba.com/strategy/value-chain/
www.sap.com 2011, IC Companys fremtidssikres med nyt SAP-Økonomisystem
http://www.sap.com/denmark/about/customersuccess/pdf2011/IC_Company.pdf

Page 114 of 157
Xue H. & Zheng J. 2010, Pricing liquidity risk and cost in the stock market: How Different was
the Financial Crisis, Towers Watson
http://papers.ssrn.com/sol3/papers.cfm?abstract_id=1632969
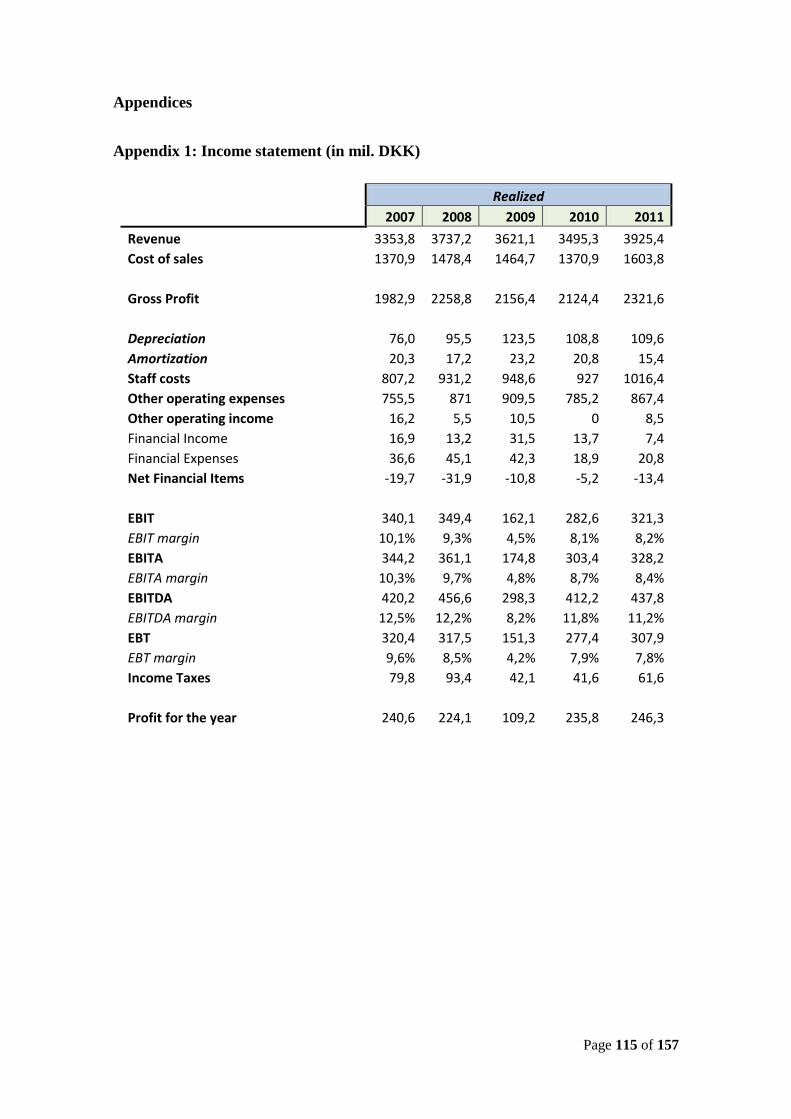
Page 115 of 157
Appendices
Appendix 1: Income statement (in mil. DKK)
Realized
2007 2008 2009 2010 2011
Revenue 3353,8 3737,2 3621,1 3495,3 3925,4
Cost of sales 1370,9 1478,4 1464,7 1370,9 1603,8
Gross Profit 1982,9 2258,8 2156,4 2124,4 2321,6
Depreciation 76,0 95,5 123,5 108,8 109,6
Amortization 20,3 17,2 23,2 20,8 15,4
Staff costs 807,2 931,2 948,6 927 1016,4
Other operating expenses 755,5 871 909,5 785,2 867,4
Other operating income 16,2 5,5 10,5 0 8,5
Financial Income 16,9 13,2 31,5 13,7 7,4
Financial Expenses 36,6 45,1 42,3 18,9 20,8
Net Financial Items -19,7 -31,9 -10,8 -5,2 -13,4
EBIT 340,1 349,4 162,1 282,6 321,3
EBIT margin 10,1% 9,3% 4,5% 8,1% 8,2%
EBITA 344,2 361,1 174,8 303,4 328,2
EBITA margin 10,3% 9,7% 4,8% 8,7% 8,4%
EBITDA 420,2 456,6 298,3 412,2 437,8
EBITDA margin 12,5% 12,2% 8,2% 11,8% 11,2%
EBT 320,4 317,5 151,3 277,4 307,9
EBT margin 9,6% 8,5% 4,2% 7,9% 7,8%
Income Taxes 79,8 93,4 42,1 41,6 61,6
Profit for the year 240,6 224,1 109,2 235,8 246,3
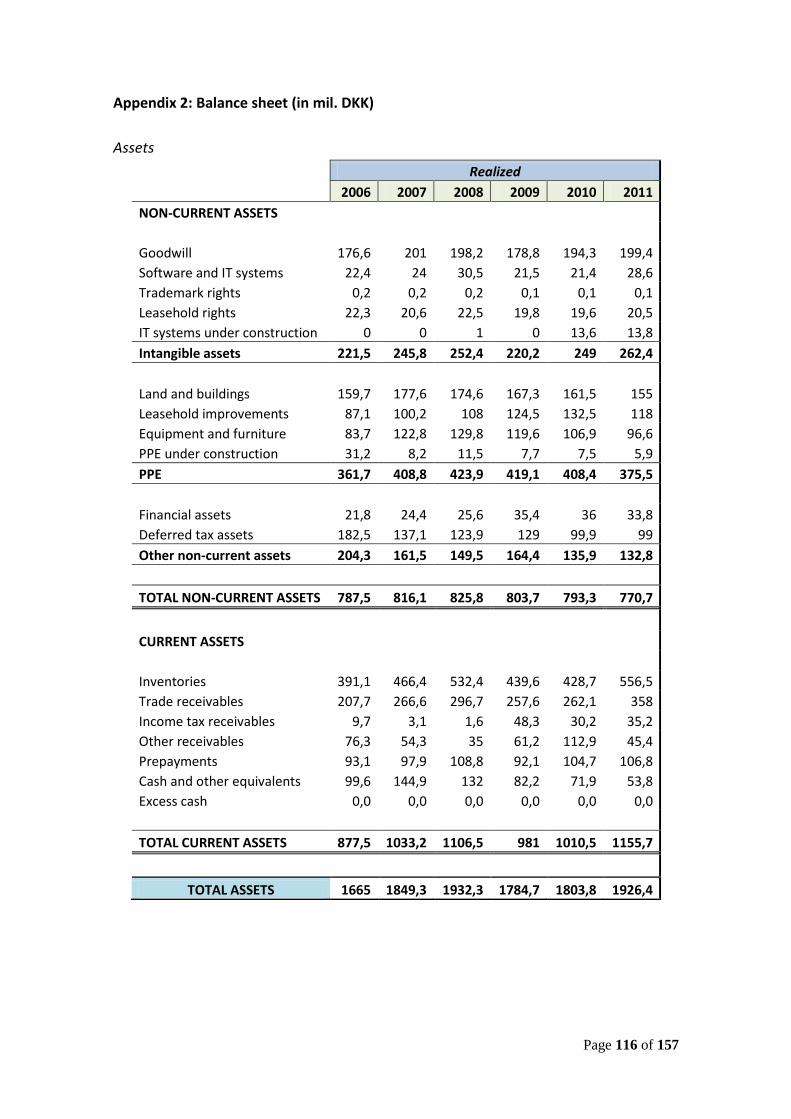
Page 116 of 157
Appendix 2: Balance sheet (in mil. DKK)
Assets
Realized
2006 2007 2008 2009 2010 2011
NON-CURRENT ASSETS
Goodwill 176,6 201 198,2 178,8 194,3 199,4
Software and IT systems 22,4 24 30,5 21,5 21,4 28,6
Trademark rights 0,2 0,2 0,2 0,1 0,1 0,1
Leasehold rights 22,3 20,6 22,5 19,8 19,6 20,5
IT systems under construction 0 0 1 0 13,6 13,8
Intangible assets 221,5 245,8 252,4 220,2 249 262,4
Land and buildings 159,7 177,6 174,6 167,3 161,5 155
Leasehold improvements 87,1 100,2 108 124,5 132,5 118
Equipment and furniture 83,7 122,8 129,8 119,6 106,9 96,6
PPE under construction 31,2 8,2 11,5 7,7 7,5 5,9
PPE 361,7 408,8 423,9 419,1 408,4 375,5
Financial assets 21,8 24,4 25,6 35,4 36 33,8
Deferred tax assets 182,5 137,1 123,9 129 99,9 99
Other non-current assets 204,3 161,5 149,5 164,4 135,9 132,8
TOTAL NON-CURRENT ASSETS 787,5 816,1 825,8 803,7 793,3 770,7
CURRENT ASSETS
Inventories 391,1 466,4 532,4 439,6 428,7 556,5
Trade receivables 207,7 266,6 296,7 257,6 262,1 358
Income tax receivables 9,7 3,1 1,6 48,3 30,2 35,2
Other receivables 76,3 54,3 35 61,2 112,9 45,4
Prepayments 93,1 97,9 108,8 92,1 104,7 106,8
Cash and other equivalents 99,6 144,9 132 82,2 71,9 53,8
Excess cash 0,0 0,0 0,0 0,0 0,0 0,0
TOTAL CURRENT ASSETS 877,5 1033,2 1106,5 981 1010,5 1155,7
TOTAL ASSETS 1665 1849,3 1932,3 1784,7 1803,8 1926,4
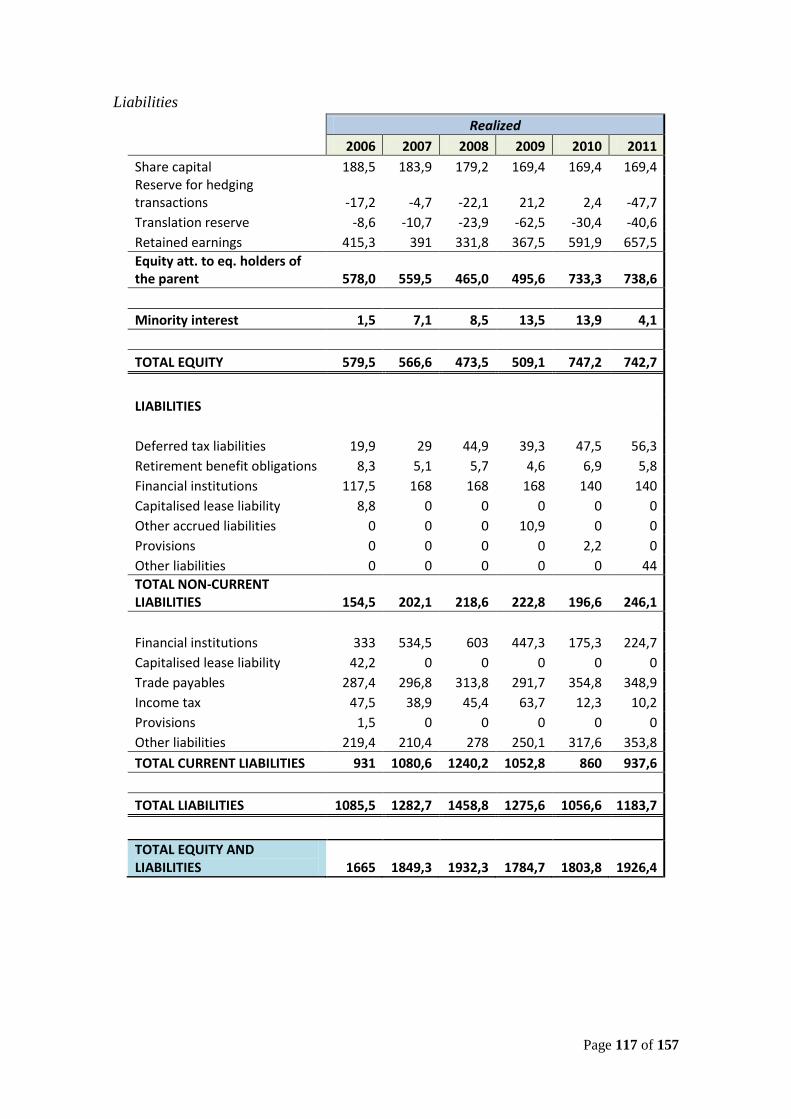
Page 117 of 157
Liabilities
Realized
2006 2007 2008 2009 2010 2011
Share capital 188,5 183,9 179,2 169,4 169,4 169,4 Reserve for hedging transactions -17,2 -4,7 -22,1 21,2 2,4 -47,7
Translation reserve -8,6 -10,7 -23,9 -62,5 -30,4 -40,6
Retained earnings 415,3 391 331,8 367,5 591,9 657,5
Equity att. to eq. holders of the parent 578,0 559,5 465,0 495,6 733,3 738,6
Minority interest 1,5 7,1 8,5 13,5 13,9 4,1
TOTAL EQUITY 579,5 566,6 473,5 509,1 747,2 742,7
LIABILITIES
Deferred tax liabilities 19,9 29 44,9 39,3 47,5 56,3
Retirement benefit obligations 8,3 5,1 5,7 4,6 6,9 5,8
Financial institutions 117,5 168 168 168 140 140
Capitalised lease liability 8,8 0 0 0 0 0
Other accrued liabilities 0 0 0 10,9 0 0
Provisions 0 0 0 0 2,2 0
Other liabilities 0 0 0 0 0 44
TOTAL NON-CURRENT LIABILITIES 154,5 202,1 218,6 222,8 196,6 246,1
Financial institutions 333 534,5 603 447,3 175,3 224,7
Capitalised lease liability 42,2 0 0 0 0 0
Trade payables 287,4 296,8 313,8 291,7 354,8 348,9
Income tax 47,5 38,9 45,4 63,7 12,3 10,2
Provisions 1,5 0 0 0 0 0
Other liabilities 219,4 210,4 278 250,1 317,6 353,8
TOTAL CURRENT LIABILITIES 931 1080,6 1240,2 1052,8 860 937,6
TOTAL LIABILITIES 1085,5 1282,7 1458,8 1275,6 1056,6 1183,7
TOTAL EQUITY AND LIABILITIES 1665 1849,3 1932,3 1784,7 1803,8 1926,4
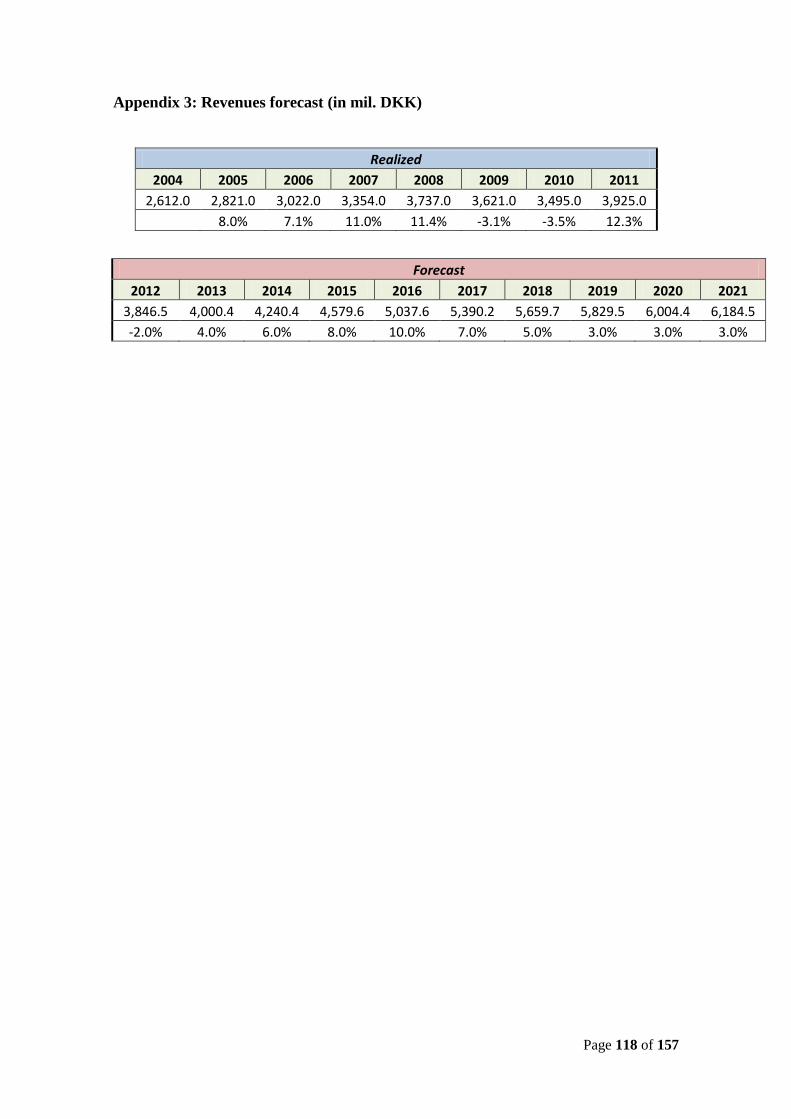
Page 118 of 157
Appendix 3: Revenues forecast (in mil. DKK)
Realized
2004 2005 2006 2007 2008 2009 2010 2011
2,612.0 2,821.0 3,022.0 3,354.0 3,737.0 3,621.0 3,495.0 3,925.0
8.0% 7.1% 11.0% 11.4% -3.1% -3.5% 12.3%
Forecast
2012 2013 2014 2015 2016 2017 2018 2019 2020 2021
3,846.5 4,000.4 4,240.4 4,579.6 5,037.6 5,390.2 5,659.7 5,829.5 6,004.4 6,184.5
-2.0% 4.0% 6.0% 8.0% 10.0% 7.0% 5.0% 3.0% 3.0% 3.0%
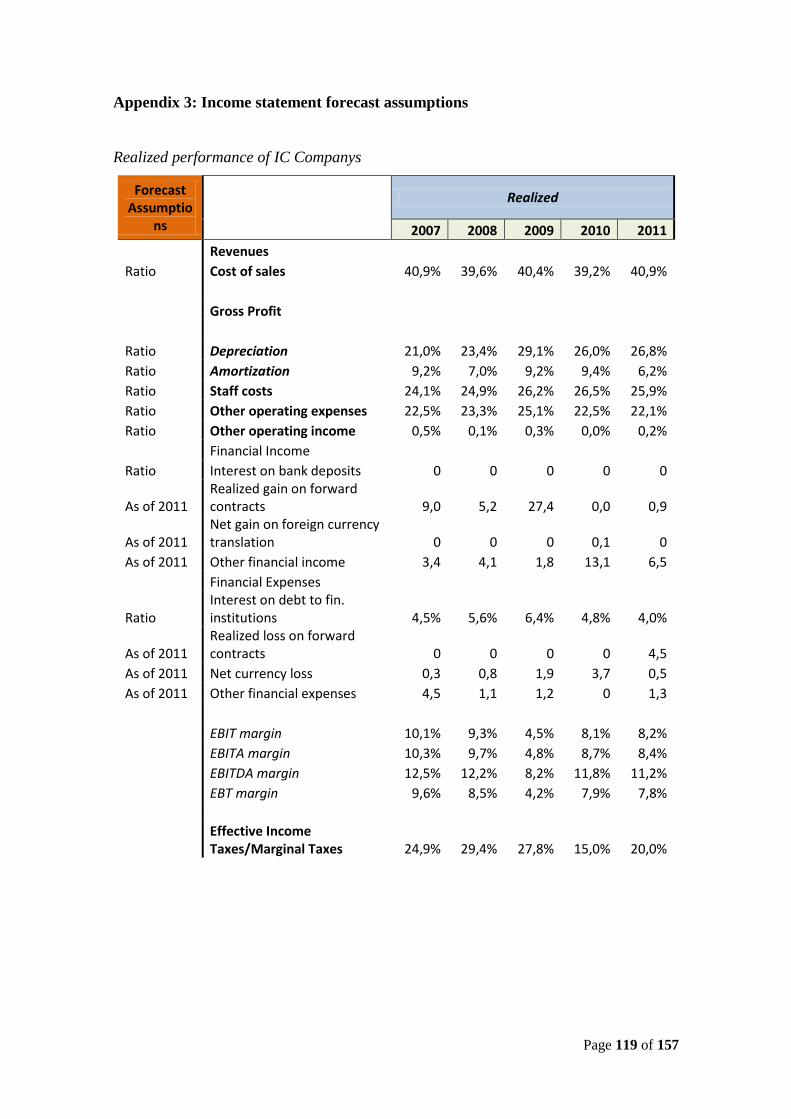
Page 119 of 157
Appendix 3: Income statement forecast assumptions
Realized performance of IC Companys
Forecast Assumptio
ns
Realized
2007 2008 2009 2010 2011
Revenues
Ratio Cost of sales 40,9% 39,6% 40,4% 39,2% 40,9%
Gross Profit
Ratio Depreciation 21,0% 23,4% 29,1% 26,0% 26,8%
Ratio Amortization 9,2% 7,0% 9,2% 9,4% 6,2%
Ratio Staff costs 24,1% 24,9% 26,2% 26,5% 25,9%
Ratio Other operating expenses 22,5% 23,3% 25,1% 22,5% 22,1%
Ratio Other operating income 0,5% 0,1% 0,3% 0,0% 0,2%
Financial Income
Ratio Interest on bank deposits 0 0 0 0 0
As of 2011 Realized gain on forward contracts 9,0 5,2 27,4 0,0 0,9
As of 2011 Net gain on foreign currency translation 0 0 0 0,1 0
As of 2011 Other financial income 3,4 4,1 1,8 13,1 6,5
Financial Expenses
Ratio Interest on debt to fin. institutions 4,5% 5,6% 6,4% 4,8% 4,0%
As of 2011 Realized loss on forward contracts 0 0 0 0 4,5
As of 2011 Net currency loss 0,3 0,8 1,9 3,7 0,5
As of 2011 Other financial expenses 4,5 1,1 1,2 0 1,3
EBIT margin 10,1% 9,3% 4,5% 8,1% 8,2%
EBITA margin 10,3% 9,7% 4,8% 8,7% 8,4%
EBITDA margin 12,5% 12,2% 8,2% 11,8% 11,2%
EBT margin 9,6% 8,5% 4,2% 7,9% 7,8%
Effective Income Taxes/Marginal Taxes 24,9% 29,4% 27,8% 15,0% 20,0%
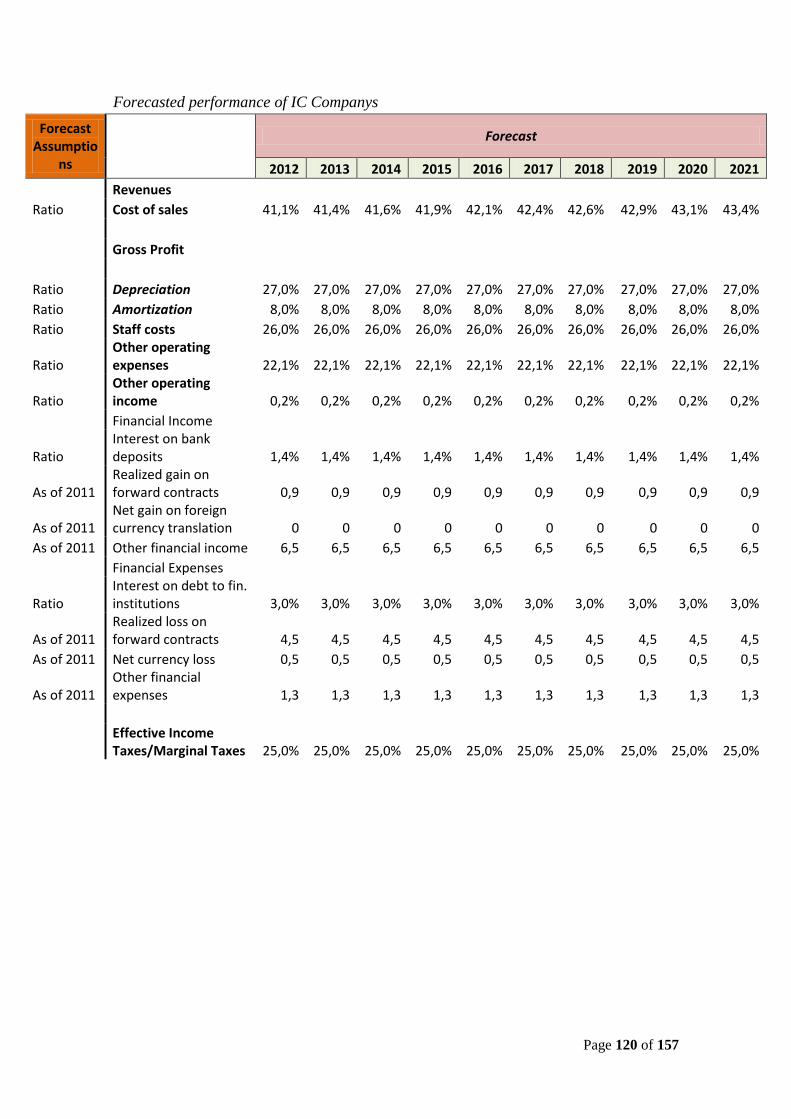
Page 120 of 157
Forecasted performance of IC Companys
Forecast Assumptio
ns
Forecast
2012 2013 2014 2015 2016 2017 2018 2019 2020 2021
Revenues Ratio Cost of sales 41,1% 41,4% 41,6% 41,9% 42,1% 42,4% 42,6% 42,9% 43,1% 43,4%
Gross Profit
Ratio Depreciation 27,0% 27,0% 27,0% 27,0% 27,0% 27,0% 27,0% 27,0% 27,0% 27,0%
Ratio Amortization 8,0% 8,0% 8,0% 8,0% 8,0% 8,0% 8,0% 8,0% 8,0% 8,0%
Ratio Staff costs 26,0% 26,0% 26,0% 26,0% 26,0% 26,0% 26,0% 26,0% 26,0% 26,0%
Ratio Other operating expenses 22,1% 22,1% 22,1% 22,1% 22,1% 22,1% 22,1% 22,1% 22,1% 22,1%
Ratio Other operating income 0,2% 0,2% 0,2% 0,2% 0,2% 0,2% 0,2% 0,2% 0,2% 0,2%
Financial Income
Ratio Interest on bank deposits 1,4% 1,4% 1,4% 1,4% 1,4% 1,4% 1,4% 1,4% 1,4% 1,4%
As of 2011 Realized gain on forward contracts 0,9 0,9 0,9 0,9 0,9 0,9 0,9 0,9 0,9 0,9
As of 2011 Net gain on foreign currency translation 0 0 0 0 0 0 0 0 0 0
As of 2011 Other financial income 6,5 6,5 6,5 6,5 6,5 6,5 6,5 6,5 6,5 6,5
Financial Expenses
Ratio Interest on debt to fin. institutions 3,0% 3,0% 3,0% 3,0% 3,0% 3,0% 3,0% 3,0% 3,0% 3,0%
As of 2011 Realized loss on forward contracts 4,5 4,5 4,5 4,5 4,5 4,5 4,5 4,5 4,5 4,5
As of 2011 Net currency loss 0,5 0,5 0,5 0,5 0,5 0,5 0,5 0,5 0,5 0,5
As of 2011 Other financial expenses 1,3 1,3 1,3 1,3 1,3 1,3 1,3 1,3 1,3 1,3
Effective Income Taxes/Marginal Taxes 25,0% 25,0% 25,0% 25,0% 25,0% 25,0% 25,0% 25,0% 25,0% 25,0%
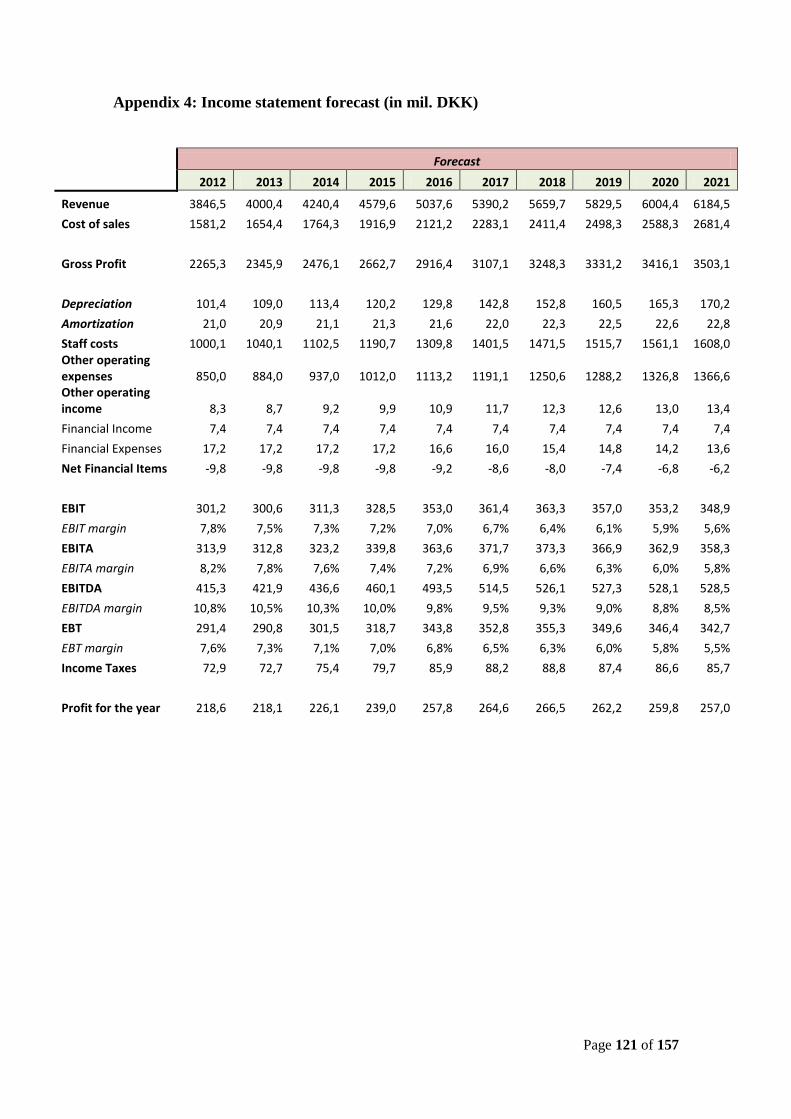
Page 121 of 157
Appendix 4: Income statement forecast (in mil. DKK)
Forecast
2012 2013 2014 2015 2016 2017 2018 2019 2020 2021
Revenue 3846,5 4000,4 4240,4 4579,6 5037,6 5390,2 5659,7 5829,5 6004,4 6184,5
Cost of sales 1581,2 1654,4 1764,3 1916,9 2121,2 2283,1 2411,4 2498,3 2588,3 2681,4
Gross Profit 2265,3 2345,9 2476,1 2662,7 2916,4 3107,1 3248,3 3331,2 3416,1 3503,1
Depreciation 101,4 109,0 113,4 120,2 129,8 142,8 152,8 160,5 165,3 170,2
Amortization 21,0 20,9 21,1 21,3 21,6 22,0 22,3 22,5 22,6 22,8
Staff costs 1000,1 1040,1 1102,5 1190,7 1309,8 1401,5 1471,5 1515,7 1561,1 1608,0 Other operating expenses 850,0 884,0 937,0 1012,0 1113,2 1191,1 1250,6 1288,2 1326,8 1366,6 Other operating income 8,3 8,7 9,2 9,9 10,9 11,7 12,3 12,6 13,0 13,4
Financial Income 7,4 7,4 7,4 7,4 7,4 7,4 7,4 7,4 7,4 7,4
Financial Expenses 17,2 17,2 17,2 17,2 16,6 16,0 15,4 14,8 14,2 13,6
Net Financial Items -9,8 -9,8 -9,8 -9,8 -9,2 -8,6 -8,0 -7,4 -6,8 -6,2
EBIT 301,2 300,6 311,3 328,5 353,0 361,4 363,3 357,0 353,2 348,9
EBIT margin 7,8% 7,5% 7,3% 7,2% 7,0% 6,7% 6,4% 6,1% 5,9% 5,6%
EBITA 313,9 312,8 323,2 339,8 363,6 371,7 373,3 366,9 362,9 358,3
EBITA margin 8,2% 7,8% 7,6% 7,4% 7,2% 6,9% 6,6% 6,3% 6,0% 5,8%
EBITDA 415,3 421,9 436,6 460,1 493,5 514,5 526,1 527,3 528,1 528,5
EBITDA margin 10,8% 10,5% 10,3% 10,0% 9,8% 9,5% 9,3% 9,0% 8,8% 8,5%
EBT 291,4 290,8 301,5 318,7 343,8 352,8 355,3 349,6 346,4 342,7
EBT margin 7,6% 7,3% 7,1% 7,0% 6,8% 6,5% 6,3% 6,0% 5,8% 5,5%
Income Taxes 72,9 72,7 75,4 79,7 85,9 88,2 88,8 87,4 86,6 85,7
Profit for the year 218,6 218,1 226,1 239,0 257,8 264,6 266,5 262,2 259,8 257,0
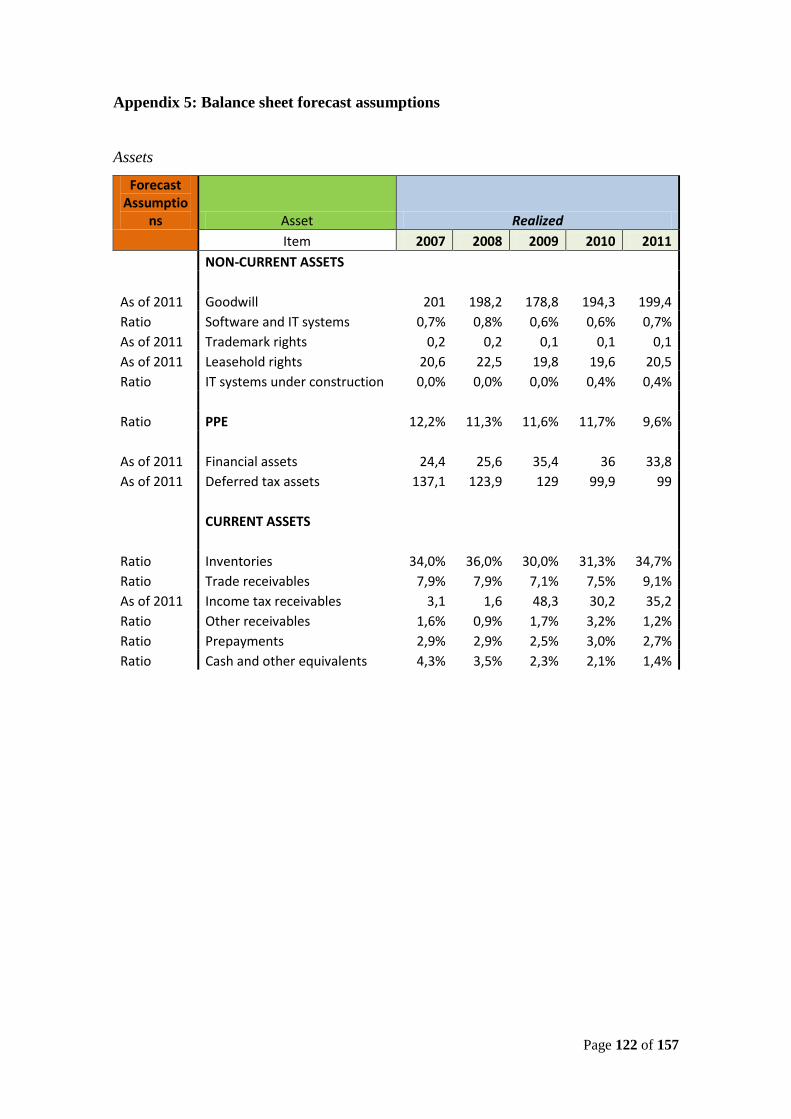
Page 122 of 157
Appendix 5: Balance sheet forecast assumptions
Assets
Forecast Assumptio
ns Asset Realized
Item 2007 2008 2009 2010 2011
NON-CURRENT ASSETS
As of 2011 Goodwill 201 198,2 178,8 194,3 199,4
Ratio Software and IT systems 0,7% 0,8% 0,6% 0,6% 0,7%
As of 2011 Trademark rights 0,2 0,2 0,1 0,1 0,1
As of 2011 Leasehold rights 20,6 22,5 19,8 19,6 20,5
Ratio IT systems under construction 0,0% 0,0% 0,0% 0,4% 0,4%
Ratio PPE 12,2% 11,3% 11,6% 11,7% 9,6%
As of 2011 Financial assets 24,4 25,6 35,4 36 33,8
As of 2011 Deferred tax assets 137,1 123,9 129 99,9 99
CURRENT ASSETS
Ratio Inventories 34,0% 36,0% 30,0% 31,3% 34,7%
Ratio Trade receivables 7,9% 7,9% 7,1% 7,5% 9,1%
As of 2011 Income tax receivables 3,1 1,6 48,3 30,2 35,2
Ratio Other receivables 1,6% 0,9% 1,7% 3,2% 1,2%
Ratio Prepayments 2,9% 2,9% 2,5% 3,0% 2,7%
Ratio Cash and other equivalents 4,3% 3,5% 2,3% 2,1% 1,4%
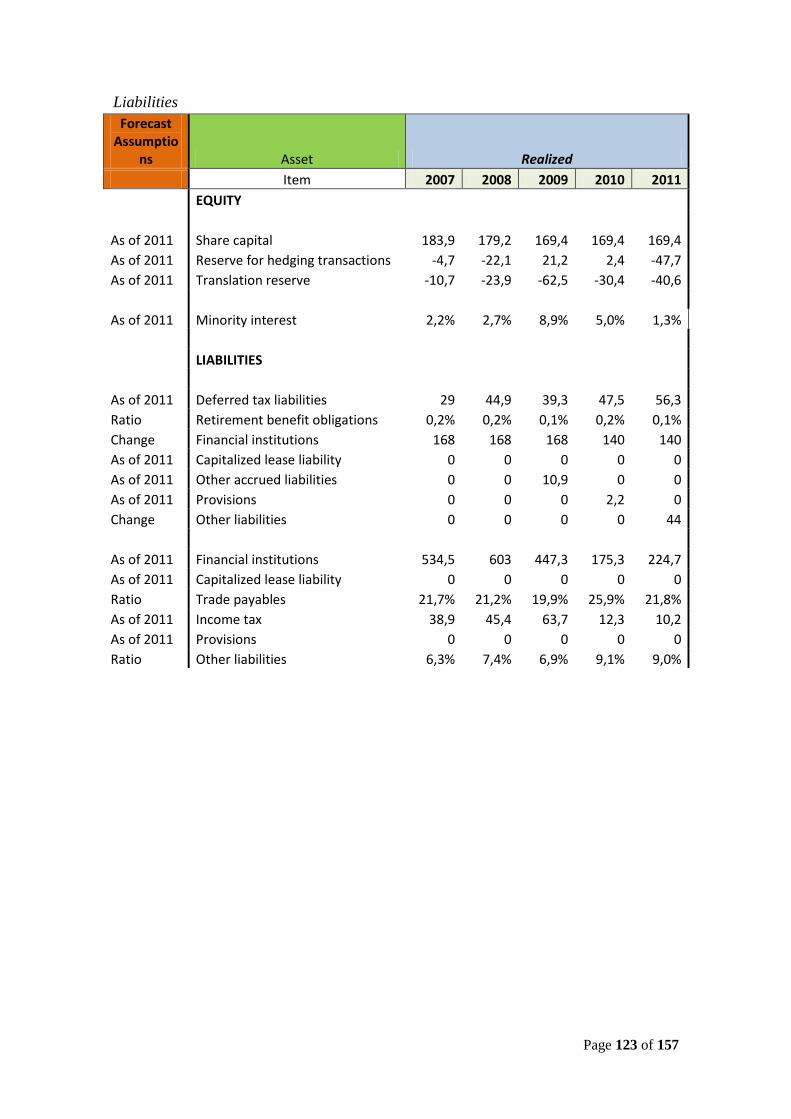
Page 123 of 157
Liabilities
Forecast Assumptio
ns Asset Realized
Item 2007 2008 2009 2010 2011
EQUITY
As of 2011 Share capital 183,9 179,2 169,4 169,4 169,4
As of 2011 Reserve for hedging transactions -4,7 -22,1 21,2 2,4 -47,7
As of 2011 Translation reserve -10,7 -23,9 -62,5 -30,4 -40,6
As of 2011 Minority interest 2,2% 2,7% 8,9% 5,0% 1,3%
LIABILITIES
As of 2011 Deferred tax liabilities 29 44,9 39,3 47,5 56,3
Ratio Retirement benefit obligations 0,2% 0,2% 0,1% 0,2% 0,1%
Change Financial institutions 168 168 168 140 140
As of 2011 Capitalized lease liability 0 0 0 0 0
As of 2011 Other accrued liabilities 0 0 10,9 0 0
As of 2011 Provisions 0 0 0 2,2 0
Change Other liabilities 0 0 0 0 44
As of 2011 Financial institutions 534,5 603 447,3 175,3 224,7
As of 2011 Capitalized lease liability 0 0 0 0 0
Ratio Trade payables 21,7% 21,2% 19,9% 25,9% 21,8%
As of 2011 Income tax 38,9 45,4 63,7 12,3 10,2
As of 2011 Provisions 0 0 0 0 0
Ratio Other liabilities 6,3% 7,4% 6,9% 9,1% 9,0%
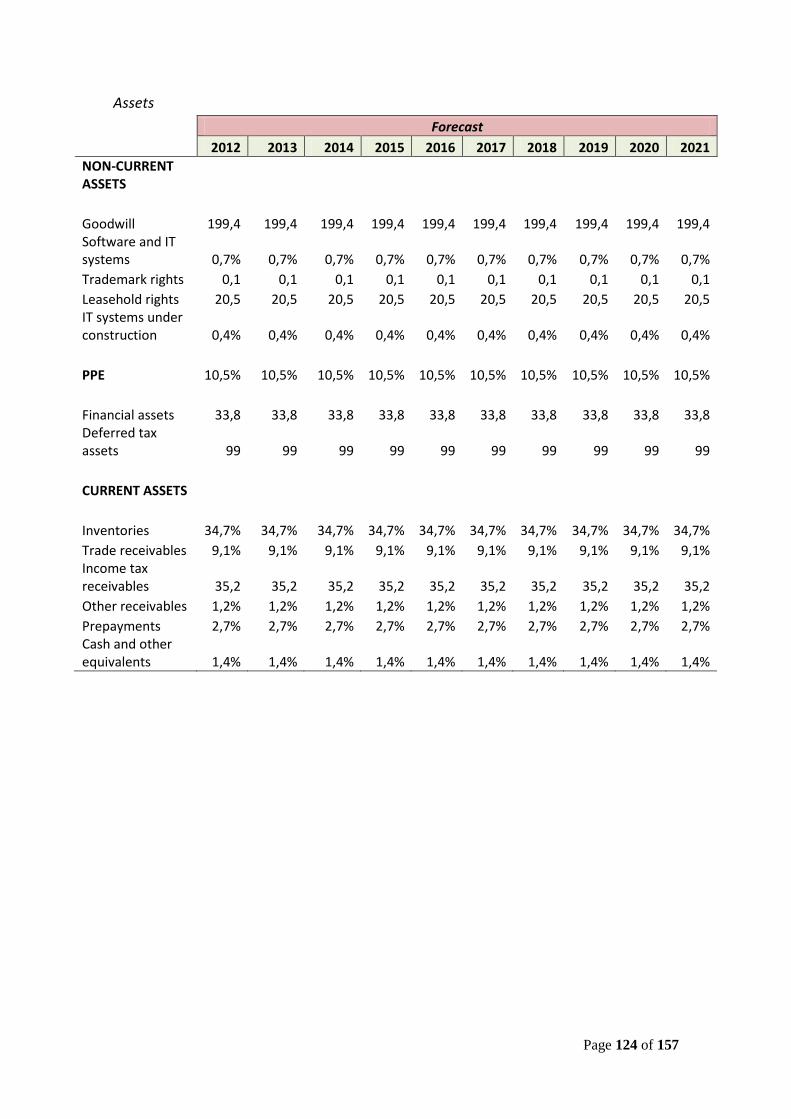
Page 124 of 157
Assets
Forecast
2012 2013 2014 2015 2016 2017 2018 2019 2020 2021
NON-CURRENT ASSETS
Goodwill 199,4 199,4 199,4 199,4 199,4 199,4 199,4 199,4 199,4 199,4 Software and IT systems 0,7% 0,7% 0,7% 0,7% 0,7% 0,7% 0,7% 0,7% 0,7% 0,7%
Trademark rights 0,1 0,1 0,1 0,1 0,1 0,1 0,1 0,1 0,1 0,1
Leasehold rights 20,5 20,5 20,5 20,5 20,5 20,5 20,5 20,5 20,5 20,5 IT systems under construction 0,4% 0,4% 0,4% 0,4% 0,4% 0,4% 0,4% 0,4% 0,4% 0,4%
PPE 10,5% 10,5% 10,5% 10,5% 10,5% 10,5% 10,5% 10,5% 10,5% 10,5%
Financial assets 33,8 33,8 33,8 33,8 33,8 33,8 33,8 33,8 33,8 33,8 Deferred tax assets 99 99 99 99 99 99 99 99 99 99
CURRENT ASSETS
Inventories 34,7% 34,7% 34,7% 34,7% 34,7% 34,7% 34,7% 34,7% 34,7% 34,7%
Trade receivables 9,1% 9,1% 9,1% 9,1% 9,1% 9,1% 9,1% 9,1% 9,1% 9,1% Income tax receivables 35,2 35,2 35,2 35,2 35,2 35,2 35,2 35,2 35,2 35,2
Other receivables 1,2% 1,2% 1,2% 1,2% 1,2% 1,2% 1,2% 1,2% 1,2% 1,2%
Prepayments 2,7% 2,7% 2,7% 2,7% 2,7% 2,7% 2,7% 2,7% 2,7% 2,7% Cash and other equivalents 1,4% 1,4% 1,4% 1,4% 1,4% 1,4% 1,4% 1,4% 1,4% 1,4%
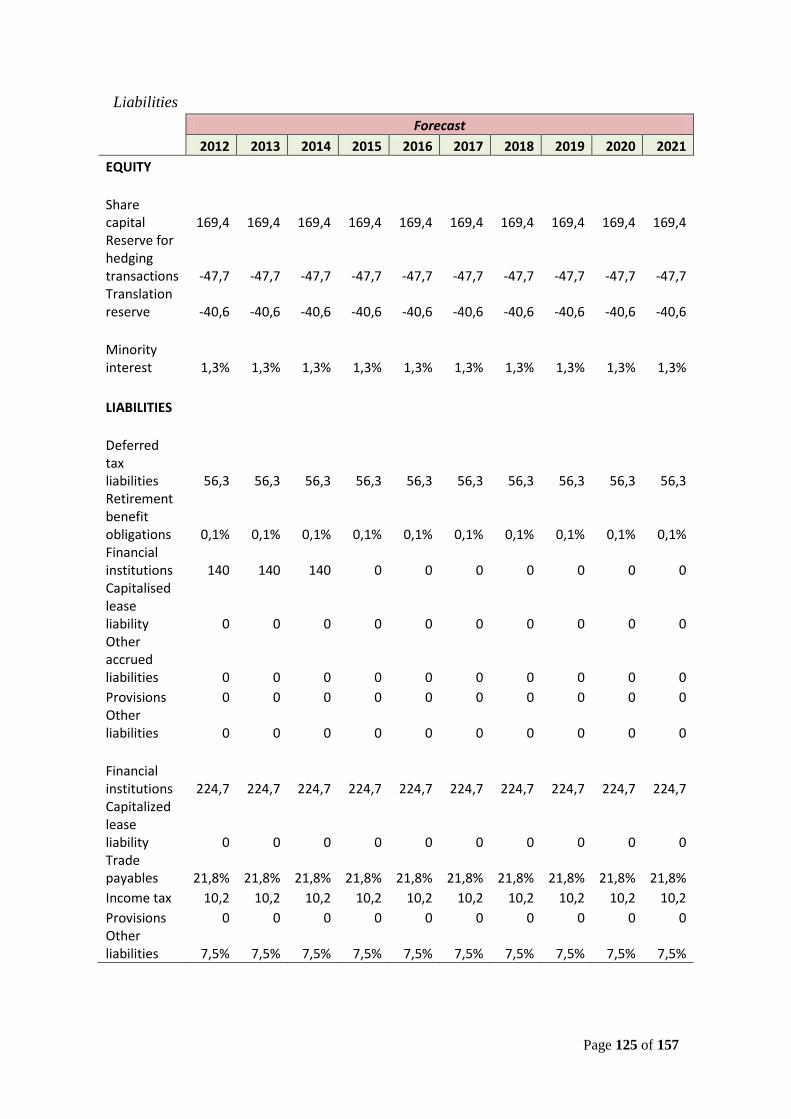
Page 125 of 157
Liabilities
Forecast
2012 2013 2014 2015 2016 2017 2018 2019 2020 2021
EQUITY
Share capital 169,4 169,4 169,4 169,4 169,4 169,4 169,4 169,4 169,4 169,4 Reserve for hedging transactions -47,7 -47,7 -47,7 -47,7 -47,7 -47,7 -47,7 -47,7 -47,7 -47,7 Translation reserve -40,6 -40,6 -40,6 -40,6 -40,6 -40,6 -40,6 -40,6 -40,6 -40,6
Minority interest 1,3% 1,3% 1,3% 1,3% 1,3% 1,3% 1,3% 1,3% 1,3% 1,3%
LIABILITIES
Deferred tax liabilities 56,3 56,3 56,3 56,3 56,3 56,3 56,3 56,3 56,3 56,3 Retirement benefit obligations 0,1% 0,1% 0,1% 0,1% 0,1% 0,1% 0,1% 0,1% 0,1% 0,1% Financial institutions 140 140 140 0 0 0 0 0 0 0 Capitalised lease liability 0 0 0 0 0 0 0 0 0 0 Other accrued liabilities 0 0 0 0 0 0 0 0 0 0
Provisions 0 0 0 0 0 0 0 0 0 0 Other liabilities 0 0 0 0 0 0 0 0 0 0
Financial institutions 224,7 224,7 224,7 224,7 224,7 224,7 224,7 224,7 224,7 224,7 Capitalized lease liability 0 0 0 0 0 0 0 0 0 0 Trade payables 21,8% 21,8% 21,8% 21,8% 21,8% 21,8% 21,8% 21,8% 21,8% 21,8%
Income tax 10,2 10,2 10,2 10,2 10,2 10,2 10,2 10,2 10,2 10,2
Provisions 0 0 0 0 0 0 0 0 0 0 Other liabilities 7,5% 7,5% 7,5% 7,5% 7,5% 7,5% 7,5% 7,5% 7,5% 7,5%
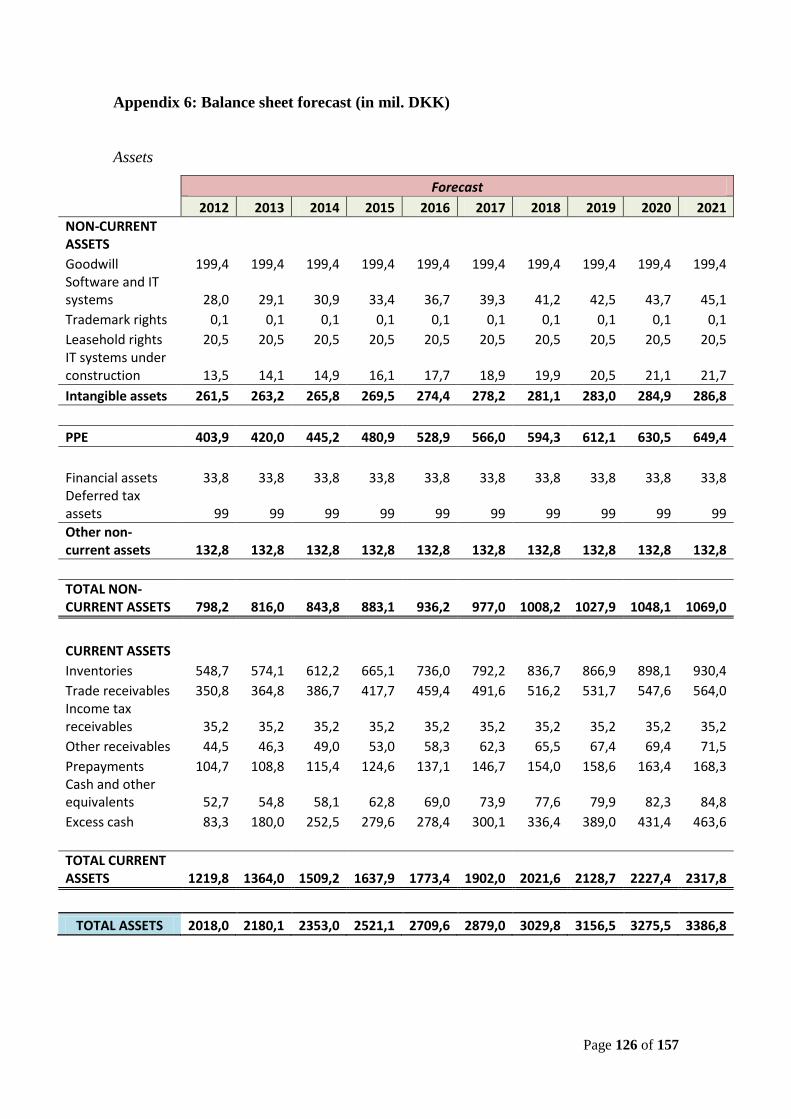
Page 126 of 157
Appendix 6: Balance sheet forecast (in mil. DKK)
Assets
Forecast
2012 2013 2014 2015 2016 2017 2018 2019 2020 2021
NON-CURRENT ASSETS
Goodwill 199,4 199,4 199,4 199,4 199,4 199,4 199,4 199,4 199,4 199,4 Software and IT systems 28,0 29,1 30,9 33,4 36,7 39,3 41,2 42,5 43,7 45,1
Trademark rights 0,1 0,1 0,1 0,1 0,1 0,1 0,1 0,1 0,1 0,1
Leasehold rights 20,5 20,5 20,5 20,5 20,5 20,5 20,5 20,5 20,5 20,5 IT systems under construction 13,5 14,1 14,9 16,1 17,7 18,9 19,9 20,5 21,1 21,7
Intangible assets 261,5 263,2 265,8 269,5 274,4 278,2 281,1 283,0 284,9 286,8
PPE 403,9 420,0 445,2 480,9 528,9 566,0 594,3 612,1 630,5 649,4
Financial assets 33,8 33,8 33,8 33,8 33,8 33,8 33,8 33,8 33,8 33,8 Deferred tax assets 99 99 99 99 99 99 99 99 99 99
Other non-current assets 132,8 132,8 132,8 132,8 132,8 132,8 132,8 132,8 132,8 132,8
TOTAL NON-CURRENT ASSETS 798,2 816,0 843,8 883,1 936,2 977,0 1008,2 1027,9 1048,1 1069,0
CURRENT ASSETS Inventories 548,7 574,1 612,2 665,1 736,0 792,2 836,7 866,9 898,1 930,4
Trade receivables 350,8 364,8 386,7 417,7 459,4 491,6 516,2 531,7 547,6 564,0 Income tax receivables 35,2 35,2 35,2 35,2 35,2 35,2 35,2 35,2 35,2 35,2
Other receivables 44,5 46,3 49,0 53,0 58,3 62,3 65,5 67,4 69,4 71,5
Prepayments 104,7 108,8 115,4 124,6 137,1 146,7 154,0 158,6 163,4 168,3 Cash and other equivalents 52,7 54,8 58,1 62,8 69,0 73,9 77,6 79,9 82,3 84,8
Excess cash 83,3 180,0 252,5 279,6 278,4 300,1 336,4 389,0 431,4 463,6
TOTAL CURRENT ASSETS 1219,8 1364,0 1509,2 1637,9 1773,4 1902,0 2021,6 2128,7 2227,4 2317,8
TOTAL ASSETS 2018,0 2180,1 2353,0 2521,1 2709,6 2879,0 3029,8 3156,5 3275,5 3386,8
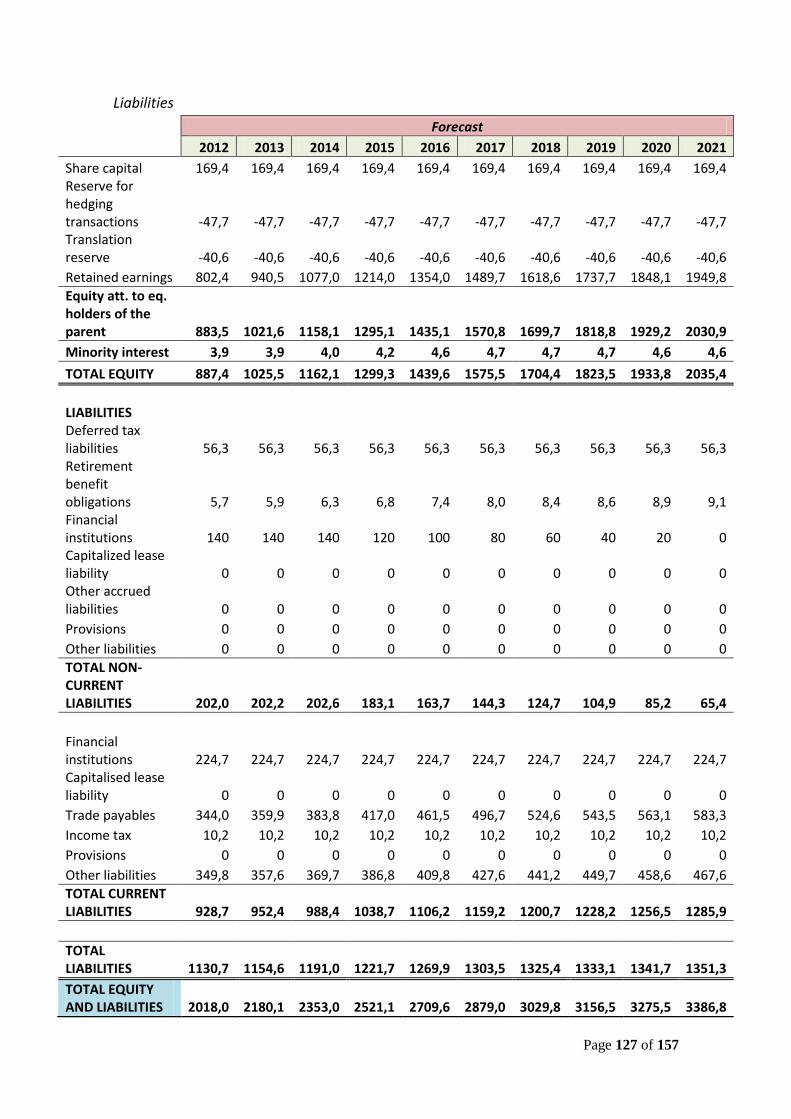
Page 127 of 157
Liabilities
Forecast
2012 2013 2014 2015 2016 2017 2018 2019 2020 2021
Share capital 169,4 169,4 169,4 169,4 169,4 169,4 169,4 169,4 169,4 169,4 Reserve for hedging transactions -47,7 -47,7 -47,7 -47,7 -47,7 -47,7 -47,7 -47,7 -47,7 -47,7 Translation reserve -40,6 -40,6 -40,6 -40,6 -40,6 -40,6 -40,6 -40,6 -40,6 -40,6
Retained earnings 802,4 940,5 1077,0 1214,0 1354,0 1489,7 1618,6 1737,7 1848,1 1949,8
Equity att. to eq. holders of the parent 883,5 1021,6 1158,1 1295,1 1435,1 1570,8 1699,7 1818,8 1929,2 2030,9
Minority interest 3,9 3,9 4,0 4,2 4,6 4,7 4,7 4,7 4,6 4,6
TOTAL EQUITY 887,4 1025,5 1162,1 1299,3 1439,6 1575,5 1704,4 1823,5 1933,8 2035,4
LIABILITIES
Deferred tax liabilities 56,3 56,3 56,3 56,3 56,3 56,3 56,3 56,3 56,3 56,3 Retirement benefit obligations 5,7 5,9 6,3 6,8 7,4 8,0 8,4 8,6 8,9 9,1 Financial institutions 140 140 140 120 100 80 60 40 20 0 Capitalized lease liability 0 0 0 0 0 0 0 0 0 0 Other accrued liabilities 0 0 0 0 0 0 0 0 0 0
Provisions 0 0 0 0 0 0 0 0 0 0
Other liabilities 0 0 0 0 0 0 0 0 0 0
TOTAL NON-CURRENT LIABILITIES 202,0 202,2 202,6 183,1 163,7 144,3 124,7 104,9 85,2 65,4
Financial institutions 224,7 224,7 224,7 224,7 224,7 224,7 224,7 224,7 224,7 224,7 Capitalised lease liability 0 0 0 0 0 0 0 0 0 0
Trade payables 344,0 359,9 383,8 417,0 461,5 496,7 524,6 543,5 563,1 583,3
Income tax 10,2 10,2 10,2 10,2 10,2 10,2 10,2 10,2 10,2 10,2
Provisions 0 0 0 0 0 0 0 0 0 0
Other liabilities 349,8 357,6 369,7 386,8 409,8 427,6 441,2 449,7 458,6 467,6
TOTAL CURRENT LIABILITIES 928,7 952,4 988,4 1038,7 1106,2 1159,2 1200,7 1228,2 1256,5 1285,9
TOTAL LIABILITIES 1130,7 1154,6 1191,0 1221,7 1269,9 1303,5 1325,4 1333,1 1341,7 1351,3
TOTAL EQUITY AND LIABILITIES 2018,0 2180,1 2353,0 2521,1 2709,6 2879,0 3029,8 3156,5 3275,5 3386,8
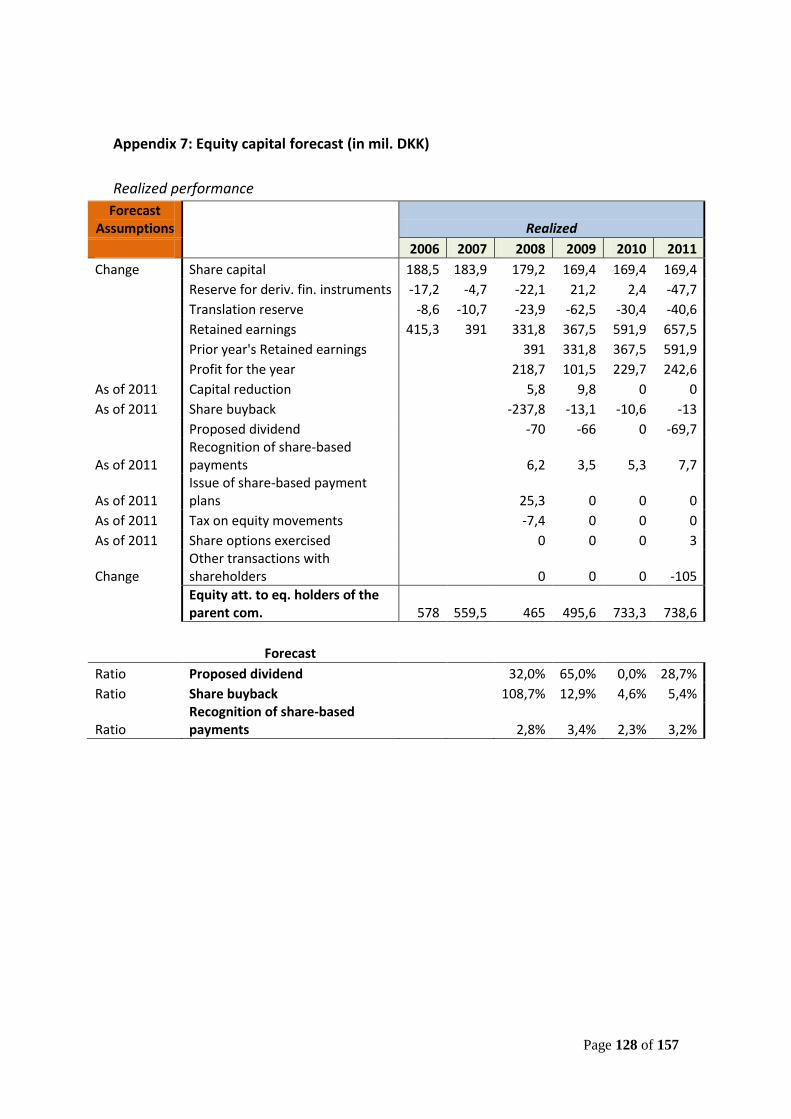
Page 128 of 157
Appendix 7: Equity capital forecast (in mil. DKK)
Realized performance
Forecast Assumptions Realized
2006 2007 2008 2009 2010 2011
Change Share capital 188,5 183,9 179,2 169,4 169,4 169,4
Reserve for deriv. fin. instruments -17,2 -4,7 -22,1 21,2 2,4 -47,7
Translation reserve -8,6 -10,7 -23,9 -62,5 -30,4 -40,6
Retained earnings 415,3 391 331,8 367,5 591,9 657,5
Prior year's Retained earnings
391 331,8 367,5 591,9
Profit for the year
218,7 101,5 229,7 242,6
As of 2011 Capital reduction
5,8 9,8 0 0
As of 2011 Share buyback
-237,8 -13,1 -10,6 -13
Proposed dividend
-70 -66 0 -69,7
As of 2011 Recognition of share-based payments
6,2 3,5 5,3 7,7
As of 2011 Issue of share-based payment plans
25,3 0 0 0
As of 2011 Tax on equity movements
-7,4 0 0 0
As of 2011 Share options exercised
0 0 0 3
Change Other transactions with shareholders
0 0 0 -105
Equity att. to eq. holders of the parent com. 578 559,5 465 495,6 733,3 738,6
Forecast
Ratio Proposed dividend 32,0% 65,0% 0,0% 28,7%
Ratio Share buyback
108,7% 12,9% 4,6% 5,4%
Ratio Recognition of share-based payments 2,8% 3,4% 2,3% 3,2%
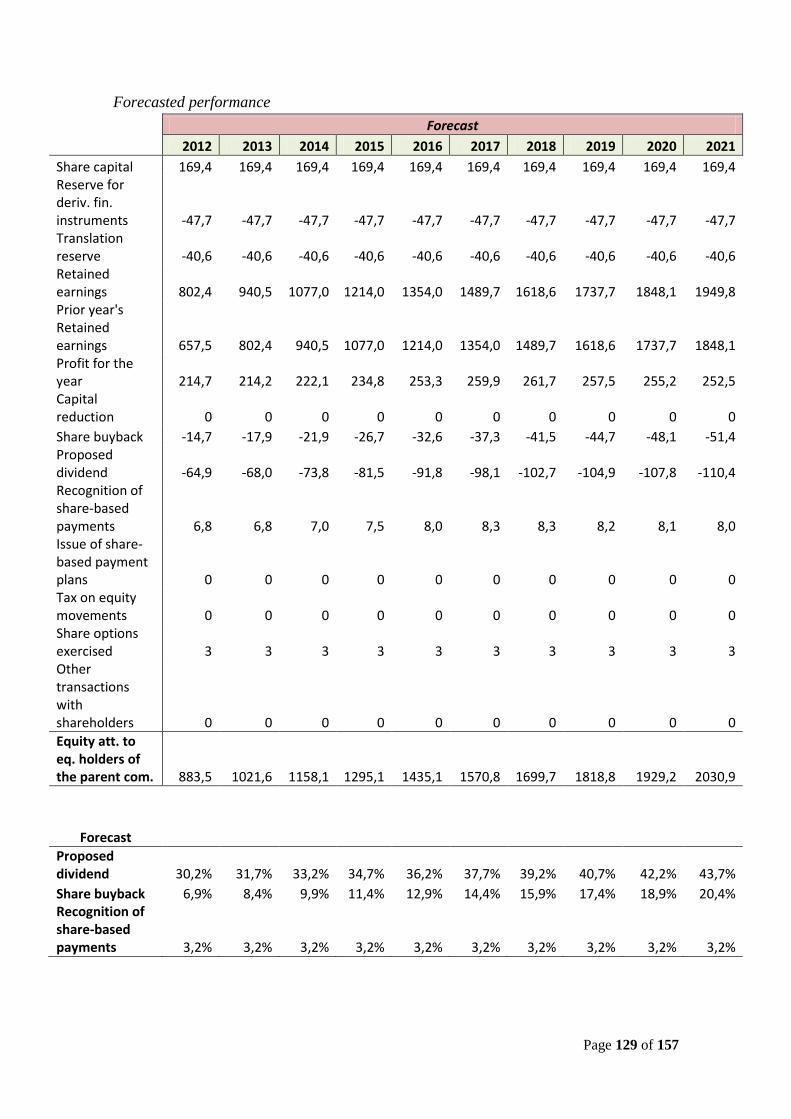
Page 129 of 157
Forecasted performance
Forecast
2012 2013 2014 2015 2016 2017 2018 2019 2020 2021
Share capital 169,4 169,4 169,4 169,4 169,4 169,4 169,4 169,4 169,4 169,4 Reserve for deriv. fin. instruments -47,7 -47,7 -47,7 -47,7 -47,7 -47,7 -47,7 -47,7 -47,7 -47,7 Translation reserve -40,6 -40,6 -40,6 -40,6 -40,6 -40,6 -40,6 -40,6 -40,6 -40,6 Retained earnings 802,4 940,5 1077,0 1214,0 1354,0 1489,7 1618,6 1737,7 1848,1 1949,8 Prior year's Retained earnings 657,5 802,4 940,5 1077,0 1214,0 1354,0 1489,7 1618,6 1737,7 1848,1 Profit for the year 214,7 214,2 222,1 234,8 253,3 259,9 261,7 257,5 255,2 252,5 Capital reduction 0 0 0 0 0 0 0 0 0 0
Share buyback -14,7 -17,9 -21,9 -26,7 -32,6 -37,3 -41,5 -44,7 -48,1 -51,4 Proposed dividend -64,9 -68,0 -73,8 -81,5 -91,8 -98,1 -102,7 -104,9 -107,8 -110,4 Recognition of share-based payments 6,8 6,8 7,0 7,5 8,0 8,3 8,3 8,2 8,1 8,0 Issue of share-based payment plans 0 0 0 0 0 0 0 0 0 0 Tax on equity movements 0 0 0 0 0 0 0 0 0 0 Share options exercised 3 3 3 3 3 3 3 3 3 3 Other transactions with shareholders 0 0 0 0 0 0 0 0 0 0
Equity att. to eq. holders of the parent com. 883,5 1021,6 1158,1 1295,1 1435,1 1570,8 1699,7 1818,8 1929,2 2030,9
Forecast Proposed
dividend 30,2% 31,7% 33,2% 34,7% 36,2% 37,7% 39,2% 40,7% 42,2% 43,7%
Share buyback 6,9% 8,4% 9,9% 11,4% 12,9% 14,4% 15,9% 17,4% 18,9% 20,4% Recognition of share-based payments 3,2% 3,2% 3,2% 3,2% 3,2% 3,2% 3,2% 3,2% 3,2% 3,2%
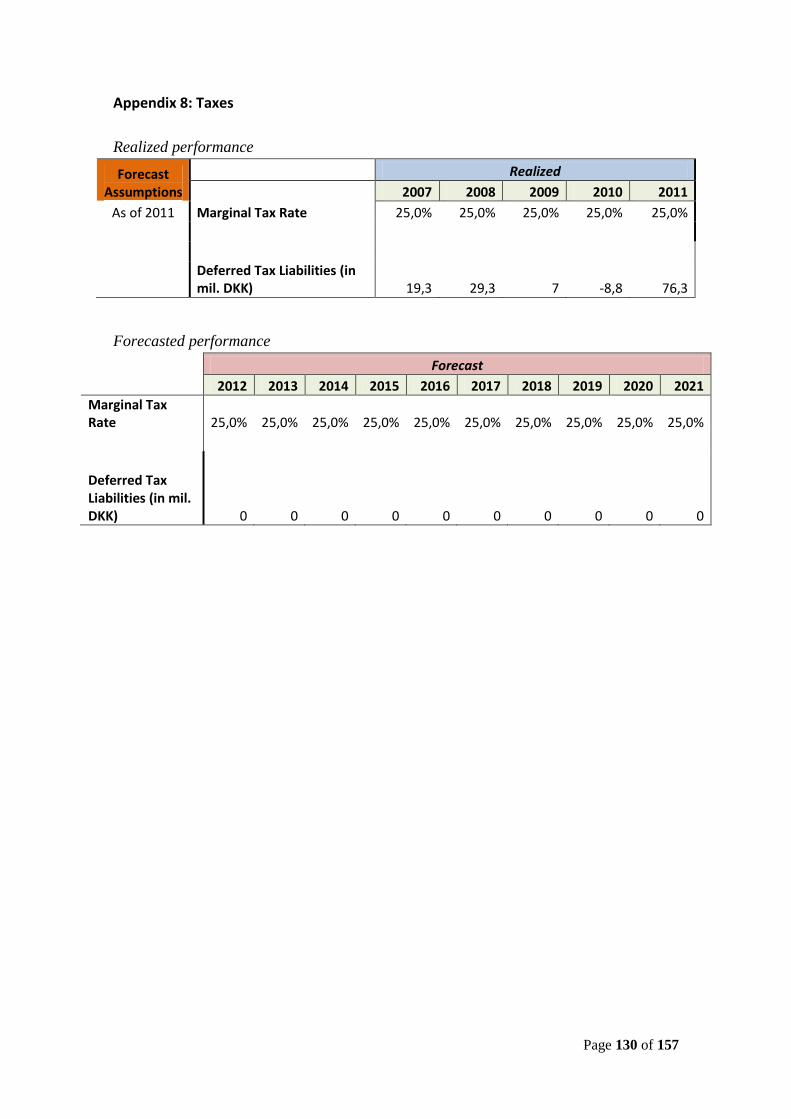
Page 130 of 157
Appendix 8: Taxes
Realized performance
Forecast Assumptions
Realized
2007 2008 2009 2010 2011
As of 2011 Marginal Tax Rate 25,0% 25,0% 25,0% 25,0% 25,0%
Deferred Tax Liabilities (in mil. DKK) 19,3 29,3 7 -8,8 76,3
Forecasted performance
Forecast
2012 2013 2014 2015 2016 2017 2018 2019 2020 2021
Marginal Tax Rate 25,0% 25,0% 25,0% 25,0% 25,0% 25,0% 25,0% 25,0% 25,0% 25,0%
Deferred Tax Liabilities (in mil. DKK) 0 0 0 0 0 0 0 0 0 0
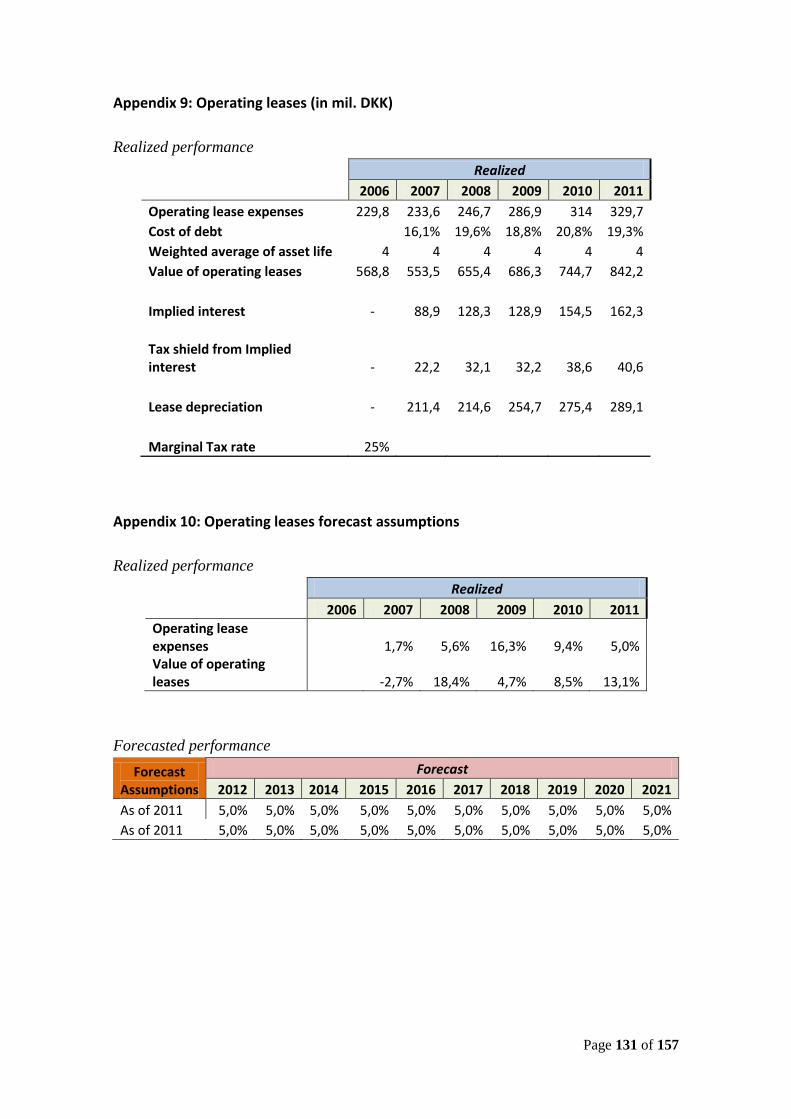
Page 131 of 157
Appendix 9: Operating leases (in mil. DKK)
Realized performance
Realized
2006 2007 2008 2009 2010 2011
Operating lease expenses 229,8 233,6 246,7 286,9 314 329,7
Cost of debt
16,1% 19,6% 18,8% 20,8% 19,3%
Weighted average of asset life 4 4 4 4 4 4
Value of operating leases 568,8 553,5 655,4 686,3 744,7 842,2
Implied interest - 88,9 128,3 128,9 154,5 162,3
Tax shield from Implied interest - 22,2 32,1 32,2 38,6 40,6
Lease depreciation - 211,4 214,6 254,7 275,4 289,1
Marginal Tax rate 25%
Appendix 10: Operating leases forecast assumptions
Realized performance
Realized
2006 2007 2008 2009 2010 2011
Operating lease expenses
1,7% 5,6% 16,3% 9,4% 5,0%
Value of operating leases
-2,7% 18,4% 4,7% 8,5% 13,1%
Forecasted performance
Forecast Assumptions
Forecast
2012 2013 2014 2015 2016 2017 2018 2019 2020 2021
As of 2011 5,0% 5,0% 5,0% 5,0% 5,0% 5,0% 5,0% 5,0% 5,0% 5,0%
As of 2011 5,0% 5,0% 5,0% 5,0% 5,0% 5,0% 5,0% 5,0% 5,0% 5,0%
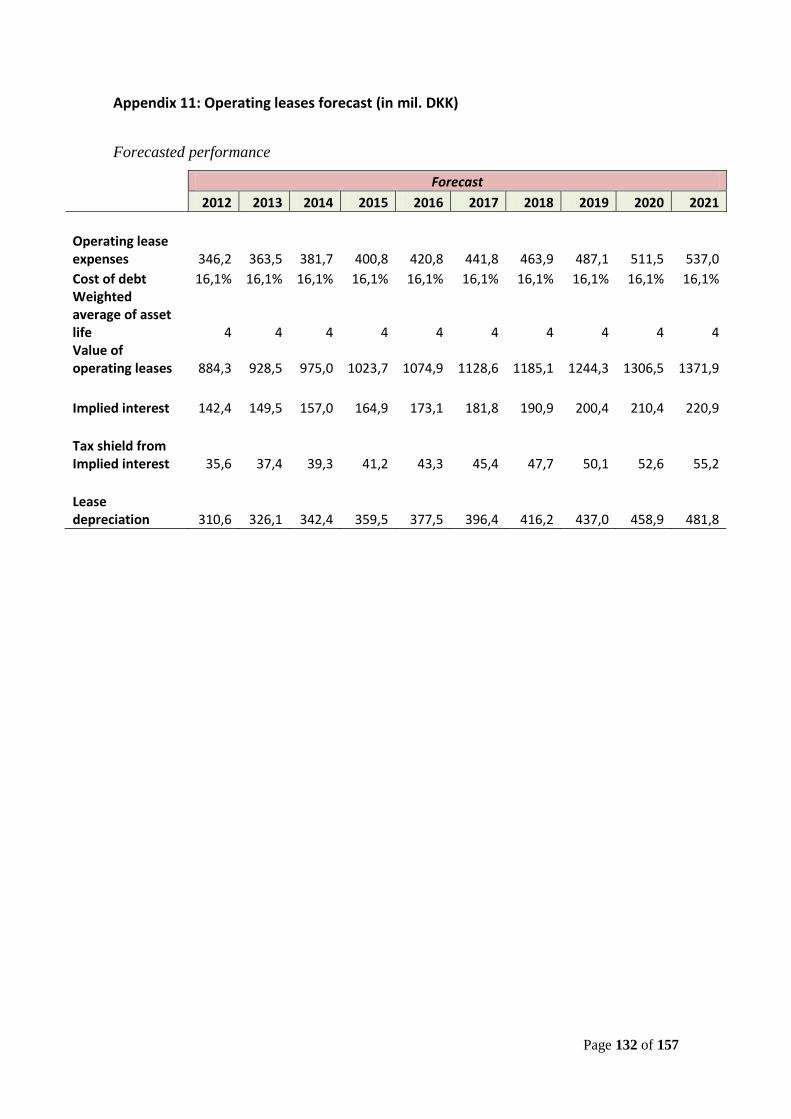
Page 132 of 157
Appendix 11: Operating leases forecast (in mil. DKK)
Forecasted performance
Forecast
2012 2013 2014 2015 2016 2017 2018 2019 2020 2021
Operating lease expenses 346,2 363,5 381,7 400,8 420,8 441,8 463,9 487,1 511,5 537,0
Cost of debt 16,1% 16,1% 16,1% 16,1% 16,1% 16,1% 16,1% 16,1% 16,1% 16,1% Weighted average of asset life 4 4 4 4 4 4 4 4 4 4 Value of operating leases 884,3 928,5 975,0 1023,7 1074,9 1128,6 1185,1 1244,3 1306,5 1371,9
Implied interest 142,4 149,5 157,0 164,9 173,1 181,8 190,9 200,4 210,4 220,9
Tax shield from Implied interest 35,6 37,4 39,3 41,2 43,3 45,4 47,7 50,1 52,6 55,2
Lease depreciation 310,6 326,1 342,4 359,5 377,5 396,4 416,2 437,0 458,9 481,8
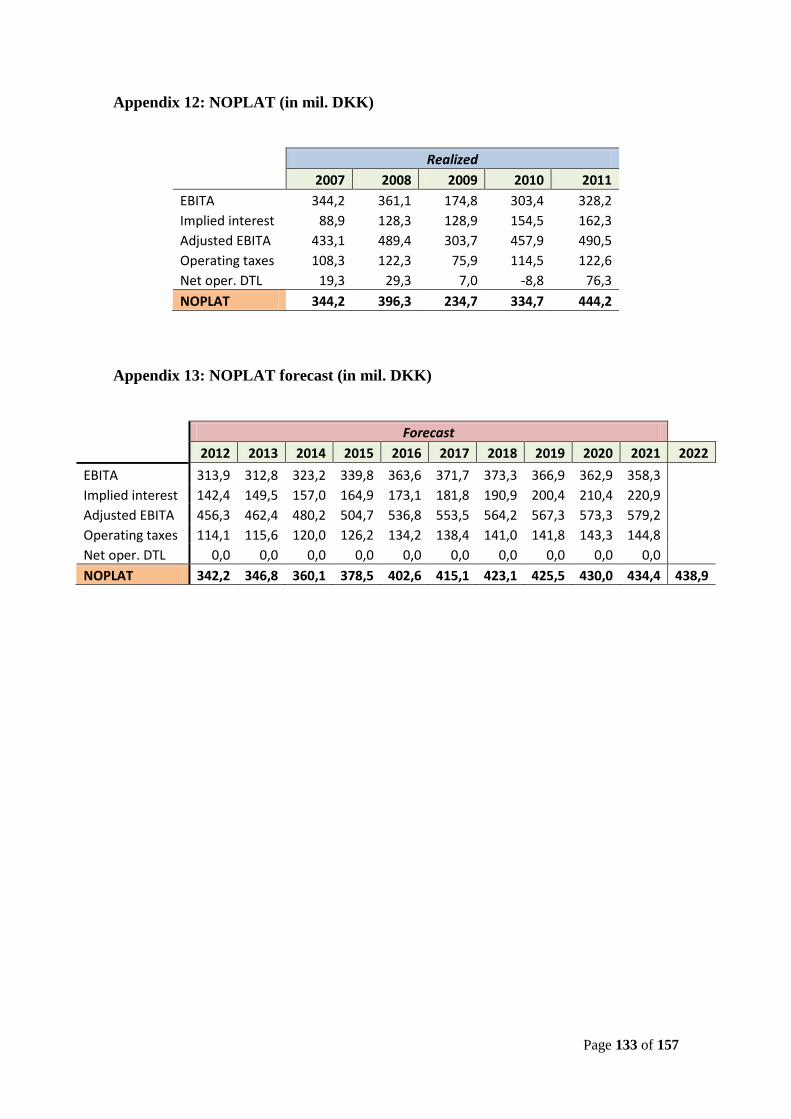
Page 133 of 157
Appendix 12: NOPLAT (in mil. DKK)
Realized
2007 2008 2009 2010 2011
EBITA 344,2 361,1 174,8 303,4 328,2
Implied interest 88,9 128,3 128,9 154,5 162,3
Adjusted EBITA 433,1 489,4 303,7 457,9 490,5
Operating taxes 108,3 122,3 75,9 114,5 122,6
Net oper. DTL 19,3 29,3 7,0 -8,8 76,3
NOPLAT 344,2 396,3 234,7 334,7 444,2
Appendix 13: NOPLAT forecast (in mil. DKK)
Forecast
2012 2013 2014 2015 2016 2017 2018 2019 2020 2021 2022
EBITA 313,9 312,8 323,2 339,8 363,6 371,7 373,3 366,9 362,9 358,3 Implied interest 142,4 149,5 157,0 164,9 173,1 181,8 190,9 200,4 210,4 220,9 Adjusted EBITA 456,3 462,4 480,2 504,7 536,8 553,5 564,2 567,3 573,3 579,2 Operating taxes 114,1 115,6 120,0 126,2 134,2 138,4 141,0 141,8 143,3 144,8 Net oper. DTL 0,0 0,0 0,0 0,0 0,0 0,0 0,0 0,0 0,0 0,0 NOPLAT 342,2 346,8 360,1 378,5 402,6 415,1 423,1 425,5 430,0 434,4 438,9
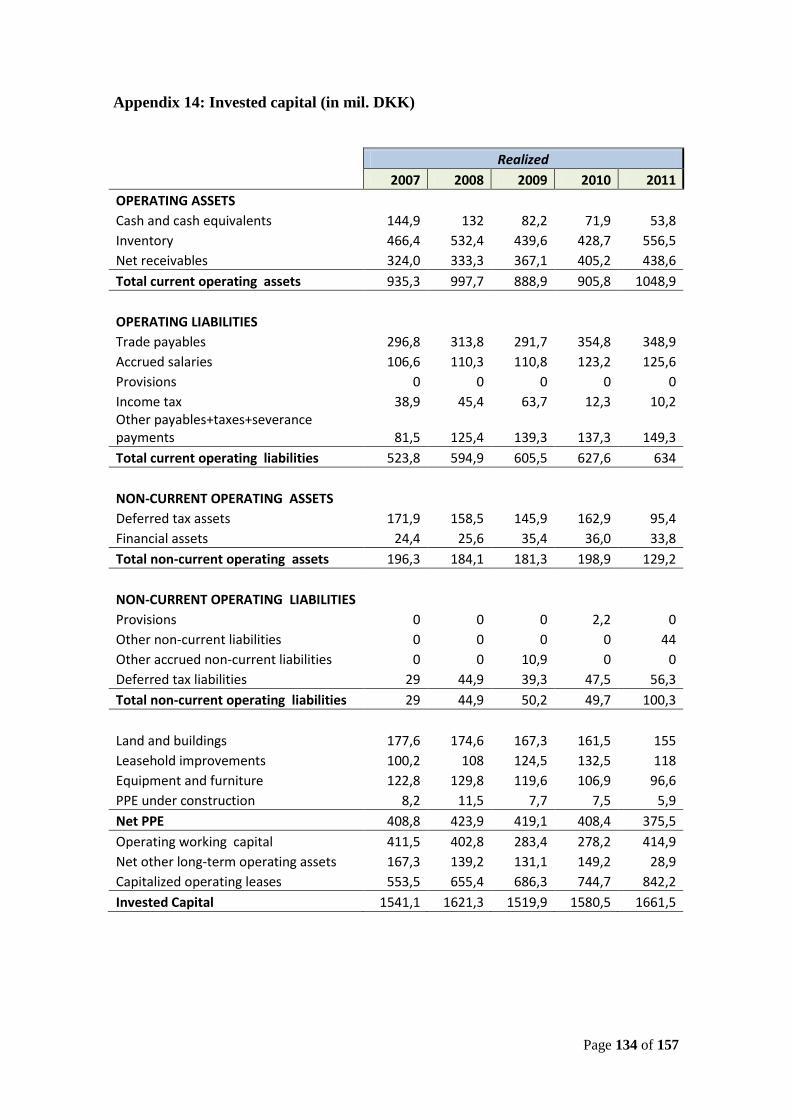
Page 134 of 157
Appendix 14: Invested capital (in mil. DKK)
Realized
2007 2008 2009 2010 2011
OPERATING ASSETS
Cash and cash equivalents 144,9 132 82,2 71,9 53,8
Inventory 466,4 532,4 439,6 428,7 556,5
Net receivables 324,0 333,3 367,1 405,2 438,6
Total current operating assets 935,3 997,7 888,9 905,8 1048,9
OPERATING LIABILITIES
Trade payables 296,8 313,8 291,7 354,8 348,9
Accrued salaries 106,6 110,3 110,8 123,2 125,6
Provisions 0 0 0 0 0
Income tax 38,9 45,4 63,7 12,3 10,2 Other payables+taxes+severance payments 81,5 125,4 139,3 137,3 149,3
Total current operating liabilities 523,8 594,9 605,5 627,6 634
NON-CURRENT OPERATING ASSETS
Deferred tax assets 171,9 158,5 145,9 162,9 95,4
Financial assets 24,4 25,6 35,4 36,0 33,8
Total non-current operating assets 196,3 184,1 181,3 198,9 129,2
NON-CURRENT OPERATING LIABILITIES
Provisions 0 0 0 2,2 0
Other non-current liabilities 0 0 0 0 44
Other accrued non-current liabilities 0 0 10,9 0 0
Deferred tax liabilities 29 44,9 39,3 47,5 56,3
Total non-current operating liabilities 29 44,9 50,2 49,7 100,3
Land and buildings 177,6 174,6 167,3 161,5 155
Leasehold improvements 100,2 108 124,5 132,5 118
Equipment and furniture 122,8 129,8 119,6 106,9 96,6
PPE under construction 8,2 11,5 7,7 7,5 5,9
Net PPE 408,8 423,9 419,1 408,4 375,5
Operating working capital 411,5 402,8 283,4 278,2 414,9
Net other long-term operating assets 167,3 139,2 131,1 149,2 28,9
Capitalized operating leases 553,5 655,4 686,3 744,7 842,2
Invested Capital 1541,1 1621,3 1519,9 1580,5 1661,5
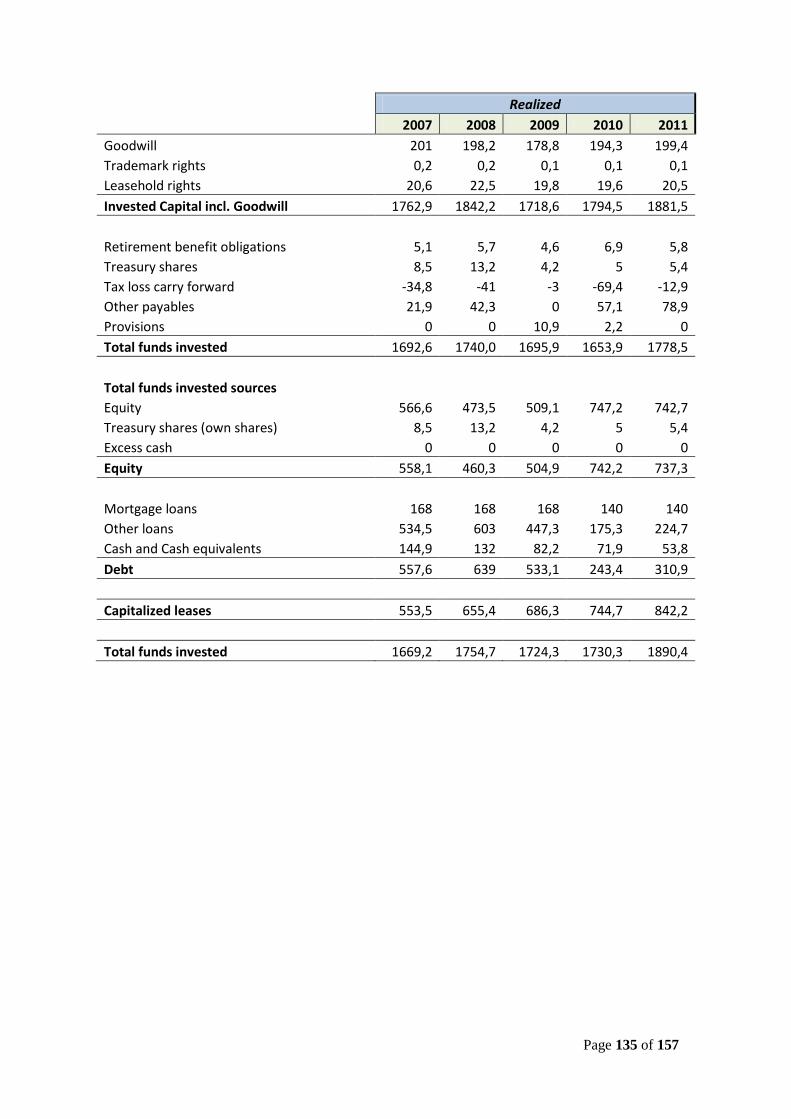
Page 135 of 157
Realized
2007 2008 2009 2010 2011
Goodwill 201 198,2 178,8 194,3 199,4
Trademark rights 0,2 0,2 0,1 0,1 0,1
Leasehold rights 20,6 22,5 19,8 19,6 20,5
Invested Capital incl. Goodwill 1762,9 1842,2 1718,6 1794,5 1881,5
Retirement benefit obligations 5,1 5,7 4,6 6,9 5,8
Treasury shares 8,5 13,2 4,2 5 5,4
Tax loss carry forward -34,8 -41 -3 -69,4 -12,9
Other payables 21,9 42,3 0 57,1 78,9
Provisions 0 0 10,9 2,2 0
Total funds invested 1692,6 1740,0 1695,9 1653,9 1778,5
Total funds invested sources
Equity 566,6 473,5 509,1 747,2 742,7
Treasury shares (own shares) 8,5 13,2 4,2 5 5,4
Excess cash 0 0 0 0 0
Equity 558,1 460,3 504,9 742,2 737,3
Mortgage loans 168 168 168 140 140
Other loans 534,5 603 447,3 175,3 224,7
Cash and Cash equivalents 144,9 132 82,2 71,9 53,8
Debt 557,6 639 533,1 243,4 310,9
Capitalized leases 553,5 655,4 686,3 744,7 842,2
Total funds invested 1669,2 1754,7 1724,3 1730,3 1890,4
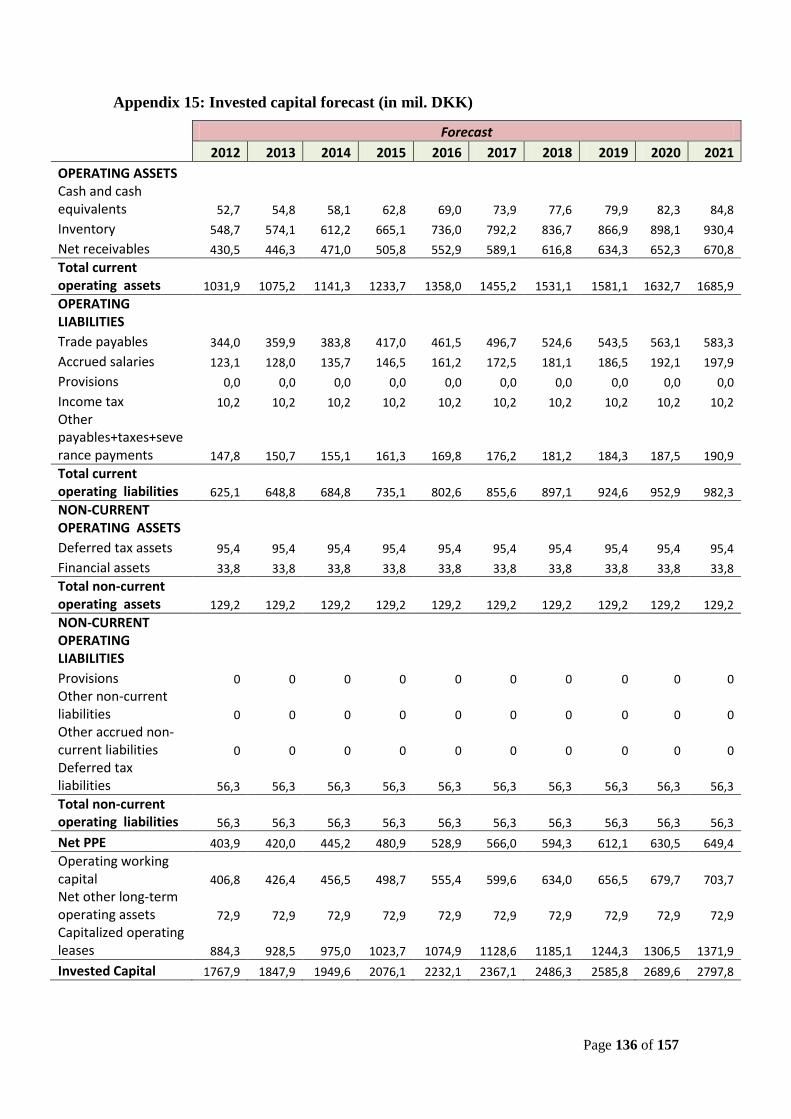
Page 136 of 157
Appendix 15: Invested capital forecast (in mil. DKK)
Forecast
2012 2013 2014 2015 2016 2017 2018 2019 2020 2021
OPERATING ASSETS
Cash and cash equivalents 52,7 54,8 58,1 62,8 69,0 73,9 77,6 79,9 82,3 84,8
Inventory 548,7 574,1 612,2 665,1 736,0 792,2 836,7 866,9 898,1 930,4
Net receivables 430,5 446,3 471,0 505,8 552,9 589,1 616,8 634,3 652,3 670,8
Total current operating assets 1031,9 1075,2 1141,3 1233,7 1358,0 1455,2 1531,1 1581,1 1632,7 1685,9
OPERATING LIABILITIES
Trade payables 344,0 359,9 383,8 417,0 461,5 496,7 524,6 543,5 563,1 583,3
Accrued salaries 123,1 128,0 135,7 146,5 161,2 172,5 181,1 186,5 192,1 197,9
Provisions 0,0 0,0 0,0 0,0 0,0 0,0 0,0 0,0 0,0 0,0
Income tax 10,2 10,2 10,2 10,2 10,2 10,2 10,2 10,2 10,2 10,2
Other payables+taxes+severance payments 147,8 150,7 155,1 161,3 169,8 176,2 181,2 184,3 187,5 190,9
Total current operating liabilities 625,1 648,8 684,8 735,1 802,6 855,6 897,1 924,6 952,9 982,3
NON-CURRENT OPERATING ASSETS
Deferred tax assets 95,4 95,4 95,4 95,4 95,4 95,4 95,4 95,4 95,4 95,4
Financial assets 33,8 33,8 33,8 33,8 33,8 33,8 33,8 33,8 33,8 33,8
Total non-current operating assets 129,2 129,2 129,2 129,2 129,2 129,2 129,2 129,2 129,2 129,2
NON-CURRENT OPERATING LIABILITIES
Provisions 0 0 0 0 0 0 0 0 0 0
Other non-current liabilities 0 0 0 0 0 0 0 0 0 0
Other accrued non-current liabilities 0 0 0 0 0 0 0 0 0 0
Deferred tax liabilities 56,3 56,3 56,3 56,3 56,3 56,3 56,3 56,3 56,3 56,3
Total non-current operating liabilities 56,3 56,3 56,3 56,3 56,3 56,3 56,3 56,3 56,3 56,3
Net PPE 403,9 420,0 445,2 480,9 528,9 566,0 594,3 612,1 630,5 649,4
Operating working capital 406,8 426,4 456,5 498,7 555,4 599,6 634,0 656,5 679,7 703,7
Net other long-term operating assets 72,9 72,9 72,9 72,9 72,9 72,9 72,9 72,9 72,9 72,9
Capitalized operating leases 884,3 928,5 975,0 1023,7 1074,9 1128,6 1185,1 1244,3 1306,5 1371,9
Invested Capital 1767,9 1847,9 1949,6 2076,1 2232,1 2367,1 2486,3 2585,8 2689,6 2797,8
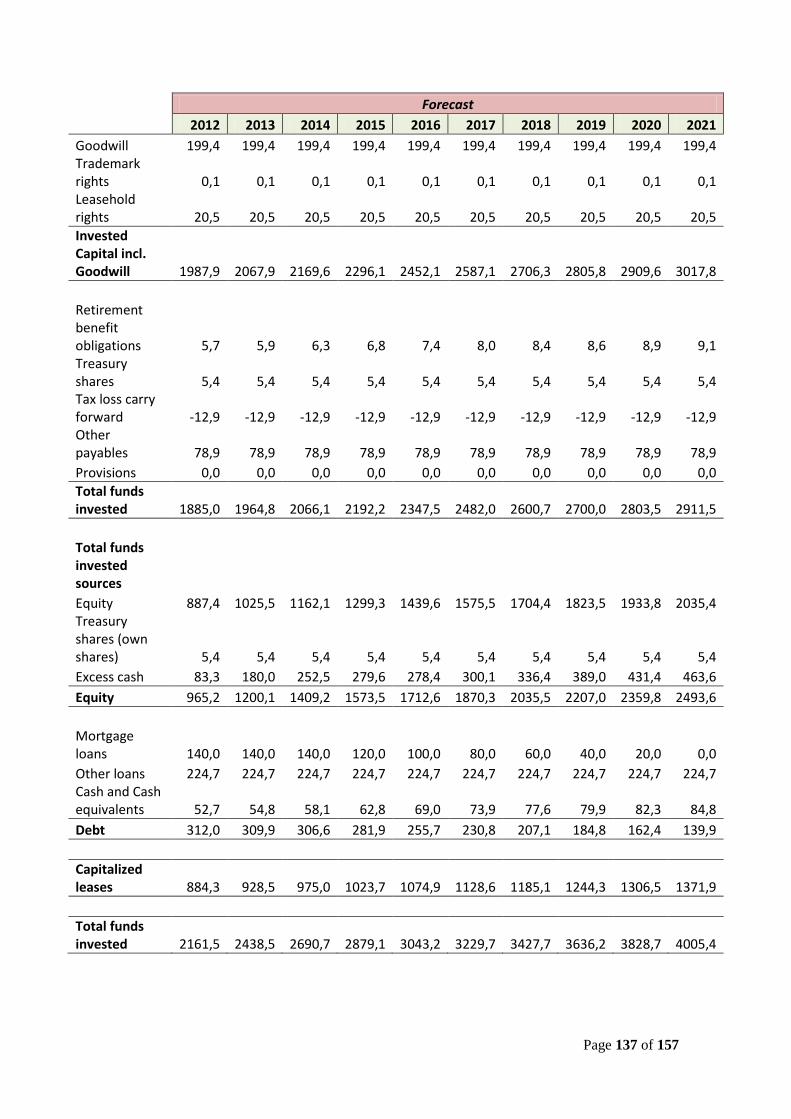
Page 137 of 157
Forecast
2012 2013 2014 2015 2016 2017 2018 2019 2020 2021
Goodwill 199,4 199,4 199,4 199,4 199,4 199,4 199,4 199,4 199,4 199,4 Trademark rights 0,1 0,1 0,1 0,1 0,1 0,1 0,1 0,1 0,1 0,1 Leasehold rights 20,5 20,5 20,5 20,5 20,5 20,5 20,5 20,5 20,5 20,5
Invested Capital incl. Goodwill 1987,9 2067,9 2169,6 2296,1 2452,1 2587,1 2706,3 2805,8 2909,6 3017,8
Retirement benefit obligations 5,7 5,9 6,3 6,8 7,4 8,0 8,4 8,6 8,9 9,1 Treasury shares 5,4 5,4 5,4 5,4 5,4 5,4 5,4 5,4 5,4 5,4 Tax loss carry forward -12,9 -12,9 -12,9 -12,9 -12,9 -12,9 -12,9 -12,9 -12,9 -12,9 Other payables 78,9 78,9 78,9 78,9 78,9 78,9 78,9 78,9 78,9 78,9
Provisions 0,0 0,0 0,0 0,0 0,0 0,0 0,0 0,0 0,0 0,0
Total funds invested 1885,0 1964,8 2066,1 2192,2 2347,5 2482,0 2600,7 2700,0 2803,5 2911,5
Total funds invested sources
Equity 887,4 1025,5 1162,1 1299,3 1439,6 1575,5 1704,4 1823,5 1933,8 2035,4 Treasury shares (own shares) 5,4 5,4 5,4 5,4 5,4 5,4 5,4 5,4 5,4 5,4
Excess cash 83,3 180,0 252,5 279,6 278,4 300,1 336,4 389,0 431,4 463,6
Equity 965,2 1200,1 1409,2 1573,5 1712,6 1870,3 2035,5 2207,0 2359,8 2493,6
Mortgage loans 140,0 140,0 140,0 120,0 100,0 80,0 60,0 40,0 20,0 0,0
Other loans 224,7 224,7 224,7 224,7 224,7 224,7 224,7 224,7 224,7 224,7 Cash and Cash equivalents 52,7 54,8 58,1 62,8 69,0 73,9 77,6 79,9 82,3 84,8
Debt 312,0 309,9 306,6 281,9 255,7 230,8 207,1 184,8 162,4 139,9
Capitalized leases 884,3 928,5 975,0 1023,7 1074,9 1128,6 1185,1 1244,3 1306,5 1371,9
Total funds invested 2161,5 2438,5 2690,7 2879,1 3043,2 3229,7 3427,7 3636,2 3828,7 4005,4
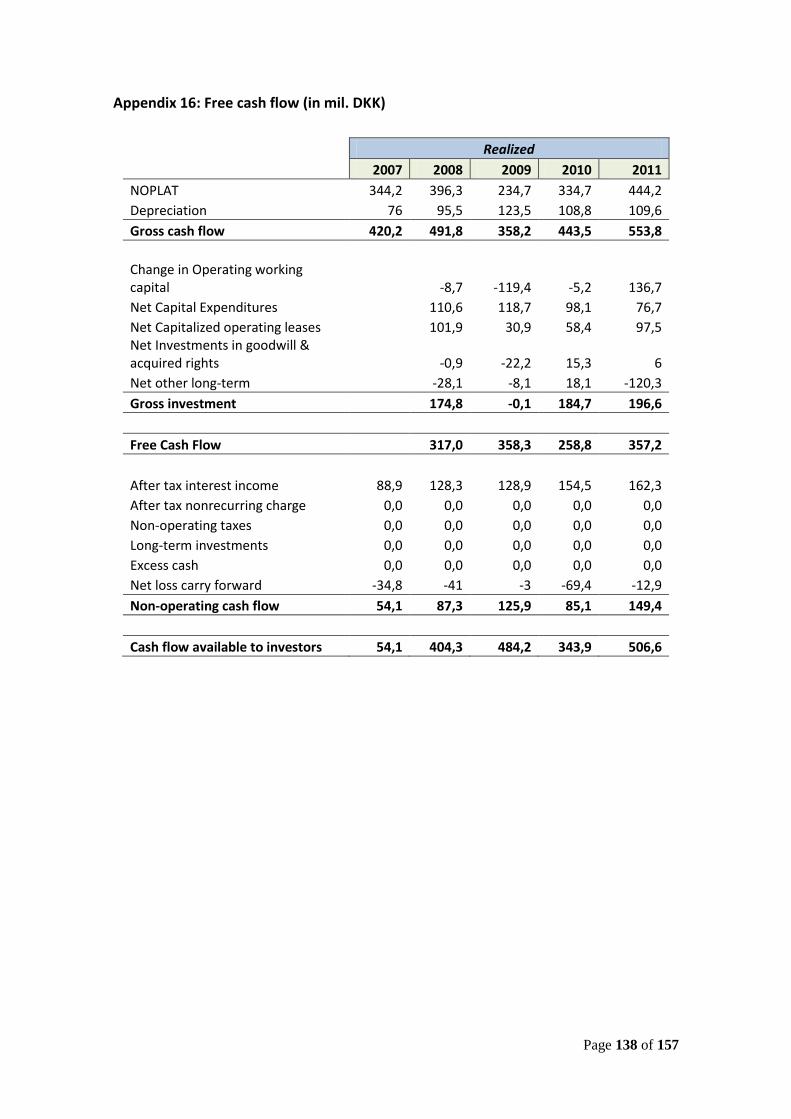
Page 138 of 157
Appendix 16: Free cash flow (in mil. DKK)
Realized
2007 2008 2009 2010 2011
NOPLAT 344,2 396,3 234,7 334,7 444,2
Depreciation 76 95,5 123,5 108,8 109,6
Gross cash flow 420,2 491,8 358,2 443,5 553,8
Change in Operating working capital
-8,7 -119,4 -5,2 136,7
Net Capital Expenditures
110,6 118,7 98,1 76,7
Net Capitalized operating leases
101,9 30,9 58,4 97,5 Net Investments in goodwill & acquired rights
-0,9 -22,2 15,3 6
Net other long-term
-28,1 -8,1 18,1 -120,3
Gross investment 174,8 -0,1 184,7 196,6
Free Cash Flow 317,0 358,3 258,8 357,2
After tax interest income 88,9 128,3 128,9 154,5 162,3
After tax nonrecurring charge 0,0 0,0 0,0 0,0 0,0
Non-operating taxes 0,0 0,0 0,0 0,0 0,0
Long-term investments 0,0 0,0 0,0 0,0 0,0
Excess cash 0,0 0,0 0,0 0,0 0,0
Net loss carry forward -34,8 -41 -3 -69,4 -12,9
Non-operating cash flow 54,1 87,3 125,9 85,1 149,4
Cash flow available to investors 54,1 404,3 484,2 343,9 506,6
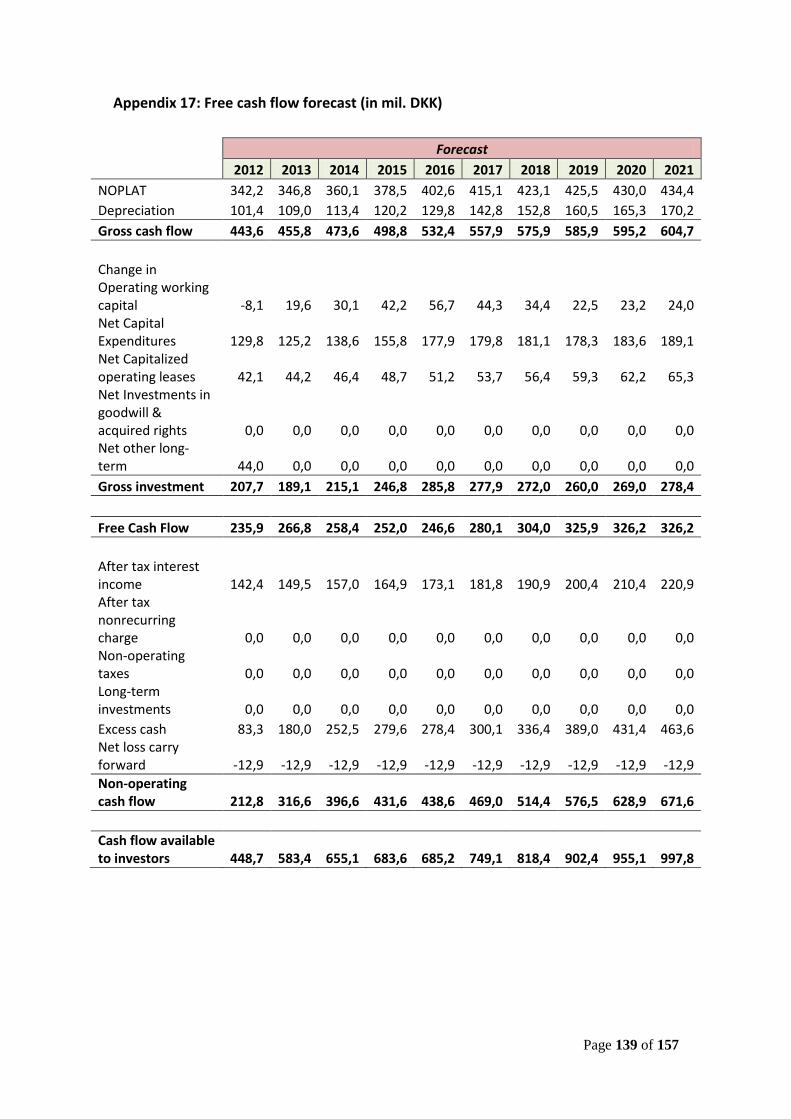
Page 139 of 157
Appendix 17: Free cash flow forecast (in mil. DKK)
Forecast
2012 2013 2014 2015 2016 2017 2018 2019 2020 2021
NOPLAT 342,2 346,8 360,1 378,5 402,6 415,1 423,1 425,5 430,0 434,4
Depreciation 101,4 109,0 113,4 120,2 129,8 142,8 152,8 160,5 165,3 170,2
Gross cash flow 443,6 455,8 473,6 498,8 532,4 557,9 575,9 585,9 595,2 604,7
Change in Operating working capital -8,1 19,6 30,1 42,2 56,7 44,3 34,4 22,5 23,2 24,0 Net Capital Expenditures 129,8 125,2 138,6 155,8 177,9 179,8 181,1 178,3 183,6 189,1 Net Capitalized operating leases 42,1 44,2 46,4 48,7 51,2 53,7 56,4 59,3 62,2 65,3 Net Investments in goodwill & acquired rights 0,0 0,0 0,0 0,0 0,0 0,0 0,0 0,0 0,0 0,0 Net other long-term 44,0 0,0 0,0 0,0 0,0 0,0 0,0 0,0 0,0 0,0
Gross investment 207,7 189,1 215,1 246,8 285,8 277,9 272,0 260,0 269,0 278,4
Free Cash Flow 235,9 266,8 258,4 252,0 246,6 280,1 304,0 325,9 326,2 326,2
After tax interest income 142,4 149,5 157,0 164,9 173,1 181,8 190,9 200,4 210,4 220,9 After tax nonrecurring charge 0,0 0,0 0,0 0,0 0,0 0,0 0,0 0,0 0,0 0,0 Non-operating taxes 0,0 0,0 0,0 0,0 0,0 0,0 0,0 0,0 0,0 0,0 Long-term investments 0,0 0,0 0,0 0,0 0,0 0,0 0,0 0,0 0,0 0,0
Excess cash 83,3 180,0 252,5 279,6 278,4 300,1 336,4 389,0 431,4 463,6 Net loss carry forward -12,9 -12,9 -12,9 -12,9 -12,9 -12,9 -12,9 -12,9 -12,9 -12,9
Non-operating cash flow 212,8 316,6 396,6 431,6 438,6 469,0 514,4 576,5 628,9 671,6
Cash flow available to investors 448,7 583,4 655,1 683,6 685,2 749,1 818,4 902,4 955,1 997,8
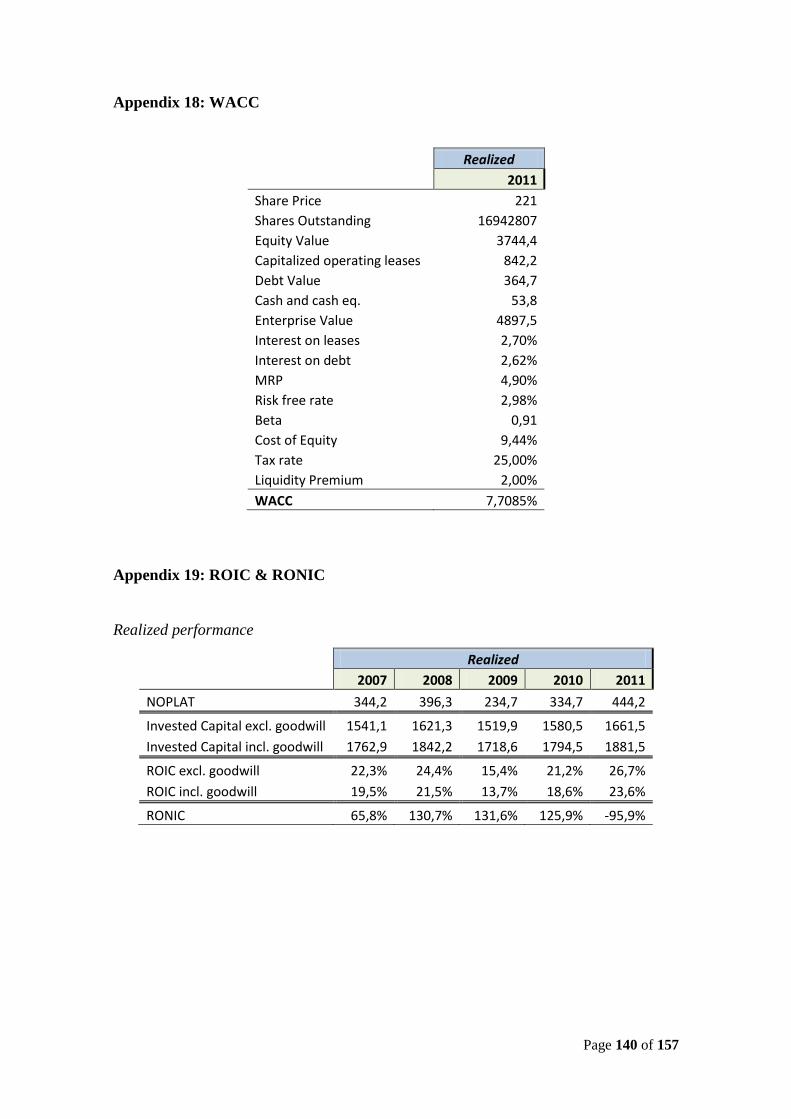
Page 140 of 157
Appendix 18: WACC
Realized
2011
Share Price 221
Shares Outstanding 16942807
Equity Value 3744,4
Capitalized operating leases 842,2
Debt Value 364,7
Cash and cash eq. 53,8
Enterprise Value 4897,5
Interest on leases 2,70%
Interest on debt 2,62%
MRP 4,90%
Risk free rate 2,98%
Beta 0,91
Cost of Equity 9,44%
Tax rate 25,00%
Liquidity Premium 2,00%
WACC 7,7085%
Appendix 19: ROIC & RONIC
Realized performance
Realized
2007 2008 2009 2010 2011
NOPLAT 344,2 396,3 234,7 334,7 444,2
Invested Capital excl. goodwill 1541,1 1621,3 1519,9 1580,5 1661,5
Invested Capital incl. goodwill 1762,9 1842,2 1718,6 1794,5 1881,5
ROIC excl. goodwill 22,3% 24,4% 15,4% 21,2% 26,7%
ROIC incl. goodwill 19,5% 21,5% 13,7% 18,6% 23,6%
RONIC 65,8% 130,7% 131,6% 125,9% -95,9%
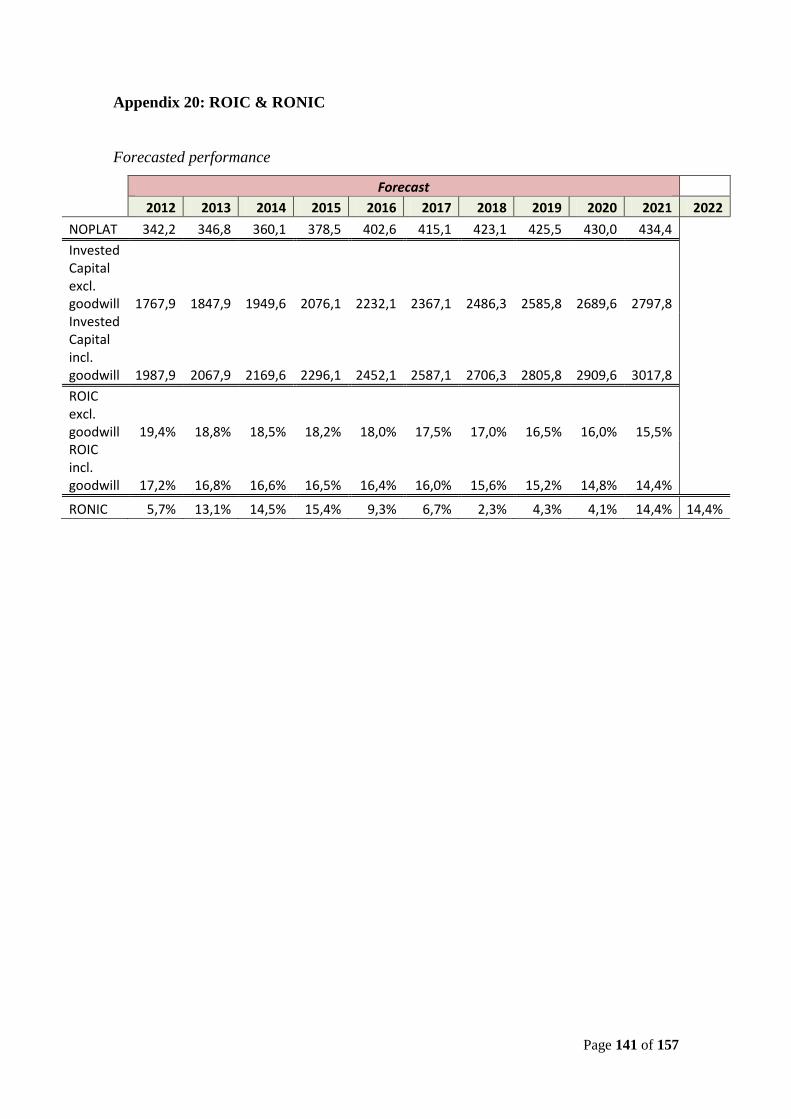
Page 141 of 157
Appendix 20: ROIC & RONIC
Forecasted performance
Forecast
2012 2013 2014 2015 2016 2017 2018 2019 2020 2021 2022
NOPLAT 342,2 346,8 360,1 378,5 402,6 415,1 423,1 425,5 430,0 434,4
Invested Capital excl. goodwill 1767,9 1847,9 1949,6 2076,1 2232,1 2367,1 2486,3 2585,8 2689,6 2797,8 Invested Capital incl. goodwill 1987,9 2067,9 2169,6 2296,1 2452,1 2587,1 2706,3 2805,8 2909,6 3017,8
ROIC excl. goodwill 19,4% 18,8% 18,5% 18,2% 18,0% 17,5% 17,0% 16,5% 16,0% 15,5% ROIC incl. goodwill 17,2% 16,8% 16,6% 16,5% 16,4% 16,0% 15,6% 15,2% 14,8% 14,4%
RONIC 5,7% 13,1% 14,5% 15,4% 9,3% 6,7% 2,3% 4,3% 4,1% 14,4% 14,4%
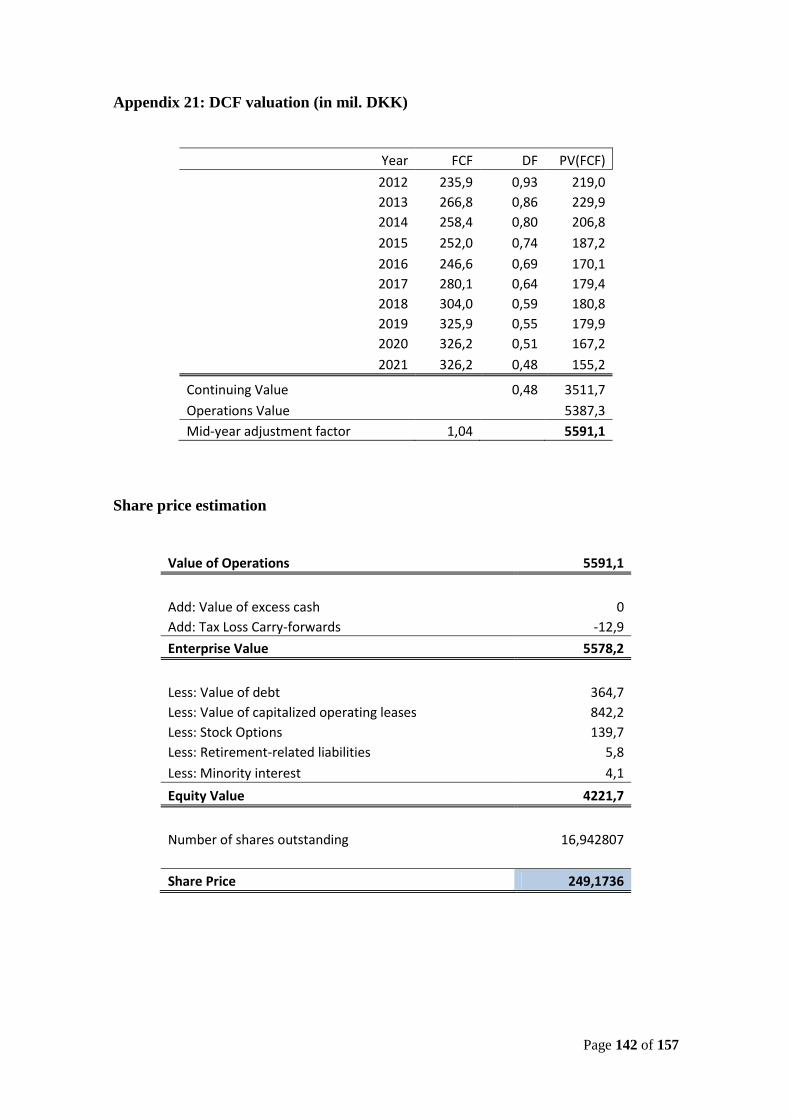
Page 142 of 157
Appendix 21: DCF valuation (in mil. DKK)
Year FCF DF PV(FCF)
2012 235,9 0,93 219,0
2013 266,8 0,86 229,9
2014 258,4 0,80 206,8
2015 252,0 0,74 187,2
2016 246,6 0,69 170,1
2017 280,1 0,64 179,4
2018 304,0 0,59 180,8
2019 325,9 0,55 179,9
2020 326,2 0,51 167,2
2021 326,2 0,48 155,2
Continuing Value
0,48 3511,7
Operations Value
5387,3
Mid-year adjustment factor 1,04 5591,1
Share price estimation
Value of Operations 5591,1
Add: Value of excess cash 0
Add: Tax Loss Carry-forwards -12,9
Enterprise Value 5578,2
Less: Value of debt 364,7
Less: Value of capitalized operating leases 842,2
Less: Stock Options 139,7
Less: Retirement-related liabilities 5,8
Less: Minority interest 4,1
Equity Value 4221,7
Number of shares outstanding 16,942807
Share Price 249,1736
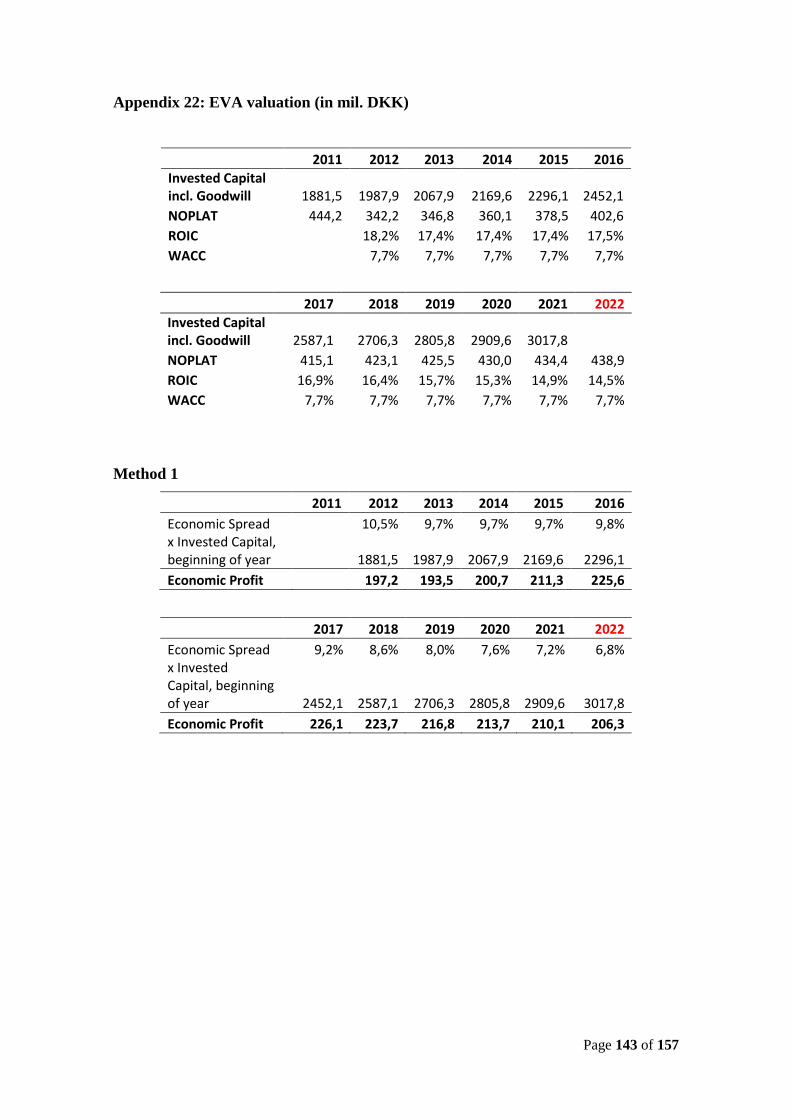
Page 143 of 157
Appendix 22: EVA valuation (in mil. DKK)
2011 2012 2013 2014 2015 2016
Invested Capital incl. Goodwill 1881,5 1987,9 2067,9 2169,6 2296,1 2452,1
NOPLAT 444,2 342,2 346,8 360,1 378,5 402,6
ROIC
18,2% 17,4% 17,4% 17,4% 17,5%
WACC
7,7% 7,7% 7,7% 7,7% 7,7%
2017 2018 2019 2020 2021 2022
Invested Capital incl. Goodwill 2587,1 2706,3 2805,8 2909,6 3017,8
NOPLAT 415,1 423,1 425,5 430,0 434,4 438,9
ROIC 16,9% 16,4% 15,7% 15,3% 14,9% 14,5%
WACC 7,7% 7,7% 7,7% 7,7% 7,7% 7,7%
Method 1
2011 2012 2013 2014 2015 2016
Economic Spread
10,5% 9,7% 9,7% 9,7% 9,8% x Invested Capital, beginning of year
1881,5 1987,9 2067,9 2169,6 2296,1
Economic Profit 197,2 193,5 200,7 211,3 225,6
2017 2018 2019 2020 2021 2022
Economic Spread 9,2% 8,6% 8,0% 7,6% 7,2% 6,8% x Invested Capital, beginning of year 2452,1 2587,1 2706,3 2805,8 2909,6 3017,8
Economic Profit 226,1 223,7 216,8 213,7 210,1 206,3
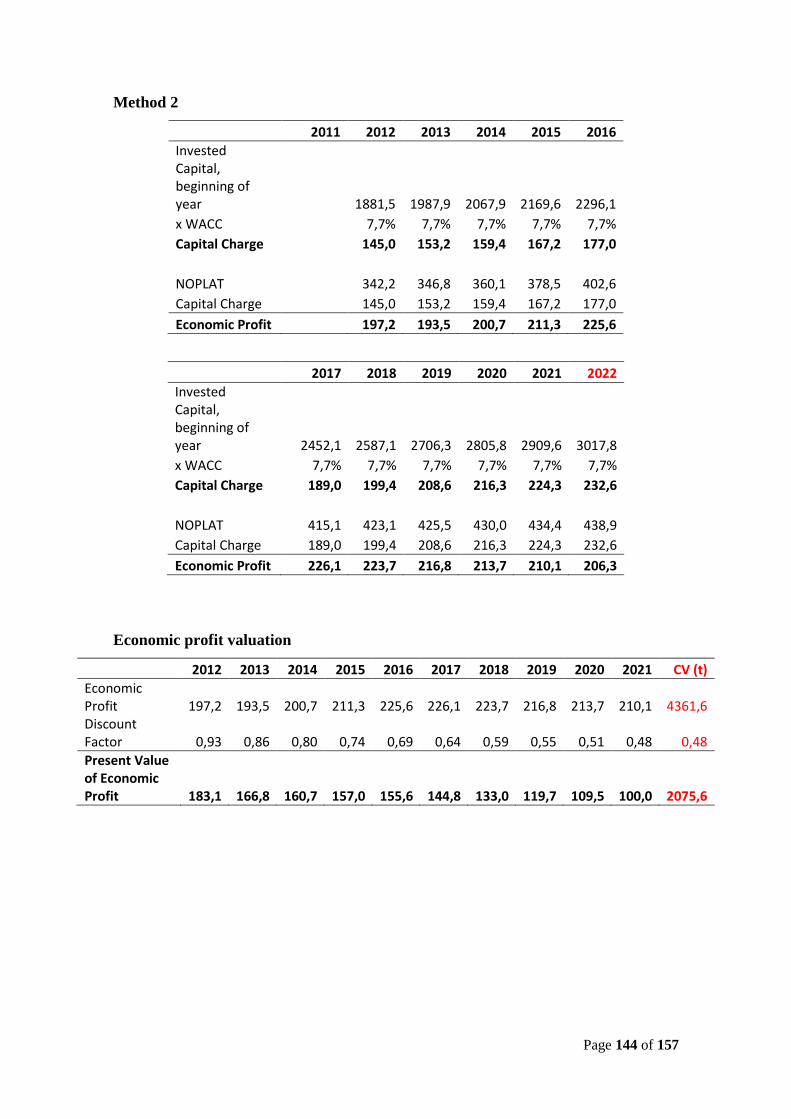
Page 144 of 157
Method 2
2011 2012 2013 2014 2015 2016
Invested Capital, beginning of year
1881,5 1987,9 2067,9 2169,6 2296,1
x WACC
7,7% 7,7% 7,7% 7,7% 7,7%
Capital Charge
145,0 153,2 159,4 167,2 177,0
NOPLAT
342,2 346,8 360,1 378,5 402,6
Capital Charge
145,0 153,2 159,4 167,2 177,0
Economic Profit 197,2 193,5 200,7 211,3 225,6
2017 2018 2019 2020 2021 2022
Invested Capital, beginning of year 2452,1 2587,1 2706,3 2805,8 2909,6 3017,8
x WACC 7,7% 7,7% 7,7% 7,7% 7,7% 7,7%
Capital Charge 189,0 199,4 208,6 216,3 224,3 232,6
NOPLAT 415,1 423,1 425,5 430,0 434,4 438,9
Capital Charge 189,0 199,4 208,6 216,3 224,3 232,6
Economic Profit 226,1 223,7 216,8 213,7 210,1 206,3
Economic profit valuation
2012 2013 2014 2015 2016 2017 2018 2019 2020 2021 CV (t)
Economic Profit 197,2 193,5 200,7 211,3 225,6 226,1 223,7 216,8 213,7 210,1 4361,6 Discount Factor 0,93 0,86 0,80 0,74 0,69 0,64 0,59 0,55 0,51 0,48 0,48
Present Value of Economic Profit 183,1 166,8 160,7 157,0 155,6 144,8 133,0 119,7 109,5 100,0 2075,6
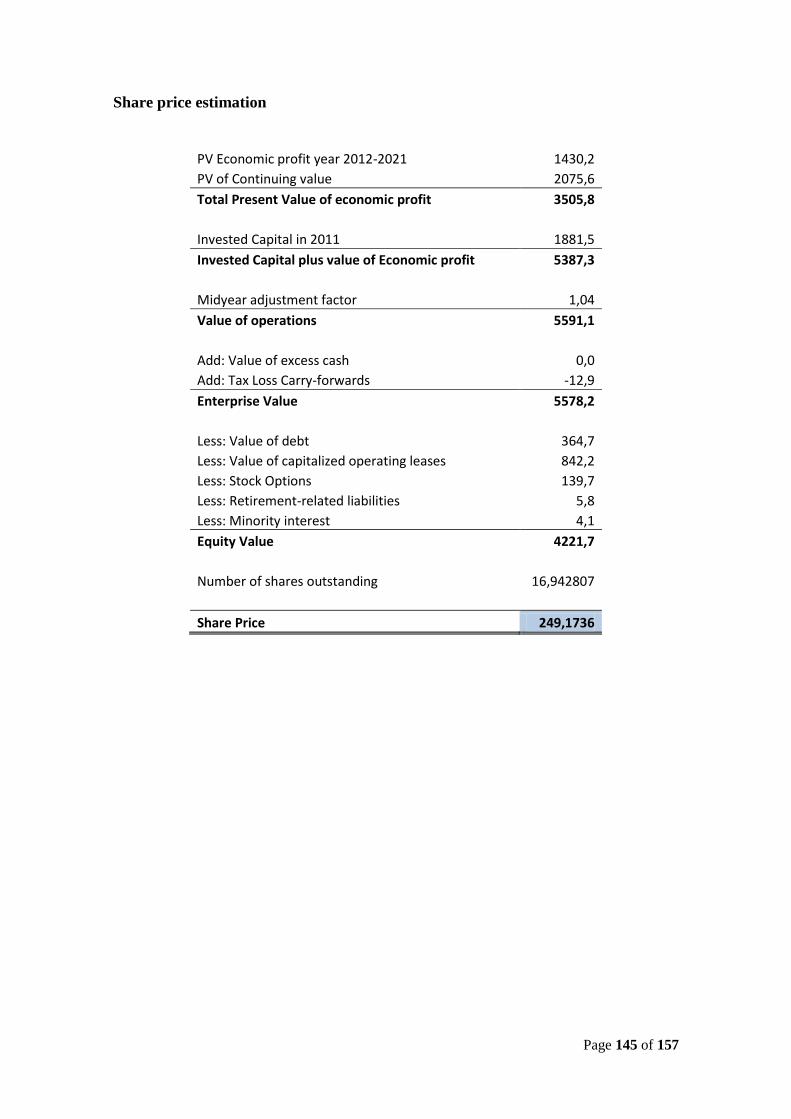
Page 145 of 157
Share price estimation
PV Economic profit year 2012-2021 1430,2
PV of Continuing value 2075,6
Total Present Value of economic profit 3505,8
Invested Capital in 2011 1881,5
Invested Capital plus value of Economic profit 5387,3
Midyear adjustment factor 1,04
Value of operations 5591,1
Add: Value of excess cash 0,0
Add: Tax Loss Carry-forwards -12,9
Enterprise Value 5578,2
Less: Value of debt 364,7
Less: Value of capitalized operating leases 842,2
Less: Stock Options 139,7
Less: Retirement-related liabilities 5,8
Less: Minority interest 4,1
Equity Value 4221,7
Number of shares outstanding 16,942807
Share Price 249,1736
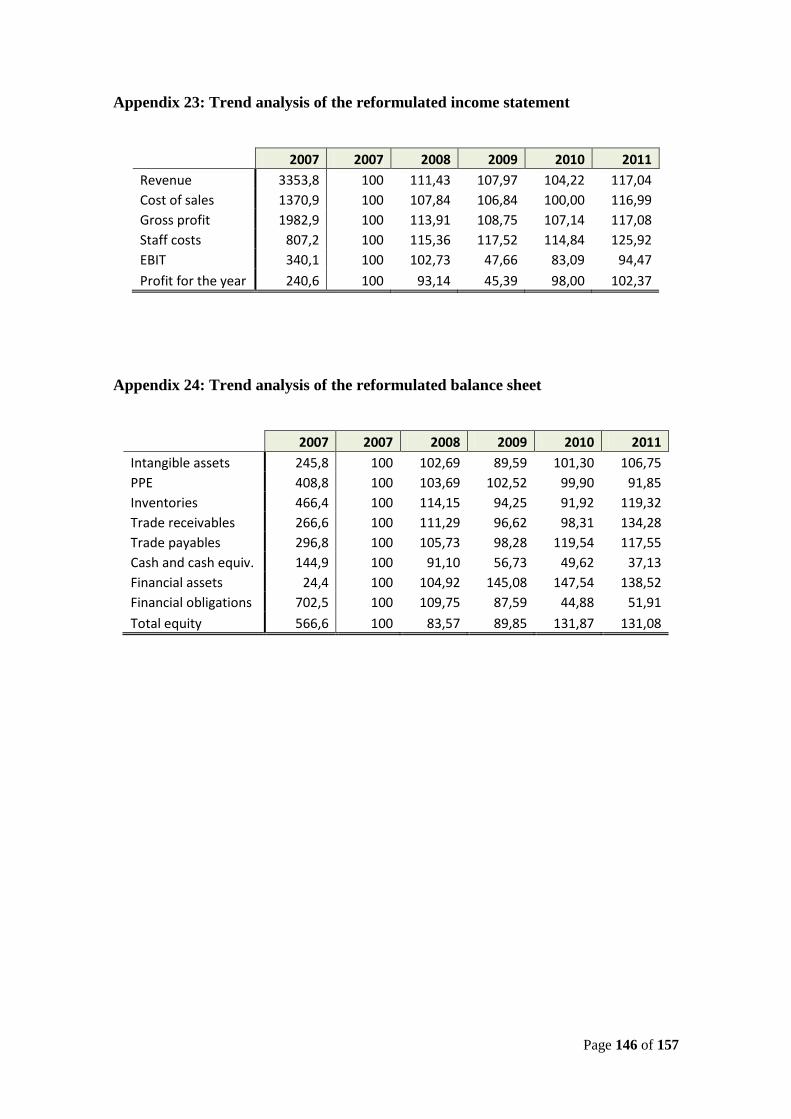
Page 146 of 157
Appendix 23: Trend analysis of the reformulated income statement
2007 2007 2008 2009 2010 2011
Revenue 3353,8 100 111,43 107,97 104,22 117,04
Cost of sales 1370,9 100 107,84 106,84 100,00 116,99
Gross profit 1982,9 100 113,91 108,75 107,14 117,08
Staff costs 807,2 100 115,36 117,52 114,84 125,92
EBIT 340,1 100 102,73 47,66 83,09 94,47
Profit for the year 240,6 100 93,14 45,39 98,00 102,37
Appendix 24: Trend analysis of the reformulated balance sheet
2007 2007 2008 2009 2010 2011
Intangible assets 245,8 100 102,69 89,59 101,30 106,75
PPE 408,8 100 103,69 102,52 99,90 91,85
Inventories 466,4 100 114,15 94,25 91,92 119,32
Trade receivables 266,6 100 111,29 96,62 98,31 134,28
Trade payables 296,8 100 105,73 98,28 119,54 117,55
Cash and cash equiv. 144,9 100 91,10 56,73 49,62 37,13
Financial assets 24,4 100 104,92 145,08 147,54 138,52
Financial obligations 702,5 100 109,75 87,59 44,88 51,91
Total equity 566,6 100 83,57 89,85 131,87 131,08
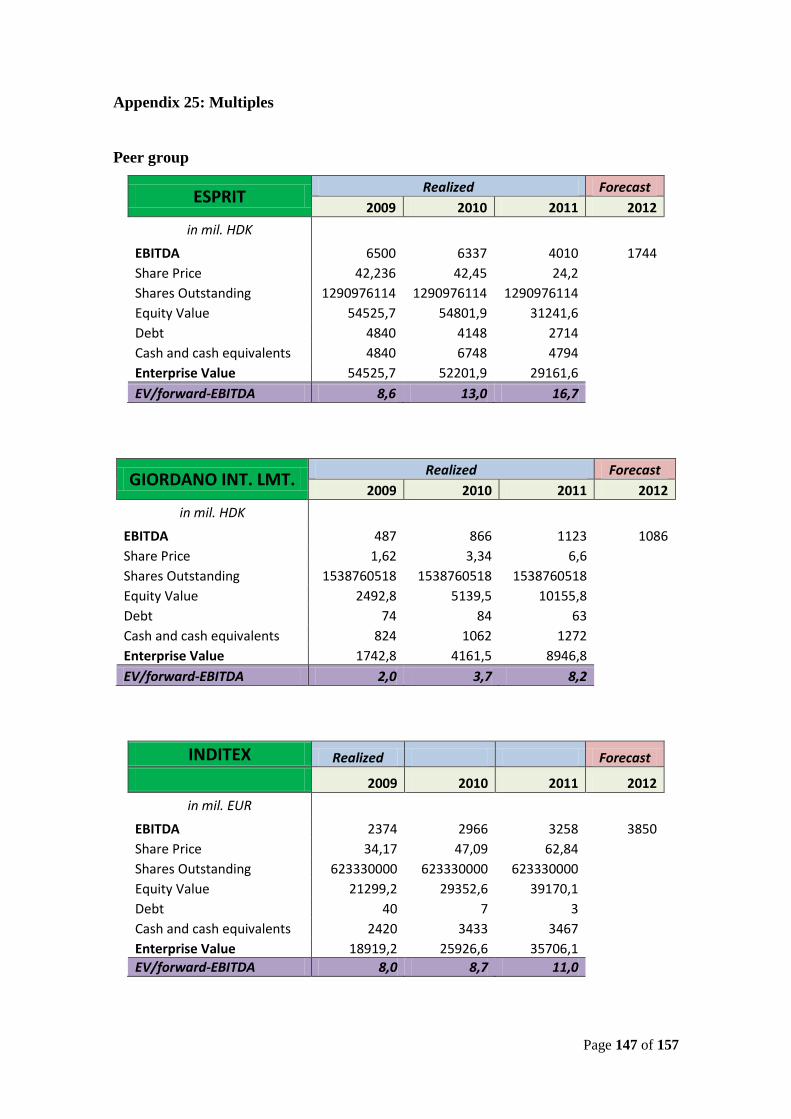
Page 147 of 157
Appendix 25: Multiples
Peer group
ESPRIT Realized Forecast
2009 2010 2011 2012
in mil. HDK EBITDA 6500 6337 4010 1744
Share Price 42,236 42,45 24,2 Shares Outstanding 1290976114 1290976114 1290976114 Equity Value 54525,7 54801,9 31241,6 Debt 4840 4148 2714 Cash and cash equivalents 4840 6748 4794 Enterprise Value 54525,7 52201,9 29161,6 EV/forward-EBITDA 8,6 13,0 16,7
GIORDANO INT. LMT. Realized Forecast
2009 2010 2011 2012
in mil. HDK EBITDA 487 866 1123 1086
Share Price 1,62 3,34 6,6 Shares Outstanding 1538760518 1538760518 1538760518 Equity Value 2492,8 5139,5 10155,8 Debt 74 84 63 Cash and cash equivalents 824 1062 1272 Enterprise Value 1742,8 4161,5 8946,8 EV/forward-EBITDA 2,0 3,7 8,2
INDITEX Realized Forecast
2009 2010 2011 2012
in mil. EUR EBITDA 2374 2966 3258 3850
Share Price 34,17 47,09 62,84 Shares Outstanding 623330000 623330000 623330000 Equity Value 21299,2 29352,6 39170,1 Debt 40 7 3 Cash and cash equivalents 2420 3433 3467 Enterprise Value 18919,2 25926,6 35706,1 EV/forward-EBITDA 8,0 8,7 11,0
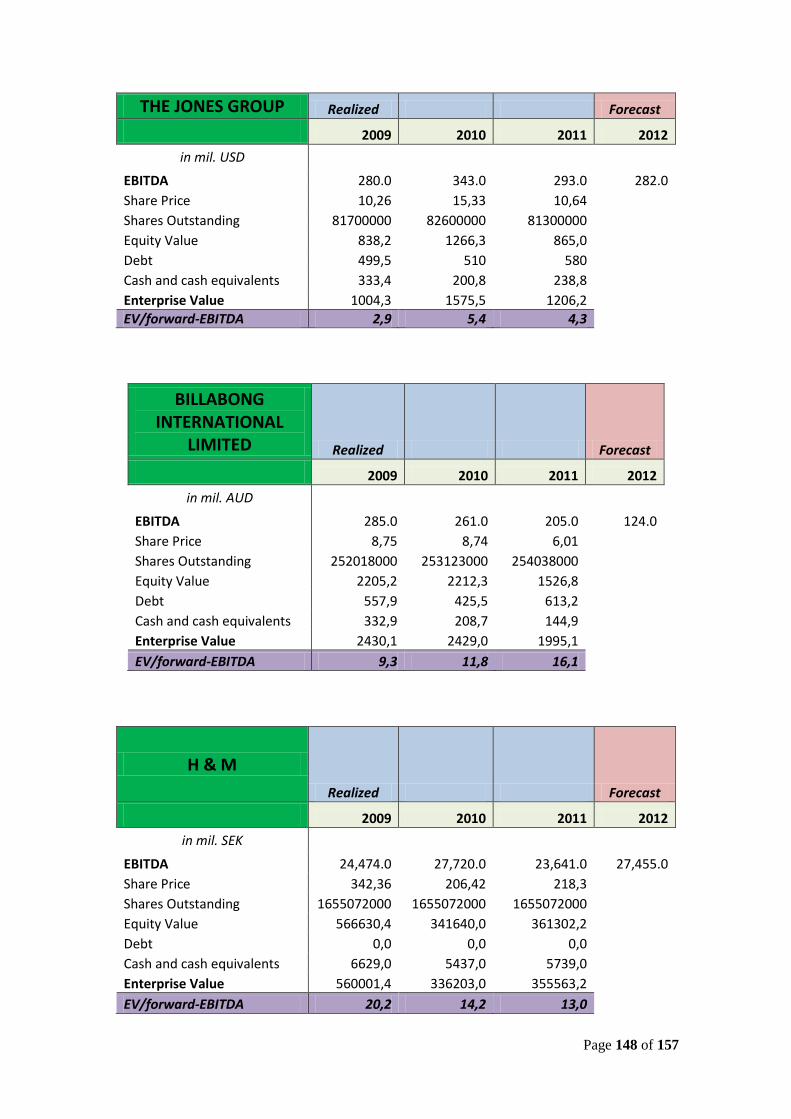
Page 148 of 157
THE JONES GROUP Realized Forecast
2009 2010 2011 2012
in mil. USD EBITDA 280.0 343.0 293.0 282.0
Share Price 10,26 15,33 10,64 Shares Outstanding 81700000 82600000 81300000 Equity Value 838,2 1266,3 865,0 Debt 499,5 510 580 Cash and cash equivalents 333,4 200,8 238,8 Enterprise Value 1004,3 1575,5 1206,2 EV/forward-EBITDA 2,9 5,4 4,3
BILLABONG INTERNATIONAL
LIMITED Realized Forecast
2009 2010 2011 2012
in mil. AUD EBITDA 285.0 261.0 205.0 124.0
Share Price 8,75 8,74 6,01 Shares Outstanding 252018000 253123000 254038000 Equity Value 2205,2 2212,3 1526,8 Debt 557,9 425,5 613,2 Cash and cash equivalents 332,9 208,7 144,9 Enterprise Value 2430,1 2429,0 1995,1 EV/forward-EBITDA 9,3 11,8 16,1
H & M
Realized Forecast
2009 2010 2011 2012
in mil. SEK EBITDA 24,474.0 27,720.0 23,641.0 27,455.0
Share Price 342,36 206,42 218,3 Shares Outstanding 1655072000 1655072000 1655072000 Equity Value 566630,4 341640,0 361302,2 Debt 0,0 0,0 0,0 Cash and cash equivalents 6629,0 5437,0 5739,0 Enterprise Value 560001,4 336203,0 355563,2 EV/forward-EBITDA 20,2 14,2 13,0
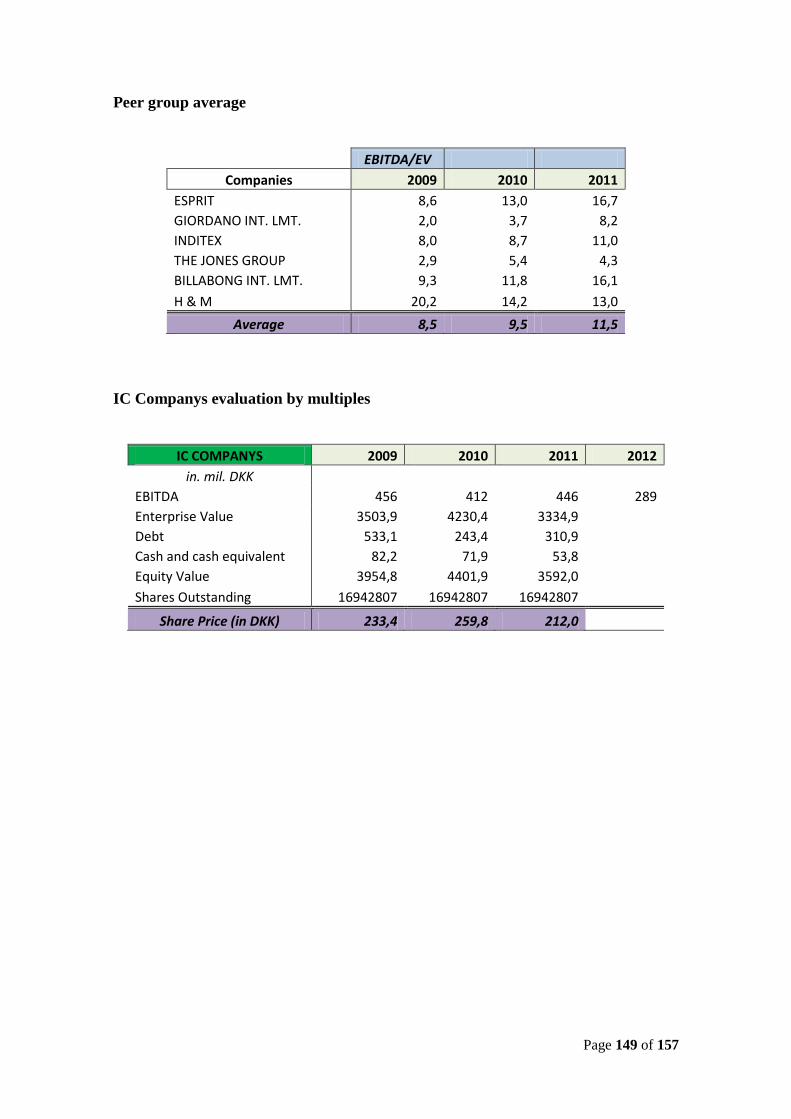
Page 149 of 157
Peer group average
EBITDA/EV
Companies 2009 2010 2011
ESPRIT 8,6 13,0 16,7
GIORDANO INT. LMT. 2,0 3,7 8,2
INDITEX 8,0 8,7 11,0
THE JONES GROUP 2,9 5,4 4,3
BILLABONG INT. LMT. 9,3 11,8 16,1
H & M 20,2 14,2 13,0
Average 8,5 9,5 11,5
IC Companys evaluation by multiples
IC COMPANYS 2009 2010 2011 2012
in. mil. DKK
EBITDA 456 412 446 289
Enterprise Value 3503,9 4230,4 3334,9
Debt 533,1 243,4 310,9
Cash and cash equivalent 82,2 71,9 53,8
Equity Value 3954,8 4401,9 3592,0
Shares Outstanding 16942807 16942807 16942807
Share Price (in DKK) 233,4 259,8 212,0
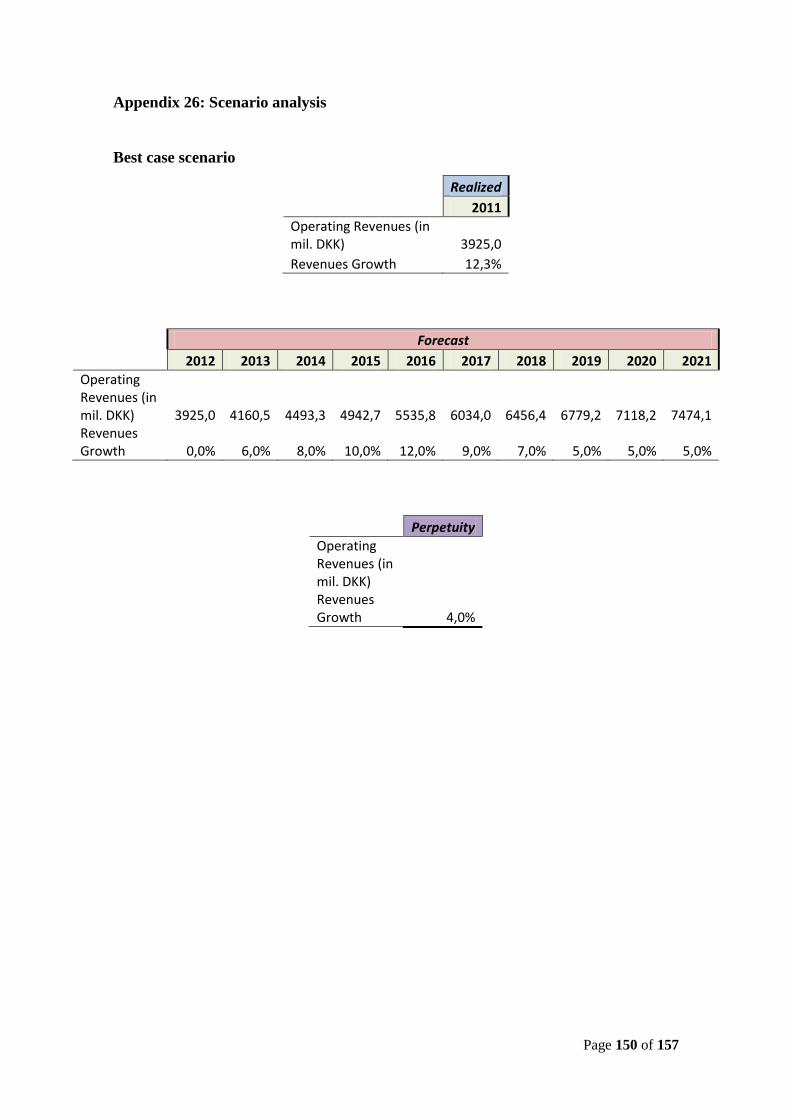
Page 150 of 157
Appendix 26: Scenario analysis
Best case scenario
Realized
2011
Operating Revenues (in mil. DKK) 3925,0
Revenues Growth 12,3%
Forecast
2012 2013 2014 2015 2016 2017 2018 2019 2020 2021
Operating Revenues (in mil. DKK) 3925,0 4160,5 4493,3 4942,7 5535,8 6034,0 6456,4 6779,2 7118,2 7474,1 Revenues Growth 0,0% 6,0% 8,0% 10,0% 12,0% 9,0% 7,0% 5,0% 5,0% 5,0%
Perpetuity
Operating Revenues (in mil. DKK)
Revenues Growth 4,0%
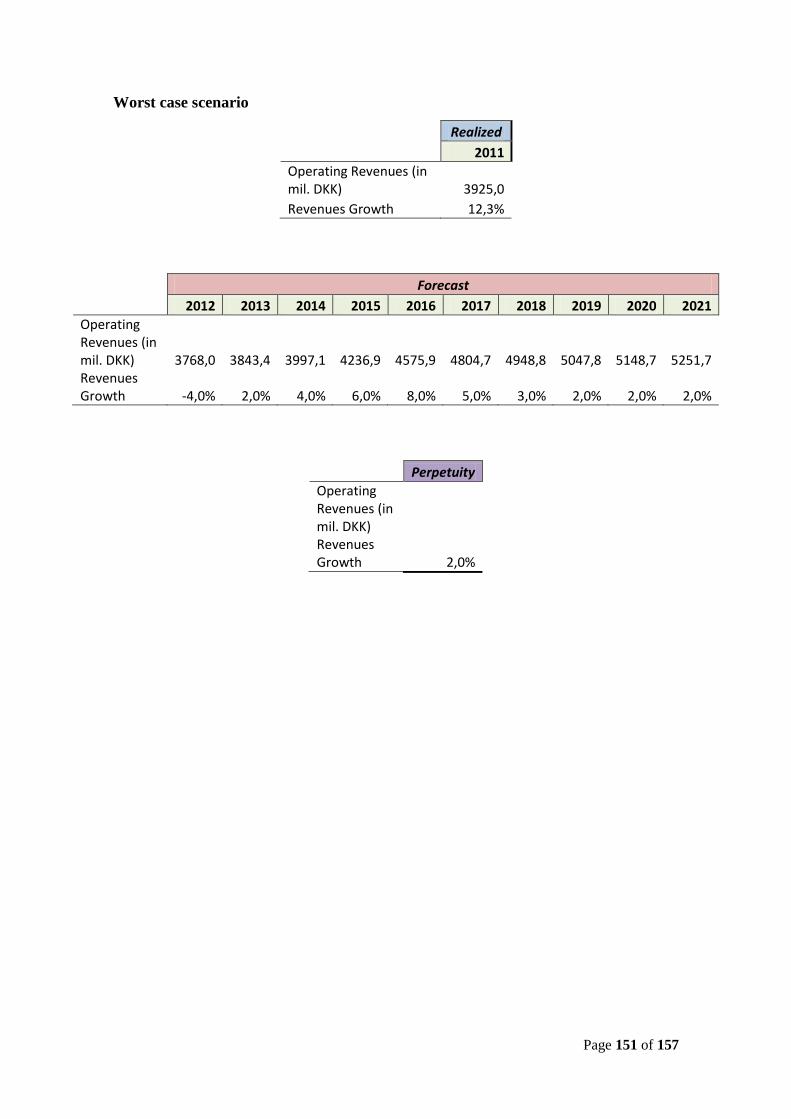
Page 151 of 157
Worst case scenario
Realized
2011
Operating Revenues (in mil. DKK) 3925,0
Revenues Growth 12,3%
Forecast
2012 2013 2014 2015 2016 2017 2018 2019 2020 2021
Operating Revenues (in mil. DKK) 3768,0 3843,4 3997,1 4236,9 4575,9 4804,7 4948,8 5047,8 5148,7 5251,7 Revenues Growth -4,0% 2,0% 4,0% 6,0% 8,0% 5,0% 3,0% 2,0% 2,0% 2,0%
Perpetuity
Operating Revenues (in mil. DKK)
Revenues Growth 2,0%
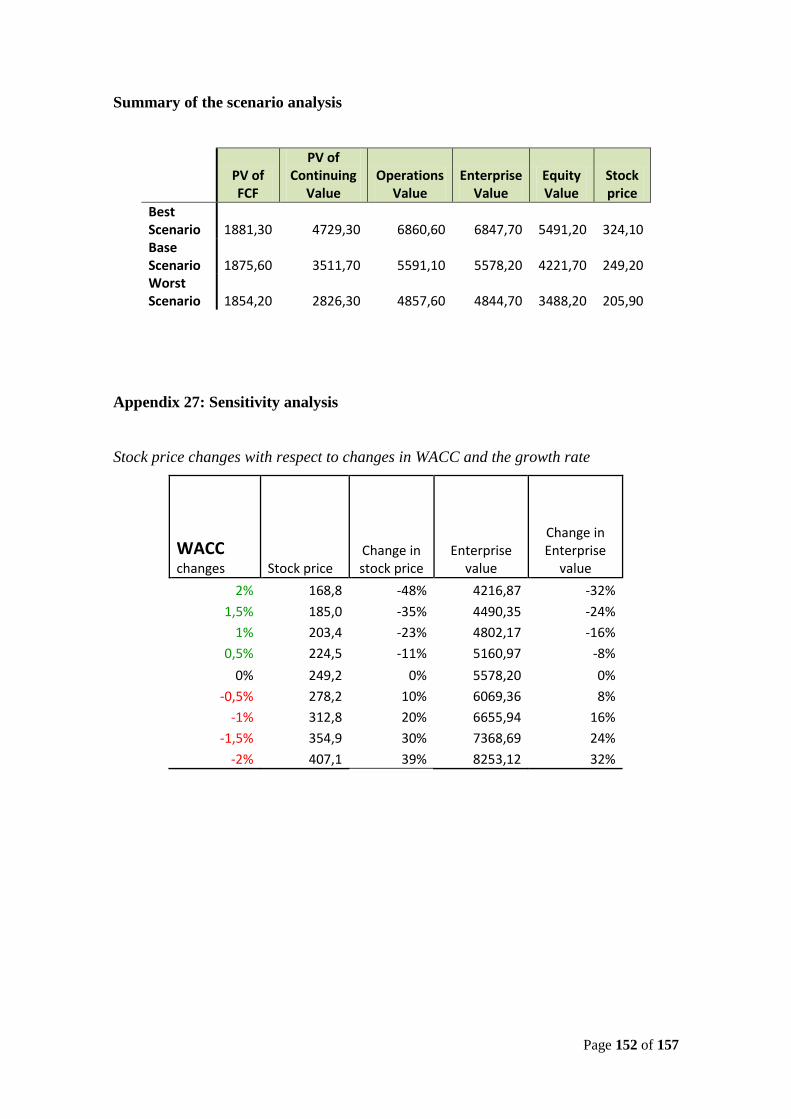
Page 152 of 157
Summary of the scenario analysis
PV of FCF
PV of Continuing
Value Operations
Value Enterprise
Value Equity Value
Stock price
Best Scenario 1881,30 4729,30 6860,60 6847,70 5491,20 324,10 Base Scenario 1875,60 3511,70 5591,10 5578,20 4221,70 249,20 Worst Scenario 1854,20 2826,30 4857,60 4844,70 3488,20 205,90
Appendix 27: Sensitivity analysis
Stock price changes with respect to changes in WACC and the growth rate
WACC changes Stock price
Change in stock price
Enterprise value
Change in Enterprise
value
2% 168,8 -48% 4216,87 -32%
1,5% 185,0 -35% 4490,35 -24%
1% 203,4 -23% 4802,17 -16%
0,5% 224,5 -11% 5160,97 -8%
0% 249,2 0% 5578,20 0%
-0,5% 278,2 10% 6069,36 8%
-1% 312,8 20% 6655,94 16%
-1,5% 354,9 30% 7368,69 24%
-2% 407,1 39% 8253,12 32%
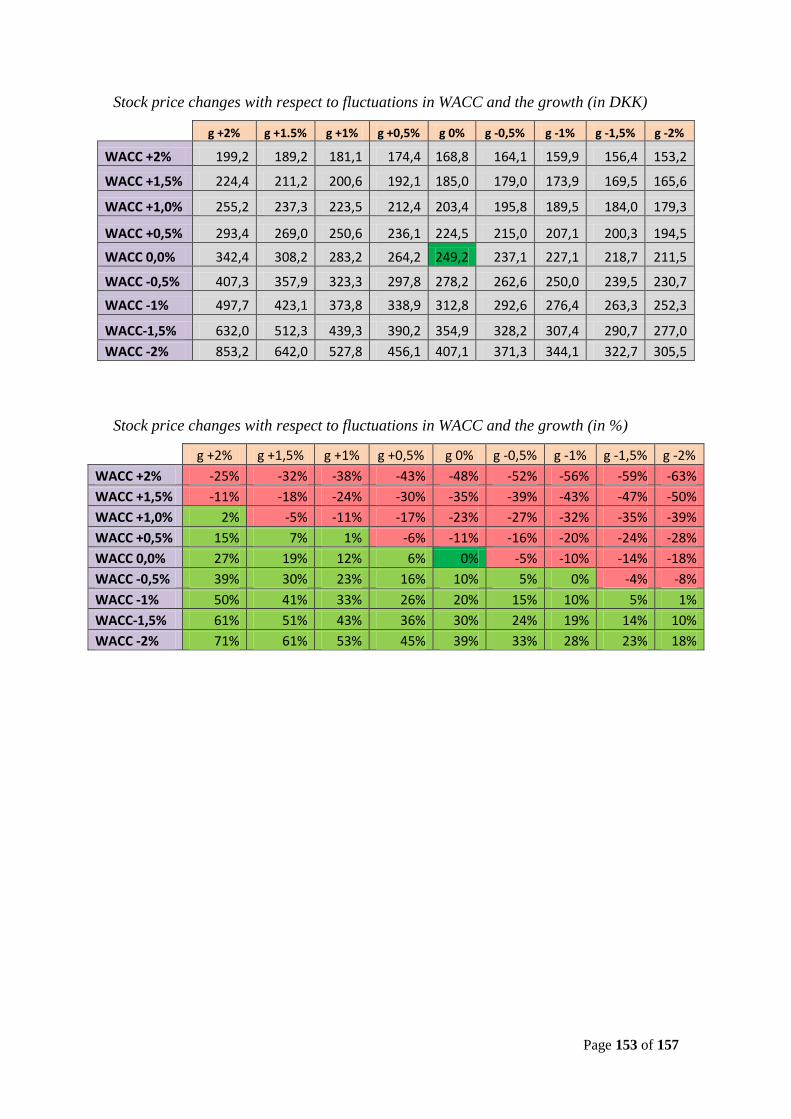
Page 153 of 157
Stock price changes with respect to fluctuations in WACC and the growth (in DKK)
g +2% g +1.5% g +1% g +0,5% g 0% g -0,5% g -1% g -1,5% g -2%
WACC +2% 199,2 189,2 181,1 174,4 168,8 164,1 159,9 156,4 153,2
WACC +1,5% 224,4 211,2 200,6 192,1 185,0 179,0 173,9 169,5 165,6
WACC +1,0% 255,2 237,3 223,5 212,4 203,4 195,8 189,5 184,0 179,3
WACC +0,5% 293,4 269,0 250,6 236,1 224,5 215,0 207,1 200,3 194,5
WACC 0,0% 342,4 308,2 283,2 264,2 249,2 237,1 227,1 218,7 211,5
WACC -0,5% 407,3 357,9 323,3 297,8 278,2 262,6 250,0 239,5 230,7
WACC -1% 497,7 423,1 373,8 338,9 312,8 292,6 276,4 263,3 252,3
WACC-1,5% 632,0 512,3 439,3 390,2 354,9 328,2 307,4 290,7 277,0
WACC -2% 853,2 642,0 527,8 456,1 407,1 371,3 344,1 322,7 305,5
Stock price changes with respect to fluctuations in WACC and the growth (in %)
g +2% g +1,5% g +1% g +0,5% g 0% g -0,5% g -1% g -1,5% g -2%
WACC +2% -25% -32% -38% -43% -48% -52% -56% -59% -63%
WACC +1,5% -11% -18% -24% -30% -35% -39% -43% -47% -50%
WACC +1,0% 2% -5% -11% -17% -23% -27% -32% -35% -39%
WACC +0,5% 15% 7% 1% -6% -11% -16% -20% -24% -28%
WACC 0,0% 27% 19% 12% 6% 0% -5% -10% -14% -18%
WACC -0,5% 39% 30% 23% 16% 10% 5% 0% -4% -8%
WACC -1% 50% 41% 33% 26% 20% 15% 10% 5% 1%
WACC-1,5% 61% 51% 43% 36% 30% 24% 19% 14% 10%
WACC -2% 71% 61% 53% 45% 39% 33% 28% 23% 18%
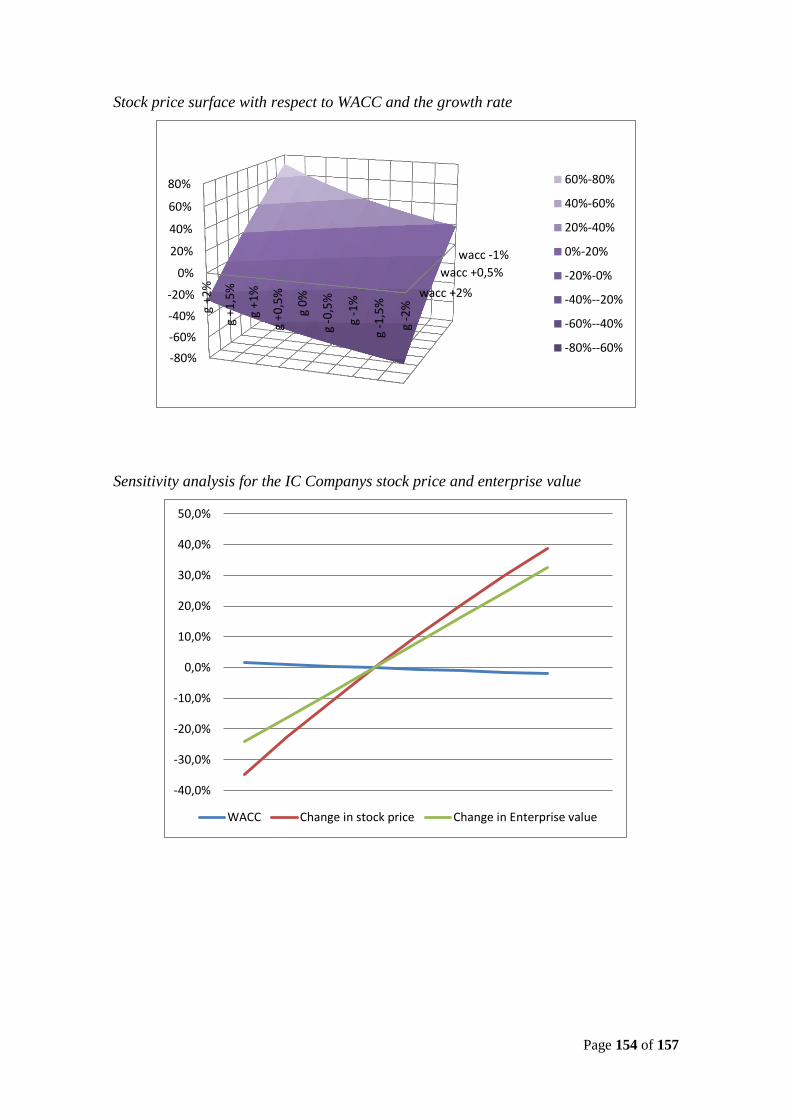
Page 154 of 157
Stock price surface with respect to WACC and the growth rate
Sensitivity analysis for the IC Companys stock price and enterprise value
wacc +2%
wacc +0,5%
wacc -1%
-80%
-60%
-40%
-20%
0%
20%
40%
60%
80%
g +
2%
g +
1,5
%
g +
1%
g +
0,5
%
g 0
%
g -0
,5%
g -1
%
g -1
,5%
g -2
%
60%-80%
40%-60%
20%-40%
0%-20%
-20%-0%
-40%--20%
-60%--40%
-80%--60%
-40,0%
-30,0%
-20,0%
-10,0%
0,0%
10,0%
20,0%
30,0%
40,0%
50,0%
WACC Change in stock price Change in Enterprise value
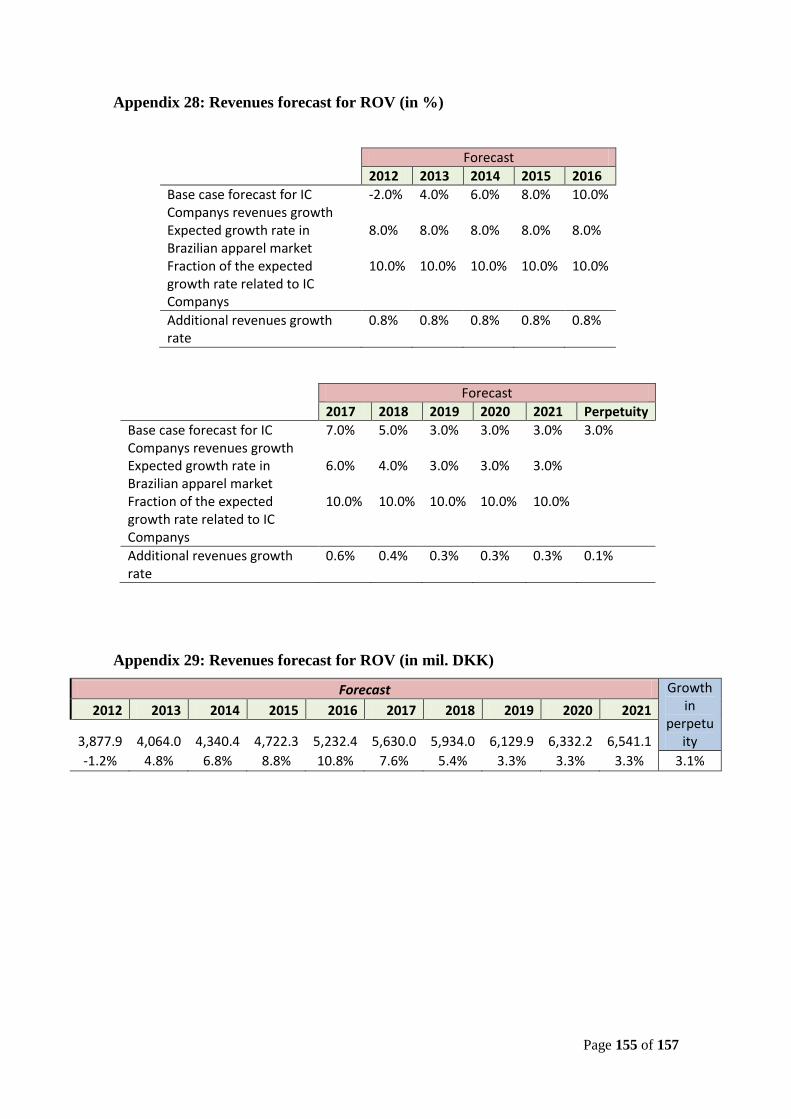
Page 155 of 157
Appendix 28: Revenues forecast for ROV (in %)
Forecast
2012 2013 2014 2015 2016
Base case forecast for IC Companys revenues growth
-2.0% 4.0% 6.0% 8.0% 10.0%
Expected growth rate in Brazilian apparel market
8.0% 8.0% 8.0% 8.0% 8.0%
Fraction of the expected growth rate related to IC Companys
10.0% 10.0% 10.0% 10.0% 10.0%
Additional revenues growth rate
0.8% 0.8% 0.8% 0.8% 0.8%
Forecast
2017 2018 2019 2020 2021 Perpetuity
Base case forecast for IC Companys revenues growth
7.0% 5.0% 3.0% 3.0% 3.0% 3.0%
Expected growth rate in Brazilian apparel market
6.0% 4.0% 3.0% 3.0% 3.0%
Fraction of the expected growth rate related to IC Companys
10.0% 10.0% 10.0% 10.0% 10.0%
Additional revenues growth rate
0.6% 0.4% 0.3% 0.3% 0.3% 0.1%
Appendix 29: Revenues forecast for ROV (in mil. DKK)
Forecast Growth in
perpetuity
2012 2013 2014 2015 2016 2017 2018 2019 2020 2021
3,877.9 4,064.0 4,340.4 4,722.3 5,232.4 5,630.0 5,934.0 6,129.9 6,332.2 6,541.1
-1.2% 4.8% 6.8% 8.8% 10.8% 7.6% 5.4% 3.3% 3.3% 3.3% 3.1%
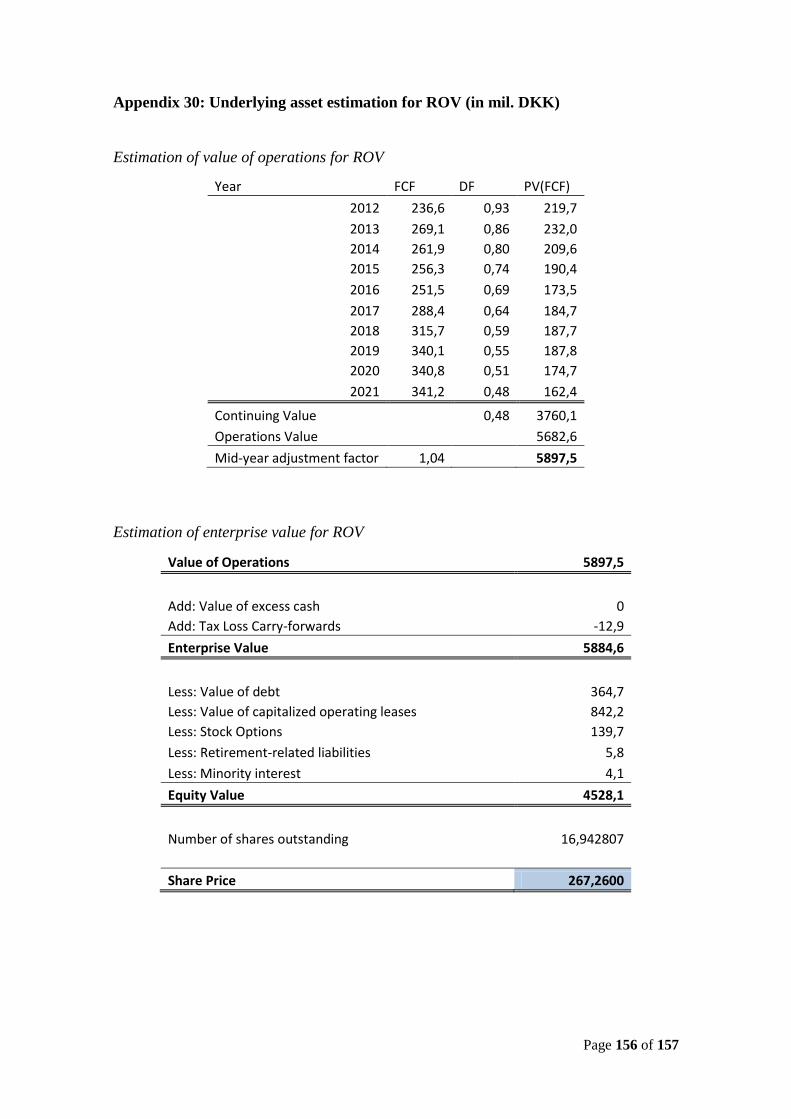
Page 156 of 157
Appendix 30: Underlying asset estimation for ROV (in mil. DKK)
Estimation of value of operations for ROV
Year FCF DF PV(FCF)
2012 236,6 0,93 219,7
2013 269,1 0,86 232,0
2014 261,9 0,80 209,6
2015 256,3 0,74 190,4
2016 251,5 0,69 173,5
2017 288,4 0,64 184,7
2018 315,7 0,59 187,7
2019 340,1 0,55 187,8
2020 340,8 0,51 174,7
2021 341,2 0,48 162,4
Continuing Value
0,48 3760,1
Operations Value
5682,6
Mid-year adjustment factor 1,04 5897,5
Estimation of enterprise value for ROV
Value of Operations 5897,5
Add: Value of excess cash 0
Add: Tax Loss Carry-forwards -12,9
Enterprise Value 5884,6
Less: Value of debt 364,7
Less: Value of capitalized operating leases 842,2
Less: Stock Options 139,7
Less: Retirement-related liabilities 5,8
Less: Minority interest 4,1
Equity Value 4528,1
Number of shares outstanding 16,942807
Share Price 267,2600
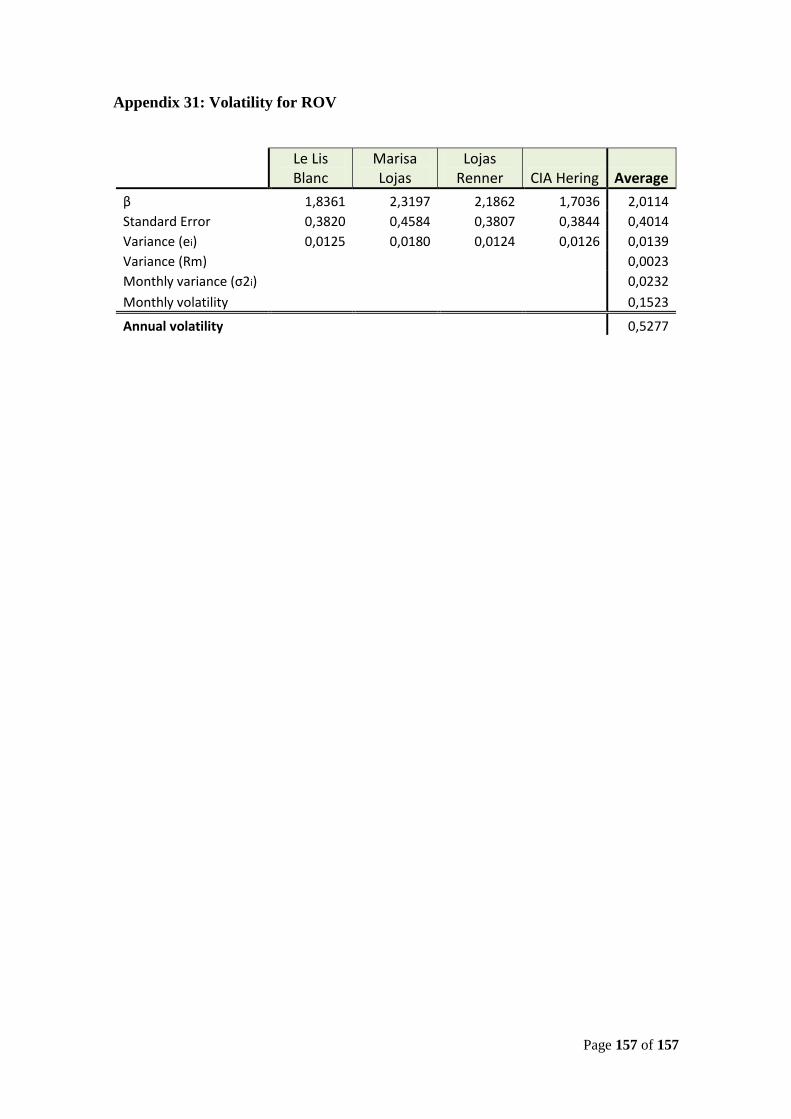
Page 157 of 157
Appendix 31: Volatility for ROV
Le Lis Blanc
Marisa Lojas
Lojas Renner CIA Hering Average
β 1,8361 2,3197 2,1862 1,7036 2,0114
Standard Error 0,3820 0,4584 0,3807 0,3844 0,4014
Variance (ei) 0,0125 0,0180 0,0124 0,0126 0,0139
Variance (Rm)
0,0023
Monthly variance (σ2i)
0,0232
Monthly volatility 0,1523
Annual volatility
0,5277