Embed Size (px)
Citation preview

Strategic Advisers® Emerging Markets FundOffered exclusively to certain managed account clients of Strategic Advisers LLC or its affiliates – not available for sale to the general public
Semi-Annual ReportAugust 31, 2021
Semi-Annual Report
Note to Shareholders 3Investment Summary 4Schedule of Investments 6Financial Statements 35Notes to Financial Statements
39
Shareholder Expense Example
47
Board Approval of New Sub-Subadvisory Agreement
48
To view a fund’s proxy voting record for the 12-month period ended June 30, visit http://www.fidelity.com/proxyvotingresults or visit the Securities and Exchange Commission’s (SEC) web site at http://www.sec.gov.You may also call 1-800-544-3455 to request a free copy of the proxy voting guidelines.Standard & Poor’s, S&P and S&P 500 are registered service marks of The McGraw-Hill Companies, Inc. and have been licensed for use by Fidelity Distributors Corporation.Other third-party marks appearing herein are the property of their respective owners.All other marks appearing herein are registered or unregistered trademarks or service marks of FMR LLC or an affiliated company. © 2021 FMR LLC. All rights reserved.
Contents
This report and the financial statements contained herein are submitted for the general information of the shareholders of the Fund. This report is not authorized for distribution to prospective investors in the Fund unless preceded or accompanied by an effective prospectus.A fund files its complete schedule of portfolio holdings with the SEC for the first and third quarters of each fiscal year on Form N-PORT. Forms N-PORT are available on the SEC’s web site at http://www.sec.gov. A fund’s Forms N-PORT may be reviewed and copied at the SEC’s Public Reference Room in Washington, DC. Information regarding the operation of the SEC’s Public Reference Room may be obtained by calling 1-800-SEC-0330.For a complete list of a fund’s portfolio holdings, view the most recent holdings listing, semiannual report, or annual report on Fidelity’s web site at http://www.fidelity.com, http://www.institutional.fidelity.com, or http://www.401k.com, as applicable.NOT FDIC INSURED •MAY LOSE VALUE •NO BANK GUARANTEENeither the Fund nor Fidelity Distributors Corporation is a bank.
3 Semi-Annual Report
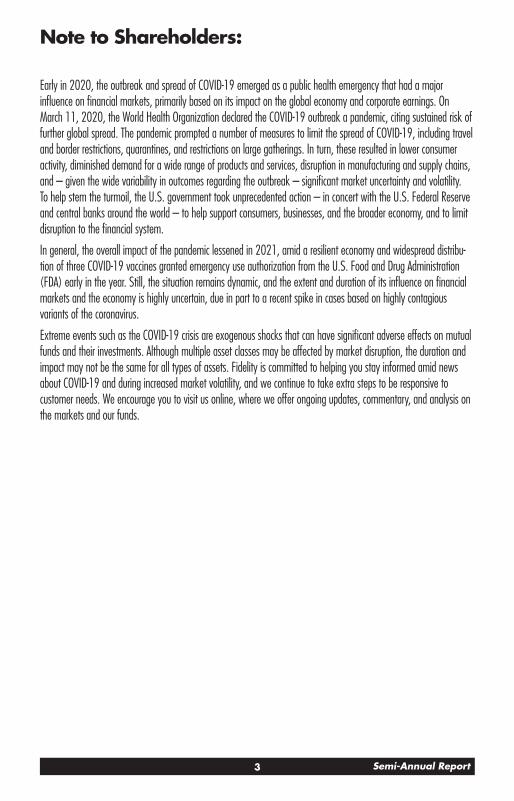
Note to Shareholders:
Early in 2020, the outbreak and spread of COVID-19 emerged as a public health emergency that had a major influence on financial markets, primarily based on its impact on the global economy and corporate earnings. On March 11, 2020, the World Health Organization declared the COVID-19 outbreak a pandemic, citing sustained risk of further global spread. The pandemic prompted a number of measures to limit the spread of COVID-19, including travel and border restrictions, quarantines, and restrictions on large gatherings. In turn, these resulted in lower consumer activity, diminished demand for a wide range of products and services, disruption in manufacturing and supply chains, and – given the wide variability in outcomes regarding the outbreak – significant market uncertainty and volatility. To help stem the turmoil, the U.S. government took unprecedented action – in concert with the U.S. Federal Reserve and central banks around the world – to help support consumers, businesses, and the broader economy, and to limit disruption to the financial system.
In general, the overall impact of the pandemic lessened in 2021, amid a resilient economy and widespread distribu-tion of three COVID-19 vaccines granted emergency use authorization from the U.S. Food and Drug Administration (FDA) early in the year. Still, the situation remains dynamic, and the extent and duration of its influence on financial markets and the economy is highly uncertain, due in part to a recent spike in cases based on highly contagious variants of the coronavirus.
Extreme events such as the COVID-19 crisis are exogenous shocks that can have significant adverse effects on mutual funds and their investments. Although multiple asset classes may be affected by market disruption, the duration and impact may not be the same for all types of assets. Fidelity is committed to helping you stay informed amid news about COVID-19 and during increased market volatility, and we continue to take extra steps to be responsive to customer needs. We encourage you to visit us online, where we offer ongoing updates, commentary, and analysis on the markets and our funds.

4Semi-Annual Report
Investment Summary (Unaudited)
The information in the following tables is based on the direct investments of the Fund.
Top Ten Holdings as of August 31, 2021
(excluding cash equivalents) % of fund’s net assets
Fidelity Advisor Emerging Markets Fund – Class Z 7.0Fidelity SAI Emerging Markets Low Volatility Index Fund 5.7Fidelity SAI Emerging Markets Value Index Fund 5.4Taiwan Semiconductor Manufacturing Co. Ltd. 4.0Fidelity SAI Emerging Markets Index Fund 3.7Tencent Holdings Ltd. 3.4Goldman Sachs Emerging Markets Equity Fund Institutional Shares 3.1Samsung Electronics Co. Ltd. 2.9Invesco Developing Markets Fund Class R6 2.4Aberdeen Emerging Markets Fund Institutional Service Class 2.2
39.8
Top Five Market Sectors as of August 31, 2021
(stocks only) % of fund’s net assets
Information Technology 13.9Financials 12.1Consumer Discretionary 10.2Communication Services 5.9Materials 4.0
Geographic Diversification (% of fund’s net assets)
As of August 31, 2021
United States of America* 43.6%
Cayman Islands 12.5%
Taiwan 8.6%
Korea (South) 8.0%
China 5.9%
India 5.8%
Brazil 3.7%
Russia 1.8%
South Africa 1.7%
Other 8.4%
* Includes Short-Term investments and Net Other Assets (Liabilities).
Percentages are based on country or territory of incorporation and are adjusted for the effect of futures contracts, if applicable.

5 Semi-Annual Report
Asset Allocation (% of fund’s net assets)
As of August 31, 2021
Common Stocks 55.3%
Preferred Stocks 1.9%
Diversifed Emerging Markets Funds 34.2%
Other 1.8%
Short-Term Investments and Net Other Assets (Liabilities) 6.8%
Asset allocations of funds in the pie chart reflect the categorizations of assets as defined by Morningstar as of the reporting date.
6Semi-Annual Report
See accompanying notes which are an integral part of the financial statements.
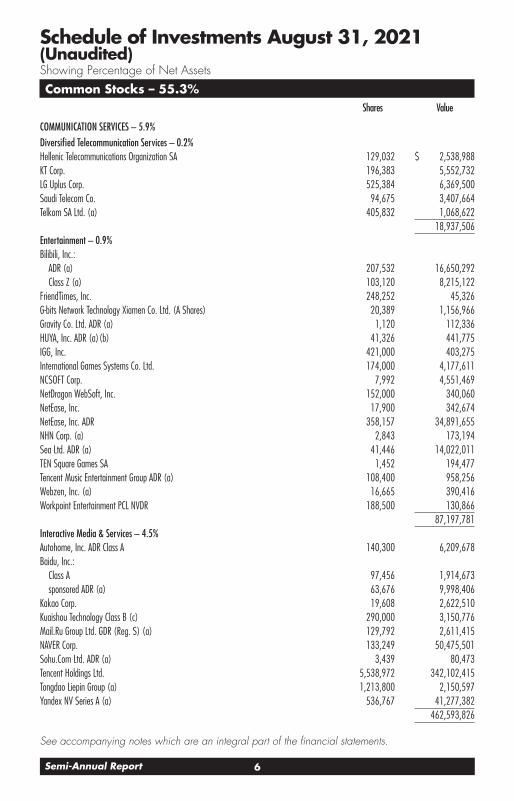
Common Stocks – 55.3%Shares Value
COMMUNICATION SERVICES – 5.9%Diversified Telecommunication Services – 0.2%Hellenic Telecommunications Organization SA 129,032 $ 2,538,988KT Corp. 196,383 5,552,732LG Uplus Corp. 525,384 6,369,500Saudi Telecom Co. 94,675 3,407,664Telkom SA Ltd. (a) 405,832 1,068,622
18,937,506Entertainment – 0.9%Bilibili, Inc.:
ADR (a) 207,532 16,650,292Class Z (a) 103,120 8,215,122
FriendTimes, Inc. 248,252 45,326G-bits Network Technology Xiamen Co. Ltd. (A Shares) 20,389 1,156,966Gravity Co. Ltd. ADR (a) 1,120 112,336HUYA, Inc. ADR (a) (b) 41,326 441,775IGG, Inc. 421,000 403,275International Games Systems Co. Ltd. 174,000 4,177,611NCSOFT Corp. 7,992 4,551,469NetDragon WebSoft, Inc. 152,000 340,060NetEase, Inc. 17,900 342,674NetEase, Inc. ADR 358,157 34,891,655NHN Corp. (a) 2,843 173,194Sea Ltd. ADR (a) 41,446 14,022,011TEN Square Games SA 1,452 194,477Tencent Music Entertainment Group ADR (a) 108,400 958,256Webzen, Inc. (a) 16,665 390,416Workpoint Entertainment PCL NVDR 188,500 130,866
87,197,781Interactive Media & Services – 4.5%Autohome, Inc. ADR Class A 140,300 6,209,678Baidu, Inc.:
Class A 97,456 1,914,673sponsored ADR (a) 63,676 9,998,406
Kakao Corp. 19,608 2,622,510Kuaishou Technology Class B (c) 290,000 3,150,776Mail.Ru Group Ltd. GDR (Reg. S) (a) 129,792 2,611,415NAVER Corp. 133,249 50,475,501Sohu.Com Ltd. ADR (a) 3,439 80,473Tencent Holdings Ltd. 5,538,972 342,102,415Tongdao Liepin Group (a) 1,213,800 2,150,597Yandex NV Series A (a) 536,767 41,277,382
462,593,826
Schedule of Investments August 31, 2021 (Unaudited)Showing Percentage of Net Assets
7 Semi-Annual Report
See accompanying notes which are an integral part of the financial statements.
Common Stocks – continuedShares Value
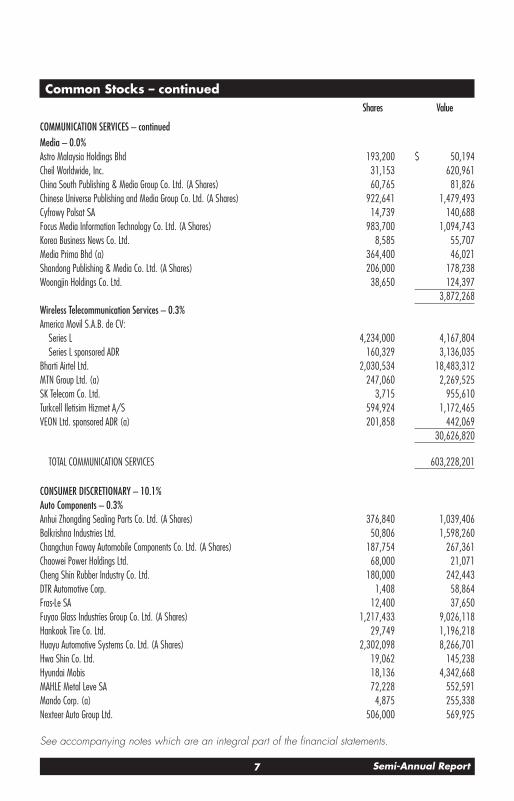
COMMUNICATION SERVICES – continuedMedia – 0.0%Astro Malaysia Holdings Bhd 193,200 $ 50,194Cheil Worldwide, Inc. 31,153 620,961China South Publishing & Media Group Co. Ltd. (A Shares) 60,765 81,826Chinese Universe Publishing and Media Group Co. Ltd. (A Shares) 922,641 1,479,493Cyfrowy Polsat SA 14,739 140,688Focus Media Information Technology Co. Ltd. (A Shares) 983,700 1,094,743Korea Business News Co. Ltd. 8,585 55,707Media Prima Bhd (a) 364,400 46,021Shandong Publishing & Media Co. Ltd. (A Shares) 206,000 178,238Woongjin Holdings Co. Ltd. 38,650 124,397
3,872,268Wireless Telecommunication Services – 0.3%America Movil S.A.B. de CV:
Series L 4,234,000 4,167,804Series L sponsored ADR 160,329 3,136,035
Bharti Airtel Ltd. 2,030,534 18,483,312MTN Group Ltd. (a) 247,060 2,269,525SK Telecom Co. Ltd. 3,715 955,610Turkcell Iletisim Hizmet A/S 594,924 1,172,465VEON Ltd. sponsored ADR (a) 201,858 442,069
30,626,820
TOTAL COMMUNICATION SERVICES 603,228,201
CONSUMER DISCRETIONARY – 10.1%Auto Components – 0.3%Anhui Zhongding Sealing Parts Co. Ltd. (A Shares) 376,840 1,039,406Balkrishna Industries Ltd. 50,806 1,598,260Changchun Faway Automobile Components Co. Ltd. (A Shares) 187,754 267,361Chaowei Power Holdings Ltd. 68,000 21,071Cheng Shin Rubber Industry Co. Ltd. 180,000 242,443DTR Automotive Corp. 1,408 58,864Fras-Le SA 12,400 37,650Fuyao Glass Industries Group Co. Ltd. (A Shares) 1,217,433 9,026,118Hankook Tire Co. Ltd. 29,749 1,196,218Huayu Automotive Systems Co. Ltd. (A Shares) 2,302,098 8,266,701Hwa Shin Co. Ltd. 19,062 145,238Hyundai Mobis 18,136 4,342,668MAHLE Metal Leve SA 72,228 552,591Mando Corp. (a) 4,875 255,338Nexteer Auto Group Ltd. 506,000 569,925

8Semi-Annual Report
See accompanying notes which are an integral part of the financial statements.
Schedule of Investments (Unaudited) – continued
Common Stocks – continuedShares Value
CONSUMER DISCRETIONARY – continuedAuto Components – continuedNingbo Huaxiang Electronic Co. Ltd. (A Shares) 224,686 $ 801,966Somboon Advance Technology PCL unit 71,100 46,276Sri Trang Agro-Industry PCL 1,675,800 1,973,668Tianneng Power International Ltd. (b) 1,495,826 2,000,217Tupy SA 18,900 81,437Yoo Sung Enterprise 12,624 38,071
32,561,487Automobiles – 1.3%Bajaj Auto Ltd. 238,049 12,164,480BYD Co. Ltd. (H Shares) 134,000 4,504,962Dongfeng Motor Group Co. Ltd. (H Shares) 2,272,000 2,488,919Eicher Motors Ltd. 135,200 4,965,451Great Wall Motor Co. Ltd. (H Shares) 4,558,500 20,983,009Hyundai Motor Co. 53,957 9,893,704Kia Corp. 364,531 26,768,016Li Auto, Inc. ADR (a) 442,100 13,643,206Loncin Motor Co. Ltd. 295,300 170,945Maruti Suzuki India Ltd. 141,228 13,253,568PT Astra International Tbk 7,696,200 2,819,467SAIC Motor Corp. Ltd. (A Shares) 1,657,613 4,956,906Tofas Turk Otomobil Fabrikasi A/S 52,674 266,141UMW Holdings Bhd 79,400 60,357XPeng, Inc.:
ADR (a) 394,600 16,770,500Class A 165,400 3,400,531
137,110,162Distributors – 0.0%Inter Cars SA 261 27,666Xinhua Winshare Publishing and Media Co. Ltd. 178,000 124,732
152,398Diversified Consumer Services – 0.0%Human Soft Holding Co. KSCC 24,130 272,917New Oriental Education & Technology Group, Inc. sponsored ADR 521,500 1,178,590Visang Education, Inc. 8,025 68,623YDUQS Participacoes SA 385,998 1,910,283
3,430,413Hotels, Restaurants & Leisure – 0.8%Huazhu Group Ltd. ADR (a) 147,479 7,121,761Jiumaojiu International Holdings Ltd. (c) 681,000 2,285,338MakeMyTrip Ltd. (a) 45,188 1,166,754Sands China Ltd. (a) 2,080,722 6,684,525
9 Semi-Annual Report
See accompanying notes which are an integral part of the financial statements.
Common Stocks – continuedShares Value
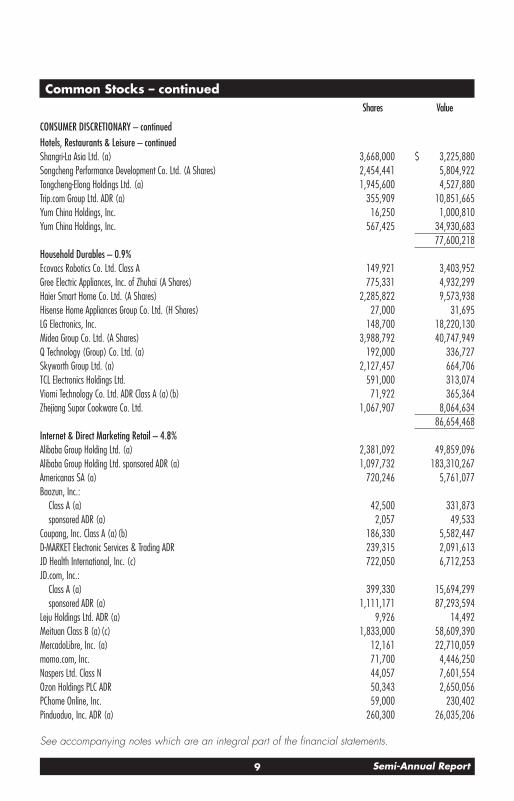
CONSUMER DISCRETIONARY – continuedHotels, Restaurants & Leisure – continuedShangri-La Asia Ltd. (a) 3,668,000 $ 3,225,880Songcheng Performance Development Co. Ltd. (A Shares) 2,454,441 5,804,922Tongcheng-Elong Holdings Ltd. (a) 1,945,600 4,527,880Trip.com Group Ltd. ADR (a) 355,909 10,851,665Yum China Holdings, Inc. 16,250 1,000,810Yum China Holdings, Inc. 567,425 34,930,683
77,600,218Household Durables – 0.9%Ecovacs Robotics Co. Ltd. Class A 149,921 3,403,952Gree Electric Appliances, Inc. of Zhuhai (A Shares) 775,331 4,932,299Haier Smart Home Co. Ltd. (A Shares) 2,285,822 9,573,938Hisense Home Appliances Group Co. Ltd. (H Shares) 27,000 31,695LG Electronics, Inc. 148,700 18,220,130Midea Group Co. Ltd. (A Shares) 3,988,792 40,747,949Q Technology (Group) Co. Ltd. (a) 192,000 336,727Skyworth Group Ltd. (a) 2,127,457 664,706TCL Electronics Holdings Ltd. 591,000 313,074Viomi Technology Co. Ltd. ADR Class A (a) (b) 71,922 365,364Zhejiang Supor Cookware Co. Ltd. 1,067,907 8,064,634
86,654,468Internet & Direct Marketing Retail – 4.8%Alibaba Group Holding Ltd. (a) 2,381,092 49,859,096Alibaba Group Holding Ltd. sponsored ADR (a) 1,097,732 183,310,267Americanas SA (a) 720,246 5,761,077Baozun, Inc.:
Class A (a) 42,500 331,873sponsored ADR (a) 2,057 49,533
Coupang, Inc. Class A (a) (b) 186,330 5,582,447D-MARKET Electronic Services & Trading ADR 239,315 2,091,613JD Health International, Inc. (c) 722,050 6,712,253JD.com, Inc.:
Class A (a) 399,330 15,694,299sponsored ADR (a) 1,111,171 87,293,594
Leju Holdings Ltd. ADR (a) 9,926 14,492Meituan Class B (a) (c) 1,833,000 58,609,390MercadoLibre, Inc. (a) 12,161 22,710,059momo.com, Inc. 71,700 4,446,250Naspers Ltd. Class N 44,057 7,601,554Ozon Holdings PLC ADR 50,343 2,650,056PChome Online, Inc. 59,000 230,402Pinduoduo, Inc. ADR (a) 260,300 26,035,206
10Semi-Annual Report
See accompanying notes which are an integral part of the financial statements.
Schedule of Investments (Unaudited) – continued
Common Stocks – continuedShares Value
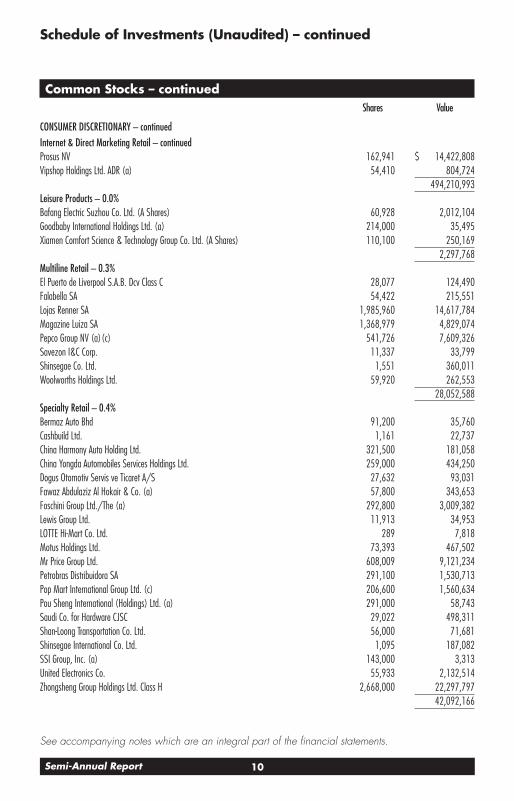
CONSUMER DISCRETIONARY – continuedInternet & Direct Marketing Retail – continuedProsus NV 162,941 $ 14,422,808Vipshop Holdings Ltd. ADR (a) 54,410 804,724
494,210,993Leisure Products – 0.0%Bafang Electric Suzhou Co. Ltd. (A Shares) 60,928 2,012,104Goodbaby International Holdings Ltd. (a) 214,000 35,495Xiamen Comfort Science & Technology Group Co. Ltd. (A Shares) 110,100 250,169
2,297,768Multiline Retail – 0.3%El Puerto de Liverpool S.A.B. Dcv Class C 28,077 124,490Falabella SA 54,422 215,551Lojas Renner SA 1,985,960 14,617,784Magazine Luiza SA 1,368,979 4,829,074Pepco Group NV (a) (c) 541,726 7,609,326Savezon I&C Corp. 11,337 33,799Shinsegae Co. Ltd. 1,551 360,011Woolworths Holdings Ltd. 59,920 262,553
28,052,588Specialty Retail – 0.4%Bermaz Auto Bhd 91,200 35,760Cashbuild Ltd. 1,161 22,737China Harmony Auto Holding Ltd. 321,500 181,058China Yongda Automobiles Services Holdings Ltd. 259,000 434,250Dogus Otomotiv Servis ve Ticaret A/S 27,632 93,031Fawaz Abdulaziz Al Hokair & Co. (a) 57,800 343,653Foschini Group Ltd./The (a) 292,800 3,009,382Lewis Group Ltd. 11,913 34,953LOTTE Hi-Mart Co. Ltd. 289 7,818Motus Holdings Ltd. 73,393 467,502Mr Price Group Ltd. 608,009 9,121,234Petrobras Distribuidora SA 291,100 1,530,713Pop Mart International Group Ltd. (c) 206,600 1,560,634Pou Sheng International (Holdings) Ltd. (a) 291,000 58,743Saudi Co. for Hardware CJSC 29,022 498,311Shan-Loong Transportation Co. Ltd. 56,000 71,681Shinsegae International Co. Ltd. 1,095 187,082SSI Group, Inc. (a) 143,000 3,313United Electronics Co. 55,933 2,132,514Zhongsheng Group Holdings Ltd. Class H 2,668,000 22,297,797
42,092,166
11 Semi-Annual Report
See accompanying notes which are an integral part of the financial statements.
Common Stocks – continuedShares Value
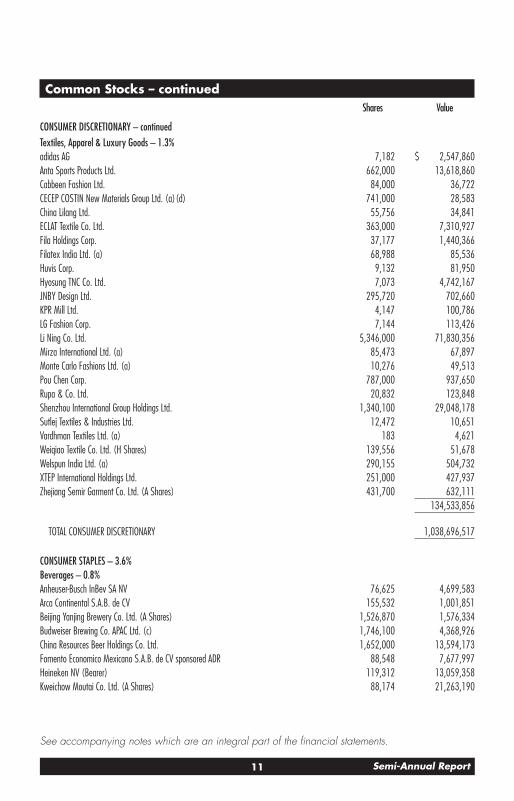
CONSUMER DISCRETIONARY – continuedTextiles, Apparel & Luxury Goods – 1.3%adidas AG 7,182 $ 2,547,860Anta Sports Products Ltd. 662,000 13,618,860Cabbeen Fashion Ltd. 84,000 36,722CECEP COSTIN New Materials Group Ltd. (a) (d) 741,000 28,583China Lilang Ltd. 55,756 34,841ECLAT Textile Co. Ltd. 363,000 7,310,927Fila Holdings Corp. 37,177 1,440,366Filatex India Ltd. (a) 68,988 85,536Huvis Corp. 9,132 81,950Hyosung TNC Co. Ltd. 7,073 4,742,167JNBY Design Ltd. 295,720 702,660KPR Mill Ltd. 4,147 100,786LG Fashion Corp. 7,144 113,426Li Ning Co. Ltd. 5,346,000 71,830,356Mirza International Ltd. (a) 85,473 67,897Monte Carlo Fashions Ltd. (a) 10,276 49,513Pou Chen Corp. 787,000 937,650Rupa & Co. Ltd. 20,832 123,848Shenzhou International Group Holdings Ltd. 1,340,100 29,048,178Sutlej Textiles & Industries Ltd. 12,472 10,651Vardhman Textiles Ltd. (a) 183 4,621Weiqiao Textile Co. Ltd. (H Shares) 139,556 51,678Welspun India Ltd. (a) 290,155 504,732XTEP International Holdings Ltd. 251,000 427,937Zhejiang Semir Garment Co. Ltd. (A Shares) 431,700 632,111
134,533,856
TOTAL CONSUMER DISCRETIONARY 1,038,696,517
CONSUMER STAPLES – 3.6%Beverages – 0.8%Anheuser-Busch InBev SA NV 76,625 4,699,583Arca Continental S.A.B. de CV 155,532 1,001,851Beijing Yanjing Brewery Co. Ltd. (A Shares) 1,526,870 1,576,334Budweiser Brewing Co. APAC Ltd. (c) 1,746,100 4,368,926China Resources Beer Holdings Co. Ltd. 1,652,000 13,594,173Fomento Economico Mexicano S.A.B. de CV sponsored ADR 88,548 7,677,997Heineken NV (Bearer) 119,312 13,059,358Kweichow Moutai Co. Ltd. (A Shares) 88,174 21,263,190

12Semi-Annual Report
See accompanying notes which are an integral part of the financial statements.
Schedule of Investments (Unaudited) – continued
Common Stocks – continuedShares Value
CONSUMER STAPLES – continuedBeverages – continuedThai Beverage PCL 17,314,300 $ 8,757,279Wuliangye Yibin Co. Ltd. (A Shares) 234,901 7,333,135
83,331,826Food & Staples Retailing – 1.0%Atacadao SA 1,301,200 4,567,336Bid Corp. Ltd. (a) 71,316 1,570,437Bim Birlesik Magazalar A/S JSC 476,211 4,114,202Clicks Group Ltd. 198,405 4,132,479CP ALL PCL (For. Reg.) 9,288,900 18,713,110Magnit OJSC 52,655 3,989,726President Chain Store Corp. 537,000 5,543,589Raia Drogasil SA 3,308,972 16,356,719Sendas Distribuidora SA 407,000 1,323,136Shoprite Holdings Ltd. 806,883 10,212,232Wal-Mart de Mexico SA de CV Series V 6,248,509 22,232,546X5 Retail Group NV GDR (Reg. S) 195,159 6,465,618Yifeng Pharmacy Chain Co. Ltd. 440,978 3,538,363
102,759,493Food Products – 1.2%Angel Yeast Co. Ltd. (A Shares) 742,000 4,601,969AVI Ltd. 402,650 2,106,073Charoen Pokphand Foods PCL (For. Reg.) 1,156,500 967,782China Mengniu Dairy Co. Ltd. 12,173,496 73,174,490Dwarikesh Sugar Industries Ltd. 174,073 168,463Inner Mongoli Yili Industries Co. Ltd. (A Shares) 148,500 781,724JBS SA 2,539,329 15,307,280Marfrig Global Foods SA 274,386 1,087,292Minerva SA 62,300 100,725PT Japfa Comfeed Indonesia Tbk 1,180,600 149,825SLC Agricola SA 141,300 1,113,283Tata Consumer Products Ltd. 144,212 1,709,862Uni-President China Holdings Ltd. 140,000 132,666Unified-President Enterprises Corp. 5,014,000 13,107,904Universal Robina Corp. 1,138,040 3,457,221
117,966,559Household Products – 0.0%Hindustan Unilever Ltd. 20,645 770,915Opple Lighting Co. Ltd. (A Shares) 57,064 202,617
973,532Personal Products – 0.6%AMOREPACIFIC Corp. 24,310 4,772,199

13 Semi-Annual Report
See accompanying notes which are an integral part of the financial statements.
Common Stocks – continuedShares Value
CONSUMER STAPLES – continuedPersonal Products – continuedColgate-Palmolive Ltd. 49,248 $ 1,143,119Dabur India Ltd. 44,657 380,452Emami Ltd. 10,684 87,463LG Household & Health Care Ltd. 24,676 31,108,362Natura & Co. Holding SA (a) 2,446,058 24,418,951Organic Tea Cosmetics Holdings Co. Ltd. (a) 4,513 2,847Proya Cosmetics Co. Ltd. (A Shares) 56,300 1,369,789
63,283,182Tobacco – 0.0%ITC Ltd. 280,801 813,330
TOTAL CONSUMER STAPLES 369,127,922
ENERGY – 2.2%Energy Equipment & Services – 0.1%Ezion Holdings Ltd. warrants 4/16/23 (a) (d) 5,020,014 5,862Offshore Oil Enginering Co. Ltd. (A Shares) 1,070,200 752,040Yantai Jereh Oilfield Services (A Shares) 1,108,072 6,321,843
7,079,745Oil, Gas & Consumable Fuels – 2.1%Aldrees Petroleum and Transport Services Co. 4,834 88,542Anhui Hengyan Coal Industry & Electricity Power Co. Ltd. (A Shares) 2,504,500 2,988,793China Coal Energy Co. Ltd. (H Shares) 4,901,000 3,503,663China Merchants Energy Shipping Co. Ltd. (A Shares) 4,172,760 2,803,068China Petroleum & Chemical Corp. (H Shares) 32,646,000 15,707,221Empresas COPEC SA 719,063 6,689,369Gazprom OAO sponsored ADR (Reg. S) 1,517,353 12,600,099Grupa Lotos SA 6,853 104,204Hindustan Petroleum Corp. Ltd. 643,806 2,352,794Indian Oil Corp. Ltd. 1,315,262 1,998,558Lukoil PJSC 165,638 14,162,082Lukoil PJSC sponsored ADR 364,875 30,926,805MOL Hungarian Oil and Gas PLC Series A (For. Reg.) 136,011 1,115,278Novatek PJSC GDR (Reg. S) 157,767 37,390,779Oil & Natural Gas Corp. Ltd. 980,532 1,620,309PetroChina Co. Ltd. (H Shares) 20,438,000 8,927,727Petronet LNG Ltd. 1,375,049 4,290,019Polish Oil & Gas Co. SA 1,350,590 2,221,510PT Adaro Energy Tbk 1,702,400 150,396PT Indo Tambangraya Megah Tbk 67,100 75,274PTT PCL (For. Reg.) 2,994,800 3,550,321
14Semi-Annual Report
See accompanying notes which are an integral part of the financial statements.
Schedule of Investments (Unaudited) – continued
Common Stocks – continuedShares Value
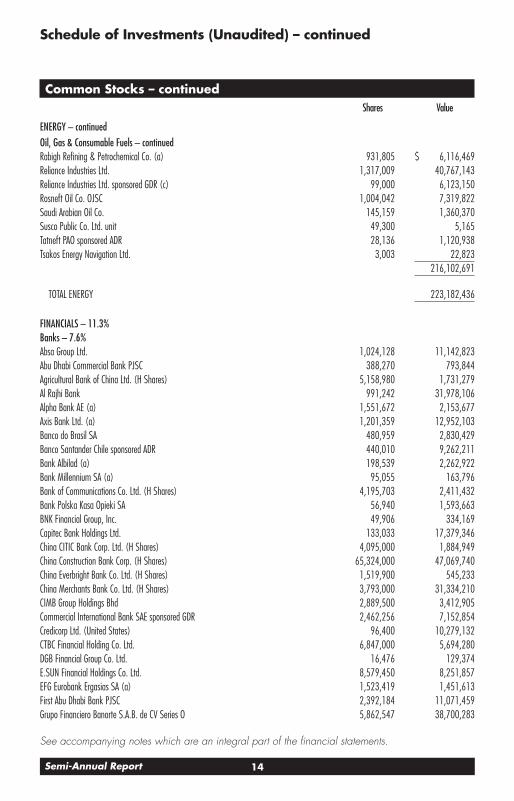
ENERGY – continuedOil, Gas & Consumable Fuels – continuedRabigh Refining & Petrochemical Co. (a) 931,805 $ 6,116,469Reliance Industries Ltd. 1,317,009 40,767,143Reliance Industries Ltd. sponsored GDR (c) 99,000 6,123,150Rosneft Oil Co. OJSC 1,004,042 7,319,822Saudi Arabian Oil Co. 145,159 1,360,370Susco Public Co. Ltd. unit 49,300 5,165Tatneft PAO sponsored ADR 28,136 1,120,938Tsakos Energy Navigation Ltd. 3,003 22,823
216,102,691
TOTAL ENERGY 223,182,436
FINANCIALS – 11.3%Banks – 7.6%Absa Group Ltd. 1,024,128 11,142,823Abu Dhabi Commercial Bank PJSC 388,270 793,844Agricultural Bank of China Ltd. (H Shares) 5,158,980 1,731,279Al Rajhi Bank 991,242 31,978,106Alpha Bank AE (a) 1,551,672 2,153,677Axis Bank Ltd. (a) 1,201,359 12,952,103Banco do Brasil SA 480,959 2,830,429Banco Santander Chile sponsored ADR 440,010 9,262,211Bank Albilad (a) 198,539 2,262,922Bank Millennium SA (a) 95,055 163,796Bank of Communications Co. Ltd. (H Shares) 4,195,703 2,411,432Bank Polska Kasa Opieki SA 56,940 1,593,663BNK Financial Group, Inc. 49,906 334,169Capitec Bank Holdings Ltd. 133,033 17,379,346China CITIC Bank Corp. Ltd. (H Shares) 4,095,000 1,884,949China Construction Bank Corp. (H Shares) 65,324,000 47,069,740China Everbright Bank Co. Ltd. (H Shares) 1,519,900 545,233China Merchants Bank Co. Ltd. (H Shares) 3,793,000 31,334,210CIMB Group Holdings Bhd 2,889,500 3,412,905Commercial International Bank SAE sponsored GDR 2,462,256 7,152,854Credicorp Ltd. (United States) 96,400 10,279,132CTBC Financial Holding Co. Ltd. 6,847,000 5,694,280DGB Financial Group Co. Ltd. 16,476 129,374E.SUN Financial Holdings Co. Ltd. 8,579,450 8,251,857EFG Eurobank Ergasias SA (a) 1,523,419 1,451,613First Abu Dhabi Bank PJSC 2,392,184 11,071,459Grupo Financiero Banorte S.A.B. de CV Series O 5,862,547 38,700,283
15 Semi-Annual Report
See accompanying notes which are an integral part of the financial statements.
Common Stocks – continuedShares Value
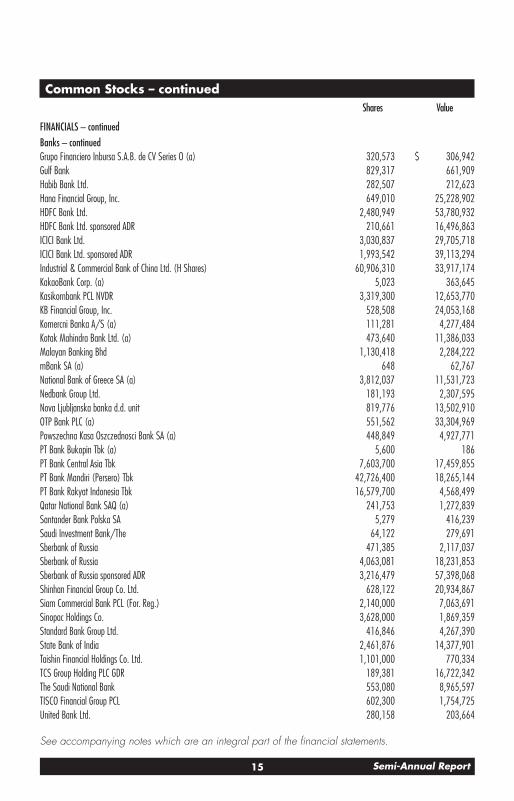
FINANCIALS – continuedBanks – continuedGrupo Financiero Inbursa S.A.B. de CV Series O (a) 320,573 $ 306,942Gulf Bank 829,317 661,909Habib Bank Ltd. 282,507 212,623Hana Financial Group, Inc. 649,010 25,228,902HDFC Bank Ltd. 2,480,949 53,780,932HDFC Bank Ltd. sponsored ADR 210,661 16,496,863ICICI Bank Ltd. 3,030,837 29,705,718ICICI Bank Ltd. sponsored ADR 1,993,542 39,113,294Industrial & Commercial Bank of China Ltd. (H Shares) 60,906,310 33,917,174KakaoBank Corp. (a) 5,023 363,645Kasikornbank PCL NVDR 3,319,300 12,653,770KB Financial Group, Inc. 528,508 24,053,168Komercni Banka A/S (a) 111,281 4,277,484Kotak Mahindra Bank Ltd. (a) 473,640 11,386,033Malayan Banking Bhd 1,130,418 2,284,222mBank SA (a) 648 62,767National Bank of Greece SA (a) 3,812,037 11,531,723Nedbank Group Ltd. 181,193 2,307,595Nova Ljubljanska banka d.d. unit 819,776 13,502,910OTP Bank PLC (a) 551,562 33,304,969Powszechna Kasa Oszczednosci Bank SA (a) 448,849 4,927,771PT Bank Bukopin Tbk (a) 5,600 186PT Bank Central Asia Tbk 7,603,700 17,459,855PT Bank Mandiri (Persero) Tbk 42,726,400 18,265,144PT Bank Rakyat Indonesia Tbk 16,579,700 4,568,499Qatar National Bank SAQ (a) 241,753 1,272,839Santander Bank Polska SA 5,279 416,239Saudi Investment Bank/The 64,122 279,691Sberbank of Russia 471,385 2,117,037Sberbank of Russia 4,063,081 18,231,853Sberbank of Russia sponsored ADR 3,216,479 57,398,068Shinhan Financial Group Co. Ltd. 628,122 20,934,867Siam Commercial Bank PCL (For. Reg.) 2,140,000 7,063,691Sinopac Holdings Co. 3,628,000 1,869,359Standard Bank Group Ltd. 416,846 4,267,390State Bank of India 2,461,876 14,377,901Taishin Financial Holdings Co. Ltd. 1,101,000 770,334TCS Group Holding PLC GDR 189,381 16,722,342The Saudi National Bank 553,080 8,965,597TISCO Financial Group PCL 602,300 1,754,725United Bank Ltd. 280,158 203,664
16Semi-Annual Report
See accompanying notes which are an integral part of the financial statements.
Schedule of Investments (Unaudited) – continued
Common Stocks – continuedShares Value
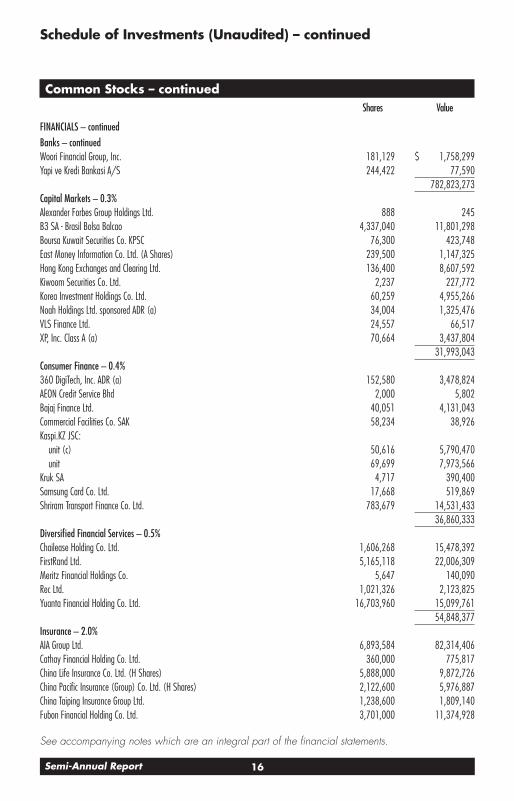
FINANCIALS – continuedBanks – continuedWoori Financial Group, Inc. 181,129 $ 1,758,299Yapi ve Kredi Bankasi A/S 244,422 77,590
782,823,273Capital Markets – 0.3%Alexander Forbes Group Holdings Ltd. 888 245B3 SA - Brasil Bolsa Balcao 4,337,040 11,801,298Boursa Kuwait Securities Co. KPSC 76,300 423,748East Money Information Co. Ltd. (A Shares) 239,500 1,147,325Hong Kong Exchanges and Clearing Ltd. 136,400 8,607,592Kiwoom Securities Co. Ltd. 2,237 227,772Korea Investment Holdings Co. Ltd. 60,259 4,955,266Noah Holdings Ltd. sponsored ADR (a) 34,004 1,325,476VLS Finance Ltd. 24,557 66,517XP, Inc. Class A (a) 70,664 3,437,804
31,993,043Consumer Finance – 0.4%360 DigiTech, Inc. ADR (a) 152,580 3,478,824AEON Credit Service Bhd 2,000 5,802Bajaj Finance Ltd. 40,051 4,131,043Commercial Facilities Co. SAK 58,234 38,926Kaspi.KZ JSC:
unit (c) 50,616 5,790,470unit 69,699 7,973,566
Kruk SA 4,717 390,400Samsung Card Co. Ltd. 17,668 519,869Shriram Transport Finance Co. Ltd. 783,679 14,531,433
36,860,333Diversified Financial Services – 0.5%Chailease Holding Co. Ltd. 1,606,268 15,478,392FirstRand Ltd. 5,165,118 22,006,309Meritz Financial Holdings Co. 5,647 140,090Rec Ltd. 1,021,326 2,123,825Yuanta Financial Holding Co. Ltd. 16,703,960 15,099,761
54,848,377Insurance – 2.0%AIA Group Ltd. 6,893,584 82,314,406Cathay Financial Holding Co. Ltd. 360,000 775,817China Life Insurance Co. Ltd. (H Shares) 5,888,000 9,872,726China Pacific Insurance (Group) Co. Ltd. (H Shares) 2,122,600 5,976,887China Taiping Insurance Group Ltd. 1,238,600 1,809,140Fubon Financial Holding Co. Ltd. 3,701,000 11,374,928

17 Semi-Annual Report
See accompanying notes which are an integral part of the financial statements.
Common Stocks – continuedShares Value
FINANCIALS – continuedInsurance – continuedHDFC Standard Life Insurance Co. Ltd. (c) 204,930 $ 2,016,264Hyundai Fire & Marine Insurance Co. Ltd. 49,606 1,095,787ICICI Lombard General Insurance Co. Ltd. (c) 26,092 570,332PICC Property & Casualty Co. Ltd. (H Shares) 11,168,000 10,094,702Ping An Insurance Group Co. of China Ltd. (H Shares) 5,465,500 42,319,819Porto Seguro SA 367,969 4,068,382Powszechny Zaklad Ubezpieczen SA 698,693 7,406,221Samsung Fire & Marine Insurance Co. Ltd. 63,119 12,308,942Sanlam Ltd. 2,396,896 10,632,887Sul America SA unit 231,520 1,314,132
203,951,372Thrifts & Mortgage Finance – 0.5%Housing Development Finance Corp. Ltd. 1,006,713 38,618,886LIC Housing Finance Ltd. 1,548,355 8,537,591
47,156,477
TOTAL FINANCIALS 1,157,632,875
HEALTH CARE – 1.7%Biotechnology – 0.1%InnoCare Pharma Ltd. (a) (c) 407,000 1,138,194Innovent Biologics, Inc. (a) (c) 225,000 1,813,898Remegen Co. Ltd. (H Shares) (a) (c) 47,500 613,794Zai Lab Ltd. (a) 94,300 13,454,370
17,020,256Health Care Equipment & Supplies – 0.3%Angelalign Technology, Inc. (c) 800 39,705Peijia Medical Ltd. (a) (c) 871,000 2,558,981Rayence Co. Ltd. 12,372 166,006Shenzhen Mindray Bio-Medical Electronics Co. Ltd. (A Shares) 457,425 23,222,778Top Glove Corp. Bhd 1,420,800 1,367,140
27,354,610Health Care Providers & Services – 0.3%Apollo Hospitals Enterprise Ltd. 21,145 1,440,434Bangkok Chain Hospital PCL 1,839,300 1,282,636Hapvida Participacoes e Investimentos SA (c) 4,199,747 11,955,650Mediclinic International PLC (a) 1,860,126 8,003,296National Medical Care Co. 37,993 672,604Neuca SA 233 56,879
18Semi-Annual Report
See accompanying notes which are an integral part of the financial statements.
Schedule of Investments (Unaudited) – continued
Common Stocks – continuedShares Value
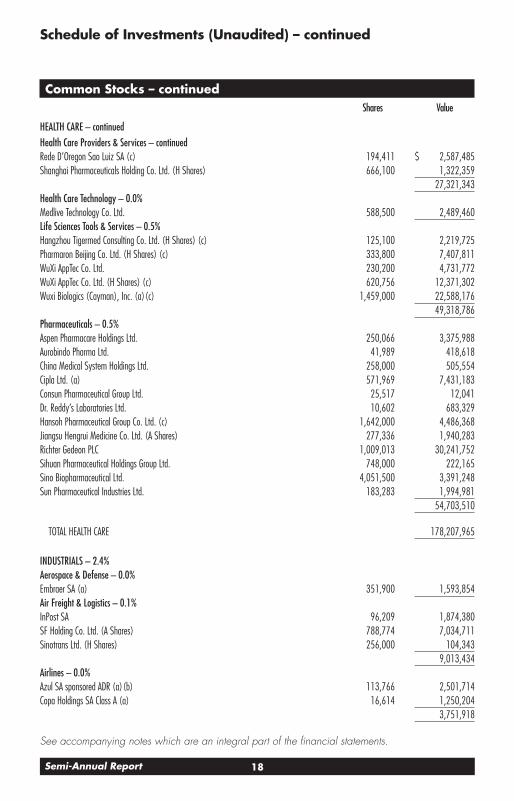
HEALTH CARE – continuedHealth Care Providers & Services – continuedRede D’Oregon Sao Luiz SA (c) 194,411 $ 2,587,485Shanghai Pharmaceuticals Holding Co. Ltd. (H Shares) 666,100 1,322,359
27,321,343Health Care Technology – 0.0%Medlive Technology Co. Ltd. 588,500 2,489,460Life Sciences Tools & Services – 0.5%Hangzhou Tigermed Consulting Co. Ltd. (H Shares) (c) 125,100 2,219,725Pharmaron Beijing Co. Ltd. (H Shares) (c) 333,800 7,407,811WuXi AppTec Co. Ltd. 230,200 4,731,772WuXi AppTec Co. Ltd. (H Shares) (c) 620,756 12,371,302Wuxi Biologics (Cayman), Inc. (a) (c) 1,459,000 22,588,176
49,318,786Pharmaceuticals – 0.5%Aspen Pharmacare Holdings Ltd. 250,066 3,375,988Aurobindo Pharma Ltd. 41,989 418,618China Medical System Holdings Ltd. 258,000 505,554Cipla Ltd. (a) 571,969 7,431,183Consun Pharmaceutical Group Ltd. 25,517 12,041Dr. Reddy’s Laboratories Ltd. 10,602 683,329Hansoh Pharmaceutical Group Co. Ltd. (c) 1,642,000 4,486,368Jiangsu Hengrui Medicine Co. Ltd. (A Shares) 277,336 1,940,283Richter Gedeon PLC 1,009,013 30,241,752Sihuan Pharmaceutical Holdings Group Ltd. 748,000 222,165Sino Biopharmaceutical Ltd. 4,051,500 3,391,248Sun Pharmaceutical Industries Ltd. 183,283 1,994,981
54,703,510
TOTAL HEALTH CARE 178,207,965
INDUSTRIALS – 2.4%Aerospace & Defense – 0.0%Embraer SA (a) 351,900 1,593,854Air Freight & Logistics – 0.1%InPost SA 96,209 1,874,380SF Holding Co. Ltd. (A Shares) 788,774 7,034,711Sinotrans Ltd. (H Shares) 256,000 104,343
9,013,434Airlines – 0.0%Azul SA sponsored ADR (a) (b) 113,766 2,501,714Copa Holdings SA Class A (a) 16,614 1,250,204
3,751,918

19 Semi-Annual Report
See accompanying notes which are an integral part of the financial statements.
Common Stocks – continuedShares Value
INDUSTRIALS – continuedBuilding Products – 0.1%Bawan Co. 67,521 $ 725,490Dare Power Dekor Home Co. Ltd. (A Shares) 1,207,978 2,445,610Everest Industries Ltd. 8,635 52,170HSIL Ltd. 19,766 59,270Kajaria Ceramics Ltd. 28,685 462,099LX Hausys Ltd. 1,397 106,200SCG Ceramics PCL NVDR (a) 567,400 49,591Sung Kwang Bend Co. Ltd. 9,981 77,770Xinyi Glass Holdings Ltd. 923,000 3,880,719ZBOM Home Collection Co. Ltd. 318,156 1,188,770Zhejiang Weixing New Building Materials Co. Ltd. (A Shares) 838,086 2,563,279
11,610,968Commercial Services & Supplies – 0.0%Binjiang Service Group Co. Ltd. 24,000 68,969China Everbright International Ltd. 153,000 105,837Country Garden Services Holdings Co. Ltd. 242,000 1,843,599Greentown Service Group Co. Ltd. 1,494,000 1,598,221UE Furniture Co. Ltd. 14,800 24,832
3,641,458Construction & Engineering – 0.4%Budimex SA 65 5,023China Railway Group Ltd. (H Shares) 3,212,993 1,540,925DL E&C Co. Ltd. (a) 15,458 1,880,722DL Holdings Co. Ltd. 2,851 177,864Hyundai Engineering & Construction Co. Ltd. 5,027 240,743Larsen & Toubro Ltd. 1,136,266 26,045,757Metallurgical Corp. China Ltd. (H Shares) 5,023,882 2,002,460Murray & Roberts Holdings Ltd. (a) 72,316 51,276Orascom Construction PLC 1,460 6,882Praj Industries Ltd. 21,698 98,867Sinopec Engineering Group Co. Ltd. (H Shares) 450,000 238,960Suzhou Gold Mantis Consolidated Co. Ltd. 1,238,300 1,360,832Voltas Ltd. 434,356 5,929,369
39,579,680Electrical Equipment – 0.2%China High Speed Transmission Equipment Group Co. Ltd. (a) 269,210 194,532DONGYANG E&P, Inc. 21,665 352,389Electrical Industries Co. 57,362 508,515Graphite India Ltd. 394,700 3,460,544Harbin Electric Machinery Co. Ltd.(H Shares) 98,000 32,257Hongfa Technology Co. Ltd. (A Shares) 372,726 3,595,897
20Semi-Annual Report
See accompanying notes which are an integral part of the financial statements.
Schedule of Investments (Unaudited) – continued
Common Stocks – continuedShares Value
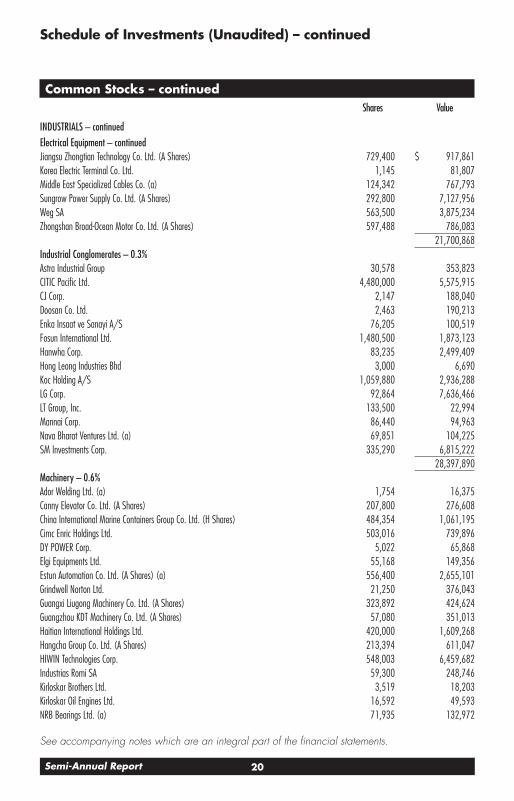
INDUSTRIALS – continuedElectrical Equipment – continuedJiangsu Zhongtian Technology Co. Ltd. (A Shares) 729,400 $ 917,861Korea Electric Terminal Co. Ltd. 1,145 81,807Middle East Specialized Cables Co. (a) 124,342 767,793Sungrow Power Supply Co. Ltd. (A Shares) 292,800 7,127,956Weg SA 563,500 3,875,234Zhongshan Broad-Ocean Motor Co. Ltd. (A Shares) 597,488 786,083
21,700,868Industrial Conglomerates – 0.3%Astra Industrial Group 30,578 353,823CITIC Pacific Ltd. 4,480,000 5,575,915CJ Corp. 2,147 188,040Doosan Co. Ltd. 2,463 190,213Enka Insaat ve Sanayi A/S 76,205 100,519Fosun International Ltd. 1,480,500 1,873,123Hanwha Corp. 83,235 2,499,409Hong Leong Industries Bhd 3,000 6,690Koc Holding A/S 1,059,880 2,936,288LG Corp. 92,864 7,636,466LT Group, Inc. 133,500 22,994Mannai Corp. 86,440 94,963Nava Bharat Ventures Ltd. (a) 69,851 104,225SM Investments Corp. 335,290 6,815,222
28,397,890Machinery – 0.6%Ador Welding Ltd. (a) 1,754 16,375Canny Elevator Co. Ltd. (A Shares) 207,800 276,608China International Marine Containers Group Co. Ltd. (H Shares) 484,354 1,061,195Cimc Enric Holdings Ltd. 503,016 739,896DY POWER Corp. 5,022 65,868Elgi Equipments Ltd. 55,168 149,356Estun Automation Co. Ltd. (A Shares) (a) 556,400 2,655,101Grindwell Norton Ltd. 21,250 376,043Guangxi Liugong Machinery Co. Ltd. (A Shares) 323,892 424,624Guangzhou KDT Machinery Co. Ltd. (A Shares) 57,080 351,013Haitian International Holdings Ltd. 420,000 1,609,268Hangcha Group Co. Ltd. (A Shares) 213,394 611,047HIWIN Technologies Corp. 548,003 6,459,682Industrias Romi SA 59,300 248,746Kirloskar Brothers Ltd. 3,519 18,203Kirloskar Oil Engines Ltd. 16,592 49,593NRB Bearings Ltd. (a) 71,935 132,972
21 Semi-Annual Report
See accompanying notes which are an integral part of the financial statements.
Common Stocks – continuedShares Value
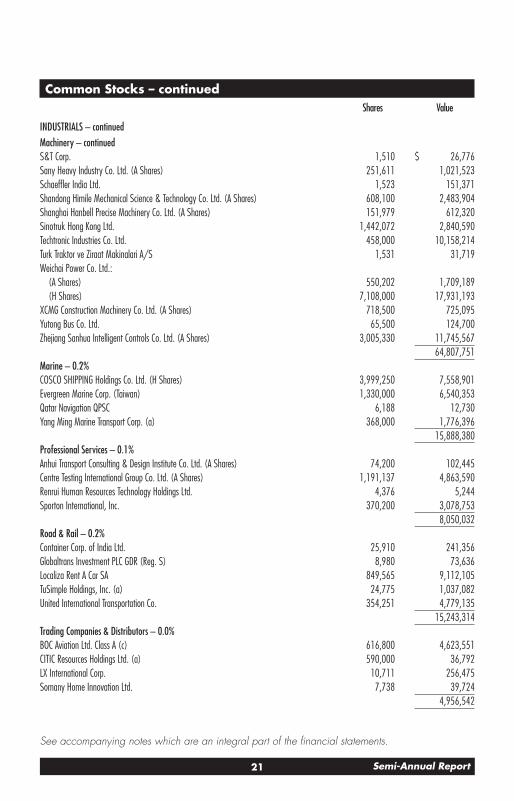
INDUSTRIALS – continuedMachinery – continuedS&T Corp. 1,510 $ 26,776Sany Heavy Industry Co. Ltd. (A Shares) 251,611 1,021,523Schaeffler India Ltd. 1,523 151,371Shandong Himile Mechanical Science & Technology Co. Ltd. (A Shares) 608,100 2,483,904Shanghai Hanbell Precise Machinery Co. Ltd. (A Shares) 151,979 612,320Sinotruk Hong Kong Ltd. 1,442,072 2,840,590Techtronic Industries Co. Ltd. 458,000 10,158,214Turk Traktor ve Ziraat Makinalari A/S 1,531 31,719Weichai Power Co. Ltd.:
(A Shares) 550,202 1,709,189(H Shares) 7,108,000 17,931,193
XCMG Construction Machinery Co. Ltd. (A Shares) 718,500 725,095Yutong Bus Co. Ltd. 65,500 124,700Zhejiang Sanhua Intelligent Controls Co. Ltd. (A Shares) 3,005,330 11,745,567
64,807,751Marine – 0.2%COSCO SHIPPING Holdings Co. Ltd. (H Shares) 3,999,250 7,558,901Evergreen Marine Corp. (Taiwan) 1,330,000 6,540,353Qatar Navigation QPSC 6,188 12,730Yang Ming Marine Transport Corp. (a) 368,000 1,776,396
15,888,380Professional Services – 0.1%Anhui Transport Consulting & Design Institute Co. Ltd. (A Shares) 74,200 102,445Centre Testing International Group Co. Ltd. (A Shares) 1,191,137 4,863,590Renrui Human Resources Technology Holdings Ltd. 4,376 5,244Sporton International, Inc. 370,200 3,078,753
8,050,032Road & Rail – 0.2%Container Corp. of India Ltd. 25,910 241,356Globaltrans Investment PLC GDR (Reg. S) 8,980 73,636Localiza Rent A Car SA 849,565 9,112,105TuSimple Holdings, Inc. (a) 24,775 1,037,082United International Transportation Co. 354,251 4,779,135
15,243,314Trading Companies & Distributors – 0.0%BOC Aviation Ltd. Class A (c) 616,800 4,623,551CITIC Resources Holdings Ltd. (a) 590,000 36,792LX International Corp. 10,711 256,475Somany Home Innovation Ltd. 7,738 39,724
4,956,542
22Semi-Annual Report
See accompanying notes which are an integral part of the financial statements.
Schedule of Investments (Unaudited) – continued
Common Stocks – continuedShares Value
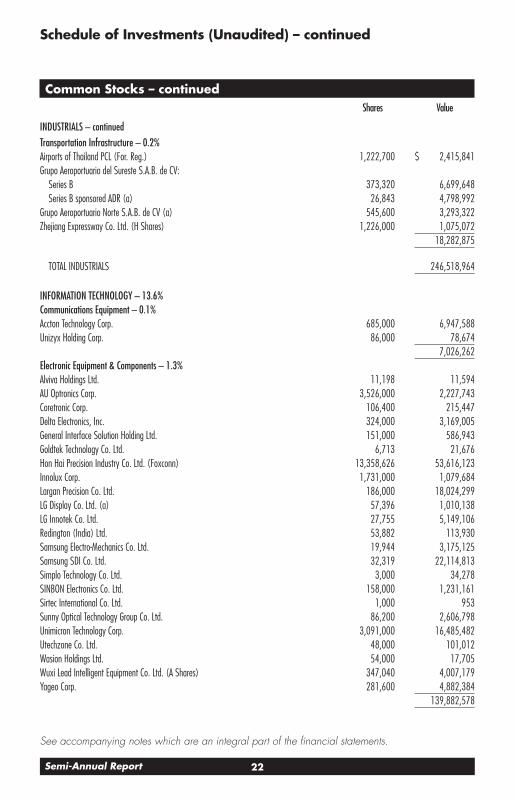
INDUSTRIALS – continuedTransportation Infrastructure – 0.2%Airports of Thailand PCL (For. Reg.) 1,222,700 $ 2,415,841Grupo Aeroportuario del Sureste S.A.B. de CV:
Series B 373,320 6,699,648Series B sponsored ADR (a) 26,843 4,798,992
Grupo Aeroportuario Norte S.A.B. de CV (a) 545,600 3,293,322Zhejiang Expressway Co. Ltd. (H Shares) 1,226,000 1,075,072
18,282,875
TOTAL INDUSTRIALS 246,518,964
INFORMATION TECHNOLOGY – 13.6%Communications Equipment – 0.1%Accton Technology Corp. 685,000 6,947,588Unizyx Holding Corp. 86,000 78,674
7,026,262Electronic Equipment & Components – 1.3%Alviva Holdings Ltd. 11,198 11,594AU Optronics Corp. 3,526,000 2,227,743Coretronic Corp. 106,400 215,447Delta Electronics, Inc. 324,000 3,169,005General Interface Solution Holding Ltd. 151,000 586,943Goldtek Technology Co. Ltd. 6,713 21,676Hon Hai Precision Industry Co. Ltd. (Foxconn) 13,358,626 53,616,123Innolux Corp. 1,731,000 1,079,684Largan Precision Co. Ltd. 186,000 18,024,299LG Display Co. Ltd. (a) 57,396 1,010,138LG Innotek Co. Ltd. 27,755 5,149,106Redington (India) Ltd. 53,882 113,930Samsung Electro-Mechanics Co. Ltd. 19,944 3,175,125Samsung SDI Co. Ltd. 32,319 22,114,813Simplo Technology Co. Ltd. 3,000 34,278SINBON Electronics Co. Ltd. 158,000 1,231,161Sirtec International Co. Ltd. 1,000 953Sunny Optical Technology Group Co. Ltd. 86,200 2,606,798Unimicron Technology Corp. 3,091,000 16,485,482Utechzone Co. Ltd. 48,000 101,012Wasion Holdings Ltd. 54,000 17,705Wuxi Lead Intelligent Equipment Co. Ltd. (A Shares) 347,040 4,007,179Yageo Corp. 281,600 4,882,384
139,882,578

23 Semi-Annual Report
See accompanying notes which are an integral part of the financial statements.
Common Stocks – continuedShares Value
INFORMATION TECHNOLOGY – continuedIT Services – 1.6%Digital China Holdings Ltd. (H Shares) 653,000 $ 407,209Globant SA (a) 38,053 12,263,721HCL Technologies Ltd. 686,474 11,125,525Hinduja Global Solutions Ltd. 1,905 71,838Infosys Ltd. 1,200,518 28,041,101Infosys Ltd. sponsored ADR 1,838,932 43,803,360MindTree Consulting Ltd. 111,574 5,547,652Mphasis BFL Ltd. 81,525 3,238,716Network International Holdings PLC (a) (c) 505,549 2,719,051PagSeguro Digital Ltd. (a) 140,224 8,339,121StoneCo Ltd. Class A (a) 71,202 3,313,741Systex Corp. 33,000 102,141Tata Consultancy Services Ltd. 362,040 18,791,331Tech Mahindra Ltd. 612,308 12,150,727Wipro Ltd. 1,232,209 10,813,852WNS Holdings Ltd. sponsored ADR (a) 13,554 1,124,169
161,853,255Semiconductors & Semiconductor Equipment – 7.3%Advanced Analog Technology, Inc. 51,000 163,755Alcor Micro Corp. 226,000 416,763Ardentec Corp. 343,000 890,490ASE Technology Holding Co. Ltd. 3,521,000 16,247,827ASML Holding NV (Netherlands) 6,515 5,433,430ChipMOS TECHNOLOGIES, Inc. 216,000 459,242D&O Green Technologies Bhd 37,600 46,943eGalax_eMPIA Technology, Inc. 99,910 308,155Elan Microelectronics Corp. 69,000 392,953eMemory Technology, Inc. 307,000 18,094,084Everlight Electronics Co. Ltd. 73,000 146,232Generalplus Technology, Inc. 41,000 110,891Global Unichip Corp. 226,000 3,534,314Greatek Electronics, Inc. 49,000 158,928Himax Technologies, Inc. sponsored ADR (b) 112,555 1,324,772JMicron Technology Corp. (a) 7,834 56,512King Yuan Electronics Co. Ltd. 1,448,000 2,387,504LONGi Green Energy Technology Co. Ltd. 739,052 10,233,503Lx Semicon Co. Ltd. 9,519 948,693Macroblock, Inc. 68,000 631,906Macronix International Co. Ltd. 73,000 106,375Malaysian Pacific Industries Bhd 12,286 130,101MediaTek, Inc. 2,506,000 81,642,537

24Semi-Annual Report
See accompanying notes which are an integral part of the financial statements.
Schedule of Investments (Unaudited) – continued
Common Stocks – continuedShares Value
INFORMATION TECHNOLOGY – continuedSemiconductors & Semiconductor Equipment – continuedMLS Co. Ltd. (A Shares) 552,731 $ 1,434,721Nanya Technology Corp. 252,000 605,033Novatek Microelectronics Corp. 318,000 5,162,786Parade Technologies Ltd. 6,000 379,664Phison Electronics Corp. 57,000 880,062Powertech Technology, Inc. 807,000 3,282,742Radiant Opto-Electronics Corp. 462,000 1,653,818Raydium Semiconductor Corp. 45,280 627,070Realtek Semiconductor Corp. 895,000 17,928,478Sigurd Microelectronics Corp. 212,000 498,264Silergy Corp. 167,000 24,033,121Silicon Motion Tech Corp. sponsored ADR 8,585 640,956SK Hynix, Inc. 553,469 50,862,192Sonix Technology Co. Ltd. 222,000 726,461Taiwan Semiconductor Manufacturing Co. Ltd. 18,791,900 413,061,837Taiwan Semiconductor Manufacturing Co. Ltd. sponsored ADR 486,907 57,946,802United Microelectronics Corp. 6,093,000 13,835,021Vanguard International Semiconductor Corp. 1,616,000 8,647,961ViTrox Corp. Bhd 6,000 27,048Winbond Electronics Corp. 1,629,000 1,737,616
747,837,563Software – 0.1%Asseco Poland SA 16,805 368,116Avast PLC (c) 555,857 4,568,507Birlasoft Ltd. 33,607 192,149Cheetah Mobile, Inc. ADR (a) (b) 13,583 27,573Cyient Ltd. 29,158 390,680Genesis Technology, Inc. 15,000 35,255KPIT Engineering Ltd. 63,382 292,622Nucleus Software Exports Ltd. 31,536 238,494Oracle Financial Services Soft 1,081 69,639Shenzhen Kingdom Sci-Tech Co. Ltd. (A Shares) 259,103 495,691
6,678,726Technology Hardware, Storage & Peripherals – 3.2%Acer, Inc. 427,000 389,080ASUSTeK Computer, Inc. 330,000 3,866,069Chicony Electronics Co. Ltd. 62,000 175,984Compal Electronics, Inc. 1,420,000 1,175,803Getac Technology Corp. 131,818 249,280Lenovo Group Ltd. 8,802,000 9,755,542Lite-On Technology Corp. 2,172,000 4,806,422

25 Semi-Annual Report
See accompanying notes which are an integral part of the financial statements.
Common Stocks – continuedShares Value
INFORMATION TECHNOLOGY – continuedTechnology Hardware, Storage & Peripherals – continuedMicro-Star International Co. Ltd. 397,000 $ 1,873,319Qisda Corp. 197,000 211,916Samsung Electronics Co. Ltd. 4,565,271 302,144,081Wiwynn Corp. 81,000 2,840,975Xiaomi Corp. Class B (a) (c) 1,790,800 5,756,385
333,244,856
TOTAL INFORMATION TECHNOLOGY 1,396,523,240
MATERIALS – 3.8%Chemicals – 0.7%China BlueChemical Ltd. (H Shares) 162,000 50,199China Risun Group Ltd. Class H 238,000 168,001China Sanjiang Fine Chemicals Ltd. 329,000 131,559China XLX Fertiliser Ltd. 138,724 103,096Fertilizantes Heringer SA (a) 86,500 396,132Finolex Industries Ltd. (a) 24,457 56,306Formosa Plastics Corp. 902,000 3,343,036Fufeng Group Ltd. 437,000 166,879Gujarat Narmada Valley Fertilizers Co. 54,694 249,362Gujarat State Fertilizers & Chemicals Ltd. 97,251 136,043Hansol Chemical Co. Ltd. 60,668 15,207,505Kolon Industries, Inc. 19,850 1,490,157LG Chemical Ltd. 37,369 24,441,781Mangalore Chemicals & Fertilizers Ltd. (a) 50,959 52,390National Fertilizers Ltd. (a) 63,071 47,162National Industrialization Co. (a) 108,426 603,603Phillips Carbon Black Ltd. 197,247 659,734PhosAgro OJSC GDR (Reg. S) 42,690 840,993Polyplex Corp. Ltd. 8,102 168,518Saudi Basic Industries Corp. 214,894 7,047,208Saudi Industrial Investment Group 259,082 2,479,815Saudi Kayan Petrochemical Co. (a) 423,737 2,103,603Shandong Sinocera Functional Material Co. Ltd. (A Shares) 389,683 2,760,056Sharda Cropchem Ltd. 25,945 112,243Sinopec Shanghai Petrochemical Co. Ltd. (H Shares) 224,000 48,386Sociedad Quimica y Minera de Chile SA (PN-B) sponsored ADR 71,784 3,743,536Solar Industries India Ltd. 203,700 4,884,963Taekwang Industrial Co. Ltd. 168 160,186
26Semi-Annual Report
See accompanying notes which are an integral part of the financial statements.
Schedule of Investments (Unaudited) – continued
Common Stocks – continuedShares Value
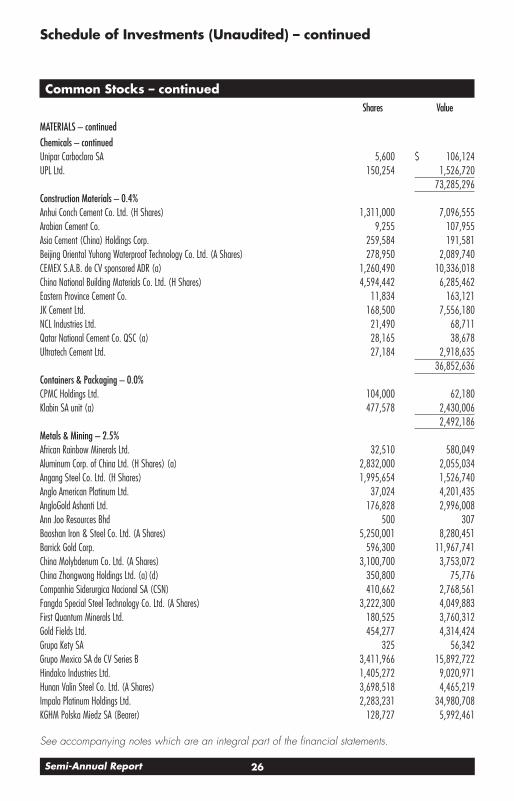
MATERIALS – continuedChemicals – continuedUnipar Carbocloro SA 5,600 $ 106,124UPL Ltd. 150,254 1,526,720
73,285,296Construction Materials – 0.4%Anhui Conch Cement Co. Ltd. (H Shares) 1,311,000 7,096,555Arabian Cement Co. 9,255 107,955Asia Cement (China) Holdings Corp. 259,584 191,581Beijing Oriental Yuhong Waterproof Technology Co. Ltd. (A Shares) 278,950 2,089,740CEMEX S.A.B. de CV sponsored ADR (a) 1,260,490 10,336,018China National Building Materials Co. Ltd. (H Shares) 4,594,442 6,285,462Eastern Province Cement Co. 11,834 163,121JK Cement Ltd. 168,500 7,556,180NCL Industries Ltd. 21,490 68,711Qatar National Cement Co. QSC (a) 28,165 38,678Ultratech Cement Ltd. 27,184 2,918,635
36,852,636Containers & Packaging – 0.0%CPMC Holdings Ltd. 104,000 62,180Klabin SA unit (a) 477,578 2,430,006
2,492,186Metals & Mining – 2.5%African Rainbow Minerals Ltd. 32,510 580,049Aluminum Corp. of China Ltd. (H Shares) (a) 2,832,000 2,055,034Angang Steel Co. Ltd. (H Shares) 1,995,654 1,526,740Anglo American Platinum Ltd. 37,024 4,201,435AngloGold Ashanti Ltd. 176,828 2,996,008Ann Joo Resources Bhd 500 307Baoshan Iron & Steel Co. Ltd. (A Shares) 5,250,001 8,280,451Barrick Gold Corp. 596,300 11,967,741China Molybdenum Co. Ltd. (A Shares) 3,100,700 3,753,072China Zhongwang Holdings Ltd. (a) (d) 350,800 75,776Companhia Siderurgica Nacional SA (CSN) 410,662 2,768,561Fangda Special Steel Technology Co. Ltd. (A Shares) 3,222,300 4,049,883First Quantum Minerals Ltd. 180,525 3,760,312Gold Fields Ltd. 454,277 4,314,424Grupa Kety SA 325 56,342Grupo Mexico SA de CV Series B 3,411,966 15,892,722Hindalco Industries Ltd. 1,405,272 9,020,971Hunan Valin Steel Co. Ltd. (A Shares) 3,698,518 4,465,219Impala Platinum Holdings Ltd. 2,283,231 34,980,708KGHM Polska Miedz SA (Bearer) 128,727 5,992,461
27 Semi-Annual Report
See accompanying notes which are an integral part of the financial statements.
Common Stocks – continuedShares Value
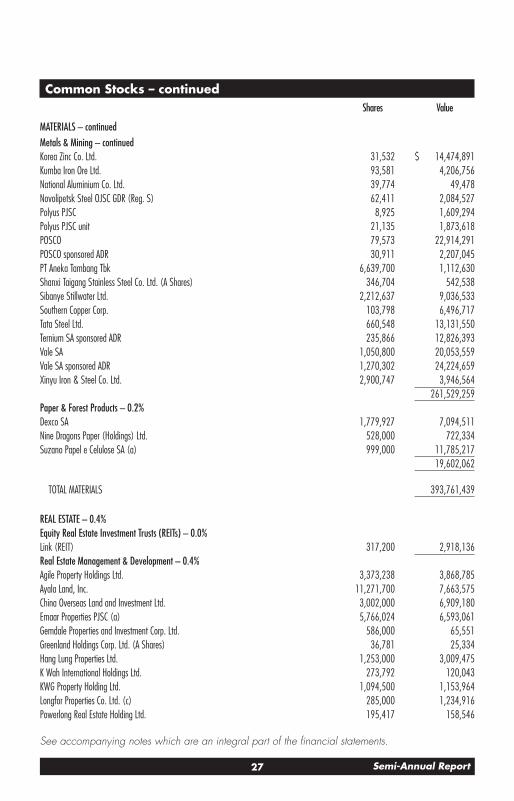
MATERIALS – continuedMetals & Mining – continuedKorea Zinc Co. Ltd. 31,532 $ 14,474,891Kumba Iron Ore Ltd. 93,581 4,206,756National Aluminium Co. Ltd. 39,774 49,478Novolipetsk Steel OJSC GDR (Reg. S) 62,411 2,084,527Polyus PJSC 8,925 1,609,294Polyus PJSC unit 21,135 1,873,618POSCO 79,573 22,914,291POSCO sponsored ADR 30,911 2,207,045PT Aneka Tambang Tbk 6,639,700 1,112,630Shanxi Taigang Stainless Steel Co. Ltd. (A Shares) 346,704 542,538Sibanye Stillwater Ltd. 2,212,637 9,036,533Southern Copper Corp. 103,798 6,496,717Tata Steel Ltd. 660,548 13,131,550Ternium SA sponsored ADR 235,866 12,826,393Vale SA 1,050,800 20,053,559Vale SA sponsored ADR 1,270,302 24,224,659Xinyu Iron & Steel Co. Ltd. 2,900,747 3,946,564
261,529,259Paper & Forest Products – 0.2%Dexco SA 1,779,927 7,094,511Nine Dragons Paper (Holdings) Ltd. 528,000 722,334Suzano Papel e Celulose SA (a) 999,000 11,785,217
19,602,062
TOTAL MATERIALS 393,761,439
REAL ESTATE – 0.4%Equity Real Estate Investment Trusts (REITs) – 0.0%Link (REIT) 317,200 2,918,136Real Estate Management & Development – 0.4%Agile Property Holdings Ltd. 3,373,238 3,868,785Ayala Land, Inc. 11,271,700 7,663,575China Overseas Land and Investment Ltd. 3,002,000 6,909,180Emaar Properties PJSC (a) 5,766,024 6,593,061Gemdale Properties and Investment Corp. Ltd. 586,000 65,551Greenland Holdings Corp. Ltd. (A Shares) 36,781 25,334Hang Lung Properties Ltd. 1,253,000 3,009,475K Wah International Holdings Ltd. 273,792 120,043KWG Property Holding Ltd. 1,094,500 1,153,964Longfor Properties Co. Ltd. (c) 285,000 1,234,916Powerlong Real Estate Holding Ltd. 195,417 158,546
28Semi-Annual Report
See accompanying notes which are an integral part of the financial statements.
Schedule of Investments (Unaudited) – continued
Common Stocks – continuedShares Value
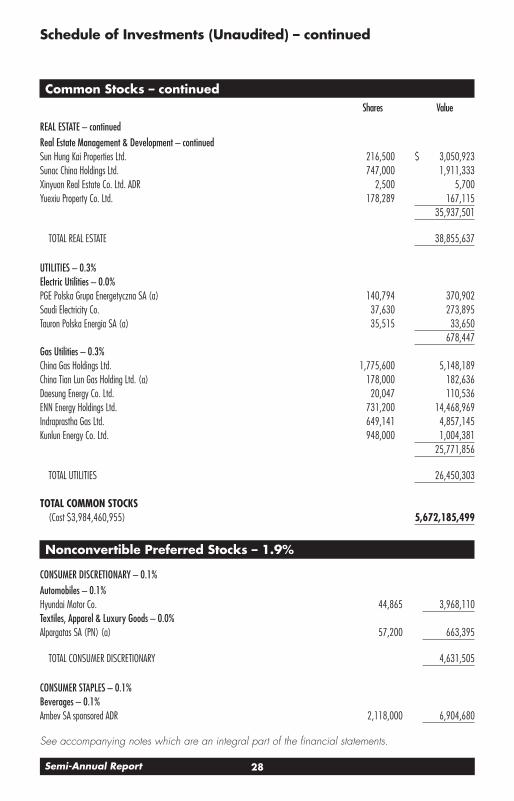
REAL ESTATE – continuedReal Estate Management & Development – continuedSun Hung Kai Properties Ltd. 216,500 $ 3,050,923Sunac China Holdings Ltd. 747,000 1,911,333Xinyuan Real Estate Co. Ltd. ADR 2,500 5,700Yuexiu Property Co. Ltd. 178,289 167,115
35,937,501
TOTAL REAL ESTATE 38,855,637
UTILITIES – 0.3%Electric Utilities – 0.0%PGE Polska Grupa Energetyczna SA (a) 140,794 370,902Saudi Electricity Co. 37,630 273,895Tauron Polska Energia SA (a) 35,515 33,650
678,447Gas Utilities – 0.3%China Gas Holdings Ltd. 1,775,600 5,148,189China Tian Lun Gas Holding Ltd. (a) 178,000 182,636Daesung Energy Co. Ltd. 20,047 110,536ENN Energy Holdings Ltd. 731,200 14,468,969Indraprastha Gas Ltd. 649,141 4,857,145Kunlun Energy Co. Ltd. 948,000 1,004,381
25,771,856
TOTAL UTILITIES 26,450,303
TOTAL COMMON STOCKS(Cost $3,984,460,955) 5,672,185,499
Nonconvertible Preferred Stocks – 1.9%
CONSUMER DISCRETIONARY – 0.1%Automobiles – 0.1%Hyundai Motor Co. 44,865 3,968,110Textiles, Apparel & Luxury Goods – 0.0%Alpargatas SA (PN) (a) 57,200 663,395
TOTAL CONSUMER DISCRETIONARY 4,631,505
CONSUMER STAPLES – 0.1%Beverages – 0.1%Ambev SA sponsored ADR 2,118,000 6,904,680

29 Semi-Annual Report
See accompanying notes which are an integral part of the financial statements.
Nonconvertible Preferred Stocks – continuedShares Value
ENERGY – 0.3%Oil, Gas & Consumable Fuels – 0.3%Petroleo Brasileiro SA - Petrobras:
(PN) (non-vtg.) 1,753,700 $ 9,221,610(PN) sponsored ADR (non-vtg.) 309,181 3,249,492sponsored ADR 1,670,905 18,112,610
30,583,712
FINANCIALS – 0.8%Banks – 0.8%Banco Bradesco SA (PN) 819,523 3,669,057Banco do Estado Rio Grande do Sul SA Class B 51,110 123,357Itau Unibanco Holding SA 7,731,936 46,264,814Itau Unibanco Holding SA sponsored ADR 2,931,595 17,384,358Itausa-Investimentos Itau SA (PN) 8,043,846 17,983,070Sberbank of Russia 145,250 614,846Sberbank of Russia (Russia) 128,031 541,958
86,581,460
INDUSTRIALS – 0.1%Aerospace & Defense – 0.0%Forjas Taurus SA (a) 149,300 649,080Airlines – 0.1%Azul SA (a) 1,176,100 8,581,700
TOTAL INDUSTRIALS 9,230,780
INFORMATION TECHNOLOGY – 0.3%Technology Hardware, Storage & Peripherals – 0.3%Samsung Electronics Co. Ltd. 455,559 27,831,080
MATERIALS – 0.2%Chemicals – 0.1%Braskem SA (PN-A) (a) 281,026 3,586,467LG Chemical Ltd. 11,485 3,428,935Unipar Carbocloro SA 21,300 372,507
7,387,909Metals & Mining – 0.1%Bradespar SA (PN) 37,400 456,759Gerdau SA 2,562,960 14,037,098
30Semi-Annual Report
See accompanying notes which are an integral part of the financial statements.
Schedule of Investments (Unaudited) – continued
Nonconvertible Preferred Stocks – continuedShares Value
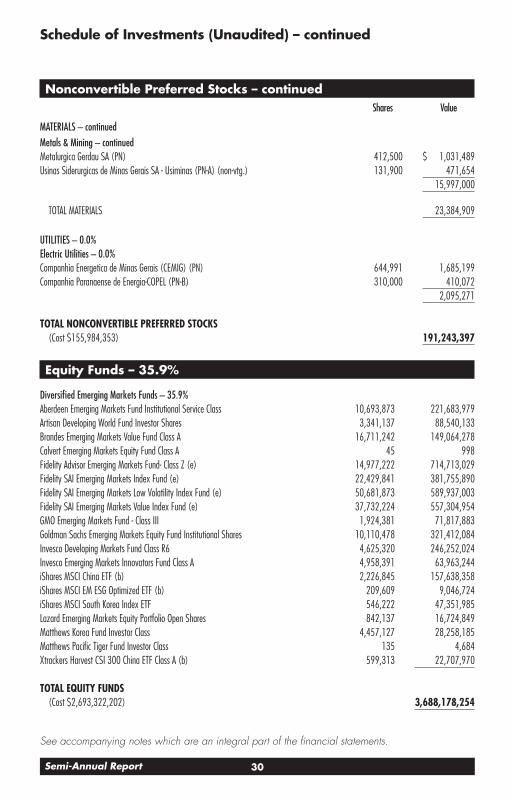
MATERIALS – continuedMetals & Mining – continuedMetalurgica Gerdau SA (PN) 412,500 $ 1,031,489Usinas Siderurgicas de Minas Gerais SA - Usiminas (PN-A) (non-vtg.) 131,900 471,654
15,997,000
TOTAL MATERIALS 23,384,909
UTILITIES – 0.0%Electric Utilities – 0.0%Companhia Energetica de Minas Gerais (CEMIG) (PN) 644,991 1,685,199Companhia Paranaense de Energia-COPEL (PN-B) 310,000 410,072
2,095,271
TOTAL NONCONVERTIBLE PREFERRED STOCKS(Cost $155,984,353) 191,243,397
Equity Funds – 35.9%
Diversified Emerging Markets Funds – 35.9%Aberdeen Emerging Markets Fund Institutional Service Class 10,693,873 221,683,979Artisan Developing World Fund Investor Shares 3,341,137 88,540,133Brandes Emerging Markets Value Fund Class A 16,711,242 149,064,278Calvert Emerging Markets Equity Fund Class A 45 998Fidelity Advisor Emerging Markets Fund- Class Z (e) 14,977,222 714,713,029Fidelity SAI Emerging Markets Index Fund (e) 22,429,841 381,755,890Fidelity SAI Emerging Markets Low Volatility Index Fund (e) 50,681,873 589,937,003Fidelity SAI Emerging Markets Value Index Fund (e) 37,732,224 557,304,954GMO Emerging Markets Fund - Class III 1,924,381 71,817,883Goldman Sachs Emerging Markets Equity Fund Institutional Shares 10,110,478 321,412,084Invesco Developing Markets Fund Class R6 4,625,320 246,252,024Invesco Emerging Markets Innovators Fund Class A 4,958,391 63,963,244iShares MSCI China ETF (b) 2,226,845 157,638,358iShares MSCI EM ESG Optimized ETF (b) 209,609 9,046,724iShares MSCI South Korea Index ETF 546,222 47,351,985Lazard Emerging Markets Equity Portfolio Open Shares 842,137 16,724,849Matthews Korea Fund Investor Class 4,457,127 28,258,185Matthews Pacific Tiger Fund Investor Class 135 4,684Xtrackers Harvest CSI 300 China ETF Class A (b) 599,313 22,707,970
TOTAL EQUITY FUNDS(Cost $2,693,322,202) 3,688,178,254

31 Semi-Annual Report
See accompanying notes which are an integral part of the financial statements.
Other – 0.1%Shares Value
Commodity Funds – Broad Basket – 0.1%Fidelity SAI Inflation-Focused Fund (e)
(Cost $6,768,588) 858,825 $ 11,310,724
U.S. Treasury Obligations – 0.3%Principal Amount
U.S. Treasury Bills, yield at date of purchase 0.02% to 0.05% 9/9/21 to 11/26/21 (f)(Cost $33,497,801) $ 33,500,000 $ 33,497,323
Money Market Funds – 8.2%Shares
Fidelity Cash Central Fund 0.06% (g) 6,181,976 6,183,212Fidelity Securities Lending Cash Central Fund 0.06% (g) (h) 183,205,540 183,223,861State Street Institutional U.S. Government Money Market Fund Premier Class 0.03% (i) 650,148,437 650,148,437
TOTAL MONEY MARKET FUNDS(Cost $839,555,510) 839,555,510
TOTAL INVESTMENT IN SECURITIES – 101.7%(Cost $7,713,589,409) 10,435,970,707
NET OTHER ASSETS (LIABILITIES) – (1.7)% (175,035,570)
NET ASSETS – 100% $10,260,935,137
Futures ContractsNumber
of contractsExpiration
DateNotional Amount
Value Unrealized Appreciation/ (Depreciation)
Purchased
Equity Index ContractsICE E-mini MSCI Emerging Markets Index Contracts
(United States) 8,790 Sept. 2021 $ 570,998,400 $ 776,408 $ 776,408
The notional amount of futures purchased as a percentage of Net Assets is 5.6%
For the period, the average monthly notional amount at value for futures contracts in the aggregate was $296,423,365.
32Semi-Annual Report
See accompanying notes which are an integral part of the financial statements.
Schedule of Investments (Unaudited) – continued
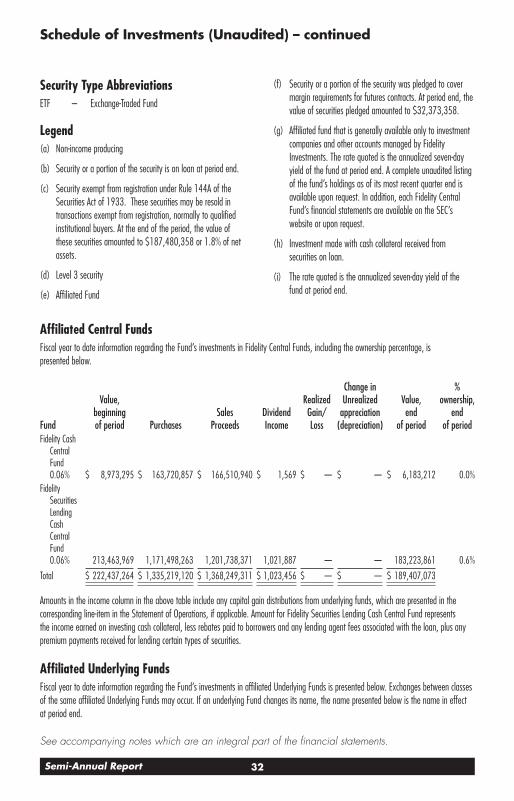
Security Type AbbreviationsETF – Exchange-Traded Fund
Legend(a) Non-income producing
(b) Security or a portion of the security is on loan at period end.
(c) Security exempt from registration under Rule 144A of the Securities Act of 1933. These securities may be resold in transactions exempt from registration, normally to qualified institutional buyers. At the end of the period, the value of these securities amounted to $187,480,358 or 1.8% of net assets.
(d) Level 3 security
(e) Affiliated Fund
(f) Security or a portion of the security was pledged to cover margin requirements for futures contracts. At period end, the value of securities pledged amounted to $32,373,358.
(g) Affiliated fund that is generally available only to investment companies and other accounts managed by Fidelity Investments. The rate quoted is the annualized seven-day yield of the fund at period end. A complete unaudited listing of the fund’s holdings as of its most recent quarter end is available upon request. In addition, each Fidelity Central Fund’s financial statements are available on the SEC’s website or upon request.
(h) Investment made with cash collateral received from securities on loan.
(i) The rate quoted is the annualized seven-day yield of the fund at period end.
Affiliated Central FundsFiscal year to date information regarding the Fund’s investments in Fidelity Central Funds, including the ownership percentage, is presented below.
Fund
Value, beginning of period Purchases
Sales Proceeds
Dividend Income
Realized Gain/Loss
Change in Unrealized
appreciation (depreciation)
Value, end
of period
% ownership,
end of period
Fidelity Cash Central Fund 0.06% $ 8,973,295 $ 163,720,857 $ 166,510,940 $ 1,569 $ — $ — $ 6,183,212 0.0%
Fidelity Securities Lending Cash Central Fund 0.06% 213,463,969 1,171,498,263 1,201,738,371 1,021,887 — — 183,223,861 0.6%
Total $ 222,437,264 $ 1,335,219,120 $ 1,368,249,311 $ 1,023,456 $ — $ — $ 189,407,073
Amounts in the income column in the above table include any capital gain distributions from underlying funds, which are presented in the corresponding line-item in the Statement of Operations, if applicable. Amount for Fidelity Securities Lending Cash Central Fund represents the income earned on investing cash collateral, less rebates paid to borrowers and any lending agent fees associated with the loan, plus any premium payments received for lending certain types of securities.
Affiliated Underlying FundsFiscal year to date information regarding the Fund’s investments in affiliated Underlying Funds is presented below. Exchanges between classes of the same affiliated Underlying Funds may occur. If an underlying Fund changes its name, the name presented below is the name in effect at period end.

33 Semi-Annual Report
See accompanying notes which are an integral part of the financial statements.
Affiliate
Value, beginning of period Purchases
Sales Proceeds
Dividend Income
Realized Gain (loss)
Change in Unrealized
appreciation (depreciation)
Value, end
of periodFidelity Advisor Emerging
Markets Fund – Class Z $ — $ — $ — $ — $ — $ 307,130,258 $ 714,713,029
Fidelity Emerging Markets Fund 684,589,409 30,000,000 — — — (307,006,638) —
Fidelity SAI Emerging Markets Index Fund 438,038,233 — 50,000,000 — 17,889,027 (24,171,370) 381,755,890
Fidelity SAI Emerging Markets Low Volatility Index Fund 518,268,483 27,000,000 — — — 44,668,520 589,937,003
Fidelity SAI Emerging Markets Value Index Fund 323,147,760 218,000,000 — — — 16,157,194 557,304,954
Fidelity SAI Inflation-Focused Fund 9,687,545 — — — — 1,623,179 11,310,724
Total $ 1,973,731,430 $ 275,000,000 $ 50,000,000 $ — $ 17,889,027 $ 38,401,143 $ 2,255,021,600
Investment ValuationThe following is a summary of the inputs used, as of August 31, 2021, involving the Fund’s assets and liabilities carried at fair value. The inputs or methodology used for valuing securities may not be an indication of the risk associated with investing in those securities. For more information on valuation inputs, and their aggregation into the levels used below, please refer to the Investment Valuation section in the accompanying Notes to Financial Statements.
Valuation Inputs at Reporting Date:Description Total Level 1 Level 2 Level 3Investments in Securities:Equities:
Communication Services $ 603,228,201 $ 246,059,648 $ 357,168,553 $ —Consumer Discretionary 1,043,328,022 856,542,754 186,756,685 28,583Consumer Staples 376,032,602 371,333,019 4,699,583 —Energy 253,766,148 229,125,338 24,634,948 5,862Financials 1,244,214,335 917,529,720 326,684,615 —Health Care 178,207,965 141,482,090 36,725,875 —Industrials 255,749,744 255,749,744 — —Information Technology 1,424,354,320 933,683,371 490,670,949 —Materials 417,146,348 340,773,574 76,296,998 75,776Real Estate 38,855,637 38,855,637 — —Utilities 28,545,574 28,545,574 — —
Equity Funds 3,688,178,254 3,688,178,254 — —Other 11,310,724 11,310,724 — —Other Short-Term Investments 33,497,323 — 33,497,323 —Money Market Funds 839,555,510 839,555,510 — —Total Investments in Securities: $ 10,435,970,707 $ 8,898,724,957 $ 1,537,135,529 $ 110,221
34Semi-Annual Report
See accompanying notes which are an integral part of the financial statements.
Schedule of Investments (Unaudited) – continued
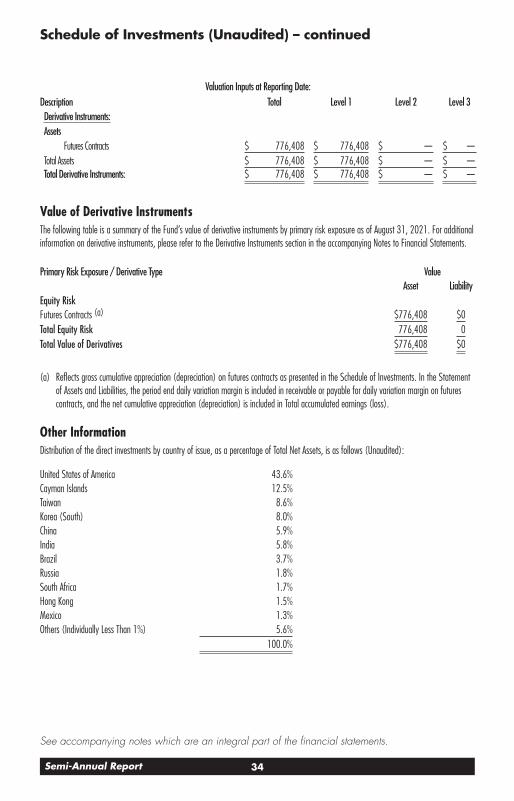
Valuation Inputs at Reporting Date:Description Total Level 1 Level 2 Level 3Derivative Instruments:Assets
Futures Contracts $ 776,408 $ 776,408 $ — $ —Total Assets $ 776,408 $ 776,408 $ — $ —Total Derivative Instruments: $ 776,408 $ 776,408 $ — $ —
Value of Derivative InstrumentsThe following table is a summary of the Fund’s value of derivative instruments by primary risk exposure as of August 31, 2021. For additional information on derivative instruments, please refer to the Derivative Instruments section in the accompanying Notes to Financial Statements.
Primary Risk Exposure / Derivative Type ValueAsset Liability
Equity Risk Futures Contracts (a) $ 776,408 $ 0Total Equity Risk 776,408 0Total Value of Derivatives $ 776,408 $ 0
(a) Reflects gross cumulative appreciation (depreciation) on futures contracts as presented in the Schedule of Investments. In the Statement of Assets and Liabilities, the period end daily variation margin is included in receivable or payable for daily variation margin on futures contracts, and the net cumulative appreciation (depreciation) is included in Total accumulated earnings (loss).
Other InformationDistribution of the direct investments by country of issue, as a percentage of Total Net Assets, is as follows (Unaudited):
United States of America 43.6%Cayman Islands 12.5%Taiwan 8.6%Korea (South) 8.0%China 5.9%India 5.8%Brazil 3.7%Russia 1.8%South Africa 1.7%Hong Kong 1.5%Mexico 1.3%Others (Individually Less Than 1%) 5.6%
100.0%
35 Semi-Annual Report
See accompanying notes which are an integral part of the financial statements.
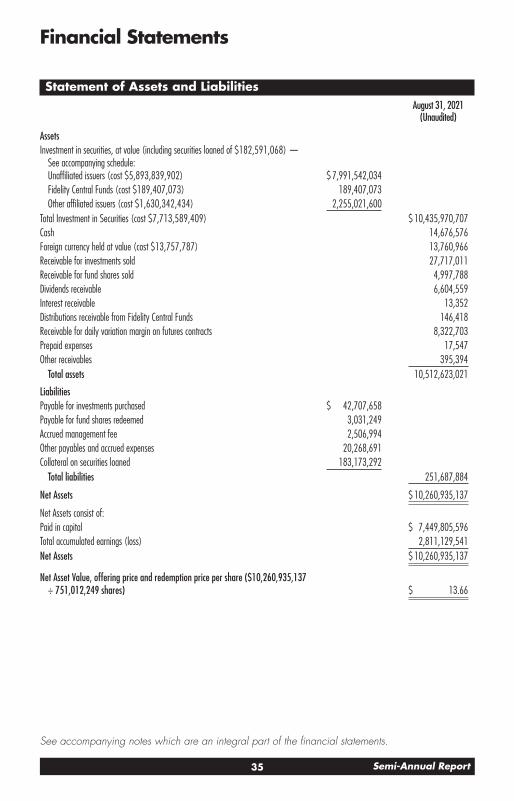
Financial Statements
Statement of Assets and LiabilitiesAugust 31, 2021
(Unaudited)
Assets Investment in securities, at value (including securities loaned of $182,591,068) —
See accompanying schedule: Unaffiliated issuers (cost $5,893,839,902) $ 7,991,542,034Fidelity Central Funds (cost $189,407,073) 189,407,073Other affiliated issuers (cost $1,630,342,434) 2,255,021,600
Total Investment in Securities (cost $7,713,589,409) $ 10,435,970,707Cash 14,676,576Foreign currency held at value (cost $13,757,787) 13,760,966Receivable for investments sold 27,717,011Receivable for fund shares sold 4,997,788Dividends receivable 6,604,559Interest receivable 13,352Distributions receivable from Fidelity Central Funds 146,418Receivable for daily variation margin on futures contracts 8,322,703Prepaid expenses 17,547Other receivables 395,394
Total assets 10,512,623,021
Liabilities Payable for investments purchased $ 42,707,658Payable for fund shares redeemed 3,031,249Accrued management fee 2,506,994Other payables and accrued expenses 20,268,691Collateral on securities loaned 183,173,292
Total liabilities 251,687,884
Net Assets $ 10,260,935,137
Net Assets consist of: Paid in capital $ 7,449,805,596Total accumulated earnings (loss) 2,811,129,541Net Assets $ 10,260,935,137
Net Asset Value, offering price and redemption price per share ($10,260,935,137 ÷ 751,012,249 shares) $ 13.66

36Semi-Annual Report
See accompanying notes which are an integral part of the financial statements.
Financial Statements – continued
Statement of OperationsSix months ended August 31, 2021
(Unaudited)
Investment Income Dividends:
Unaffiliated issuers $ 82,940,598Interest 43,051Income from Fidelity Central Funds (including $1,021,887 from security lending) 1,023,456
Income before foreign taxes withheld 84,007,105Less foreign taxes withheld (8,994,585)
Total income 75,012,520
Expenses Management fee $ 27,437,339Custodian fees and expenses 757,770Independent trustees’ fees and expenses 37,123Registration fees 197,353Audit 55,061Legal 12,468Miscellaneous 30,700
Total expenses before reductions 28,527,814Expense reductions (12,465,092)Total expenses after reductions 16,062,722
Net investment income (loss) 58,949,798Realized and Unrealized Gain (Loss) Net realized gain (loss) on:
Investment securities: Unaffiliated issuers (net of foreign taxes of $230,788) 71,603,792Affiliated issuers 17,889,027
Foreign currency transactions (2,130,193)Futures contracts 6,218,498
Total net realized gain (loss) 93,581,124Change in net unrealized appreciation (depreciation) on:
Investment securities: Unaffiliated issuers (net of increase in deferred foreign taxes of $7,293,072) (310,512,361)Affiliated issuers 38,401,143
Assets and liabilities in foreign currencies 379,205Futures contracts (1,091,376)
Total change in net unrealized appreciation (depreciation) (272,823,389)Net gain (loss) (179,242,265)Net increase (decrease) in net assets resulting from operations $ (120,292,467)

37 Semi-Annual Report
See accompanying notes which are an integral part of the financial statements.
Statement of Changes in Net AssetsSix months ended
August 31, 2021 (Unaudited)
Year ended February 28,
2021Increase (Decrease) in Net Assets Operations
Net investment income (loss) $ 58,949,798 $ 91,514,399Net realized gain (loss) 93,581,124 219,539,578Change in net unrealized appreciation (depreciation) (272,823,389) 2,384,371,428Net increase (decrease) in net assets resulting from operations (120,292,467) 2,695,425,405
Distributions to shareholders (22,658,533) (90,024,462)Share transactions
Proceeds from sales of shares 1,690,313,139 3,358,154,783Reinvestment of distributions 20,736,407 81,913,668Cost of shares redeemed (521,394,703) (1,649,482,798)Net increase (decrease) in net assets resulting from share transactions 1,189,654,843 1,790,585,653Total increase (decrease) in net assets 1,046,703,843 4,395,986,596
Net Assets Beginning of period 9,214,231,294 4,818,244,698End of period $ 10,260,935,137 $ 9,214,231,294
Other Information Shares
Sold 123,290,401 324,339,792Issued in reinvestment of distributions 1,504,819 6,168,199Redeemed (37,601,573) (138,988,515)Net increase (decrease) 87,193,647 191,519,476
38Semi-Annual Report
See accompanying notes which are an integral part of the financial statements.
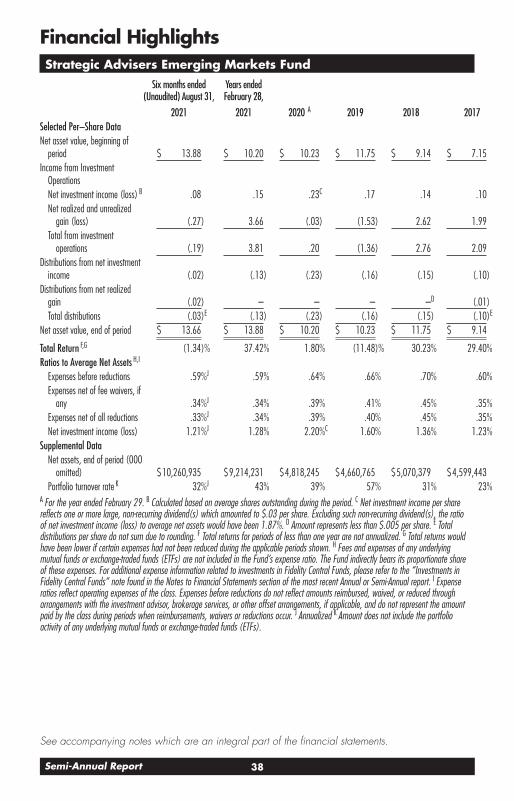
Financial HighlightsStrategic Advisers Emerging Markets Fund
Six months ended (Unaudited) August 31,
Years ended February 28,
2021 2021 2020 A 2019 2018 2017Selected Per–Share Data Net asset value, beginning of
period $ 13.88 $ 10.20 $ 10.23 $ 11.75 $ 9.14 $ 7.15Income from Investment
Operations Net investment income (loss) B .08 .15 .23C .17 .14 .10Net realized and unrealized
gain (loss) (.27) 3.66 (.03) (1.53) 2.62 1.99Total from investment
operations (.19) 3.81 .20 (1.36) 2.76 2.09Distributions from net investment
income (.02) (.13) (.23) (.16) (.15) (.10)Distributions from net realized
gain (.02) – – – –D (.01)Total distributions (.03)E (.13) (.23) (.16) (.15) (.10)E
Net asset value, end of period $ 13.66 $ 13.88 $ 10.20 $ 10.23 $ 11.75 $ 9.14
Total Return F,G (1.34)% 37.42% 1.80% (11.48)% 30.23% 29.40%Ratios to Average Net Assets H,I
Expenses before reductions .59%J .59% .64% .66% .70% .60%Expenses net of fee waivers, if
any .34%J .34% .39% .41% .45% .35%Expenses net of all reductions .33%J .34% .39% .40% .45% .35%Net investment income (loss) 1.21%J 1.28% 2.20%C 1.60% 1.36% 1.23%
Supplemental Data Net assets, end of period (000
omitted) $ 10,260,935 $ 9,214,231 $ 4,818,245 $ 4,660,765 $ 5,070,379 $ 4,599,443Portfolio turnover rate K 32%J 43% 39% 57% 31% 23%
A For the year ended February 29. B Calculated based on average shares outstanding during the period. C Net investment income per share reflects one or more large, non-recurring dividend(s) which amounted to $.03 per share. Excluding such non-recurring dividend(s), the ratio of net investment income (loss) to average net assets would have been 1.87%. D Amount represents less than $.005 per share. E Total distributions per share do not sum due to rounding. F Total returns for periods of less than one year are not annualized. G Total returns would have been lower if certain expenses had not been reduced during the applicable periods shown. H Fees and expenses of any underlying mutual funds or exchange-traded funds (ETFs) are not included in the Fund’s expense ratio. The Fund indirectly bears its proportionate share of these expenses. For additional expense information related to investments in Fidelity Central Funds, please refer to the “Investments in Fidelity Central Funds” note found in the Notes to Financial Statements section of the most recent Annual or Semi-Annual report. I Expense ratios reflect operating expenses of the class. Expenses before reductions do not reflect amounts reimbursed, waived, or reduced through arrangements with the investment advisor, brokerage services, or other offset arrangements, if applicable, and do not represent the amount paid by the class during periods when reimbursements, waivers or reductions occur. J Annualized K Amount does not include the portfolio activity of any underlying mutual funds or exchange-traded funds (ETFs).
39 Semi-Annual Report
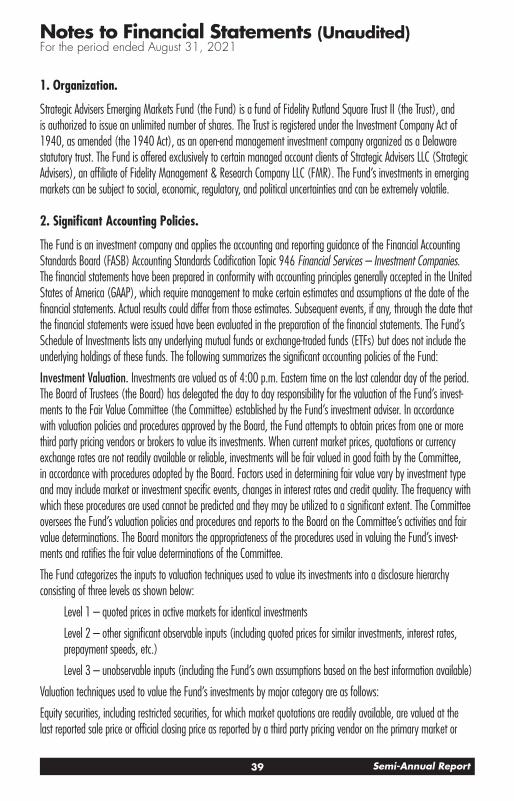
Notes to Financial Statements (Unaudited)For the period ended August 31, 2021
1. Organization.
Strategic Advisers Emerging Markets Fund (the Fund) is a fund of Fidelity Rutland Square Trust II (the Trust), and is authorized to issue an unlimited number of shares. The Trust is registered under the Investment Company Act of 1940, as amended (the 1940 Act), as an open-end management investment company organized as a Delaware statutory trust. The Fund is offered exclusively to certain managed account clients of Strategic Advisers LLC (Strategic Advisers), an affiliate of Fidelity Management & Research Company LLC (FMR). The Fund’s investments in emerging markets can be subject to social, economic, regulatory, and political uncertainties and can be extremely volatile.
2. Significant Accounting Policies.
The Fund is an investment company and applies the accounting and reporting guidance of the Financial Accounting Standards Board (FASB) Accounting Standards Codification Topic 946 Financial Services – Investment Companies. The financial statements have been prepared in conformity with accounting principles generally accepted in the United States of America (GAAP), which require management to make certain estimates and assumptions at the date of the financial statements. Actual results could differ from those estimates. Subsequent events, if any, through the date that the financial statements were issued have been evaluated in the preparation of the financial statements. The Fund’s Schedule of Investments lists any underlying mutual funds or exchange-traded funds (ETFs) but does not include the underlying holdings of these funds. The following summarizes the significant accounting policies of the Fund:
Investment Valuation. Investments are valued as of 4:00 p.m. Eastern time on the last calendar day of the period. The Board of Trustees (the Board) has delegated the day to day responsibility for the valuation of the Fund’s invest-ments to the Fair Value Committee (the Committee) established by the Fund’s investment adviser. In accordance with valuation policies and procedures approved by the Board, the Fund attempts to obtain prices from one or more third party pricing vendors or brokers to value its investments. When current market prices, quotations or currency exchange rates are not readily available or reliable, investments will be fair valued in good faith by the Committee, in accordance with procedures adopted by the Board. Factors used in determining fair value vary by investment type and may include market or investment specific events, changes in interest rates and credit quality. The frequency with which these procedures are used cannot be predicted and they may be utilized to a significant extent. The Committee oversees the Fund’s valuation policies and procedures and reports to the Board on the Committee’s activities and fair value determinations. The Board monitors the appropriateness of the procedures used in valuing the Fund’s invest-ments and ratifies the fair value determinations of the Committee.
The Fund categorizes the inputs to valuation techniques used to value its investments into a disclosure hierarchy consisting of three levels as shown below:
Level 1 – quoted prices in active markets for identical investments
Level 2 – other significant observable inputs (including quoted prices for similar investments, interest rates, prepayment speeds, etc.)
Level 3 – unobservable inputs (including the Fund’s own assumptions based on the best information available)
Valuation techniques used to value the Fund’s investments by major category are as follows:
Equity securities, including restricted securities, for which market quotations are readily available, are valued at the last reported sale price or official closing price as reported by a third party pricing vendor on the primary market or

40Semi-Annual Report
Notes to Financial Statements (Unaudited) – continued
exchange on which they are traded and are categorized as Level 1 in the hierarchy. In the event there were no sales during the day or closing prices are not available, securities are valued at the last quoted bid price or may be valued using the last available price and are generally categorized as Level 2 in the hierarchy. For foreign equity securities, when market or security specific events arise, comparisons to the valuation of American Depositary Receipts (ADRs), futures contracts, Exchange-Traded Funds (ETFs) and certain indexes as well as quoted prices for similar securities may be used and would be categorized as Level 2 in the hierarchy. For equity securities, including restricted securities, where observable inputs are limited, assumptions about market activity and risk are used and these securities may be categorized as Level 3 in the hierarchy.
Debt securities, including restricted securities, are valued based on evaluated prices received from third party pricing vendors or from brokers who make markets in such securities. U.S. government and government agency obligations are valued by pricing vendors who utilize matrix pricing which considers yield or price of bonds of comparable quality, coupon, maturity and type or by broker-supplied prices. When independent prices are unavailable or unreliable, debt securities may be valued utilizing pricing methodologies which consider similar factors that would be used by third party pricing vendors. Debt securities are generally categorized as Level 2 in the hierarchy but may be Level 3 depending on the circumstances. ETFs are valued at their last sale price or official closing price as reported by a third party pricing vendor on the primary market or exchange on which they are traded and are categorized as Level 1 in the hierarchy. In the event there were no sales during the day but the exchange reports a closing bid level, ETFs are valued at the closing bid and would be categorized as Level 1 in the hierarchy. In the event there was no closing bid, ETFs may be valued by another method that the Board believes reflects fair value in accordance with the Board’s fair value pricing policies and may be categorized as Level 2 in the hierarchy.
Futures contracts are valued at the settlement price established each day by the board of trade or exchange on which they are traded and are categorized as Level 1 in the hierarchy. Investments in open-end mutual funds, including the Fidelity Central Funds, are valued at their closing net asset value (NAV) each business day and are categorized as Level 1 in the hierarchy. If an unaffiliated open-end mutual fund’s NAV is unavailable, shares of that fund may be valued by another method that the Board believes reflects fair value in accordance with the Board’s fair value pricing policies and is categorized as Level 2 in the hierarchy.
Changes in valuation techniques may result in transfers in or out of an assigned level within the disclosure hierarchy. The aggregate value of investments by input level as of August 31, 2021 is included at the end of the Fund’s Schedule of Investments.
Foreign Currency. Certain Funds may use foreign currency contracts to facilitate transactions in foreign-denominated securities. Gains and losses from these transactions may arise from changes in the value of the foreign currency or if the counterparties do not perform under the contracts’ terms.
Foreign-denominated assets, including investment securities, and liabilities are translated into U.S. dollars at the exchange rates at period end. Purchases and sales of investment securities, income and dividends received, and expenses denominated in foreign currencies are translated into U.S. dollars at the exchange rate in effect on the transaction date.
The effects of exchange rate fluctuations on investments are included with the net realized and unrealized gain (loss) on investment securities. Other foreign currency transactions resulting in realized and unrealized gain (loss) are disclosed separately.
41 Semi-Annual Report
Investment Transactions and Income. For financial reporting purposes, the Fund’s investment holdings and NAV include trades executed through the end of the last business day of the period. The NAV per share for processing shareholder transactions is calculated as of the close of business of the New York Stock Exchange (NYSE), normally 4:00 p.m. Eastern time and includes trades executed through the end of the prior business day. Gains and losses on securities sold are determined on the basis of identified cost. Dividend income is recorded on the ex-dividend date, except for certain dividends from foreign securities where the ex-dividend date may have passed, which are recorded as soon as the Fund is informed of the ex-dividend date. Non-cash dividends included in dividend income, if any, are recorded at the fair market value of the securities received. Income and capital gain distributions from Fidelity Central Funds, if any, are recorded on the ex-dividend date. Income and capital gain distributions from any underlying mutual funds or exchange-traded funds (ETFs) are recorded on the ex-dividend date. Interest income is accrued as earned and includes coupon interest and amortization of premium and accretion of discount on debt securities as applicable. Investment income is recorded net of foreign taxes withheld where recovery of such taxes is uncertain.
Expenses. Expenses directly attributable to a fund are charged to that fund. Expenses attributable to more than one fund are allocated among the respective funds on the basis of relative net assets or other appropriate methods. Expenses included in the accompanying financial statements reflect the expenses of that fund and do not include any expenses associated with any underlying mutual funds or exchange-traded funds. Although not included in a fund’s expenses, a fund indirectly bears its proportionate share of these expenses through the net asset value of each underlying mutual fund or exchange-traded fund. Expense estimates are accrued in the period to which they relate and adjustments are made when actual amounts are known.
Deferred Trustee Compensation. Under a Deferred Compensation Plan (the Plan) for certain Funds, certain independent Trustees have elected to defer receipt of a portion of their annual compensation. Deferred amounts are invested in affiliated mutual funds, are marked-to-market and remain in a fund until distributed in accordance with the Plan. The investment of deferred amounts and the offsetting payable to the Trustees presented below are included in the accompanying Statement of Assets and Liabilities in other receivables and other payables and accrued expenses, as applicable.
Strategic Advisers Emerging Markets Fund $ 69,135
Income Tax Information and Distributions to Shareholders. Each year, the Fund intends to qualify as a regulated investment company under Subchapter M of the Internal Revenue Code, including distributing substantially all of its taxable income and realized gains. As a result, no provision for U.S. Federal income taxes is required. The Fund files a U.S. federal tax return, in addition to state and local tax returns as required. The Fund’s federal income tax returns are subject to examination by the Internal Revenue Service (IRS) for a period of three fiscal years after they are filed. State and local tax returns may be subject to examination for an additional fiscal year depending on the jurisdiction. Foreign taxes are provided for based on the Fund’s understanding of the tax rules and rates that exist in the foreign markets in which it invests. The Fund is subject to a tax imposed on capital gains by certain countries in which it invests. An estimated deferred tax liability for net unrealized appreciation on the applicable securities is included in Other payables and accrued expenses on the Statement of Assets & Liabilities.
Distributions are declared and recorded on the ex-dividend date. Income and capital gain distributions are determined in accordance with income tax regulations, which may differ from GAAP.

42Semi-Annual Report
Notes to Financial Statements (Unaudited) – continued
Capital accounts within the financial statements are adjusted for permanent book-tax differences. These adjustments have no impact on net assets or the results of operations. Capital accounts are not adjusted for temporary book-tax differences which will reverse in a subsequent period.
Book-tax differences are primarily due to futures contracts, foreign currency transactions, certain foreign taxes, passive foreign investment companies (PFIC), market discount, partnerships, deferred trustees compensation, capital loss carryforwards and losses due to wash sales and excise tax regulations.
As of period end, the cost and unrealized appreciation (depreciation) in securities, and derivatives if applicable, for federal income tax purposes were as follows:
Gross unrealized appreciation $ 2,922,197,654Gross unrealized depreciation (230,290,688)Net unrealized appreciation (depreciation) $ 2,691,906,966
Tax cost $ 7,744,840,149
Restricted Securities (including Private Placements). Funds may invest in securities that are subject to legal or contractual restrictions on resale. These securities generally may be resold in transactions exempt from registration or to the public if the securities are registered. Disposal of these securities may involve time-consuming negotiations and expense, and prompt sale at an acceptable price may be difficult. Information regarding restricted securities held at period end is included at the end of the Schedule of Investments, if applicable.
3. Derivative Instruments.
Risk Exposures and the Use of Derivative Instruments. The Fund’s investment objective allows the Fund to enter into various types of derivative contracts, including futures contracts. Derivatives are investments whose value is primarily derived from underlying assets, indices or reference rates and may be transacted on an exchange or over-the-counter (OTC). Derivatives may involve a future commitment to buy or sell a specified asset based on specified terms, to exchange future cash flows at periodic intervals based on a notional principal amount, or for one party to make one or more payments upon the occurrence of specified events in exchange for periodic payments from the other party.
The Fund used derivatives to increase returns and to manage exposure to certain risks as defined below. The success of any strategy involving derivatives depends on analysis of numerous economic factors, and if the strategies for investment do not work as intended, the Fund may not achieve its objectives.
The Fund’s use of derivatives increased or decreased its exposure to the following risk:
Equity Risk Equity risk relates to the fluctuations in the value of financial instruments as a result of changes in market prices (other than those arising from interest rate risk or foreign exchange risk), whether caused by factors specific to an individual investment, its issuer, or all factors affecting all instruments traded in a market or market segment.
The Fund is also exposed to additional risks from investing in derivatives, such as liquidity risk and counterparty credit risk. Liquidity risk is the risk that the Fund will be unable to close out the derivative in the open market in a timely manner. Counterparty credit risk is the risk that the counterparty will not be able to fulfill its obligation to the Fund.

43 Semi-Annual Report
Counterparty credit risk related to exchange-traded futures contracts may be mitigated by the protection provided by the exchange on which they trade.
Investing in derivatives may involve greater risks than investing in the underlying assets directly and, to varying degrees, may involve risk of loss in excess of any initial investment and collateral received and amounts recognized in the Statement of Assets and Liabilities. In addition, there may be the risk that the change in value of the derivative contract does not correspond to the change in value of the underlying instrument.
Futures Contracts. A futures contract is an agreement between two parties to buy or sell a specified underlying instru-ment for a fixed price at a specified future date. The Fund used futures contracts to manage its exposure to the stock market.
Upon entering into a futures contract, a fund is required to deposit either cash or securities (initial margin) with a clearing broker in an amount equal to a certain percentage of the face value of the contract. Futures contracts are marked-to-market daily and subsequent daily payments (variation margin) are made or received by a fund depending on the daily fluctuations in the value of the futures contracts and are recorded as unrealized appreciation or (deprecia-tion). This receivable and/or payable, if any, is included in daily variation margin on futures contracts in the Statement of Assets and Liabilities. Realized gain or (loss) is recorded upon the expiration or closing of a futures contract. The net realized gain (loss) and change in net unrealized appreciation (depreciation) on futures contracts during the period is presented in the Statement of Operations.
Any open futures contracts at period end are presented in the Schedule of Investments under the caption “Futures Contracts”. The notional amount at value reflects each contract’s exposure to the underlying instrument or index at period end. Securities deposited to meet initial margin requirements are identified in the Schedule of Investments.
4. Purchases and Sales of Investments.
Purchases and sales of securities, other than short-term securities and in-kind transactions, as applicable, are noted in the table below.
Purchases ($) Sales ($)Strategic Advisers Emerging Markets Fund 2,215,704,632 1,514,528,553
5. Fees and Other Transactions with Affiliates.
Management Fee. Strategic Advisers (the investment adviser) provides the Fund with investment management related services. For these services, the Fund pays a monthly management fee to the investment adviser. The management fee is calculated by adding the annual management fee rate of .25% of the Fund’s average net assets throughout the month to the aggregate of the fee rates, payable monthly by the investment adviser, to the Fund’s sub-advisers. The Fund’s maximum aggregate management fee will not exceed 1.20% of the Fund’s average net assets. For the reporting period, the total annualized management fee rate was .56% of the Fund’s average net assets.
During the period, the investment adviser waived a portion of its management fee as described in the Expense Reductions note.
44Semi-Annual Report
Notes to Financial Statements (Unaudited) – continued
Sub-Advisers. Acadian Asset Management LLC, Causeway Capital Management, LLC, FIAM LLC (an affiliate of the investment adviser), FIL Investment Advisors, Schroder Investment Management North America, Inc., Somerset Capital Management LLP and T. Rowe Price Associates, Inc. each served as a sub-adviser for the Fund during the period. Sub-advisers provide discretionary investment advisory services for their allocated portion of the Fund’s assets and are paid as described in the Management Fee note.
Geode Capital Management, LLC (Geode) has been retained to serve as a sub-adviser for the Fund. As of the date of this report, however, Geode has not been allocated any portion of the Fund’s assets. Geode in the future may provide discretionary investment advisory services for an allocated portion of the Fund’s assets and will be paid by the invest-ment adviser for providing these services.
Brokerage Commissions. A portion of portfolio transactions were placed with brokerage firms which are affiliates of the investment adviser. Brokerage commissions are included in net realized gain (loss) and change in net unrealized appreciation (depreciation) in the Statement of Operations. The commissions paid to these affiliated firms were as follows:
AmountStrategic Advisers Emerging Markets Fund $ 5,019
Interfund Trades. Funds may purchase from or sell securities to other funds affiliated with each sub-adviser under procedures adopted by the Board. The procedures have been designed to ensure these interfund trades are executed in accordance with Rule 17a-7 of the 1940 Act. Any interfund trades are included within the respective purchases and sales amounts shown in the Purchases and Sales of Investments note and are noted in the table below.
Purchases ($) Sales ($)Strategic Advisers Emerging Markets Fund 12,102,671 3,918,241
6. Investments in Fidelity Central Funds.
Funds may invest in Fidelity Central Funds, which are open-end investment companies generally available only to other investment companies and accounts managed by the investment adviser and its affiliates. The Schedule of Investments lists any Fidelity Central Funds held as an investment as of period end, but does not include the underly-ing holdings of each Fidelity Central Fund. An investing fund indirectly bears its proportionate share of the expenses of the underlying Fidelity Central Funds.
Based on its investment objective, each Fidelity Central Fund may invest or participate in various investment vehicles or strategies that are similar to those of the investing fund. These strategies are consistent with the investment objec-tives of the investing fund and may involve certain economic risks which may cause a decline in value of each of the Fidelity Central Funds and thus a decline in the value of the investing fund.

45 Semi-Annual Report
Fidelity Central Fund Investment Manager Investment Objective Investment Practices Expense Ratio(a)
Fidelity Money Market Central Funds
Fidelity Management & Research Company LLC (FMR)
Each fund seeks to obtain a high level of current income consistent with the preservation of capital and liquidity.
Short-term Investments Less than .005% to .01%
(a) Expenses expressed as a percentage of average net assets and are as of each underlying Central Fund’s most recent annual or semi-annual shareholder report.
A complete unaudited list of holdings for each Fidelity Central Fund is available upon request or at the Securities and Exchange Commission website at www.sec.gov. In addition, the financial statements of the Fidelity Central Funds, which are not covered by the Report of Independent Registered Public Accounting Firm, are available on the Securities and Exchange Commission website or upon request.
7. Committed Line of Credit.
Certain Funds participate with other funds managed by the investment adviser or an affiliate in a $4.25 billion credit facility (the “line of credit”) to be utilized for temporary or emergency purposes to fund shareholder redemptions or for other short-term liquidity purposes. The participating funds have agreed to pay commitment fees on their pro-rata portion of the line of credit, which are reflected in Miscellaneous expenses on the Statement of Operations, and are listed below. During the period, there were no borrowings on this line of credit.
AmountStrategic Advisers Emerging Markets Fund $ 8,828
8. Security Lending.
Funds lend portfolio securities through a lending agent from time to time in order to earn additional income. On the settlement date of the loan, a fund receives collateral (in the form of U.S. Treasury obligations, letters of credit and/or cash) against the loaned securities and maintains collateral in an amount not less than 100% of the market value of the loaned securities during the period of the loan. The market value of the loaned securities is determined at the close of business of a fund and any additional required collateral is delivered to a fund on the next business day. A fund or borrower may terminate the loan at any time, and if the borrower defaults on its obligation to return the securities loaned because of insolvency or other reasons, a fund may apply collateral received from the borrower against the obligation. A fund may experience delays and costs in recovering the securities loaned. Any cash collateral received is invested in the Fidelity Securities Lending Cash Central Fund. Any loaned securities are identified as such in the Schedule of Investments, and the value of loaned securities and cash collateral at period end, as applicable, are presented in the Statement of Assets and Liabilities. Security lending income represents the income earned on investing cash collateral, less rebates paid to borrowers and any lending agent fees associated with the loan, plus any premium payments received for lending certain types of securities. Security lending income is presented in the Statement of Operations as a component of income from Fidelity Central Funds.

46Semi-Annual Report
Notes to Financial Statements (Unaudited) – continued
9. Expense Reductions.
The investment adviser has contractually agreed to waive the Fund’s management fee in an amount equal to .25% of the Fund’s average net assets until September 30, 2024. During the period, this waiver reduced the Fund’s manage-ment fee by $12,141,679.
Commissions paid to certain brokers with whom the investment adviser, or its affiliates, places trades on behalf of the Fund include an amount in addition to trade execution, which may be rebated back to the Fund to offset expenses. This amount totaled $323,413 for the period.
10. Other.
Fund’s organizational documents provide former and current trustees and officers with a limited indemnification against liabilities arising in connection with the performance of their duties to the fund. In the normal course of business, the fund may also enter into contracts that provide general indemnifications. The fund’s maximum exposure under these arrangements is unknown as this would be dependent on future claims that may be made against the fund. The risk of material loss from such claims is considered remote.
Funds do not invest in underlying mutual funds for the purpose of exercising management or control; however, investments by funds within their principal investment strategies may represent a significant portion of the underlying mutual fund’s net assets. At the end of the period, certain Funds were the owners of record of 10% or more of the total outstanding shares of the following underlying mutual funds as shown below.
FundStrategic Advisers Emerging
Markets FundFidelity SAI Emerging Markets Low Volatility Index Fund 33%Fidelity SAI Emerging Markets Value Index Fund 29%
11. Coronavirus (COVID-19) Pandemic.
An outbreak of COVID-19 first detected in China during December 2019 has since spread globally and was declared a pandemic by the World Health Organization during March 2020. Developments that disrupt global economies and financial markets, such as the COVID-19 pandemic, may magnify factors that affect the Fund’s performance.

47 Semi-Annual Report
Shareholder Expense Example
As a shareholder, you incur two types of costs: (1) transaction costs, which may include sales charges (loads) on purchase payments or redemption proceeds, as applicable and (2) ongoing costs, which generally include manage-ment fees, distribution and/or service (12b-1) fees and other Fund expenses. This Example is intended to help you understand your ongoing costs (in dollars) of investing in a fund and to compare these costs with the ongoing costs of investing in other mutual funds.The Example is based on an investment of $1,000 invested at the beginning of the period and held for the entire period (March 1, 2021 to August 31, 2021).Actual ExpensesThe first line of the accompanying table provides information about actual account values and actual expenses. You may use the information in this line, together with the amount you invested, to estimate the expenses that you paid over the period. Simply divide your account value by $1,000.00 (for example, an $8,600 account value divided by $1,000.00 = 8.6), then multiply the result by the number in the first line for a class/Fund under the heading entitled “Expenses Paid During Period” to estimate the expenses you paid on your account during this period. If any fund is a shareholder of any underlying mutual funds or exchange-traded funds (ETFs) (the Underlying Funds), such fund indirectly bears its proportional share of the expenses of the Underlying Funds in addition to the direct expenses incurred presented in the table. These fees and expenses are not included in the annualized expense ratio used to calculate the expense estimate in the table below.Hypothetical Example for Comparison PurposesThe second line of the accompanying table provides information about hypothetical account values and hypothetical expenses based on the actual expense ratio and an assumed rate of return of 5% per year before expenses, which is not the actual return. The hypothetical account values and expenses may not be used to estimate the actual ending account balance or expenses you paid for the period. You may use this information to compare the ongoing costs of investing in the Fund and other funds. To do so, compare this 5% hypothetical example with the 5% hypothetical examples that appear in the shareholder reports of the other funds. If any fund is a shareholder of any Underlying Funds, such fund indirectly bears its proportional share of the expenses of the Underlying Funds in addition to the direct expenses as presented in the table. These fees and expenses are not included in the annualized expense ratio used to calculate the expense estimate in the table below.Please note that the expenses shown in the table are meant to highlight your ongoing costs only and do not reflect any transaction costs. Therefore, the second line of the table is useful in comparing ongoing costs only, and will not help you determine the relative total costs of owning different funds.
Annualized Expense Ratio- A
Beginning Account Value March 1, 2021
Ending Account Value
August 31, 2021
Expenses Paid During Period- B
March 1, 2021 to August 31, 2021
Strategic Advisers Emerging Markets Fund .34%
Actual $1,000.00 $986.60 $1.70Hypothetical- C $1,000.00 $1,023.49 $1.73
A Annualized expense ratio reflects expenses net of applicable fee waivers.B Expenses are equal to the annualized expense ratio, multiplied by the average account value over the period, multiplied by 184/ 365
(to reflect the one-half year period). The fees and expenses of any Underlying Funds are not included in each annualized expense ratio.C 5% return per year before expenses
48Semi-Annual Report
Board Approval of New Sub-Subadvisory AgreementStrategic Advisers Emerging Markets Fund
In March 2021, the Board of Trustees, including the Independent Trustees (together, the Board) voted to approve a new sub-subadvisory agreement among T. Rowe Price Associates, Inc. (TRPA) and T. Rowe Price Singapore Private Ltd. (T. Rowe Singapore) with respect to the fund (New Agreement). The Board, assisted by the advice of fund counsel and Independent Trustees’ counsel, considered a broad range of information.
In considering whether to approve the New Agreement, the Board reached a determination, with the assistance of fund counsel and Independent Trustees’ counsel and through the exercise of its business judgment, that the approval of the New Agreement is in the best interests of the fund and its shareholders and does not involve a conflict of interest from which Strategic Advisers or its affiliates derive an inappropriate advantage. Also, the Board found that the fees to be charged under the New Agreement bear a reasonable relationship to the services to be rendered and will be based on services provided that will be in addition to, rather than duplicative of services provided under the advisory contract of any underlying fund in which the fund may invest. The Board’s decision to approve the New Agreement was not based on any single factor, but rather was based on a comprehensive consideration of all the information provided to the Board. In addition, individual Trustees did not necessarily attribute the same weight or importance to each factor.
Nature, Extent, and Quality of Services Provided. The Board considered the backgrounds of the investment personnel that will provide services to the fund, and also considered the fund’s investment objective, strategies and related investment philosophy and current sub-adviser line-up. The Board also considered the structures of the invest-ment personnel compensation programs and whether such structures provide appropriate incentives to act in the best interests of the fund.
The Board noted that the New Agreement is for T. Rowe Singapore to act a sub-subadviser to the fund alongside an existing sub-sub-adviser, T. Rowe Price International Limited (T. Rowe International), for an existing investment mandate that is sub-advised by TRPA. The Board noted that it previously received and considered materials relating to the nature, extent and quality of services provided by Strategic Advisers, TRPA, and T. Rowe International, including the resources dedicated to investment management and support services, as well as shareholder and administrative services, in connection with its annual renewal of the fund’s management contract, sub-advisory agreements and sub-subadvisory agreements at its September 2020 meeting. The Board noted its familiarity with the nature, extent and quality of services provided by TRPA and T. Rowe International to the fund for the investment mandate, and to other Strategic Advisers funds for different investment mandates, and considered that other than the appointment of a new co-portfolio manager from T. Rowe Singapore for the investment mandate, the New Agreement will not result in any changes to (i) the nature, extent and quality of the sub-advisory or sub-subadvisory services provided; (ii) the investment process or strategies employed in the management of the fund’s assets; or (ii) the day-to-day manage-ment of the fund. The Board considered supplemental information provided by T. Rowe Singapore in the Board’s March 2021 materials.
Resources Dedicated to Investment Management and Support Services. The Board reviewed the general qualifica-tions and capabilities of T. Rowe Singapore’s investment staff, use of technology, and approach to managing and compensating investment personnel. The Board noted that T. Rowe Singapore’s analysts have extensive resources, tools, and capabilities that allow them to conduct sophisticated quantitative and/or fundamental analysis. Additionally, in its deliberations, the Board considered T. Rowe Singapore’s trading capabilities and resources and compliance
49 Semi-Annual Report
infrastructure, which are integral parts of the investment management process. The Board also considered T. Rowe Singapore’s investments in business continuity planning, and TRPA’s and T. Rowe International’s success in continu-ously providing services to the fund notwithstanding the severe disruptions caused by the COVID-19 pandemic.
Shareholder and Administrative Services. The Board considered: (i) the nature, extent, quality, and cost of advisory services to be performed by T. Rowe Singapore under the New Agreement; and (ii) the resources to be devoted to the fund’s compliance policies and procedures.
Investment Performance. The Board considered the historical investment performance of TRPA and T. Rowe International and their portfolio managers in managing the fund under the investment mandate, and that the approval of the New Agreement will not result in any changes (i) to the fund’s investment processes or strategies or (ii) except for the addition of a new T. Rowe Singapore co-portfolio manager, in the persons primarily responsible for the day-to-day management of the fund.
Based on its review, the Board concluded that the nature, extent, and quality of services that will be provided to the fund under the New Agreement should benefit the fund’s shareholders.
Competitiveness of Management Fee and Total Fund Expenses. The Board noted that the New Agreement will not result in changes to the maximum aggregate annual management fee payable by the fund or Strategic Advisers’ portion of the management fee. The Board considered Strategic Advisers’ contractual agreement to waive its portion of the fund’s management fee.
The Board considered that TRPA, and not the fund, will compensate T. Rowe Singapore under the terms of the New Agreement and that the fund and Strategic Advisers are not responsible for any such fees or expenses. The Board also considered that the New Agreement will not result in any changes to (i) the fees paid under the sub-advisory agree-ment among Strategic Advisers, TRPA, and the Trust on behalf of the fund, or (ii) the fact that TRPA, and not the fund, compensates T. Rowe International under the terms of the sub-subadvisory agreement between TRPA and T. Rowe International, for the existing investment mandate.
Based on its review, the Board concluded that the fund’s management fee structure and any changes to projected total expenses bear a reasonable relationship to the services that the fund and its shareholders will receive and the other factors considered.
Because the New Agreement was negotiated at arm’s length and will have no impact on the maximum management fees payable by the fund or Strategic Advisers’ portion of the management fee, the Board did not consider the costs of services and profitability to be significant factors in its decision to approve the New Agreement.
Potential Fall-Out Benefits. The Board considered that it reviews information regarding the potential of direct and indirect benefits to Strategic Advisers and its affiliates from their relationships with the fund, including non-advisory fee compensation paid to affiliates of Strategic Advisers, if any, as well as information regarding potential fall-out benefits accruing to each sub-adviser, if any, as a result of its relationship with the fund, during its annual renewal of the fund’s management contract, sub-advisory agreements, and sub-subadvisory agreements. The Board considered Strategic Advisers’ representation that it does not anticipate that the approval of the New Agreement will have a significant impact on the profitability of, or potential fall-out benefits to, Strategic Advisers or its affiliates.
Possible Economies of Scale. The Board considered that it reviews whether there have been economies of scale in connection with the management of the fund during its annual renewal of the fund’s management contract,

50Semi-Annual Report
Board Approval of New Sub-Subadvisory Agreement – continued
sub-advisory agreements, and sub-subadvisory agreements. The Board noted that it did not consider the possible realization of economies of scale to be a significant factor in its decision to approve the New Agreement because the fund will not bear any additional management fees or expenses under the New Agreement.
Conclusion. Based on its evaluation of all of the conclusions noted above, and after considering all factors it believed relevant, the Board concluded that the New Agreement’s fee structure bears a reasonable relationship to the services to be rendered and that the New Agreement is in the best interests of the fund and its shareholders and should be approved. The Board also concluded that the fees to be charged under the New Agreement will be based on services provided that will be in addition to, rather than duplicative of, services provided under the advisory contract of any underlying fund in which the fund may invest. In addition, the Board concluded that the approval of the New Agreement does not involve a conflict of interest from which Strategic Advisers or its affiliates derive an inappropriate advantage.
51 Semi-Annual Report
Board Approval of Amended Sub-Advisory AgreementStrategic Advisers Emerging Markets Fund
In June 2021, the Board of Trustees, including the Independent Trustees (together, the Board) voted to approve amendments to the fee schedules for the investment mandates in the existing sub-advisory agreements among Strategic Advisers LLC (Strategic Advisers), each of Acadian Asset Management LLC, Causeway Capital Management LLC (Causeway), and Schroder Investment Management North America Inc. (each, a Sub-Adviser), and Fidelity Rutland Square Trust II (Trust) on behalf of the fund, and also voted to approve an amendment in the existing sub-advisory agreement among Strategic Advisers, Causeway, and the Trust on behalf of the fund to add certain additional representations from Causeway regarding a participating affiliate arrangement (each, an Amended Sub-Advisory Agreement). The Board noted that the updated fee schedules in the Amended Sub-Advisory Agreements will result in the same or lower fees at all asset levels. The Board also noted that no other material contract terms are impacted by the Amended Sub-Advisory Agreements. The Board, assisted by the advice of fund counsel and Independent Trustees’ counsel, considered a broad range of information.
In considering whether to approve each Amended Sub-Advisory Agreement, the Board reached a determination, with the assistance of fund counsel and Independent Trustees’ counsel and through the exercise of its business judgment, that the approval of each Amended Sub-Advisory Agreement is in the best interests of the fund and its sharehold-ers and that the approval of such agreement does not involve a conflict of interest from which Strategic Advisers or its affiliates derive an inappropriate advantage. Also, the Board found that the fees to be charged under each Amended Sub-Advisory Agreement bear a reasonable relationship to the services to be rendered and will be based on services provided that will be in addition to, rather than duplicative of services provided under the advisory contract of any underlying fund in which the fund may invest. The Board’s decision to approve each Amended Sub-Advisory Agreement was not based on any single factor, but rather was based on a comprehensive consideration of all the information provided to the Board. In addition, individual Trustees did not necessarily attribute the same weight or importance to each factor.
Nature, Extent, and Quality of Services Provided. The Board considered the backgrounds of the investment personnel that will provide services to the fund, and also considered the fund’s investment objective, strategies and related investment philosophy and current sub-adviser line-up, as well as the structures of the investment personnel compensation programs and whether such structures provide appropriate incentives to act in the best interests of the fund, at its September 2020 meeting. The Board considered the detailed information provided by Strategic Advisers and each Sub-Adviser in the June 2021 annual contract renewal materials.
The Board noted that it had approved the existing sub-advisory agreement with each Sub-Adviser at its September 2020 meeting and that each Amended Sub-Advisory Agreement will not result in any changes to: (i) the nature, extent and quality of the sub-advisory services provided; (ii) the investment process or strategies employed in the management of the fund’s assets; or (iii) the day-to-day management of the fund or the persons primarily responsible for such management.
Investment Performance. The Board did not consider performance to be a material factor in its decision to approve each Amended Sub-Advisory Agreement because the approval of each Amended Sub-Advisory Agreement will not result in any changes (i) to the fund’s investment processes or strategies; or (ii) in the persons primarily responsible for the day-to-day management of the fund.
52Semi-Annual Report
Board Approval of Amended Sub-Advisory Agreement – continued
Based on its review, the Board concluded that the nature, extent, and quality of services that will be provided to the fund under each Amended Sub-Advisory Agreement will continue to benefit the fund’s shareholders.
Competitiveness of Management Fee and Total Fund Expenses.
The Board noted that each Amended Sub-Advisory Agreement will not result in changes to the maximum aggregate annual management fee payable by the fund or Strategic Advisers’ portion of the management fee. The Board considered Strategic Advisers’ contractual agreement to waive its portion of the fund’s management fee. The Board considered that each Amended Sub-Advisory Agreement will or has the potential to result in a decrease in the total management fees of the fund. Based on its review, the Board concluded that the fund’s management fee structure and any changes to projected total expenses bear a reasonable relationship to the services that the fund and its shareholders will receive and the other factors considered.
Because each Amended Sub-Advisory Agreement was negotiated at arm’s length and will have no impact on the maximum management fees payable by the fund, the Board did not consider the costs of services and profitability of the relationship with the fund to Strategic Advisers to be significant factors in its decision to approve each Amended Sub-Advisory Agreement.
Potential Fall-Out Benefits. The Board considered that it reviews information regarding the potential of direct and indirect benefits to Strategic Advisers and its affiliates from their relationships with the fund, including non-advisory fee compensation paid to affiliates of Strategic Advisers, if any, as well as information regarding potential fall-out benefits accruing to each Sub-Adviser, if any, as a result of its relationship with the fund, during its annual renewal of the fund’s management contract, sub-advisory agreements, and sub-subadvisory agreements. The Board considered Strategic Advisers’ representation that it does not anticipate that the approval of each Amended Sub-Advisory Agreement will have a significant impact on the profitability of, or potential fall-out benefits to, Strategic Advisers or its affiliates.
Possible Economies of Scale. The Board considered that it reviews whether there have been economies of scale in connection with the management of the fund during its annual renewal of the fund’s management contract, sub-advisory agreements, and sub-subadvisory agreements. The Board noted that each Amended Sub-Advisory Agreement will continue to provide for breakpoints that have the potential to reduce sub-advisory fees paid to the Sub-Adviser as assets allocated to the Sub-Adviser grow. The Board also noted that it did not consider the possible realization of economies of scale to be a significant factor in its decision to approve each Amended Sub-Advisory Agreement because the fund will not bear any additional management fees or expenses under each Amended Sub-Advisory Agreement.
Conclusion. Based on its evaluation of all of the conclusions noted above, and after considering all factors it believed relevant, the Board concluded that each Amended Sub-Advisory Agreement’s fee structure bears a reasonable relation-ship to the services to be rendered and that each Amended Sub-Advisory Agreement is in the best interests of the fund and its shareholders and should be approved. The Board also concluded that the sub-advisory fees to be charged under each Amended Sub-Advisory Agreement will be based on services provided that will be in addition to, rather than duplicative of, services provided under the advisory contract of any underlying fund in which the fund may invest. In addition, the Board concluded that the approval of each Amended Sub-Advisory Agreement does not involve a conflict of interest from which Strategic Advisers or its affiliates derive an inappropriate advantage.

53 Semi-Annual Report

54Semi-Annual Report

55 Semi-Annual Report

SAE-SANN-1021 1.918361.111