Embed Size (px)
Citation preview

"STRAlEGIC PRICING OF DIFFERENTIATED CONSUMER DURABLES IN A DYNAMIC DUOPOLY
A NUMERICAL ANALYSIS'
by Fernando NASCIMENTO*
Wilfried R. VANHONACKER**
N° 88 / 63
* Fernando NASCIMENTO, Assistant Professor or Marketing, Catholic University of Portugal, Lisbon, Portugal.
** Wilfried R. VANHONACKER, Associate Professor of Marketing, INSEAD, Fontainebleau, France
Director of Publication :
Charles WYPLOSZ, Associate Dean for Research and Development
Printed at INSEAD, Fontainebleau, France
Strategic Pricing of Differentiated Consumer Durables
in a Dynamic Duopoly: A Numerical Analysis
* Fernando Nascimento
and **
Wilfried R. Vanhonacker
Revised October 1988
Assistant Professor of Marketing, Catholic University of Portugal,
Lisbon, Portugal.
** Associate Professor of Marketing, INSEAD, Fontainebleau, France.
Strategic Pricing of Differentiated Consumer Durables
in a Dynamic Duopoly: A Numerical Analysis
ABSTRACT
Under different modes of competitive pricing behavior, profit maximizing
price trajectories are derived for durable products in a dynamic duopoly.
Open-loop cooperative and non-cooperative pricing behavior is analyzed
within a comprehensive model where sales of differentiated products are
described by interlocked diffusion processes with realistic demand charac-
teristics. Because of analytic complexity, the optimal trajectories implied
by the control and differential game problems are derived numerically across
an extensive set of plausible market scenarios. Manipulation of initial
market conditions enables derivation of optimal competitive pricing as a
function of timing of entry.
Key Words: PRICING, DUOPOLY, DIFFUSION, CONTROL AND GAME THEORY,
COMPETITION.
1.
1. INTRODUCTION
Strategic pricing of consumer durables has been investigated extensi-
vely. Recognizing demand as well as cost dynamics, a body of literature has
emerged which provides a coherent set of normative pricing guidelines.
Relying on the equilibrium concept in a monopolistic environment, the majori-
ty of this research does not recognize the implications of competitive
behavior. As most aspects of business have become increasingly competitive,
existing normative guidelines need to be supplemented with insights regarding
pricing in a competitive environment. Some fruitful attempts have been made
recently and a set of new insights are emerging. However, these insights
remain confined to a single and specific mode of competitive behavior.
Recognizing that firms can and do behave in a variety of ways, this research
extends the normative pricing literature by explicitly focusing on differen-
tial conduct in a dynamic duopoly.
The importance of competitive effects on optimal prices was recognized
early on by Spence (1981). Using a calculus-of-variation approach, he inves-
tigated the impact of competitive behavior on prices in the framework of a
simple demand model with cost dynamics. Thompson and Teng (1984) considered
both advertising and pricing decisions in a dynamic duopoly. Their price
mechanism was modeled as a single selling price decided by the largest com-
petitor. Diffusion characteristics and learning effects were incorporated by
Rao and Bass (1984), who considered a more realistic demand model for a
market of undifferentiated products. Within a similar demand framework,
Clarke and Dolan (1984) studied differentiated product markets and evaluated
basic pricing rules in a simulation framework. Wernerfelt (1985) modeled the
"gaming" aspect of pricing in more detail for undifferentiated but estab-
lished competitors. Enhancing the demand side of the diffusion process and
recognizing time-of-entry effects, Eliashberg and Jeuland (1986) derived some
normative pricing rules. Enhancing the cost dynamics in a special way,
Wernerfelt (1986) obtained optimal prices for an established duopoly with
specific demand characteristics.
Although each of these studies gives important new insights into the
peculiarities of strategic pricing in non-monopolistic markets, they all
assume the same type of competitive behavior. Specifically, competitors are
2.
assumed to maximize profits in a strictly non-cooperative environment. This
does not do justice to the reality of competitive conduct where implicit
cooperative behavior is often observed (Axelrod 1984). The objective of this
study is to investigate strategic pricing under different modes of competi-
tive behavior.
This research investigates profit maximizing price trajectories for
differentiated consumer durables in a dynamic duopoly under coalition,
competition (Nash equilibrium), price following (instantaneous and delayed),
and cost pricing (naive predation). Accordingly, both simultaneous (non-
cooperative) and sequential (reactive) pricing decisions are analyzed
(Eliashberg and Chatterjee 1985). Demand for each product is modeled as a
contagion-type diffusion process (Bass 1969). Demand functions are interre-
lated through a price mechanism and hazard rates capturing the dynamics of
adoption over time. Both primary and secondary demand effects are con-
sidered. The market has two segments defined over a heterogeneous population
in terms of reservation prices. As in Eliashberg and Jeuland (1986) the cost
structures are assumed fixed. No uncertainty is incorporated and the firms
act under full information. Price is the single decision variable considered
explicitly.
Given the complexity of the model, the price trajectories were derived
numerically over a large number of realistic scenarios (a total of 12,288
numerical optimization problems covering 256 different scenarios were
solved). Convergence of the results across scenarios served as a weak test
on uniqueness and convergence to global optima. For computational ease,
open-loop solutions over a finite time horizon were considered. Even though
feedback strategies, where firms can revise their pricing decisions in
response to sales patterns, would be more realistic, the main insights
provided by open-loop equilibria will still hold. After all, competitive
interdependencies take place largely through the price dynamics and, hence,
the mort important "gaming" aspects are captured here. However, the open-
loop results might be less aggressive than the ones obtained from closed-loop
equilibria (Wernerfelt 1985, p.932).
3.
2. DEMAND MODEL FOR DYNAMIC DUOPOLY
Unit sales of the two competing firms in the market are described by a
system of differential equations
Q1(t) = EPB1(1)1(t),P2(0) - Q1(01111[01(0,02(01
(1)
Q2(t) = EPB2(p1(t),p2(0) - 02(01h2[01(0,02(01
where
PB 1(p1(t),p2(0) and PB2(1)1(t),P2(0) denote the number of potential
buyers at time t of, respectively, Firm l's and Firm 2's product;
Q 1(t) and Q2(t) denote the accumulated sales volume by time t of,
respectively, Firm 1 and Firm 2;
h 1[Q1(t),Q2(t)] and h2[01(0,02(t)] denote the hazard rates for the
probability of purchasing, respectively, Firm l's and Firm 2's product.
Within a monopolistic formulation of (1), Bass (1969) developed a
diffusion model for consumer durables where the hazard rate is a linear
function in accumulated sales volume. This fundamental assumption found
support in empirical analyses and has been preserved in subsequent extensions
of the model (see, e.g., Bass 1980, Kalish 1983, Nascimento and Vanhonacker
1988). Since neither theoretical nor empirical reasons suggest otherwise,
linearity was adopted in the duopoly case investigated here.1
Specifically,
moi(t),Q2(01 = ao + al Q 1(t) + a2 Q2(t)
h 2[01(t),Q2(01 = bo + b1 Q 1(t) + b2 02(t)
4.
The interpretations of the parameters in the hazard functions are
identical to those in the case of monopoly. Accordingly, ao and b
o can be
referredtoas"coefficientsofinnovation,"a l , 2 ) can
be referred to as "coefficients of imitation." Note that the hazard rates
are a function of the accumulated sales volume for both competing products.
We assume, however, that "our" accumulated sales volume will have a greater
impact on the adoption of "our" product than will the competitor's accumu-
lated sales volume. Therefete, we assume ai >a, and b2>bi.
The number of potential buyers of each product is modeled as a non-
stationary variable using the. reservation price notion (Jeuland 1981).
Specifically, it is assumed that each individual in the market has a reser-
vation price for both products. These reservation prices are functions of a
large number of variables such as quality, product features, availability,
etc., which are not modeled explicitly.2
Depending on his reservation prices and the market prices for both
products, an individual can be classified at any point in time as .either a
potential buyer of Firm l's product, a potential buyer of Firm 2's product,
or not a potential buyer. Specifically, if his reservation price for product
1 is lover than product l's market price and his reservation price for
product 2 is higher than product 2's market price, the individual will be a
potential buyer of product 2. If the inequalities between the respective
reservation prices and market prices are reversed, the individual will be a
potential buyer of product 1. If both reservation prices are lover than the
respective market prices, the individual will not be a potential buyer of
either product. If, on the other hand, both reservation prices are higher
than the respective market prices, neither product is rejected a priori and
an additional assumption is needed to identify whether the individual will be
a potential buyer of either product 1 or product 2.
Two additional assumptions are homotheticity of the indifference curves
in the space of product characteristics and linear consumption technology.3
The implied choice criterion essentially states that an individual will
choose that product whose reservation price/market price ratio is the
highest. If an individual is willing to pay up to (maximally) pr, and pr2
5.
for, respectively, product 1 and product 2, this implies that the vectors
representing their consumption technologies reach exactly the same indif-
ference curve since the utility derived for each dollar spent on either
product is the same. When the prices of both products vary in the same
proportion as the reservation prices, the vectors representing consumption
technologies will again reach the same level of utility due to the
homotheticity of the indifference curves in the characteristics space.
Accordingly, when both market prices are below the respective reservation
prices at the same percentage level, the individual will be indifferennt
between both products. If the proportionality is different, the individual
will be classified according to the choice rule stated above.
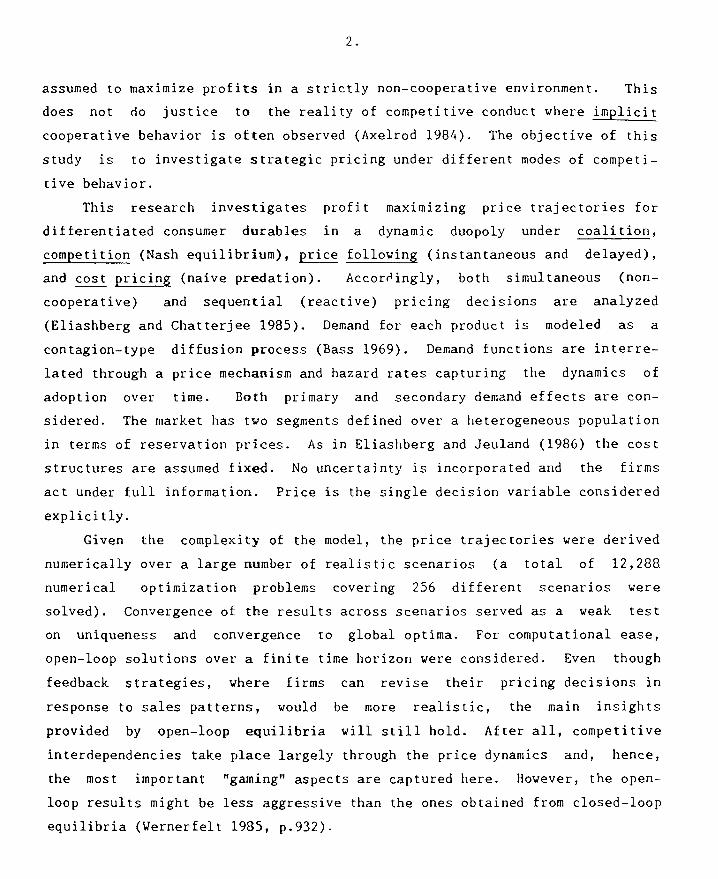
Figure 1 (A) summarizes in reservation price space the classification
of each individual in the market at one point in time given market prices
(p1(t) and 1)2(0) and reservation prices (pr1(t) and pr2(0).
PB1(p1(t),p2(0) as defined above corresponds to area 1, where
FB2(p1(t),p2(0) corresponds to area 2. The border which area 1 and area 2
share is the line pr2(t) [p2(t)/p1(t)Ipr 1(t) which describes indifference
as implied by the homotheticity of indifference curves. Figure 1 (B) ii-
lustrates graphically the shifts that occur if product 1 raises its price.
Two distinct effects occur: first, there is a loss in primary demand (the
area of non-buyers expands along the x-axis); second, there is a loss in
selective demand (the number of potential buyers of product 2 expands).
Mathematically, the potential adopter populations equal (dropping time
subscripts for notational convenience)
PB1(PI ,P2) = N fm I (P2/P1)Pr1 g(pri ,pr2)dpr, dpr,
pi
and
PB2(pi ,P2) = N r
(pl/p2)pr, g(pri,pr2)dpr, dPr2
p2
Reservation Price for Product 2 (pr2(t))
A
P2(0 t) [P(0 ]pr
1 (t) 1 pr
Market Price' for Product 2
(P2 (0)
(A)
Potential Buyers of Product 2 (Area 2)
Non- cuyer.s
. Potential Buyers of Product 1
(Area 1)
Market Price for Product 1 (pi(t))
Reservation Price ) for Product 1
(prl(t))
Reservation Price for Product 2 (pr2(t+1))
A
i'lLoss of Selective Demand Potential for Product 1
(B) Market Price
for Product 2 (p2(t+1)) Loss of Primary
Demand Potential for Product 1
Reservation Price for Product 1
Market Price (pr1(t+1)) for Product 1 (pl(t+1))
Figure 1
Fopulation Breakdown at One Point in Time

6.
where g(pr,,pr2) is a bivariate distribution describing the heterogeneity in
reservation prices across the population, and N denotes the size of the
population. The numerical results reported later were derived with a
bivariate gamma distribution. The corresponding adopter populations are
derived in Appendix 1.
3. MODES OF COMPETITIVE BEHAVIOR
The various competitive environments considered in addition to monopoly
are summarized in Table 1. The monopoly case (Firm 1) was incorporated as a
benchmark. It is a simple control problem analyzed extensively by Kalish
(1983).
Under coalition, both firms cooperate by acting together as a monopoly.
Note that by changing the initial conditions (i.e., Qi(0)= Q2(0)= 0), we can
investigate the situation where one of the firms is a new entrant into an
existing market. Past cumulative sales produce higher hazard rates for the
new entrant. Accordingly, Qi(0) constitutes a barrier to entry for that
firm. The coalition case can also be interpreted as a case of one firm with
two products in a single market and, hence, can provide insights into product
line pricing and the desirability of price/product discrimination.
The competition case is one of non-cooperation where each firm vin
seek to maximize its profits taking the competitor's price as given (i.e.,
Nash equilibrium). Again, initial conditions can be altered to study the
impact on pricing strategies of a newcomer entering an existing market.
The follower case is essentially a naive competition situation: Firm 2
always matches Firm l's price. In contrant to the competition case, this
case is sot "optimal" but is very easy to implement as, apart -from Firm l's
price, no external knowledge is required. Note that by setting t different
from zero, delayed price following behavior can be analyzed.
In the cost pricing situation, Firm 2's long run objective is to
destroy Firm 1. It is willing to pursue this objective at the expense of
its own profits (by essentially pricing its product at cost). As vin
become evident from the discussion hereafter, pricing at cost over the life
Table 1
Competitive Environments Analyzed
Market Characteristics Problem Analytic Statement
Structure
1, Coalition Both firms act
together as a
monopoly
(friendly com-
petition)
Control problem Max T
with two control pl(t) p z(t) f e-rt
(p i (t) - cz ) Q z (t)
variables : t=0
p z (t) and p2(t) -rt
+e (pi (t) - c 2 1 Q 2 (t) dt
Subject to:
Qz (t)=[PBz (pz (t),p,(t))-Q i (t)) hz(Qz (t), Qz (t)).
àz(t)=IPBz (pz (t),Pz(t1)-0»t11 h 2 tO i (t), Q 2 (t)l.
2. Competition Each firm seeks Differential Firm i(i = 1,2):
profit maximiza- game problem in Max T -rt
tion given the context of non- p (t) J e (p (t) - c J Q (t) i
i Q.
competitor's Nash eguilibrium t=0
price
Subject to:
4 1 (t)=1P131 (p 1 (t),p2 (t))-Q1 (t)1 h i fQ,(t), Q 2 (t)).
ô 2 (t)=EPB,(p 1 (t),p 2 (t)1-Q 2 (t)111,(Q i (t), Q 2 (t)].
Q 1 (0) = Q,(0) = qz
Table 1 (cont'd)
Competitive Environments Analyzed
Market
Characteristics
Problem Analytic Statement
Structure
3. Follower Firm 2 matches Stackelberg Max -rt
Firm l's price game problem p (t) f e (p(t) - c2 1 Q (t)
whenever it is t=0
changed (tit-
for-tat type Subject to:
strategy
(5 i (t)=I'13(pi (t),P2 (t))-4,(t)) h i P22 (t). 02 et»1).
Q 2 (t)=[P02(p2 (t),P2(t)(-Q 2 (t)1 11 2(Q2(t), O2 tt»6-
Q(0) = 42(0) = cl,
p 2 (t) = pi (t - T)
4. Cost
pricing
Firm 2 tries to
destroy Firm 1
at the expense
of its own
profits
Control problem
with single
control
variable :
p,(t)
Firm 1
Max
p(t)
t=o
-rt e [p (t) - c i l Q i (t)
Subject to:
, 2 (t)=(1)13, (p i ft ).p, (t ) (-Q,(t)] h i lQ i (t), 42(t)'li-
(2 2 (t)=U132(pI lt),p 2(t))-Q 2 (t)1 11 2[Q 2 (t), Q2 (t)11-
Q2'" = Q2(° ) = q,
Firm 2 :
p = (t) = c,
7.
cycle is not optimal in a predatory sense. Accordingly, cost pricing can be
viewed as a "naive predation" pricing strategy.
4. NUMERICAL ANALYSIS
In general, analytic modeling of optimal pricing decisions in a com-
petitive environment is difficult. To evaluate some simple pricing rules
without even establishing optimality, Clark,- and Dolan (1984) rely on a
simulation analysis. Rao and Bass (1985) and Eliashberg and Jeuland (1986)
pursue the problem analytically but finally have to resort to numerical
analyses to provide meaningful.insights into some of their analytic results.
In order not to compromise on reality to enable some analytic derivations, an
extensive numerical analysis was performed. For a set of 256 realistic
scenarios, the problems shown in Table 1 were solved numerically and cor-
responding price trajectories and cumulative profits were derived.
The parameter values are shown in Table 2. The innovation and imita-
tion parameters were derived from empirical results reported by Bass (1969)
and are similar to the values used in Nascimento and Vanhonacker (1988).
Although no empirical evidence exists on the magnitude of the imitation
impact of a competitor's cumulative sales volume on a firm's diffusion (or
hazard rate), we hypothesized it to be about 1/3 of the direct imitation
effect generated by the firm's own cumulative sales volume. Initial sales
levels were set arbitrarily at 5 and 100. The value 5 was interpreted as an
"early entry" (i.e., new firm entering the market). Because of numerical
optimization problems, the value zero could not be used. Value 100 was
interpreted as a "late entry" (i.e., firm operating in an established
market). Relative to a population size of 2000, value 100 implies 5Z
penetration given each individual buys only one unit of the product. The
absolute values are of little concern as the relative comparisons of interest
are independent of the scale adopted. In all analyzed scenarios, the con-
straint was added that sales of neither product could be negative.
Ail other parameters were fixed. The bivariate gamma distribution
describing heterogeneity in the reservation prices was relatively flat, with
a, = a, = 1 and e, e, = 40. With a, = a, = 1, the marginal densities are
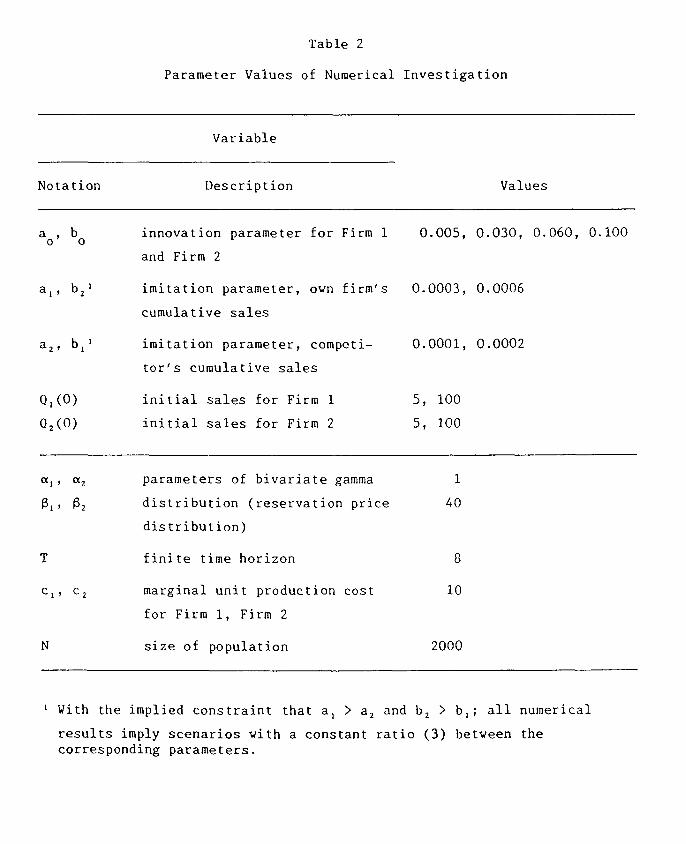
Table 2
Parameter Values of Numerical Investigation
Variable
Notation
Description Values
a , b o o
a„ b2
innovation parameter for Firm 1 0.005, 0.030, 0.060, 0.100
and Firm 2
imitation parameter, own firm's 0.0003, 0.0006
cumulative sales
a2, b,' imitation parameter, competi- 0.0001, 0.0002
tor's cumulative sales
MO)
initial sales for Firm 1 5, 100
02(°)
initial sales for Firm 2 5, 100
ale 0(.2 parameters of bivariate gamma 1
( 1 (3 2 distribution (reservation price
40
distribution)
T
finite time horizon 8
C I / 2 marginal unit production cost 10
for Firm 1, Firm 2
N
size of population 2000
' With the implied constraint that a, > a2 and 1)2 > b,; all numerical
results imply scenarios with a constant ratio (3) between the corresponding parameters.
8.
exponential. Accordingly, reservation prices are concentrated towards the
axes. Furthermore, the shape of the distribution of the population remains
the same irrespective of the values of the 0 parameters.
In all, 256 scenarios were analyzed. Within each, optimal price
trajectories were derived for six different competitive environments over a
finite horizon of eight tire periods. Accordingly, 12,288 numerical optimiza-
tion problems were solved with an approach similar to the one adopted by
Pindyck (1978). GAMS (Kendrick and Meeraus 1985), a powerful optimization
program, was used to derive numericall' the optimal price trajectories.
Because of inherent checks for local versus global optima and convergence of
the results derived, we feel reasonably confident about the uniqueness of the
derived optimal trajectories.
Some of the optimization problems could not be solved satisfactorily.
For subsequent analysis and discussion, we retain the scenarios for which the
optimization could be solved over eight consecutive time periods.4 Obviously
not selected at random, subsequent analysis exhibits remarkable convergence
of results. Moreover, the scenarios are representative and provide good
overall insight into strategic pricing under the different modes of competi-
tive behavior.
5. RESULTS FOR SOME SPECIFIC SCENARIOS
A. Description of Scenaries
In order to illustrate the impact of dynamic demand characteristics,
ten scenarios were singled out for a detailed analysis. The profile of
these scenarios is described in Table 3. As can be seen there, the
scenarios differ in diffusion process parameters for both products. For the
first four scenarios, both products have symmetric diffusion processes (i.e.,
identical innovation and imitation parameters). They only differ in initial
saleslevel(i.e.,Q.(0) for i=1,2). In the first scenario, both firms can
be interpreted as early entrants. In scenario 2, the firms compete much
later in the category's life cycle. The last two scenarios have one firm
being a late entrant relative to the other. These symmetric diffusion
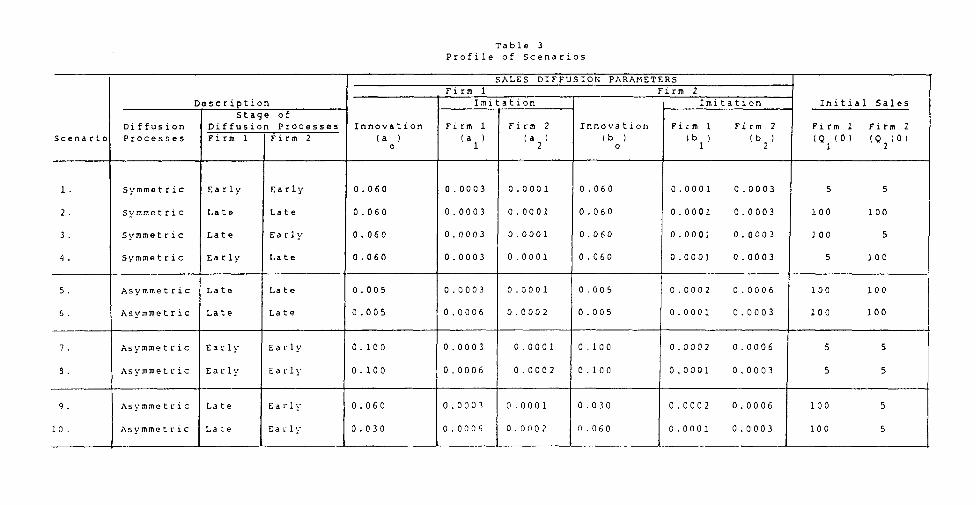
Table 3 Profile of Scenarios
SALES DIFFUSION PARAMETERS Firm 1 Firm 2
Description Imitation Imitation Initial Sales Stage of
Diffusion Diffusion Processes Innovation Firm 1 Firm 2 Innovation Firm 1 Firm 2 Firm 1 Firm 2 Scenario Processes Firm 1 Firm 2 (a ) (a ) (a) (b ) (b ) (b ) (Q (0) (4(0)
0 1 2 0 1 2 1 2
1. Symmetric Early Early 0.060 0.0003 0.0001 0.060 0.0001 0.0003 5 5
2. Symmetric Late Late 0.060 0.0003 0.0001 0.060 0.0001 0.0003 100 100
3. Symmetric Late Early 0.060 0.0003 0.0001 0.060 0.0001 0.0003 100 5
9. Symmetric Early Late 0.060 0.0003 0.0001 0.060 0.0001 0.0003 5 100
5. Asymmetric Late Late 0.005 0.0003 0.0001 0.005 0.0002 0.0006 100 100
6. Asymmetric Late Late 0.005 0.0006 0.0002 0.005 0.0001 0.0003 100 100
7. Asymmetric Early Early 0.100 0.0003 0.0001 0.100 0.0002 0.0006 5 5
8. Asymmetric Early Early 0.100 0.0006 0.0002 0.100 0.0001 0,0003 5 5
9. Asymmetric Late Early 0.060 0.0003 0.0001 0.030 0.0002 0.0006 100 5
10. Asymmetric Late Early 0.030 0.0006 0.0002 0.060 0.0001 0.0003 100 5
9.
scenarios will give detAdaxed insight into the effect of order of entry on
strategic pricing under iiEferent modes of competitive behavior.
The remaining six senarios consider asymmetric diffusion processes.
For scenarios 5 and 6, oth firms compete late in the category's life cycle.
In contrast, scenarios lamd 8 capture competition early in the life cycle.
In scenarios 9 and 1, Firm 2 is a late entrant relative to Firm 1. In
scenario 9, the new eatmanz has diffusion process parameters which are twice
as large as the cormlemnding parameters of the incumbent. In scenario 10,
the reverse relationshipœxists between the corresponding parameters. The
numerical results for tffieue ten scenarios are discussed next.
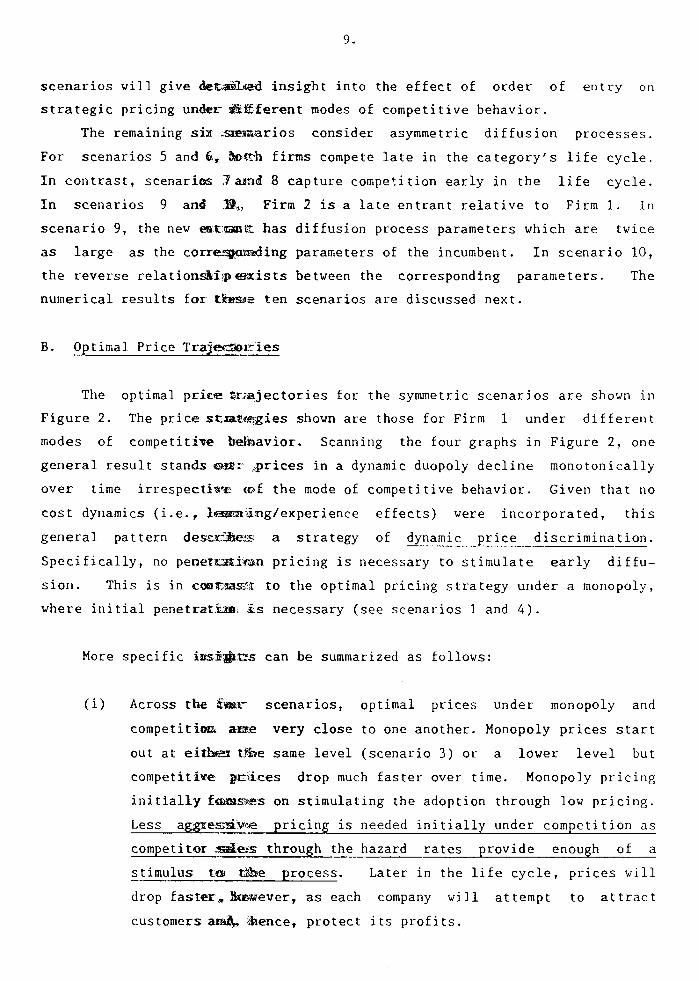
B. Optimal Price Traje lies
The optimal prive trzajectories for the symmetric scenarios are shown in
Figure 2. The price stiatiegies shown are those for Firm 1 under different
modes of competitive belavior. Scanning the four graphs in Figure 2, one
general result stands entr prices in a dynamic duopoly decline monotonically
over time irrespective (of the mode of competitive behavior. Given that no
cost dynamics (i.e., leuroIng/experience effects) were incorporated, this
general pattern descrAkes a strategy of dynamic price discrimination.
Specifically, no penetttinm pricing is necessary to stimulate early diffu-
sion. This is in comitiast to the optimal pricing strategy under a monopoly,
where initial penetratimo &s necessary (see scenarios 1 and 4).
More specific izastzs can be summarized as follows:
(i) Across the 6007 scenarios, optimal prices under monopoly and
competitive ante very close to one another. Monopoly prices start
out at either tehe same level (scenario 3) or a lover level but
competitive pniices drop much faster over time. Monopoly pricing
initially fonns>es on stimulating the adoption through low pricing.
Less aggresuVce. pricing is needed initially under competition as
competitor through the hazard rates provide enough of a
stimulus to tthe process. Later in the life cycle, prices will
drop fastes. Mkewever, as each company will attempt to attract
customers andt„. pence, protect its profits.
1 1 ... 1 2 3 4 5 6 7 8
T iME
Scenario 3
1 2 3 4 5 6 7
• MONOPOLY O COALITION o FOLLOWER 0 o FOLLOWER 1
O COMPETITION • COST PRICING
w u
cr 40
30
20 —
60
50
TiME
60
1 2 3
TRIE
1 5 6 7 t
50
w u cc 40
30
20
I J
1 2 3 4
TIME
5 6 7 8
• mONOPO Y
O COALITION o FOLLOWER 0 o FOLLOWER 1 • COMPETITION
✓ COST PRICING
Scenario 4
Figure 2
Price Trajectories for Firm 1 When Both Firms Have Symmetric Diffusion Processes
Scenario 2
60
50
w u
cc
- 4
0 a.
30
20 —
• MONOPOLY
O COALITION o FOLLOWER 0
o FOLLOWER 1
O COMPETITION
• COST PRICING
Scenario 1 • MONOPOLY
O COALITION o FOLLOWER 0 à FOLLOWER 1
O COMPETITION
• COST PRICING
60
50
w
cr - 40 a
30
20
10.
(ii) Cost pricing by the new entrant leads to the most aggressive
pricing by Firm 1 (see scenarios 2 and 3). Clearly, Firm 1 at-
tempts to protect its business against the "predator." When the
incumbent resorts to cost pricing at the expense of the new
entrant (Scenario 4), initial pricing is relatively high indicat-
ing profit taking when the direct threat is minimal.
(iii) Cooperative competitive behavior leads to higher prices.
Follower 0, follower 1, and coalition result in relatively high
prices for Firm 1 across the four scenarios. Follower 1 prices do
become aggressive later on to secure a large share of the expand-
ing primary demand. Coalition prices for Firm 1 are highest when
it enters a market with an established competitor. Accordingly,
some segmentation seems optimal. The price differential between
the two firms will be investigated shortly.
(iv) When both firms are early, the range of initial prices for dif-
ferent modes of competitive behavior is smallest. Except for cost
pricing, these initial prices are also the lowest among the four
scenarios. This seems to suggest that extensive price competition
is secondary to both firms attempting to stimulate the diffusion
and adoption of the category. Market growth is the dominant
objective of the players early on in the category's life cycle.
(v) Irrespective of the mode of competitive behavior, Firm l's initial
prices are highest when it is first to the market (see scenario
4). This is in contrast to the monopoly environment when early
entry would require the subsidizing of early adopters to stimulate
diffusion and adoption.
Figure 3 illustrates the price differentials under coalition and compe-
tition between both firms. The results for scenario 4 are not shown as they
are identical to the ones for scenario 3 except for switching Firm 1 and Firm
2. In scenario 1, there is no differential. Both competitors are early
entrants in the category. They are more eager to create market growth than
to differentiate on price. As one would expect, coalition pays better than
Figure 3
Price Trajectories for Both Firms Having Symmetric Diffusion Processes
Scenario 1
60 60
50 50
W u_ Q 40 o.
w u cc 4 0 Ô.
30 30
20 20
1 2 3 4 5 6 7 e
TIME
1 i t 1 t I I i
O COALITION (1. 2) 60
O COMPÉTITION (1) o COMPÉTITION (2)
50
30
20
Scenario 3
1 2 3 4 5 6 7 e
TIME
1 t ,. 1 1 1
Scenario 2 t
O COALITION (1, 2) O COMPETITION (1) o COMPETITION (2)
1 2 3
I
4
TIME
8 5 6 7
O COALITION (I ) O COALITION (2) O COMPETITION (1) O COMPETITION (2)
11.
competition. A somewhat similar pattern is observed in scenario 2. However,
prices under competition diverge somewhat over time. Whether this is a
substantively meaningful result (indicating the development of segments) or a
strictly numerical result is not clear at this point. More analysis is
needed here.
The results for scenario 3 suggest that, when both firms enter the
market sequentially, the price differential is the largest under coalition
with the new entrant having higher prices. Accordingly, segmentation is more
difficult to achieve under competition. Ove: time, however, the differential
is difficult to maintain both under cooperative and non-cooperative behavior.
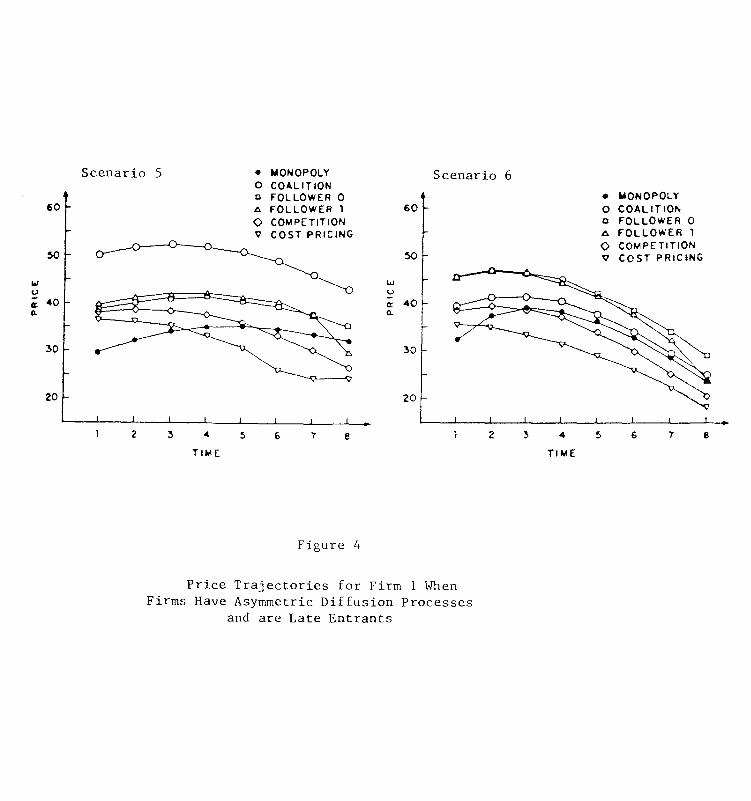
The optimal price trajectories for Firm 1 for scenarios 5 and 6 are
shown in Figure 4. In scenario 5, Firm 1 has the slowest diffusion process;
in scenario 6, Firm 2 has the slowest process. Actually, results in scenario
5 are the optimal pricing patterns for the "slow diffusion" competitor
whereas the results in scenario 6 are the ones for the "fast diffusion"
competitor. Consistent with the symmetric scenarios discussed above, coope-
rative behavior results in high level price trajectories for both competi-
tors. In contrast to the previous four scenarios, the trajectories generally
exhibit more penetration characteristics irrespective of the mode of competi-
tive behavior. This probably is a result of the small value of the innova-
tion parameter used in scenarios 5 and 6. Because of the small innovation
effects, aggressive pricing is needed early on to stimulate diffusion. Some
specific results can be summarized as follows:
(i) Relative to the "fast diffusion" competitor (scenario 6), the
"slow diffusion" competitor (scenario 5) faces flatter price
trajectories over time irrespective of the mode of competitive
behavior. Apart from the coalition case, these trajectories start
at lover price levels than the corresponding trajectories for the
"fast diffusion" competitor. The optimal strategy for the "fast
diffusion" competitor is to price aggressively over time so as to
stimulate market growth irrespective of the pricing behavior of
its competitor.
20
Scenario 6 Scenario 5
60
• 1.40NOPOLY O COALITION o FOLLOWER 0 o FOLLOWER 1
O COMPETITION ✓ COST PRICING
• MONOPOLY O COALITION o FOLLOWER O o FOLLOWER 1
O COMPETITION • COST PRICING
60
50
cc 40
30
20
1 2 3 4 5 6 7
TIME
1 2 3 4 5 6 7
TIME
Figure 4
Price Trajectories for Firm 1 When Firms Have Asymmetric Diffusion Processes
and are Late Entrants
12.
(ii) Under coalition, the "slow diffusion" competitor prices much
higher than the "fast diffusion" competitor, The price differen- _
tial is quite large with prices showing little sign of converging
over the finite time horizon. The strategy here seems to price the
rapidly diffusing product low to stimulate diffusion and to price
the slow diffusing product high to generate profits.
Accordingly, both products seem to play a different role in the
overall maximization of discounted profits.
(iii) Follower prices are highest when Firm 1 has a relatively rapid
diffusion process (scenario 6). Accordingly, the "fast diffusion"
competitor will benefit most from reactive cooperative pricing
behavior by its competitor.
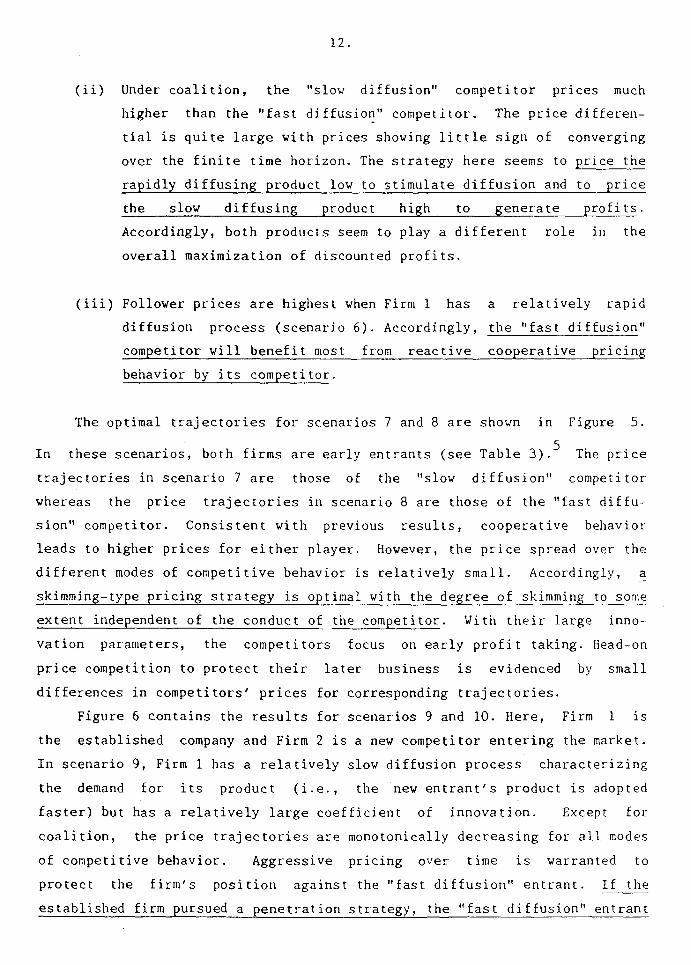
The optimal trajectories for scenarios 7 and 8 are shown in Figure 5.
In these scenarios, both firms are early entrants (see Table 3).5
The price
trajectories in scenario 7 are those of the "slow diffusion" competitor
whereas the price trajectories in scenario 8 are those of the "fast diffu-
sion" competitor. Consistent with previous results, cooperative behavior
leads to higher prices for either player. However, the price spread over the
different modes of competitive behavior is relatively small. Accordingly, a
skimming-type pricing strategy is optimal with the degree of skimming to some
extent independent of the conduct of the competitor. With their large inno-
vation parameters, the competitors focus on early profit taking. Head-on
price competition to protect their later business is evidenced by small
differences in competitors' prices for corresponding trajectories.
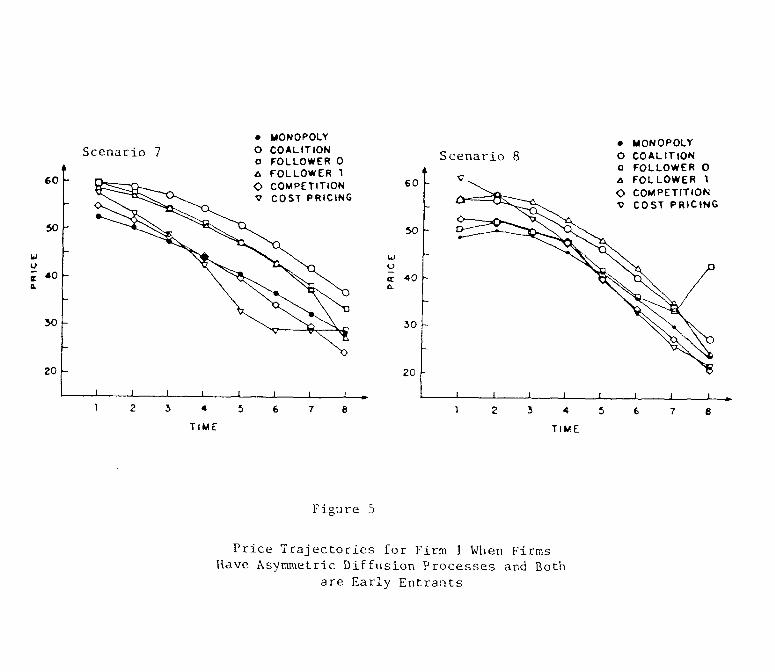
Figure 6 contains the results for scenarios 9 and 10. Here, Firm 1 is
the established company and Firm 2 is a new competitor entering the market.
In scenario 9, Firm 1 has a relatively slow diffusion process characterizing
the demand for its product (i.e., the new entrant's product is adopted
faster) but has a relatively large coefficient of innovation. Except for
coalition, the price trajectories are monotonically decreasing for all modes
of competitive behavior. Aggressive pricing over time is warranted to
protect the firm's position against the "fast diffusion" entrant. If the
established firm pursued a penetration strategy, the "fast diffusion" entrant
1 2 3 4 5 6 7
TIME
1 2 3 4 5
TIME
6 7
a 40
20
60
30
50
Figure 5
Price Trajectories for Firm 1 When Firms Have Asymmetric Diffusion Processes and Bath
are Early Entrants
60
50
y m 40 a
30
20
• AIONOPOLT O COALITION o FOLLOWER 0 • FOLLOWER 1
O COMPETITION • COST PRICING
Scenario 7 • MONOPOLY O COALITION o FOLLOWER o FOLLOWER 1
O COMPETITION • COST PRICING
Scenario 8
60
50
cr 40
30
20
Scenario 10 • MONOPOLY O COALITION o FOLLOWER O o FOLLOWER 1 O COMPETITION ✓ COST PRICING
T 1 6 2 3 4
TIME
5 8 1 2 3 4 5 6 7
TIME
8
• MONOPOLY O COALITION o FOLLOWER o FOLLOWER I O COMPETITIONI ✓ COST PRICING
,
Figure '6
Price Trajectories for Firm 1 When Firms Have Asymmetric Diffusion Processes
And Firm 2 is a Lane, Entrant
60
cr 40
30
20
13.
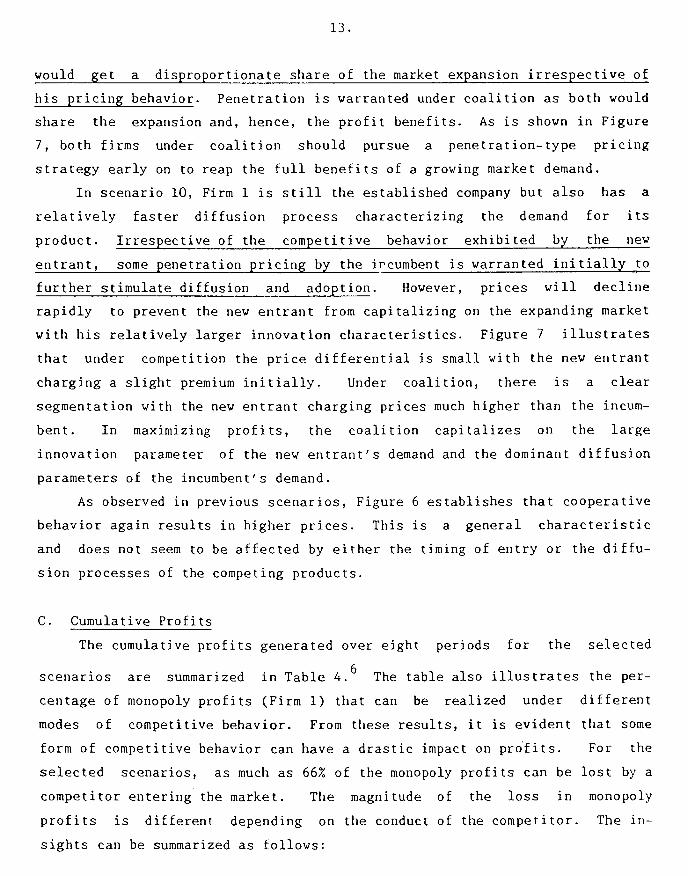
would get a disproportionate share of the market expansion irrespective of
his pricing behavior. Penetration is warranted under coalition as both would
share the expansion and, hence, the profit benefits. As is shown in Figure
7, both firms under coalition should pursue a penetration-type pricing
strategy early on to reap the full benefits of a growing market demand.
In scenario 10, Firm 1 is still the established company but also has a
relatively faster diffusion process characterizing the demand for its
product. Irrespective of the competitive behavior exhibited by the new
entrant, some penetration pricing by the ircumbent is warranted initially to
further stimulate diffusion and adoption. However, prices will decline
rapidly to prevent the new entrant from capitalizing on the expanding market
with his relatively larger innovation characteristics. Figure 7 illustrates
that under competition the price differential is small with the new entrant
charging a slight premium initially. Under coalition, there is a clear
segmentation with the new entrant charging prices much higher than the incom-
bent. In maximizing profits, the coalition capitalizes on the large
innovation parameter of the new entrant's demand and the dominant diffusion
parameters of the incumbent's demand.
As observed in previous scenarios, Figure 6 establishes that cooperative
behavior again results in higher prices. This is a general characteristic
and does not seem to be affected by either the timing of entry or the diffu-
sion processes of the competing products.
C. Cumulative Profits
The cumulative profits generated over eight periods for the selected
scenarios are summarized in Table 4.6
The table also illustrates the per-
centage of monopoly profits (Firm 1) that can be realized under different
modes of competitive behavior. From these results, it is evident that some
form of competitive behavior can have a drastic impact on prdfits. For the
selected scenarios, as much as 66% of the monopoly profits can be lost by a
competitor entering the market. The magnitude of the loss in monopoly
profits is different depending on the conduct of the competitor. The in-
sights can be summarized as follows:
O COALITION (1) o COALITION (21 • COmPETITION (1)
o COMPETITION (2)
O COALITION (1) Scenario 10
o COALITION (2)
• COmPETITION
o COMPETIT(ON (2) •
I
$0
20
50
Scenario 9
c 40 sa.
30
60
50
c 40
30
20
2 3 4 5
6 7
1 2 3
4
5 6 7
8
TIME
TIME
Figure 7
Price Trajectories for Both Firms Having Asymmetric Diffusion Processes With
Firm 2 Being a Late Entrant
Table 4
Cumulative Profits for Scenarios,
Competitive Envi ronment
Symmetric Sales Diffusion Processes Asymmetric Sales Diffusion Processes
Scenarios Scenarios Scenarios Scenarios
1 2 3 4 5 6 7 8 9 10
monopoly, 10276.3 11013.9 11013.9 10276.3 5786.8 12283.2 14156.3 18117.8 11013.9 14224.1
(1.00) (1.00) (1.00) (1.00) (1.00) (1.00) (1.00) (1.00) (1.00) (1.00)
Coalition Firm 1 8808.0 9321.1 9260.5 9227.5 5021.9 11651.6 11652.9 15890.1 8756.7 12330.8
(0.86)3 (0.85) (0.84) (0.90) (0.87) (0.95) (0.82) (0.88) (0.80) (0.87)
Firm 2 8808.0 9321.1 9227.5 9260.5 11651.6 5021.9 15890.1 11652.9 11264.2 8861.4
(0.86) (0.85) (0.84) (0.90) (2.01) (0.41) (1.12) (0.64) (1.02) (0.62)
Follower 0, 8808.0 9321.1 8791.7 9626.4 5934.9 10243.9 12262.0 14053.1 8814.4 11004.2
(0.86) (0.85) (0.80) (0.94) (1.03) (0.83) (0.87) (0.76) (0.80) (0.77)
Follower 1 2 8969.9 9615.3 9059.2 9820.9 6012.0 10716.0 12575.2 15804.0 9077.4 11540.9
(0.87) (0.87) (0.82) (0.96) (1.04) (0.87) (0.89) (0.87) (0.82) (0.81)
Competition Firm 1 8496.0 8826.9 8750.7 8941.0 5495.7 10028.3 11587.6 14670.9 8539.1 11171.0
(0.83) (0.80) (0.79) (0.87) (0.95) (0.82) (0.82) (0.81) (0.78) (0.79)
Fins 2 8550.7 8974.8 9004.8 8875.9 10172.6 5551.1 14896.1 11734.8 10561.9 9021.6
(0.83) (0.81) (0.82) (0.86) (1.76) (0.45) (1.05) (0.65) (0.96) (0.63)
Cost Pricing, 4353.7 3992.9 3727.3 4829.4 2999.8 4251.8 6017.8 7597.4 3838.6 4798.2
(0.42) (0.36) (0.34) (0.47) (0.52) (0.35) (0.43) (0.42) (0.35) (0.34)
Cumulative profits computed over eight time periods; for description of 10 scenarios, see Table 3.
Results for Firm 1. Percentage of cumulative profits for corresponding monopoly environment (i.e., 1 ne 1 in the table).
14.
(i) Cost pricing by the competitor results in a firm obtaining less
than half of its monopoly profits.
(ii) Across the scenarios, cumulative profits under Follower 0 are less
than the corresponding cumulative profits under Follower 1.
Accordingly, if the competitor opts for price following (reactive
cooperative pricing strategy), cumulative profits of a firm are
enhanced when price adjustments are delayed irrespective of demand
characteristics. One has to keen in mind, however, that to some
extent the finite horizon might explain this result. Specifical-
ly, under delayed response, the price leader makes an end move in
the last period. In order to capture a substantial share of the
market, the price leader will slash prices drastically (see, e.g.,
price trajectories for Follower 1 illustrated above). The longer
the response delay, the larger the window of opportunity to make
this move and capture the market. Even though unit margins fall,
demand might expand at a faster rate resulting in enhanced overall
profits.
(iii) Cumulative profits of a firm are generally largest when it does
not face any competition (i.e., monopoly environment). One
exception is scenario 5 where price following by the competitor
provides cumulative profits which are slightly higher than the
corresponding monopoly profits (i.e., Follower 0: 5934.9; Follower
1: 6012.0; versus Monopoly: 5786.8). Whether this is a substan-
tively meaningful result or a numerical analysis result is not
clear at this point. It indicates, however, that competitive
presence in some instances could have a positive net effect on
cumulative profits over a finite horizon. Here, the firm seems to
benefit from the dominating diffusion characteristics of the
competitor's product and his price following behavior. Further
analysis is warranted here.
(iv) In general, cooperative behavior results in larger cumulative
profits than non-cooperative behavior. There are some excep-
tions, however. In scenario 5, Firm l's cumulative profits under
15.
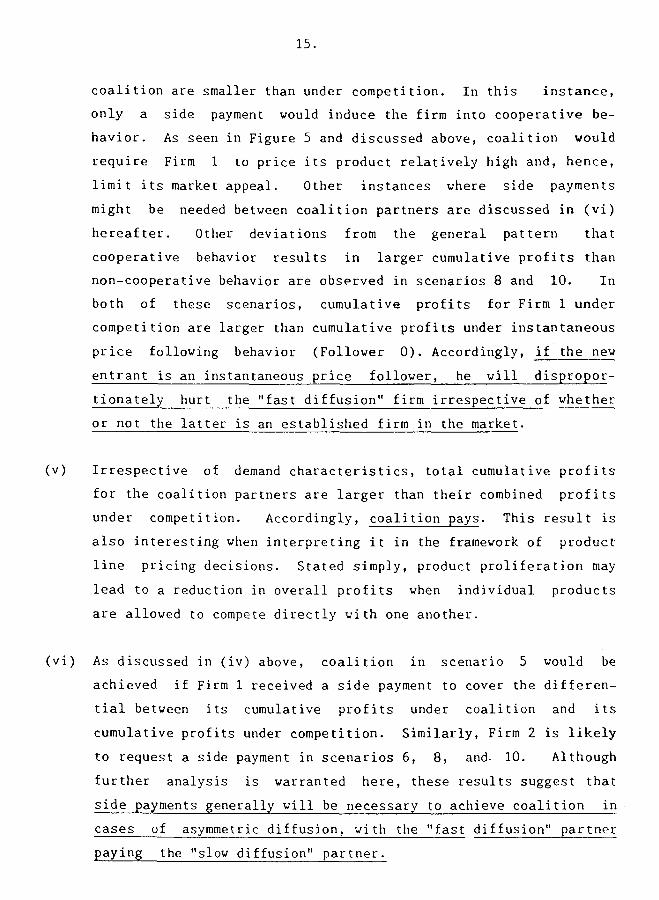
coalition are smaller than under competition. In this instance,
only a side payment would induce the firm into cooperative be-
havior. As seen in Figure 5 and discussed above, coalition would
require Firm 1 to price its product relatively high and, hence,
limit its market appeal. Other instances where side payments
might be needed between coalition partners are discussed in (vi)
hereafter. Other deviations from the general pattern that
cooperative behavior results in larger cumulative profits than
non-cooperative behavior are observed in scenarios 8 and 10. In
both of these scenarios, cumulative profits for Firm 1 under
competition are larger than cumulative profits under instantaneous
price following behavior (Follower 0). Accordingly, if the new
entrant is an instantaneous price follower, he will dispropor-
tionately hurt the "fast diffusion" firm irrespective of whether
or not the latter is an established firm in the market.
(v) Irrespective of demand characteristics, total cumulative profits
for the coalition partners are larger than their combined profits
under competition. Accordingly, coalition pays. This result is
also interesting when interpreting it in the framework of product
line pricing decisions. Stated simply, product proliferation may
lead to a reduction in overall profits when individual products
are allowed to compete directly with one another.
(vi) As discussed in (iv) above, coalition in scenario 5 would be
achieved if Firm 1 received a side payment to cover the differen-
tial between its cumulative profits under coalition and its
cumulative profits under competition. Similarly, Firm 2 is likely
to request a side payment in scenarios 6, 8, and- 10. Although
further analysis is warranted here, these results suggest that
side payments generally will be necessary to achieve coalition in
cases of asymmetric diffusion, with the "fast diffusion" partner
paying the "slow diffusion" partner.
16.
6. SUMMARY OF NUMERICAL RESULTS
A. Optimal Price Trajectories
A convenient way to summarize all numerical results is to use a set of
linear regression equations (see, e.g., Nascimento and Vanhonacker 1987a).
The equations reported here relate the parameters of the diffusion processes
and their pairwise interactions to a number -f dependent measures describing
aspects of either the optimal price trajectories (i.e., initial price, price
range over time, period in which price peaked, mean price level, and dif-
ference in mean price level over different modes of competitive behavior) or
cumulative profits over a finite time horizon (i.e., absolute cumulative
profits, and differences in cumulative profits over different modes of com-
petitive behavior). Higher-order interactions were not considered so that
adequate degrees of freedom were assured for estimation and testing. The
linearity assumption is restrictive and might be a crude approximation for
some dependent measures, but highly significant fits were established in- _
dicating that in general the approximation was adequate. The results are
reported in the form of significant standardized regression coefficients
(e.g., Beta coefficients).
The main independent variables in each of the estimated equations are
the six characteristics of the diffusion processes: initial cumulative sales
for both firms (i.e., Q,(0) and 02(0)), the innovation parameters for both
firms (i.e., ao
and bo), and the imitation parameters (i.e., ai and bi for
i=1,2). Because of the constant relationship between both imitation
parameters within each diffusion process (i.e., a,/a2= b2/b,= 3; see Table
2), the imitation parameters were incorporated as a single variable.
The regression results for the optimal price trajectories are sum-
marized in Table 5. The primary results for the four selected aspects can
be described as follows:
(i) Initial Price Level: Consistent with the monopoly case, when the
diffusion processes of both firms are less dependent on imitation
effects than on innovation effects and both firms are established
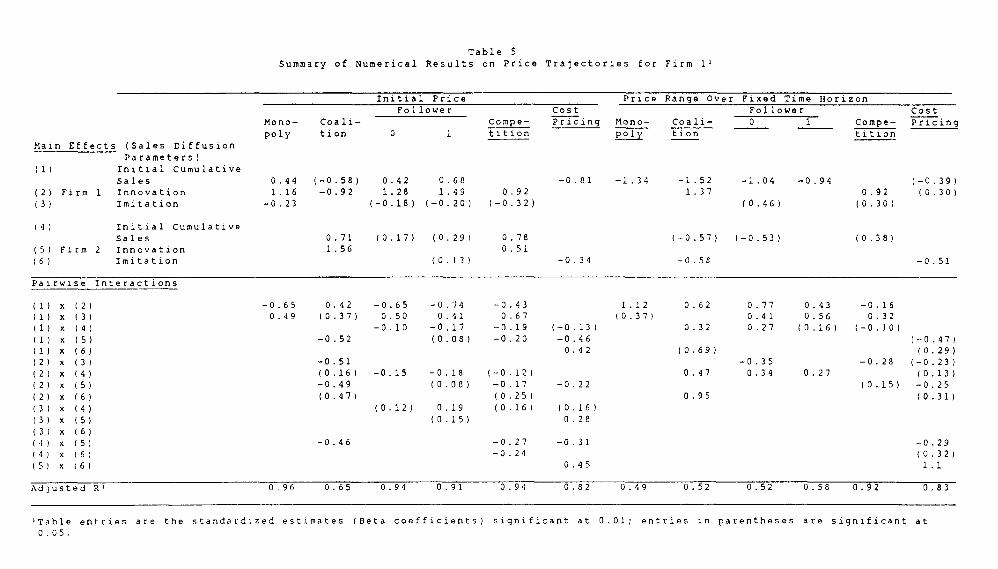
1.12
-0.65 0.92 -0.65 -0.74 -0.43
0.49 (0.37) 0.50 0.41 0.67
-0.10 -0.17 -0.19 (-0.13)
-0.52 (0.08) -0.20 -0.46 0.42
0.62 0.77 0.41
0.32 0.27 (0.37)
0.43 0.56
(0.16)
(0.69)
-0.35 0.47 0.34 0.27
-0.22
0.95
(0.16)
0.28
-0.31
0.95
-0.16 0.32
(-0.10)
(-0.47)
(0.29)
-0.28 (-0.23)
(0.13)
(0.15) -0.25
(0.31)
-0.29 (0.32)
1.1
-0.51
(0.16) -0.15 -0.18 (-0.12)
-0.49 (0.08) -0.17
(0.47) (0.25)
(0.12) 0.19 (0.16)
(0.15)
-0.46 -0.27
-0.24
Table 5
Summary of Numerical Results on Price Trajectories for Firm 1 1
Initial Price Price Range Over Fixed Time Horizon
Follower Cost Follower Cost
Mono- Coali- Compe- Pricing Mono- Coali- 0 1 Compe- Pricing
poly tion 0 1 tition poly tion tition
Main Effects (Sales Diffusion
Parameters)
(1) Initial Cumulative
Sales
(2) Firm 1 Innovation
(3) Imitation
0.44 (-0.58) 0.92 0.68
1.16 -0.92 1.28 1.49 0.92
-0.23 (-0.18) (-0.20) (-0.32)
-0.81 -1.34 -1.52 -1.04 -0.94 (-0.39)
1.37 0.92 (0.30)
(0.96) (0.30)
(4) Initial Cumulative
Sales
0.71 (0.17) (0.29) 0.78
(-0.57) (-0.53) (0.38)
(5) Firm 2 Innovation
1.56 0.51
(6) Imitation
(0.13) -0.34 -0.58 -0.51
Pairwise Interactions
Àdjusted 0.96
0.65 0.94
0.91 0.94
0.82
0.49 0.52
0.52 0.58
0.92 0.83
)Table entries are the standardized estimates (Beta coefficients) significant at 0.01; entries in parentheses are significant at
0.05.
Summary of Numerical
Table 5 (cont'd)
Results on Price Trajectories for Firm 11
Period in Which Maximum Price was Reached Mean Price
Follower Cost Follower Cost
Mono- Coali- Compe- Pricing Mono- Coali- Compe- Pricing
poly tion 0 1 tition poly tion 0 1 tition
Main Effects (Sales Diffusion Parameters)
(1) Initial Cumulative
Sales -0.69 -0.79 -0.84 -0.82 (0.22) -1.05 (0.29) (0.41) -0.76 -1.19
(2) Firm 1 Innovation -1.67 -1.30 -1.68 -1.59 -1.35 (-0.56) 1.03 -1.68 1.50 1.59 -0.42
(3) Imitation -0.36 (-0.37) (-0.26) -0.46 -0.86 (-0.31) -0.65
(4) Initial Cumulative
Sales -1.05 (-0.38) (-0.72) -0.99 (0.33) (0.25) (0.37) 0.98
(5) Firm 2 Innovation (-0.37) -0.91 0.86 0.67
(6) Imitation -0.63 0.27 (0.26) -0.34 -0.38
Pairwise Interactions
(1) x (2) 0.47 (-0.20) 0.52 0.53 0.69 (0.17) -0.82 0.42 -0.77 -0.86 -0.32 0.12
(1) x (3) (-0.27) 0.61 0.34 0.93 0.44 0.53
(1) x (4) (-0.57) (0.10) 0.32 -0.17 -0.23 -0.32 (-0.08)
(1) x (5) 0.28 (0.09) 0.45 -0.31 -0.28 -0.25 (1) x (6) (0.38) (-0.24) (0.32) 0.41
(2) x (3) 0.63 0.56 0.24 0.74 0.31 (0.10)
(2) x (4) 0.25 0.19 (0.13) 0.39 0.38 (0.14) -0.23 -0.25 -0.18
(2) x (5) 0.76 0.60 (0.11) 0.19 (0.24) 0.49 -0.25 -0.17 (-0.07)
(2) x (6) 0.62 0.59 (0.21)
(3) x (4) (0.17) 0.21
(3) x (5) (0. 29) (0.15) 0.28 0.20
(3) x (6) (-0.26) (-0.19)
(4) x (5) (0.16) 0.51 -0.32 -0.39 -0.20
(4) x (6) (0.20)
(5) x (6) 0.53
Adjusted 0.88 0.65 0.85 0.84 0.81 0.43 0.90 0.82 0.86 0.85 0.91 0.93
'Table entries are the standardized estimates (Geta coefficients) significant at 0.01; entries in parentheses are significant
at 0.05.

17.
in the market, initial prices for Firm 1 will be high under com-
petition and price following behavior. Under coalition, initial
prices for Firm 1 will be high when, relative to Firm 2, its
innovation effects are small and it entered the market later. If
Firm 2 as a new entrant resorts to cost pricing, incumbent Firm 1
will price high initially when the entrant's sales are driven
primarily by innovation rather than imitation.
(ii) Price Range Over Fixed Time Ho!izon: For established firms exer-.
cising cooperative behavior (i.e., coalition or price following),
the range of Firm l's prices over time will be narrow when its
sales diffusion is driven primarily by innovation effects where
that of the other firm is driven by imitation effects. Under
competition, the range of Firm l's prices will be narrow when it
is established and has a rapid sales diffusion process relative to
a new entrant. When Firm 2 opts for cost pricing, the range of
established Firm l's prices will be narrow when its sales diffu-
sion process is driven by innovation rather than imitation, the
reverse of the competitor's sales diffusion process.
(iii) Time Period in which Prices Will Peak: Prices for Firm 1 viii
peak early and decline monotonically afterwards when both firms
are established competitors and Firm 1 sales diffuse relatively
fast over time. This result generally holds irrespective of the
conduct of the competitor. In the case of cost pricing, this
result is strengthened when Firm 2's sales diffusion has a strong
innovation effect.
(iv) Mean Price Level: consistent with the monopoly case, the average
of Firm l's prices will be high when both established competitors
have sales diffusion processes with strong innovation and weak
imitation effects and Firm 2 exhibits price following behavior.
Under coalition and non-cooperative behavior (i.e., competition
and cost pricing) in a market with an established competitor whose
sales diffusion process is driven primarily by innovation effects,
18.
Firm 1, as a new entrant, will have a high average price level
when its sales diffuse slowly over time.
The regression results on the pairwise differences in mean price level
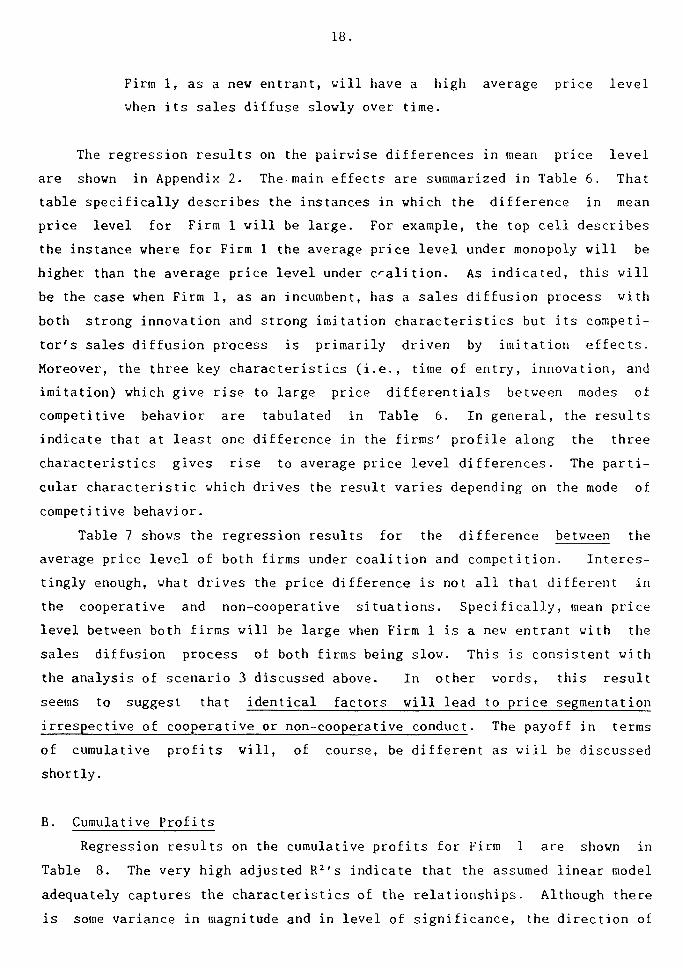
are shown in Appendix 2. The main effects are summarized in Table 6. That
table specifically describes the instances in which the difference in mean
price level for Firm 1 will be large. For example, the top cell describes
the instance where for Firm 1 the average price level under monopoly will be
higher than the average price level under coalition. As indicated, this will
be the case when Firm 1, as an incumbent, has a sales diffusion process with
both strong innovation and strong imitation characteristics but its competi-
tor's sales diffusion process is primarily driven by imitation effects.
Moreover, the three key characteristics (i.e., time of entry, innovation, and
imitation) which give rise to large price differentials between modes of
competitive behavior are tabulated in Table 6. In general, the results
indicate that at least one difference in the firms' profile along the three
characteristics gives rise to average price level differences. The parti-
cular characteristic which drives the result varies depending on the mode of
competitive behavior.
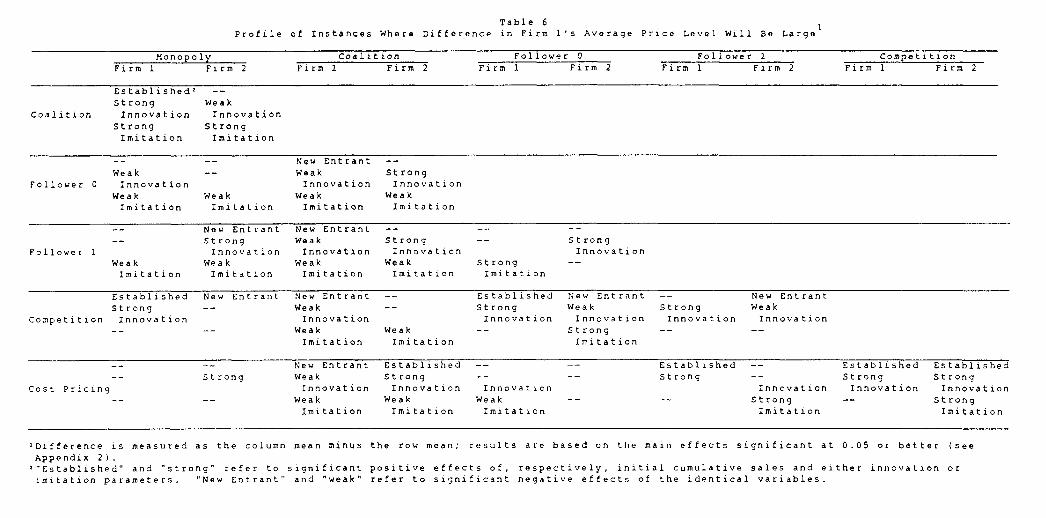
Table 7 shows the regression results for the difference between the
average price level of both firms under coalition and competition. Interes-
tingly enough, what drives the price difference is not all that different in
the cooperative and non-cooperative situations. Specifically, mean price
level between both firms will be large when Firm 1 is a new entrant with the
sales diffusion process of both firms being slow. This is consistent with
the analysis of scenario 3 discussed above. In other words, this result
seems to suggest that identical factors will lead to price segmentation
irrespective of cooperative or non-cooperative conduct. The payoff in terms
of cumulative profits will, of course, be different as vin. be discussed
shortly.
B. Cumulative Profits
Regression results on the cumulative profits for Firm 1 are shown in
Table 8. The very high adjusted R2's indicate that the assumed linear model
adequately captures the characteristics of the relationships. Although there
is some variance in magnitude and in level of significance, the direction of
Monopoly Coalition Follower 0 Follower 1 Competition Firm 1 Firm 2 Firm 1 Firm 2 Firm 1 Firm 2 Firm 1 Firm 2 Firm 1 Firm 2
Table 6 1 Profile of Instances Where Difference in Firm l's Average Price Level Will Be Large
Established 2 -- Strong Weak
Coalition Innovation Innovation Strong Strong Imitation Imitation
-- New Entrant -- Weak Weak Strong
Follower 0 Innovation Innovation Innovation Weak Weak Weak Weak Imitation Imitation Imitation Imitation
New Entrant New Entrant -- -- Strong Weak Strong Strong
Follower 1 Innovation Innovation Innovation Innovation Weak Weak Weak Weak Strong -- Imitation Imitation Imitation Imitation Imitation
Established New Entrant New Entrant Established New Entrant -- New Entrant Strong -- Weak -- Strong Weak Strong Weak
Competition Innovation Innovation Innovation Innovation Innovation Innovation -- Weak Weak -- Strong -- --
Imitation Imitation Imitation
Cost Pricing
-- New Entrant Established -- Established -- Established Established Strong Weak Strong -- Strong -- Strong Strong
Innovation Innovation Innovation Innovation Innovation Innovation Weak Weak Weak Strong -- Strong Imitation Imitation Imitation Imitation Imitation
,Difference is measured as the column mean minus the row mean; results are based on the main effects significant at 0.05 or better (sec Appendix 21. ,"Established" and "strong" refer to significant positive effects of, respectively, initial cumulative sales and either innovation or imitation parameters. "New Entrant" and "weak" refer to significant negative effects of the identical variables.
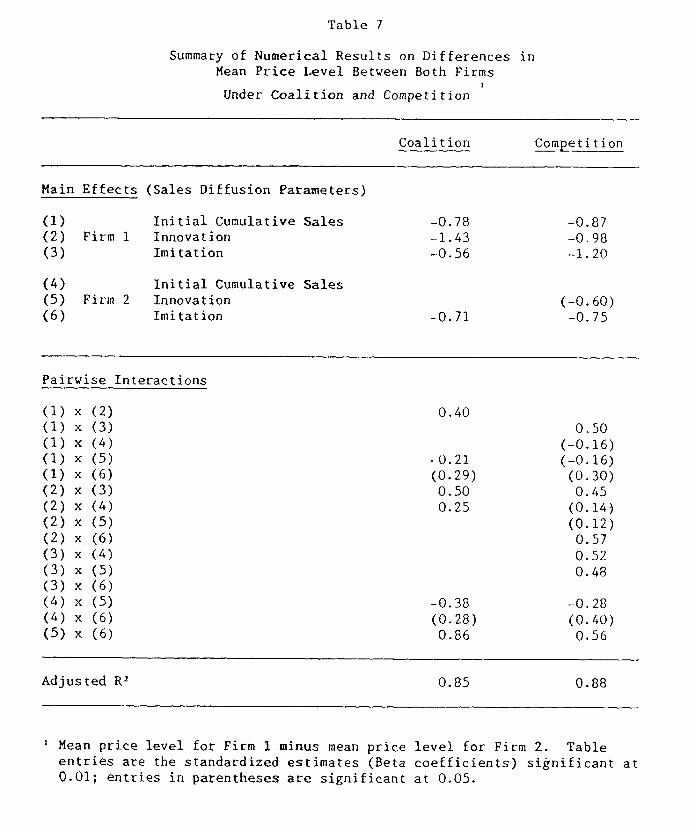
Table 7
Summary of Numerical Results on Differences in Mean Price Level Between Both Firms
Under Coalition and Competition
Coalition Competition
Main Effects (Sales Diffusion Parameters)
(1) Initial Cumulative Sales (2) Firm 1 Innovation
(3) Imitation
(4) Initial Cumulative Sales (5) Firm 2 Innovation (6) Imitation
-0.78 -1.43 -0.56
-0.71
-0.87 -0.98 -1.20
(-0.60) -0.75
Pairwise Interactions
(1) (1)
x x (2) (3)
0.40 0.50
(1) x (4) (-0.16) (1) x (5) -0.21 (-0.16) (1) x (6) (0.29) (0.30) (2) x (3) 0.50 0.45 (2) x (4) 0.25 (0.14-) (2) x (5) (0.12) (2) x (6) 0.57 (3) x (4) 0.52 (3) x (5) 0.48 (3) x (6) (4) x (5) -0.38 -0.28 (4) x (6) (0.28) (0.40) (5) x (6) 0.86 0.56
Adjusted R2
0.85 0.88
' Mean price level for Firm 1 minus mean price level for Firm 2. Table entries are the standardized estimates (Beta coefficients) significant at 0.01; entries in parentheses are significant at 0.05.
Table 8
Summary of Numerical Results on Cumulative Profits for Firm 1 2
Competitive Environment
Monopoly Coalition
Follower
Competition
Cost
Pricing 0 1
Main Effects (Sales Diffusion Parameters)
(1) Initial Cumulative Sales 0.32 0.24 0.31 0.35 0.29 (2) Firm 1 Innovation 1.14 1.07 1.17 1.14 0.13 0.90 (3) Imitation 0.52 0.46 0.62 0.61 0.68 0.62
(4) Initial Cumulative Sales 0.14 0.27 0.23 0.26 0.35 (5) Firm 2 Innovation 0,16 0.21 0.17 (0.14) (0.10) (6) Imitation (-0.07) (-0.07) -0.37
Pairwise Interactions
(1) x (2) -0.42 -0.34 -0.35 -0.37 -0.37 -0.33 (1) x (3) 0.23 0.18 0.11 0.11 0.12 -0.09 (1) x (4) -0.09 -0.09 -0.10 -0.11 -0.17 (1) x (5) (-0.04) -0.10 -0.08 -0.23 (1) x (6) 0.29 (2) x (3) -0.16 -0.18 -0.25 -0.19 -0.23 -0.24 (2) x (4) -0.13 -0.11 -0.08 -0.14 -0.10
(2) x (5) -0.10 -0.11 -0.09 (-0.04) -0.14 (2) x (6) (0.11) (0.10) (0.06) 0.18 0.21 (3) x (4) 0.09 0.12 0.16 0.12 (3) x (5) 0.07 (-0.06) 0.13
(3) x (6) (0.13)
(4) x (5) -0.07 -0.07 -0.19 (4) x (6) (5) x (6) (-0.11) 0.38
Adjusted R 2 0.98 0.99 0.98 0.99 0.99 0.98
2 Table entries are the standardized estimates (Beta coefficients) significant at 0.01; entries in parentheses are significant at 0.05.
19.
the effects are quite similar across the modes of competitive behavior.
Accordingly, the selected diffusion process parameters enhance cumulative
profits of Firm 1 identically irrespective of the conduct of the competitor.
Specifically, rapid diffusion and early entry enhance profits for Firm 1
particularly when its competitor's sales diffusion process is characterized
by weak imitation effects. Innovation is the dominating factor in determin-
ing cumulative profits over a fixed time horizon across all modes of
competitive behavior except competition. Under competition (i.e., Nash
equilibrium), imitation is the dominating fa-_tor.
The regression results on pairwise differences in cumulative profits
obtained under each mode of competitive behavior are shown in Appendix 3.
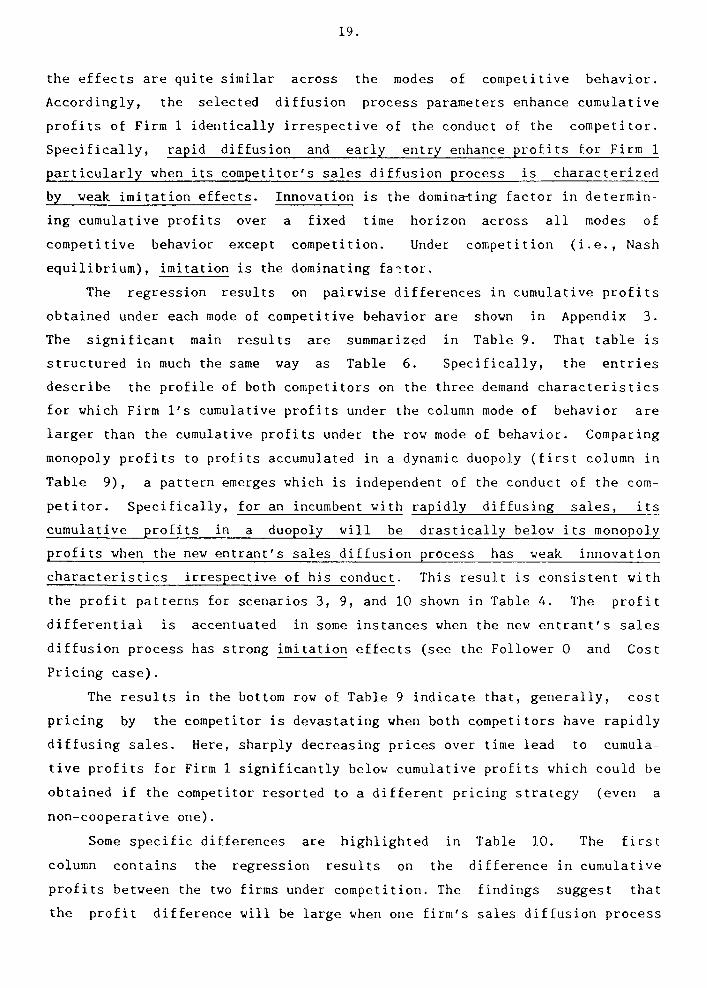
The significant main results are summarized in Table 9. That table is
structured in much the same way as Table 6. Specifically, the entries
describe the profile of both competitors on the three demand characteristics
for which Firm l's cumulative profits under the column mode of behavior are
larger than the cumulative profits under the row mode of behavior. Comparing
monopoly profits to profits accumulated in a dynamic duopoly (first column in
Table 9), a pattern emerges which is independent of the conduct of the com-
petitor. Specifically, for an incumbent with rapidly diffusing sales, its
cumulative profits in a duopoly will be drastically below its monopoly
profits when the new entrant's sales diffusion process has weak innovation
characteristics irrespective of his conduct. This result is consistent with
the profit patterns for scenarios 3, 9, and 10 shown in Table 4. The profit
differential is accentuated in some instances when the new entrant's sales
diffusion process has strong imitation effects (see the Follower 0 and Cost
Pricing case).
The results in the bottom row of Table 9 indicate that, generally, cost
pricing by the competitor is devastating when both competitors have rapidly
diffusing sales. Here, sharply decreasing prices over time lead to cumula-
tive profits for Firm 1 significantly below cumulative profits which could be
obtained if the competitor resorted to a different pricing strategy (even a
non-cooperative one).
Some specific differences are highlighted in Table 10. The first
column contains the regression results on the difference in cumulative
profits between the two firms under competition. The findings suggest that
the profit difference will be large when one firm's sales diffusion process
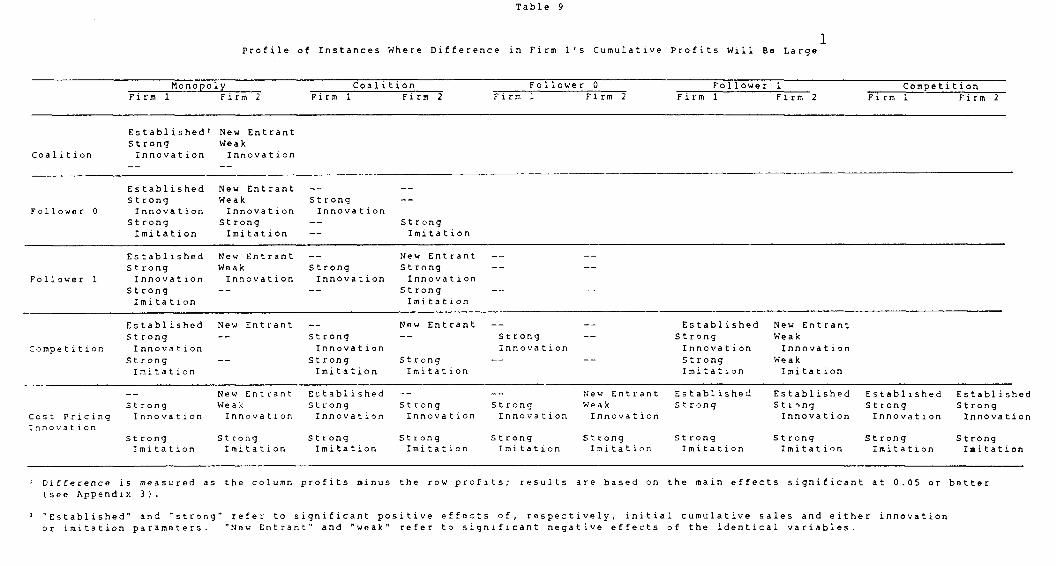
Table 9
1 Profile of Instances Where Difference in Firm l's Cumulative Profits Will Be Large
Monopoly Coalition Follower 0 Follower 1 Competition Firm 1 Firm 2 Firm 1 Firm 2 Firm 1 Firm 2 Firm 1 Firm 2 Firm 1 Firm 2
Coalition
Established 2 New Entrant Strong Weak Innovation Innovation
Follower 0
Established New Entrant -- Strong Weak Strong Innovation Innovation Innovation
Strong Strong Strong Imitation Imitation Imitation
Follower 1
Established New Entrant -- New Entrant -- Strong Weak Strong Strong -- Innovation Innovation Innovation Innovation
Strong -- -- Strong Imitation Imitation
Competition
Established New Entrant -- New Entrant -- Established New Entrant Strong -- Strong -- Strong Strong Weak Innovation Innovation Innovation Innovation Innovation
Strong -- Strong Strong -- Strong Weak Imitation Imitation Imitation Imitation Imitation
Cost Pricing Innovation
-- New Entrant Established -- -- New Entrant Established Established Established Established Strong Weak Strong Strong Strong Weak Strong Stclng Strong Strong Innovation Innovation Innovation Innovation Innovation Innovation Innovation Innovation Innovation
Strong Strong Imitation Imitation
Strong Strong Imitation Imitation
Strong Strong Imitation Imitation
Strong Strong Imitation Imitation
Strong Strong Imitation Imitation
Difference is measured as the column profits minus the row profits; results are based on the main effects significant at 0.05 or better (see Appendix 3).
2 "Established" and "strong" refer to significant positive effects of, respectively, initial cumulative sales and either innovation or imitation parameters. "New Entrant" and "weak" refer to significant negative effects of the identical variables.
Table 10
Results orlDifferences in Cumulative Profits
Both Firms Between Both Under Firms Under Coalition and
2
Competition Competition
Main Effects (Sales Diffusinu Parameters)
(1) Initial Connelwtive Sales (2) Firm 1 Innovation 0.81 1.60
(3) Imitation 1.55
(4) Initial ConeUnive Sales -0.38 (5) Firm 2 Innovation -0.51 -2.25 (6) Imitation 0.50 (0.81) Pairwise Interactions
(1) x (2) -0.25 (1) x (3) (1) x (4) (1) x (5) 0.07 (1) x (6) (2) x (3) -0.17 (-0.68) (2) x (4) (-0.06) (2) x (5) (2) x (6) -1.36 (3) x (4) (3) x (5) 1.21 (3) x (6) -2.09 (4) x (5) 0.30 (4) x (6) (0.16) (5) x (6) -0.27 1.15
Adjusted R2 0.99 0.48
' Table entries are the !slamdardized estimates (Beta coefficients) significant at 0.01; entries in parenükeses are significant at 0.05.
2 Measure of incéntive Uo meperate for both firms, defined as [Profits (Firm 1,Coalition)-ProfitstF•i:rn I, Competition)] x [Profits(Firm 2, Coalition)- Profits(Firm 2,Competivional.
20.
has strong innovation characteristics whereas the new entrant's process has
weak innovation but strong imitation characteristics.
The second set of regression results shown in Table 10 provide some
insight into instances where cooperative behavior (i.e., coalition) would be
mutually beneficial. The dependent measure vas constructed as the difference
in cumulative profits for one firm under coalition and competition times the
same difference for the other firm. A large positive value would imply that
both competitors would benefit tremendously from coalition. Keeping in mind
that the linear model captured only 48% of .he variance in the dependent
measure, the results suggest that order of entry does not impact the
desirability of cooperation. Strong imitation effects and asymmetries in
innovation effects should drive both competitors from competition to coali-
tion. These diffusion process characteristics also identify instances where
competition should be avoided in product line pricing.
7. SUMMARY AND DISCUSSION
The optimal price trajectories derived for a dynamic duopoly are of
three types: (a) pure penetration (i.e., monotonically increasing), (b) pure
skimming (i.e., monotonically decreasing), and (c) an initial phase of
penetration followed by a period of skimming. These shapes also characterize
profit maximizing price trajectories in a monopoly situation (Kalish 1983).
In light of these results, it is insightful to discuss the major results
obtained in this research in contrast to the monopoly situation. As such,
the impact of a different mode of competitive pricing behavior on the shape
of optimal price trajectories can be better understood.
Under monopoly, the price trajectories are primarily of type (a) and
type (b). One striking result obtained here is that across various
scenarios, initial penetration pricing is much more prevalent in a monopoly
ahan in a duopoly irrespective of the conduct of the competitor. Relative to
a duopoly, one product cannot span the market as well as two products can
(sold at the same price). The hazard rate in the sales diffusion process
tends to be lower since there are no cross product effects. Therefore, the
firm has to execute the penetration effort alone and more intensively.
21.
Under coalition, the shape of the optimal price trajectories varies the
mort across scenarios. Except for price following behavior, prices
generally tend to be higher under coalition than under different modes of
competitive pricing behavior. Basically, the two-product coalition strategy
consists of price segmentation: the dominant (high hazard rate) product is
mass-marketed through relatively low pricing and the weaker product is tar-
geted with a higher price tag at a market niche comprised of potential buyers
with high reservation prices. The segmentation is entirely dependent on the
asymmetry in diffusion process characteristi.ls, with the price differential
being dictated by the degree of asymmetry. Under symmetric diffusion, the
price trajectories for both firms coincide. Cumulative profits were
generally larger for the "fast diffusion" partner as the niche strategy
tended to weaken the profit position of the other firm.
Across scenarios, the optimal price trajectories under price following
behavior are similar in shape to the monopoly price trajectories and are
generally the highest among all modes of competitive pricing behavior. An
intelligent price leader viii recognize the passive pricing behavior of his
competitor and an implicit form of coalition will be established. These
results are to some extent consistent with Axelrod's (1984) assertion that a
tit-for-tat strategy leads to cooperation. Instantaneous and delayed price
following lead to very similar trajectories until the last period. There,
under delayed following behavior, the price leader will take advantage of the
response delay by slashing his price drastically (i.e., an endgame move).
Delayed response also enhances cumulative profits for the price leader.
Under instantaneous price following, optimal price trajectories for the price
leader coincide exactly with his coalition price when both firms have per-
fectly symmetric diffusion processes.
When the competitor resorts to cost pricing, the optimal price trajec-
tories are generally of type (b). The degree of skimming is largely
dependent on whether this naive predation strategy characterizes competitive
conduct early or late in thé product life cycle. Early on, the predator
takes upon himself the burden of developing the market by charging low
prices. The optimal pricing strategy of the other firm is skimming with very
high initial prices. Interestingly, cumulative profits for this firm are not
the lowest among those obtained under various modes of competitive pricing

22.
behavior. If predation begins later in the life cycle, the skimming trajec-
tories are more defensive with lower initial prices and narrower ranges over
the fixed time horizon. It should also be noted that cost pricing (or any
strategy where the price is purposely kept at a low but constant level) is
not an optimal predatory strategy. Altho'igh not explicitly analyzed here,
the results suggest that such an optimal strategy would likely be of the
skimming type with high initial prices in an attempt to slow down or halt the
diffusion process (and, hence, market development) followed by low prices to
grab market share.
Under competition (Nash equilibrium), the optimal price trajectories
tend to be similar in shape to the corresponding optimal monopoly trajec-
tories (except in early stages where monopoly trajectories exhibit penetra-
tion characteristics). As one would expect, however, they manifest
themselves at much lower levels.
Recognizing that competitive conduct can differ, these results supple-
ment the established insights on strategic pricing in non-monopolistic
markets. They were, however, derived in a specific framework. Relaxing the
constraints of the current study constitutes a fruitful avenue for future
research. Another avenue for future research would be some empirical work to
validate the normative results in real environments. Empirical research is
lacking in this general research area.
23.
FOOTNOTES
1. Eliashberg and Jeuland (1986) assume the hazard functions to be linear
in price and price differential.
2. A different approach is taken by Clarke and Dolan (1984). They relate
the reservation prices for both products directly and confine the diffu-
sion dynamics to non-stationary reservation prices.
3. In characterizing a choice rule, Hauser and Shugan (1983) also rely on
homotheticity which in the DEFENDER model is implied by the strict
assumption of parallel linear indifference curves.
4. Of the 256 scenarios, the percentage successfully solved over eight
consecutive time periods per mode of competitive behavior was: monopoly
(100%), coalition (70%), Follower 0 (78%), Follower 1 (88%), competition
(45%), and cost pricing (91%).
5. The price increase in the last period of scenario 8 for Follower 0 is a
numerical result and should not be interpreted substantively.
6. Note that under competition, the Firm 1 and Firm 2 results for
scenarios 5 and 6 and scenarios 7 and 8 should be mirror images.
However, some differences are observed which are a result of solving the
differential game problems numerically.
24.
REFERENCES
Axelrod, R. 1984. The Evolution of Cooperation. New York, N.Y.: Basic
Books, Inc.
Bass, F. M. 1969. A New Product Growth Model for Consumer Durables.
Management Science 15, 215-227.
Bass, F. M. 1980. The Relationship Between Diffusion Rates, Experience
Curves, and Demand Elasticities for Consumer Durable Technical
Innovations. Journal of Business 53: 551-567.
Clarke, D. G. and R. J. Dolan. 1984. A Simulation Analysis of Alternative
Pricing Strategies for Dynamic Environments. Journal of Business 57:
S179-S200.
Eliashberg, J. and R. Chatterjee. 1985. Analytical Models of Competition
with Implications for Marketing: Issues, Findings, and Outlook. Journal
of Marketing Research 22: 237-261.
Eliashberg, J. and A. P. Jeuland. 1986. The Impact of Competitive Entry in a
Developing Market Upon Dynamic Pricing Strategies. Marketing Science 5:
20-36.
Hauser, J. R. and S. M. Shugan. 1983. Defensive Marketing Strategies.
Marketing Science 2: 319-360.
Jeuland, A. P. 1981. Parsimonious Models of Diffusion and Innovation. Part
B. Incorporating the Variable Price. Working Paper, Center for Research
in Marketing, University of Chicago.
Kalish, S. 1983. Monopolistic Pricing with Dynamic Demand and Production
Costs. Marketing Science 2: 135-159.
25.
Kendrick, D. and A. Meeraus. 1985. GAMS. Washington, D.C.: The World Bank.
Nascimento, F. and W. R. Vanhonacker. 1988. Optimal Strategic Pricing of
Reproducible Consumer Products. Management Science 34: 921-937.
Pindyck, R. S. 1978. Gains to Producers from the Cartelization of
Exhaustible Resources. Review of Economics and Statistics 60: 238-251.
Rao, R. C. and F. M. Bass. 1985. Competitpn, Strategy, and Price Dynamics:
A Theoretical and Empirical Investigation. Journal of Marketing Research
22: 283-296.
Spence, A. M. 1981. Learning Curve and Competition. The Bell Journal of
Economics 12: 49-70.
Thompson, G. L. and J. T. Teng. 1984. Optimal Pricing and Advertising
Policies for New Product Oligopoly Models. Marketing Science 3: 148-169.
Wernerfelt, B. 1985. The Dynamics of Prices and Market Shares Over the
Product Life Cycle. Management Science 31: 928-939.
Wernerfelt, B. 1986. A Special Case of Dynamic Pricing Policy. Management
Science 32: 1562-1566.
26.
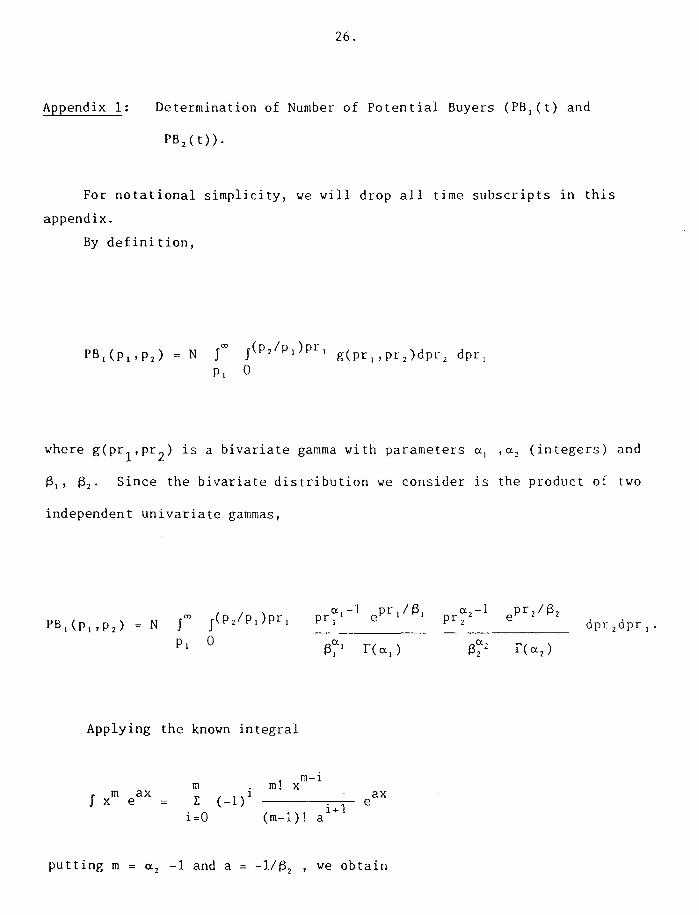
Appendix 1: Determination of Number of Potential Buyers (PB1(t) and
PB,(0).
For notational simplicity, we will drop all time subscripts in this
appendix.
By definition,
PB,(p„p,) = N J f(P2/101)Pri g(pr„Pr2)dPr2 dpr1
PI 13
where g(prl,pr2) is a bivariate gamma with parameters a1 / a 2 (integers) and
0,, S2• Since the bivariate distribution we consider is the product of two
independent univariate gammas,
PB1(P1,P2) = N (P /P )Pr S 2 1 I
o
pr eΠ-1 pr
' /0' Pr a2-1 epr2/0.2
i' , dpr,dpri.
Qat oc 2' r(Œt) P-• 2 F(a2)
Applying the known integral
m , mt xm-i f x
m eax
= E (-1)". eax
i=0 (m-1)! a
putting m = a, -1 and a = -1/0, , we obtain
pr, a
2-1-i OC 2-1
02
e-pr,/e,
i=0 02 x2-1 (Œ2-1-0!
or
PB1(PI,P2) =
pr i a,-1
epri C,
N
PI 131 œ1 r(<11)
(P2/P1)Pr, dpr i (1-2)
0
PB,(P 1 ,P 2 )
27.
pria,-1e
N f
Pl 01 1 r(al)
a2-1 (cc -1)! pr 2 (OE2 1 1) e-pr 2/02
E(-1) '
02a2(Œ2-1)! i=0 (a2-1-i)! (-1702)1+1
(P2/P1)Pri dpr i
0
CC2 - 1 - i = (X 2 - 1
az - 1 - i = a2 - 2
a,
az
- 1
- 1
i
- i
=
=
a,
0
- 1
Since
for i = 0
for i = 1
for i = a2 - 2
and for i = a, - 1
- (x2 + 2 = 1,
we can replace a, - 1 - i by i. Accordingly, expression (1-2) becomes
pr a,-1 aa,-1 pr i ,
, P13 1(131 /P2) = N f a
(1 -
P1 01 r(al)
a2-1 PrIP2 (3- E e 2 p 1
i=0
Pr,
1 - }dpri . i!
13
a2 -1
E
i=0
al -l+i
E (-1) j j=0 (a1 -1+i-j)! (1 + 1
13; 737
(a1-1+i)! pria,-144-i
P2
pi
1
28.
Again applying integral
part, and rearranging
PB1(p1,p2) = N
Ce 2-1 co
- ( E f e-pr
i=0 PI
Again applying
the
-pr,
(1-1) setting
second part,
- - cx1 -1
E
m = Π2
i 1
i!
m =
we obtain:
- 1 and
œ
Pi
0.--2 5- 13'c'
al -1 + i
a
--!
P2
Pi
and
i
a =
= -1/02 to
1
the first
dpr,).(1-3)
P2
PI
e (31
1
'(-- +
°2
integral
[pr,
i=0 si
1
-- 12±) pri a,+i-1
°1 PI
(1-1) putting
(a1 -1)!
1 1 -- +
°I 02
PB 1(pip2) becomes
-p, al -1
PB,(p1,p2) = N e t31 E
i=0
i Pr: 1
5, i!
-KI( 1.4- -4- 1-z-) P2 PI P1 al
+i-1 +i-1
e Pr: -i ΠI
P a
2 PI
P2
P 1
i 1 CO
P1 (a, -1)!
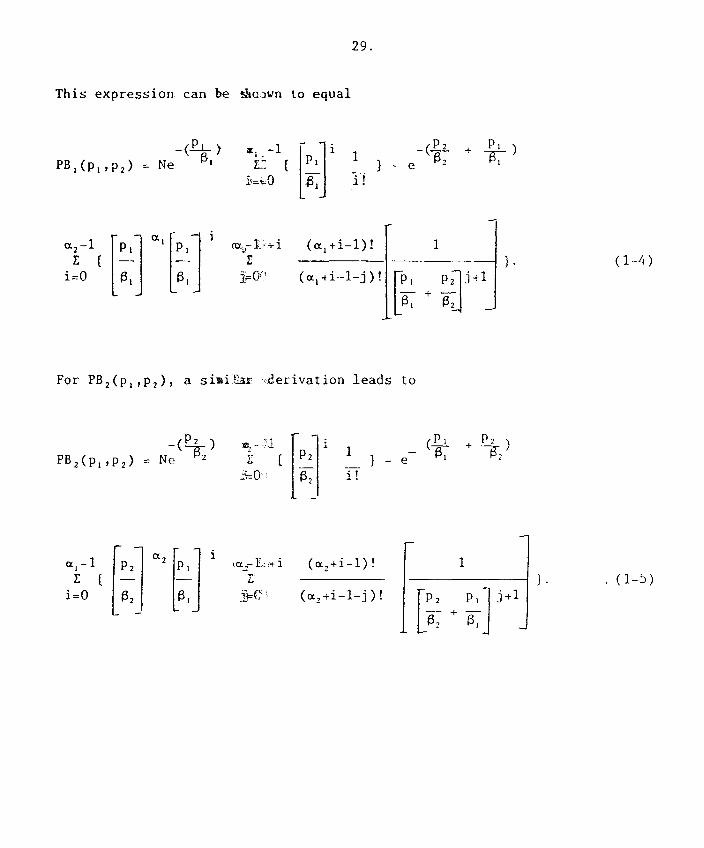
pi
ei i!
P2 PI )
- e f32 P131(p„p2) = Ne -'
a,
) •
oi
a2 -1 E
i=0 (1-4)
p, pfli,1
f7:
1 axe I' i (al+i-1)!
1=0 (al+i-1-j)!
This expression can be gic.Dwn to equal
29.
For F13 2(PI /P2), a simigl , erivation leads to
) 114,- PB 2 (pi , p 2 ) = Ne Pz E
PI P2
- T 73-2 1 )
i! P2
ai -1 E
i=0
P2 «2
P, (a2+i-1)! L.
j'mC (a2+i-1-j)!
1 . (1-5)
02
[pi: J+1
Appendix 2: Table 2-1
Summarv of Numerical Recuits on Differences in Mean Price Level for Firm 1 1
Monopoly Versus Coalition Versus
Follower Cost Follower Cost
Coalition 0 1 Competi- Pricing 0 1 Competi- Pricing
tion tion
Main Effects (Sales Diffusion
Parameters)
(1) Initial Cumulative Sales 0.96. 0.76 -1.00 -1.05 (-1.29) -0.55
(2) Firm 1 Innovation 1.87 -0.67 1.03 -1.95 -2.14 (-1.54) -1.86
(3) Imitation (0.42) -0.91 (-0.43) -0.62 (-0.49) (-1.66) -1.14
(4) Initial Cumulative Sales -0.58 -0.82 (0.49)
(5) Firm 2 Innovation -0.72 (0.36) (1.28) 0.74 1.07 1.29
(6) Imitation 0.49 -0.53 -0.37 -0.60 0.59 (-0.89) -0.55
Pairwise Interactions
(1) x (2) -0.70 -0.34 -0.37 -0.72 -0.66 0.71 0.59 0.49
(1) x (3) 0.59 0.48 (0.28) (0.47) 0.42
(1) x (4) 0.30 0.40 0.28
(1) x (5) 0.27 0.20 (-0.31) -0.28 -0.37 (-0.17)
(1) x (6) (-0.37) (0.33) (-0.79) (0.37) (0.44)
(2) x (3) -0.55 0.77 0.44 0.66 0.74 (0.72) 0.90
(2) x (4) (-0.14) 0.37 0.44 (0.14) 0.20 (0.22)
(2) x (5) (0.16) (-0.14) (-0.20) -0.27 -0.27
(2) x (6) -0.50 (0.32) (0.33) (0.51) 0.63 0.66
(3) x (4) -0.34 -0.33
(3) x (5) -0.31 -0.34 (-0.21) (-0.28) -0.44
(3) x (6) (0.46) -0.26
(4) x (5) 0.28 0.35 -0.28 -0.34
(4) x (6) (-0.33) (-0.99)
(5) x (6)
Adjusted R 0.83 0.72 0.80 0.88 0.34 0.79 0.75 0.29 0.81
1 Table entries are the standardized estimates (Beta coefficients) significant at 0.01: entries in parentheses are
significant at 0.05.
Table 2-1 (cont'd)
Summary of Numerical Results on Differences in Mean Price Level for Firm 1 1
Follower O Versus Follower 1 Versus
Follower 1 Competition
Cost
Pricing Competition Cost
Pricing
Competition Versus
Cost Pricing
Main Effects (Sales Diffusion
Parameters)
(1) Initial Cumulative Sales (0.80) 1.31 0.99
(2) Firm 1 Innovation (1.55) 1.49 1.27 (0.40)
(3) Imitation (0.73) (-1.06)
(4) Initial Cumulative Sales (-0.94) (-0.89) (0.50)
(5) Firm 2 Innovation (0.69) (-0.62) (-1.02) 0.86
(6) Imitation (0.48) 0.50 (0.30)
Pairwise Interactions (1) x (2) (-0.58) (-0.62) 0.57 -0.41
(1) x (3) (0.48) (0.21) 0.32
(1) x (4) (0.23) (0.16)
(1) x (5) (-0.23) (0.28) (0.40) 0.30 (0.13)
(1) x (6) (-0.41) 0.57
(2) x (3) (-0.36) (-0.44) (-0.43) (-0.16)
(2) x (4) -0.15 -0.17
(2) x (5) (-0.26) (0.24) (0.32) (0.30) (0.14)
(2) x (6) (-0.35)
(3) x (4) (0.60)
(3) x (5) (-0.39) -0.41
(3) x (6) (4) x (5) (0.41) (0.50) 0.19 (0.14)
(4) x (6) -0.27 -0.32
(5) x (6) (-0.77) -0.45 -0.70
Adjusted R 0.26 0.78 0.31 0.61 0.86 0.93
1 Table entries are the standaudized estimates (Beta coefficients) significant at 0.01; entries in parentheses are significant
at 0.05.
Appendix 3: Table 3-1
Summarv of Numerical Results on Differences in Cumulative Profits for Firm 1 1
Monopoly Versus Coalition Versus Follower Cost Follower Cost
Coalition 0 1 Competi- Pricing 0 1 Competi- Pricing tion tion
Main Effects (Sales Diffusion
Parameters)
(1) Initial Cumulative Sales 0.52 (0.21) (0.21) 0.43 0.26
(2) Firm 1 Innovation 1.21 0.76 0.81 1.00 0.81 (0.28) 0.30 0.63 0.94
(3) Imitation 0.28 (0.24) (0.33) 0.58 0.60 0.43
(4) Initial Cumulative Sales -0.58 -0.38 -0.53 -0.69 -0.38 (-0.16) -0.38
(5) Firm 2 Innovation -0.67 (-0.29) -0.32 -0.51 (0.16) 0.13
(6) Imitation (0.14) 0.50 (0.19) 0.31 0.36 0.17
Pairwise Interactions
(1) x (2) -0.62 -0.43 -0.39 -0.53 -0.25 (-0.10) -0.15 -0.30
(1) x (3) 0.43 0.40 0.34 0.37 0.30 0.17 (0.10) (0.27)
(1) x (4) 0.32 0.14 0.26 0.29 (-0.03)
(1) x (5) 0.18 0.16 0.18 (0.08) 0.07 0.10 0.10 0.07
(1) x (6) -0.37
(2) x (3) (-0.16) -0.17 (-0.09) -0.17 -0.17
(2) x (4) 0.34 0.16 0.22 0.30 (-0.06) -0.19 -0.16 -0.12
(2) x (5) 0.16 0.15 0.16
(2) x (6) -0.39 (0.19) 0.20 (0.13)
(3) x (4) -0.25 -0.22 -0.35 -0.27' 0.13
(3) x (5) (0.13) (-0.12) (-0.16) -0.34 -0 11 -0.12
(3) x (6) 0.67 0.74 (0.13)
(4) x (5) 0.14 0.14 0.15 0.30 0.24 0.26 0.24 0.12
(4) x (6) (0.16)
(5) x (6) 0.40 -0.20 -0.27 -0.46 -0.59 -0.50 -0.28
Adjusted R 0.90 0.92 0.93 0.95 0.99 0.94 0.97 0.99 0.99
-4
1 Table entries are the standardized estimates (Beta coefficients) significant at 0.01; entries in parentheses are
significant at 0.05.
Table 3-1 (cont'd)
Summary of Numerical Results on Differences in Cumulative Profits for Firm 1 1
Main Effects (Sales Diffusion
Follower 0 Versus Follower 1 Versus
Follower 1 Competition
Cost
Pricing Competition
Cost
Pricing
Compétition Versus
Cost Pricing
Parameters)
(1) Initial Cumulative Sales (0.28) (0.45) 0.45
(2) Firm 1 Innovation (0.76) 0.81 0.42 1.15 1.16
(3) Imitation 0.58 (0.21) 0.58 0.60
(4) Initial Cumulative Sales -0.38 (-0.30) 0.13 (0.20)
(5) Firm 2 Innovation -0.51 (-0.27 0.17 0.33
(6) Imitation 0.50 0.14 0.18
Pairwise Interactions
(1) x (2) 0.35 -0.25 -0.32 -0.36 -0.38
(1) x (3) 0.22 0.23
(1) x (4) (0.17) (-0.03)
(1) x (5) (-0.25) 0.07 -0.07 0.03 (0.06)
(1) x (6) -0.13
(2) x (3) -0.36 -0.62 -0.17 -0.19 -0.20
(2) x (4) (0.34) (-0.06) 0.27 -0.06 -0.17
(2) x (5) -0.37 (-0.03)
(2) x (6) (3) x (4) -0.41 (0.42) 0.76 0.13
(3) x (5) 0.57 -0.24
(3) x (6) -0.52 (-0.08)
(4) x (5) 0.30 -0.14 0.14
(4) x (6) (0.16) (0.15) (-0.09)
(5) x (6) -0.27 (0.23) -0.17 -0.33
Adjusted R 0.68 0.58 0.99 0.97 0.99 0.98
1 Table entries are the standardized estimates (Beta coefficients) significant at 0.01; entries in parentheses are significant
at 0.05.

Arnoud DE MEYER
Philippe A. NAERT Marcel WEVERBERGH and Guido VERSWIJVEL
86/03 Michael BRIMM
86/04 Spyros MAKRIDAKIS and Michèle HIBON
86/05 Charles A. VYPLOSZ
86/06 Francesco CIAVA22I, Jeff R. SBEEN and Charles A. VYPLOSZ
86/07 Douglas L. MacLACHLAN and Spyros HAKRIDAKIS
86/08 José de la TORRE and David H. NECKAR
86/09 Philippe C. BASPESLAGH
86/10 R. MOENART, Arnoud DR MEYER, J. BARBE and D. DESCHOOLMEESTER.
86/11 Philippe A. NAERT and Alain BULTE2
86/12 Roger BETANCOURT and David CAUTSCHI
86/13 S.P. ANDERSON and Damien J. NEVEU
86/14 Charles VALDMAN
86/15 Mihkel TOMRAg and Arnoud DE MEYER
1986
86/01
86/02
86/26 Barry EICHENGREEN "The econoeic conséquences of the Franc and Charles VYPLOSZ Poincare", September 1986.
86/28 Manfred KETS DE VRIES and Danny MILLER
"Interpreting organizational tees.
"Flexibility: the next competitive hattle,
86/29 Manfred KETS DE VRIES 'Why follov the leader?".
86/30 Manfred KETS DE VRIES 'The succession gamet the real story.
86/31 Arnoud DE MEYER
"The R & D/Production interface".
"Subjective estimation in Integrating communication budget and allocation decisions: e case study", January 1986.
"Sponsorship and the diffusion of organizational innovations a preliminary viev".
"Confidence intervals: an empirical investigation for the series in the H-Competition" .
"A note on the reduction of the vorkveek", July 1985.
"The real exchange rate and the fiscal aspects of e naturel resource discovery", Revised version: February 1986.
"Judgmental bisses in sales forecasting", February 1986.
"Forecasting political risks for international operations", Second Draft: March 3, 1986.
"Conceptualixing the strategic process in diversified firas: the role and nature of the corporate influence process", February 1986.
"Antlysing the issues concerning technological de-maturity".
'From "Lydiametry" to "Pinkhamization": ■isspecifying advertising dynamics rarely affects profitability".
"The economics of recel' firme, Revised April 1986.
"Spatial coepetition à la Cournot".
comparaison internationale des marges brutes du commerce', June 1985.
"Boy the manageriel attitudes of firas vith FMS differ from other manufacturing fins: survey results". June 1986.
86/16 B. Espen ECKBO and Hervig M. LANGOHR
86/17 David B. JEMISON
86/18 James TEBOUL and V. HALLERET
86/19 Rob R. VEITZ
86/20 Albert CORHAY, Gabriel HAVAWINI and Pierre A. MICHEL
86/21 Albert CORHAY, Gabriel A. flAWAVINI and Pierre A. MICHEL
86/22 Albert CORHAY, Gabriel A. HAVAWINI and Pierre A. MICHEL
86/23 Arnoud DE MEYER
86/24 David GAUTSCHI and Vithala R. RAO
86/25 H. Peter GRAY and Ingo WALTER
86/27 Karel COOL and Ingemar DIERIGKX
86/31 Arnoud DE MEYER, Jinichiro NAKANE, Jeffrey G. MILLER and Kasra FERDOVS
86/32 Karel COOL and Dan SCHENDEL
"Les primes des offres publiques, la note d'information et le *arche des transferts de contrôle des sociétés".
'Strategic capability transfer in acquisition intégration", May 1986.
"Tovards an operational definition of services", 1986.
"Nostradamus: a knovledge-based forecasting advisor".
"The pricing of equity on the London stock exchange: seasonolity and size preeium", June 1986.
"Risk-premla aeasonality in U.S. and European equity markets", February 1986.
"Stasonality in the risk-return relationships some international evidence", July 1986.
"An exploratory study on the integration of information systeas in nanufacturine, July 1986.
"A oethodology for specification and aggregation in product concept testing", Juiy 1986.
'Protection', August 1986.
"Negative risk-return relationships in business strategy: paradox or truism?", October 1986.
"Flexibility: the next coopetitive hattle, Revised Version: March 1987
Performance differences &sang strategic group me■bers", October 1986.
IMSEAD VORT.INC PAPERS SUIES
October 1986.

86/33 Ernst BALTENSPERGER and Jean DERMINE
86/34 Philippe HASPESLACH and David JEMISON
'The role of public policy in insuring financial stability: e cross-country, comparative perspective", August 1986, Revised
November 1986.
"Acquisitions: wyths and reality", July 1986.
87/06 Arun K, JAIN, Christian PINSON and Naresh K. KALHOTRA
87/07 Rolf BANZ and Gabriel HAVAWINI
*Customer loyalty as e construct in the aarketing of banking services", July 1986.
"Equity pricing and stock market anomalies", February 1987.
87/08 Manfred KETS DE VRIES 'Leaders vho can't manage", February 1987. 86/35 Jean DERMINE
86/36 Albert CORHAY and Gabriel HAVAVINI
86/37 David GAUTSCAI and
Roger BETANCOURT
86/38 Gabriel CAVAWINI
86/39 Gabriel HAVAVINI
Pierre MICHEL and Albert COREAY
86/40 Charles WYPLOSZ
86/41 Kasra FERDOVS and Vickham SKINNER
86/42 Kasra PERDONS and Per LINDBERG
86/43 Damien NEVEN
86/44 Ingemar DIERICKX Carmen MATUTES and Damien NEVEN
1987
87/01 Manfred KETS DE VRIES
87/02 Claude VIALLET
87/03 David GAUTSCHI and Vithala RAO
87/04 Sumantra CHOSHAL and Christopher BARTLETT
87/05 Arnoud DE MEYER and Kasra. PERDUS
"Measuring the market value of a bank, e primer', November 1986.
"Seasonality in the risk-return relationshipt some international evidence", July 1986.
'The evolution of retailing: e suggested
economic interpretation".
'Financial innovation and recent developments in the French capital markets', Updated: September 1986.
'The pricing of cannon stocks on the Brussela stock exchanget e re-examination of the evidence", November 1986.
'Capital flovs liberalization and the EMS, a French perspective", December 1986.
"Manufacturing in a nev perspective", July 1986.
"FMS as indicator of aanufacturing strategy", December 1986.
"On the existence of equilibriui in hotelling's sodel", November 1986.
"Value added tax and coapetition", December 1986.
'Prisoners of leadership".
"An eapirical investigation of international asset pricing", November 1986.
'A sethodology for specification and aggregation in product concept testing", Revised Version: January 1987.
"Organizing for innovations: case of the multinational corporation", February 1987.
"Kanagerial focal points in manufacturing strategy", February 1987.
"Entrepreneurial activities of European KBAs",
March 1987.
"A cultural viev of organizational change", March 1987
"Forecasting and loss functions", March 1987.
"The Janus Head: learning from the superior and subordinate faces of the manager's job", April 1987.
"Multinational corporations as diffcrentiated netvorks", April 1987.
"Product Standards and Competitive Strategy: An Analysis of the Principles", May 1987.
"KETAFORECASTING: Vays of improving Porecasting. Accuracy and Usefulness", May 1987.
"Tak_over attempts: vhat does the language tell
us?, June 1987.
"Managers' cognitive caps for upvard and dovnvard relationships", June 1987.
"Vhy the EMS? Dynamic games and the equilibrlum
policy regime, May 1987.
"A nev approach to statistIcal forccasting", June 1987.
"Strategy formulation: the impact of national
culture", Revised: July 1987.
"Conflicting Ideologics: structural and motivational conséquences", August 1987.
"The deaand for retail products and the household production atodel: nev vievs on complementarity and substitutabillty".
87/18 Reinhard ANGELMAR and "Patents and the European biotechnology lag: a Christoph LIEBSCHER study of large European phareaceutical firas",
June 1987.
87/09 Lister VICKERY, Mark PILKINCTON and Paul READ
87/10 André LAURENT
87/11 Robert FILDES and Spyros MAKRIDAKIS
87/12 Fernando BARTOLOME and André LAURENT
87/13 Sumantra CHOSHAL and Nitin NOURIA
87/14 candis LABEL
87/15 Spyros HAKRIDAKIS
87/16 Susan SCHNEIDER
and Roger DUNBAR
87/17 André LAURENT and Fernando BARTOLOME
87/19 David BEGG and Charles WYPLOSZ
87/20 Spyros MAKRIDAYIS
87/21 Susan SCHNEIDER
87/22 Susan SCUNEIDER
87/23 Roger BETANCOURT David GAUTSCHI

87/29 Susan SCHNEIDER and "Interpreting strategic behavior: basic Paul SHRIVASTAVA assumptions theres in organizations", September
1987
87/26 Roger BETANCOURT "Demand complementarities, household production and David GAUTSCHI and retail assortments", July 1987.
88/10 Bernard SINCLAIR- DESGAGNé
80/11 Dernard SINCLAIR. DESGACNé
"The robustness of some standard auction galle fonts", February 1988.
"nen atitionary atrategiee nr@ Pqm111brluu bidding strategyt The single-ergeginî property", February 19$8.
87/39 Manfred KETS DE VRIES "The dark side of CEO succession", November 1987
87/40 Carmen KATUTES and "Product compatibility and the scope of entry", Pierre RECIBEAU November 1987
"The internai and externat careers: a theoretical and cross-cultural perspective", Spring 1987.
"The robustness of KDS configurations in the face of incomplete data", March 1987, Revised: July 1987.
"Is there a capital shortage in Europe?", August 1987.
"Controlling the interest-rate risk of bonds: an introduction to duration analysis and immunization strategies", September 1987.
"Privatization: its motives and likely consequences", October 1987.
"Strategy formulation: the impact of national culture", October 1987.
87/41 Gabriel HAVAVINI and Claude VIALLET
87/42 Damien NEVEN and Jacques-F. TRISSE
87/43 Jean GABSZEVICZ and Jacques-F. TRISSE
87/44 Jonathan HAK/LTON, Jacques-F. TRISSE and Anita VESKAMP
87/45 Karel COOL, David JEMISON and Ingemar DIERICKX
87/46 Ingemar DIERICKX and Karel COOL
88/01 Michael LAVRENCE and Spyros MAKRIDAKIS
88/02 Spyros MAKRIDAKIS
88/03 James TEBOUL
88/04 Susan SCHNEIDER
88/05 Charles VYPLOSZ
88/06 Reinhacd ANGELMAR
88/07 Ingemar DIERICKX and Karel COOL
88/08 Reinhard ANGELMAR and Susan SCHNEIDER
88/09 Bernard SINCLAIR- DESGAGNé
"Seasonality, size premium and the relationship betveen the risk and the return of French coamon stocks", November 1987
"Coabining horizontal and vertical differentiation: the principle of max-min differentiation", December 1987
"Location", December 1987
"Spatial discrimination: Bertrand vs. Cournot in a Bodel of location choice", December 1987
"Business strategy, market structure and risk-return relationships: e causal interpretation", December 1987.
"Asset stock accumulation and sustainability of coapetitive advantage", December 1987.
"Factors affecting judgemental forecasts and confidence Intervale, January 1988.
"Predicting recessions and other turning points", January 1988.
"De-industrialise service for quality", January 1988.
'National vs. corporate culture: implications for huaan resource management", January 1988.
"The svinging dollar: is Europe out of step?", January 1988.
"Les conflits dans les canaux de distribution", January 1988.
"Competitive advantage: a resource based perspective", January 1988.
"Issues in the study of organizational cognition", February 1988.
"Price formation and product design through bidding", February 1988.
87/30 Jonathan HAMILTON V. Rentley MACLEOD and J. F. TRISSE
87/24 C.B. DERR and André LAURENT
87/25 A. K. JAIN, N. K. MALHOTRA and Christian PINSON
87/27 Michael BUROA
87/28 Gabriel HAVAVINI
87/31 Martine QUINZII and "On the optimality of central places", J. F. l'HISSE September 1987.
"German, French and British aanufacturing strategies less different than one thinks", September 1987.
"A process framevork for analyzing cooperation betveen firme, September 1987.
'European manufacturers: the dangers of couplacency. Insights fro■ the 1987 European aanufocturing futures survey, October 1987.
87/32 Arnoud DE MEYER
87/35 P. J. LEDERER and "Co■petitive location on netvorks under J. P. TRISSE discriminatory pricing", September 1987.
87/36 Manfred KETS DE VRIES "Prisoners of leadership", Revised version October 1987.
87/37 Landis LABEL
87/38 Susan SCHNEIDER
"Spatial competition and the Core", August 1987.
87/33 Yves DOZ and Amy SHEN
87/34 Kasra FERDOVS and Arnoud DE MEYER
1988

*The multinational corporation as a netvork: perspectives from interorganizational theory', May 1988.
88/28 Sumantra GHOSHAL and C. A. BARTLETT
88/12 Spyros MAKRIDAKIS
88/13 Manfred KETS DE VRIES
88/14 Alain NOEL
88/15 Anil DEOLALIKAR and Lars-Rendrik ROLLER
88/16 Gabriel RAVAVINI
88/17 Michael BURDA
88/18 Michael BURDA
88/19 M.J. LAVRENCE and Spyros MAKRIDAKIS
88/20 Jean DERMINE, Damien NEVEN and J.F. TRISSE
88/21 James TEBOUL
88/22 Lars-Hendrik RÔLLER
88/23 Sjur Didrik FLAM and Georges ZACCOUR
88/24 B. Espen ECKBO and Hervig LANGOHR
88/25 Everette S. GARDNER and Spyros MAKRIDAKIS
88/26 Sjur Didrik FLAN and Georges ZACCOUR
88/27 Murugappa KRISRNAN Lars-Rendrik RÔLLER
"Business firas and managers in the 21st century*, February 1988
"Alexithynia in organizational life: the organization man revisited", February 1988.
"The interpretation of strategies: a study of the impact of CEOs on the corporation", March 1988.
"The production of and returna from industrial innovation: an econoeetric analysis for a developing country", December 1987.
"Market efficiency and equity pricing: international evidence and implications for global investine, March 1988.
"Monopolistic coepetition, costs of adjustvent and the behavior of European esploysent", September 1987.
"Reflections on ',voit Unemployment" in Europe", November 1987, revised February 1988.
"Individual blas in judgements of confidence", March 1988.
"Portfolio selection by ■utual funds, an eguilibrium model", March 1988.
"De-industrialize service for guality", March 1988 (88/03 Revised).
"Proper Ouadratic Punctions vith an Application to AT&T", May 1987 (Revised March 1988).
"Equilibres de Nash-Cournot dams le marché européen du gaz: un cas où les solutions en boucle ouverte et en feedback coIncident", Mars 1988
"Information disclosure, ■eans of paysent, and takeover premia. Public and Private tender offers in France", July 1985, Sixth revision, April 1988.
"The future of forecasting", April 1988.
"Seri-coepetitive Cournot equilibrium in multistage oligopolies", April 1988.
"Entry rame vith resalable capacity", April 1988.
88/29 Naresh K. MALROTRA, Christian PINSON and Arun K. JAIN
88/30 Catherine C. ECKEL and Theo VERMAELEN
88/31 Sumantra GHOSRAL and Christopher BARTLETT
88/32 Kasra FERDOVS and David SACKRIDER
88/33 Mihkel M. TOMBAK
88/34 Mihkel M. TOMBAK
88/35 Mihkel M. TOMBAK
88/36 Vikas TIBREVALA and Bruce BUCHANAN
88/37 Murugappa KRISRNAN Lars-Rendrik ROLLER
88/38 Manfred KETS DE VRIES
88/39 Manfred KETS DE VRIES
88/40 Josef LAKON/SROK and Theo VERMAELEN
88/41 Charles VYPLOSZ
88/42 Paul EVANS
88/43 B. SINCLAIR-DDSGAGNE
88/44 Essam MAHMOUD and Spyros MAKRIDAKIS
88/45 Robert KORAJCZYK and Claude VIALLET
88/46 Yves DOl and Amy SHUEN
"Consumer cognitive eomplexity and the dimensionality of multidimensional scaling configurations", May 1988.
"The financial fellout from Chernobyl: risk perceptions and regulatory response", May 1988.
*Creation, adoption, and diffusion of innovations by subsidiaries of multinational corporations", June 1988.
"International manufacturing: positioning plants for success", June 1988.
"The importance of flexibility in aanufacturing", June 1988.
"Flexibility: an important dimension in manufacturing", June 1988.
'A strategic analysis of investeent in flexible eanufacturing systems*, July 1988.
"A Predictive Test of the no Modal that Contrôle for Non.,starionerlty". June 1188.
"Regulating Price-Liability Competition To Isprove Velfare", July 1988.
"The Motivating Role of Envy : A Forgotten Factor in Management, April 88.
"The Leader as Mirror : Clinical Reflections", July 1988.
"Anoaalous price behavlor around repurchase tender offers", August 1988.
"Assymetry in the EMS: intentional or systemic?", August 1988.
"Organizational development in the transnational enterprise", June 1988.
"Group decision support systems implement Rayesian rationality*, September 1988.
"The state of the art and future directions in combining forccasts", September 1988.
"An empirical investigation of international asset pricing", November 1986, reyised August 1988.
"From lntent to outcome: e process frasevork for partncrships", August 1988.

88/4/
Alain BULTEZ, "Asymmetric cannibalism between substitute
Els GIJSBRECHTS, items listed by retailers", Septernber 1988.
Philippe NAERT and Pie VANDEN ABEELE
88/48
Michael BORDA
"Reflections on 'Vait ttnemployment' in
Europe, II", April 1988 revised Septernber 1988.
"Information asymmetry and equity issues",
Septernber 1988.
"Managing expert systems: from inception
through updating", October 1987.
"Technology, vork, and the organization: the
impact of expert systems", July 1988.
"Cognition and organizational analysis: who's
minding the store?", Septernber 1988.
88/49 Nathalie DIERKENS
88/50
Rob VEITZ and
Arnoud DE MEYER
88/51 Rob VEITZ
88/52
Susan SCHNEIDER and
Reinhard ANGELMAR
88/53 Manfred KETS DE VRIES "Vhatever happened to the philosopher-king: the
leader's addiction to power, Septernber 1988.
88/54 Lars-ilendrik RÔLLER "Strategic choice of flexible production
and Mihkel M. TOMBAK technologies and velfare implications",
October 1988
88/55 Peter BOSSAERTS
and Pierre MILLION
88/56 Pierre MILLION
88/57 Wilfried VANHONACKER
and Lydia PRICE
88/58 B. SINCLAIR-DESGAGNE
and Mihkel M. TOMBAK
88/59 Martin KILDUFF
88/60 Michael BURDA
88/61 Lars-Hendrik RÔLLER
88/62 Cynthia VAN NULLE, Thco VERMAELEN and
Paul DE VOUTERS
"Method of moments tests of contingent clairon
asset pricing models", October 1988.
"Site-sorted portfolios and the violation of
the random walk hypothesis: Additional
empirical evidence and implication for tests
of asset plicing models", June 1988.
"Data transferability: entimeting the recponne
effect of future events based on historical
analogy", October 1988.
"Assessing economic inequality", November 1988.
"The interpersonal structure of decision
making: a social comparison approach to
organizational choice", November 1988.
"Is mismatch really the problem? Some estimates
of the Chelvood Gate II model with US data",
Septernber 1988.
"Modelling cost structure: the Bell System
revisited", November 1988.
"Régulation, taxes and the market for corporate control in Belgium", Septernber 1988.