Embed Size (px)
Citation preview

AD-R15g 095 USE OF HINGED STRAKES FOR LATERAL CONTROL AT HIGHANGLES OF RTTACK(U) RIR FORCE INST OF TECHWRIGHT-PATTERSON AFB OH R E ERB MAY 85
UNCLASSIFIED AFIT/C/HR-85-6T F/G 2e/4l
EIm/mmm/IE/I///EE-//EEIImlfilflR/imflfi.feEEEEElillli//EEilllllllliliu

1..
11 111_- 4 .6
MICROCOPY RESOLUTION TEST CHART
NATIONAL BUREAU OF STANDARDS- 963-A
'=,II~

[INI AS;e
SECURITY CLASSIFICATION OF THIS PAGE ('Whan DataEntered)
DOCUMENTATION PRUCTONSBEFORE COMPLETING FORM
I. REPORT NUMBER 2. GOVT ACCESSION NO. 3. RECIPIENT'S CATALOG NUMBER%IAFIT/CI/NR 85-61T
4. TITLE (and Subtitle) S. TYPE OF REPORT & PERIOD COVEREDn Use of Hinged Strakes for Lateral Control at THESIS/.I$RJAA7X"AI)PMHigh Angles of Attack
S. PERFORMING O11G. REPORT NUMBER
7. AUTHOR(s) 8. CONTRACT OR GRANT NUMBER(a)
00 Russell Earl ErbIn
9. PERFORMING ORGANIZATION NAME AND ADDRESS 1O. PROGRAM ELEMENT. PROJECT, TASK
AREA & WORK UNIT NUMBERS
AFIT STUDENT AT: Texas A&M
I. CONTROLLING OFFICE NAME AND ADDRESS 12. REPORT DATE
AFIT/NR May 85WPAFB OH 45433 13. NUMBER OF PAGES
14. MONITORING AGENCY NAME 4 ADDRESS(if different from Controlling Office) IS. SECURITY CLASS. (of thia report)
UNCLASSIISa. OECL ASSI FICATION! DOWNGRADING
SCHEDULE
16. DISTRIB3UTION STATEMENT (of this Report) TIAPPROVED FOR PUBLIC RELEASE; DISTRIBUTION UNLIMITED ELECTE
AUG16 1985
17. DISTRIBUTION STATEMENT (of the abstract entered in Block .20, it different from Report)
B
18. SUPPLEMENTARY NOTES
APPROVED FOR PUBLIC RELEASE: IAW AFR 190-! YtfE WOLAVERDean for Research and
Professional DevelopmeniS I /fr') AFIT, Wright-Patterson AFB OH
19. KEY WORDS (Continue on revere side if necesaery md Identify by block number)
0 8 20. ABSTRACT (Continue on reverse slde If necesary and Identify by block number)
S'J ATTACHEDL,_
1%FORM III
D , JAN7,3 1473 EDITION OF I NOV 65 IS OBSOLETE UNCLASS
85 " 8 13 09 CURITY CLASSIFICATION OF THIS PAGE (%n Date Entered)
p..
85..-,- ..
'. ' ' . 1" ,'..°./ . -,,,
. j- . , , . '., - % . ,% ' . %- '. . - 'r .' . w . " " " ; " - -_. J ., '. '. - . . - - . -. . --..-7 %

USE OF HINGED STRAKES FOR LATERAL CONTROL AT HIGH ANGLES OF ATTACK
A Thesis
by
RUSSELL EARL ERB
Approved as to style and content by:
Donald T. Ward(Chairman of Committee)
Stan J. Miley Peter F. Stiller(Member) (Member)
Cyrus Ostowari Walter E. Haisler, Jr.(Member) (Head of Department)-
El
*May 1985 D tfl
DDG ~ Av~t!1 titjy CCdes
ODD A -I

USE OF HINGED STRAKES FOR LATERAL CONTROL AT HIGH ANGLES OF ATTACK
A Thesis
by
RUSSELL EARL ERB
Submitted to the Graduate College ofTexas A&M University
in partial fulfillmeot of the requirements for the degree of
MASTER OF SCIENCE
May 1985
Major Subject: Aerospace Engineering
',
-., **. * C*. CA ,'..*:- .
--C' * ,' .' . ,' . .,. ' ',. " C '''i' """ . . -"" C."C, ''.,.'..\.,-ls ."',-" . -.- ,.., C-, C. . .'':. . "-\ ' .. '-"K _-. ._
U' -• ' - - " "q:, ,, S, rn, 44~ .' q ,_. -_,., - ," -.- 4 ,,- -, I,'- I'-. ' .',l ' " " " ''" - I" ,. -,.',• * = .
61
AFIT RESEARCH ASSESSMENT
The purpose of this questionnaire is to ascertain the value and/or contribution of researchaccomplished by students or faculty of the Air Force Institute of Technology (AU). It would begreatly appreciated if you would complete the following questionnaire and return it to:
AFIT/NRWright-Patterson AFB OH 45433
RESEARCH TITLE: Use of Hinged Strakes for Lateral Control at High Angl~s of Attack
AUTHOR: Russell Ear Erb
RESEARCH ASSESSMENT QUESTIONS:
1. Did this research contribute to a current Air Force project?
( ) a. YES ( ) b. NO
2. Do you believe this research topic is significant enough that it would have been researched(or contracted) by your organization or another agency if AFIT had not?'
( ) a. YES ( ) b. NO
3. The benefits of AFIT research can often be expressed by the equivalent value that youragency achieved/received by virtue of AFIT performing the research. Can you estimate what thisresearch would have cost if it had been accomplished under contract or if it had been done in-housein terms of manpower and/or dollars?
a. MAN-YEARS ( ) b. $
4. Often it is not possible to attach equivalent dollar values to research, although theresults of the research may, in fact, be important. Whether or not you Were able to establish anequivalent value for this research (3. above), what is your estimate of its significance?
a. HIGHLY ( ) b. SIGNIFICANT ( ) c. SLIGHTLY ( ) d. OF NOSIGNIFICANT SIGNIFICANT SIGNIFICANCE
5. AFIT welcomes any further comments you may have on the above questions, or any additionaldetails concerning the current application, future potential, or other value of this research.Please use the bottom part of this questionnaire for your statement(s).
NAME GRADE POSITION
ORGANIZATION LOCATION
STATEMENT(s):
"* - " ' ' ' ' ' ' ° ' ' ' ." . " ' '. .r nF ., " " b ' r ' ' N' ' '

FOLD DOWN ON OUTSIDE - SEAL WITH TAPE
I 1.
AFITINR NO0 POSTAGE
WhIIf.-PATTES 0 451433 1111 O4 NECESSARY
IF MAILEDOFMICIAL 11uisN1 IN THE
PENALTY FO PRIVATE USE. 63" UNITED STATES
BUSINESS REPLY MAILFIST CLASS PUMIT NO. n WAIE1NTON D.C.
POSTAGIE WILL E PAID BY ADfUhE
' AFIT/ DAAWrilht-Patteremo AFB OH 45433
.%
t.
-. FOLD IN

iii
ABSTRACT
Use of Hinged Strakes For Lateral Control at High Angles of Attack
(May 1985)
Russell Earl Erb, B.S., United States Air Force Academy
Chairman of Advisory Committee: Dr. Donald T. Ward
An investigation was conducted to study using a portion of the
leading edgestrake hinged along the longitudinal axis as a roll control
device for a high performance aircraft at high angles of attack (AOA).
A wind tunnel test was conducted to gather static force and moment data
* for use in a six degree of freedomc computer simulation. Asymmet-
ric strake deflections, both dihedral and anhedral, were investigated.
The longitudinal coefficients were little affected by strake deflection,
but the lateral-directional coefficients showed a nonlinear, but repeat-
able, behavior with strake deflection. Comparisons to published data
indicate that the strakes produce similar behavior for different air-
craft designs. Simulations of the aircraft response to the strakes
showed that an improvement over current roll-nperformance could be
obtained by combining the positive strake deflection with the ailerons
up to 38*A, after which the strakes alone produced the best roll
performance. Sideslip and AOA must be closely controlled or the air-
craft will either not roll, or will depart during the roll. The rolling--
performance using 4 he-hinged et~akes at high AOA is compared to rollIng--
performance using differential leading edge flaps. The differential L
leading efe, flaps produce comparable roll rates with less sideslip thanproduced by-h#/hinged strakes. Iowever, tJepossibility exists of
combining hinged strakes with differential)leadin-Pdggeflaps for
improved roll performance. F--

iv
TABLE OF CONTENTS
Page
ABSTRACT . . . . . . . . . . . . . . . . . . . . . . iii
TABLE OF CONTENTS . . . . . . . . . . . . . . . . . . . . . . . . ivLIST OF SYMBOLS .. .. .. ................... o v
LIST OF FIGURES . . . . . . . . . . . . . . . . . . . ..... vii
LIST OF TABLES . . . . . . . . . . . . . . . . . . ....... xi
INTRODUCTION . . . . . . . . . . . . . . . . . . . . . . . . . . 1WIND TUNNEL TEST . . . . . . . . . . . . . . . . . . . . . . . . 5
Model Description ........... ......... 5
Tunnel Installation .................... 8
Instrumentation . . . . . . . . . . . . . . . 8
Test Procedures . . ................... 10
Data Reduction Methods . . . . . . . . . 11
DISCUSSION OF RESULTS. ............... ..... . 14
COMPARISON TO PUBLISHED DATA . . . . . . . .......... 71
SIMULATION ANALYSIS . . . . . . . . . . . . . . . . . . . . . . 79
ROLL PERFORMANCE OF STRAKES.. ............... .. 89
Roll Performance Using Sideslip Feedback. . . ....... 94
Roll Performance at Higher Load Factors . . . . ...... 112
Effects of Thrust Limiting. . . . . . . . . . . . . . 133
Effects of Increased Yaw Damper Gain. ........... 133
COMPARISON TO DIFFERENTIAL LEADING EDGE FLAPS . . . . o . . . . 141
CONCLUSIONS AND RECOMMENDATIONS . . . . . . . . . . . . . .. . 144
REFERENCES . . . . . . . . . . . . . . . . . . o . o 146
APPENDIX A, SUMMARY OF CONSTANTS . . . . . . . . . . o . . . .o. 147
APPENDIX B, RUN SCHEDULE. ............ .. ...... 148
APPENDIX C, DERIVATION OF ACTUAL SIDESLIP ANGLE. . . . . . . . . 150
VI ... . . ...................... . . . . o . . . . 151

v
LIST OF SYMBOLS
A c Fuselage cavity area
A Duct exit areaeA i Reference inlet area
b Reference wing span
c Reference wing mean aerodynamic chord
CLLift coefficient
C y Side force coefficient
C D Drag coefficient
Cm Pitching moment coefficient
C nYawing moment coefficient
C Z Rolling moment coefficient
C T Cross sectional area of the wind tunnel test section, 68 ft2
FA Force in the axial direction, internal balance axesA£ Rligmmn nblneae
Fn Rolling moment in balance axes
F N Force in the normal direction, internal balance axes
ib Balance incidence angle
i t Incidence angle of the horizontal tail
M Mach number
P sStatic pressure in the model cavityqs yai rsuecretdfrbokg
qcU Dynamic pressure ucorrected for blockage
S Wing reference area
a ,AOA Angle of attack
8 Sideslip
8s Sting angle
8actual Actual sideslip angle
DOF Degrees of Freedom
LEF Leading edge flaps
DLEF Differential Leading Edge Flaps
LEX Leading edge extensions
6LSDLS Deflection of the left strake (positive upward)
RsDRS Deflection of the right strake (positive upward)
-! '' ; '" ".-"; . ".- "-"..- .", , - ;, , . '. ,- ., ."-"... " ".- . ... .,--R..S,-.- -.,..
vi
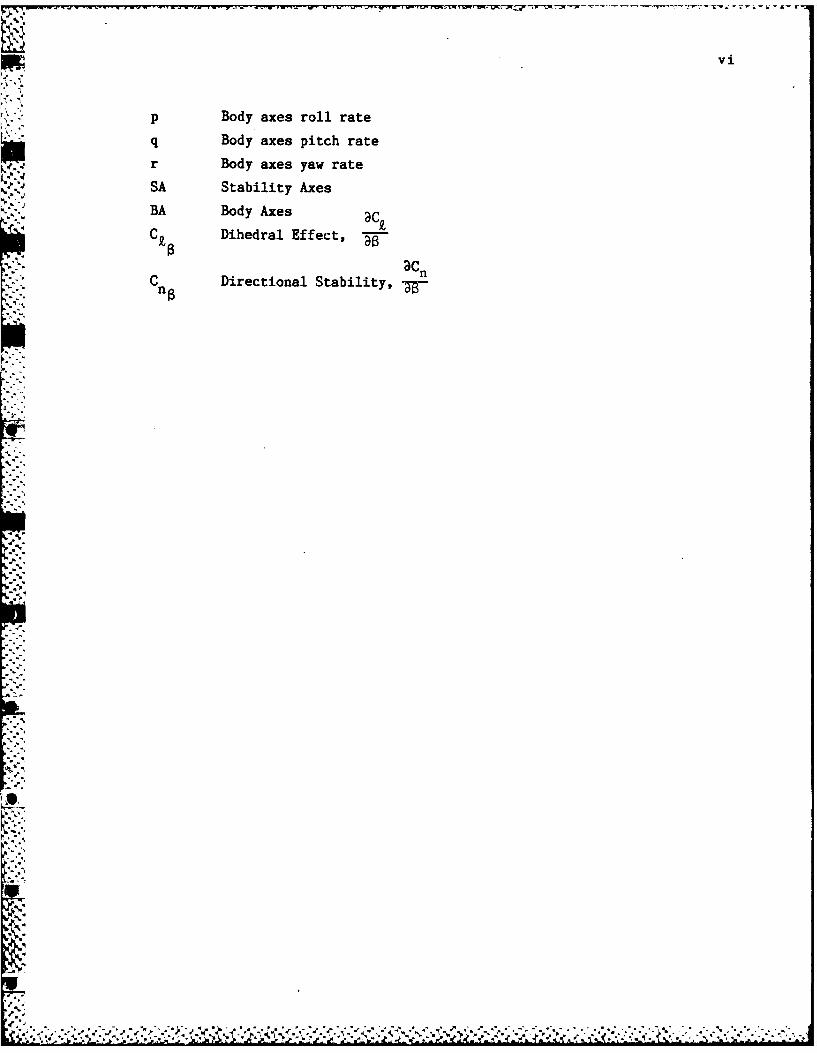
p Body axes roll rate
q Body axes pitch rate
r Body axes yaw rate
SA Stability AxesBA Body Axes
C B Dihedral Effect, a--k
C n Directional Stability, -
S.
%4
B,..
, .-..
B--~ °l
vii
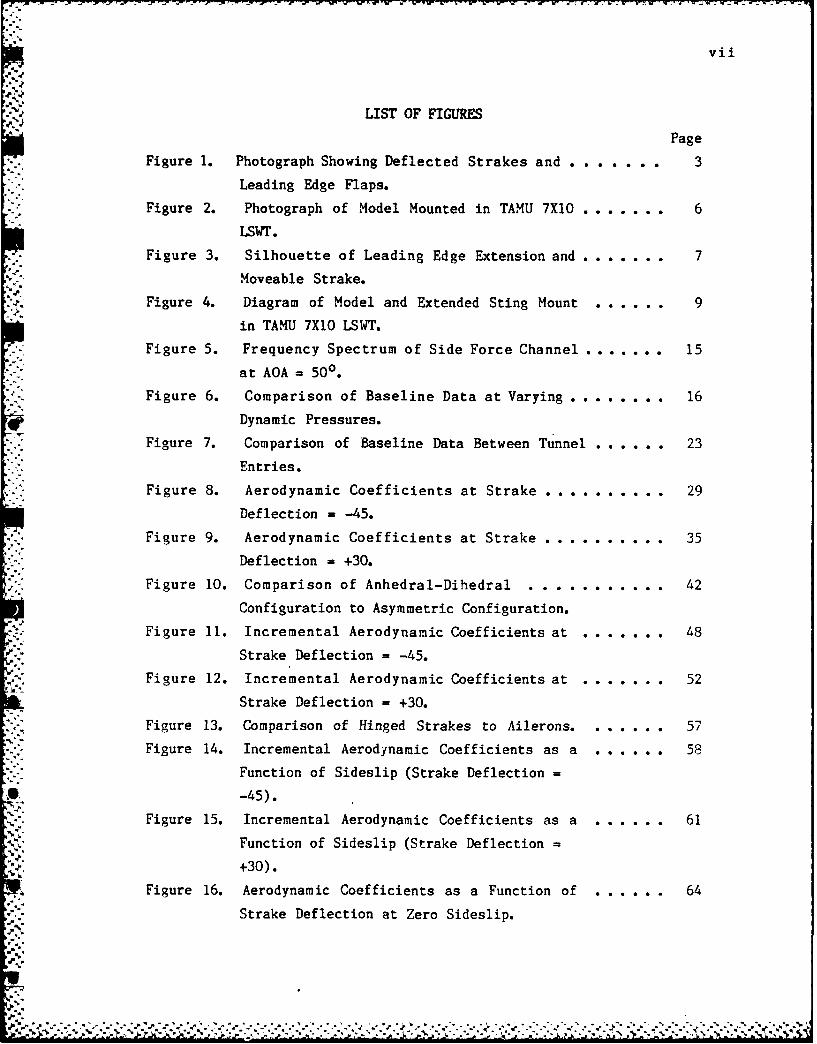
LIST OF FIGURES
Page
Figure 1. Photograph Showing Deflected Strakes and . . . . . . . 3
Leading Edge Flaps.
Figure 2. Photograph of Model Mounted in TAMU 7X10 . . . . . . . 6
LSWT.
Figure 3. Silhouette of Leading Edge Extension and .. ..... 7
Moveable Strake.
Figure 4. Diagram of Model and Extended Sting Mount . . . . . . 9
in TAMU 7X1O LSWT.
Figure 5. Frequency Spectrum of Side Force Channel....... 15
at AOA = 500 .
Figure 6. Comparison of Baseline Data at Varying ........ 16
Dynamic Pressures.
Figure 7. Comparison of Baseline Data Between Tunnel . . . . . . 23
Entries.
Figure 8. Aerodynamic Coefficients at Strake . . . ....... 29
Deflection - -45.
Figure 9. Aerodynamic Coefficients at Strake . . . . . . . . . . 35
Deflection = +30.
Figure 10. Comparison of Anhedral-Dihedral . . . . . . . . . . . 42
Configuration to Asymmetric Configuration.
Figure 11. Incremental Aerodynamic Coefficients at . . . . . . . 48
Strake Deflection = -45.
Figure 12. Incremental Aerodynamic Coefficients at .. . . .. 52
Strake Deflection = +30.
Figure 13. Comparison of Hinged Strakes to Ailerons. . . . . . . 57
Figure 14. Incremental Aerodynamic Coefficients as a . . . . . . 58
Function of Sideslip (Strake Deflection =
-45).
Figure 15. Incremental Aerodynamic Coefficients as a . . . . . . 61
Function of Sideslip (Strake Deflection =+30).
Figure 16. Aerodynamic Coefficients as a Function of . . . . . . 64
Strake Deflection at Zero Sideslip.
.5.
% • - -q- • . - -. .~... ... . . . . .- .j.ox- .- . . ...
viii
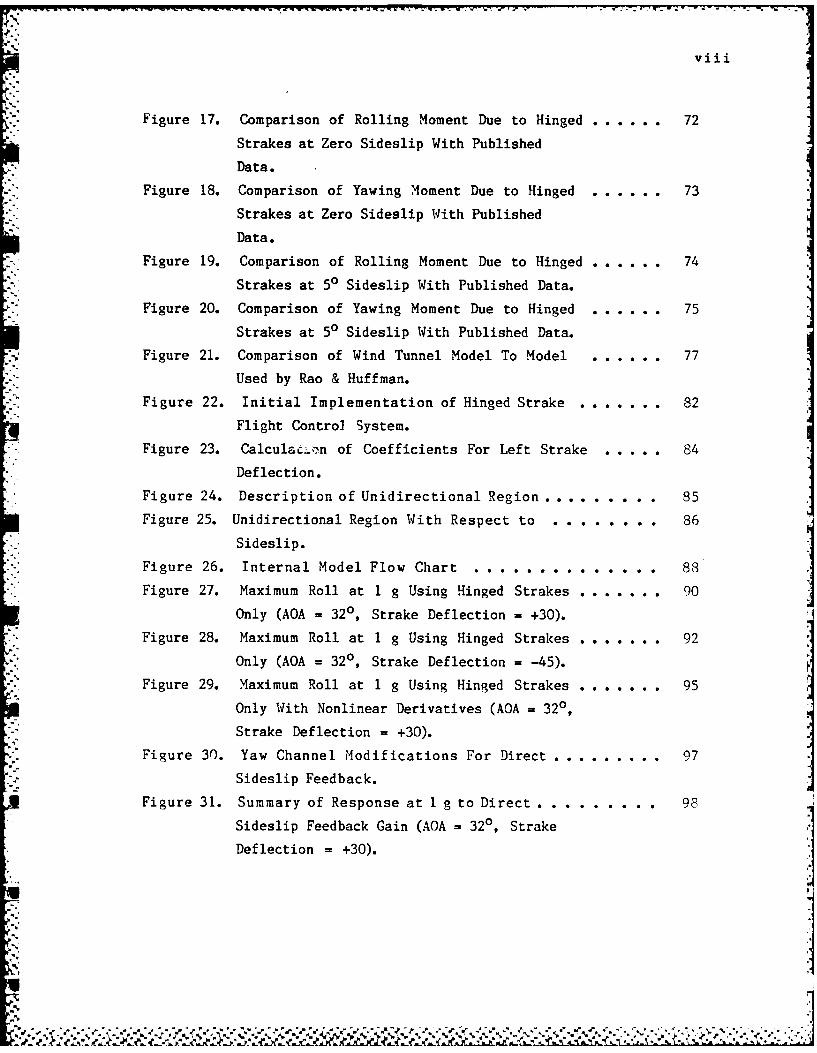
Figure 17. Comparison of Rolling Moment Due to Hinged . . . ... 72
Strakes at Zero Sideslip With Published
Data.
Figure 18. Comparison of Yawing Moment Due to Hinged . . . ... 73
Strakes at Zero Sideslip With Published
Data.
Figure 19. Comparison of Rolling Moment Due to Hinged . . . ... 74
Strakes at 50 Sideslip With Published Data.
Figure 20. Comparison of Yawing Moment Due to Hinged . . . ... 75
Strakes at 50 Sideslip With Published Data.
Figure 21. Comparison of Wind Tunnel Model To Model ..... 77
Used by Rao & Huffman.
Figure 22. Initial Implementation of Hinged Strake . . . . ... 82
Flight Control System.
Figure 23. Calculac..n of Coefficients For Left Strake . . ... 84
Deflection.
Figure 24. Description of Unidirectional Region....... 85
Figure 25. Unidirectional Region With Respect to . . . . . ... 86
Sideslip.
Figure 26. Internal Model Flow Chart . . . . . . . . . 88
Figure 27. Maximum Roll at 1 g Using Hinged Strakes . . . . ... 90
Only (AOA = 320, Strake Deflection = +30).
Figure 28. Maximum Roll at 1 g Using Hinged Strakes . . . . ... 92
Only (AOA = 320, Strake Deflection = -45).
Figure 29. Maximum Roll at 1 g Using Hinged Strakes . . . . ... 95
Only With Nonlinear Derivatives (AOA = 320,
Strake Deflection = +30).Figure 30. Yaw Channel Modifications For Direct ............ 97
Sideslip Feedback.
Figure 31. Summary of Response at 1 g to Direct . . . . . . ... 98
Sideslip Feedback Gain (AOA = 320, Strake
Deflection = +30).
% %

ix
Figure 32. Maximum Roll at 1 g Using Hinged Strakes . . . . . . . 100
Only With Sideslip Feedback (AOA = 320,
Strake Deflection = +30, Sideslip Feedback
Gain - 25).
Figure 33. Maximum Roll at 1 g Using Hinged Strakes . . . . . . . 101
Only With Sideslip Feedback (AOA = 320,
Strake Deflection = +30, Sideslip Feedback
Gain = 30).
Figure 34. Maximum Roll at 1 g Using Hinged Strakes . . . . . . . 102
Only With Sideslip Feedback (AOA = 320,
Strake Deflection = +30, Sideslip Feedback
Gain = 35).
Figure 35. Maximum Roll at 1 g Using Hinged Strakes . . . . . . . 103
Only With Sideslip Feedback (AOA = 320,
Strake Deflection = +30).
Figure 36. Maximum Roll at 1 g Using Hinged Strakes . . . . . . . 105
Only With Sideslip Feedback (AOA = 380,
Strake Deflection = +30).
Figure 37. Maximum Roll at 1 g Using Hinged Strakes . . . . . . . 108
Only With Sideslip Feedback (AOA = 320,
Strake Deflection = -45).
Figure 38. Maximum Roll at 1 g Using Hinged Strakes . . . . . . . 110
and Full Rudder Command With Sideslip
Feedback (AOA = 320, Strake Deflection =
+30).
Figure 39. Maximum Left Roll at 5 g's Using Hinged . . . . . . . 113
Strakes Only With Sideslip Feedback (AOA =
320, Strake Deflection = +30).
Figure 40. Roll Channel Modifications for Connecting . . . . . . 115
Strake FCS Into Aileron Input Command.
Figure 41. Maximum Roll at 5 g's Using Hinged Strakes . . . . . . 116
Only With Sideslip Feedback (AOA = 320,
Strake Deflection = +30).
9".
. ....

x
iigure 42. Maximum Roll at 5 g's Using Hinged Strakes ...... 119
Only With Sideslip Feedback (AOA = 320,
Strake Deflection = -45).
Figure 43. Maximum Roll at 5 g's Using Ailerons Only ...... 121
With Sideslip Feedback (AOA = 320).
Figure 44. Maximum Roll at 5 g's Using Hinged Strakes ...... 123
and Ailerons With Sideslip Feedback (AOA =
320, Strake Deflection = +30).
Figure 45. Maximum Roll at 5 g's Using Hinged Strakes ...... 125
and Ailerons With Sideslip Feedback (AOA =
320, Strake Deflection = -45).
Figure 46, Maximum Roll at 5 g's Using Hinged Strakes ...... 127
Only With Sideslip Feedback (AOA = 380,
Strake Deflection = +30).
Figure 47. Maximum Roll at 5 g's Using Ailerons Only . . .... 129
With Sideslip Feedback (AOA = 380).
Figure 48. Maximum Roll at 5 g's Using Hinged Strakes ...... 131
and Ailerons With Sideslip Feedback (AOA =
380, Strake Deflection = +30).
Figure 49. Maximum Roll at 5 g's Using Hinged Strakes . . . . . . 134
and Ailerons With Sideslip Feedback and
Thrust Limiting (AOA = 320, Strake Deflec-
tion = +30).
Figure 50. Maximum Roll at 5 G's Using Hinged Strakes . o . . . . 137
Only With Increased Yaw Damper Gain (AOA =
320, Strake Deflection = +30, Yaw Damper
Gain = 15).
Figure 51. Maximum Roll at 5 G's Using Hinged Strakes . . . . . . 139
And Ailerons With Increased Yaw Damper Gain
(AOA = 320, Strake Deflection = +30, Yaw
Damper Gain = 15).
Figure 52, Maximum Roll at 5 G's Using Differential ....... 142
Leading Edge Flaps (AOA = 320, Flap Deflec-
tion 1 10).
:. -•-.a.-. . . . . -- . . . . ... °--r v -".' '-% -- "-% -. .. .- '-'-.',:.' ..... ',.. . .. '..'.. .. '
K - - P
xi
LIST OF TABLES
Page
Table 1. Internal Balance Resolution.. . . 0 . . . . 10
Table 2. CD Corrections (M < 0.3). . . . . . 12
-CD
.v"A
INTRODUCTION
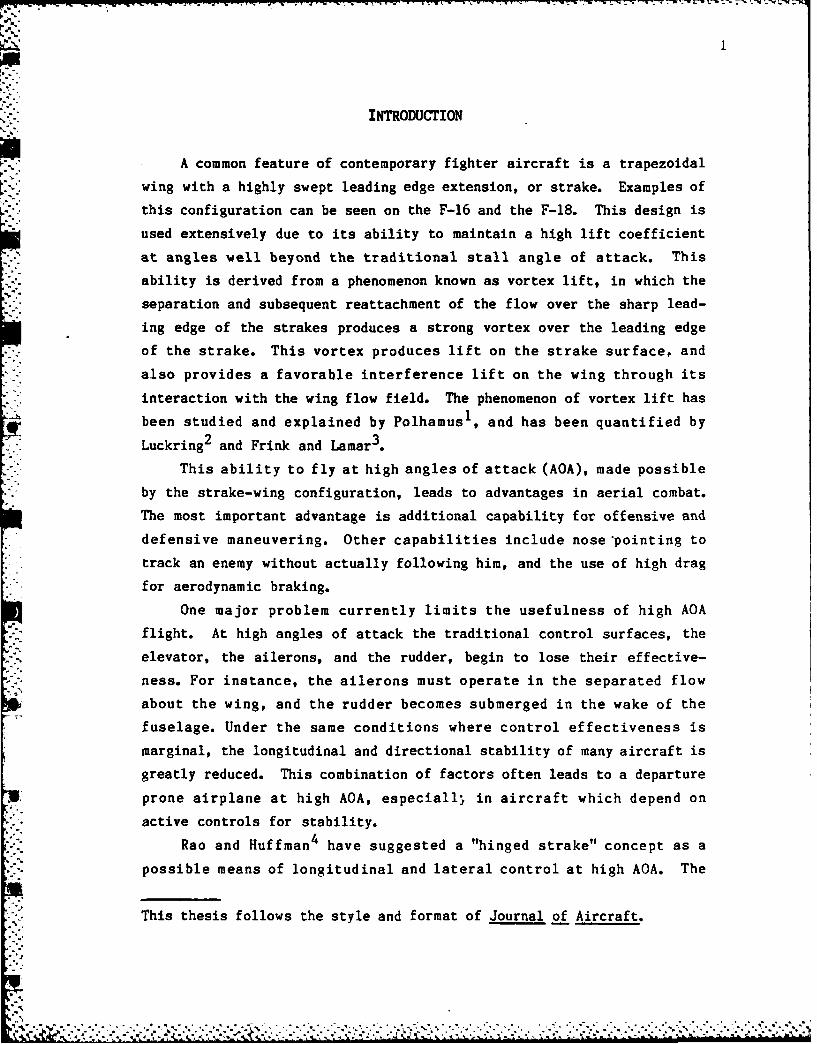
A common feature of contemporary fighter aircraft is a trapezoidal
wing with a highly swept leading edge extension, or strake. Examples of
this configuration can be seen on the F-16 and the F-18. This design is
used extensively due to its ability to maintain a high lift coefficient
at angles well beyond the traditional stall angle of attack. This
ability is derived from a phenomenon known as vortex lift, in which the
separation and subsequent reattachment of the flow over the sharp lead-
ing edge of the strakes produces a strong vortex over the leading edge
of the strake. This vortex produces lift on the strake surface, and
also provides a favorable interference lift on the wing through its
interaction with the wing flow field. The phenomenon of vortex lift has
been studied and explained by Polhamus 1 , and has been quantified by23Luckring and Frink and Lamar3.
This ability to fly at high angles of attack (AOA), made possible
by the strake-wing configuration, leads to advantages in aerial combat.
The most important advantage is additional capability for offensive and
defensive maneuvering. Other capabilities include nose 'pointing to
track an enemy without actually following him, and the use of high drag
for aerodynamic braking.
One major problem currently limits the usefulness of high AOA
flight. At high angles of attack the traditional control surfaces, the
elevator, the ailerons, and the rudder, begin to lose their effective-
ness. For instance, the ailerons must operate in the separated flow
about the wing, and the rudder becomes submerged in the wake of the
fuselage. Under the same conditions where control effectiveness is
marginal, the longitudinal and directional stability of many aircraft is
greatly reduced. This combination of factors often leads to a departure
prone airplane at high AOA, especiall in aircraft which depend on
active controls for stability.
Rao and Huffman4 have suggested a "hinged strake" concept as a
possible means of longitudinal and lateral control at high AOA. The
This thesis follows the style and format of Journal of Aircraft.
"-V- 'L L : ?.°':- - -- ' -?. -: - ? , ". L ..' .' -. .-" "" '--- --".'
2
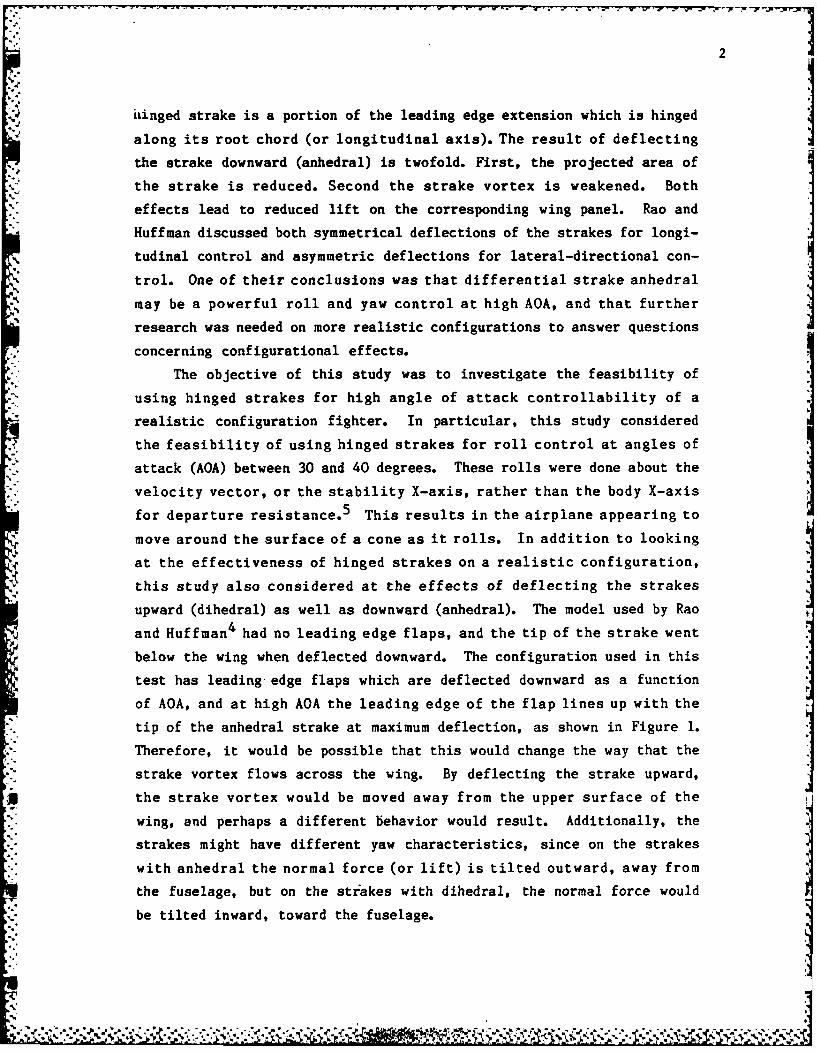
hinged strake is a portion of the leading edge extension which is hinged
along its root chord (or longitudinal axis). The result of deflecting
the strake downward (anhedral) is twofold. First, the projected area of
the strake is reduced. Second the strake vortex is weakened. Both
effects lead to reduced lift on the corresponding wing panel. Rao and
Huff man discussed both symmetrical deflections of the strakes for longi-
tudinal control and asymmetric deflections for lateral-directional con-
trol. One of their conclusions was that differential strake anhedral
may be a powerful roll and yaw control at high AOA, and that further
research was needed on more realistic configurations to answer questions
concerning configurational effects.
The objective of this study was to investigate the feasibility of
using hinged strakes for high angle of attack controllability of a
realistic configuration fighter. In particular, this study considered
the feasibility of using hinged strakes for roll control at angles of
attack (AOA) between 30 and 40 degrees. These rolls were done about the
velocity vector, or the stability X-axis, rather than the body X-axis
for departure resistance. 5 This results in the airplane appearing to
move around the surface of a cone as it rolls. In addition to looking
at the effectiveness of hinged strakes on a realistic configuration,
this study also considered at the effects of deflecting the strakes
upward (dihedral) as well as downward (anhedral). The model used by Rao
and Huffman 4 had no leading edge flaps, and the tip of the strake went
below the wing when deflected downward. The configuration used in this
test has leading edge flaps which are deflected downward as a function
of AOA, and at high AOA the leading edge of the flap lines up with the
tip of the anhedral strake at maximum deflection, as shown in Figure 1.
Therefore, it would be possible that this would change the way that the
strake vortex flows across the wing. By deflecting the strake upward,
the strake vortex would be moved away from the upper surface of the
wing, and perhaps a different behavior would result. Additionally, the
strakes might have different yaw characteristics, since on the strakes
with anhedral the normal force (or lift) is tilted outward, away from
the fuselage, but on the strakes with dihedral, the normal force would
be tilted inward, toward the fuselage.

3
U,
! °
"9 , I.• ,.
Deflected Strake Deflected. Leading r
Edge Flap
"-iFigure 1. Photograph Showing Deflected Strakes and Leading Edge Flaps.
4..
4
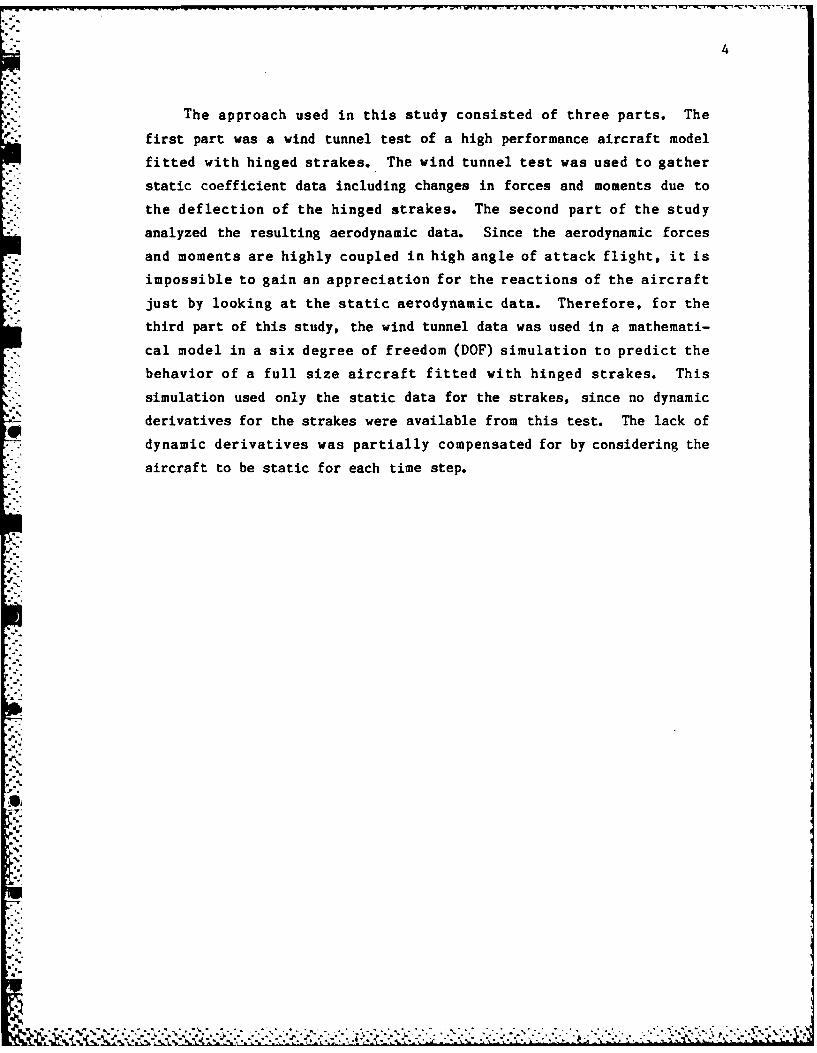
The approach used in this study consisted of three parts. The
first part was a wind tunnel test of a high performance aircraft model
fitted with hinged strakes. The wind tunnel test was used to gather
static coefficient data including changes in forces and moments due to
the deflection of the hinged strakes. The second part of the study
analyzed the resulting aerodynamic data. Since the aerodynamic forces
and moments are highly coupled in high angle of attack flight, it is
impossible to gain an appreciation for the reactions of the aircraft
just by looking at the static aerodynamic data. Therefore, for the
third part of this study, the wind tunnel data was used in a mathemati-
cal model in a six degree of freedom (DOF) simulation to predict the
behavior of a full size aircraft fitted with hinged strakes. This
simulation used only the static data for the strakes, since no dynamic
derivatives for the strakes were available from this test. The lack of
dynamic derivatives was partially compensated for by considering the
aircraft to be static for each time step.
7 -' . .
5
WIND TUNNEL TEST
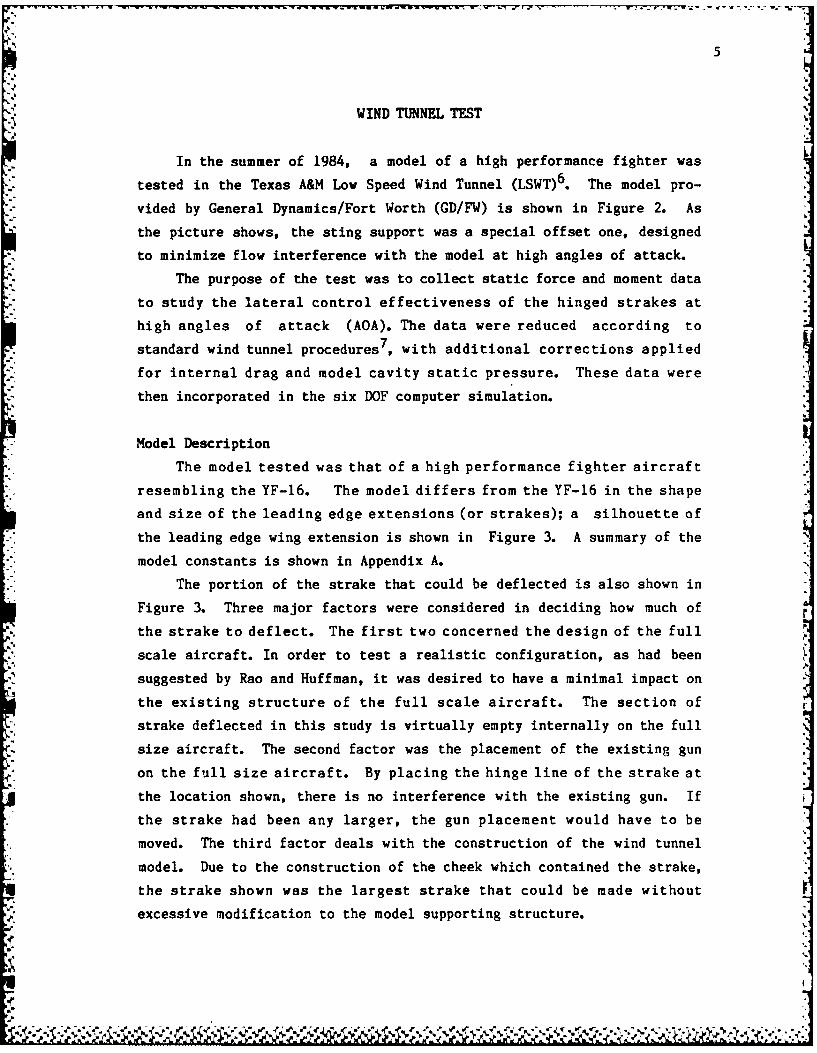
In the summer of 1984, a model of a high performance fighter was
tested in the Texas A&M Low Speed Wind Tunnel (LSWT)6. The model pro-
vided by General Dynamics/Fort Worth (GD/FW) is shown in Figure 2. As
the picture shows, the sting support was a special offset one, designed
to minimize flow interference with the model at high angles of attack.
The purpose of the test was to collect static force and moment data
to study the lateral control effectiveness of the hinged strakes at
high angles of attack (AOA). The data were reduced according to
standard wind tunnel procedures7, with additional corrections applied
for internal drag and model cavity static pressure. These data were
then incorporated in the six DOF computer simulation.
Model Description
The model tested was that of a high performance fighter aircraft
resembling the YF-16. The model differs from the YF-16 in the shape
and size of the leading edge extensions (or strakes); a silhouette of
the leading edge wing extension is shown in Figure 3. A summary of the
model constants is shown in Appendix A.
The portion of the strake that could be deflected is also shown in
Figure 3. Three major factors were considered in deciding how much of
the strake to deflect. The first two concerned the design of the full
scale aircraft. In order to test a realistic configuration, as had been
suggested by Rao and Huffman, it was desired to have a minimal impact on
the existing structure of the full scale aircraft. The section of
strake deflected in this study is virtually empty internally on the full
size aircraft. The second factor was the placement of the existing gun
on the full size aircraft. By placing the hinge line of the strake at
the location shown, there is no interference with the existing gun. If
the strake had been any larger, the gun placement would have to be
moved. The third factor deals with the construction of the wind tunnel
model. Due to the construction of the cheek which contained the strake,
the strake shown was the largest strake that could be made without
excessive modification to the model supporting structure.
*",/- 1 00. ; ,-' q;d ' % . , 1 L' V.. WV ': .' &*-. Z yV aY I Zi

Figure 2. Photograph of Model Mounted in TAMU 7' X 10' LS14T.
4IL

/7
Leading EdgeWing Extension
"! Model
Centerline
/
Moveable /
Strake I 7
Wing LeadingEdge
Figure 3. Silhouette of Leading Edge Extension and Moveable Strake.
', ;• .- -- ..'-"- - " .",'. '- -- '- "- " "- - .- " "- "-""-''-"".''-" , -" ','-.', ', '-L , "" "',-,'- ", ". " ,', -" "" " ". "- -""-"". ,.""-""-.- " "-

8
This strake design was proposed to the sponsor and approved. The
model was then modified by the Texas A&M Research and Instrumentation
Division. The hinged strakes for the wind tunnel modql were made with
deflections from +450 to -450 in increments of 150. The original
strake provided with the model was used for the 00 deflection case.I
Figure 1 shows the deflected strakes on the model. The deflected
strakes were made with flat lower surfaces and modeling clay was used to
fair in the sharp breaks in the LEX curvature. Figure 1 also shows the
leading edge flaps CLEF) deflected to 300 . All runs were made with theI
LEF in this position, since it was the most representative of their
position in high AQA flight.
Tunnel Installation
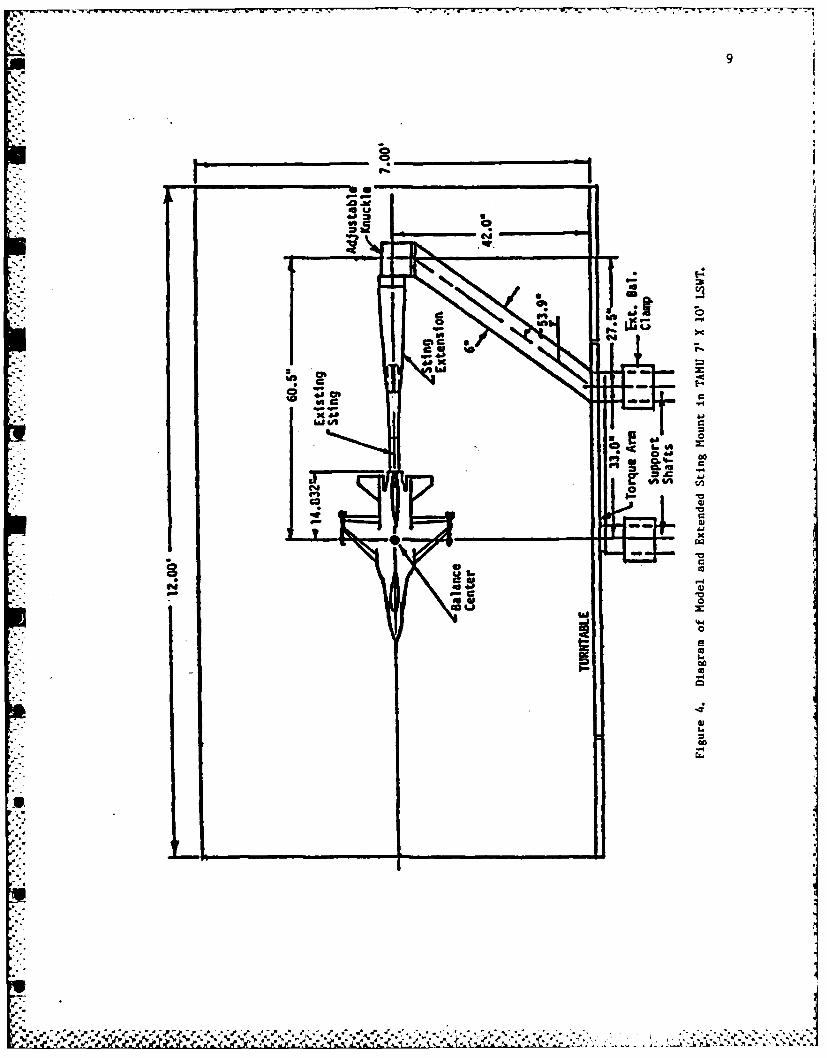
The model was mounted in the tunnel on a sting with the wings
vertical, as shown in Figure 4. The sting was fitted into a manually
adjustable knuckle which was used to change the yaw orientation of the
model with respect to the wind tunnel in order to test different side-
slip angles. Angle of attack variations were obtained by rotating the
turntable to the desired angles. The knuckle could be set at yaw
angles of 00, 50, 100, and 150. Since the knuckle could only be rotated
upward, positive or negative yaw orientations were obtained by rotatingI
the sting 1800 at the center joint.LA
Instrumentation
Force and moment data were collected with a Task Mark XIII six
component internal balance. The frequency spectrum of one of the *
balance outputs was recorded during Runs 1-3 to check f or the resonant
frequencies of the model/sting system and to compare them with the data
sampling frequencies since previous tests had shown considerable vibra-
* tion of the model and sting support. The balance resolution in terms of
coefficients is shown in Table 1.
Iz'
-do
a~aw
'mu
41o
CL#2
Vol %
co V4
U1
plo
10
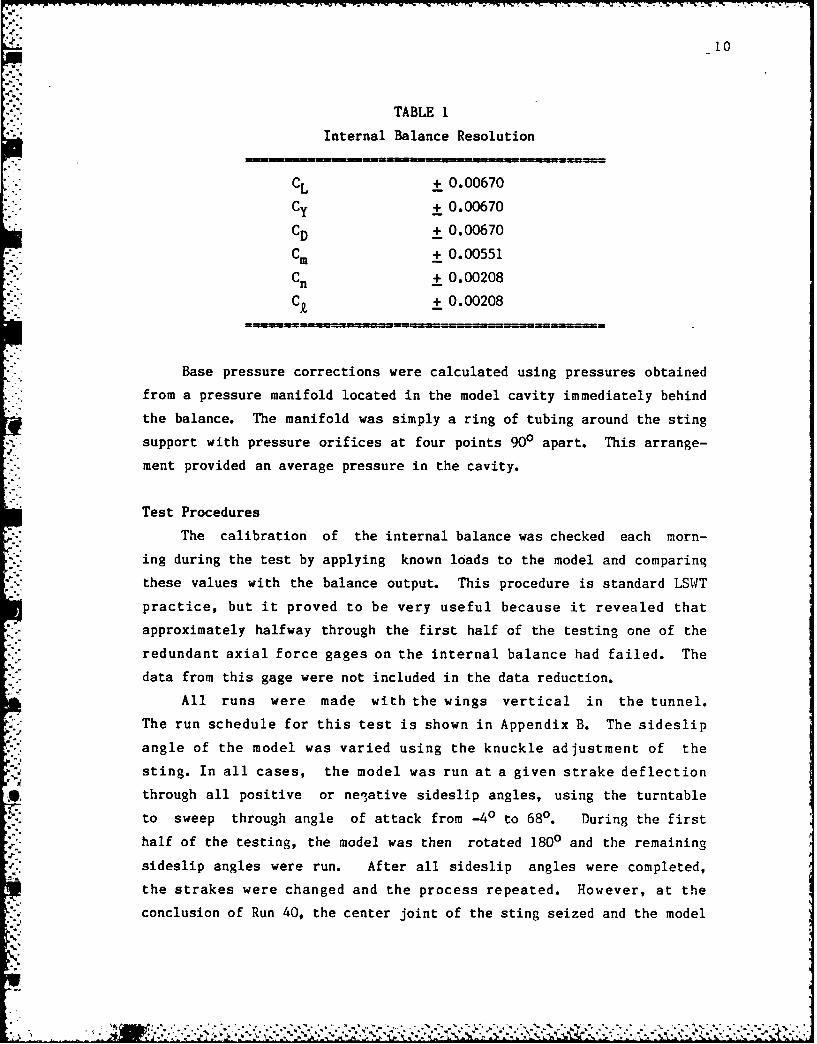
TABLE 1
Internal Balance Resolution
CL + 0.00670L .07
CD + 0.00670
CD + 0.00551
CM + 0.00208
C + 0.00208
Base pressure corrections were calculated using pressures obtained
*from a pressure manifold located in the model cavity immediately behind
the balance. The manifold was simply a ring of tubing around the sting
support with pressure orifices at four points 900 apart. This arrange-
ment provided an average pressure in the cavity.
Test Procedures
The calibration of the internal balance was checked each morn-
ing during the test by applying known loads to the model and comparing
these values with the balance output. This procedure is standard LSWT
practice, but it proved to be very useful because it revealed that
approximately halfway through the first half of the testing one of the
redundant axial force gages on the internal balance had failed. The
data from this gage were not included in the data reduction.
All runs were made with the wings vertical in the tunnel.
The run schedule for this test is shown in Appendix B. The sideslip
* - ~angle of the model was varied using the knuckle adjustment of the
sting. In all cases, the model was run at a given strake deflection
through all positive or ne'oative sideslip angles, using the turntable
to sweep through angle of attack from .. 40 to 680. During the first
4 half of the testing, the model was then rotated 1800 and the remaining
sideslip angles were run. After all sideslip angles were completed,
the strakes were changed and the process repeated. However, at the
conclusion of Run 40, the center joint of the sting seized and the model

had to be removed from the tunnel to repair the sting. When the tests
were completed, the strakes were changed and the same sideslip angles
were run to minimize the number of times the model had to be rotated
1800. After all strake deflections were run, the model was rotated
1800 and the same strake deflections were run for the remaining side-
slip angles. Sideslip angles ranged from -150 to 150 for asymmetric
cases, and from -100 to 100 for anhedral-dihedral cases.
Data Reduction Methods
The data were reduced using standard procedures as described by
Pope 7. The sponsor requested that several corrections be made to the
data in addition to the standard data reduction procedures. These
corrections are summarized as follows.
The model was constructed with a 57 minute difference between the
model longitudinal axis and the internal balance longitudinal axis. To
account for this difference, the forces and moments were rotated from
balance axes, balance center to body axes, balance center using the
following equations:
F N = FN cos 57' + FA sin 57'
FA = -FN sin 57' + FA cos 57'
Fk= FZ cos 57'- n sin 57'
Fn= F sin 57' + Fn cos 57'
Static base pressure was measured in the model cavity at each data
point and the correction was applied in balance axes to the coefficients
during data reduction by the formula:
ACD = (P, - P,) A,qc S
CD =CD - ACDtotal measured
'I

12
Since the model was a flow through model, being open from the inlet to
the base of the model, the drag due to flow through the model was
accounted for. This internal drag was subtracted from the drag coeffi-
cient as determined from Table 2.
TABLE 2
CD Corrections (M < 0.3)
aAC D AC D
-5 .0025 20 .0038
0 .0023 25 .0049
5 .0023 30 .0062
10 .0025 32 .0068
15 .0030 90 .0068
The usual blockage and wall corrections2 were made for an AQA
below 320. For any AQA above 320, wall corrections were not applied
and the following Maskell correction was used:
q= qu[l + 2 .5(CDS/CT)]
In addition to these deviations from the standard data reduction
procedures, moments were resolved about the 35% mean aerodynamic chord
* at the request of the sponsor. This change from resolving moments about
* the 25% mean aerodynamic chord was requested because of the relaxed
- static stability of the design.
Due to the geometry of the sting support, the sting angle, listed
as in the run schedule, is not the actual sideslip angle of the model.
* . Since the model was rotated about the wind Y-axis in the tunnel rather
* than about the body Y-axis, the actual sideslip is a function of angle
of attack. Stability axes sideslip was calculated according to the
formula:
U%
*~ ~ -W- '~* -7
* 13
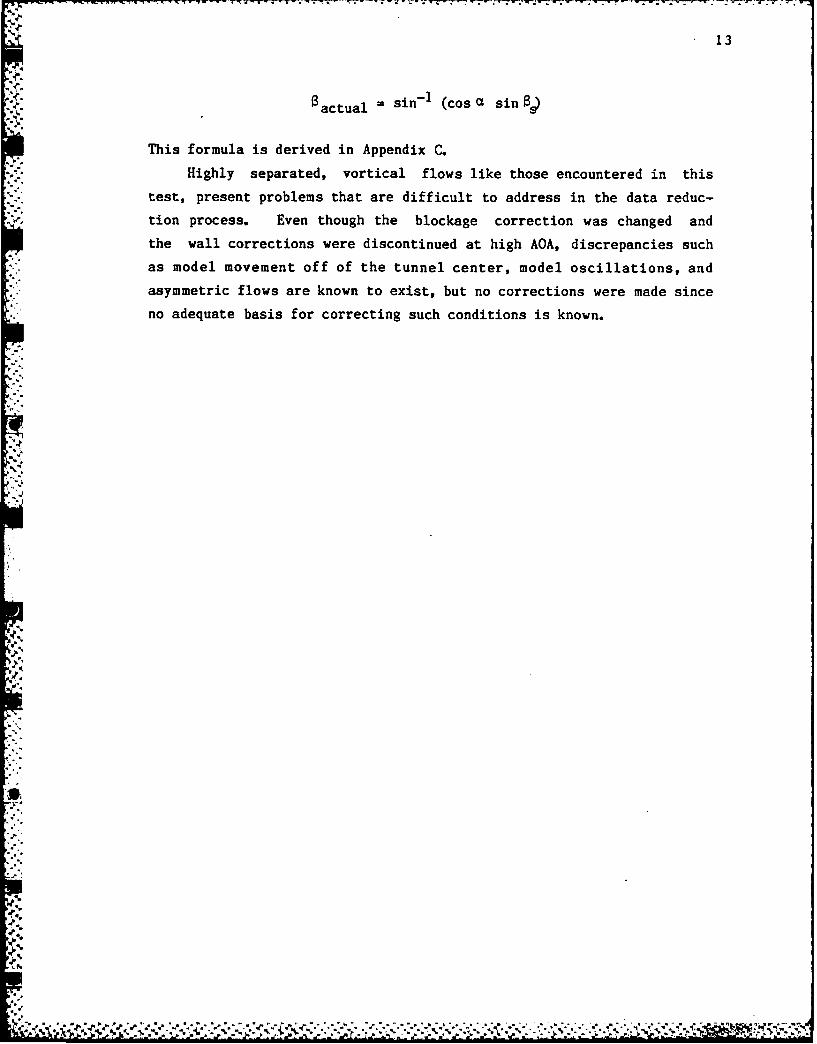
-actual sin- 1 (cos a sin 5d
This formula is derived in Appendix C.
Highly separated, vortical flows like those encountered in this
test, present problems that are difficult to address in the data reduc-
tion process. Even though the blockage correction was changed and
the wall corrections were discontinued at high AOA, discrepancies such
as model movement off of the tunnel center, model oscillations, and
asymmetric flows are known to exist, but no corrections were made since
no adequate basis for correcting such conditions is known.
.o
*,*4- --°4
'ell.
• °ore

14
DISCUSSION OF RESULTS
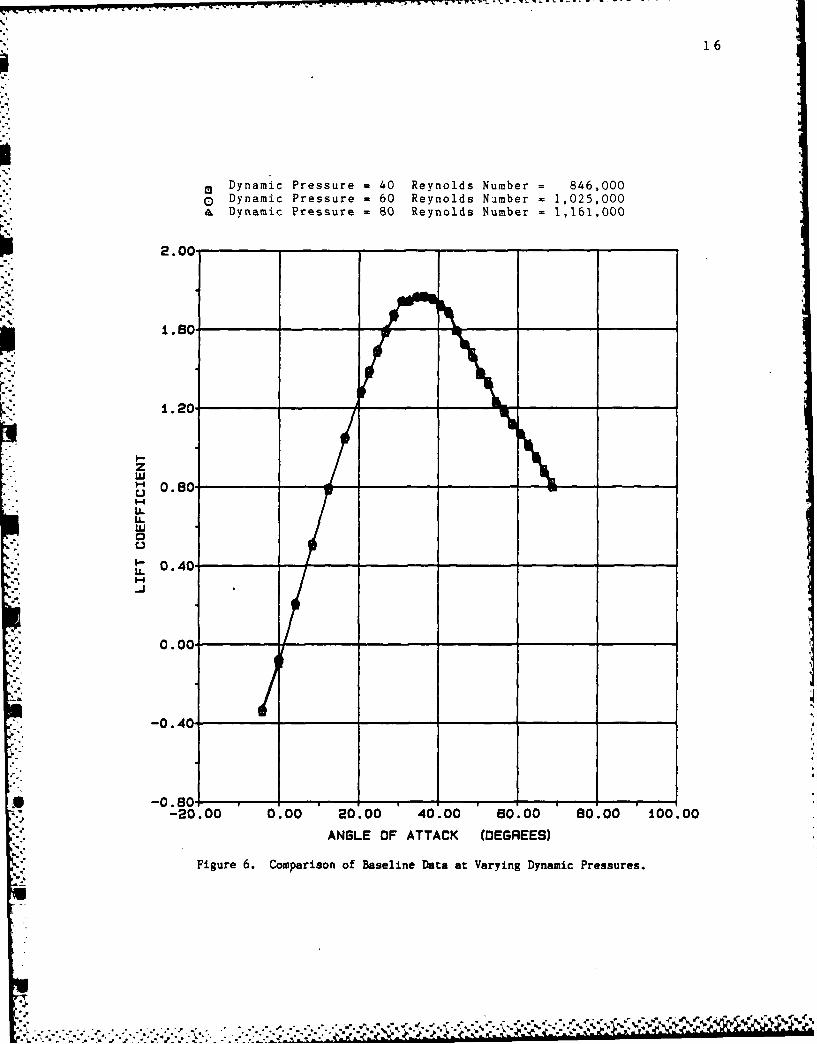
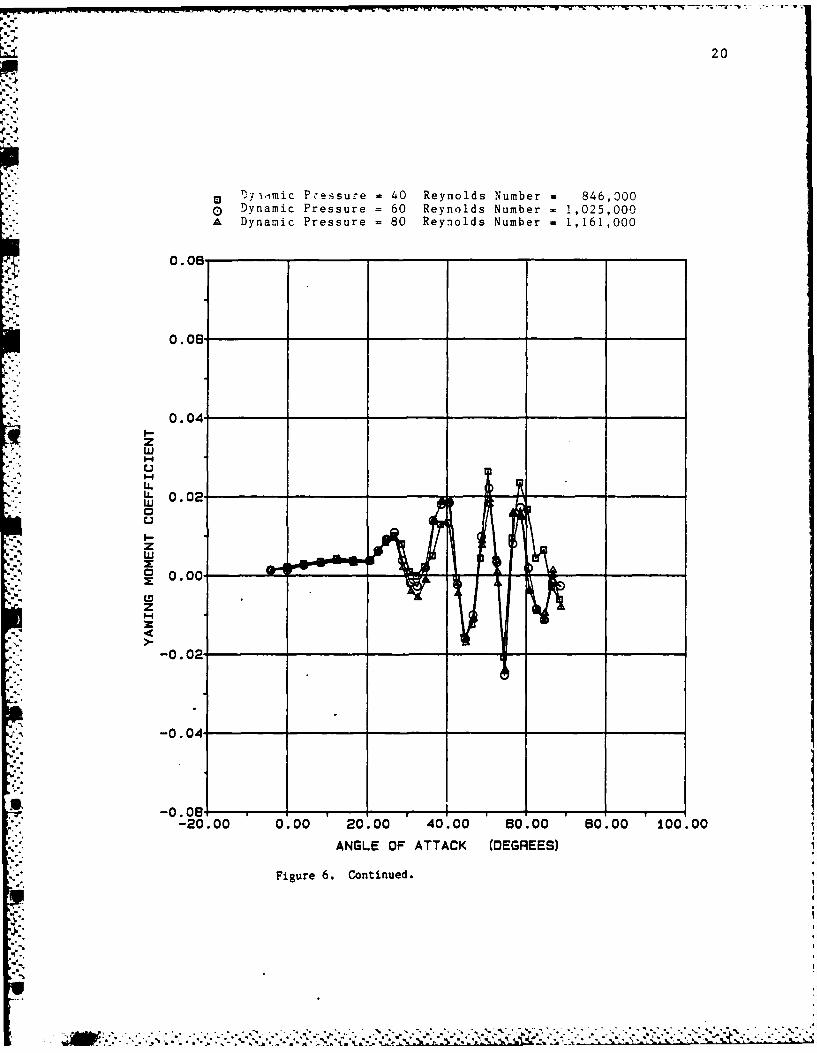
Runs 1, 2, and 3 were run with the baseline configuration at
dynamic pressures of 40, 60, and 80 psf respectively with correspond-
ing Reynolds Numbers of 846,000, 1,025,000, and 1,161,000. This check
looked at variations due to Reynolds number and also to insure that the
steel sleeve would reduce the vibrations seen previously8 . In addi-
tion, a spectral analyzer was attached to the side force channel to
check for the dominant frequencies to compare against the sampling rate.
These vibrations had their largest amplitudes at 500 AQA. The frequency
spectrum of the forward side force channel at 50 AQA is shown in Figure
5. The side force channel was chosen since the amplitude of the oscilla-
tions was greatest in the lateral direction. This spectrum shows that
the model was oscillating with a fundamental frequency of 11 Hz. The
balance output was sampled once every 4.5 milliseconds, or at a fre-
quency of 222 Hz. The measured value of the balance output was the
average value of 100 of these samples. Therefore, at least one complete
period of an oscillation would be measured for frequencies up to 22.2
11z. In this case, the data were sampled over two fundamental periods.
If the sample size and sampling rate were to cause an error, this error
would be seen as non-repeatability in the data points.
In Run 3 data were taken with both increasing and with decreasing
angles of attack. As can be seen in Figure 6, the data points were
repeatable and no hysteresis is apparent. Runs 2 and 3 at dynamic
pressures of 60 and 80 psf gave almost identical results at low
angles of attack and were still in fairly close agreement at very high
angles of attack. The rolling moment was the parameter of primary
interest, and this agreement is shown in Figure 6. Note that these data
and all other plotted data are plotted in stability axes. Run 1 is far
* removed from Runs 2 and 3 in this region. Based on this information,
following runs were made at a dynamic pressure of 80 psf.
On Run 8, LSWT personnel noticed that the rolling moment produced
by the model was exceeding the limits of the internal balance.
UReferencing the previous figure, the Principal Investigator decided
to reduce the dynamic pressure to 60 psf. Run 9 was run with the
.- .j4

%.-
* . 15
1.0
m0.80
S0.6
, - 00.4
, 0.2
00 10 20 30 40 50 60 70 80 90 100
Frequency (Hz)
Figure 5. Frequency Spectrum of Side Force Channel at AOA 500.
- ......, -.
,..:.. .. . . . . . . . . . . . .
16
-PC Dynamic Pressure = 40 Reynolds Number = 846,000
o Dynamic Pressure = 60 Reynolds Number - 1,025,000,& Dynamic Pressure = 80 Reynolds Number = 1,161,000
2.00
1. 0.
1.20
zw' 0.80
U.w0
*- 0.40I.
-
0.00
-0.40-
-0.80i , , ...
-20.00 0.00 20.00 40.00 80.00 80.00 100.00
ANGLE OF ATTACK (DEGREES)
Figure 6. Comparison of Baseline Data at Varying Dynamic Pressures.
Jm • .

17
-. 9
* Dynamic Pressure = 40 Reynolds Nunber = 846,000() Dynamic Presm;ure a 60 Reynolds Number = 1,025,000
Dynamic Pressure = 80 Reynolds Number = 1,161,000
0.12
0.08
0.04
I-
zw
I--
-0.00w0
L'
Cn
-20.00 0.00 20.00 40.00 80.00 B0.00 100.00
ANGLE OF ATTACK (DEGREES)
Figure 6. Continued.

18
Dynamic Pressure = 40 Reynolds Number = 846,0000 Dynamic Pressure - 60 Reynolds Number - 1,025,000A Dynamic Pressure = 80 Reynolds Number = 1,161,ODO
2.40_
2.00
1.90.
ILL
1.20U
U.LLw0
L9 0.80.
1 0
-0.00 0.00-20:00 0.00 20.00 40.00 80.00 80:00 1O00.00
ANGLE OF ATTACK (DEGREES)
Figure 6. Continued.
%.
~ *.9.,... 'a' %*~a

19
Dynamic Pressure = 40 Reynolds Number = 846,0000 Dynamic Pressure w 60 Reynolds Number = 1,025,000A Dynamic Pressure = 80 Reynolds Number = 1,161,000
0.20
0.10
0.00.zw
'b'-4
rC.
ooo4
iLLi.Uj -0.10
zwx
-0.40
-0.50 . . ..- 20.0O0 0.0O0 20.0O0 40.0O0 8O. O0 80. O0 1O0.0
ANGLE OF ATTACK (DEGREES)
Z Figure 6. Continued.
%z
=I-
-0.4
.. .-20.0 0.0 2.00 0.00 BO.0 eooo ±0.0
o % .O °- Q o. .• . ,, .o . ANGLE.. .. OF A TA K EG E S
20
')yiimic PI-essure = 40 Reynolds Number = 846,000C Dynamic Pressure - 60 Reynolds Number = 1,025,000A Dynamic Pressure = 80 Reynolds Number = 1,161,000
0.05
.O.O
0.05.
0.04I-zwLU1-4
ILL 0.02w
I-
zw-0.00
z3
-0.02
-0.04
-0.08 - -,
-20.00 0.00 20.00 40.00 0.00 80.00 100.00
ANGLE OF ATTACK (DEGREES)
Figure 6. Continued.
.... ... ... ... ... ... .... ... ... ... ... ... ... .... ... ... ... ... ... .... ... --*~~4'* ,-- 4

721
' Dynamic Pressure = 40 Reynolds Number = 846,0000 Dynamic Pressure = 60 Reynolds Number = 1,025,000( Dynamic Pressure = 80 Reynolds Number = 1,161,000
0.08
0.06
0.04-zw
14LLLL.W 0.02-U
zw
0.00
z-0
-0.02--
-0.04_
-0.08 ......-20.00 0.00 20.00 40.00 60.00 80.00 100.00
ANGLE OF ATTACK (DEGREES)
Figure 6. Concluded.
A .--..' -. : ,';?,-,':..? -::.::": -: " ' " " "" '" " " ' " " " """ -""""" ' " :""" " """ "" " "
22
1 J
configuration predicted to create the maximum rolling moment to see if
the rolling moment would remain within limits. The baseline runs were
repeated, and all f urther runs were made with a dynamic pressure of 60
psf.
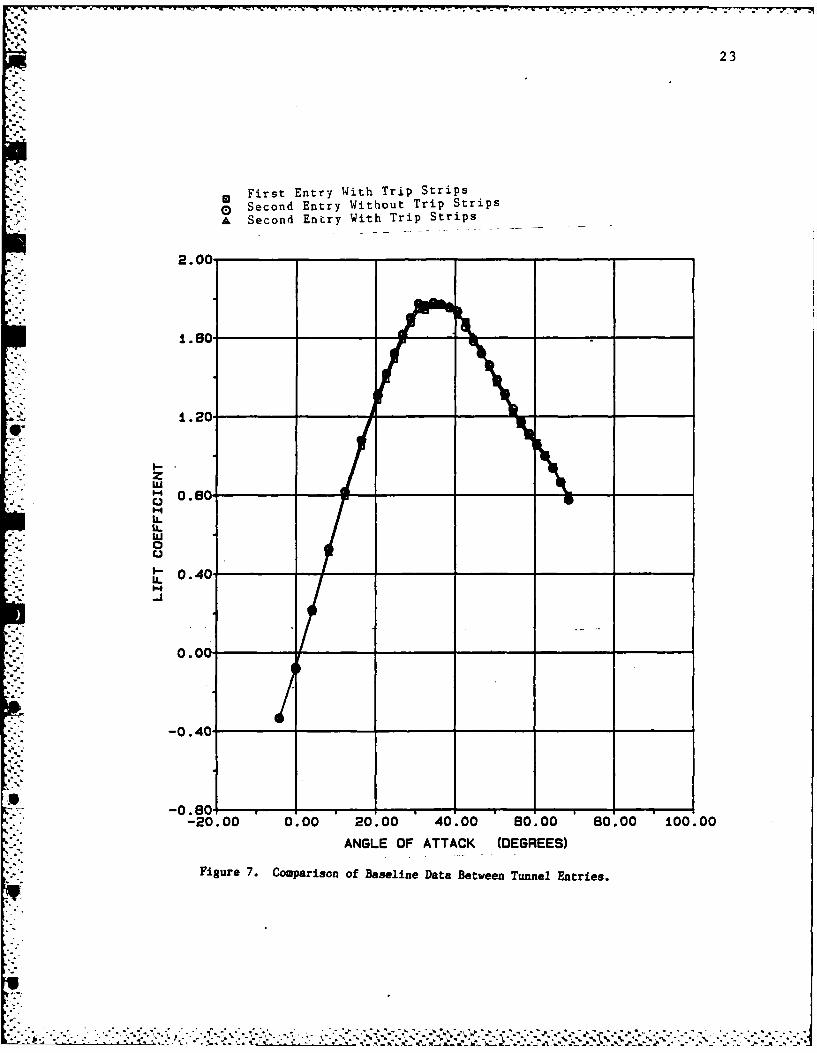
Further Reynolds Number effects were seen upon re-entry for the
second half of the wind tunnel test. The first runs of this test were
used to try to reproduce data from the first half of the test. The
%6 rolling moment coefficient was again used as the comparison, since it
was the primary parameter of interest. The last two attempts to
reproduce Run 2 are shown plotted against Run 2 in Figure 7. Note
that Run 46 was conducted without trip strips, which had worn off the
model during previous runs. On Run 47, these trip strips were
replaced, and were used for the remainder of the test. Note that
the trip strips cause a change in rolling moment, especially at the
higher angles of attack. Also, the agreement between the first and
second entry in the LSWT is not as close as desired in the region of
primary interest (AQA = 300 to 400). In fact, the signs are
reversed on the coefficients in some cases between tests. However,
since all measurements and parameters that could be changed had been set
as close as possible to the condiitions of the first half of the test,
the test was continued from here. Similar problems with asymmetries
have been seen before. 8 It is still not clear if the lack of trip
strips and/or asymmetries in the model and airf low are the source of
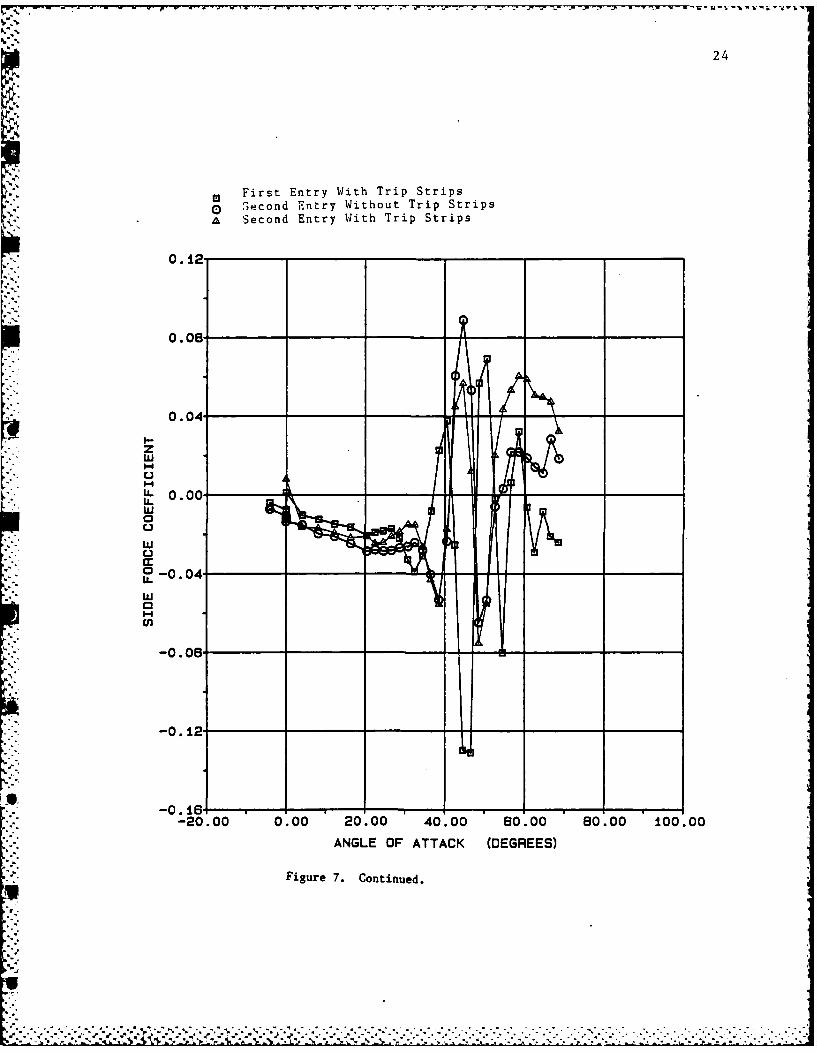
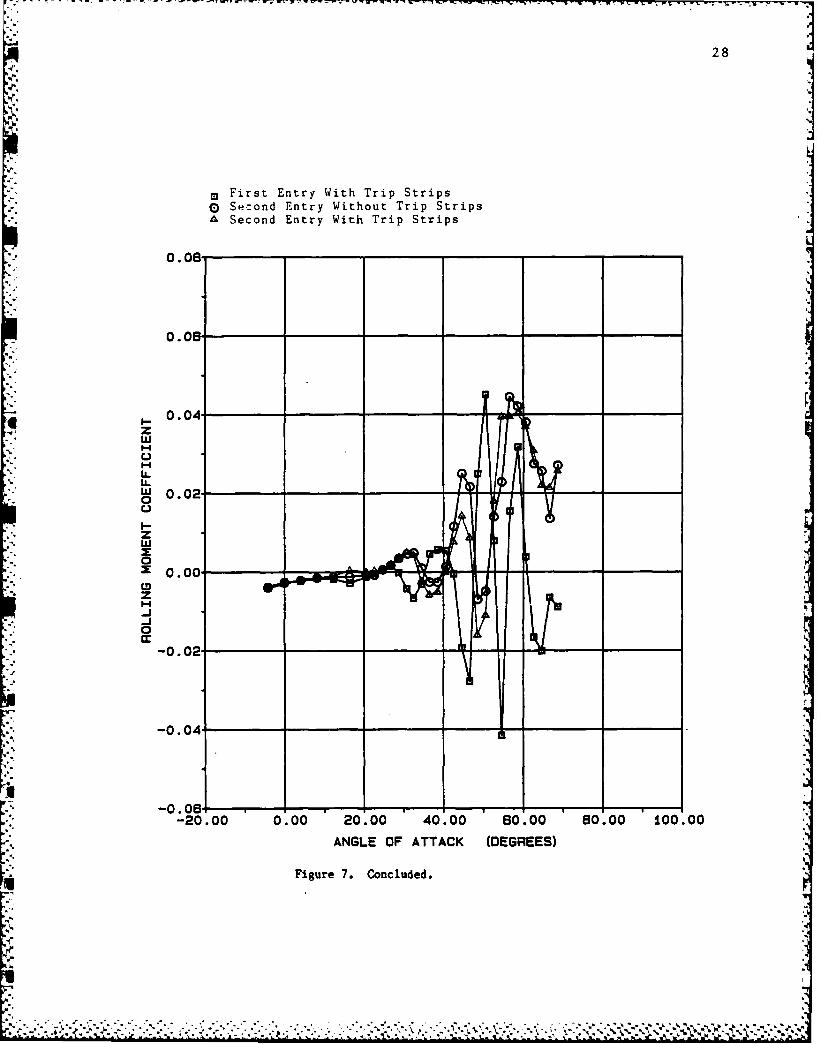
this disagreement. Due to lack of time to run new baseline data, thedata from from the second entry were used in conjunction with the datafrom the first entry. As will be seen later, this would only really
affect the results for the +150 and +300 strake deflections, since the
* - anhedral-dihedral data would not be used.
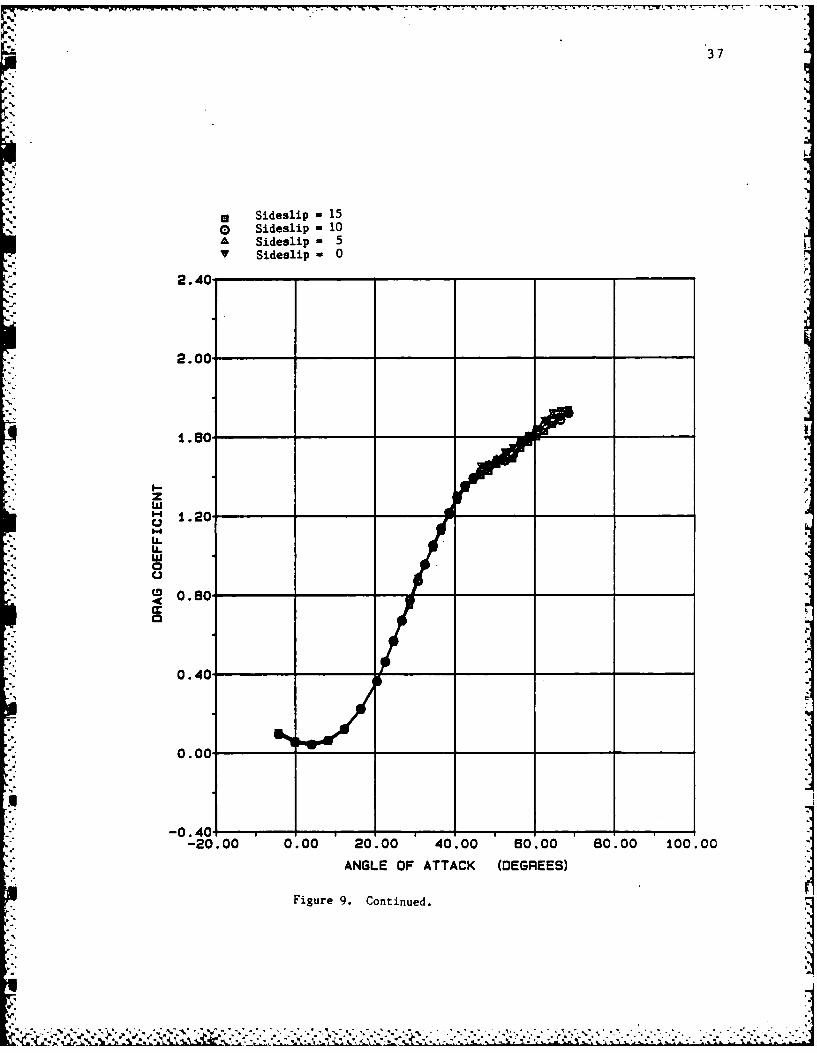
The longitudinal coefficients, CL9 CD, and Cm, appear to be well
U behaved across the full angle of attack range, in that they do not
change rapidly from one a~igle of attack to another. Also, CL and CDvary insignificantly with sideslip angle, and Cm shows only a slight
change at higher angles of attack. See Figures 8-9.
The lateral-directional coefficients, Cy ,n and C-n, show a
very different behavior with varying angle of attack. At lower angles0
%J
23
First Entry With Trip Stripso Second Entry Without Trip StripsA Second Entry With Trip Strips
2.00
4.. 1.190.__ __
1.20/
IL. 0.80
I-.
0.U
L- 0.40
SH
0.00.
-0.4-0-
-0.80! ...-20.00 0.00 20.00 40.00 80.00 80.00 100.00
ANGLE OF ATTACK (DEGREES)
Figure 7. Comparison of Baseline Data Between Tunnel Entries.
W
24
First Entry With Trip Strips(o 'econd Entry Without Trip StripsA Second Entry With Trip Strips
0.12
0.083
0.04
zw
LLI.. 0 O0 _ _ _ _
wC3
C.
C3 -0.04-
w
-0.06
-0.12
-0. B
-20.00 0.00 20.00 40.00 80.00 80.00 100.00
ANGLE OF ATTACK (DEGREES)
Figure 7. Continued.

25
First Entry With Trip StripsSecond Entry Without Trip Strips
A Second Entry With Trip Strips
2.40_
2.00
1 .20I=4n,
0
0.400
0.00.
-0.401 ..-20.00 0.00 20.00 40.00 80.00 80.00 100.0
ANGLE OF ATTACK (DEGREES)
Figure 7. Continued.
U!t!
- . . . . .-

26 L
0 First Entry With Trip Strips0 Secoand Entry Without Trip Strips
S Second Entry With Trip Strips
0.20-
0.10-
* z
LL'-4
U*-0.0
0
*00
CL -r30
-20.00 0'.00 20.00 40.00 80.00 80.00 100.00
ANGLE OF ATTACK (DEGREES)
Figure 7. Continued.
I

27
* First Entry With Trip Strips0 Second Entry Without Trip Strips
A Second Entry With Trip Strips
0.053
0.08.
0.04-
wUP4
ILL
IDP
z'-64
-r-
-20.00 0.00 20.00 40.00 80.00 80.00 100.00K.ANGLE OF ATTACK (DEGREES)
Figure 7. Continued.
~ ~ .~ ___ 2 .
28
*First Entry With Trip StripsoSec:ond Entry Without Trip StripsASecond Entry With Trip Strips
0.08.
0.0OB
4 0.04-
U
U10.02-
z
0.2
-004
-0.02,
-20.00 0.00 20.00 40.00 80.00 80.00 100.00
ANGLE OF ATTACK (DEGREES)
Figure 7. Concluded.

-. .. . . . . - . . - . - - r,,' ,, ° . i- - ""•* • " i " --i. .--- ,-- --- -~-~ " . . " .:°
29
-.
. Sideslip - 15C) Sideslip = 10* Sideslip - 5V Sideslip - 0
2.00-
4¢.
1.50.
1.20
0.80• I-I
LLLL.0
* - ~0.40--J
0.00
-0.40
-0.80 , ..-20.00 0.00 20.00 40.00 80.00 80.00 100.00
ANGLE OF ATTACK (DEGREES)
Figure 8. Aerodynamic Coefficients at Strake Deflection -45.
ofi.
A * -*** .

30
m Sideslip - 150 Sideslip - 10
Sideslip - 5SSideslip - 0
0.30
0.20
0.10.
zLU
U- 0.00.LU0C.7
w
L)cc
•0 .- 0. 10LU
-0.20.
-0.30.
-20.00 0.00 20.00 40.00 0.00 80.00 100.00
ANGLE OF ATTACK (DEGREES)
Figure 8. Continued.
SV
* . . . . . . .. - -, . . .

31
*Sideslip - 15CO Sideslip m 10A Sideslip - 5T Sideslip - 0
2.40-
2.00-
1.-0
zw.H~ 1.20-
U-
0
S0.80.
0.40-
0.00.
-20.00 0.00 20.00 40.00 80.00 80.00 100.00
ANGLE OF ATTACK (DEGREES)
Figure 8. Continued.

32
* Sideslip = 150 Sideslip = 10A Sideslip - 5V Sideslip = 0
0.20
0.10
0.00z
'-4
I,-
U-W -0.10
0 .
zw0I-0...20_z
I.-
~-0.30.
-0.40-
3 ~-0.50 - -
-20.00 0.00 20.00 -;0.00 BC.00 80.00 100.00ANGLE OF ATTACK (DEGREES)
Figure 8. Continued.
. ,,, , ,.,,U,., .: ,,: . ... : - . - . :. : . t . . / : . . : . ,: _- :'.' -. . ,,,.,

33
Sideslip - 150 Sidz.slip = 10A Sideslip - 57 Sideslip = 0
0.10-
0.06
0.06
z
ILL
IL 0.0,4-=-4
U0L-
z
) 0.02
z
0.00
-0. 02- LW
-0.041-20.00 0.00 20.00 40.00 80.00 80.o 100.00
ANGLE OF ATTACK (DEGREES)
Figure 8. Continued.
.1,

34
wSideslip - 15o) Sideslip . 10A Sideslip a5V Sideslip a 0
0.08-
0.08._ _ _ _ _ _ _ _
0.04.
w
ILILWJ 0.02-0Li
zwx0
S0.00-
z
-0.2
-0.04.
-20.00 0.00 20.00 40.00 80.00 80.00 100.tANGLE OF ATTACK (DEGREES)
Figure 8. Concluded.
U%

35
* Sideslip - 15a Sideslip - 10A Sideslip - 5v Sideslip - 0
2.00-
1.60.
4 1.20-
w
0.60-A.IL
0.0.
-0.40-
I7
-20.00 0.00 20.00 40.00 60.00 80.00 100.00
ANGLE OF ATTACK (DEGREES)
Figure 9. Aerodynamic Coefficients at Strake Deflection =+30.
A.%

36
* Sideslip - 15o Sideslip - 10
A Sideslip - 5v Sideslip - 0
0.20 C
0.0 __ __ _
4 0.00.
1-4U
ILw
LU
uJL)0.20-w0
-0.30-
-0.40-
-050-20.00 0.00 20.00 40.00 60.00 80.00 100. 00
ANGLE OF ATTACK (DEGREES)
Figure 9. Continued.
* ~. . . . . . . . .
37
* Sideslip - 150 Sideslip - 10A Sideslip - 5V Sideslip - 0
2.40
2.00
1. 80
1-.20
z(.1
I-4
0U
0O. 80-
0.-0
IZl
0
": 0.80 __ __
0.0
-0.40 ....
-20.00 0.00 20.00 40.00 80.00 80.00 100.00
ANGLE OF ATTACK (DEGREES)
Figure 9. Continued.
.9. ° t • ='•

38
Sideslip - 15Sideslip - 10
A Sideslip - 5v Sideslip - 0
0.20
0. i0
0.00
I-
C).
ILLU-0.10-
w-Ot
z
x -0.20-0
z"-"z
CL -0.30
-0.40-
I'.,
-0.50 --- I-20.00 0.00 20.00 40.00 80.00 180.00 100.00
ANGLE OF ATTACK (DEGREES)
Figure 9. Continued.
It •t
Th

39
*Sideslip m 150Sideslip - 10ASideslip - 5YSideslip m 0
0.10._ _ _ _
0.08.
a 0.08-
C-3
LL0.04-0
z
w
zma
-0.2
-20.00 0.00 20.00 40.00 60.00 80.00 100.00
ANGLE OF ATTACK (DEGREES)
Figure 9. Continued.
- -- 40
m Sideslip a 15o Sideslip a 10A Sideslip - 5V Sideslip a 0 ,
0.08.
0.08 ____
4 0.04-z A
Li.U
UJ0.02-
zwo
0.00.Iz
0
-0.02-
-0.04-
-0.08i-20.00 0.00 20.00 40.00 80.00 80.00 100.00
ANGLE OF ATTACK (DEGREES)
Figure 9. Concluded.
41
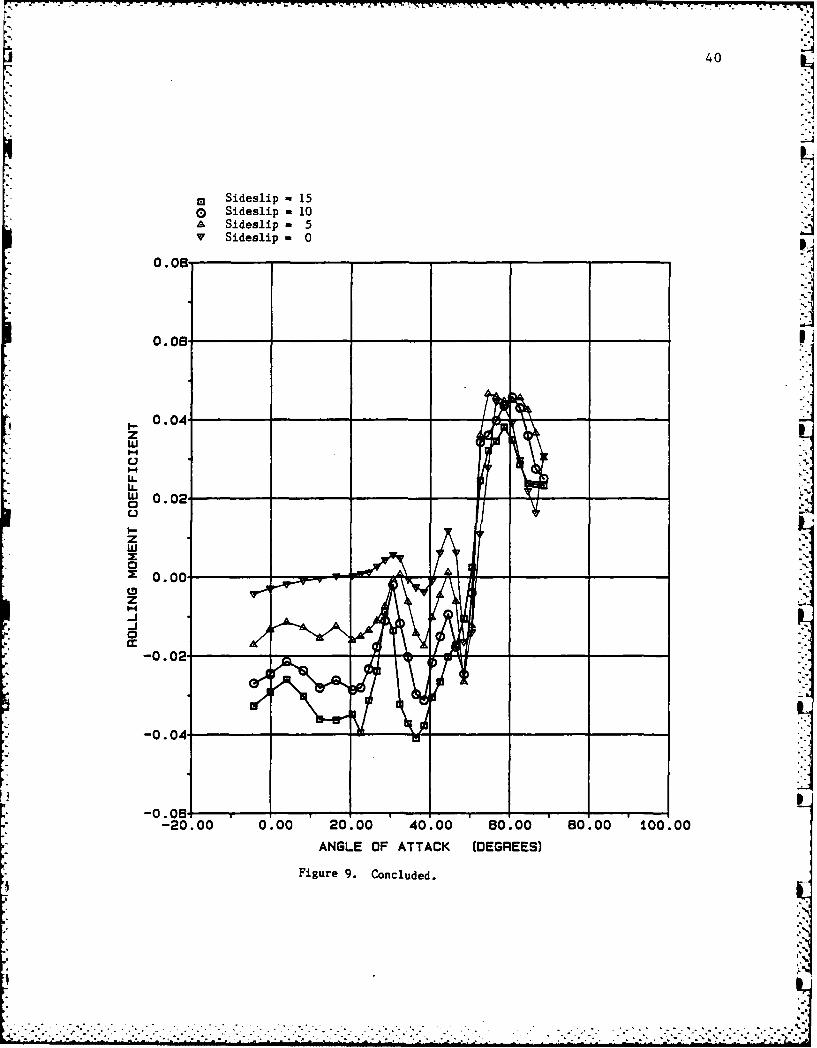
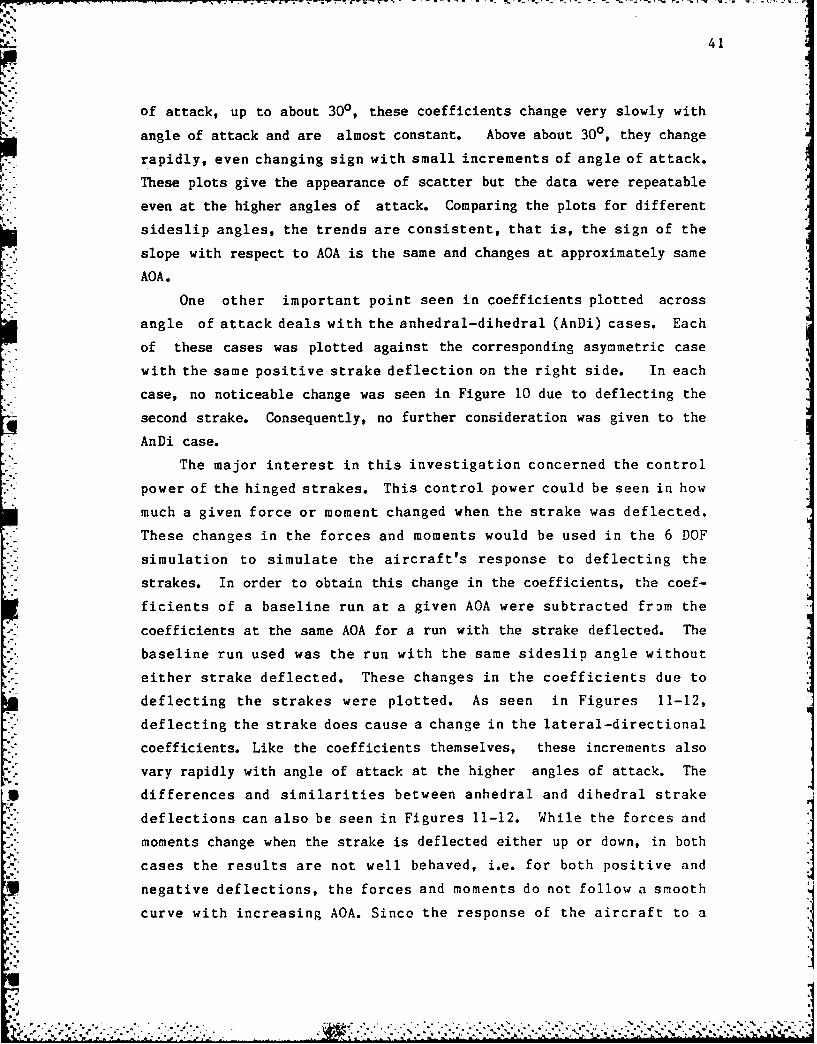
of attack, up to about 300, these coefficients change very slowly with
angle of attack and are almost constant. Above about 300, they change
rapidly, even changing sign with small increments of angle of attack.
These plots give the appearance of scatter but the data were repeatable
even at the higher angles of attack. Comparing the plots for different
sideslip angles, the trends are consistent, that is, the sign of the
slope with respect to AOA is the same and changes at approximately same
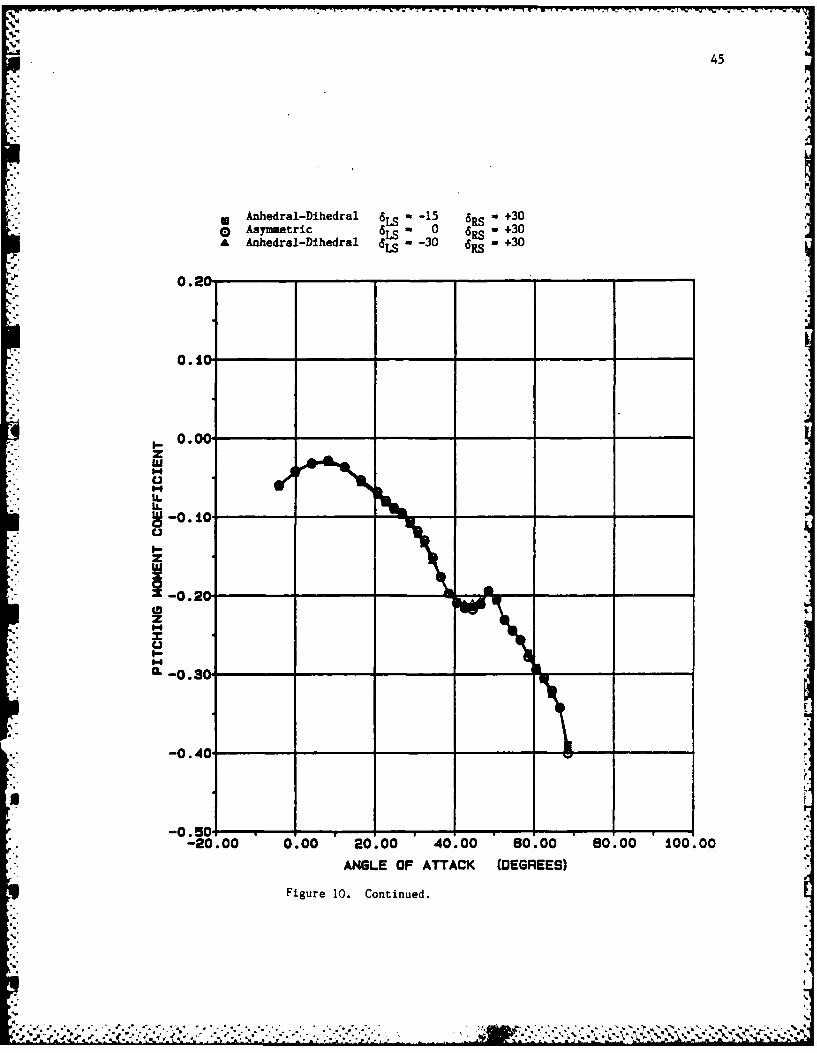
AOA.One other important point seen in coefficients plotted across
angle of attack deals with the anhedral-dihedral (AnDi) cases. Each
of these cases was plotted against the corresponding asymmetric case
with the same positive strake deflection on the right side. In each
case, no noticeable change was seen in Figure 10 due to deflecting the
second strake. Consequently, no further consideration was given to the
AnDi case.
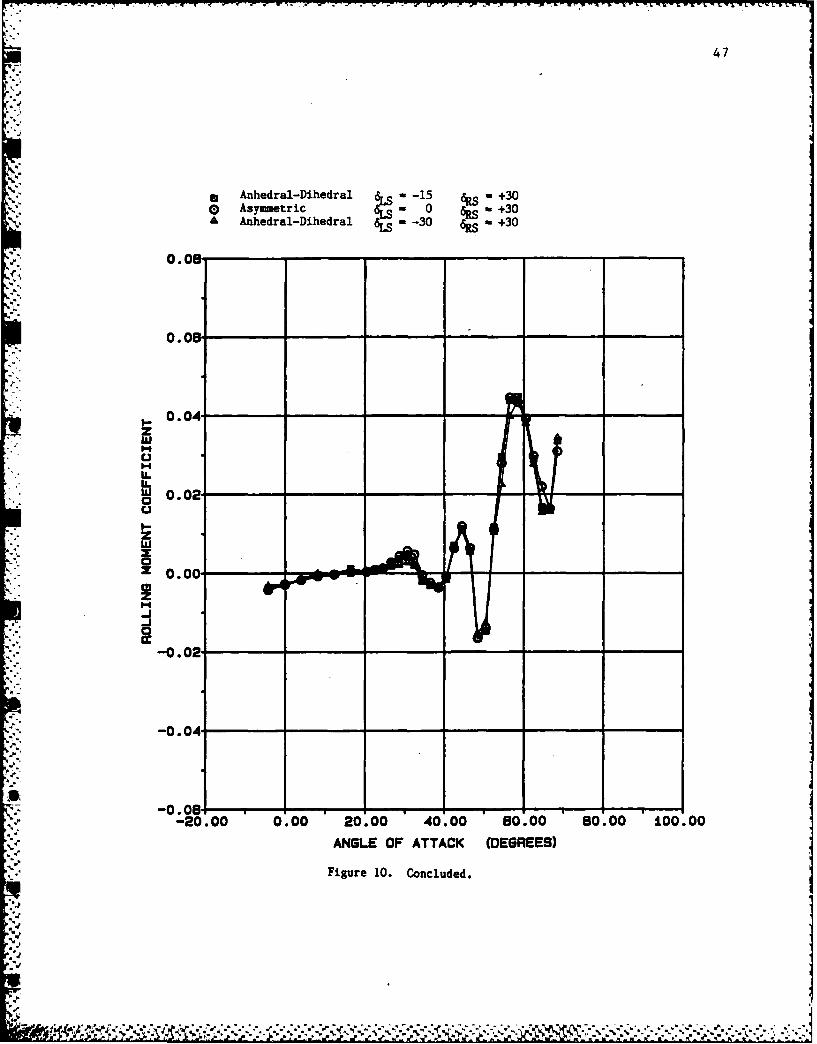
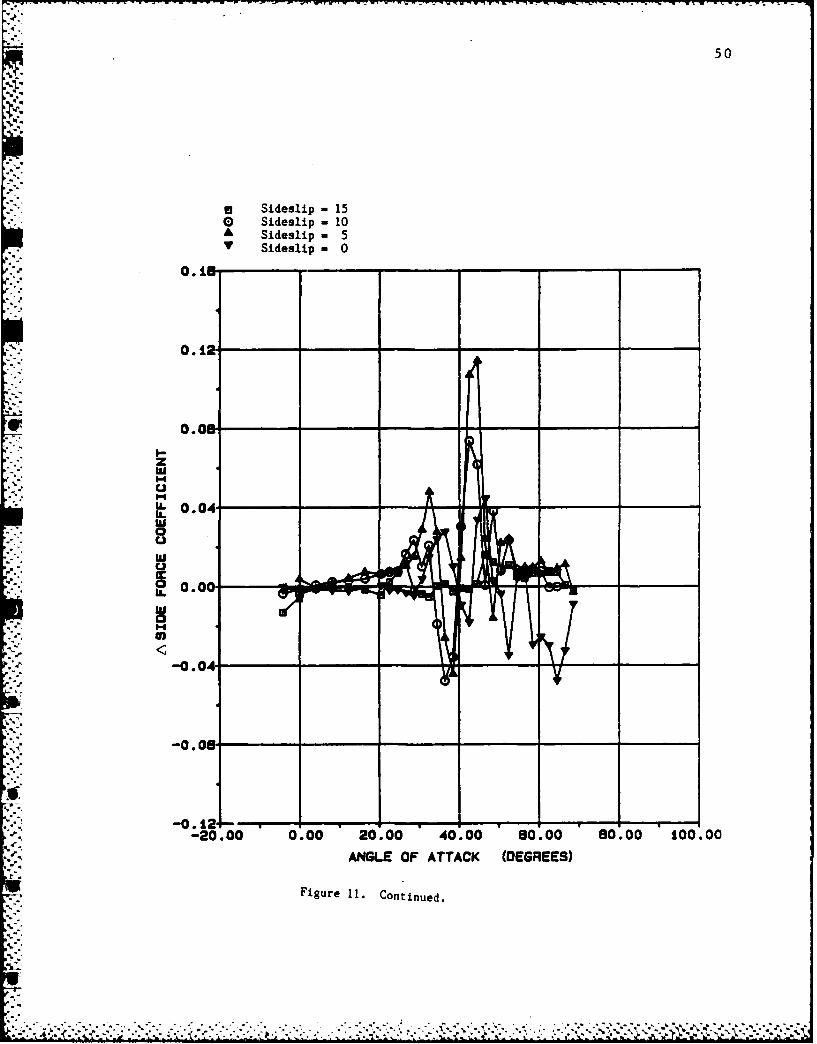
The major interest in this investigation concerned the control
power of the hinged strakes. This control power could be seen in how
much a given force or moment changed when the strake was deflected.
These changes in the forces and moments would be used in the 6 DOF
simulation to simulate the aircraft's response to deflecting the
strakes. In order to obtain this change in the coefficients, the coef-
ficients of a baseline run at a given AOA were subtracted from the
coefficients at the same AOA for a run with the strake deflected. The
baseline run used was the run with the same sideslip angle without
either strake deflected. These changes in the coefficients due to
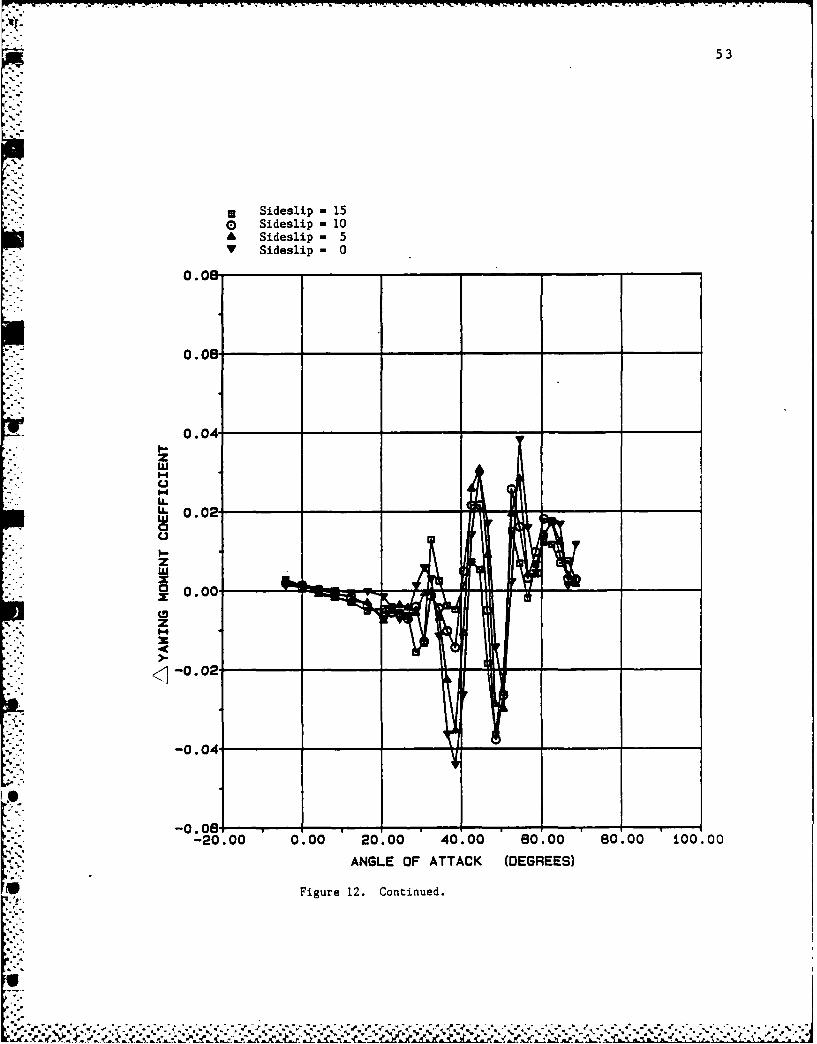
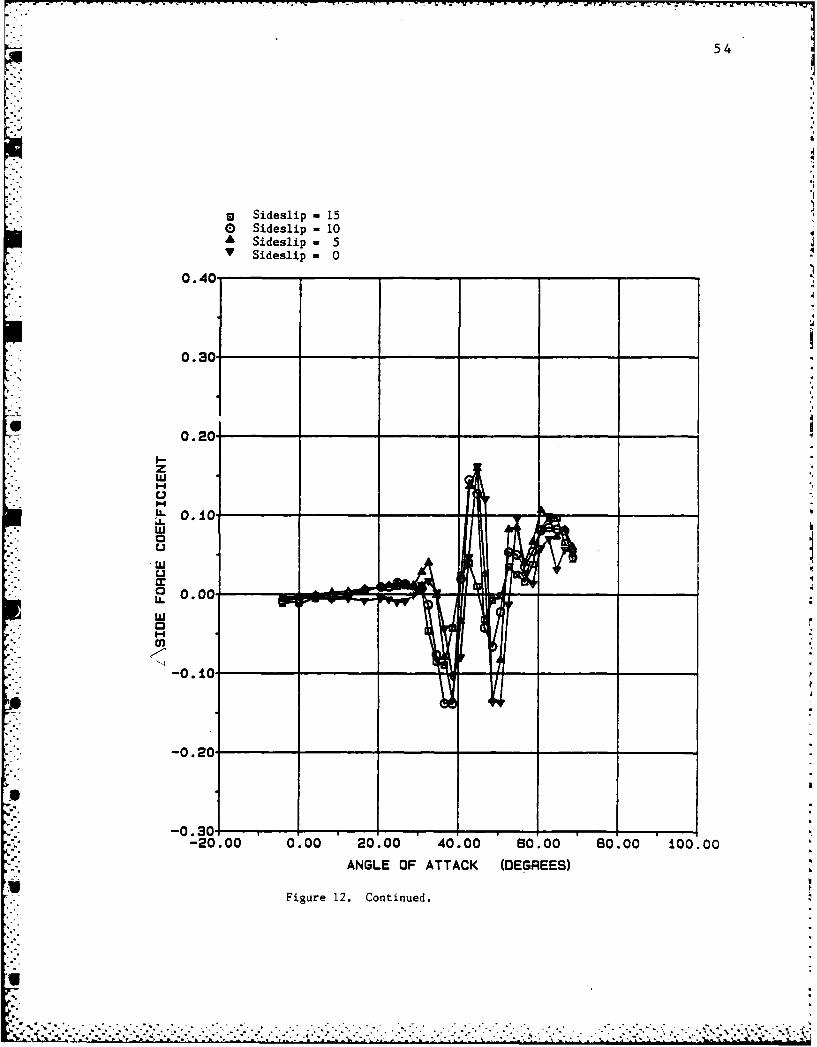
deflecting the strakes were plotted. As seen in Figures 11-12,
deflecting the strake does cause a change in the lateral-directional
coefficients. Like the coefficients themselves, these increments also
vary rapidly with angle of attack at the higher angles of attack. The
differences and similarities between anhedral and dihedral strake
deflections can also be seen in Figures 11-12. While the forces and
moments change when the strake is deflected either up or down, in both
cases the results are not well behaved, i.e. for both positive and
negative deflections, the forces and moments do not follow a smooth
curve with increasing AOA. Since the response of the aircraft to a

42
* Anhedral-Dihedral 6LS -15 6RS - +300 Asymmetric 6LS -0 6 RS - +30A Anhedral-Dihedral 6LS -30 6RS - +30
2.00
1.80
1. 20
zCM 0.80.
IL.I- I-I
IIJ0
0.40-
0.00
-0.40.
-20.00 0.00 20.00 40.00 80.00 80.00 iO0.OCANGLE OF ATTACK (DEGREES)
Figure 10. Comparison of Anhedral-Dihedral Configuration to AsymmetricConfiguration.
.. . .. . .. ... . . . . . . . . . . -.. *-,,.',*..'."..,,', . .. I I *i ' .. -

43
* Anhedral-Dihedral -L -15 6S- +30e Asymmetric tr. 0 RS . +30A Anhedral-DihedralI -6LS -30 6 RS . +30
0.06
0.04-
0.02-
z
wU
15-0.00-w0
-0.024--
-0. 0&
-0.08
-20.00 0.00 20.00 40.00 80.00 80.00 100.00ANGLE OF ATTACK (DEGREES)
Figure 10. Continued.

44
'S.,'
* Anhedral-Dihedral 6LS -15 6RS - +30
0 Asymmetric S 0 - +30Anhedral-Dihedral -3
2.40
2.00
.. 5
C 1 .80
.4
-0.40 ..
-20.0O0 0.0O0 20.0O0 40.00 80.0O0 80'.O0 100.O00
ANGLE OF ATTACK (DEGREES)
Figure 10. Continued.
".-9,. ' ' .' '' .. .' . . ." , .- ' . ." . . . • . - - - -- . • , % . . , % - , - , - ., . '
45
* Anhedral-Dihedral -LS -15 6RS - +30o Asymmetric L- 0 6RS - +30A Aahedral-Dihedral 6 -30 - +30
0.20
0.00z
U
.4 (
L
-0.10 .
z
-0.20i0z
.4 0
-0.40
-20.00 0.00 20.00 40.00 80.00 80.00 100.00
ANGLE OF ATTACK (DEGREES)
Figure 10. Continued.

q'I IM
46
.1'.4
Anhedral-Dihedral 6 - -15 6 - +30o Asymetric 0 - +30& Anhedral-Dihedral -30 - +30
0.05
....- 0.00
0.04I-z64
lUI-
0 0.02-w- Z
X
. .- 0.02-
I.
.- 0.00'
.-'.-20.0O0 0.00 20.00 40.00 80.00 0.00 10.0:0
• -,',-ANGLE OF ATTACK (DEGREES)2Figure 10. Continued.5.4w 0.0
'.'.-i
S'' . ° '' , "." ; . '' " '' ,.. - ''"" ... , . , . . ... . . """"""""""""""""""""""""""""""'""" """""""""""""""""""' /
'.,-- ' . *:' .. ' -2.00.... 0,.00 20'. -.. 00 .'.'. 0.00': ". 0 .00 80" " .00 100 ... 00J ".%'.'.'."
47
** Anhedral-Dihedral &~-15 6Rs -+300 Asymmetric dFS 0 -+30A Anhedral-Dihedral - 30 6Rs - +30
0.08
0.08
0.04-z
LL
.O
UH
LU
z0z 0.00-
cc
0.2
-0.04-
-0.043
-20.00 0.00 20.00 40.00 80.00 830.00 100.00
ANGLE OF ATTACK (DEGREES)
Figure 10. Concluded.
° ak

48
* Sideslip - 15D Sideslip - 10A Sideslip - 5Y Sideslip - 0
0.08
0.08
0.04-z
I-.
,U
M
IL- -0.02-
0z
-0.00
. -, -0 .VOB .. . ...
-z-j0
-20.00 0.00 20.00 40.00 80.00 80.00 100.00ANGLE OF ATTACK (DEGREES)
Figure 11. Incremental Aerodynamic Coefficients at Strake Deflection-45.

i--I.
49
*n Sideslip - 15o Sideslip - 10A Sideslip - 5Y Sideslip - 0
0.08
0.08
0.04
U-0.02I-z
-L0. 0z
< v< -0.02 •
-0.04
-0.O81
-20.00 0.00 20.00 40.00 80.00 80.00 100.00ANGLE OF ATTACK (DEGREES)
Figure 11. Continued.
.J . pJ..*, . ...
50
* Sideslip - 150 Sideslip - 10A Sideslip - 5
SSideslip - 0
0.18
0.12-
0.00
0.-0
3
0.4
0.6
-20.00 0.00 20.00 40.00 830.00 80.00 100.00ANGLE OF ATTACK (DEGREES)
Figure 11. Continued.

51
- Sideslip - 15- Sideslip w 10A Sideslip - 5v Sideslip - 0
0.00
0. 08
0.04.
z
msm
'-0.04.
-0.02.
.''o
20.000.0 2.0 4.0 0.0 0.0 1.0
... ANGLE OF ATTACK (DEGREES)
"': Figure 11. Concluded.
2'3
mI
",'". i
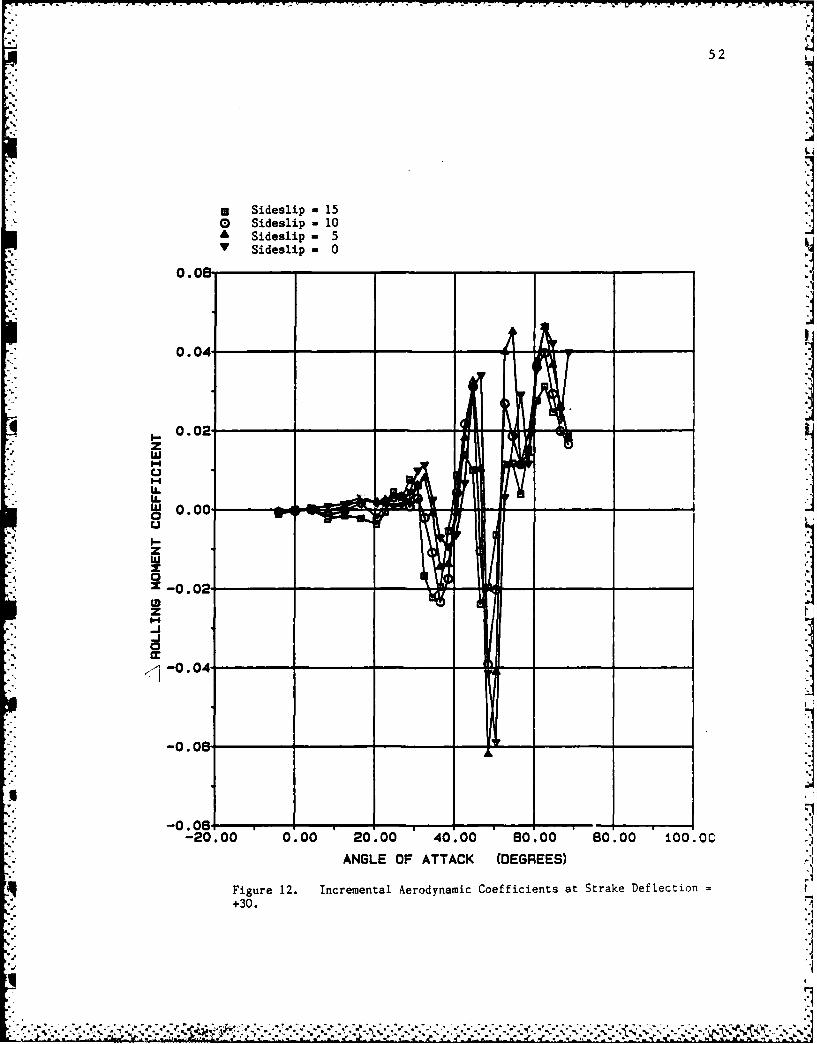
52
a Siesli a 1
* Sideslip - 15A Sideslip - 10
ASideslip - 5
0.08
0.04 -
0.02-
z-j
cJ
0
0..
-0.0
-2.0 0.00 20.00 40.00 50.00 80.00 100. 0C
ANGLE OF ATTACK (DEGREES)
Figure 12. Incremental Aerodynamic Coefficients at Strake Deflection=+30.
1i
53
* Sideslip - 15D Sideslip - 10A Sideslip - 5V Sideslip - 0
0.08
0.08
0.04
z
ILlI-4
LU'-4
.0
z
z
<-0.02
-0.04-
-008
-20.00 0.00 20.00 40.00 80.00 80.00 100.00
ANGLE OF ATTACK (DEGREES)
Figure 12. Continued.
I%
54
0 Sideslip - 15o Sideslip - 10 .
Sideslip - 5• Sideslip - 0
0.40
0.30
0.20..mL 0.10
wP
0.0
cn
-0.10.
-0.20-
-0.30i ,,,'-20.00 0.00 20.00 40.00 0.00 80.00 i00. 00
ANGLE OF ATTACK (DEGREES)
Figure 12. Continued.
U-

55
* Sideslip - 15a o Sideslip - 10
A Sideslip - 5V Sideslip - 0
0.04-
0.02-
zL
U.
I.-
z
z
0*-0.08.
-0.08.
-0.101 11-20.00 C1.00 20.00 40.00 830.00 80.00 100.00
ANGLE OF ATTACK (DEGREES)
Figure 12. Concluded.
56
strake deflection is very complex, a 6 DOF simulation must be used to
determine which strake deflection (positive or negative) will give the
best overall performance.
Figure 13 shows the incremental rolling moment for the -450 strake
deflection and the +300 strake deflection at zero sideslip plotted
against the incremental rolling moment of 100 aileron deflection5 . This
plot shows that the strakes are virtually ineffective below 280 AOA,
while in this region the ailerons are the most effective. Above about
300 AOA, the ailerons begin to lose their effectiveness, while in this
same region, the strakes become effective.
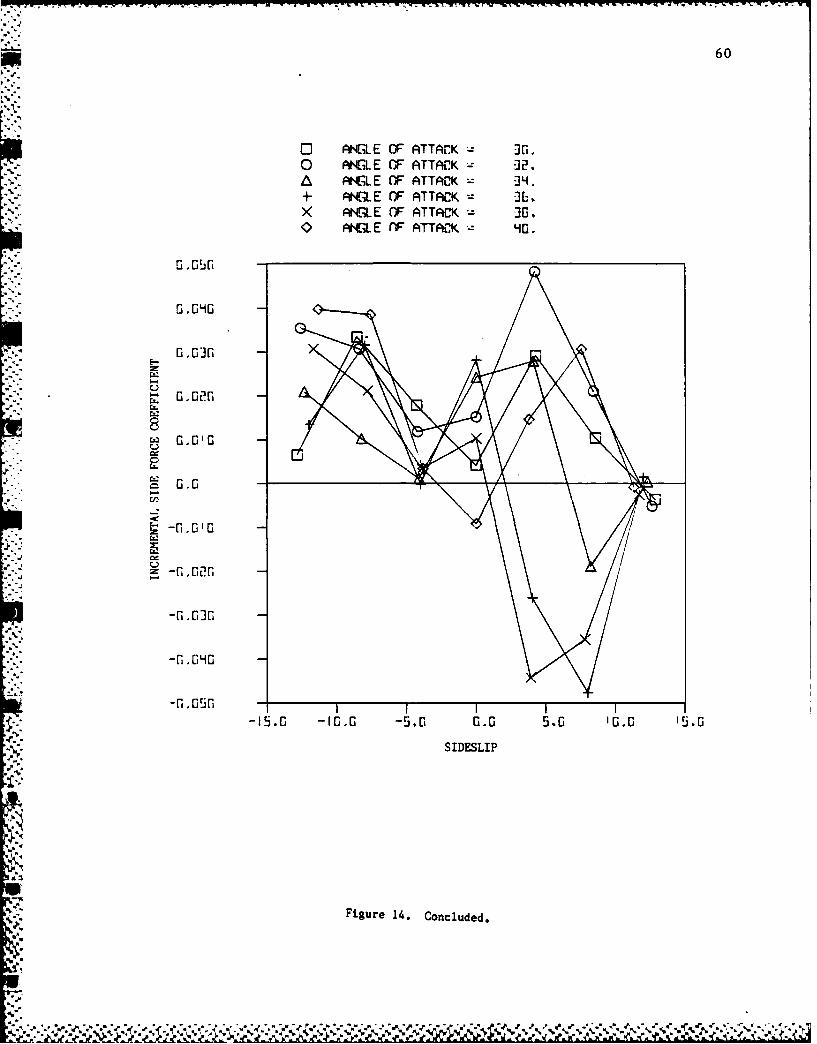
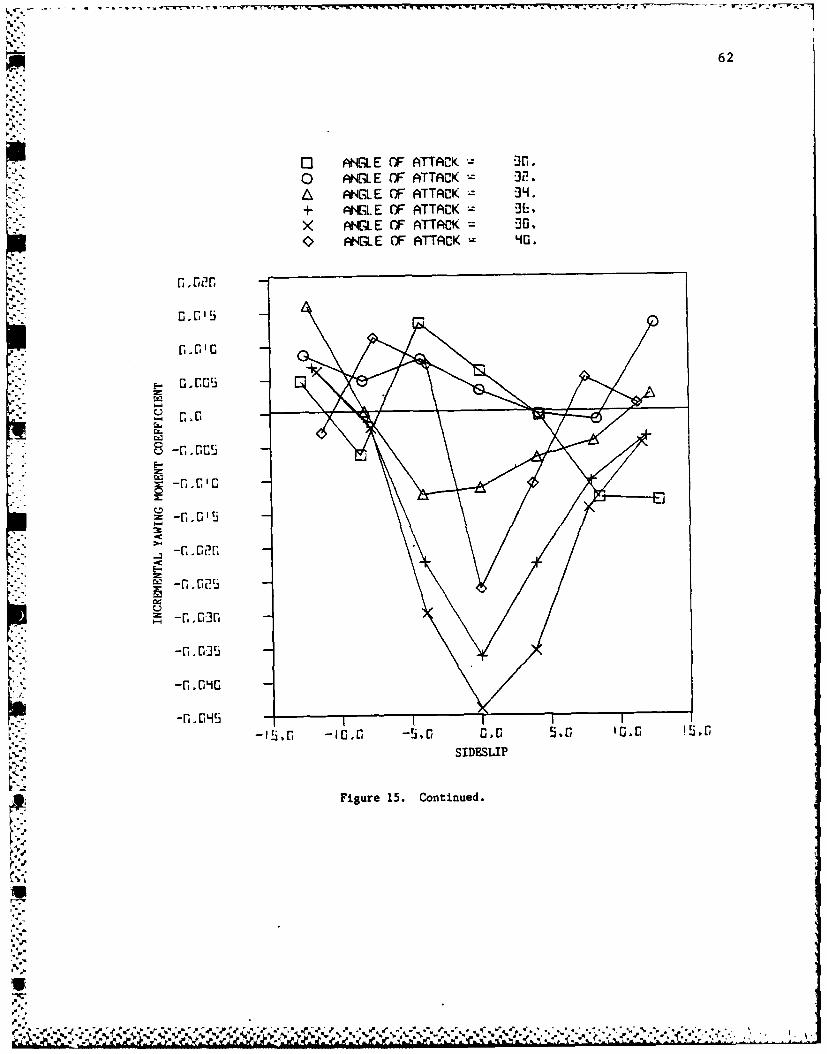
These increments were also plotted as a function of sideslip. An
example can be seen in Figures 14-15. Two points are emphasized by
these plots. First, since the configuration is not symmetric, the
coefficients are not symmetric about zero sideslip. Second, the varia-
tion of the incremental coefficients is not smooth throughout the high
angle of attack region; a given incremental coefficient may even have a
larger magnitude at a lower sideslip angle. This nonlinear behavior
could be due to factors such as the vortex system from the nose and
strake is changing character rapidly with changing sideslip. The cur-
rent increment in sideslip of roughly 50 is very coarse for this region,
and a smaller increment might help explain this behavior.
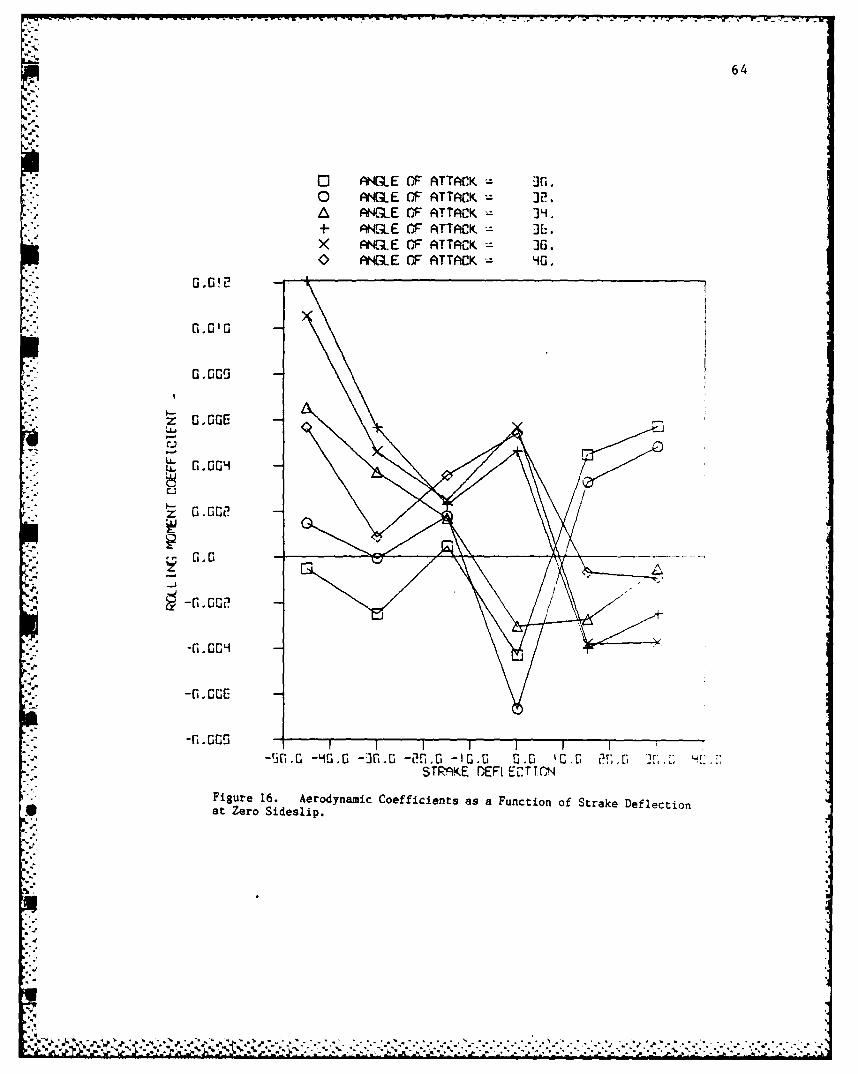
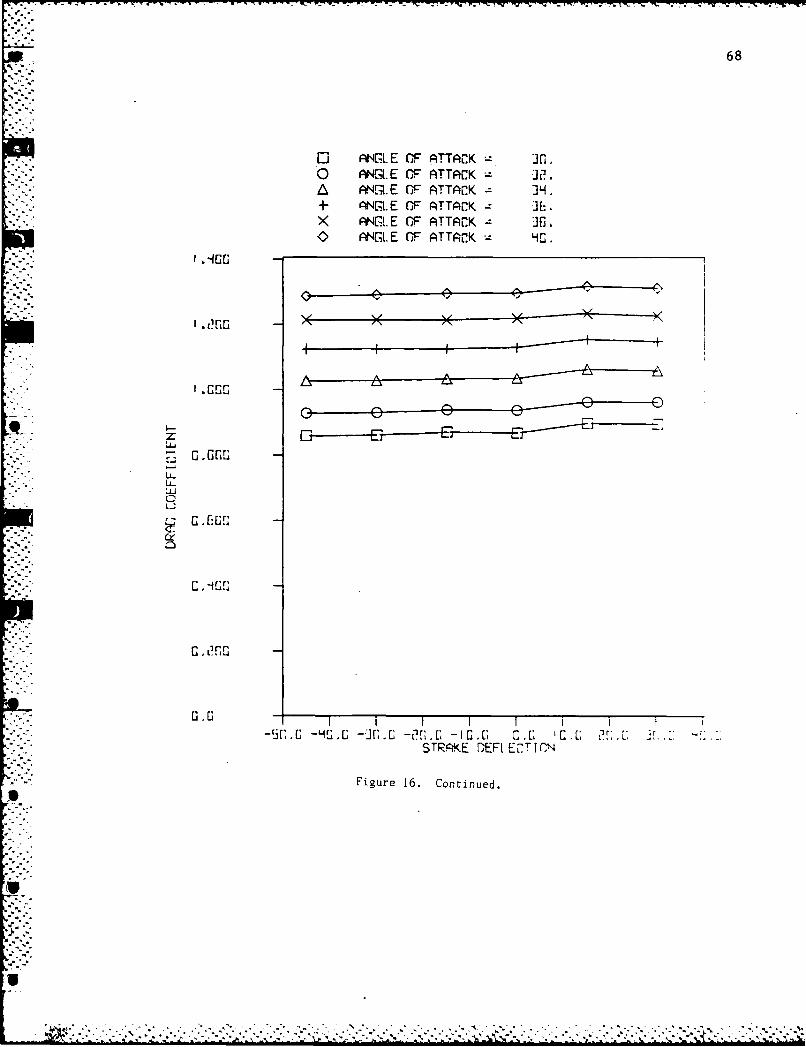
The coefficients were also plotted across strake deflection, at
constant angle of attack and sideslip. See Figure 16. The slope of the
line is roughly equivalent to the control power derivative. Again,
there is little if any change in the longitudinal derivatives due to
the position of the strakes. The variation of the lateral-directional
derivatives is not monotonic; the slope of the line often changed sign
with increasing strake deflection. For instance, at an AOA = 380,
deflecting the strake from 00 to -150 causes a reduction in rolling
moment, while deflecting the strake from -150 to -300 causes an increase
in rolling moment. The result of this behavior is that the hinged
strakes can not be treated like conventional surfaces such as ailerons,
whose forces and moments change smoothly and monotonically with deflec-
tion angle. For instance, deflecting an aileron twice as much as a given
deflection typically produces twice as much rolling moment. However,
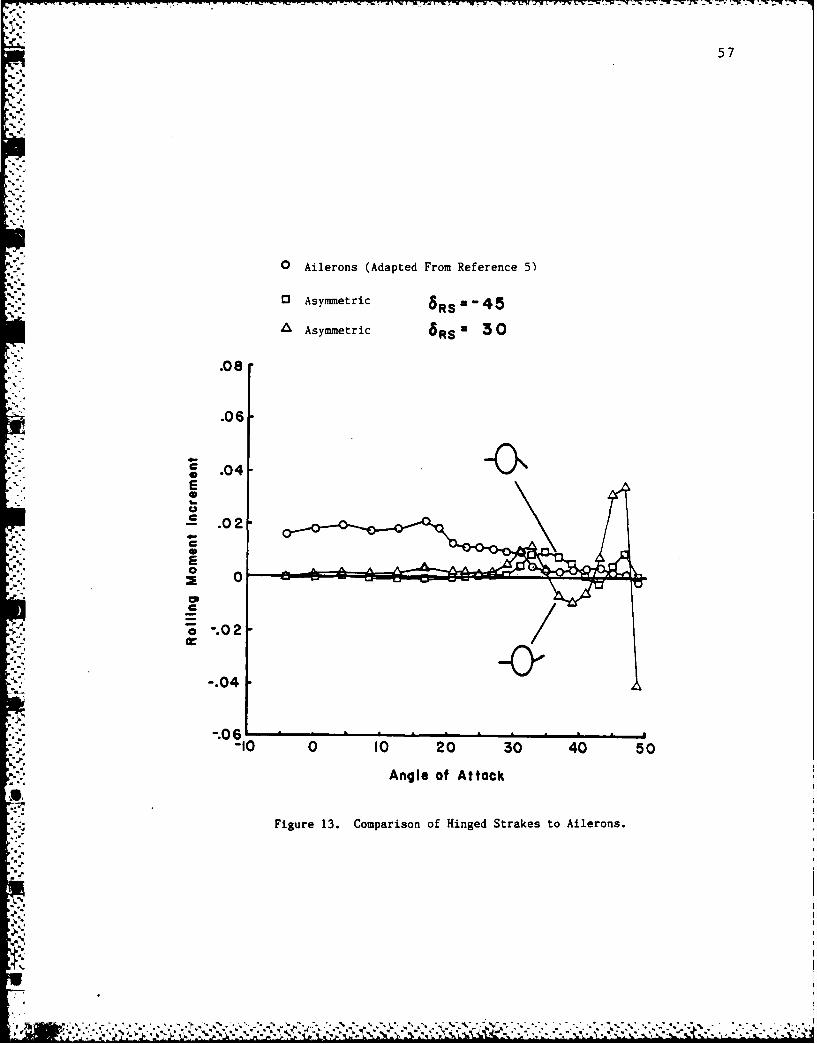
57
0 Ailerons (Adapted From Reference 5)
03 Asymmetric Rz4
A Asymmetric 6RS= 30
.08
-06-
C .04E
-S.02-
-. 00--.0461
-00 10 2 0 30 40 50
p..-.Angle of Attack
Figure 13. Comparison of Hinged Strakes to Ailerons.
.4.

58
~:ji
0 AN'L E C)F ATTACK - J,
0 AISLE CF ATTACK - 32.A' / ANELE OF ATTACK 34,
+" NGLE OF ATTACK - 3 bL'.
X ANGLE OF ATTACK - -3G
0 ANGLE CF ATTACK 40,
0.0G9
G.GOE,E-
U
8. G .BGG -
-G, G G;4 -
Sideslip -[tak Defecio -4)
CL!o L
- .- [ -. 002%0
"- - -f.OOE ;
-15,G -10.0 -5i.O 0.11 5.G '0.0 '!5, 4
iFigure 14. Incremental Aerod..nauic Coefficients as a Function of '
Sideslip (Strake Deflection - -45). 4
-
"-....i 'r 1 /. I-• - m c . , .%n 4.... -- .-- -- *.,.

59
O3 AGLE CF ATTACK = 3a.0 A NGLE OF ATTACK = 32.
S ANLE OF ATTACK = 34It AWGLE OF ATTACK = "3b.X ANGLE OF ATTACK = 36.C ANlE OF ATTACK = 40.
G.0'
Uz3
Ct
G,015
--- f...
a SIDESLIP
Figure 14. Continued.
i !............ ..................p'-*
60
[7 IE OF ATTACK .- 1.0 ANLE rF ATTACK ]2.A NL;.LE OF ATTACK 3H4- 'NWLE OF ATTACK = LX ANGLE OF ATTACK " .0 At{L.E nF ATTACK 4 40.
G 0.05
0 .04
-G.GS3i.00
-G.04
-15. G.G S C, G 050 0 01.
I--4
-,:= -0 .[
- ,G I I III
SIDESLIP
Figure 14. Concluded.
",""""""" .,%,"- . . .'"o", .'"-4.% -"""-"""-":" "% " FP ="' . . . , r . . .. . , ", ". ,.-,. -. .- j
:." ,,' ., ' 'Y'-''' ..w.', .,..- - ,., , ' ', ''.',' . ( " .. . . . .. .. '.-.,. .,..,',..',:r.... ,,. ,,. ' I

61
0 R{E OF ATTACK .0 RNGLE OF ATTACK - 2.A ANLE OF ATTACK *]"31- AWLE OF ATTACK ML'.,X A14E OF ATTACK - G
At AItLE OF ATTACK HO.
0.
-r, rip5 -"-- 5. 1
-fl.,BEG -
-t5i,O -10.0 -!i,0 0,,0 .'0.0G, 'S,0
SIDESLIP
Figure 15. Incremental Aerodynamic Coefficients as a Function ofSideslip (Strake Deflection - +30).
• m''.. . " . ," .", .".'.',''m','.''''.""",.. . . . . .. . . . . . . . . . . . . . .'. .... . . . . . . . . . . ... .,.. .,.. . . . . . , . ,, ,
62
0l ,'GLE OF ATTACK I "nl.0 PNGLE OF ATTACK "2.
A AN[I E OF ATTACK - "3H.
Li- Nq4. E OF ATTACK ,X ANCILE OF ATTACK = *JG,0 A{L E OF ATTACK 4G., G_
.. G.025(
W-n. G35
-G.
,-*,c.0 -5. 0.0 !!--
40. r p e
z."- 4
[, •,
'"
r.'i- . U
-.

63
0 ANGi.E OF ATTACK 3rOo ANGLE OF ATTACK 32.A ANGLE OF ATTACK - 42-- PNGLE (F ATTACK Jlb[X ANGLE OF ATTACK 3G.0 ANGLE OF ATTACK 40
r0,150
b-
., ,
15, -1. -5, a... 5.[ G. 5,
SIDESLIP
Figure 15. Conp:luded.
J.3
~%,C.,
;; b """; - --- .,'v- ."•". # •,"•--•'. ' . ' ., , -.--. .' .- '-..t" Y .-. ' . . .) . - 7, .; .\ . . ,. .-,4k',.."'
64
o AN LE rF ATTACK I 1.o ANGLE OF ATTACK = ]2.A ANGLE OF ATTACK = ]9.+ ANGLE CF ATTACK = E:.X ANGLE OF ATTACK =- G.<) ANGLE CF ATTACK 4 0.
G.0!2
"0, GGE
.1
..- G. GIG;:- \
G. 0GG2
Li..1
".- 7 -G. GGE--
I-
z-I. 02
p0 -.0 r-!.-.3
-S.0 -90.G -]G.0 -20.0 -10.0 SI.0 '0.0 I ;.t; 2r;.:; M.STRI.KE DEFt ECTMCN
" Figure 16. Aerodynamic Coefficients as a Function of Strake Deflection.* at Zero Sideslip.
47
,.-9

--.
65
o GELE OF ATTAC(K- 3Go LNtLE CF ATTACK = 32.A NR.LE OF ATTACK 34,- NGI.E OF ATTACK M.X rNGL E CF ATTACK 3 ]G.0 ANGLE OF ATTACK 4G.
G.G'5
*U c" G~'
GoG'G
-G. G25
-- -l .G 'X (G '
STRAKE DERt ELMLON'
Figure 16. Continued.
Volz
-"L"'."","'" "."", .i"-'"-"-."-'." .:" ,1 ' -".7' . "- i+i+]"'. ,i-i '' -." +. " i-i.. -K ' Z' I .-.- 1

66
o NGL.E OF ATTACK - Mo.o ANGLE OF ATTACK = 12.A AN CA.E (F ATTACK - 14,4- PN4i.E OF ATTACK - "-b,)< A{L E OF ATTACK = 3O.
A NG .LE OF ATTACK z HE.
0.<.010.
I-- Gz 00
U-'U-I.L
LU
-G.o rX,[
-4.,, -]o!, -I , :c l~
-(LO [t' 1 I I I I I "" i -
STR KE rEF[ E[TICN
Figure 16. Continued.
• ~~~~~~~~~~~~~~~~~~~~~~~..'...-......-.. -.•. .................... . .'$.........-.--... .. ".....-....... ...... ..j. ,.'.-. ... _

67
o NGI. E OF ATTACK - IrM.o N .E Of A~TTACK 3 2.A A~NGL E OF ATTACK - J1,4- A NGLE CF": ATTACK IbX ANGL. E OF ATTACK 10J.0 A N 1.E OF ATTACK
0.0
IL
M
-G.J
STRI(E DERt E7TICN
1Figure 16. Continued.
68
NC {L F ATTACKo ANR~. E OF ATTACK 10J.
PNCI LE 01 ATTACK 3 H,+ ANC~L E OF ATTACK Ib
)< I. E G. ATTAL-K - ]f,AN'G4L. E OF ATTACK4G
AA
orr
-5GGu -4, --Jf.G -O'[;.G -IG.G C.E. 'C,[,, ~ .:- --. STRIjKE DER E17TTC'N
Figure 16. Continued.
ITS

69
S ANGL.E OF ATT K - :3,f,0 PHEA.E OF ATTACK 32." N .E 0F ATTACK 34."+ CN[L.E OF ATTACK R -J,')< ANG.E OF ATTACK 3G,0 RI:4.E OF ATTAC0K 0 0.
zAV-' I .G~;rl
J~LLJ-
C. GEEr;
L .,1 1-
""- -S[kC -HUX -:3inG -2[!,G -10,G 0.0 !OXG 21,0,G G. S4,G .," " STRPIKE DEFL.ECTI N "
•Figure 16. Concluded.
,U-
•.'2-"Q.
I,,. [
,.-
'. ,.'-:;.'->.'"-"-% --, ?%.> "% i.---. .:4 "-i.-"->i.;--..-.>.>-:-:.? - .:.','-'b - :- , --. ' .J.x '"
70
this is not the case with the hinged strakes. Therefore, the strakes
were used by moving the approriate strake immediately to a given deflec-
tion any time that they are used. This would avoid having an unpredict-
able reaction caused by deflecting the strake a partial amount.
It
.
71
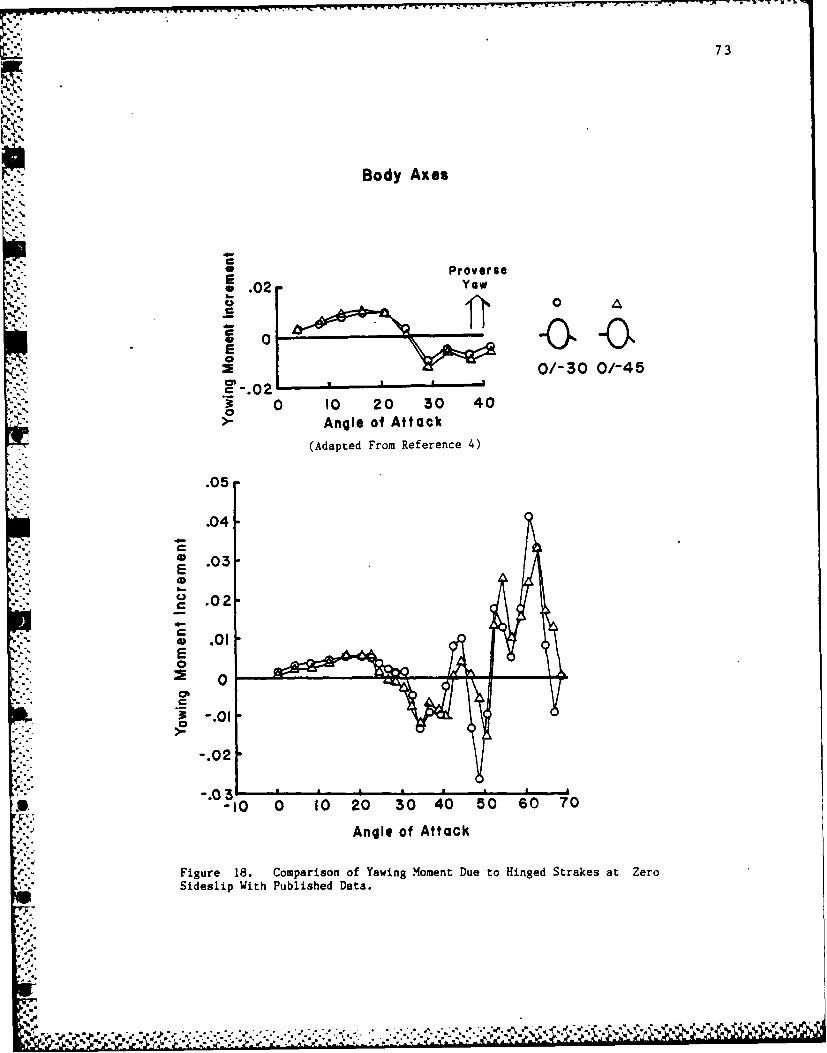
COMPARISON TO PUBLISHED DATA
To check for consistency with previous tests, the data obtained in
this test were compared to that obtained by Rao and Huffman4 . Both sets
of data for incremental rolling and yawing moment are plotted in Figures
17-18. These data are at zero sideslip for -300 and -450 anhedral
strake deflection. Note that the data are plotted in body axes.
Many similarities can be seen in the shape of the data between the
two tests. Above 200 AOA both cases show a large increase in incre-
mental rolling moment, until about 300 AOA. At this point,.there is a
sharp decrease in the incremental rolling moment continuing until 400
AOA. This sudden break has been attributed to the bursting of the
strake vortex. Both cases also show a higher incremental rolling moment
for the -450 case than the -300 case.
The incremental yawing moments are likewise very similar. In the
low AOA region up to about 200 AOA each test shows both deflections to
cause roughly the same magnitude of incremental yawing moment. At about
200 AOA both tests show the incremental yawing moment decreasing and
changing sign until about 300, where the incremental yawin- moment is
roughly constant until about 400. In both cases, the break in the
incremental yawing moment corresponds to the same AOA as the break in
the incremental rolling moment.
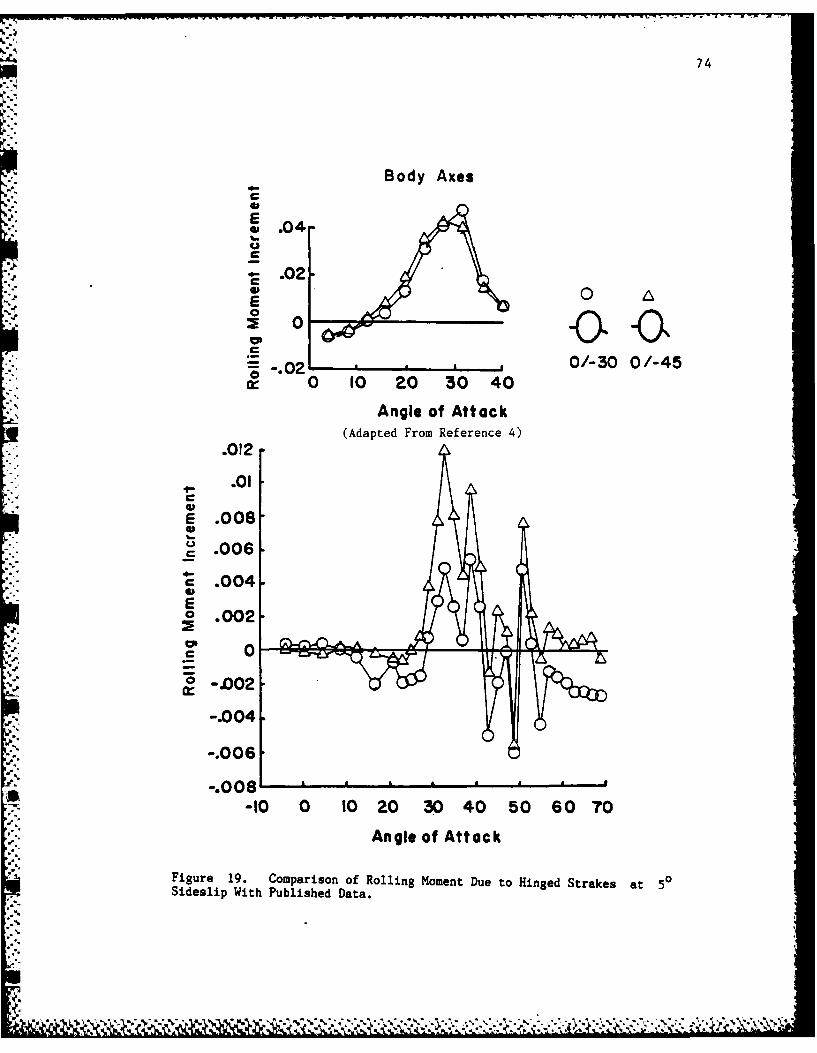
Figures 19-20 compare the data for the two tests with 50 sideslip.
Again, many similarities between the data can be seen. The incremental
rolling moment for both tests in this case continues to show the same
basic shape, rising around 200 angle of attack, reaching a maximum
around 300 to 340, and dropping back down by 400. The overall magnitude
of both incremental rolling moments has also decreased as a result of
the introduction of sideslip. The incremental yawing moment curves also
s*'ow the same basic shape as before. Reference 4 is not clear in
stating if the yawing moment contribution of the baseline model was
subtracted from the data for the deflected strakes. If it were not,
this ommission could account for the negative magnitudes at low AOA
where the fighter data of this test shows a positive magnitude.

72
-p%..
Body Axes
0 06E
.= .04 oz
o .02 0/-30 0/-45
C
z 0" 0 10 20 30 40
Angle of Attack(Adapted From Reference 4)
.02
.015
E".01
C
cc .005-
0
-005-
-.01
-10 0 10 20 30 40 50 60 70
Angle of AttackFigure 17. Comparison of Rolling Moment Due to Hinged Strakes at ZeroSideslip With Published Data.
::..? ~ ~ * **~T -, ' -, .,. - ... , ' .. p. ." *= " •.r , ,t J ( - , . ,. . . , , • , i ,. . ., , . , .
.- 73
Body Axes
* Proverse02 Yaw d0
* .02
Oj____________ 0/-30 0/-45
0 0 10 20 30 40Angle of Attack
(Adapted From Reference 4)
. .05
.04
* .03E
£ .02
C* .01E
02 0
. -.01
-. 02
* -10 0 10 20 30 40 50 60 70
Angle of Attack
Figure 18. Comparison of Yawing Moment Due to Hinged Strakes at ZeroV," Sideslip With Published Data.
74
Body Axes
C
E * 04
C
. .02
2 0
CP
0/-30 0/-45-.02,cr 0 10 20 30 40
Angle of Attack(Adapted From Reference 4)
.012
.01
E .008_ .006-
.004
0 .002 ^
0. -Do2-. 004
-.006
-.008-10 0 10 20 30 40 50 60 70
Angle of Attack
Figure 19. Comparison of Rolling Moment Due to Hinged Strakes at 50Sideslip With Published Data.

75
Body Axes
!,-C
C 0 00
0C0
-.0
_____7___ 0/-30 0/-45
-0435
0 0 10 20 30 40Angle of Attack
(Adapted From Reference 4)
.025-
.02-
.015-%C
* .01
005
0
S-.015
-1O 0 10 20 30 40 50 60 70
Angle of Attack
Figure 20. Comparison of Yawing Moment Due to Hinged Strakes at 50Sideslip With Published Data.
4%~ ~~trtrr -w -. -%-s- - . - ~ r'-' X rW .-- --
76
While the behavior of the data in both tests is similar, there is a
significant difference in their magnitudes. The most obvious difference
0'. between the generic model of Reference 4 and the high performance
fighter of this test is the difference in strake area in terms of
percentage of wing area. Bath models are shown in Figure 21 with equal
wing span. The generic model has a 440 leading edge sweep, compared to
a 450 sweep on the high performance fighter model. Both wings can be
considered roughly the same for purposes of this comparison. The ex-
posed area of the strakes of the generic model equals 26.6% of the wing
area, while the area of the strakes of the fighter is only 3.6% of theIwino area. If the magnitude of the incremental m~oments was strictly a
function of the area ratio between the strake and the wing, then theratio of the magnitudes of the incremental moments would be 3.6/26.6
rolling moment is .29, and the ratio of the magnitudes of the maximum
incremental yawing moment is 0.5. Comparing the maximum incremental
rolling moment for the case with sideslip, the ratio of the magnitudes
is still .29, indicating that the effects of sideslip are similar in
both cases. In addition, the generic model shows that with and without
sideslip, 6s = -. 450 and 6s= -300 produce about the same rolling moment
both with and without sideslip. The fighter model shows the -450 case
to produce roughly twice the rolling moment as the -300 case both with
and without sideslip. Likewise, both models show each case to produce
equal amounts of yawing moment regardless of sideslip. Apparently, the
effects of sideslip are similar.
Since the ratio of incremental rolling moment is greater than the
ratio of strake/wing area, the source of the rolling moment is not only
due to the reduction of the projected area of the strake, but that a
major portion arises from the decrease of circulation velocities in the
vortex. If strake area were the only factor, then the ratio of the
* magnitudes of the incremental rolling moments of the two tests would
have been equal to .16, the ratio of the strake areas. c wever, the
rolling moment due to deflecting the smaller strakes is greater than
would be predicted by such an analysis. Since the strength of the
vortex is not only dependent on the are of the strake, this result would

77
C1l)C14
0
0L*
7- -:. v- ; r C -6-tvC>rV
78
indicate that the weakening of the vortex one of the causes of the
rolling moment.
Since the yawing moment coefficient of the smaller strake is closer
to the yawing moment coefficient of the large strake than the rolling
moment coefficient of the small strake is to that of the large strake,
it seems that the incremental rolling moment coefficient is more sensi-
tive to the size of the hinged strake. Although insufficient data are
available to reach a conclusion at this point, it is possible that
larger strakes would create a change in available rolling moment without
as large a change in yawing moment.
In spite of these differences, a consistency in basic trends can be
seen between the data of this test and thet data shown by Rao and
Huff man 4 . Rao and Huffman had recommended that the hinged strake con-
cept be tested on more realistic configurations, and this test shows
that many of their basic concepts are still valid even with a different
configuration.
'i-" i"" " . " ' "... ... ." "- " .. . . .

79
SIMULATION ANALYSIS
Since an aircraft flying at high AOA has highly coupled behavior
between the longitudinal and lateral-directional modes, it is difficult
to obtain any sense of the response to control inputs just by examining
the static aerodynamic data. Therefore, the bulk of the analysis in
this study was done using a six DOF computer simulation model.
The mathematical model used was a modification of the model devel-
oped by Stout 5 at Texas A&M. This model was set up to run using the
EASY4 Dynamic Analysis Program9 on a CDC Cyber 825. This program simu-
lates the behavior of the aircraft using a state variable approach,
integrating the states of the aircraft while stepping through time.
Through the use of tabular input data, the program can simulate the
nonlinear behavior of the aircraft at these high AOAs. Since dynamic
derivatives for the strakes were not available, only the static data for
the strakes are considered in the analysis.
The original simulation had a trim routine which calculated the
states for the Flight Control System (FCS) for 1 g, straight and level
flight. This routine not only calculated the airspeed for 1 g flight at
the given angle of attack, but also calculated the states at the given
operating point such that none of the states would have an initial
transient. At the angles of attack investigated, this trim approach
yielded a dynamic pressure of about 25 psf and possibly led to unreal-
istically low roll rates in the previous study. If the dynamic pressure
were increased, it was postualated that these roll rates could be
increased. Since the angle of attack was fixed, increased dynamic
pressure would yield a higher load factor. With this in mind, the trim
routine was rewritten to allow commanded normal acceleration to be input
through the pitch stick channel. For conditions other than level
flight, this results in a steady pullup. An initial roll angle is
allowed, but the iritial roll and yaw rates must be zero. This steady
pullup more accurately modeled conditions under which high angle of
attack flight would be encountered.
Several points should be noted nbout the relationship between the
commanded g and the resulting normal acceleration at the CG. First, the

80
stick commands incremental g's in the body normal direction. Since the
aircraft is at an angle of attack, the body load factor is related to
the stability axes load factor by
n - nSAcosa
Thus, for straight and level flight, a normal acceleration of cosa must
be commanded, or since the stick commands incremental g's, for level
flight a load factor of cosa - 1 must be commanded. At high angles of
attack, the angle of attack limiter reduces the amount of load factor
commanded such that the resulting load factor is less than that
commanded. As a result, in order to command a desired load factor, the
stick input must be calculated by the following equations:
For a < 29.90:
ncom = ndesiredcos a - 1
For a > 29.90:
ncom = ndesiredcosa + 0.322( a - 29.9) - 1
Note that if ncom > 8.0, the AOA limiter will not allow the aircraft to
trim at the desired load factor.
The nonlinear data for the simulation was obtained from several
sources. A majority of the aerodynamic data was obtained from the open
literature.I0 These data gave various coefficients of the aircraft as
functions of angle of attack and mach number. Additional nonlinear
lateral-directional data for the baseline aircraft as functions of angle
of attack and sideslip were obtained from the wind tunnel test. Due to
slight asymmetries in the model, the baseline data for C0, Cn, and
did not equal zero at zero sideslip. These data were mathematically
shifted to pass through zero to eliminate effects on the simulation at
zero sideslip. Since all of the analysir is calculated in body axes,
all of these data were entered into the model in this format.
The data for the effects of the strakes were entered into the model
as the increments in the coefficients between the run with the strake
deflected and the baseline run. As seen earlier, deflecting strakes of
"I
81
this size had virtually no effect on the longitudinal characteristics of
the aircraft, so no longitudinal data from the strakes were included in
the analysis. The data from the strakes for C , Cn, and Cy were entered
as tabular functions of angle of attack and sideslip for each measured
strake deflection from -450 to +300. These data were entered in stabil-
ity axes to prevent confusion between these data and the data analyzed
earlier. In order to calculate the effect of the strake, its effect was
calculated as a function of AOA and sideslip in the tables for both the
strake deflection above and below the current deflection. These two
values were then interpolated based on the current strake deflection.
The resulting coefficients were then converted to body axes before being
used in the analysis. As a result of this scheme, the effects of the
strakes could be modeled as functions of angle of attack, sideslip, and
strake deflection as shown in the previous analysis of the aerodynamic
data. The strake data tables ranged in AOA from 260 to 420 and in
sideslip from -150 to 150. For points outside this data range, the
values of the coefficients are treated as constant from the last data
point. For instance, at an AOA of 340 and a sideslip of 200, the value
of the coefficient at an AOA of 340 and a sideslip of 150 was used.
Due to the nonlinear aerodynamics of the hinged strakes, the
strakes could not simply be connected to the roll channel. Since the
aerodynamic moments were not monotonic with strake deflection, a "bang-
bang" control system was installed. When a roll command is received,
the appropriate strake is deflected to full deflection until the desired
roll rate is achieved, then the strake returns to the undeflected posi-
tion. The actuators are modeled with a transfer function of
10
S + 10
with a rate limit of 120 degrees/second. This rate limit was based on
the rudder's rate limit of 120 degrees/second, and should be reasonable
since the strake is a smaller surface. The initial implementation of
the Hinged Strake Flight Control System is shown in Figure 22. Only one
strake is commanded to be deflected at any given time, since the
0
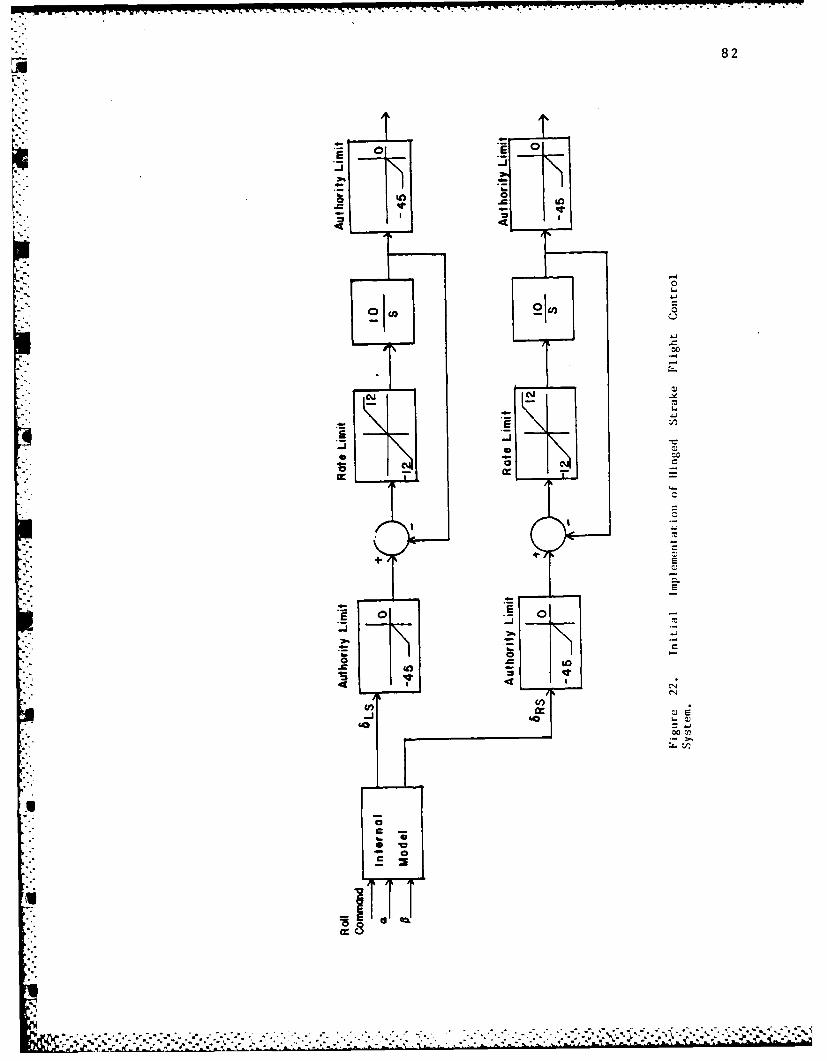
82
r- I
10 . 0
Gof
- (- _
.00
-°-j
o 0
,,.,--,:. ..'-. -.-". ...-,.-"-°. ....'-.,- .". '' .":.-.'", --,-:-"- r': -
AD-Ai58 005 USE OF HINGED STRAKES FOR LATERAL CONTROL AT HIGH 2/,aANGLES OF ATTACK(U) AIR FORCE INST OF TECHNRIGHT-PATTERSON AFB OH R E ERR MAY 85
USI E D FTC/R8-1 / 94 N
io
'111iO 1112---S11111"--- l* * I -
IIIJIL25I1.6
MICROCOPY RESOLUTION TEST CHARTNATIONAL BUREAU OF STANDARDS- 1963 A
%(Ik F
II

83
Anhedral-Dihedral case showed no noticeable change from the Asymmetric
case.
The block labeled Internal Model in Figure 22 defines logic for
choosing the appropriate strake to deflect. Several factors are con-
sidered to produce the command signals to the strake actuators. Since
the strakes have virtually no effect below 280, the strakes return to
the undeflected position anytime the angle of attack falls below 280.
Another major consideration is a "unidirectional" region. This region
is an area where deflecting either strake produces a rolling moment in
the same direction.
Since the asymmetric strake deflections tested only considered
deflecting the right strake, symmetry was assumed to calculate the
effect of deflecting the left strake. The coefficients due to the left
strake are calculated by the equation
C (c -C (a~-8X left x right
See Figure 23. The other force and moment coefficients are calculated
in a similar fashion.
The unidirectional region arises from a condition shown in Figure
24. At an angle of attack of 300 and a sideslip of 12.50, a right
strake deflection produces a right rolling moment. In order to find the
rolling moment for a left strake deflection, first find the rolling
moment for a right strake deflection at an angle of attack of 300 and a
sideslip of -12.50. In this case, the right strake deflection produces
a left rolling moment. After converting to the corresponding left
strake deflection at an angle of attack of 300 and a sideslip of -12.50,
the left strake deflection produces a right rolling moment. Therefore,
at this angle of attack and sideslip both right and left strake deflec-
tions produce a right rolling moment. This angle of attack and sideslip
is in a unidirectional region. These regions can be identified on the
plots of incremental rolling moment versus sideslip, as shown in Figure
25. If two points on the incremental rolling moment plot for a given

84
Unidirectional Region
Rolling Moment
V.0 V63
*%,
..-4 , .8 = -, (,-
C CS
eft right
Figure 23. Calculation of Coefficients For Left Strake Deflection.
.:-

85
8RS 30
a=30 12.5
V1 WIND TUNNEL DATA V..
--- - - - - - - - -
FINAL RESULT
Figure 24. Description of Unidirectional Region.r
1.7.

86
Asymmetric 8RSz 30
0 Angle of Attack = 30
.01 .I
.008
.002 *1
. 0
%'b"
-p-, .o2- o
E -.002.
4-0,r, ".004
IUnidirecioflol Region
.006
-.008 i--------15 -10 -5 0 5 (0 15
S ideslip
Figure 25. Unidirectional Region With Respect to Sideslip.
,1%
'p,.
r . . - -- .' .' . .,.. 7 ,.,.. ..

87
angle of attack at equal and opposite sideslip angles have opposite
signs, then those points are contained in a unidirectional region. L
A flowchart of the logic used in the internal model is shown in
Figure 26. If the angle of attack is less than 280 or no roll is
commanded, both strakes are commanded to zero deflection. If a roll is
commanded, then the roll coefficient for maximum deflection of each
strake is calculated. If these coefficients have the different signs,
then the strake producing roll in the commanded direction is deflected.
If both roll coefficients have the same sign, then the aircraft is in a
unidirectional region. If both strakes will roll the aircraft in the
commanded direction, then the strake producing the most rolling moment
is deflected. If neither strake will produce the desired roll direc-
tion, then both strakes are returned to zero deflection.
One should note that two major assumptions are inherent in the
design of the strake flight control system. One assumption is that the
sideslip angle is available for the logic choices. Presently, no satis-
factory sideslip indicators for use at these AOA exist on operational
aircraft. The second assumption is that a good model of the strake
aerodynamics is available. Creating such a model could be difficult,
since it is likely that different store configurations, or even irregu-
larities between aircraft could have a major effect on the strake aero-
dynamics. This effect of slight irregularities is suspected since a
change in the data was seen even when reinstalling the same model in the
same wind tunnel. This assumption could be investigated by further wind
tunnel tests using different store configurations and different models
of the same type of aircraft.
.
°.,I

88
COMLSLCKD 0OL:CORSSTD CMR: CMR=
IN
Figure 26.IntrnlMdelFlwchrtSGNR= IGN 0 CRFR
SG ASN
.1y

89
ROLL PERFORMANCE OF STRAKES
The first simulations done used strakes alone as a roll control
device. These simulations used the initial implementation of the strake
flight control system, in which the strakes were commanded separately
from the ailerons. The remainder of the aircraft FCS was unaltered,
except that the ailerons were disabled, so that the roll rate feedback
to the ailerons would not oppose the roll caused by the strakes. In the
yaw axis, only the standard feedback channels were active, namely the
stability axis yaw damper and the lateral acceleration. These simula-
tions were initially started in 1 g straight and level flight at 320 AOA
with the maximum upward strake deflection of +300. This condition was
chosen because it gave the maximum rolling moment available, and the
data at this AOA and strake deflection were the most symmetric about
zero sideslip, presumably giving the most consistent behavior. An
important additional point was that these simulations used linear deriv-
atives ( C , Cy )i0
The z sulfs for the +300 strake deflection can be seen in Figure
27. The control input commands maximum right roll from 0 to 6 seconds,
and then no roll from 6 to 8 seconds. At the end of the 6 second
period, the aircraft has only rolled 400. The stability axis roll rate
shows an initial increase until about 2 seconds, where it starts oscil-
lating. This roll rate never increased above 10 deg/sec, which is not
high enough to truly be useful. This rolling moment was the highest
available in simulations at other AOAs between 300 and 400.
A key to the reason for this low performance is the sideslip pro-
duced by this maneuver. The strakes produced a fair amount of adverse
yaw, causing a positive sideslip of up to 40. As a result, the dihedral
effect of the aircraft produced a significant left rolling moment, which
degraded the rolling performance. A clue to solving this problem is
seen in the fact that only 1.5 degrees of rudder was used in this
maneuver, while 300 of rudder throw is available.
For purposes of comparison, the same maneuver was performed using
the maximum negative deflection of -450 on the strakes. See Firure 20.
The dihedral effect was even more evident. This strake deflection
%%
.
"" ..- " " ." . .. ' ." :" ' '. '.' '. . "'. . "'.. '." .'.- .- ', '.'..' ';-'.-'. '.''.' .'-.'-''o''.''-""-''- '. ' -' .'.- . . - " . . .'-."

90
.G.
', iGr,"
-15n, I-20.
-200 -
5 ,GG -4.00
3.EG .G
2.00 -
Lau 0 -Ln G.G -
2. O -
LOG
40.030O.0
IG-
90.0210.0
'40 .G
35ZG
30 0II
4-r
051G.
O L . 2.0 3. 4. 0 510 E. a I .0 9.6
TIME (SEC)
Figure 27. Maximum Roll at 1 g Using Hinged Strakes Only (AOA - 320,Strake Deflection - +30).
1, ",4., .> . :\{ , . ,. . ...: ?,,, .: >....... :..... .
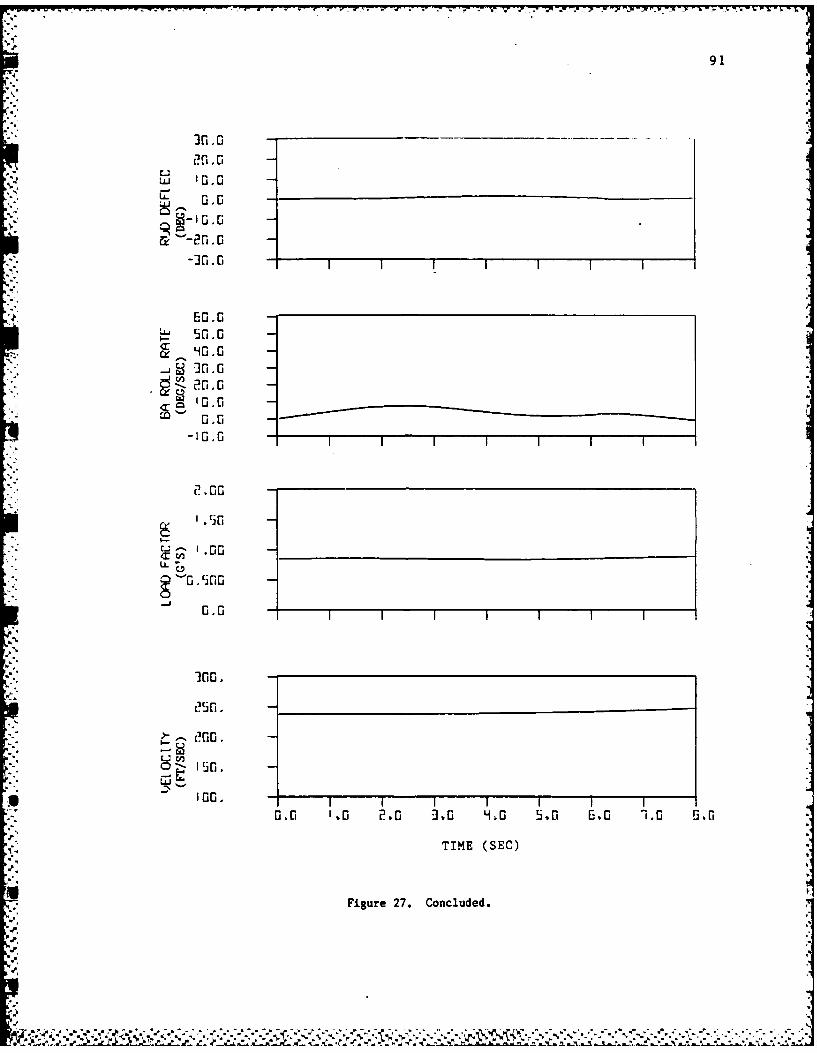
91
3G. 0
JrL02. 0.0 -
" NL 0.0
-30.0
600&-2f.00
-]f50 -
U O0 -
,LL
0.0
0. -
u 20. ncd
100.
0 -i~.0,III
4" - TIME (SEC)
Figure 27. Concluded.
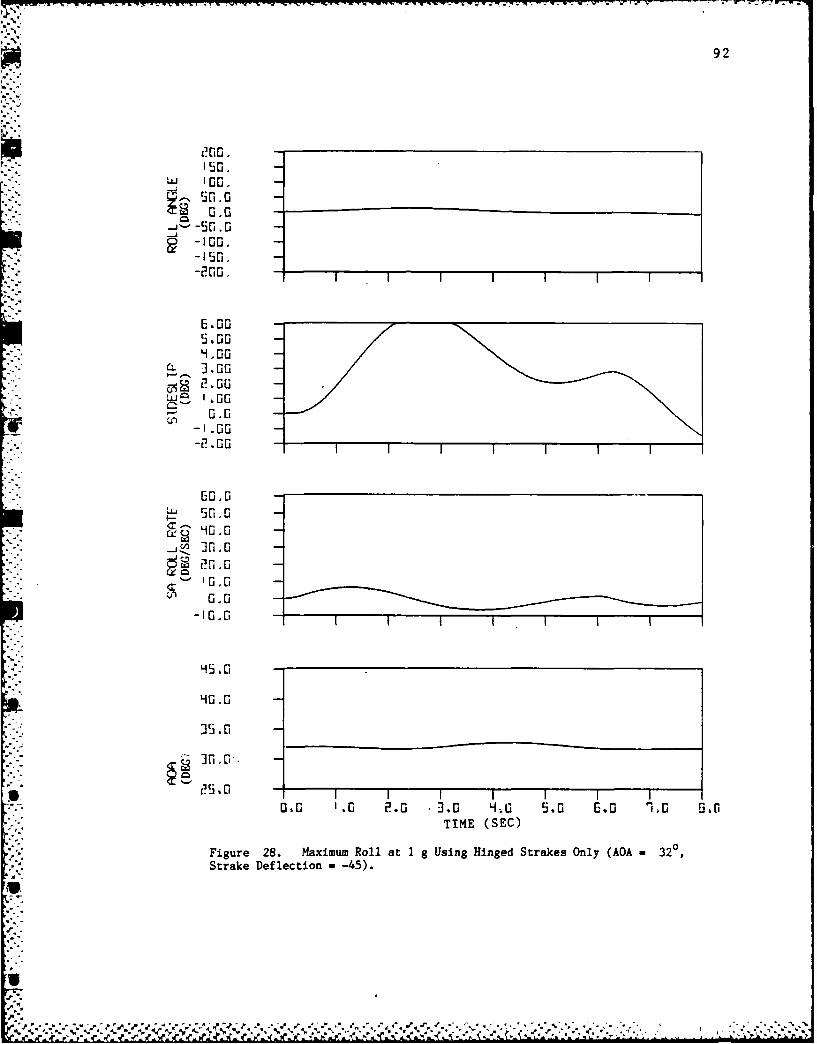
92
00o.2G.
-G,
L '00
... 00
4.00o2(i. -
-GG,0.0 -
0,0
0I 0
'r. ] .0
2.
-10.0
45.0
0 -. -
00.0
Fiur 28. Maiu ola I g Usn Hige Stae nlIA 3
Stan Delcto -- 5)
.- 50 .0
--
25.0
'10.0
O G '.0 2,0 .-J.0 41 0 5.0 0.0 1.0 0.0TIME. (SEC)
Figure 28. Maximum Roll at 1 g Using Hinged Strakes Only (AOA - 320,Strake Deflection - -45).
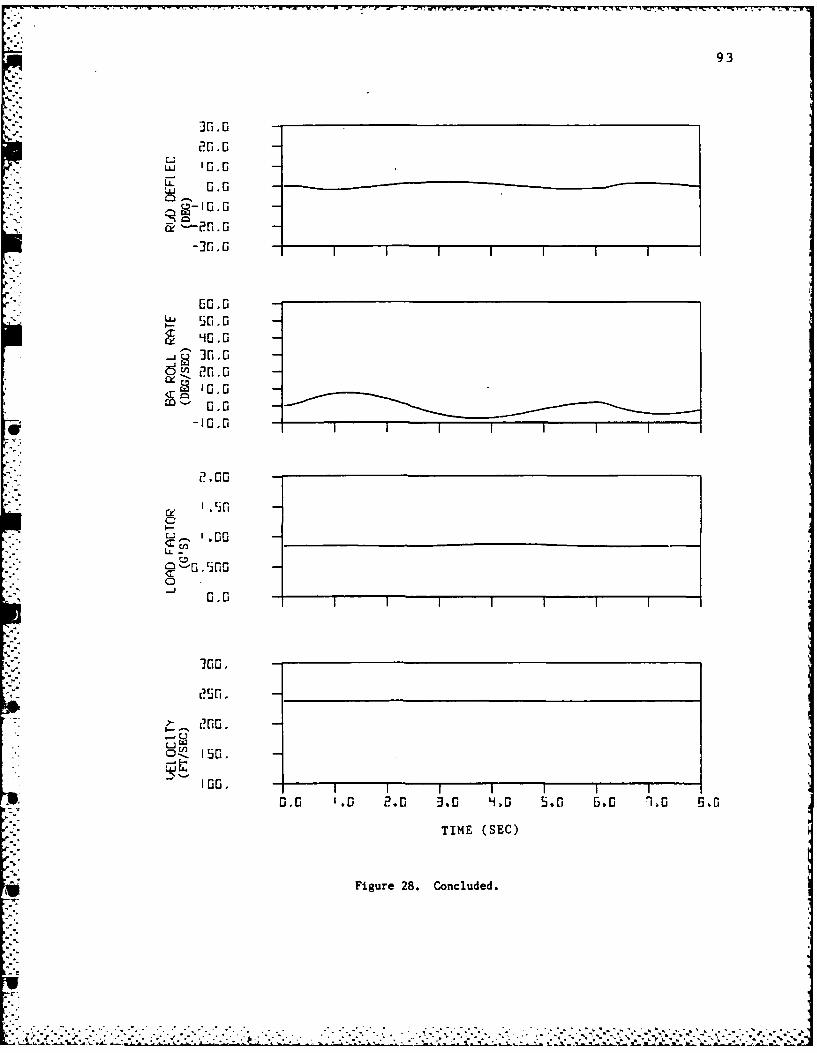
93
20.0
LU '.
-30 0
00.00 -LU
20 0
.0 0.0
2.5Go
LL
Lu. i5o.
2 - 10 . - __ __ _ I__ __ _ __ __ __ __ __ _ __ __ __ __ _
0.0 '.0 2. 0 3.0 4,0 5,0 6.0 ai0 6,G
TIME (SEC)
Figure 28. Concluded.
n-so

F r ~~ C' rr'r - ' . -. -. -' 1. - ~ -- V <W.I -M, TV~ ~t- xC v 4~ 1 -- . bEV
94
produces more adverse yaw, and up to 7 degrees of sideslip is produced.
The sideslip is so severe that the aircraft stops rolling to the right,
and actually rolls to the left. Again, only 20 of the available rudder
deflection has been used.
After the nonlinear sideslip derivatives obtained from the wind
tunnel test were inserted into the simulation, the performance for these
cases was degraded even further. Figure 29 shows a roll using the +300
strake deflection with the nonlinear derivatives. The maximum sideslip
is now greater than 60, and the dihedral effect results in no net roll.
Again, rudder deflection was minimal. In order to produce any roll, the
sideslip angle must be controlled. If the sideslip is not controlled,
the dihedral effect will either degrade or will totally prevent the
desired roll.
Roll Performance Using Sideslip Feedback
The next step was to see if the rudder could be used to control the
sideslip and therefore improve the roll performance. Since sideslip had
already been assumed to be available for the internal model, it was
decided to try using s ideslip feedback to control the rudder.
The sideslip feedback was inserted in the yaw channel immediately
after the stability axis yaw damper, as shown in Figure 30. Sideslip
was fed back in terms of degrees, and feedback gains of 2, 4, 10, 20,
25, 30, 35, 40, and 50 were tested. Again, these tests were made at an
AOA of 320 since the data were well behaved there. All rolls were made
to the right. Three quantitative factors were used in evaluating the
appropriate feedback gain. These factors were maximum roll angle,
maximum sideslip, and maximum roll rate (stability axes) in the sixI
seconds that roll was commanded. A summary of these data are shown in
Figure 31.
S This analysis narrowed the choice of feedback gain down to 25, 30,
or 35. Gains above 35 showed an Cnrsein maximum sideslip, along
with an increase of oscillations in sideslip. In addition, when the
-* control input was removed at six seconds, these cases continued -.o
oscillate in sideslip. Gains below 25 did not produce as much roll
angle or roll rate. Large sideslip angles were still present, and the

,. .. .. --, , - . , - - - - . --V, , - - -. - -: ' r ' , ,- i - . . rc ,
95
200;. -loc.
100.
-210. 5 II I
0.00 -
5.009.00.002.00
S .000-1.00
-2. 00
u 50, 0cr, 90.0
-1 0.0-i ]4.0100
LL~95,0
35,0
30. 0a" 25.0 'Iiitiii
070 0 2.0 -3.0 40 5.0 6.0 1.0 .0
TIME (SEC)
Figure 29. Maximum R811 at I g Using Hinged Strakes Only With NonlinearDerivatives (AOA - 32 , Strake Deflection +30).
U!

. .. . ~ ~ ~ ~ ~ ~ ~ ~ ~ ~ - -. . .. . ... . - ir I, -- .- . . , , ." . ,,-,_. _,.. . , ., . .
96
"' ']fL.0 -
20.0
Uj '0.0K -o.o
-30-0.0G..
S-26 .0
50.050.0
0 C
9 '0.02).o -
a 00- -
250.
2.00 -
C20.0
"100.
>" -' 200.
IGO.I0 1 0. IIIIII
OX0 1,0 2.a 3.0 -X 5,0 6.0 1.0 S.a
TIME (SEC)
Figure 29. Concluded.

97
00
LZ000
w-
00>0
0 0
oo010
4 CC
00 00
*(A
00
00
400
r-q V00
CLr
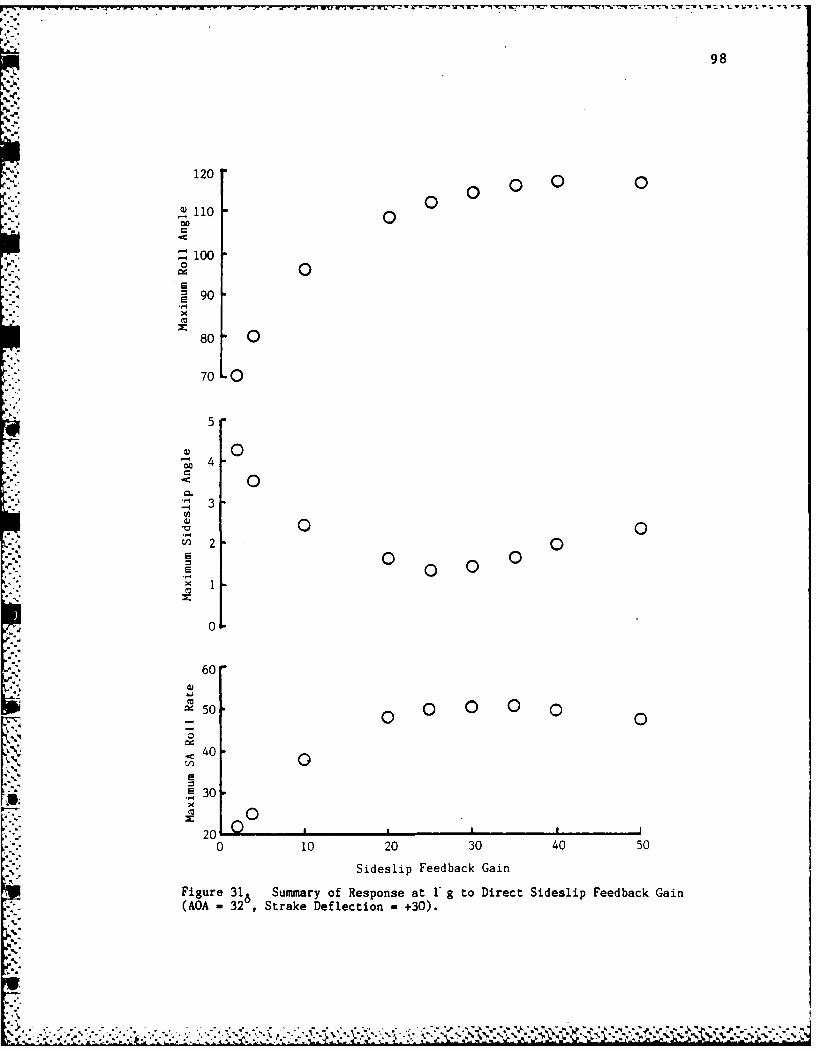
98
120.000
00
.-' 110 0
m2 S100o
"2 90xE
80 0
70 0
5
S 0-4
, 0' 3
C2,,0 02 0
,2 0 0 -
× 10
.4
60
50- 0 0 0 0 0
0
<40 0r= 30:
00200 10 20 30 40 50
Sideslip Feedback Gain
Figure 316 Summary of Response at 1'g to Direct Sideslip Feedback Gain(AOA = 32 , Strake Deflection = +30).
,. .. ..... .. .. .. .. .. .. . .-, ,. .,, ., .. :, ., ,. -. , ....... .. ..v
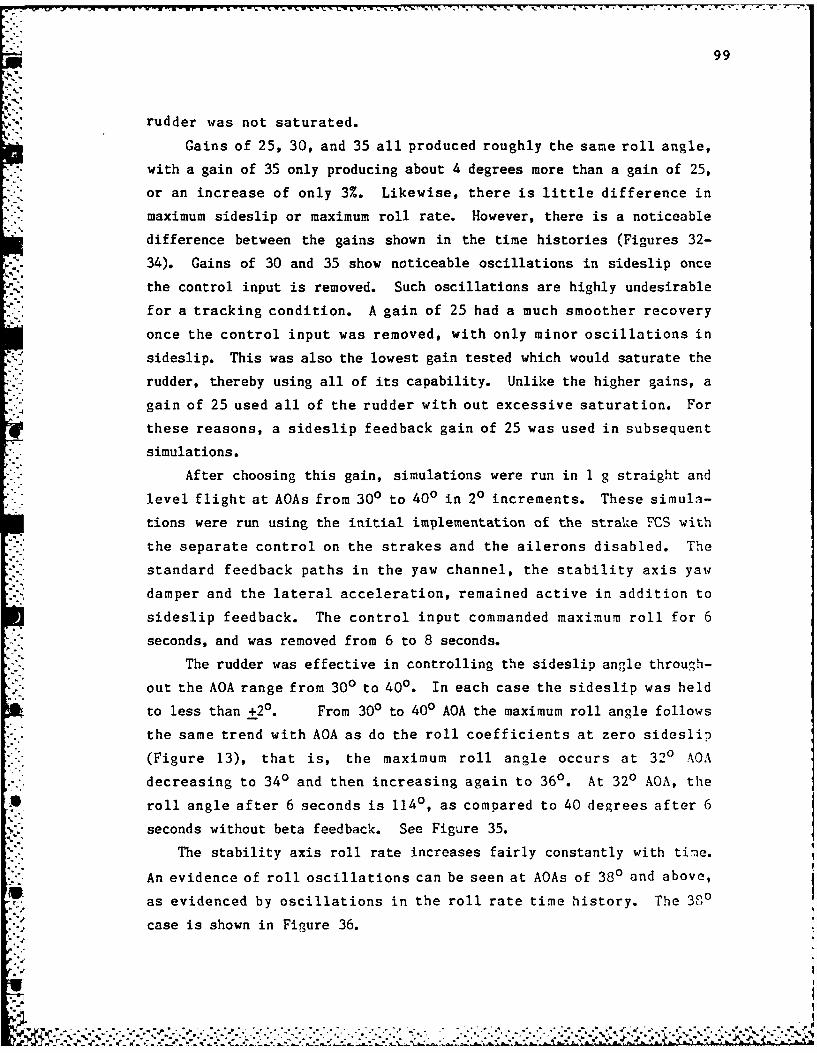
99
rudder was not saturated.
Gains of 25, 30, and 35 all produced roughly the same roll angle,
with a gain of 35 only producing about 4 degrees more than a gain of 25,
or an increase of only 3%. Likewise, there is little difference in
maximum sideslip or maximum roll rate. However, there is a noticeable
difference between the gains shown in the time histories (Figures 32-
34). Gains of 30 and 35 show noticeable oscillations in sideslip once
the control input is removed. Such oscillations are highly undesirable
for a tracking condition. A gain of 25 had a much smoother recovery
once the control input was removed, with only minor oscillations in
sideslip. This was also the lowest gain tested which would saturate the
rudder, thereby using all of its capability. Unlike the higher gains, a
gain of 25 used all of the rudder with out excessive saturation. For
these reasons, a sideslip feedback gain of 25 was used in subsequent
simulations.
After choosing this gain, simulations were run in 1 gstraight and
level flight at AQAs from 300 to 400 in 20 increments. These simula-
tions were run using the initial implementation of the strake FCS with
the separate control on the strakes and the ailerons disabled. The
standard feedback paths in the yaw channel, the stability axis yaw
damper and the lateral acceleration, remained active in addition to
sideslip feedback. The control input commanded maximum roll for 6
seconds, and was removed from 6 to 8 seconds.
* . The rudder was effective in controlling the sideslip angle through-
out the AQA range from 300 to 400. In each case the sideslip was held
to less than +20. From 300 to 400 AOA the maximum roll angle follows
* * the same trend with AQA as do the roll coefficients at zero sidesli,
(Figure 13), that is, the maxim um roll angle occurs at 320 AOA
decreasing to 340 and then increasing again to 360. At 320 AQA, the
* roll angle after 6 seconds is 1140, as compared to 40 degrees after 6
seconds without beta feedback. See Figure 35.
4-' The stability axis roll rate increases fairly constantly with timie.
An evidence of roll oscillations can be seen at AQAs of 380 and above,
as evidenced by oscillations in the roll rate time history. The 380
case is shown in Figure 36.

100
ih.05- I 5(s1.-
-U.
Li. G
'-I .G
J(U
.V.0 x
-. '-51 . G
TIME (SEC)
Figure 32. Maximum Roll at 1 g Using Hinged Strakes Only With SideslipFeedback (AOA 320, Strake Deflection +30, Sideslip Feedback Gain25).
CZ" 'G7<.1gG.G-

101
i' '[;I, - L
J!.U
ZT
-15 L5-P[" I I I1 I
H. U U
- ((SEC)
- I I I
(L.U -
Fedbc (AO 320 Strk Delcto _3,Sdsi edakGi
30)
a-.. 0.:-U
'-I U . U
.-, [U
- - ,(L-
r,0.[0 '. ?[ .E' -J.i [ H'I.r, 5,[0 Ei.0 1.0 .[
TIME (SEC)
Figure 33. Maximum Roll at 1 g Using Hinged Strakes Only With SideslipFeedback (AOA - 320, Strake Deflection - +30, Sideslip Feedback Gain -
30).L
-a
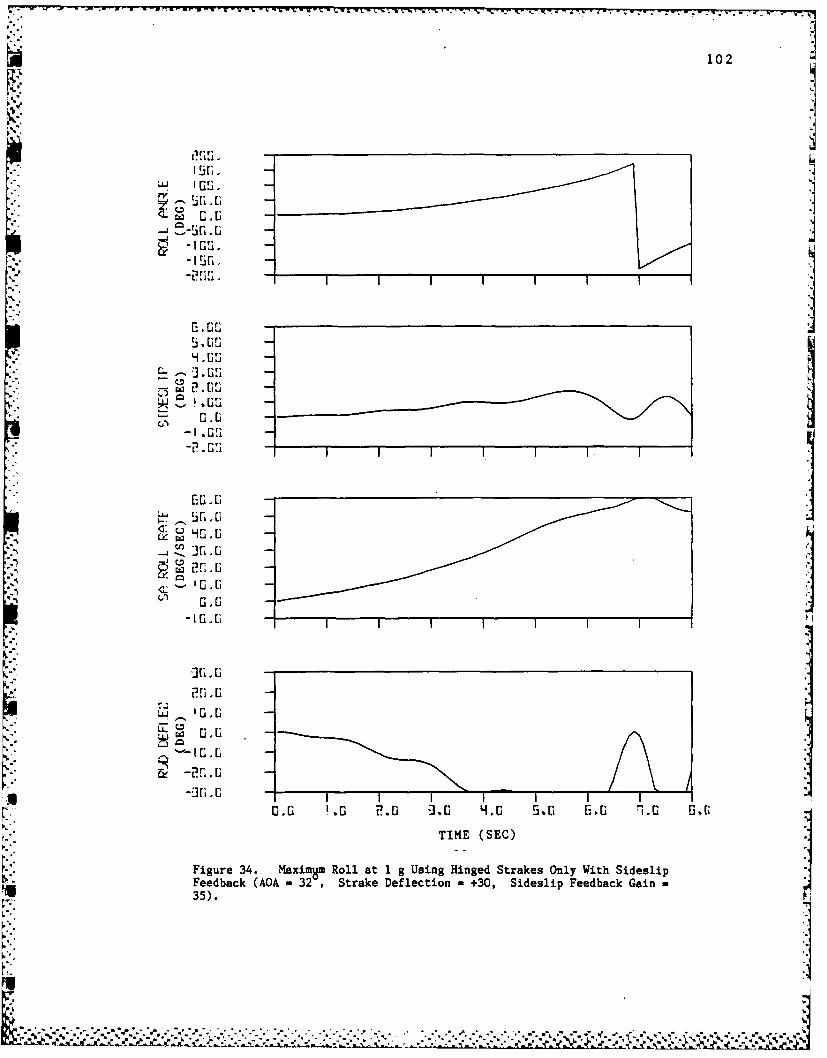
102
MI;S.
~<L G.0
• " I I I III •I4 . C; -
-I.C
LUtE
-1Gi.GIIII -- III"
- TIM (SAC
go.Eo
TIM2iA . £ . JE (SEC) .0 1.
Figure 34. Maxim8m Roll at 1 g Using Hinged Strakes Only With Sideslip jFeedback (AOA - 32 Strake Deflection - +30, Sideslip Feedback Gain -35).
•j

103
4 C[. E
31:: .C
-Ox
4C LL. C
-15[:.-
-::-u
5, Ur"
-K. 1;
_ I.:. . -:_
- ICp
4x
X : C,
i,,- •A
-IC.O
TIME (SEC)
Figure 35. im Roll at 1 g Using Hinged Strakes Only With SideslipFeedback (AOA - 32 , Strake Deflection - +30).
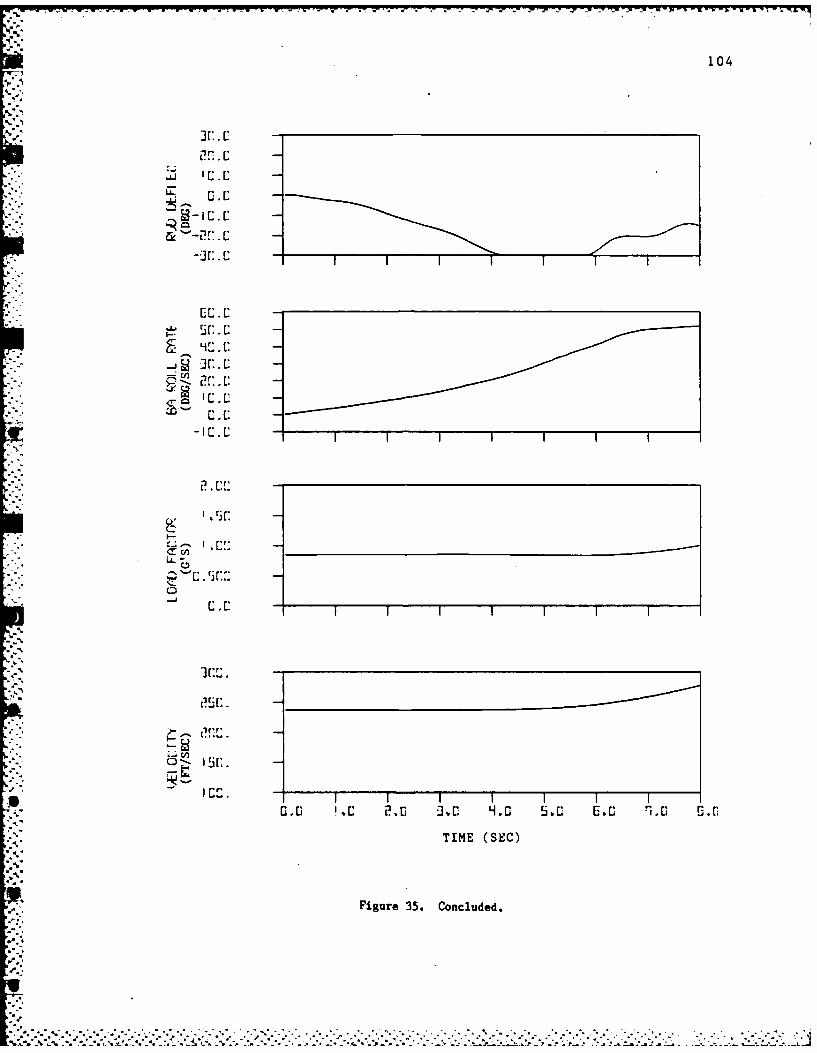
104
EL. C
4'..
... .......
X. C
I-
0EC,
Cc
CIO -. 2.__ __3x___ ____ ____ ___ ____i.__U__U.__ __ :
TIM (EC
Fiue35 ocldd
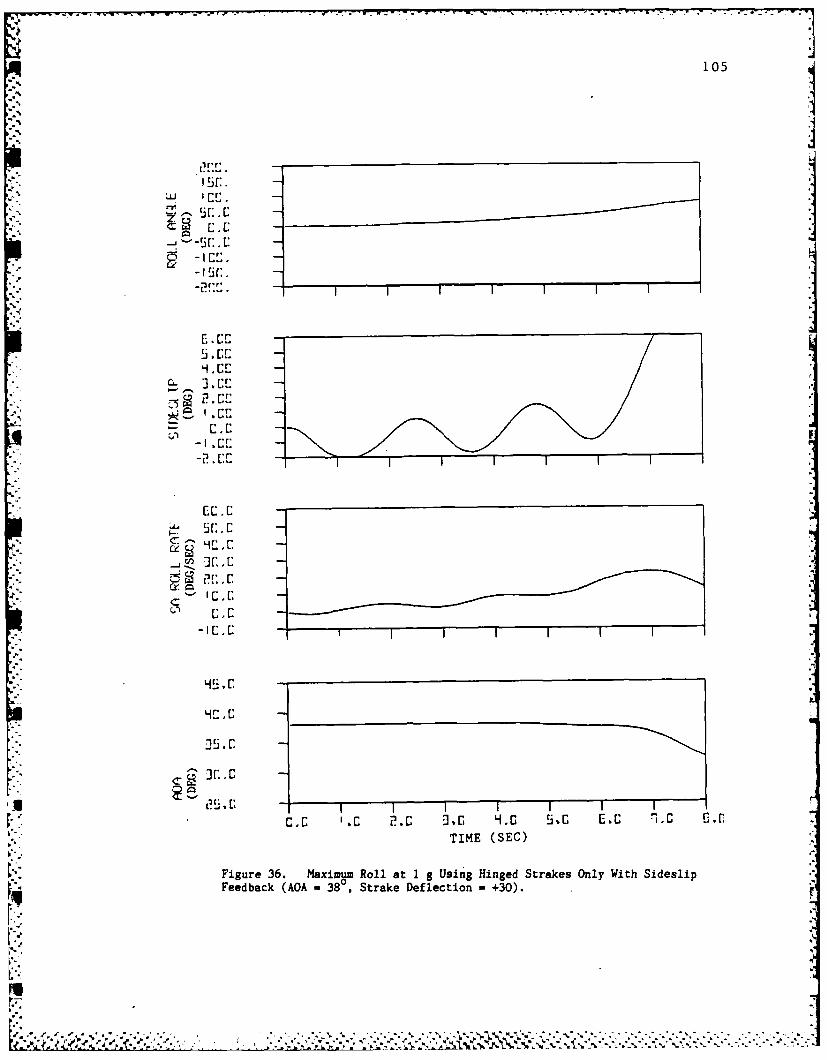
-- ~ ~ ~ ~ ~ ~ ~ ~ ~ ~ W: T r . . ~ ~ ' * . .. . '- --- ' - -.
105
5i~r:.
2.C
4C, C
4C,
00
Fedak-O 8 SraeDfeto 3)
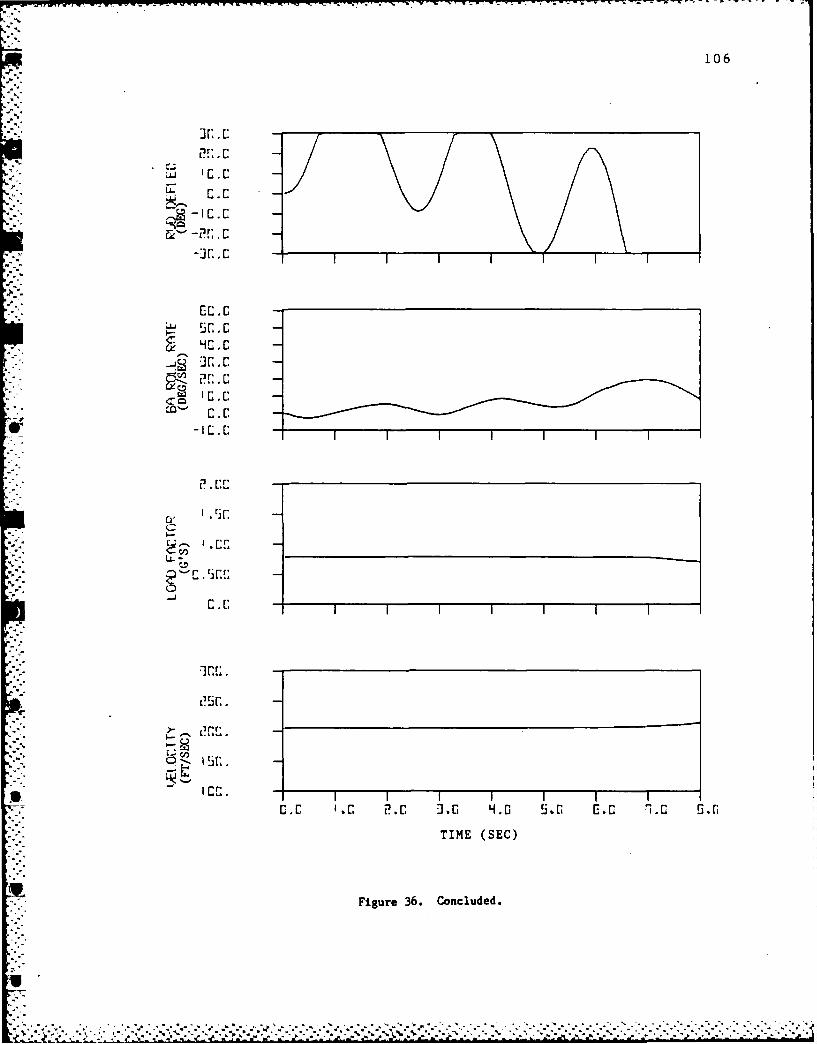
106
LI-
C.
cz C.C
4C.
...... ..........
15 ,
TIME (SEC)
Figure 36. Concluded.
107
In general, the AOA is virtually constant for at least 4 seconds,
and then decreases. The constant behavior in the first 4 seconds is
largely due to the fact that the longitudinal forces and moments were
essentially unchanged by stake deflection. The eventual decrease in AOA
was due to another factor. As the aircraft rolls, the lift vector,
unchanged in magnitude, is no longer pointing upward. As the aircraft
begins to dive, it picks up speed and the lift is increased. This lift
increases the normal acceleration, which is fed back to the pitch chan-
nel, causing a decrease in angle of attack in order to maintain the
commanded normal acceleration.
The reactions of the aircraft after the control input is removed
are equally important. In all cases, the roll angle continues to in-
crease due to the angular momentum of the aircraft. At 300 and 320 AOA
the sideslip angle decreased after the control input was removed. low-
ever, at 360 to 400 AOA the sideslip shows a very different behavior.
Above 340 AOA, the Cn5 of the aircraft becomes negative (unstable). At
approximately this same point, the strakes begin to produce proverse
yaw. This proverse yaw offsets the effects of the unstable Cn , but
when it is removed, the aircraft reacts to this instability, which shows
up as increasing sideslip.
One case was run using the -450 strake deflection at 320 AOA for
comparison purposes, shown in Figure 37. After the 6 second control
input, the aircraft had rolled virtually the same amount (1140), but the
sideslip variations were larger, about 60 compared to 1.40 maximum.
This behavior was comparable to the earlier findings for negative strake
deflections.
A set of simulations was run for the positive strake deflection
commanding left rolls. With the very small sideslip an-les, the results
were essentially the same as for the right rolls.
The simulations seemed to indicate that the faster the rudder was
deflected, the less sideslip would be allowed to build up. To investi-
gate this possibility, a simulation was run at 320 commandin- a maxinum
roll with the strakes and maximum rudder deflection simultaneously. See
Figure 38. The result of this combined input was that the sideslip went
negative initially, and no roll was produced for the first two seconds.
I
.. ......... °. .. ... °....... . °o.. °.. ..- . ,- .- ,. °

Nii " ' " - - . , . . , . - , . -. - -: _ - - ,
q 108
S50-100.
-I.00 -
Lj .00
CL5& .00
LL0o- on -0.
20.0
2" G C,
- 1 0.0
35.0
35,0 2 x0'- .0_ _ _ _ _ _ _ _ _ _ _ _ _ _
0.0 , ,0 2.0 -3.0 9.0 5.0 E.0 .0 O.0i-
TIME (SEC)
Figure 37. Maximum Roll at I g Using Hinged Strakes Only With SideslipFeedback (AOA = 32°, Strake Deflection - -45).
].
U- *.. . + - - - - , . . . . -. . . - • • " .• ' .4~ p . , . %
.- "+ + - " - +. . " p"."- . . . . . . . ' +K " ,
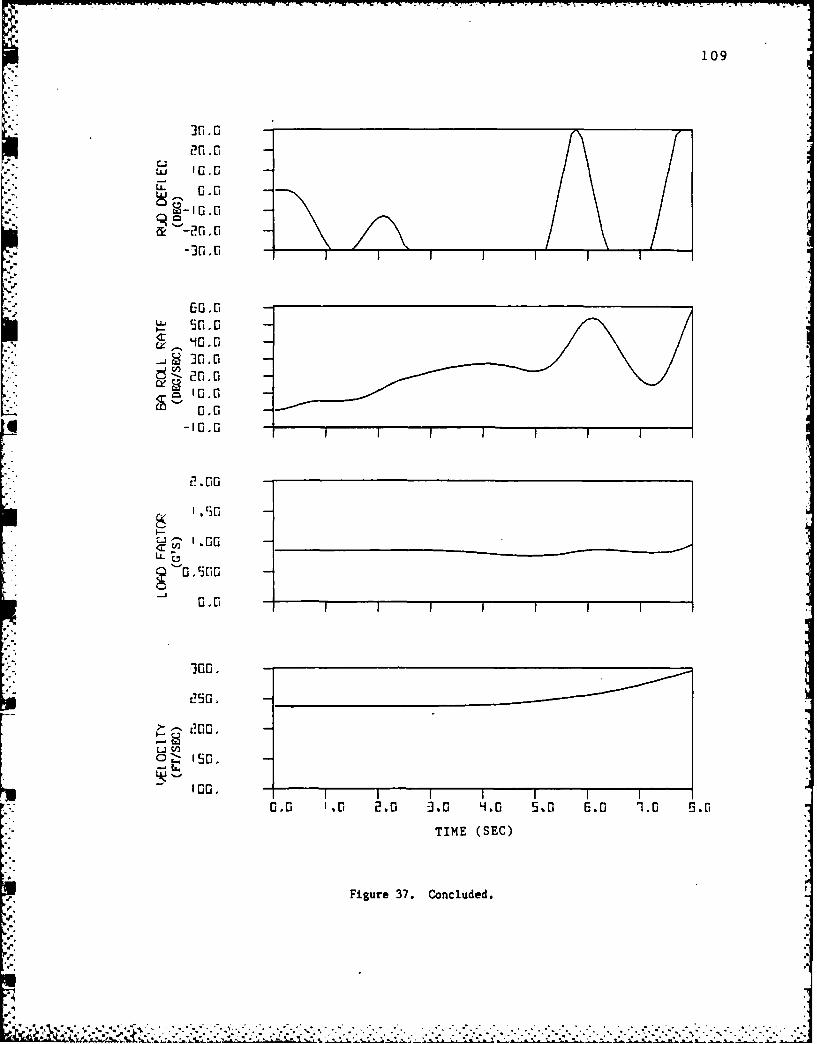
109
20.0U 0.0
40.0
-300 G-0.020.0
120.0
".-" '0.0q -1 0.0 III
1200
I-,5
a-.A m rio C, 2. . . ., -'
." ... .200-. - -
J-, 0F0igure 37, Concluded.___ __ __ ___ __ __ __
*300
"w?50
" " " "- ",'- '' " " . - .' .0 ". " . ". " " " '"' . 2 ''" •"" -"• ."- - •"..." " °
"-" ' ' ' '
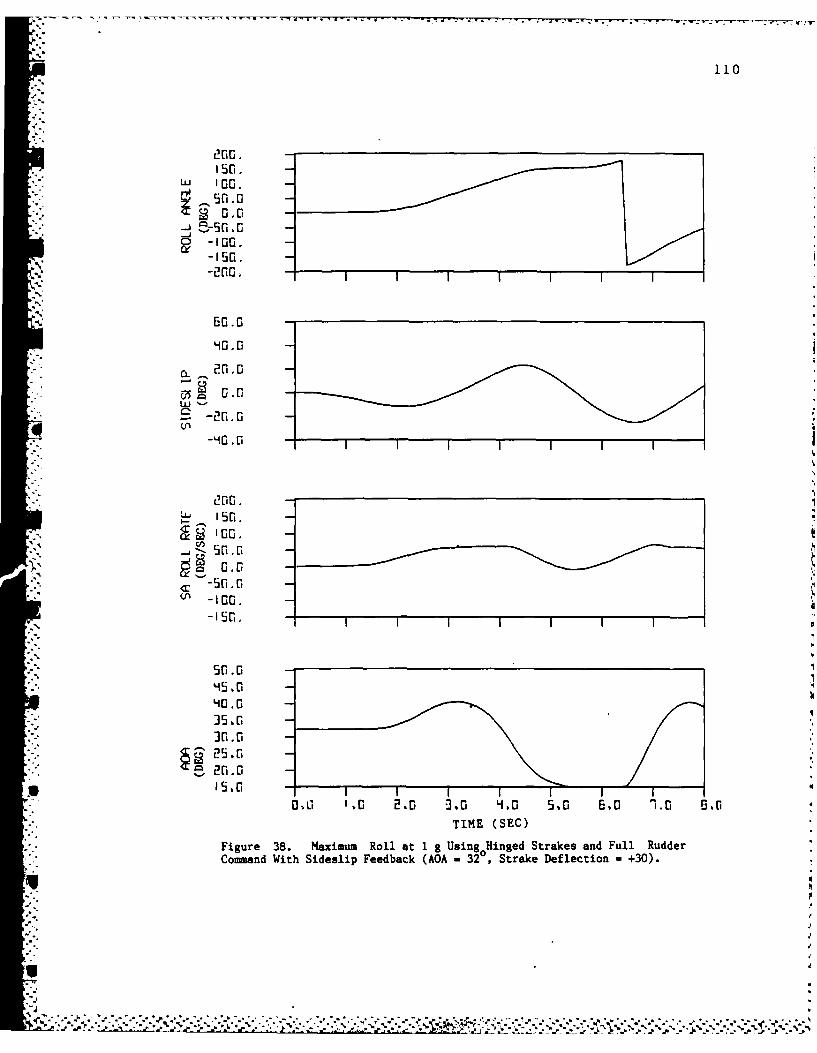
110
200.i"R ,,[5a. -
I0. CLur '00,
150.
-100.-IO. -
40.0
CJL 20.,0
-2r .-.,- 0.0 -
S-2.0I5-4" -90.0
--. 00, -
-50. -
- 10-50.0
50.035.0
S5,.0
25.0G
15. -
O, 1,0 2,0 "3,0 H.0 5., E.0 . 6.0,0TIME (SEC)
Figure 38. Maximum Roll at 1 g Using0 Hinged Strakes and Full RudderCommand With Sideslip Feedback (AOA - 32 , Strake Deflection = +30).
%
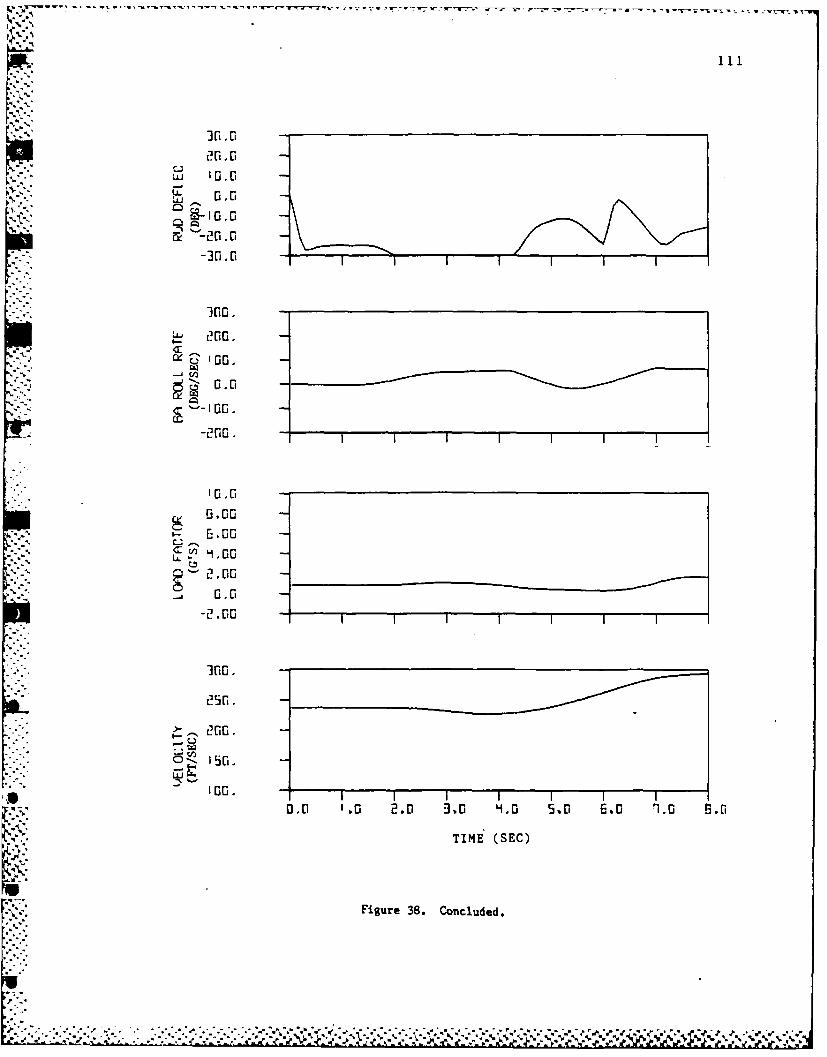
20.0C
Io.. ..
-311 G0*30.E -
'#mU" 2'00". -
' C , .......
-
L. P£3.00'--, ,--,.'- E,,00-
:].'-2. CIOr,-. 1 2. .00 5:
Figure 300
%° %°
-.,, --,,., O.............-...,.......5...............

K 112
The sideslip had much larger oscillations, reaching over 200, and the
AOA varied from 150 to 400 . These oscillations were undesirable, so
this case was not pursued any farther. Additionally, some of these
sideslip angles were outside the data limits of the simulation.
Roll Performance at Higher Load Factors
As mentioned earlier, the previous simulations were done at a
dynamic pressure of about 25 psf in order to achieve straight and level
flight. At this low dynamic pressure, none of the control surfaces were
very effective. If a certain angle of attack is maintained as the
dynamic pressure is increased, the load factor will necessarily in-
crease. Additionally, this condition would be a more realistic high AOA
case. After the modifications to the initial conditions were made, a
simulation was run for a left roll at 320 AOA with increment of 5 g's
commanded and with a positive strake deflection of +300. See Figure 39.
The initial dynamic pressure for this simulation was 200 psf. After 6
seconds, the aircraft 'had rolled approximately 5400, achieving a stab-
ility axis roll rate of -150 degrees per second.
This high roll rate raised concern about roll coupling and diver-
gence due to reduced stability caused by decreased control authority,
which could be seen in this simulation. After the control was removed,
the aircraft pitched up to 500 AOA and subsequently departed. It was
now necessary to limit the roll rate. In order to do this, the strake
FCS was modified slightly. Instead of having a separate input, the
strake FCS was connected to the aileron input command. The strakes then
commanded a maximum roll based on the sign of the aileron input comnand.
This change is shown in Figure 40. With this setup, if the roll rate
became too high, the sign on the aileron roll signal would change, and
the strakes would command an opposite roll to decrease the roll rate.
After this change was made, a set of simulations was run to compare
the performance of the strakes alone, the ailerons alone, and the
strakes and ailerons combined. Strake deflections included +300 and
-450. Two major trends were seen in these simulations. These trends
were divided below and above 380 AOA. Below 330 the response is typi-
fied by the simulation at 320 AOA. Figure 41 shows this trajectory,
V.* h'%
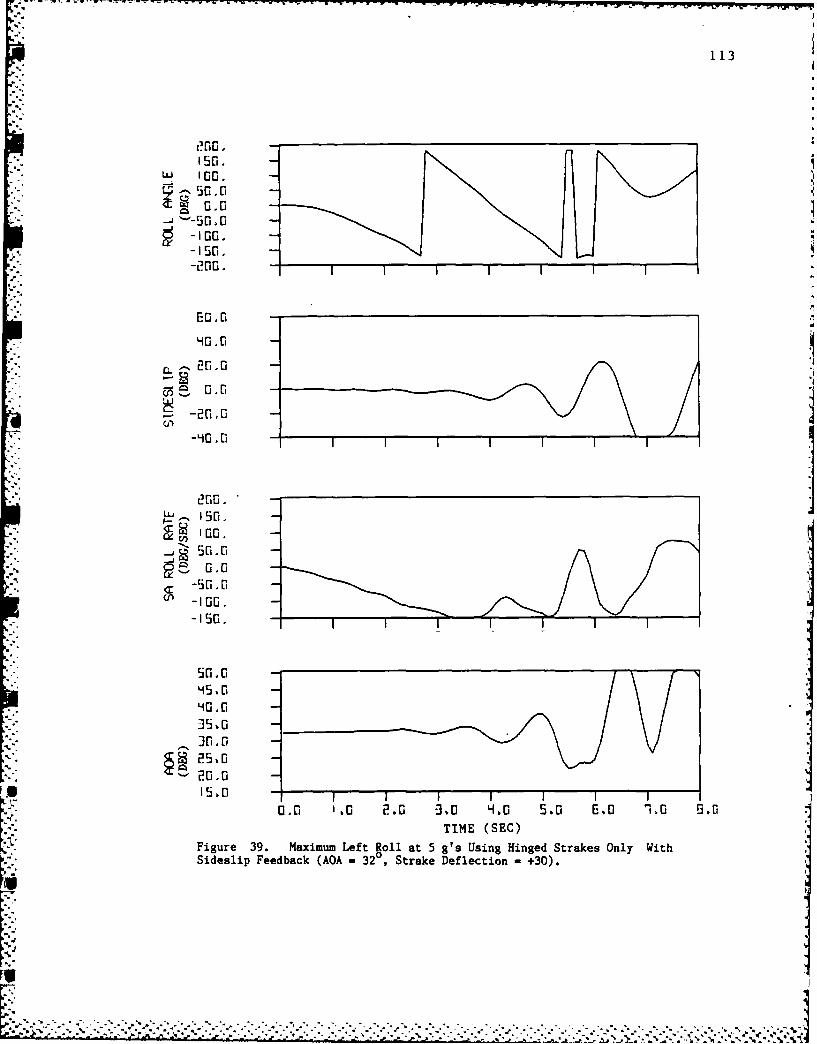
-w-------.. . . . -- ... ..r ~ r ~ - -r w "'-. = r -
1134_.
'00.
5". C -
-. '-50 0-100.
o -15fl, -
50.0
u 0.0 -
20,0
., 50.-40-1 -G . C
-150 .I
45.,G40.0 G35,0G
25.020.0
*15.0 -
0.0 ' .0 2.0 -30 H.0 5.0 E.0 1,0 roTIME (SEC)
Figure 39. Maximum Left Roll at 5 g's Using Hinged Strakes Only WithSideslip Feedback (AOA - 320, Strake Deflection - +30).K
"****-..*.*... . *6~*~* . . . . . . 4
%A
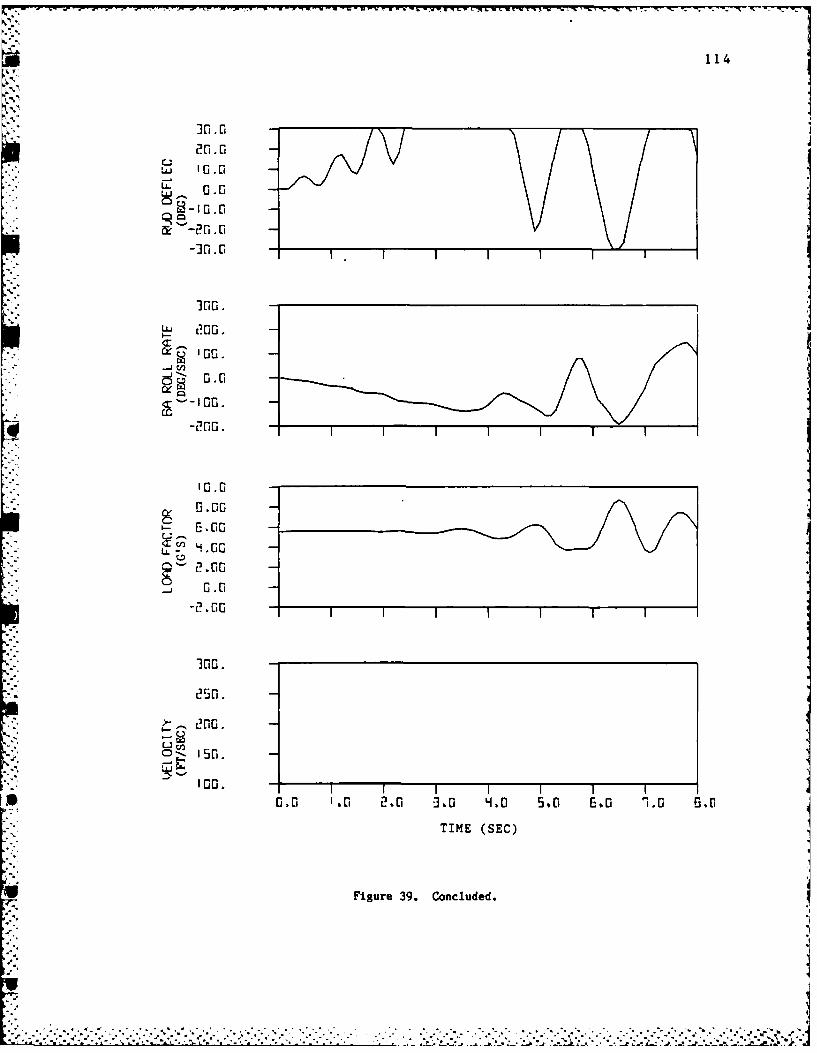
114
]'0.0 -
230.0 II30 0
U -20. G-i .0
_W .G
c- 100.
'100.
10.0
400.
0.00
Fi0ure 39. Concluded..0-. '50
- 100. -
°" . • . I . .. 0. o - - 2 , 0 -- . . . . . S• . .. . . . 0 . . ..6 -0°'" " ".,, "-" ,o,"o- ,' '"" . ,' '"° -°• •"• - -' °"• "°" -"" """ -""" .TIME . °"" (SEoC)'". " - "
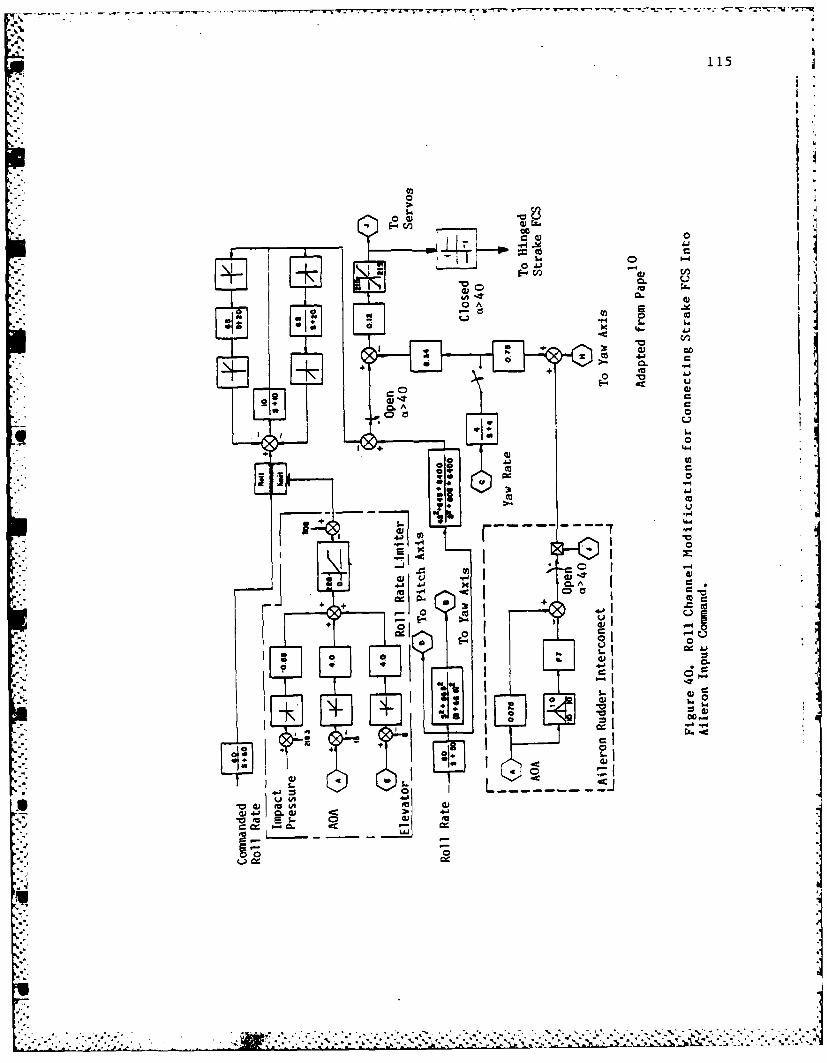
115
E 0~
ICC
44-
000
I- ,4al)
4J-
0. A 0
4+ 41i
CD U,
I --
0x.
V' -W 1 0 w lI6v m :1.

116
00 0
.
LU l00.
-- 0,.
-00. --05G. U -
-IGO.
40.0
G,' -- 0.0
-3 -2G.3r C-25. G
290.0 -
-00 G 2.-. . . x 10 8.r
00.
S F 50. 0HS,-i-o.
*v .00
15 , I I II l
TIME (SEC)
Figure 41. Maximum Roll at 5 g's Using Hinged Strakes Only WithSideslip Feedback (AOA - 320, Strake Deflection - +30).
__,.'..'°...-..% ..'......... ..,.. •, .................................................................................,........... . ' ,... ,,'.

q.
117
4.
20.0L*. '0.0O
S-20.0-0.0 -
300. -.. "- 200. -
I-- C
200.
'0.0
55 Of~o -
0..,F.00-] \
.. .00
2,00 -
)TIM (SEC)o
F eG.
9i00. -
1 00. -
0.0 KO, 2.0 3,0 '4.0 5,0 6,O "L0 6r,0
TIME (SEC)
Figure 41. Concluded.
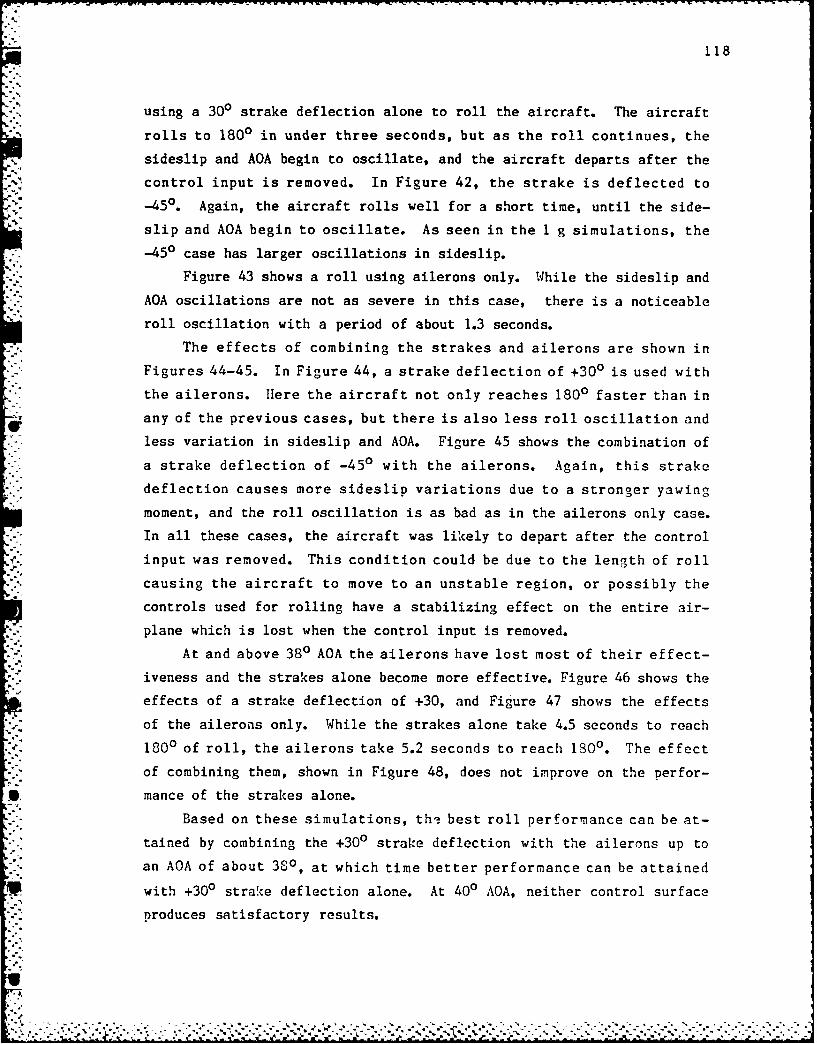
118
using a 300 strake deflection alone to roll the aircraft. The aircraft
rolls to 1800 in under three seconds, but as the roll continues, the
sideslip and AOA begin to oscillate, and the aircraft departs after the
control input is removed. In Figure 42, the strake is deflected to-450. Again, the aircraft rolls well for a short time, until the side-
slip and AOA begin to oscillate. As seen in the 1 g simulations, the
-450 case has larger oscillations in sideslip.
Figure 43 shows a roll using ailerons only. While the sideslip and
AOA oscillations are not as severe in this case, there is a noticeable
roll oscillation with a period of about 1.3 seconds.
The effects of combining the strakes and ailerons are shown in
Figures 44-45. In Figure 44, a strake deflection of +300 is used with
the ailerons. Here the aircraft not only reaches 1800 faster than in
any of the previous cases, but there is also less roll oscillation and
less variation in sideslip and AOA. Figure 45 shows the combination of
a strake deflection of -450 with the ailerons. Again, this strake
deflection causes more sideslip variations due to a stronger yawing
moment, and the roll oscillation is as bad as in the ailerons only case.
In all these cases, the aircraft was likely to depart after the control
input was removed. This condition could be due to the length of roll
causing the aircraft to move to an unstable region, or possibly the
controls used for rolling have a stabilizing effect on the entire air-
plane which is lost when the control input is removed.
At and above 380 AOA the ailerons have lost most of their effect-
iveness and the strakes alone become more effective. Figure 46 shows the
effects of a strake deflection of +30, and Figure 47 shows the effects
of the ailerons only. While the strakes alone take 4.5 seconds to reach
1800 of roll, the ailerons take 5.2 seconds to reach 1800. The effect
of combining them, shown in Figure 48, does not improve on the perfor-
mance of the strakes alone.
Based on these simulations, thi best roll performance can be at-
tained by combining the +300 strake deflection with the ailerons up to
an AOA of about 380, at which time better performance can be attained
with +300 strake deflection alone. At 400 AOA, neither control surface
produces satisfactory results.
-- - . * . - . - . . . . . - -- . -

119
-250.
I0.0LaJ
-0.0
-ZCn100.
25.G
- 20. G
00
SielpFedak(AA3 tak elcto 4)
Lj.~..%
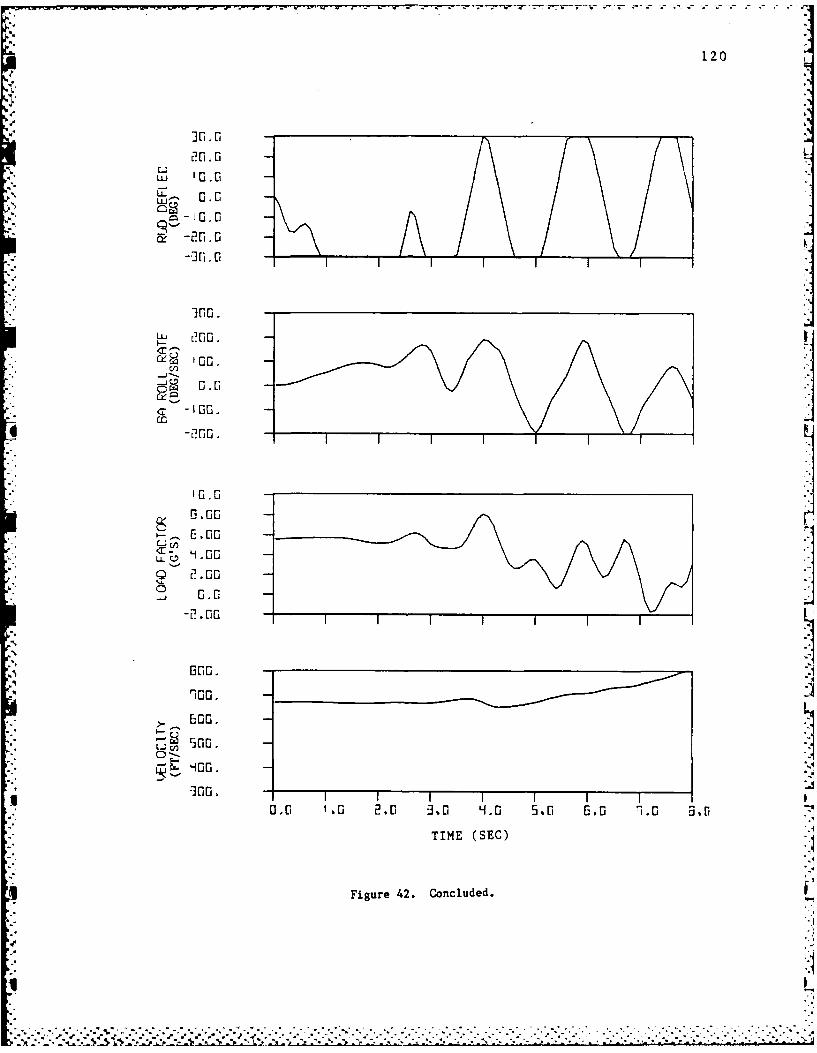
120
PG. 0 L Lii'3 .LUs 0.0
-10G.
rL: .00
',.00C-j ;.
C .00L:r
-900.
1.00
a 00.20
TIME (SEC)
Figure 42. Concluded. 1

* - - - -. 121
0.0
II Sri.
40.0G
CL- 0G,c.......0..
G . -
LU
-4G, '00
C -'00
450.040J,0
3G .0G
20.00 00 M . .0 60 1. .
TIME (SEC)
Fiur 4. axi~um Roll at 5 g's Using Ailerons Only With SideslipFeedback (A- 32 )
%;z.:X C~xy.--. ..
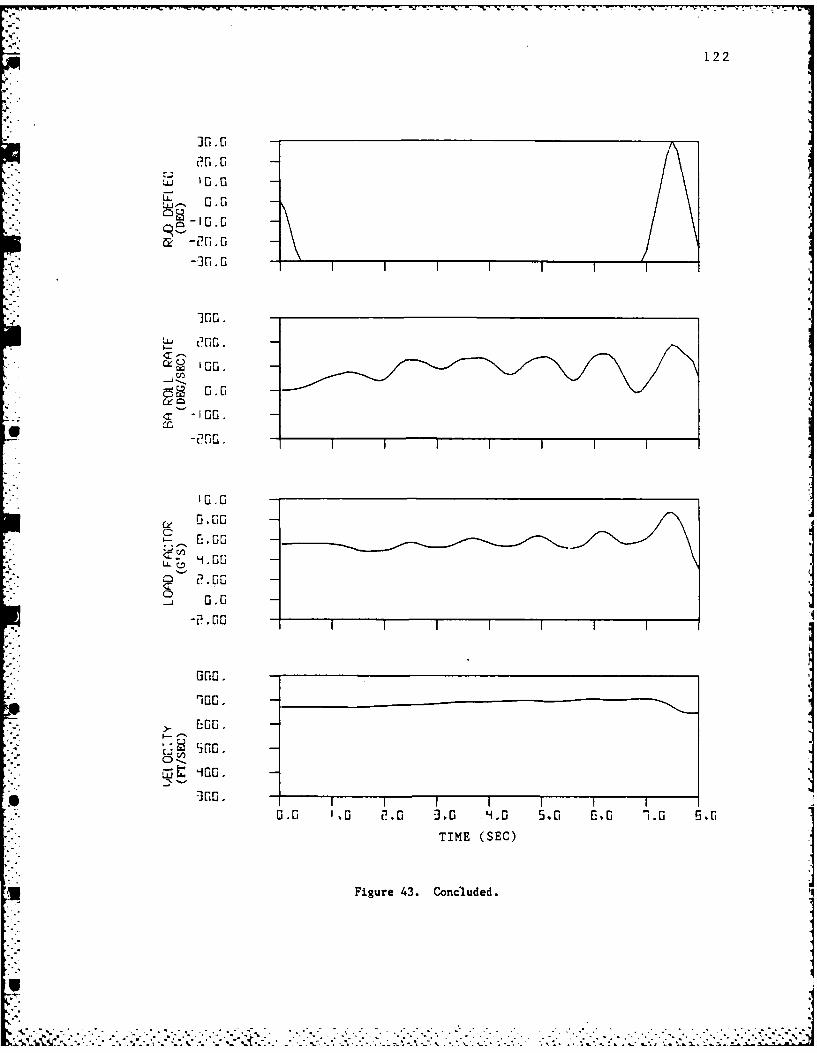
122
G~J . 0
LL
C-
Cn
-2.0 1.-. . 40 50 60 10 BC
Fiur 43.Coclued
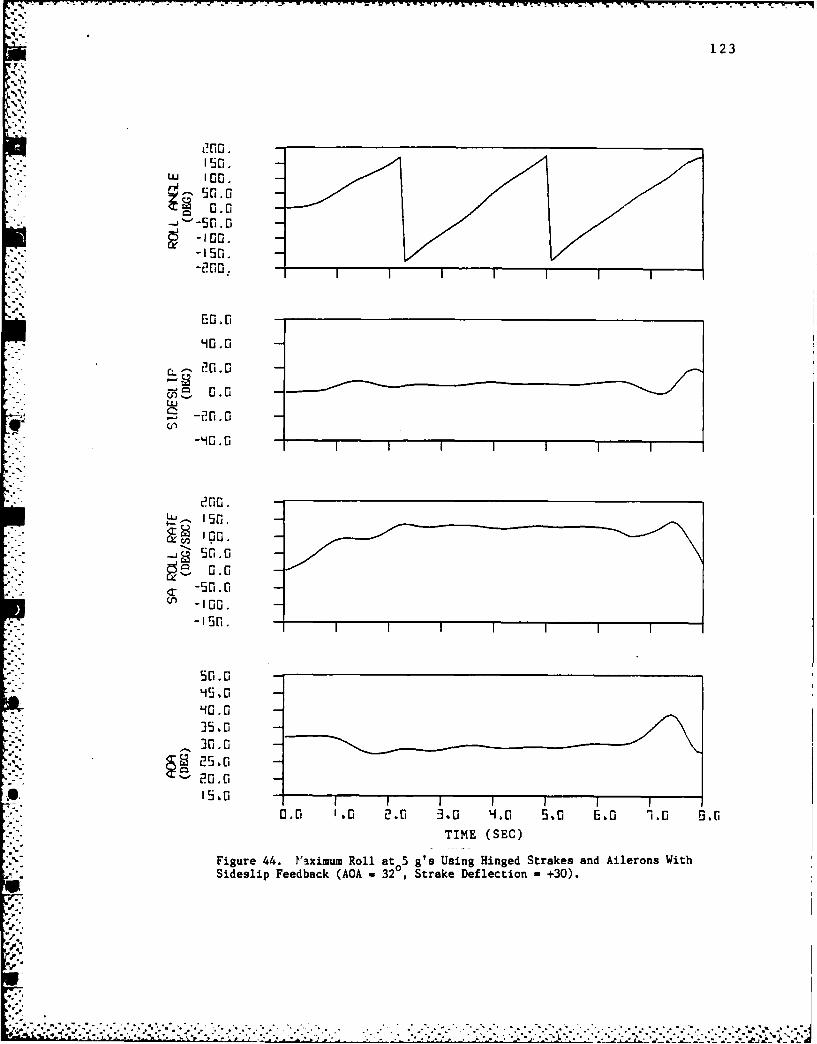
123
000,150. -
w '00.
4_0.0
: ." -150.-
?:,-0r,,_ _ __ _ _ _ _ _ _ __ _ _ _ _ _ __ _ _ _ _ _ _
90.0
40 .0
S0 .O
- -4 .0
-40.0
200.
L 15f.0
- .- , 50.0
a, Of- 50 Ea 10 G.r
¢-50.0n -100.
-50.
90.035,030.030.050 _-
v20.0
0.0 ' ,0 2.0 3,0 4.0 5,0 0,0 1.0 OG
TIME (SEC)
Figure 44. Vaximum Roll at 5 g's Using Hinged Strakes and Ailerons WithSideslip Feedback (AOA - 320, Strake Deflection - +30).
.-,: ... : --- -... - .. -, .- . . -..- ...- * .. . . *. .. . -, - - - . - .. .., - , - . .. . . ., . .. ,, , . ,-',1 ' .,:.., .:,.. ., .,. . .,. .. .-. .. . ..... . . . ...-'- . ..v ..,.:....-'.v ..'.v '.*...-'.'.v ..... ... "' -:,

Vm- V
124
2(.0 -
,, 10.0
"u 0.0
S-2110 0-- 70.0 -
LL. 200.I-
loc,-I00.S0.0
0 GO--00
' .002.00
I.-. 0.0
2.00
900.>_. 000.I.--.'
00. -*(LOG. -
0.0 O 2.0 ,0 a 3 .0 5.0 t.0 1.0 C,.L.
TIME (SEC)
Figure 44. Concluded.
- a{ ,.. . . . .. *...:
, ..-. u3 . o , . - + . ... . . ., . . . . .. . . ,S , , . . . . . . . . --.. . . . . .- , .- .. , -. . . . . . , . . , + . .- . . .o . + , . .
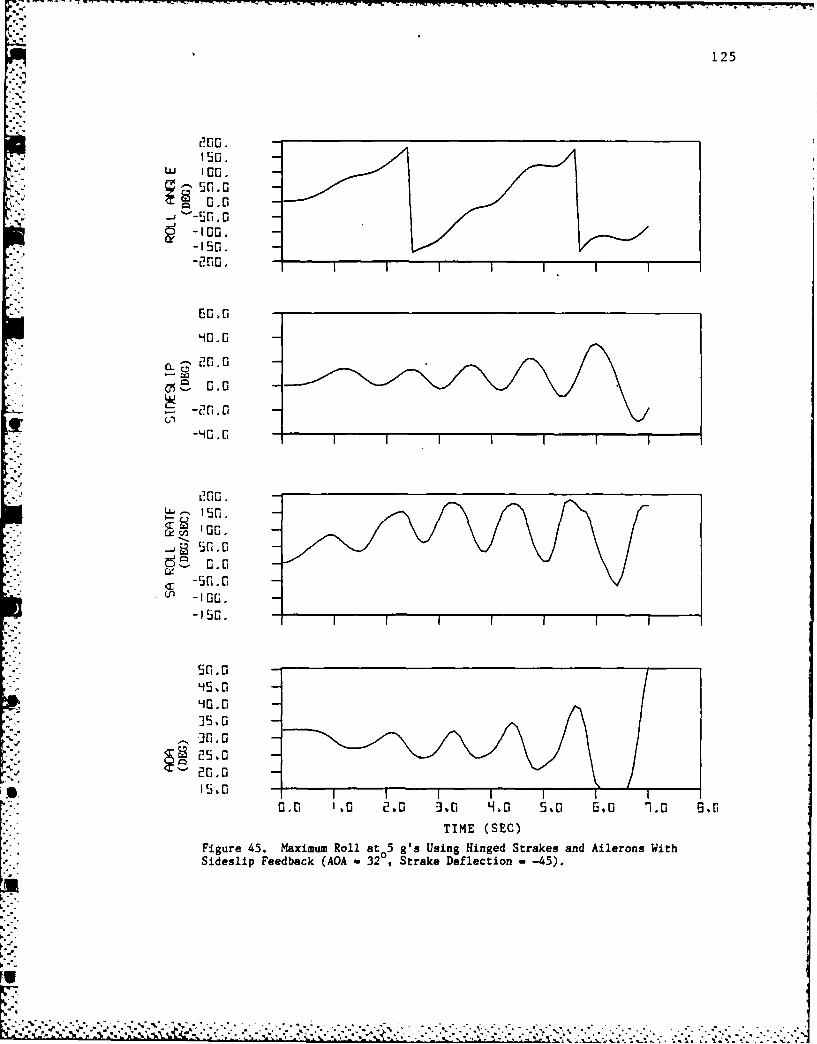
125
40.0
En.0 -
20.0
- -50.0
50
4~ 0.0
05.0
2 -0.0
15.0
a , 1.0..0.G L.0 , E " .rTIME (SC
Figur45 aiuRlat5gsUigHne taeanAieosW h
Figuei 45. dMaiku RAol at2 gsk UsingcHin -45esad) iern.Wt

126
20.0
20.0
re.' 0 .0 A"
&-2(1.0
'00. -
S=-100.
'0 .0 -
- .00. -
C-
2 .00Ce
f. v
. 0.0 -.
-2.00 -
600.'100. -__________________, _____
0.00.
C-P
100. I
TIME 0.0 0 2.0 3.0 4.0 5.0 6 0 1.0 G.v(SEC) TIME (SEC)
Figure 45. Concluded.
.- "

127
150.
S0.0.a-50[.0C
40.0G
4*0.0G
* ~ 35.0
20. 0
0 , C 2 o 3 0 , , . 1. .L
L1TIME (SEC)
Fiue 4. Mxmu ol t 5gs sn igd Stae nyWt
i deli Fedak(00. tak elcto 3)
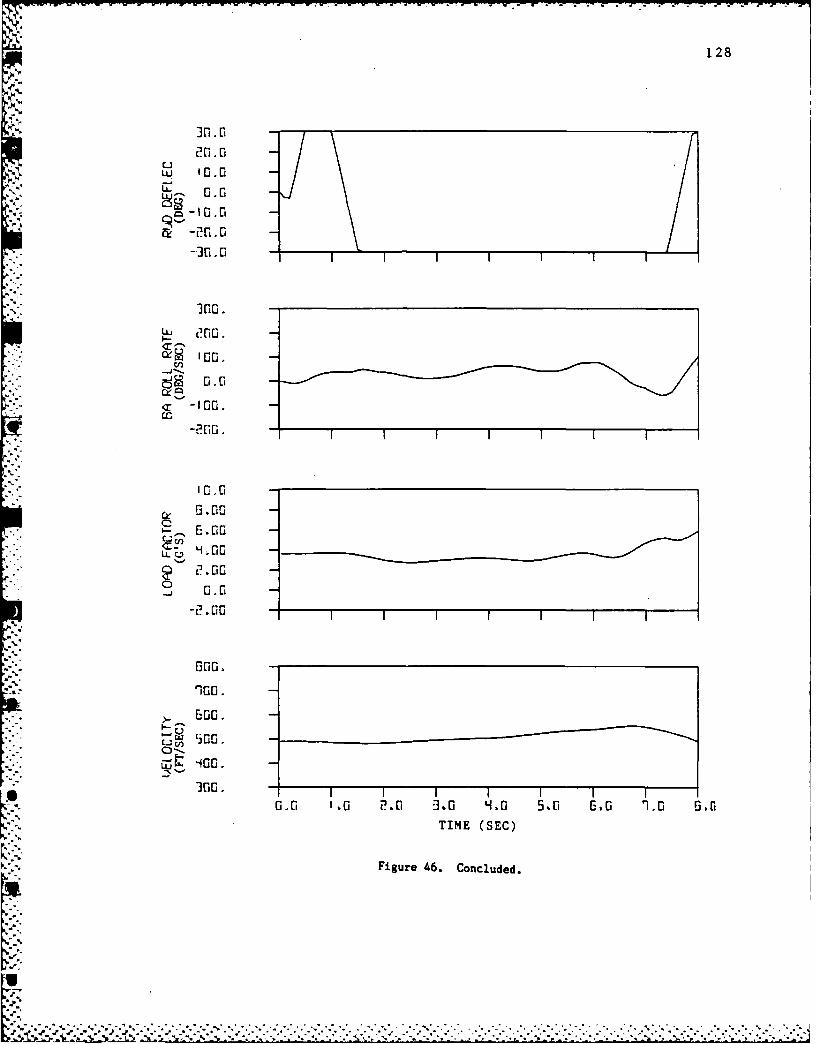
128
20.0
".4.,~0 G.J 1.
4.m
4c
1 -2G. 0-30.0 -
30.
u 0 .CI-
-100. I I__ _ _ __ _ _ _ _ _ __ _ _ _ _ _ __ _ _ _ _ _
S 0.0
r -00.
200 .- A . . .
' 0.0 -
-2r 4.00-000
2.00.
-. 600. -
:4r.
-4ur. .'on4ued
t a"" ." "'' "". - o """, ° °". " '-".° "- •. 0 * o '~C .0 -." 0 '" ." " ", " " "6 0" - -"-.0 " 0",-- . 0" ' . . .

129
U.J 100.
c 0 . C0G.0
....... ...... ...
-4GG
-IGiO.
4- 0.0
30~ 00
15.
I ~ IIII II0. 00.2 n, 30 40 5. .C 1 .r
TIM (EC
0iue 4. Mxmu.0la ' UigAlrn nl ih SdsiFeebak (OA38

130
30.0
20.0
L.. 10.0-,
No.
&-20.0
300.] 00.
C. '00.
C, -100.
'0.0
C
,_ G. - 00-
- 0.00. . G
20.00J 10.0r 0,00 -
L ,-, G.00
--...00
*000.
TIME (SEC)
Figure 47. Concluded.

131
1,0 Co
5r.
Lu n . -
o -il.-iGo,--Iri.-I tO. -
-20. 0
Ejr,,"-" 2f'l,0- ',
s,- 0.0
iL- 56.
5-ri, C,40.
25. G
-1 0 .I I II I
250X
-T I~
2.0 , -0 50
0 25,00-
,15 0I I I I II
0,0 '.0 2.0 3,.0 L oO 5.0 8.0 "1.0 8.0
TIME (SEC)
Figure 48. Maximum Roll at 5 g's Using Hinged Strakes and Ailerons With
Sideslip Feedback (AOA - 38, Strake Deflection = +30).
,-"'V.: ;=:. : :''' '"-i": : ;::::.. ;;' :::.:x:::; :- :-:: ::- : :i::::' -; S. ::; .': : : ;_: ': --:::.:

132
20.0r
-3G.0G
10.0G
0 C
-fo
TIME (SEC)
Figure 48. Concluded.

133
It should be noted that the effects of the strake and the ailerons
have been added together linearly. The deflection of the strake will
probably affect the aileron effectiveness, since the flow field over the
wing is changed when the strake is deflected. This effect would prob-
ably change the results when the two controls are used together.
A common problem throughout the AOA range is a need for better
regulation of sideslip and AOA. This difficulty suggests greater rudder
and elevator authority. While the rudder authority would be harder to
resolve, it should be noted that these simulations were done using data
for a smaller elevator than is now in use. The larger elevator has
improved high AOA flying qualities, and might reduce some of the AOA
variations seen in these simulations. Short of a way to more closely
control sideslip, a short term solution to the departure problem could
be to limit the maximum angle of roll to something small, such as 1300.
Effects of Thrust Limiting
All of the previous simulations were run setting the initial thrust
level to equal the thrust required. This thrust level usually resulted
in a thrust level that was higher than was actually available. 7sina
published curves11 for thrust available for an installed F100 engine,
the thrust was set to the maximum available as a function of Nach number
and altitude. The thrust curve used was defined for flight at low AA,
so the thrust available could be further degraded by factors such as
inlet stall. The results are shown in Figure 49. Rolling with both a
+300 strake deflection and full ailerons at 320 AOA, the time required
to roll to 1800 is about the same as the case with no thrust limitin-
(Figure 44), but as the airspeed decreases, the FCS attempts to maintain
the same load factor by increasing AOA, and the roll stops after 5
seconds as the AOA diverges.
Effects of Increased Yaw Damper Gain
The yaw channel contains a feedback path which feeds back (r - pa),
which is an approximation of 8. This path is known as the stability
axes yaw damper, and its purpose is to cause the aircraft to roll about
the velocity vector instead of the longitudinal body axis. Since the

. 134
Sri.
Nri.I~ in.
U':
G5.
35 .0
Q,
C,' .3 i Hf .G . 1. .1
TIE(SC
Fiur 49 aimmRl a 'sUigHigdS.ae ndAlrosWtSielp Febc n hutLmtn AA 3 taeDfeto
r3r..
.,7 e-,
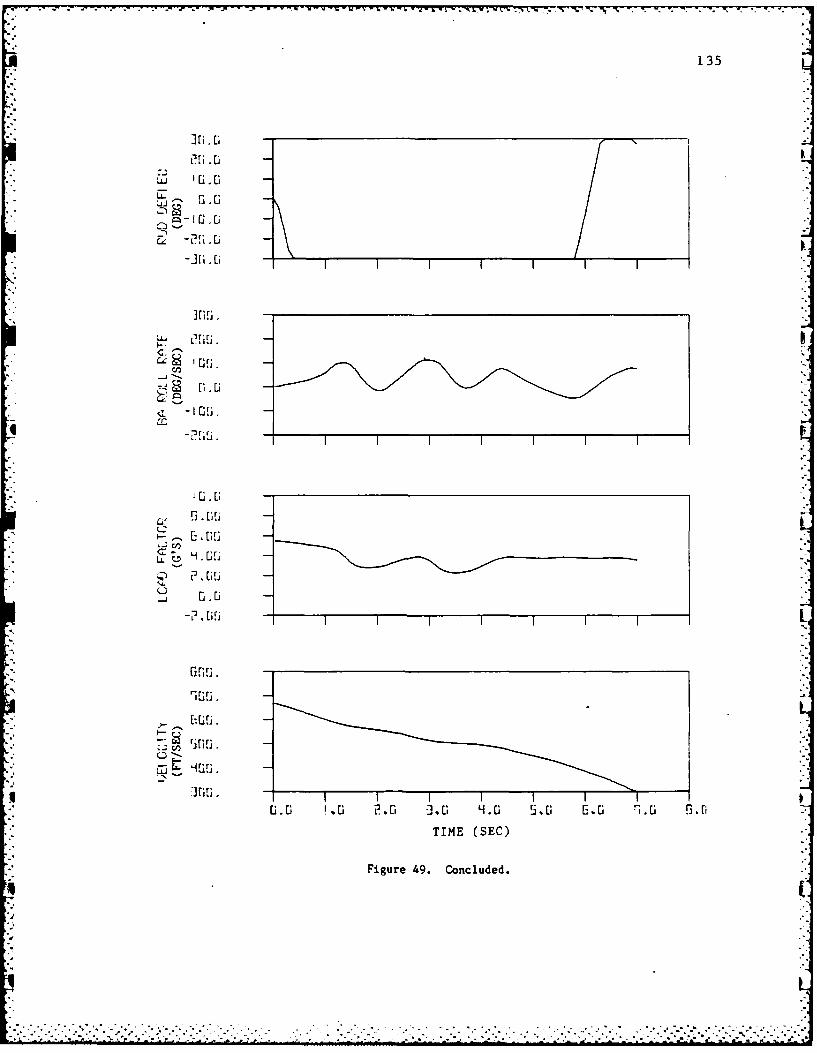
135
LI .0, ' G.
L.
TIM (EC
Fiur 49 Concuded
,r.a~

136
sideslip feedback used in the previous analysis is not currently avail-
able, another candidate solution to solving the problem of excessive
sideslip was to increase the gain on the output of the stability axes
yaw damper. It was hoped that by damping out the change in sideslip,
the overall sideslip angle could be reduced.
Simulations were run using feedback gains of 15 and 30 at an AOA of
320 and load factors of 1 g and 5 g's commanded. The simulations at 1 g
showed essentially no change from the cases using the strakes alone with
no feedback modifications to the FCS, as seen previously in Figures 27-
28. At 5 g's commanded load factor, both feedback gains tested gave
essentially the same results. The case for the gain of 15 is shown in
Figure 50. Using strakes alone, the aircraft takes over 4.5 seconds to
roll to 1800. As seen in Figure 43, the ailerons alone rolled the
aircraft to 1800 in just over 2.5 seconds at this AOA. The roll shown in
Figure 43 was done using beta feedback to the rudder, but since the yaw
characteristics of the ailerons are well defined, the same result could
be obtained by driving the rudder through the Aileron-Rudder Intercon-
nect (ARI). Thus, the strakes in this case do not show an improvement
over the performance available with the current ailerons. In addition,
the rudder oscillates excessively, causing a disconcerting roll oscil-
lation.
The combination of the positive strake deflection and ailerons was
also run at both feedback gains. The case for the feedback gain of 15
is shown in Figure 51. Again, no significant improvement over the use
of ailerons was seen, and a roll oscillation was still present. A major
reason for no improvement is that AOA drops below 280 after about 1.5
seconds and the strake deflection is removed by the internal model.
Therefore, the remainder of this roll was done with ailerons only.

137
200.
LU IOo
-50
6- 0.0
40.0
L 2 0. 0
-20 .. 50
45.040.0
2 50.0
20.0
15.0
0r0 '0 2.0i 3.0 L1. a 5.0 E.0 I. 5.0 ,TIME (SEC)
Figure 50. Maximum Roll at 5 G'S Using Hinged Strakes Only WithIncreased Yaw Damper Gain (AOA - 32 ,Strake Deflection -+30, YawDampe- Gain -15).

138
r. '."-70.0
20. 0
-i 0.0 I30.0
-200
-0.0
Jr. -C-'
u_ '00
C -.
'0.0 -
LL 4,00
-200II2.00
L 00.'_ F00.
,-'- E.,-,
-100.IIIII I
a. , ,.0 2, a -3,0 q1, 5.0 5,0 -1.0 60
TIME (SEC)
Figure 50. Concluded.
Ie . . .

139
2?00. -'5n. -
wu iOo-
50.0S0.0a
v 50. G
-150. --100.
60.0
H0.0
- 20.0
- .0C0
-20.0
r, .50 -a G_ 50.0
50.0
40.0~ 50.0-05,
50.0 -
035,.30.0
20 a
1510 I I Ia G G , 2 .0 -3.0 '40 5, G , b1 9-. 6. ,
TIME (SEC)
Figure 51. Maximum Roll at 5 G's Usiog Hinged Strakes And Ailerons WithIncreased Yaw Damper Gain (AOA u 32 , Strake Deflection - +30, YawDamper Gain - 15).
ho
i 0
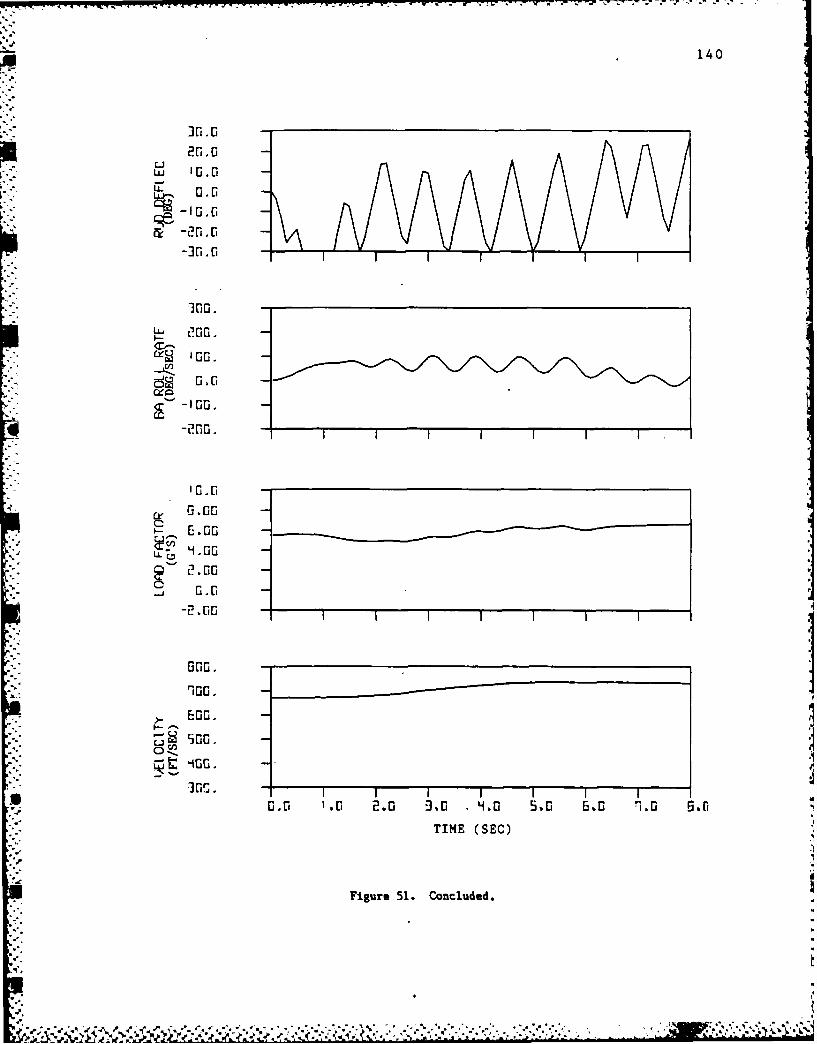
140
30.0
LLLO 20.0 -CIP?LL O 0.0-io. -
S-2n .0 -
C-
-30.0r 3.00.c0 -I00.
C 40.000.00'-I.00
2.00
G- .oo. -_J 0.0 -
9100.
0 .I I IM IE
TIME (SEC)
Figure 51. Concluded.
' .':' . .. ..,, . .".- "-" .. ' .,- '"""v ". :
,V ,.. . > - . . . .. -.- p. .. . . .
141
COMPARISON TO DIFFERENTIAL LEADING EDGE FLAPS
In order to gain a better appreciation for the usefulness of the
hinged strakes, they were briefly compared against differential leading
edge flap (DLEF) deflections for roll control as studied by Stout5. For
this comparison, the model used in Reference 5 was upgraded to allow
simulations at higher load factors. Two simulations were ran at AOAs of
320 and 340 for a 5 g commanded load factor. The results for 320 AOA
are shown in Figure 52.
Comparing Figures 52 and 44, the DLEFs gave a comparable roll,
having roughly the same roll rates. The DLEFs currently show four
advantages over the hinged strakes. First, the rudder is not saturated.
Second, roll oscillations are minimal. Third, the recovery at the end
of the roll is smoother, showing no tendencies toward departure.
Fourth, the rudder is connected directly through the ARI, and does notrequire any beta feedback. These advantages of the DLEFs are not
reasons to abandon the hinged strake concept altogether. The current
data base for DLEFs is much smaller than that for hinged strakes, par-
ticularly with regards to behavior as a function of sideslip (all of the
current DLEF data was taken at zero sideslip). Further investigation
should be done into possible combined effects of various combinations of
hinged strakes, DLEFs, and ailerons.
S
-- ~-- --.. .-. * ~ .-. '~..

142
I~flI
t~i|
"-'-" "' GG.-5G. G
E0.0
-15i. -
0 .0LU
-3i5. G
"" rS ,
' -00.
5iza 2"0 -7
,0
--U
0.0 .o 2.0 .,0 ,-.0 5,.0 0.0 -.t O.0
TIME (SE.C)
AFigure 526 Maxium Roll at 5 G's Using Differential Leading Edge Flaps(AOA - 32 , Flap Deflection.- 10)
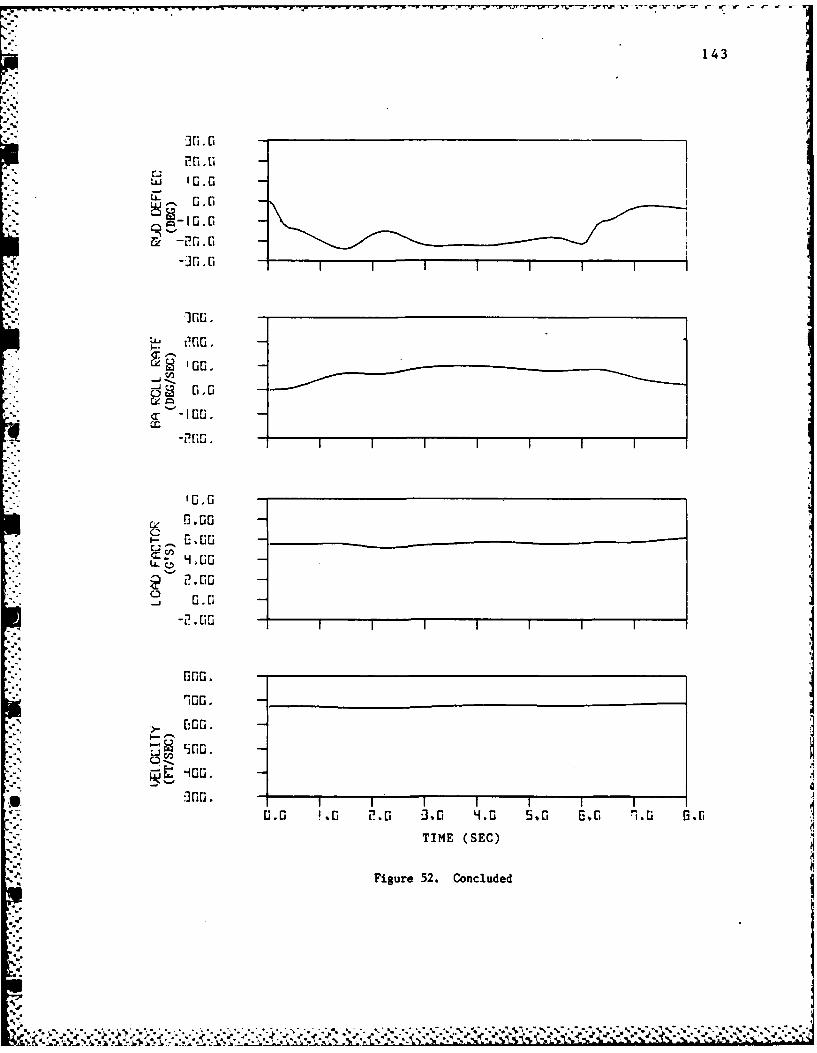
00.
-L~143
-311. G _ _ _ _ _ _ _ _ _ _ _ _ _ __ _ _ _ _ _ _ _ _ _ _ _ _ _
'or,. C _ _ _ _ _ _ _ __ _ _ _ _ _ _ _ __ _ _ _ _ _ _
j.00
LL '00
S0.00
-0-7 -7
TIM (SE00
Fiue5. ocue
144
CONCLUSIONS AND RECOMMENDATIONS.
Conclusions
1. Based on comparisons with published data, the results of this test
were consistent with previous tests.
2. The changes in the forces and moments due to dihedral strakedeflection are different from the changes due to anhedral strake deflec-
tion. In both cases, the changes in the forces and moments are
complex, nonlinear functions of AOA, sideslip, and strake deflection.
3. The anhedral-dihedral configuration, deflecting one strake upwardand the other strake downward, showed no noticeable improvement over theasymmetric case of deflecting one strake upward.
4. In order to maximize rolling performance at high AOA, the sideslip
must be kept small to prevent dihedral effect (9) from inhibiting the
roll rate.
5. Using direct sideslip feedback to control the sideslip anole, a
gain of 25 was chosen based on maximum roll angle, minimum sideslip, and
maximum roll rate, and roll recovery in 1 g flight. However, a direct
reading of sideslip at high AOAs is not currently available.
6. The best roll performance was seen using +30' strakes combined with
the ailerons at AOAs less than 380, and using +300 strakes only above
380. Both of these cases were using beta feedback to control sideslip.
7. The -450 strake deflection produced more yawing moment than the
+300 strake deflection, causing larger sideslip excursions.
8. In all cases, the aircraft was very prone to departure when the
control input was removed. This was due to large variations in sideslip
and AOA resulting from degraded stability at high AOA. If the sidesli.
and AOA cannot be more closely controlled, a possible solution to this
problem is to limit the amount of roll allowed.
9. Limiting the thrust level to thrust available while commandinp, a
constant load factor causes the aircraft to decelerate during the maneu-
ver and results in a loss of rudder and elevator effectiveness. The end
result is early departure.
.p.
q Ic.
145
10. Increasing the gain on the stability axes yaw damper does not
improve the roll performance over that which is currently available, and
serves to increase roll oscillations.
11. Based on the current data base, differential leading edge flaps
alone appear to give better performance as a roll control device than
the hinged strakes alone.
Recommendations
Further tests should be conducted to investigate the following
areas:
1. Investigate the effects of strake area to see if a larger strake
will produce an increase in rolling moment without a large increase in
yawing moment.
2. Investigate the effects of different configurations, such as store
loadings, on the reactions due to the strakes.
3. Investigate the possible combined effects of combining hinged
strakes, differential leading edge flaps, and/or ailerons as roll con-
trol devices.
4. Conduct tests to fill in the current hinged strake data base. The
primary areas of concern would be data for smaller increments in
sideslip and testing for dynamic derivatives.
5. Investigate other possible FCS mechanizations for using the hinged
strakes.
6. Conduct tests at other dynamic pressures to check for further
Reynold's Number effects.
7. Investige possibilities for sideslip sensors, such as the InertialNavigation System, vanes, or multi-holed probes.
J, -J
Ch d o
146
REFERENCES
1. Polhamus, E. C., "Application of the Leading-Edge-Suction Analogy of
Vortex Lift to the Drag Due to Lift of Sharp-Edge Delta Wings," NASA T11
D-4739, August 1968.
2. Luckring, J. M., "Aerodynamics of Strake-Wing Interactions," Journal
of Aircraft, Vol. 16, Nov. 1979, pp. 756-762.
3. Frink, N. T. and Lamar, J. E., "Analysis of Strake Vortex Breakdown
Characteristics in Relation to Design Features," Journal of Aircraft,
Vol. 18, Apr. 1981, pp. 252-258.
4. Rao, D. M. and Huffman, J. K., "Hinged Strakes for Enhanced
Maneuverablity at High Angles of Attack," Journal of Aircraft, Vol. 19,
Apr. 1982, pp. 278-282.
5. Stout, L. J., "Control Authority of Unconventional Control Surface
Deflections on a Fighter Aircraft," Masters Thesis, Texas A&M Univers-
ity, May 1985.
6. Low Speed Wind Tunnel Facility Handbook, Aerospace Engineering
Division, Texas Engineering Experiment Station, The Texas A,&M University
System, College Station, TX., Jan. 1982.
7. Pope, A., and Harper, J. J., Low SDeed Wind Tunnel Testing, John
.Wiley and Sons, Inc., New York, 1966.
8. Ward, D. T. and Stout, L. J., "Wind Tunnel Test of Fighter Aircraft
Control Authority at High Angles of Attack," TEES Report No. TR-8321,
Feb. 1984.
9. "Application of the EASY Dynamic Analysis Program to Aircraft
Environmental Control Systems Reference Guide," AFFDL-TR-77-102, Oct.
1977.
10. Pape, J. K., and Garland, 1. P., "F-16A/B Flying Qualities Full
Scale Development Test And Evaluation," AFFTC-TR-79-10, Sep. 1979.
11. Nicolai, L. M., Fundamentals of Aircraft Design, 'IETS, Inc., San
Jose, CA, 1975.
.........................

147
APPENDIX A
SU14-IARY OF CONSTANTS
Duct Exit Area (M < 1.20)-- Ae = 3.0000 in 2
Fuselage Cavity Area (M = 1.20 windshield) Ac = 3.0089 in2
Reference Wing Span- b = 23.1862 in.
Reference Wing Mean Aerodynamic Chord - c = 8.7490 in.
Reference Wing Area (280.0 ft , full scale)----- S = 1.2444 ft2
Balance Incidence Angle- ib = -00 57'
Reference Inlet Area-A i = 3.6311 in2
Moment Reference Center (.35c) Fuselage Sta.----- 20.773 in.
Waterline~.......-. 6.067 in.
Planform Area (odel) 2.263 ft2
Frontal Area (including inlet)- .187 ft2
Body Volume- .214 ft3
Lifting Surface Volume- .015 ft3
Horizontal Tail Area (movable, 2 panels) ..-- ----- .189 ft2
0.25c (wing) to 0.25c (h. tail) 1.044 ftdC
Horizontal effectiveness, --L (per degree) ---- -.0113/degdit
Moment Transfer Distances u -.1172 ft.
.023 ft.
v ------- .000 ft.
a'h
a-"
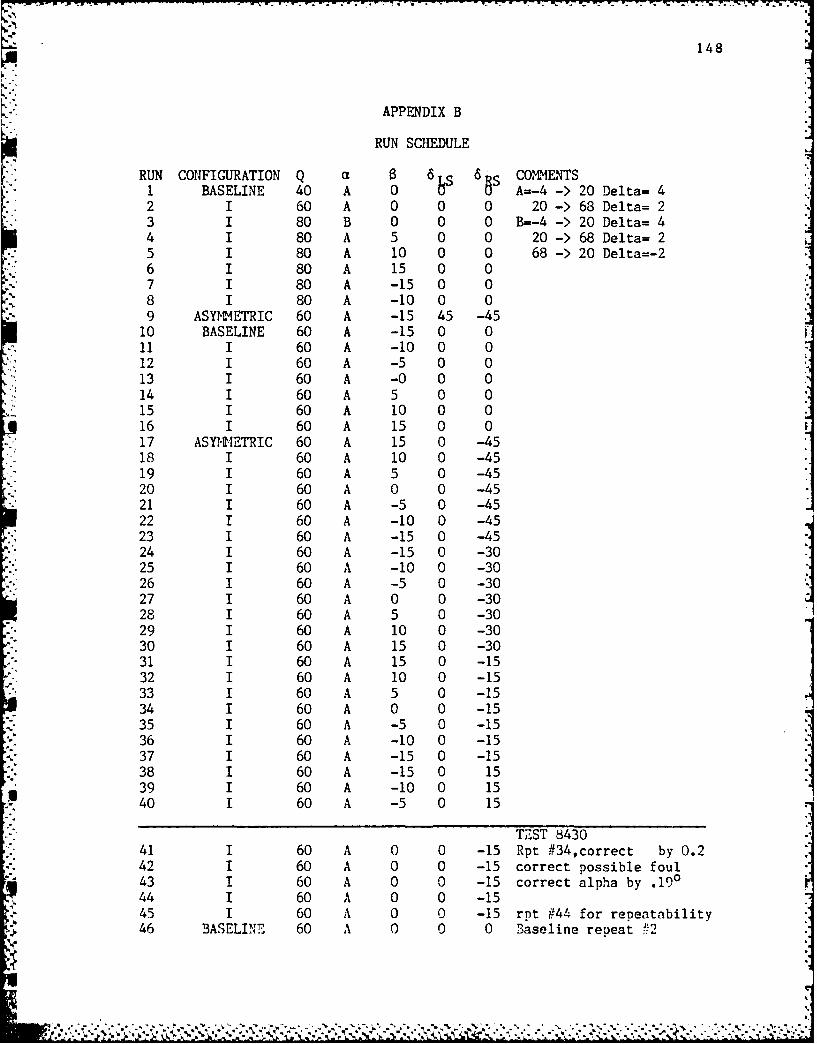
148
APPENDIX B
RUN SCHEDULE
RUN CONFIGURATION Q 6 6 COENTS1 BASELINE 40 A 0 0 A=-4 20 Delta= 42 I 60 A 0 0 0 20 ->68 Delta= 23 I 80 B 0 0 0 B=-4 ->20 Delta= 44 I 80 A 5 0 0 20 ->68 Delta= 25 I 80 A 10 0 0 68 ->20 Delta=-26 I 80 A 15 0 07 I 80 A -15 0 08 I 80 A -10 0 09 ASYMMETRIC 60 A -15 45 -45
10 BASELINE 60 A -15 0 011 I 60 A -10 0 012 I 60 A -5 0 013 I 60 A -0 0 014 I 60 A 5 0 015 I 60 A 10 0 016 I 60 A 15 0 017 ASY11 rETRIC 60 A 15 0 -4518 I 60 A 10 0 -4519 I 60 A 5 0 -4520 I 60 A 0 0 -4521 I 60 A -5 0 -4522 1 60 A -10 0 -4523 I 60 A -15 0 -4524 I 60 A -15 0 -3025 I 60 A -10 0 -3026 I 60 A -5 0 -3027 I 60 A 0 0 -3028 I 60 A 5 0 -3029 I 60 A 10 0 -3030 I 60 A 15 0 -3031 I 60 A 15 0 -1532 I 60 A 10 0 -1533 I 60 A 5 0 -1534 I 60 A 0 0 -1535 I 60 A -5 0 -1536 I 60 A -10 0 -1537 I 60 A -15 0 -1538 I 60 A -15 0 1539 I 60 A -10 0 1540 I 60 A -5 0 15
TEST 8430
41 I 60 A 0 0 -15 Rpt #34 ,correct by 0.242 I 60 A 0 0 -15 correct possible foul43 I 60 A 0 0 -15 correct alpha by .19044 I 60 A 0 0 -1545 I 60 A 0 0 -15 rpt 944 for repeatability46 BASELINE 60 A 0 0 0 Baseline repeat 2

149
47 I 60 A 0 0 0 add trips
48 ASYMETRIC 60 A 0 0 1549 I 60 A 5 0 15 L50 I 60 A 10 0 1551 I 60 A 15 0 15
52 I 60 A 15 0 3053 ASYNMETRIC 60 A 10 0 3054 I 60 A 5 0 3055 I 60 A 0 0 3056 AnDi 60 A 0 -15 3057 I 60 A 5 -15 3058 I 60 A 10 -15 3059 I 60 A 10 -30 3060 I 60 A 5 -30 3061 I 60 A 0 -30 3062 I 60 A 0 -30 1563 I 60 A 5 -30 1564 I 60 A 10 -30 1565 I 60 A -10 -30 1566 I 60 A -5 -30 1567 I 60 A -0 -30 15 clay missing left strake68 I 60 A -0 -30 3069 I 60 A -5 -30 3070 I 60 A -10 -30 3071 ASP IETRIC 60 A -0 0 3072 I 60 A -5 0 3073 I 60 A -10 0 3074 I 60 A -15 0 3075 AnDi 60 A -0 -15 30
- 76 I 60 A -5 -15 30- 77 I 60 A -10 -15 30
..... FOT--
.I'
-p
ND
°II,I .- . . . . . . . .. \ , / "-"- ' V ' . "-' "-""' . .. ' '% ' '' .-. : '%r''\ '%
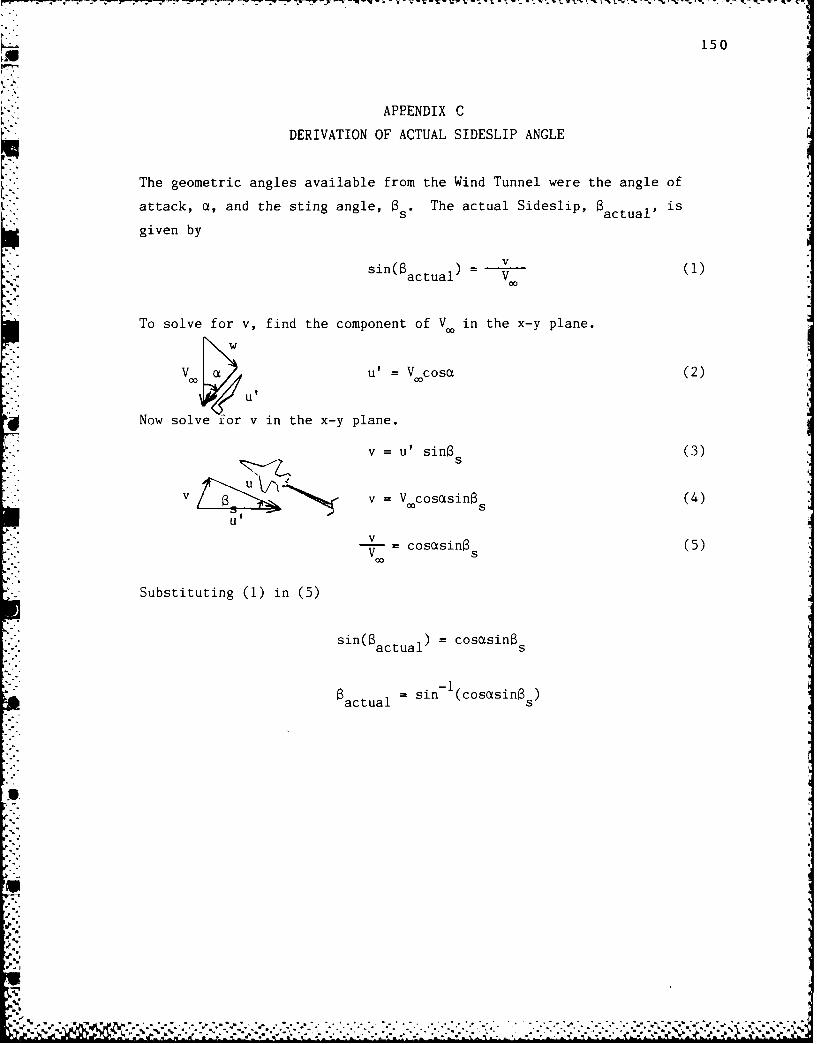
150
APPENDIX C
DERIVATION OF ACTUAL SIDESLIP ANGLE
The geometric angles available from the Wind Tunnel were the angle of
attack, a, and the sting angle, fs" The actual Sideslip, actual' is
given byv
si(actual) V001
To solve for v, find the component of V in the x-y plane.
V u= V cosa (2)
Now solve ior v in the x-y plane.
v = u' sin s (3)
v v = V cosasin s (4)
Ut
v cosasina (5)V s
Substituting (1) in (5)
sin( actual) = cosasin s
aactual - sin- (cosasinas )
3 Z
UJ
151
VITA
Russell Earl Erb was born in Arlington, Texas on 3 August 1961, and
graduated from Arlington High School on 31 May 1979. He went to the
United States Air Force Academy in the summer of the same year. At the
Air Force Academy, he majored in Aeronautical Engineering in the Flight
Mechanics track. During the summer of 1982, he spent six weeks at
Edwards Air Force Base working at the Air Force Flight Test Center in
the F-16XL Combined Test Force. During his senior year at the Academy,
he applied for and was awarded a National Science Foundation Graduate
Fellowship. On 1 June 1983 he was awarded the degree of Bachelor of
Science in Aeronautical Engineering. After graduation, he returned to
the Air Force Flight Test Center for six weeks before reporting to Texas
A&M University. While at Texas A&M University, he worked under Dr.
Donald T. Ward of the Aerospace Engineering Department in the field of
stability and control, specifically control of aircraft at high angles
of attack. Following successful completion of his degree program, he
will be stationed at Eglin Air Force Base with the 3246th Test Wing. Hle
maintains his permanent address at 832 S. Collins, Arlington, TX 76010.
2LI
I.

FILMED
10-85
DTIC.---