Embed Size (px)
Citation preview

2016
Straight Talkon Hot-ButtonIssuesUC Admissions, Finances,and Transparency


UNIVERSITY OF CALIFORNIA
1
EXECUTIVE SUMMARY ...................................................................... 2
EDUCATING CALIFORNIA'S TOP STUDENTS IS CENTRAL TO UC'S MISSION ................................... 4
UC POLICIES OVERWHELMINGLY FAVOR CALIFORNIA RESIDENTS ..................................................... 6
UC ALLOCATES STATE FUNDS THROUGH A TRANSPARENT, FAIR, AND EFFECTIVE PROCESS. ..................12 UC IS AN EFFECTIVE, RESPONSIBLE STEWARD OF ITS FINANCIAL RESOURCES .................................15
UC IS INCREASING DIVERSITY AND ENHANCING SOCIOECONOMIC MOBILITY .....................25
Contents
Straight Talk on Hot-Button Issues: UC Admissions, Finances, and Transparency
March 2016
UC ADMISSIONS, FINANCES, AND TRANSPARENCY
2
Executive Summary
Through its teaching, research, and public service missions, the
University of California sustains an unbroken commitment to
bettering the lives of Californians. For 148 years, that commit-
ment has endured despite political shifts in Sacramento, state
Great Recession. Today, UC’s commitment to Californians is
stronger than ever.
UC’s Commitment to California Students
The University of California accepts every California high
school student applicant, and every California community
college transfer applicant, who meets its eligibility criteria for
admission. Even when the University faced nearly $1 billion
dollars in state budget cuts, UC found a place at one of its
campuses for all eligible California applicants who applied—at
a time when other California public institutions turned away
tens of thousands of students. This year, the University further
expanded its commitment to Californians: UC will enroll 5,000
more California undergraduates in 2016-17 than in 2014-15, and
plans to enroll an additional 5,000 California undergraduates in
the following two years.
The admission and enrollment of California students is
independent from that of out-of-state students. The tuition
that out-of-state students pay—which, for undergraduates,
is nearly triple the tuition of California students—generates
students in many ways, sustaining the quality of UC’s academic
programs and providing services that support student success.
UC’s commitment encompasses all Californians, and that
includes helping to prepare and recruit California high school
of California underrepresented minority freshmen at UC
has increased by 34 percent, and the number of California
underrepresented minority transfer students has increased
by 24 percent. Last year, the New York Times College Access
Index recognized UC’s enrollment of high-performing students
of all backgrounds, and ranked six UC campuses in the top 10
universities nationwide for economic diversity. As the Times
wrote, “The University of California is struggling with budget
education to the masses.” As applications rise every year—in
2015, more than 200,000 students applied to the University for
California college students.
UC’s Commitment to the State of California
The University of California has a demonstrated track record
for California students, and proactively undertaken many new
the Great Recession, the University eliminated thousands of
which cut costs and generated new income totaling over $660
The University’s commitment to the state includes being fully
transparent about its budget and outcomes. UC’s comprehen-
sive annual budget is reviewed and voted on every November
at UC’s public board meeting, and extensive data about the
University’s many enterprises—including campus-level metrics
—are provided to the public via the UC website, the online UC
of reports requested by the state Legislature. The University
also publishes an annual Accountability Report, which provides
the employment of UC graduates, among many other topics.
though the budget cuts of the past several years have only been
partially restored. As the Public Policy Institute of California
recently observed, “Over the past 15 years, per student General
Fund allocations have fallen by more than 40 percent at CSU and
by more than 50 percent at UC […] Recent increases in General
Fund allocations have not made up for the previous cuts.” During
this same time period, however, UC maintained its commitment
to delivering a high quality education to its students. Graduation
rates improved and continue to rise, and more than half of UC

UNIVERSITY OF CALIFORNIA
3
California resident undergraduates have had their tuition and
fees fully covered by grants or scholarships.
UC’s Commitment to the People of California
The University of California is the land-grant university for
example, and California-based startups based on UC technology
generated more than $14 billion in revenue in 2014 alone—the
University’s land-grant mission means that UC is charged with
the discovery of new knowledge, enrich K-12 education, and
enhance the well-being of all Californians.
and training more than 50 percent of the doctors and medical
residents in California, to undertaking agricultural cooperative
members into California high schools for college advising and
preparation. This commitment to the people of California is
essential to the ethos of the University. It is a privilege for UC to
uphold this commitment year after year.

UC ADMISSIONS, FINANCES, AND TRANSPARENCY
4
Educating California’s top students is central to UC’s missionUC keeps its Master Plan promise to admit
all eligible Californians.
UC’s admissions policies are based on the California Master
Plan for Higher Education: if a California high school graduate
meets the University’s eligibility requirements and applies to
Master Plan explicitly requires the state to provide the resourc-1
UC complies with this policy each year by ensuring every
-
uate campuses. Moreover, UC has continued to meet or exceed
this obligation even in years when the state did not provide the
requisite funding. UC currently enrolls more than 7,000 stu-
dents for whom it has not received state funding. By contrast,
during the most recent economic downturn, other California
higher education institutions turned away tens of thousands of
applicants who met all requirements for admission.
State funding determines how many California
residents UC enrolls.
Many people mistakenly believe UC campuses have a set num-
ber of available spaces and if students from outside California
take those spaces, fewer spaces remain for California residents.
But nonresident students do not displace California students.
Data and background can help explain the facts.
Enrollment of California students depends on two factors: UC’s
unbroken commitment to enroll California students consistent
with California’s Master Plan for Higher Education and the
availability of state dollars to fund resident enrollment growth.
UC continues to admit all applicants from the top one-eighth of
students who graduate from California high schools. Each UC
campus sets its California resident enrollment targets based on
the availability of state funds to help pay for their education. These
targets are independent of nonresident enrollment.
Some in California have called for UC to limit the number of nonres-
ident students it enrolls, thinking this would make room for more
Californians or provide additional opportunity for more California
students. This isn’t true. The immediate impact of reducing the
number of nonresidents at the University would be less funding
for all UC students. Like other governmental agencies, UC’s state
of the recent recession and it is unlikely that the state will be
positioned to replace the more than $800 million that nonresidents
bring to the University each year. Absent additional state funding,
the reduced revenues would lead to decreases in the quality of
academic programs and services for all UC students or increases
in tuition. The burden of either scenario would fall squarely on
California students and their families—an impact UC has tried to
avoid by increasing revenues from outside California.
Increasing California enrollment requires state funding.
enrollment growth since 2010-11. Hit by the worst economic
downturn since the Great Depression, California was unable to
state provides UC with less funding today than it did in 2007-08,
even though the University enrolled nearly 9,000 more California
undergraduate students in fall 2015 compared to fall 2007. In recent
years the state has partially restored its past support of UC’s base
budget by gradually increasing annual appropriations, as it has done
with other governmental agencies. These increases have been vital
to UC’s ability to maintain its commitment to the Master Plan.
But they must be placed in context. By themselves, these appropria-
tion increases don’t cover the University’s mandatory cost increases
plan contributions, and the faculty merit program, for example.
California students for a UC education.
1
commitment to ensure adequate resources to support enrollment growth,
within the systemwide academic and individual campus plans to accommodate
eligible California freshmen applicants and eligible California Community
College transfer students… The University of California and the California
State University are expected to plan that adequate spaces are available to
accommodate all California resident students who are eligible and likely to apply
to attend an appropriate place within the system. The State of California likewise
this expansion possible, and shall commit resources to ensure that students
from enrollment categories designated in subdivision (a) of Section 66202 are
accommodated in a place within the system.”

UNIVERSITY OF CALIFORNIA
5
• Historically, the state provided funding to meet UC’s projected
the state provided the primary support for the cost of
educating California residents. Each year, the state provided
enrollment funding based on UC projections of how many
students should be enrolled. Funding levels were projected for
the following academic year, so UC could plan for expected
funded growth. If UC enrolled above or below projections, the
state would adjust UC’s budget accordingly.
•
University found itself in the position of enrolling more
California students than the state paid for, making funding
of enrollment no longer a certainty. This uncertainty about
adequate state funding for enrollment growth—not
nonresident enrollment—has limited the University's ability
to increase California undergraduate enrollment since then.
display 1 california undergraduate enrollment stopped
growing with the great recession
Fall enrollment of California resident undergraduates, 2001 to 2015
When the state funds enrollment growth, UC responds
immediately.
Providing adequate state funding is the best way to increase the
number of California students enrolled at the UC. As evidence
for UC enrollment and the University immediately implemented
plans to enroll 5,000 more resident students in the 2016-17
academic year than it did in 2014-15. Enrolling these students
does not require reducing the number of out-of-state students.
In fact, 43 percent of these new California resident students
will attend the three campuses that currently educate the most
nonresidents: Berkeley, UCLA, and San Diego. This demonstrates
that when state funding for enrollment growth is made available,
the number of resident students will increase independently of the
number of nonresident students.
UC has plans to increase California enrollment by another 5,000
California undergraduate students by 2018-19 subject to the
availability of additional enrollment funding from the state. As UC
adds undergraduates, it will be important to increase graduate
enrollment as well. Graduate students are needed to help teach and
mentor undergraduates and work with the additional faculty who
must be hired as growth occurs.
demand that exceeds state funding for enrollment growth.
Declining admission rates for California residents do not indicate
that UC has reduced its commitment to the Master Plan. The Mas-
ter Plan addresses overall admissions to the system, not admissions
at the campus level. UC’s obligation under the Master Plan is to
admit all eligible applicants and it always meets this obligation.
students who apply and those who are admitted. In recent years,
continuing increase in the number of California high school
graduates seeking a UC education, combined with reduced state
funding to enroll them. During many years when state funding
for enrollment was cut, UC held state resident enrollment relatively
for enrollment did not, admission rates went down—it became
who want to attend UC and the funding from the state available
to educate them.
0
50,000
100,000
150,000
200,000
2001 2015

UC ADMISSIONS, FINANCES, AND TRANSPARENCY
6
nonresidents are not.
UC policy guarantees admission to California residents through
two paths—a statewide path and a local path—that recognize
and reward the academic accomplishment of the state's top
high school graduates. The statewide path includes students
with grade point averages and test scores in the top 9 percent
of all California high school graduates. The local path, known
as “eligibility in the local context,” includes students who have
earned at least a 3.0 UC grade point average and are in the top 9
percent of their participating California high school, regardless
of their test scores.
Every California resident applicant who is guaranteed admission
to UC but who is not admitted to any of the campuses to which
the student had originally applied is given the opportunity to
for every eligible California applicant. In contrast, nonresident
applicants who are not competitive for admission at the
campuses they apply to are denied admission, period.
They are not guaranteed enrollment at another UC campus.
Some have argued that the low percentage of UC applicants
is that students who apply to UC also have other postsecondary
institution choices.2 Many UC applicants may have their hearts
set on a single campus and, if not admitted to that campus,
choose not to attend UC. This decision is entirely up to the
applicant. Top California high school graduates who wish to
enroll at UC will not be turned down (although, consistent with
the Master Plan, a student is not guaranteed admission to a
particular campus). For the thousands of California resident
decade, this has meant access to a life-changing UC education
that they otherwise would not have received.
The number of students in the referral pool is a function of state
funding, not UC admissions policy. The University anticipates
that the size of the referral pool will decrease for the 2016-17
admissions cycle because the state will help fund enrollment of
an additional 5,000 California residents and more applicants will
likely be admitted to a campus of their choosing.
UC policies overwhelmingly favor California residents
display 2 two paths provide systemwide guarantees for californians
Statewide Path Local Path
Top 9% of all California high school graduates Top 9% of students in participating California high schools
(known as Eligibility in the Local Context [ELC])
Applicants must meet University requirements and have a high
score on the UC Admission Index—a sliding scale comprised of a
student's high school GPA (grades earned in college-prepatory
"a-g" courses) and SAT/ACT scores
Applicants must have a 3.0 GPA or better in UC's
college-prepatory courses
Applicants meet 9% benchmark GPA for the high school;
SAT/ACT score are not considered
2 The National Association of College Admission Counseling (NACAC) reports
that over 80 percent of all college applicants apply to three or more campuses
and the number of students who apply to more than seven campuses has
doubled in the last 10 years. See State of College Admission at nacacnet.org/
research/PublicationsResources/Marketplace/research/Pages/StateofCollege-
Admission.aspx

UNIVERSITY OF CALIFORNIA
7
Californians are admitted at higher rates
than non-Californians.
The University of California’s policies and programs favor
indicates, more than two-thirds of California applicants (and
all of those who meet the University’s eligibility requirements)
are admitted. Admission rates for domestic nonresident and
international applicants are noticeably lower.
4 shows, California residents are more likely to be admitted to
multiple UC campuses compared to nonresidents. For example,
nearly 20 percent of California residents receive admission
compared to only 11 percent of nonresidents who are admitted
to three or more campuses. And 45 percent of nonresident
applicants are denied admission at all campuses to which they
apply, compared to 29 percent of California applicants. It is
important to stress that all eligible California applicants receive at
.
display 4 california applicants are more likely to be
admitted to one or more campuses than nonresidents
Fall 2015 proportion of applicants admitted by number of campuses
admitted to and residency
display 3 california applicants are far more
likely to be admitted to uc
The total for eligible California Residents is less than 100 percent as a small
number of applications are withdrawn or cancelled prior to UC making an
admission decision.
0
10%
20%
30%
40%
50%
60%
70%
80%
ZeroOne or MoreTwo or MoreThree or More
CA Residents Nonresident
0
20%
40%
60%
80%
100%
CA Residents(all)
CA Residents(eligible)
Nonresidents

UC ADMISSIONS, FINANCES, AND TRANSPARENCY
8
UC works closely with California high schools to identify
college prep courses in every California high school; no similar
services are provided for out-of-state schools and students.
UC works closely with California high schools to assist them in
developing college preparatory courses, maintaining the quality
of those courses, and communicating to all California students
which courses in each California high school will help students
prepare for college. In a partnership that is unique to California,
courses that make up the state’s agreed-upon college prepara-
tory curriculum, known as the “a-g” course pattern. UC faculty
specify the required courses in each subject area and produce
guidelines for the content and rigor of these courses. University
college preparatory curriculum. In addition, on behalf of the
state, UC maintains public course lists for more than 2,500 high
schools and programs that are available on UC’s “a-g” course
list website (https://hs-articulation.ucop.edu/agcourselist#/
list/search/all). This resource is available to teachers, school
administrators, students, and families. UC does this work on
behalf of all of California K-12, the California State University
system, and the University of California campuses. No such
services or guidance are provided for schools outside California.
UC’s eligibility standards likely guarantee admission for more
California students than the Master Plan requires.
The Master Plan for Higher Education requires UC to extend
eligibility for admission to the top one-eighth of California public
high school graduates. UC is not expected to enroll all of these
students (since some may choose to enroll elsewhere) or even
admit the top one-eighth of high school graduates (since some
may never apply to UC), but rather to ensure that all Californians
who fall within the top 12.5 percent and who apply for
In practice, UC has been admitting even more than 12.5 percent
of the public high school graduating class within its current
applicant pool. Over the past four years, the number of public
been between 14.3 and 14.9 percent of California public high
school graduates—well above the 12.5 percent ceiling.
and the vast majority were admitted to one or more campuses
of their choosing. The number admitted to a campus to which
they applied has ranged between 12.2 and 12.6 percent of high
school graduates.3 Given that not all students who meet UC’s
criteria apply, UC’s eligibility policy very likely captures more
than the top 12.5 percent required by the Master Plan.
its analysis of the higher education 2016-17 governor’s budget:
“Available Evidence Suggests UC and CSU Drawing From Beyond
Their Freshman Eligibility Pools. For fall 2014, UC and CSU
admitted 13 percent and 30 percent, respectively, of public high
school graduates as freshmen ... Because not all public high
school students within the eligibility pools apply to UC or CSU,
and many only apply to UC or CSU but not both, the universities
currently are drawing from even larger pools of students.” 4
UC admissions policies consider students’ achievements
generation college status; the vast majority of these
students are Californians.
UC believes a student’s potential to succeed on a UC campus
should be measured by more than high school grade point
averages and college admissions test scores. UC’s campus-level
admission policy includes 14 criteria, which extend beyond
grades and test scores to include accomplishments and
that each applicant must be evaluated in the context of that
applicant’s personal and educational experiences. Applicants’
achievements are viewed in terms of what they accomplished
given the resources available to them. In this way, UC seeks
3 UC Board of Admissions and Relations with Schools, Annual Report on
Undergraduate Admissions Requirements and Comprehensive Review, February
2016, p.14
senate.universityofcalifornia.edu/committees/boars/documents/
BOARS2016ReporttoRegents.pdf
4 lao.ca.gov/reports/2016/3372/higher-education-022516.pdf, p.7

UNIVERSITY OF CALIFORNIA
9
opportunity to attend UC—students from low-income families,
those whose parents did not graduate from college, and those
who have attended under-resourced high schools.
the resources available at individual California high schools—
including data about academic resources (e.g., numbers of
(e.g., numbers of students who complete college preparatory
courses), and demographic characteristics (e.g., percentages
of the student body who qualify for free or reduced lunch).
This information helps campuses to evaluate students against
others with access to similar levels of resources and to identify
California students whose levels of achievement, when viewed
in the context of the challenges they have overcome, make them
strong candidates for admission.
UC nonresident admission policy requires nonresidents to be
-
dents to a higher minimum GPA, and provides no guarantee.
The original 1960 Master Plan stated that to be eligible for
admission, nonresident students should “meet higher entrance
requirements than are required of residents of California [such
that] they stand in the upper half of those ordinarily eligible”
(emphasis added).5 UC implements this requirement—which
applies at the systemwide level only—by requiring admitted
nonresidents to have a minimum GPA of 3.4, compared to a
minimum GPA of 3.0 for Californians. The 1987 revision of the
Master Plan dropped the “upper half of those ordinarily eligible”
language and instead stated that “graduates of ... out-of-state
secondary schools [should be] held to at least equivalent levels”
of preparation to those of Californians.6
This 1987 change has been widely acknowledged in higher edu-
cation policy. For example, the most recent LAO report states,
“the Master Plan allows [CSU and UC] to admit … nonresident
students if these applicants meet similar academic standards as
eligible public high school graduates.”7 Consistent with the 1987
update of the Master Plan, UC policy holds that nonresidents
should “compare favorably” to resident students admitted to the
campus where they have applied. Some have suggested that the
qualitative, non-numeric language of the “Compare Favorably”
evolution of UC admissions away from reliance solely on grades
and test scores toward comprehensive and holistic review—an
important step forward for admissions of California students
and one that has been widely praised.
to enroll California residents, especially those from underrep-
resented groups.
The University devotes the majority of its recruiting budget to
resources go toward the recruitment of historically underserved
populations, consistent with the Regents’ Policy on Undergradu-
ate Admissions.8
Since 2010, the enrollment of California underrepresented
minority freshmen has increased 34 percent. Enrollment of
transfers from underrepresented minority groups has increased
24 percent.
Some have argued that the University spends too much money
story. In 2014-15, the University spent 56 percent more to
recruit California residents than it did nonresidents; indeed,
only 23 percent of UC’s recruiting expenses went exclusively
include the more than $25 million that UC spends annually on
5 A Master Plan for Higher Education in California, 1960 to 1975, Sacramento,
CA, 1960, p. 5
6 The Master Plan Renewed, Commission for the Review of the Master Plan for
Higher Education, Sacramento, CA July 1987, P. 15
7
8 Regents Policy 210 states, in part, that “the University of California has an
historic commitment to provide places within the University for all eligible
applicants who are residents of California. The University seeks to enroll, on each
of its campuses, a student body that, beyond meeting the University's eligibility
requirements, demonstrates high academic achievement or exceptional personal
talent, and that encompasses the broad diversity of cultural, racial, geographic,
and socioeconomic backgrounds characteristic of California.”

UC ADMISSIONS, FINANCES, AND TRANSPARENCY
10
Student Academic Preparation and Educational Partnerships
to prepare California residents for admission to the University.
Through these programs, the University has a presence in more
than 1,000 California public primary and secondary schools.
These UC investments are designed to propel the children of
California’s taxpayers into California’s public higher education
system. They represent a sizeable and sustained commitment to
Californians.
California students. Major choice has little or no bearing on
freshman admission selection except for a handful of University
programs. Indeed, one in four freshmen enters the University
with no declared major. Moreover, applicants’ initial selection
of a major has little bearing on the degree they ultimately earn,
since nearly half change their major before they graduate.
As the population of nonresidents has increased at UC, the
number
But the data show that California students have maintained
the same share of enrollments in various majors as they did
For example, Display 5 shows virtually no change in the
most popular majors at Berkeley, UCLA, and San Diego
between 2010 and 2015.
display 5 residency is not a factor in access to top majors
California resident Nonresident
2010 2014 2010 2014
Berkeley 34% 33% 35% 34%
UCLA 64% 66% 64% 63%
San Diego 63% 64% 66% 60%
display 6 $86 million targeted to supporting low-income
and educationally disadvantaged students
Academic Prep $48.9 57%
Campus Climate $13.4 16%
Summer Bridge $12.0 14%
Student Counseling $4.3 5%
UG Research $3.5 4%
Data Based Analytics $2.4 3%
Mentorship $1.3 2%
Total $86.0 100%
UC spends $86 million per year providing academic prepara-
tion and advising services for low-income and educationally
disadvantaged California middle and high school students.
The University of California spent $86 million in 2014-15 (see
and underrepresented student populations. These funds were
used to support academic preparation, summer bridge programs
(which often consist of residential orientation and workshop
programs during the summer before students matriculate, and
skills to make the transition to college), campus climate, student
counseling, data-based analytics (which are data tools used to
capture more facts about student outcomes, graduation rates,
and predictors of academic success), mentorship, and under-
graduate research.

UNIVERSITY OF CALIFORNIA
11
California students pay only a fraction of what it costs to
educate them.
Total systemwide tuition and fees for California residents in
2015-16 is $12,240—about $10,000 below the University’s aver-
age expenditures for undergraduate instruction, which exceeds
$22,000 for an undergraduate student (including expenditures
display 7 california residents pay less and nonresidents
paymore than average expenditures for instruction
In contrast, nonresident undergraduates pay $36,948—or over
$14,000 more than the average expenditures for instruction.
a subsidy—from both the state and nonresident students—
that helps cover the cost of their UC education. Moreover,
as shown in Display 8, more than half of California resident
undergraduates have their tuition and fees fully covered
by grants and scholarships.
than nonresidents.
-
uates—the state’s Cal Grants, the state’s Middle-Class Scholar-
ship Program, and the UC Blue and Gold Opportunity Plan—are
available only to California residents.
• Cal Grants cover mandatory systemwide charges for eligible
California residents.
• The Middle Class Scholarship Program will cover up to 40
percent of mandatory systemwide charges for California
students whose parents earn up to $150,000 by 2017-18,
once it is fully phased in.
• Under the Blue and Gold Opportunity Plan, UC ensures
that California undergraduates with parental income up to
$80,000 will have all their mandatory systemwide charges
display 8 more than half of california undergraduates pay
no tuition and fees
As a result of these programs, about 55 percent of California
undergraduates pay no tuition for their UC education. In
aid from the University Student Aid Program—the University’s
systemwide need-based grant programs.
0
$5,000
$10,000
$15,000
$20,000
$25,000
$30,000
$35,000
$40,000
NonresidentCA ResidentsAvg. Expenditures for Instruction
CA Resident Undergraduates
Pay no tuition
Pay partial tuition
Pay full tuition

UC ADMISSIONS, FINANCES, AND TRANSPARENCY
12
The University accelerated its plans to achieve equity in
per-student state funding across the campuses.
Historically, campuses received state funds based on factors
example, older campuses received most of their funding when
the state provided more money per student) and agreements
with the state on how various aspects of the University’s budget
were funded (for example, maintenance funding was provided
largely based on size and age of facilities, rather than on a
per-student basis). The University of California adopted a new
methodology in 2012 for achieving equity in state funding on
a per-student basis. This methodology, known as “rebenching,”
was to be completed over six years. In fall 2015, President
Napolitano accelerated and improved rebenching by addressing
the issue of funding undergraduate overenrollment (those
students for whom the state had provided no funding are now
included in enrollment targets) and by moving up the deadline
from 2017-18 to 2016-17.
UC is allocating state funds to support 7,000 previously
unfunded California residents.
-
ly to increase the enrollment of California students, consistent
with the Master Plan vision for state-supported public higher
education. Since 2008-09, the state has not regularly provided
this funding dedicated for enrollment growth. Rather than deny
access to eligible Californians, UC maintained funded levels of
enrollment and some campuses continued to enroll thousands
of California students substantially above funded levels. As
of 2014-15, UC was educating 7,000 California undergraduate
students for whom the state has not provided funding, meaning
that some campuses were “overenrolled.”
All UC campuses enroll a relatively high proportion of
low-income and underrepresented students, but several of the
overenrolled campuses, which have grown rapidly in recent
years, also have higher proportions of such students. UC River-
side, with 41 percent underrepresented minority students, also
has the highest proportion of students enrolled for whom no
state enrollment growth funding has been provided. Additional
funding to support enrollment at Riverside and similar campuses
was a high priority for the University.
By funding overenrollment, UC is ensuring that overenrolled
campuses receive the support they need to accommodate
current levels of California resident enrollment. UC campuses
will receive additional funding to enroll 5,000 more California
resident undergraduates than they enrolled in 2014-15.
funding means allocating $94 million in the current and
next budget years.
be accomplished by raising all campuses to the same level,
not by reducing per-student funding at some campuses. The
rebenching process had to be phased in over several years in
order to achieve a uniform standard of quality at all campuses.
Since rebenching began in 2012, UC has allocated $111 million
to reduce disparities in per-student state funding across the
campuses. President Napolitano will allocate a combined $94
million in 2015-16 and 2016-17 so that full per-student equity
will be achieved by 2016-17. Combined with the $50 million UC
will spend to fund overenrollment over two years, UC will have
devoted $255 million to achieve equity in state funding.
2016-17, the same amount of state resources for each of those
UC Merced, the most diverse UC campus, receives more state
resources on a per student basis than any other UC general
campus.
UC Merced, our most diverse campus, is not included in
campus receives more funding per student than any of UC’s
general campuses. Because it is also the system’s newest
campus matures and succeeds.
Display 9 shows the per-student state funding by campus
before rebenching and what that funding will be next year when
rebenching is completed.
UC allocates state funds through

UNIVERSITY OF CALIFORNIA
13
Some important state and University priorities are funded outside
their students. The University received about $3.1 billion in state
general funds in 2015-16. Examples of funds that are excluded
from the rebenching allocation include:
• Over $320 million provided for debt service for state-issued
general obligation and former state lease revenue bonds
that were transferred to UC for repayment. This debt—about
one-half of which is no longer carried by the state as it was
prior to 2013-14—funds UC’s capital programs, including new
instructional facilities such as classroom buildings.
UC uses a share of its state fund support to service this debt.
• $300 million dedicated to the base budgets of UC San Francisco
and UC Merced. In recognition of their unique situations, San
Francisco (a purely health sciences campus with no undergrad-
uate students) and Merced (a developing campus with higher
per-student funding needs) have separate formulas outside of
rebenching for determining their state allocations.
• Funds set aside for a number of programs that represent
important priorities for the state and/or UC. These include,
for example, the Agricultural Experiment Stations, HIV-AIDS
neediest students irrespective of which campus they attend.
Funding for these programs is not included in the per-student
calculation used in rebenching. Instead, funding for these
programs is provided in addition to a campus’s per-student
penalized for hosting programs that serve important state and
University goals.
0
$5,000
$10,000
$15,000
$20,000
Santa CruzSanta BarbaraSan DiegoRiversideMercedLos AngelesIrvineDavisBerkeley
Before Rebenching After Rebenching
display 9: uc's rebenching initiative will equalize state funding per students across eight campuses
outside the rebenching allocation formula.

UC ADMISSIONS, FINANCES, AND TRANSPARENCY
14
The decision to account for the resources for these important
state priorities outside of the rebenching allocation methodolo-
gy does not change the fact that these dollars are still distribut-
ed to campuses and that the majority of these funds accrue
UC’s allocation process is well documented and available
for review online.
The University of California’s Systemwide Budget Manual, which
is accessible online,9 describes how the University determines
its annual funding needs and how state funds are allocated to
campuses. It provides a detailed description of the allocation
methodology, along with the formulas used to determine a
campus’s allocation under rebenching.
The University also regularly publishes campus-level reports
of revenues and expenditures, including each campus’s total
appropriation from state funds.
•
annually in Campus Financial Schedules, which are available
-
• Campus-level trends in revenues and expenses are published
in an annual Revenue and Expense Trends report. The latest
-
are available on the University’s portal for reporting trans-
parency, which is available at http://reportingtransparency.
universityofcalifornia.edu/.
9 The current version of the Systemwide Budget Manual is available at
ucop.edu/operating-budget/budgets-and-reports/other-resources/

UNIVERSITY OF CALIFORNIA
15
UC has lowered instructional expenditures and improved
UC serves more students with fewer resources, due in part to
Smarter initiative, for example, has resulted in documented cost
savings and new revenues of over $660 million. Progress has
been made throughout the University and in every functional
area including instruction, research, academic support, student
services, medical centers, and others.
As part of the 2015-16 budget framework agreement with the
governor, UC has undertaken ambitious initiatives to operate
-
ing the number of credits within a major required to achieve
a degree, providing new pathways for students to graduate
in three years, expanding the use of data analytics to identify
students at risk academically, and increasing student enrollment
during the summer to reduce students’ time to degree.
whole, it has been due largely to the self-supporting enterprises
that provide services for a growing population of students on
with “core funds” (state funds, tuition and fees, and UC general
funds) have decreased since 2007.
the following areas:
•
increase due to increasing demand for health care services.
(97 percent), and the portion supported by state general
funds and tuition has dropped from 6 percent to 3 percent.
• Student workers account for 14 percent of the increase,
largely related to an additional 31,000 students enrolled
at UC over this period (a 15 percent increase). About half
of student workers are work-study students who work on
•
President, have increased only 5 percent. In contrast, general
campus student enrollment has grown by 15 percent (includ-
ing 7,041 additional California residents) and UC-operated
student housing has increased capacity by 37 percent.
display 10
0
10,000
20,000
30,000
40,000
50,000
60,000
70,000
80,000
General CampusStaff
Student Workers
5%
31%
21%
Health Sciences
2007 FTE Additional FTE in 2015

UC ADMISSIONS, FINANCES, AND TRANSPARENCY
16
display 11
supported by state funds
UC delivers a high-quality education with less state funding
than in the past.
Between 2007-08 and 2011-12, state support for the Univer-
sity’s budget fell by $986 million, or about 30 percent. Faced
with such a decline, the University took measures to ensure that
every eligible California student still had a place at the Univer-
sity and that a UC education remained of the highest quality.
replace a portion of the lost state funds from other sources—in-
cluding nonresident tuition paid by out-of-state students.
At the same time, the University ensured that access and quality
California undergraduates, higher in-state tuition and fees were
largely covered by additional need-based grants, including Cal
Grants. UC undergraduates received $1.2 billion more in grants
and scholarships in 2014-15 than they did in 2007-08. Similarly,
growth in nonresident enrollment occurred in addition to—not
instead of—California resident enrollment and allowed campus-
es to preserve academic programs and quality that otherwise
might have been cut.
Since 2011-12, mandatory systemwide tuition has remained
at $11,220 and the mandatory Student Services Fee remained
frozen at $972 from 2011-12 through 2014-15; it was raised by
$48 per student in 2015-16, in part to fund programs requested
-
justed dollars. In contrast, nonresident supplemental tuition
has increased from $22,878 in 2011-12 to $24,708 in 2015-16,
and will rise to $26,682 in 2016-17—which these students pay in
addition to the tuition and fees charged to California students.
Display 12 shows total charges for California resident and
nonresident undergraduates in 2011-12 and 2016-17, adjusted
students increased by $2,498.
display 12
have declined for california residents and increased for
nonresident undergraduates
0
$5,000
$10,000
$15,000
$20,000
$25,000
$30,000
$35,000
$40,000
NonresidentResident
$13,408$12,294
$36,478$38,976
2011-12 2016-17
0
10,000
20,000
30,000
40,000
50,000
20152007
State General Funds Other Core FundsTuition and Fees Non-Core Funds

UNIVERSITY OF CALIFORNIA
17
Just as the state allocates revenue from sales and use, personal
income, and corporation taxes as “general funds,” UC’s core
funds are combined and used interchangeably to support its
programs.
State funds, UC funds, and tuition—UC’s “core funds”—combine
to support UC’s commitment to provide instruction, research,
and public service. Core funds provide basic support for
instruction and other academic programs, maintaining physical
assets, providing student and cultural services that enhance
the quality of life on campuses, and supporting administrative
functions necessary to the operation of the University. Some
commentators have focused solely on one aspect of the
University’s missions, or on one fund source, in analyzing the
University’s budget. This narrow approach fails to capture the
University’s essential structure and purpose. In an operational
sense, these funds should be viewed as a whole and understood
to be critical to the support of all of UC’s missions.
An analogy for UC core funds can be drawn to the state’s general
fund, which has three primary sources of revenue: the personal
income tax, the sales and use tax, and the corporate tax, which
accrue to the state in varying amounts and proportions. These
are pooled and used to support the essential operations of the
state—from education to health and safety and other priorities,
Likewise, UC core funds have three primary sources of revenue:
tuition and fees, state general funds, and what the University
refers to as UC general funds. This latter category includes
supplemental tuition paid by nonresident students and
revenues such as cost recovery from contracts and grants
and application fees.
To continue the analogy to the state’s general fund, revenue
from income, sales, and corporate taxes all support the various
functions of state government. No state entity knows how much
it is receiving from any one of those fund sources. Yet all state
agencies, including UC, report on the amount of revenue they
receive and the expenditure of those revenues in considerable
detail. The absence of a link between a particular fund source—
for example, income tax revenue—and a particular expenditure
does not constitute a lack of transparency.
$15,000
$20,000
$25,000
2014-152009-102005-06
10 Includes revenue from state appropriations, tuition, the Student Services
Fee, professional degree supplemental tuition, and nonresident supplemental
University of California Retirement Program, and annual debt service obligations
are excluded because these resources are not available for instruction or other
purposes.
And yet, UC still has fewer available resources per student today
than it had in the past. As shown in Display 13, available revenue
per student in 2014-15 remains well below pre-recession levels.10
display 13 available funding per student
Available resources per student from state appropriations, tuition/fees, and nonresident tuition, constant 2014-15 dollars
UC ADMISSIONS, FINANCES, AND TRANSPARENCY
18
Requiring every campus department and administrative unit
to instead budget and track expenditures according to each
individual component of the University’s core funds, as some
have suggested, would result in additional and unwarranted
administrative costs at a time when the University and the state
seek to reduce—not expand—administrative overhead unrelated
to the University’s core missions, without adding materially to
transparency. Moreover, any analysis that focuses on expendi-
tures from a single component of the University’s core funds is
potentially misleading, given the reality of how the major fund
sources are blended together.
UC has a well documented track record of its commitment to
Extensive information is available to the public about UC’s
receipt and use of funds, as well as the outcomes associated with
its primary functions.
UC publishes an annual Accountability Report, the most recent
of which can be found at http://accountability.universityof-
california.edu/2015/, which provides detailed information on
topics that historically have been of interest to the public and
employment of UC graduates, among many others. UC also
is expanding content on the online UC Information Center,
found at http://www.universityofcalifornia.edu/infocenter.
The University’s annual Regents budget, which can be found
at http://ucop.edu/operating-budget/budgets-and-reports/
current-operations-budgets/, covers every major functional area
of the University’s budget, with historical trends and recent
updates highlighted in each area. Additional data about campus
expenditures posted annually on the University’s website show
granular details of how campuses spend their funds. Annual
year, UC submits and publicly posts dozens of reports requested
by the legislature.
The University of California strives to be as responsive as
possible to the public’s interest in information about its
to improve transparency and accountability.
The University’s ability to stabilize funding for its core
missions relies on achieving adequate support from all three of
its core funding sources.
The University must manage the revenue side of its budget
each year to address unavoidable cost increases needed to
estimating the amount of funding it can expect from the state
as well as estimating the amount of revenue it can generate
from its own sources, either through new revenue or savings
and cost avoidance measures. Observers sometimes suggest
to help close the budget gap each year. To close the budget gap,
UC endeavors to identify sources of revenue other than tuition,
such as additional state funding. In some years, the state is able
to provide additional funding to close the revenue gap without
tuition increases. For example, the state “bought out” projected
tuition increases in the mid-1990s for seven consecutive years
and did so again in 2006-07 and 2012-13.
fund its costs and consequently builds into its annual budget
plans an aggressive assumption about new revenue and funds
a three-legged stool, this tripartite funding structure needs
support from each component. Even with additional funds
generated through savings and new revenue, additional state
support is critical and so is support for the portion of the budget
funded from tuition and fees.
Costs increase every year at UC for items such as health
for all universities and for other state entities. For most of the
it does today. Beginning in 2011-12, tuition now funds a larger
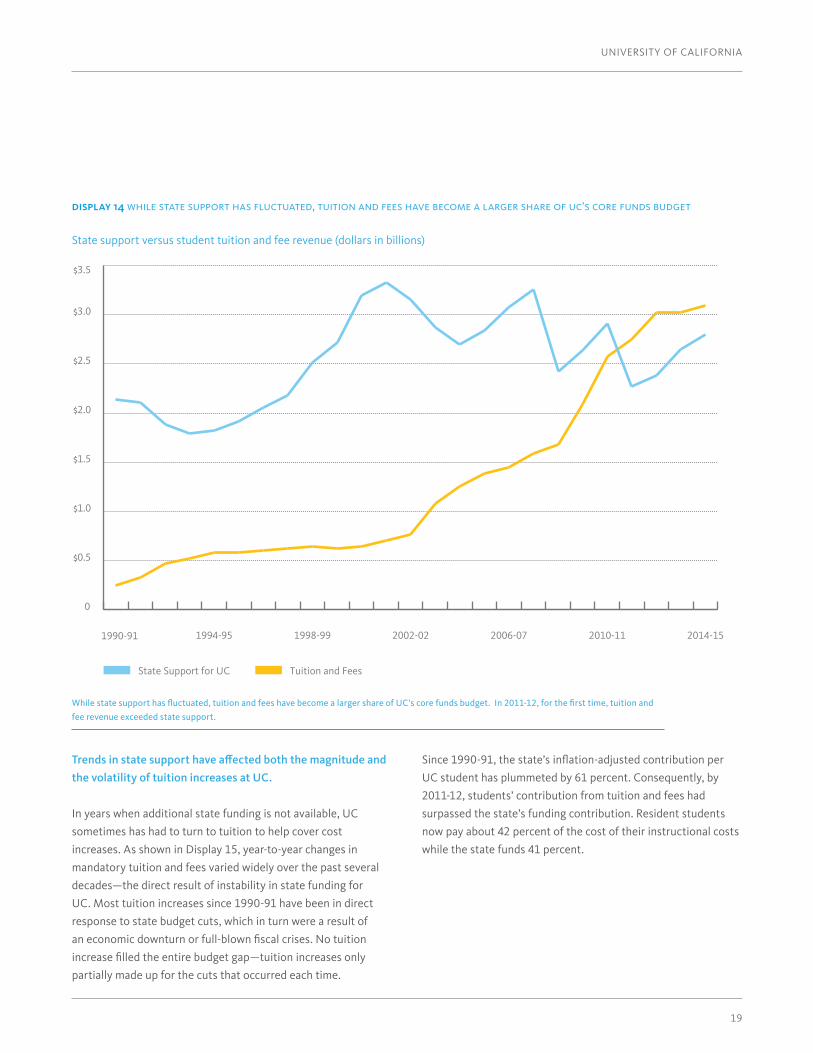
share of the core budget than state funds (see Display 14).
that is supported by tuition has no new funds to cover its cost
increases.
UNIVERSITY OF CALIFORNIA
19
fee revenue exceeded state support.
the volatility of tuition increases at UC.
In years when additional state funding is not available, UC
sometimes has had to turn to tuition to help cover cost
increases. As shown in Display 15, year-to-year changes in
mandatory tuition and fees varied widely over the past several
decades—the direct result of instability in state funding for
UC. Most tuition increases since 1990-91 have been in direct
response to state budget cuts, which in turn were a result of
partially made up for the cuts that occurred each time.
UC student has plummeted by 61 percent. Consequently, by
2011-12, students’ contribution from tuition and fees had
surpassed the state’s funding contribution. Resident students
now pay about 42 percent of the cost of their instructional costs
while the state funds 41 percent.
display 14
State support versus student tuition and fee revenue (dollars in billions)
0
$0.5
$1.0
$1.5
$2.0
$2.5
$3.0
$3.5
2014-152010-112006-072002-021998-991994-951990-91
State Support for UC Tuition and Fees

UC ADMISSIONS, FINANCES, AND TRANSPARENCY
20
-10%
0
10%
20%
30%
40%
50%
1990-95 2001-05 2008-12
State Fiscal Crisis
display 15
UNIVERSITY OF CALIFORNIA
21
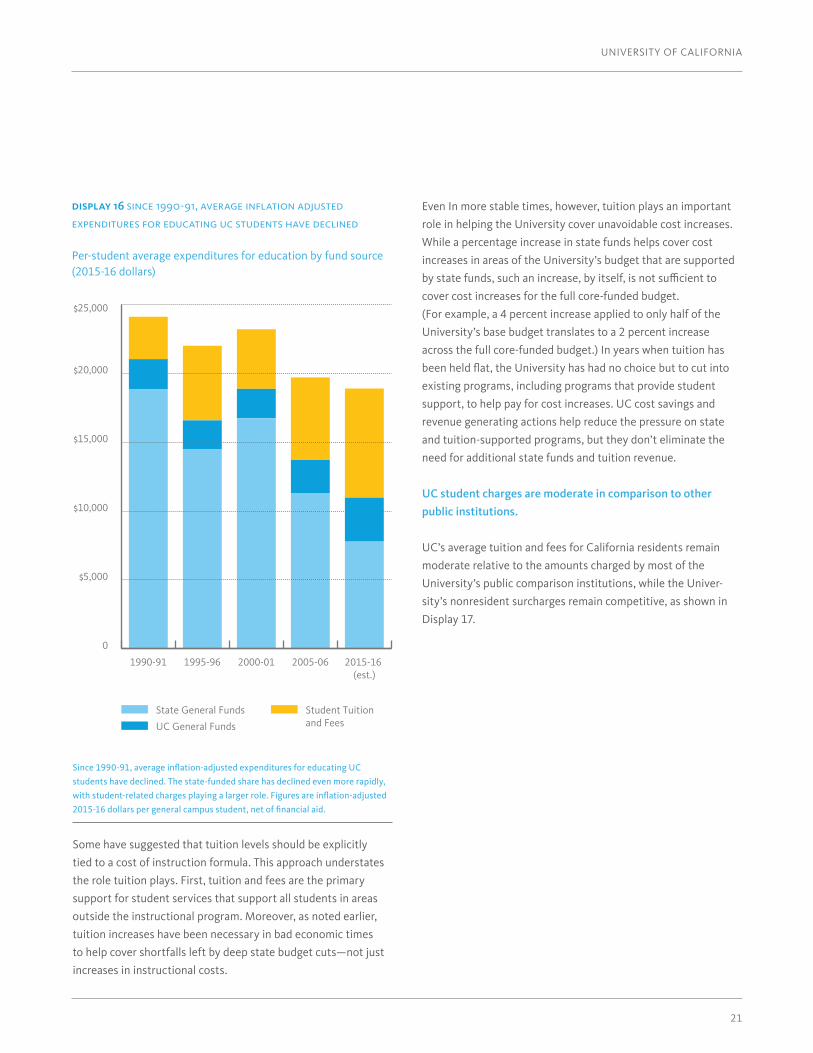
display 16
expenditures for educating uc students have declined
Per-student average expenditures for education by fund source (2015-16 dollars)
students have declined. The state-funded share has declined even more rapidly,
Some have suggested that tuition levels should be explicitly
tied to a cost of instruction formula. This approach understates
the role tuition plays. First, tuition and fees are the primary
support for student services that support all students in areas
outside the instructional program. Moreover, as noted earlier,
tuition increases have been necessary in bad economic times
to help cover shortfalls left by deep state budget cuts—not just
increases in instructional costs.
Even In more stable times, however, tuition plays an important
role in helping the University cover unavoidable cost increases.
increases in areas of the University’s budget that are supported
cover cost increases for the full core-funded budget.
(For example, a 4 percent increase applied to only half of the
University’s base budget translates to a 2 percent increase
across the full core-funded budget.) In years when tuition has
existing programs, including programs that provide student
support, to help pay for cost increases. UC cost savings and
revenue generating actions help reduce the pressure on state
and tuition-supported programs, but they don’t eliminate the
need for additional state funds and tuition revenue.
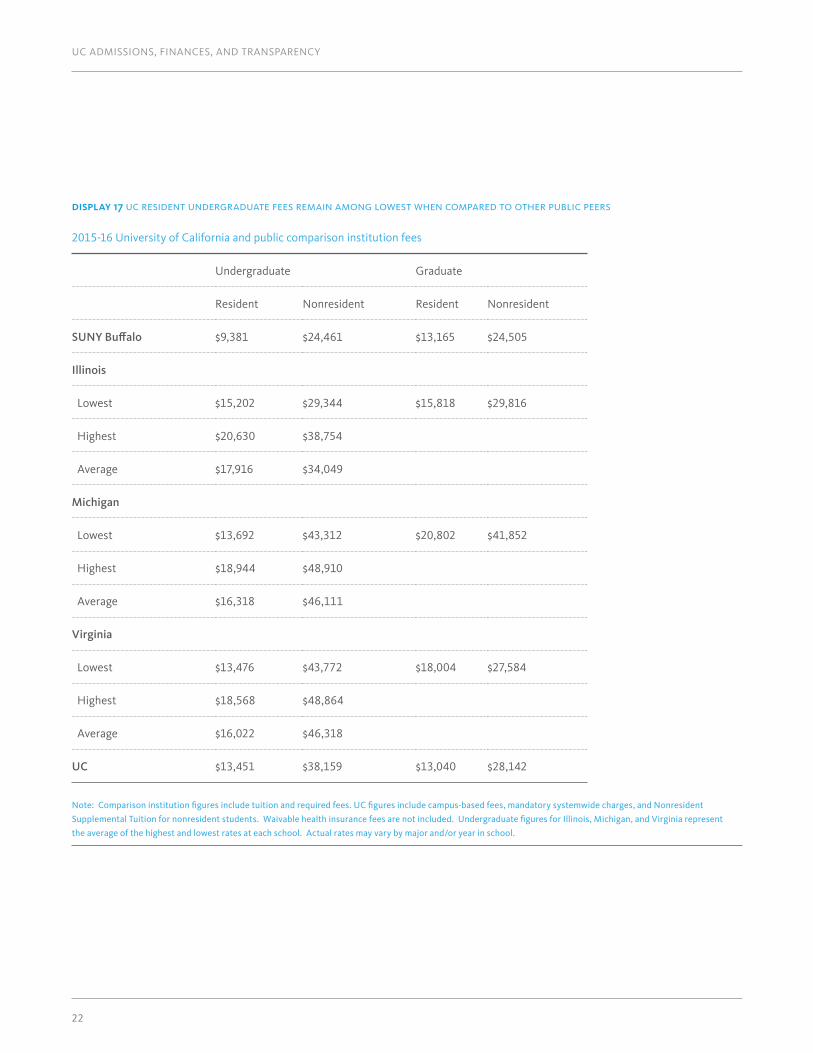
UC student charges are moderate in comparison to other
public institutions.
UC’s average tuition and fees for California residents remain
moderate relative to the amounts charged by most of the
University’s public comparison institutions, while the Univer-
sity’s nonresident surcharges remain competitive, as shown in
Display 17.
0
$5,000
$10,000
$15,000
$20,000
$25,000
2015-16 (est.)
2005-062000-011995-961990-91
State General Funds Student Tuitionand FeesUC General Funds
UC ADMISSIONS, FINANCES, AND TRANSPARENCY
22
display 17 uc resident undergraduate fees remain among lowest when compared to other public peers
the average of the highest and lowest rates at each school. Actual rates may vary by major and/or year in school.
2015-16 University of California and public comparison institution fees
Undergraduate Graduate
Resident Nonresident Resident Nonresident
$9,381 $24,461 $13,165 $24,505
Illinois
Lowest $15,202 $29,344 $15,818 $29,816
Highest $20,630 $38,754
Average $17,916 $34,049
Michigan
Lowest $13,692 $43,312 $20,802 $41,852
Highest $18,944 $48,910
Average $16,318 $46,111
Virginia
Lowest $13,476 $43,772 $18,004 $27,584
Highest $18,568 $48,864
Average $16,022 $46,318
UC $13,451 $38,159 $13,040 $28,142
UNIVERSITY OF CALIFORNIA
23
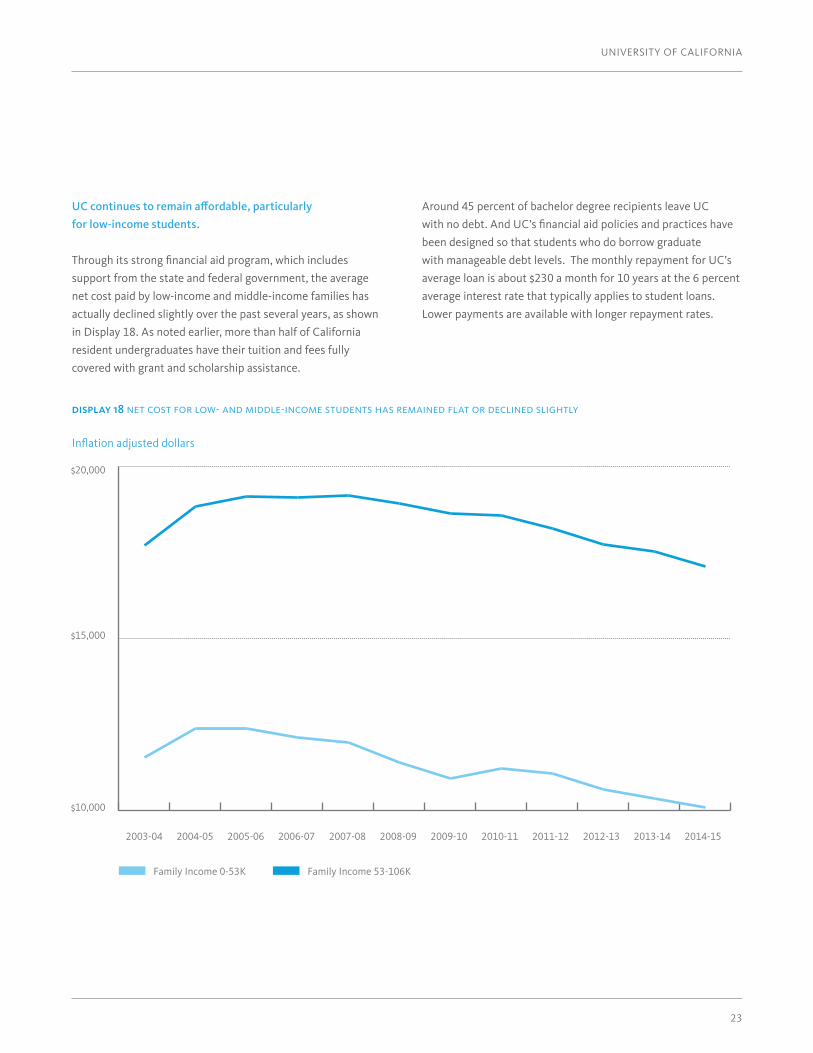
$10,000
$15,000
$20,000
2014-152013-142012-132011-122010-112009-102008-092007-082006-072005-062004-052003-04
Family Income 0-53K Family Income 53-106K
for low-income students.
support from the state and federal government, the average
net cost paid by low-income and middle-income families has
actually declined slightly over the past several years, as shown
in Display 18. As noted earlier, more than half of California
resident undergraduates have their tuition and fees fully
covered with grant and scholarship assistance.
display 18
Around 45 percent of bachelor degree recipients leave UC
been designed so that students who do borrow graduate
with manageable debt levels. The monthly repayment for UC’s
average loan is about $230 a month for 10 years at the 6 percent
average interest rate that typically applies to student loans.
Lower payments are available with longer repayment rates.

UC ADMISSIONS, FINANCES, AND TRANSPARENCY
24
display 19 uc's average indebtedness level at graduation
Average cumulative debt at graduation, 2011-12
0
$5,000
$10,000
$15,000
$20,000
$25,000
$30,000
$35,000
$40,000
Private for profit
Private 4yrnonprofit
Public 4yrUC

UNIVERSITY OF CALIFORNIA
25
Higher education contributes to economic progress and social
mobility in multiple ways. A more educated population gener-
ates more tax revenue and enjoys more rapid economic growth.
On an individual level, the correlation between higher levels of
education, lower levels of unemployment, and median earnings
is clear: individuals with a bachelor degree have higher earnings
than high school graduates or those who do not graduate.
Across majors, UC bachelor degree recipients double their
earnings within two to 10 years of graduation and go on to work
care, and technology. Some studies estimate that UC degree
recipients will earn over $1 million more in their careers than
counterparts without a degree.
it seeks to educate. UC’s record is unmatched in extending
students. Approximately 40 percent of UC undergraduates
receive Pell Grants—meaning they come from families with
income that is typically below $50,000—to help cover the cost
of their education. This proportion is far higher than at other
major research universities. Moreover, these students succeed
once they are at UC. Since 2003, UC has graduated 170,000 Pell
Grant recipients, with more than 30 percent of them in science,
percent have gone on to work in California after receiving their
low-income students earn an average income higher than their
parents’ combined incomes during the time those students
attended UC.
display 20 earnings for pell grant recipients exceed
UC is increasing diversity and enhancing socioeconomic mobility
0
2 3 4 5 6 7 8 9 10 11 12 13 14
$20,000
$40,000
$60,000
$80,000
$100,000
Median Individual Income for PellRecipients, 2-14 years after graduation
Typical Family Income for Pell Grant Recipients

UC ADMISSIONS, FINANCES, AND TRANSPARENCY
26
UC has built a strong pipeline in California to improve access
and diversity.
million per year providing academic preparation and advising
services for low-income and educationally disadvantaged
California middle and high school students. College preparation
programs serve between 50,000 and 60,000 students at around
500 California K-12 schools per year. Approximately two out of
three program participants then go on to enroll at a California
Community College, California State University, or University of
California campus.
This work covers a wide variety of activities—from supporting
schools to developing rigorous college-prep courses to providing
students with test preparation and advising. Here are some of
the programs UC operates:
• Early Academic Outreach Program (EAOP) focuses on “a-g”
course access and success and UC access for educationally
disadvantaged students.
• Mathematics, Engineering, Science Achievement (MESA)
raises the number of educationally disadvantaged students
who enter college with well-developed math and science
skills.
• The Puente Project focuses on improving college-prepara-
tory English skills with a focus on multicultural and Latino
literature.
• UC Scout provides online learning that includes inter-
net-based high school and middle school courses, Advanced
Placement courses, and information about “a-g” course
requirements.

UNIVERSITY OF CALIFORNIA
27
display 21 uc's academic preparation programs serve students across california

UC ADMISSIONS, FINANCES, AND TRANSPARENCY
28
recipients continues to increase.
UC admissions policies and processes, coupled with its robust
above, enable UC to enroll a much larger percentage of Pell
grant recipients than similar public and private institutions.
display 22
grant recipients than its comparators
2013-14 undergraduate Pell Grant recipients
UC remains accessible for students from low-income families. UC has a very high
proportion of federal Pell Grant recipients – 42 percent during 2013-14, more
than at any comparable public or private institution.
In addition, the number of undergraduates from low-income
minorities has continued to grow, as shown in Display 23.
0
10%
20%
30%
40%
Virginia
13%
Michigan
16%
Stanford
15%
USC
23%
UC
42%
50% Selected PublicFlagship Institutions
CaliforniaResearchUniversities
UC graduation rates are strong and continue to improve.
A common metric for evaluating college and university success
is the percentage of students that graduate, within four and six
years for freshman entrants and two and four years for transfer
entrants. Once students are admitted, especially students from
disadvantaged backgrounds, UC has programs that smooth
the transition from high school to college, including summer
orientation and summer bridge programs.
Once they enter UC, students succeed at ever-increasing levels.
Compared to other public school options, UC six-year graduation
rates are extremely strong, particularly for low-income students.
The four-year freshman graduation rate has improved over time
and UC is now at a high point in the four-year rate, with 64
percent of the fall 2011 cohort graduating in four years or less.
Similarly, the six-year graduation rate is at a high point, with
85 percent of the 2009 cohort graduating in six years or less.
Though a gap between Pell recipients and non-Pell students
exists at the four-year mark, it is nearly eliminated at the six-year
mark. The gap between Pell and non-Pell four-year graduation
rates has declined steadily in recent years.

UNIVERSITY OF CALIFORNIA
29
display 23
20,000
40,000
0
60,000
80,000
100,000
2010 2011 2012 2013 2014 201520092008200720062005200420032002
Undergraduate Pell Recipients, Fall Headcount
Underrepresented Minority Undergraduates, Fall Headcount
First-Generation undergraduates, Fall Headcount

UC ADMISSIONS, FINANCES, AND TRANSPARENCY
30
display 24 uc graduation rates have continued to improve over time
UC has programs and strategies in place to continue to ensure
student success.
and support timely graduation. These include rethinking course
delivery models, evaluating major coursework requirements,
expanding use of summer session courses, and leveraging
student support programs. As part of the recent framework
agreement with the governor, UC agreed to expand a series
of programmatic innovations already underway or under
development on campuses to improve student success and use
• Adaptive Learning – Three campuses are piloting ALEKS,
an “adaptive learning technology” focused on improving
student performance and persistence in chemistry and
foundational concepts in chemistry and mathematics so that
students place into a higher level chemistry or math course
for which they are better prepared, as a summer learning
opportunity in advance of undertaking a course during the
and as a learning support system during the academic term.
• Summer Session - Three campuses have established an
initiative designed to expand summer enrollment. Each
involves a pricing model incentive: a summer enrollment loan
middle-class students; a summer fee cap whereby UC
students receive for free any units taken above eight units;
40%
60%
80%
100%
'11'10'09'08'07'06'05'04'03'02'01'00
4yr Pell 4yr Non-Pell4yr All 6yr Pell
6yr All6yr Non-Pell
UNIVERSITY OF CALIFORNIA
31
and low-cost summer housing rates for continuing students
add 5,000 California residents in 2016-17, all campuses are
seeking to increase enrollment of UC students in summer
2016.
• Data Analytics – All campuses are working to better use
data and technology to identify and provide support early to
undergraduate students with a lower likelihood of complet-
ing a UC bachelor’s degree or graduating in a timely manner.
•
campuses, recently provided guidance to campuses on
advising practices that support timely graduation of students
socioeconomic cohorts of UC students. The report is also
online for anyone to access: http://ucop.edu/institutional-

UC ADMISSIONS, FINANCES, AND TRANSPARENCY
32


University of CaliforniaOffice of the President1111 Franklin StreetOakland, CA 94607-5200