Embed Size (px)
Citation preview
The story flows on: A multi‐study on the flow experience
Alma Mª Rodríguez Sánchez 2009

© Cover Design: Amparo Mora (drawing) and Mario De Libano (editing) © Alma Mª Rodríguez Sánchez, 2009. All rights reserved. No part of this publication may be reproduced or transmitted in any form or by any means, electronic or mechanical, including photocopying, recording, or any information storage and retrieval system, without prior permission from the author.
The story flows on: A multi‐study on the flow experience
Alma Mª Rodríguez Sánchez
Departamento de Psicología Evolutiva, Educativa, Social y Metodología.
26 de Mayo de 2009
Directora: Prof. Dr. Marisa Salanova Soria Co‐directores: Dr. Eva Cifre Gallego
Prof. Dr. Wilmar B. Schaufeli

The current dissertation project was funded by Bancaixa Foundation (P1.1B2004‐12)
and by the Spanish Ministry of Science and Technology (SEJ2004‐02755/PSIC).

The mountaineer does not climb in order to reach the top of the mountain, but tries to reach the summit in order to climb
(Mihaly Csikszentmihalyi, 1988)

The story flows on: A Multi‐study on the flow experience
Contents
Foreword .......................................................................................................................... 9
Chapter 1. Introduction .................................................................................................. 11
Chapter 2. Extending the Channel Model of Flow Experience among Occupations ... 31
Chapter 3. Flow Experiences among Information and Communication Technology
Users ............................................................................................................................... 59
Chapter 4. Technoflow among Spanish and Swedish students: a Confirmatory Factor
Multigroup Analysis ....................................................................................................... 75
Chapter 5. An Electronic Diary Study on Daily Flow Patterns ...................................... 93
Chapter 6. Self‐efficacy and flow at work: A virtuous circle? ..................................... 121
Chapter 7. Discussion ................................................................................................... 151
References .................................................................................................................... 171
Appendix 1. .................................................................................................................. 193
Resumen (Summary in Spanish) .................................................................................. 195
Agradecimientos (Acknowledgements) ...................................................................... 202
Curriculum Vitae .......................................................................................................... 203

9
Foreword
The current thesis began when Marisa Salanova placed a book into my hands:
‘Finding flow’ (Csikszentmihalyi, 1997). Until then, I had never heard of flow and the
positive psychology movement before. But when I discovered this experience myself, I
realised that scholars in psychology have also focused traditionally on understanding
and solving problems or pathologies in occupational contexts. But why not study the
bright side of life? Besides, flow studies applied to work settings were scarce, so the
need to understand the ‘positive’ side of occupational psychology motivated me to
take on this challenge. This ‘positive’ approach is considered to supplement the
traditional focus of psychology on disease, damage, disorder and disability. Therefore,
organisations that are interested in improving the quality of their employees’ working
life have to move forwards to amplify positive psychosocial emotions and experiences.
Concepts such as job satisfaction, organisational commitment and job engagement are
increasingly relevant to generate healthy jobs and healthy workers. Thus, the concept
of flow or optimal experience plays a role is in this context. Besides the interest in an
in‐depth study into flow as a phenomenon that needs to be clarified and to be applied
to different contexts, such as work or study, is the main research interest that
motivates the current thesis.
This thesis is a research work that has been conducted on flow in the heart of
the WoNT Research Team. Its main aim is to find good ways to improve the quality of
working life and to help build healthy organisations through accurate research and
practice. Therefore, the current thesis covers its own path to provide answers to
different questions posed in the study of flow. In addition, this path is also a learning

The story flows on: A multi‐study on the flow experience
10
path, and one that leads the author, me, to explore the slippery issue of the flow
phenomenon by means of different methods and to also experience the flow
phenomenon in this process, or story, under the guidance of Marisa Salanova, Eva
Cifre and Wilmar Schaufeli. This thesis learns from past results and also grows from the
use of one method to become another different method; that is, a thesis which also
grows in the knowledge achieved and one that continues to grow.
Chapter 1
11
Chapter 1. Introduction
“It is a feeling that I experience when I am drawing: time flies, you are alone with the sheet of paper, everything else is forgotten, the more immerse you are in the drawing itself, the more you progress in it, everything turns out better and you enjoy what you do. This often happens to me when something is complex and needs all my attention to get it right, it’s like a challenge, like something I have to prove to myself that I can do it.” (Design student)
“I was programming and I cannot describe it because it was what usually
happens when I programme, simply a matter of doing my job and time flew suddenly; 4 hours went by without my stopping” (Computer technician)
Similar quotations are the origins of the study of flow, also called optimal
experience, since Csikszentmihalyi, in the course of his doctoral research with a group
of artists (Csikszentmihalyi, 1965), observed that artists were greatly concentrated
hour after hour each day with their paintings or sculptures. They obviously enjoyed
their work immensely, and thought it was the most important thing in the world. That
is how the story begins.
The study of flow is framed into the Positive Psychology approach, that is, the
scientific study of human strength and optimal functioning (Seligman &
Csikszentmihalyi, 2000). This approach is considered to supplement the traditional
focus of psychology on disease, damage, disorder, and disability. Therefore, the study
of flow is becoming a relevant issue nowadays given the desire to improve the quality
of life among people in different domains (e.g., work, study, leisure...etc.). Although
most flow studies have focused on flow in sports, artistic activities and leisure (Jackson
& Marsh, 1996), there is little empirical evidence of flow in the work domain.
Therefore, the current thesis explores flow experience at work and also at study
The story flows on: A multi‐study on the flow experience
12
(considered as student work), specifically the flow experience structure, patterns and
antecedents, with the main aim of extending an existing model of flow.
1.1 A bit of history about the origins of flow research
As mentioned above, flow study – also known as optimal experience or
subjective experience – starts from the observations and interviews made by
Csikszentmihalyi, initially in the framework of both humanistic theories and the
interest of the study of intrinsic motivation (Csikszentmihalyi, 1988). But first in the
mid‐sixties, during the first stages of studying flow experience, the study of flow came
quite close to the studies that Abraham Maslow was developing about ‘peak
experiences’. In research, flow may usually be confounded with an extremely unusual
experience such as peak experience. However, this term has never been used by
Csikszentmihalyi, and there is plenty of evidence of differences between the two
states. Peak experience, as originally defined by Maslow is “The most wonderful
experience or experiences of your life, happiest moments, ecstatic moments, moments
of rapture” (Maslow, 1962). Peak experiences are quite rare events which arise
unexpectedly and “capture” the person regardless of her will or intention. Moreover,
few people report peak experiences in their life: in Maslow’s pioneer studies, only one
of 3000 participants described it. Otherwise, regarding flow, preliminary results from a
qualitative study (Rodríguez‐Sánchez, Salanova, Schaufeli, & Cifre, 2007) also indicate
that 98% of the participants recognised and had known this flow experience. In fact, if
we compare the findings in both peak experience and flow experience, clear
differences emerge between these two states (for a systematic discussion, see Delle
Fave, Bassi, & Massimini, in press); for instance, optimal experience, unlike peak
Chapter 1
13
experiences, is not an extreme condition, and is also far from being an unusual or rare
condition; an optimal experience can be a part of a person’s daily living.
Therefore, although flow research was clearly influenced by not only
humanistic theories, but also by the origins of the Self‐Determination Theory
(specifically in Edward Deci’s intrinsic motivation research), flow study progressed to
explore the quality of subjective experience that made a given behaviour intrinsically
rewarding. The study of subjective flow experience led Csikszentmihalyi to interview
many very different people (amateur athletes, chess masters, rock climbers, dancers,
etc.) with the aim of finding out how such people described their activity when it was
going particularly well (Csikszentmihalyi, 1988). The results of these studies constitute
the first coherent statement about flow (Csikszentmihalyi, 1975). Although the first
studies focused on arts, sports and leisure activities, flow may also occur at work since
flow was quite similar between play and work settings (Nakamura & Csikszentmihalyi,
2002). However, research into flow in the work context is lacking.
1.2 Flow definition
During the interviews, people described experiences in their activities that
made them feel good and motivated because they were doing something that was
worth doing for its own sake. Csikszentmihalyi named this experience ‘flow’ because
many respondents used it in the interviews to explain what the optimal experience felt
like (Csikszentmihalyi, 1988). But, what is flow? How can it be defined? Indeed it seems
that although one can recognise and describe flow easily, flow is difficult to define and
perhaps even more difficult to operationalise.
The story flows on: A multi‐study on the flow experience
14
Therefore, different definitions of flow can be found in the literature (for an
extended review of these definitions, see the work of Novak & Hoffman, 1997), and
Csikszentmihalyi defined it in 1997 as: “The holistic sensation that people feel when
they act with total involvement” (Csikszentmihalyi 1997, p.36). Thus, flow is a
condition in which people are so involved in an activity that nothing else seems to
matter at the time, and the experience is so enjoyable that people will do it even at
great cost for the sheer sake of doing it (Csikszentmihalyi, 1990). It is “a state that is
characterized by enjoyable feelings, concentration, immersion, and intensive
involvement” (Chen, 2006; p. 222). In fact, flow would occur when there is a balance
between high level of challenges and high level of skills (Csikszentmihalyi &
Csikszentmihalyi, 1998). If we specifically focus on the first of Csikszentmihalyi’s
studies (1975), he considered flow experience to be the situation where challenges
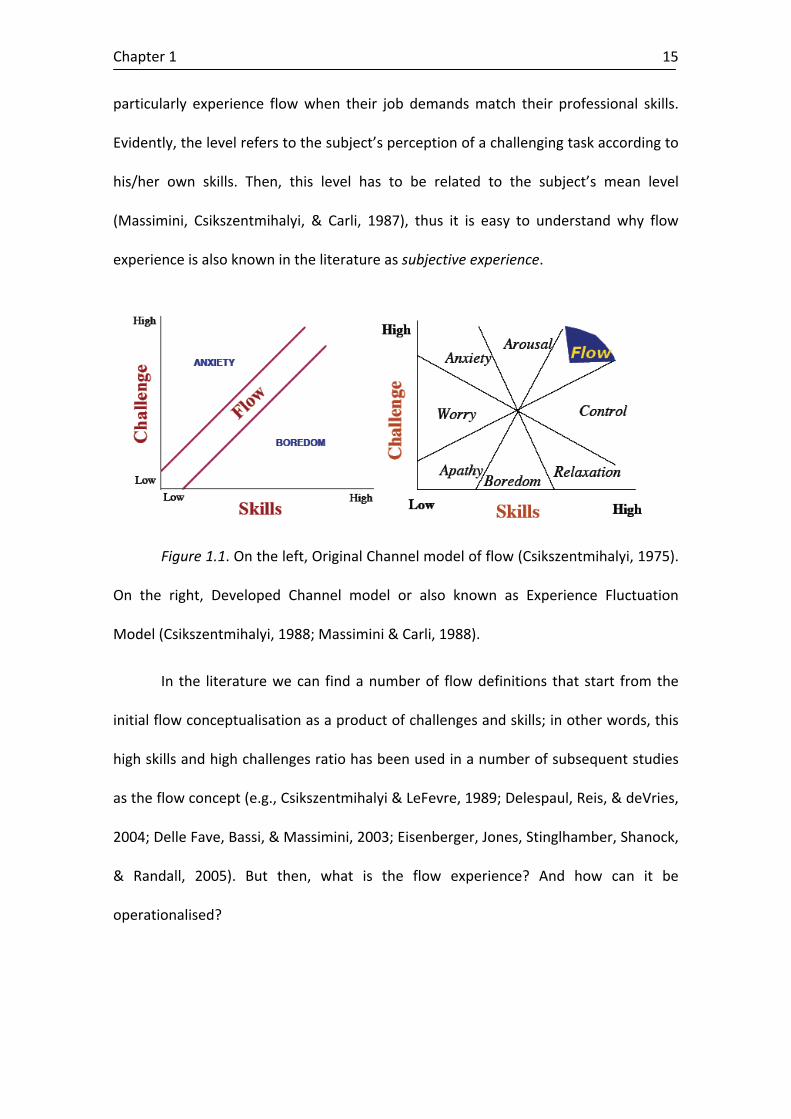
match person’s skills. Csikszentmihalyi formed a model based on this challenge‐skills
ratio coined the ‘channel model of flow’ (see Figure 1.1). This model was later
developed and analytically described by Massimini and Carli (1988). In subsequent
studies, the channel model was tested, and Csikszentmihalyi (1988) point out that to
experience flow, challenges and skills must not only be in balance, but must also
exceed levels in a way that one must increase the complexity of the activity by
developing new skills and taking on new challenges. Then, when both challenges and
skills are high, the flow experience is likely to arise (Delle Fave & Bassi, 2000). In other
words, “when both challenges and skills are high, the person is not only enjoying the
moment, but is also stretching his or her capabilities with the likelihood of learning
new skills and of increasing self‐esteem and personal complexity” (Csikszentmihalyi &
LeFevre, 1989, p. 816). Applied to the work domain, this means that employees should
Chapter 1
15
particularly experience flow when their job demands match their professional skills.
Evidently, the level refers to the subject’s perception of a challenging task according to
his/her own skills. Then, this level has to be related to the subject’s mean level
(Massimini, Csikszentmihalyi, & Carli, 1987), thus it is easy to understand why flow
experience is also known in the literature as subjective experience.
Figure 1.1. On the left, Original Channel model of flow (Csikszentmihalyi, 1975).
On the right, Developed Channel model or also known as Experience Fluctuation
Model (Csikszentmihalyi, 1988; Massimini & Carli, 1988).
In the literature we can find a number of flow definitions that start from the
initial flow conceptualisation as a product of challenges and skills; in other words, this
high skills and high challenges ratio has been used in a number of subsequent studies
as the flow concept (e.g., Csikszentmihalyi & LeFevre, 1989; Delespaul, Reis, & deVries,
2004; Delle Fave, Bassi, & Massimini, 2003; Eisenberger, Jones, Stinglhamber, Shanock,
& Randall, 2005). But then, what is the flow experience? And how can it be
operationalised?
The story flows on: A multi‐study on the flow experience
16
1.3 Flow operationalisation
Besides challenges and skills, Csikszentmihalyi also defined flow in a more
descriptive way in his studies. Thus, when a person’s skill is just right to cope with the
demands of a situation, the quality of the flow experience improves noticeably
(Csikszentmihalyi, 1988). The quality of experience is characterised by: 1) clear goals,
2) immediate and unambiguous feedback, 3) personal skills well suited to given
challenges, 4) ‘merger of action and awareness’ (i.e., the person focuses so much on
the activity that it leads to a state of harmony between the activity and the self), 5)
concentration on the task at hand, 6) a sense of potential control, 7) ‘a loss of self‐
consciousness’ (i.e., the self is fully functioning, but not aware of doing it), 8) an
altered sense of time and 9) experience which becomes autotelic (i.e., intrinsically
rewarding) (Csikszentmihalyi, 1975, 1988, 1990, 1997). In other words, flow, when
applied to the work or the study domain, may be described in terms of the employee
having a clear goal to achieve, for instance, to finish a financial report. Besides, this
employee is receiving clear feedback about how he/she is doing the task. For instance,
he/she realises that the budget is correct and that the operations tally. Furthermore,
he/she perceives the task as challenging as he/she has to tally all the operations and
financial data, but he/she also has enough skills to overcome this challenging task.
During the task, the employee is totally focused and concentrated since it is important
not to lose track of the task in order to do it correctly. Therefore the employee loses
his/her sense of time and can spend hours doing the financial report and, indeed, this
activity is intrinsically rewarding for the employee. But does this evaluation occur
before, after or during the activity?
Chapter 1
17
The problem of Csikszentmihalyi’s description of flow is that it does not specify
the way in which each dimension or characteristic works in the flow experience or in
which order they come into play. That is, the variables making up the very flow
experience. Then there is the matter of what flow experience is beyond its
prerequisites, which remains a tricky question to be solved.
A number of authors have based their work on Csikszentmihalyi’s model of nine
characteristics to present a clear and practical flow operationalisation. For instance,
Chen, Wigand and Nilan (1999) classify Csikszentmihalyi’s model of nine dimensions
into three levels: antecedents, experience, and affects or emotions. This differentiation
has been empirically validated by Chen et al. (2000). Their results identify clear goals,
immediate feedback, potential control, and the merger of action and awareness as
antecedents or prerequisites of flow. However, the flow experience itself is made up of
concentration, loss of self‐consciousness and time distortion. Finally, the
consequences of flow were positive affects and autotelic experience. This distinction
has also been supported by Nakamura and Csikszentmihalyi (2002) in a more clarifying
chapter on flow in the Handbook of Positive Psychology. They argue that high
perceived skills, that are well matched with high challenges, clear goals and immediate
feedback, are all necessary prerequisites to experience flow. It is worth noting that
very recent research also relates the concept of efficacy beliefs as an important
antecedent that can enhance flow experience (Bassi, Steca, Delle Fave, & Caprara,
2007; Salanova, Bakker, & Llorens, 2006).
Therefore, what are the core components of flow experience beyond its
prerequisites and consequences? And how can flow experience be measured? In order
The story flows on: A multi‐study on the flow experience
18
to assess flow, it is important to firstly find a clear operationalisation of the variables
that comprise flow experience. After a careful review of the literature, it seems that all
the different flow experience definitions have three common elements. The first refers
to a sense of involvement, total concentration, focused attention or loss of self‐
consciousness, in other words, being entirely engrossed in the activity at hand, that is,
what we call absorption (Chen, 2006; Csikszentmihalyi, 1997; Ghani & Deshpande,
1994; Lutz & Guiry, 1994; Moneta & Csikszentmihalyi, 1996; Novak & Hoffman, 1997;
Trevino & Webster, 1992). Absorption implies a cognitive state of deep concentration.
A second common element involves positive feelings of enjoyment that are associated
with the activity (Clarke & Haworth, 1994; Ghani & Deshpande, 1994; Moneta &
Csikszentmihalyi, 1996; Novak & Hoffman, 1997). Enjoyment refers to an affective
component of flow experience. The last element refers to the interest in performing
the activity for its own sake rather than for an extrinsic reason, that is, intrinsic interest
(Moneta & Csikszentmihalyi 1996; Novak & Hoffman, 1997; Trevino & Webster, 1992).
This last element is obviously related to a motivational aspect of flow experience.
Then, in line with an examination of previous research, we state that the
following three components (absorption, enjoyment and intrinsic interest) are the
main constituents of flow experience. These three elements, found in the literature,
also match recent research that agrees on the cognitive, motivational and emotional
components of optimal experience (Bassi et al., 2007; Delle Fave & Massimini 2004;
Delle Fave & Massimini 2005b; Jackson & Csikszentmihalyi 1999). In accordance with
Chen’s definition of flow (2006), Delle Fave and Massimini (2005b) also highlighted
that the core and stable structure of optimal experience mostly comprises the
cognitive component (i.e., absorption or deep engrossment) which did not show
Chapter 1
19
remarkable changes across samples and activities, although affective and motivational
variables varied widely in intensity across activities. Previous studies of flow at work
also support this three factorial operationalisation (Bakker, 2005; Demerouti, 2006;
Salanova et al., 2007).
It is noteworthy that the difficulty to measure and to ‘capture’ optimal
experience makes the explanation of its components even more difficult. That is why
flow experience operationalisation is still a topic of discussion because, specifically,
three major issues need to be solved. Firstly, since flow is a state or momentary
experience, when measuring it, the involved person automatically leaves out state of
flow. Therefore flow is assessed outside flow which leads to a retrospective bias.
Secondly, given its short‐lived nature, when asking people how they feel when
experiencing flow, they immediately agree about concentration and forgetting
everything around them. But what about enjoyment? Is enjoyment part of or a result
of flow experience? Interviewees also report enjoyment, but it might be biased by the
affective evaluation after the experience. Then it is logic to think that when being
completely absorbed by the activity one is engaged in – for instance, doing a
presentation with PowerPoint – it is impossible to concentrate on one’s own inner
feelings because all one’s attention is focussed on the activity at hand. But surely the
person was enjoying him/herself while creating slides for his/her presentation. Finally,
the same question arises for intrinsic interest: during flow experience while doing an
activity (e.g., writing a report), is intrinsic interest part of or an antecedent of flow
experience? On the one hand, the task is intrinsically motivating and the person is
carrying it out with great interest because that person wants to continue doing the
activity and to experience flow (intrinsic interest as a consequence). But on the other
The story flows on: A multi‐study on the flow experience
20
hand, it can also be argued that the person firstly perceives the task as intrinsically
interesting, and then experiences flow (intrinsic interest as an antecedent). However
these three major issues are not addressed in the literature in such detail, so the
current thesis attempts to answer all these questions about flow experience
operationalisation itself.
In short, finding a unified and clear flow definition and operationalisation is,
nowadays, a challenge in the study of optimal experience. In fact, research into what
the core of flow is today is a ‘hot spot’ in the study of flow. In order to overcome this
challenge, the way that scholars interested in this topic measure the flow
phenomenon is of special relevance, especially since the methodology employed has
to be highly efficient to capture this tricky phenomenon. Besides, one can argue that
flow operationalisation may differ depending on the measure used. In other words, it
is likely that information on what flow experience is may differ whether we ask the
individual to describe one experience of flow (i.e., qualitative data through interviews),
or if we ask him/her to fill out a questionnaire (measuring the frequency and intensity
of several flow‐related items) once or several times a day (i.e., study diary). Therefore,
it is advisable to use different techniques and methods to measure flow. In the current
thesis, an overview of the main methods will be used to study flow at work and also in
the use of technology context.
1.4 Measuring Flow
Then what is the best way to ‘capture’ flow? Initially, the study of flow
emerged from qualitative interviews about the nature of this optimal experience when
a particular activity was going well (Csikszentmihalyi, 1975, 2000). This qualitative
method was, and still is, a relevant tool for initial research works into these kinds of
Chapter 1
21
phenomena and experiences, such as flow, especially when the intention is to identify
and find rich descriptions of flow experience. For instance, descriptions of flow in
athletes (Jackson, 1995) or in writers (Perry, 1995) enabled the characteristics of this
flow state and the factors that help to experience flow to be known (Nakamura &
Csikszentmihalyi, 2002). Although this approach provides initial information, it is not
useful to ‘measure’ flow; for instance, to know the frequency of flow experiences, the
differences in its occurrence across contexts or individuals, or for examining whether
there are differences in the frequency of flow between different kinds of occupations.
One step forward in the study of flow has been the use of paper‐and‐pencil
questionnaires. Some of the information that appears in such questionnaires can be
obtained from initial interviews, such as the Flow State Scale (Jackson & Marsh, 1996),
which assesses Csikszentmihalyi’s model of nine dimensions (e.g., clear goals,
immediate feedback, high skills matching high challenges, merger of action and
awareness, concentration, control, loss of self‐consciousness, altered sense of time,
and autotelic experience) in the sport context. However with empirical research into
flow at work – and also in study contexts‐ most of the research done on flow usually
has measured it in terms of a combined product of high challenges and high skills
(Csikszentmihalyi & LeFevre, 1989; Delespaul et al., 2004; Delle Fave et al., 2003;
Eisenberger et al., 2005). Thus, empirical studies that assess flow experience using a
measure that, from our point of view, ‘captures’ the core components of flow
experience beyond its prerequisites (challenges and skills) are lacking.
Therefore to assess the frequency of flow experiences at work, at study and
also at work using technology, we developed a questionnaire based on the WOLF
Inventory (WOrk‐reLated Flow Inventory, Bakker, 2008), a recent questionnaire used
The story flows on: A multi‐study on the flow experience
22
in the work context to assess the three flow experience components (absorption, work
enjoyment and intrinsic work motivation) which is based on previous research (e.g.,
Bassi et al., 2007; Delle Fave & Massimini 2004). Items in the WOLF scales are
formulated in general terms; for instance, an example of an item that assesses
absorption is ‘I get carried away by my work’. Then we adapted the items using a
specific measure of flow for the activity at hand; for instance, we developed the
following item in the context of work with technology: ‘Time flies when I’m working
with technologies’. So, the novelty and strength of the current thesis is the way we
consider flow experience. Items refer to flow as being a momentary experience
related with a specific activity rather than a general behaviour during work. Likewise,
we also rather preferred to measure intrinsic interest than intrinsic motivation because
motivation implies a long‐term process rather than a momentary one attached to the
activity that is interesting. Using questionnaires offers some benefits that interviews
cannot, such as providing quantitative information, for instance, about the frequency
of flow occurrence, as well as comparing results across different contexts or
individuals. Finally, they are easy to hand out and to use in large number of different
settings. All these benefits favour the use of questionnaires as a main tool of flow
assessment, and as part of the challenge to build a valid and reliable tool to measure
flow, specifically in work and student settings, which are the main aim and
contribution of this thesis.
1.5 Measuring daily flow
Questionnaires provide valuable data. However, the weaknesses of interviews
and questionnaires lie in their reliance on the retrospective reconstruction of past
experience. Firstly, respondents have to average across many discrete experiences to
Chapter 1
23
build a picture of the typical flow experience, and then estimate the frequency and/or
the intensity of this experience (Nakamura & Csikszentmihalyi, 2002). So what is the
best way to assess flow experience? And also it would be a major goal for the current
thesis to answer the question of how flow works during the day. Therefore, to
overcome such problems, and to explore flow during the day, researchers have
developed a tool called the Experience Sampling Method (ESM) (Csikszentmihalyi,
Larson, & Prescott, 1977; Csikszentmihalyi & Larson, 1987). This diary method consists
in providing respondents with an electronic pager and a questionnaire booklet to be
used during a week. The pager randomly signals seven or eight times a day, and then
respondents fill out one sheet of the booklet. The information collected in one week
refer to activities performed by respondents, personal experiences and, traditionally,
the levels of challenges and skills. The use of this method in the study of flow is of
special relevance since researchers not only have information about inter‐person
variations in the experience, but also about intra‐person differences, which is of
interest in the current thesis given the need to understand flow patterns and dynamics
not only in a specific context (i.e., work), but also in others (i.e., leisure). But once
again, the question of how flow can be measured and operationalised, even using a
diary study or ESM, remains unsolved. In fact, in the first daily studies on flow (e.g.,
Csikszentmihalyi & Larson, 1987), the issue about how flow can be measured was
approached. For instance, it could be argued that the intensity of response on the
happy‐sad scale or the amount of concentration reported would make a good intensity
of flow index. Instead, Csikszentmihalyi and colleagues decided to take the challenges
and skills ratio as a flow measure (Csikszentmihalyi & Csikszentmihalyi, 1988). Then,
how can flow in everyday life be measured? In terms of goals or prerequisites
The story flows on: A multi‐study on the flow experience
24
(challenges and skills), or in terms of emotions or experiences (that is, the core
components of flow) lived at that time? In the current thesis, we chose to use an
alternative way to traditional studies to explore flow patterns during work and non‐
work activities (e.g., Csikszentmihalyi & LeFevre, 1989). Furthermore, the traditional
study of flow in everyday life has been characterised by the flow (measured in terms of
challenges and skills) that is attached to a specific activity. In other words, most of the
studies relate flow experiences during the day with particular activities, such as
studying, doing homework, socialising, arts and hobbies (e.g., Carli, Delle Fave, &
Massimini, 1988; Massimini & Carli, 1988). Since research into the dynamics of daily
fluctuations of flow experiences is scarce, other questions emerge and need to be
solved: how does flow fluctuate during the day. Does flow experience show a daily
pattern? Is this pattern related to the hour of the day or to the day of the week? In
other words, the current thesis aims to explore daily patterns of flow by studying the
core components of flow experience beyond its prerequisites (challenges and skills).
Therefore, the interest in measuring flow and in exploring its daily patterns led us to
use the electronic diary study as an appropriate tool to assess daily patterns of flow.
1.6 Flow antecedents
Nakamura and Csikszentmihalyi (2002) argued that high perceived skills well
matched high challenges, clear goals and immediate feedback, which are necessary
prerequisites to experience flow. However, there is no empirical evidence to validate
how these factors can foster flow experiences at work. Again, only the challenges and
skills ratio has been employed as flow antecedents at work (e.g., Eisenberger et al.,
2005). Besides, antecedents are usually confounded with flow experience itself.
Chapter 1
25
Therefore, if flow experience is mixed with challenges and skills as antecedents, how
can flow antecedents be studied?
Given the lack of empirical research into flow antecedents at work, in this
thesis we accept the challenge of exploring which factors boost flow experiences at
work beyond challenges and skills by starting out with the following idea: what makes
a person perceive a task as challenging? The answer lies in self‐efficacy beliefs.
According to the Social Cognitive Theory (Bandura, 1997, 2001), self‐efficacy is
defined as: “…beliefs in one’s capabilities to organise and execute the courses of action
required to produce given attainments” (Bandura, 1997, p. 3). Whatever other factors
serve as guides and motivators, they are rooted in the core belief that one has the
power to produce desired effects by one’s actions; otherwise, one has little incentive
to act or to persevere in the face of difficulties. In this way, it relates well to the idea
that self‐efficacy could influence the way people perceive challenges according to their
skills. Therefore, self‐efficacy may be taken into account as an antecedent of flow
experience. Along the same lines, Wigfield and Eccles (2001) also found that students
in the schooling context do not necessarily value challenging tasks optimally, rather
tasks in which they believe they can succeed. Furthermore, the key role that self‐
efficacy beliefs play in the occurrence of optimal experiences has been tested by Bassi
et al. (2007) in academic settings. Specifically, they found that students with high self‐
efficacy beliefs spend more time learning activities than those with low self‐efficacy.
Besides, they experience more flow in learning activities than low self‐efficacy
students. However, Bassi et al. (2007) employed the traditional ratio of challenges and
skills as a measure of flow. Hence in the current thesis, we take the challenge of
The story flows on: A multi‐study on the flow experience
26
exploring self‐efficacy as an antecedent of flow – measured in terms of absorption,
enjoyment and intrinsic interest – given the lack of research on flow at work that
meets this issue. Only the study of Salanova et al. (2006) approaches the issue that
efficacy beliefs have to be taken into account as antecedents of flow experience. They
provided empirical evidence that supports the idea that personal resources (e.g., self‐
efficacy beliefs) have a positive influence on the occurrence of flow among teachers
over time. Briefly, more research is needed to be able to provide the still hidden
answers to research questions about flow antecedents at work.
1.7 Specific research aims: The thesis chapters plan
As already shown, the flow study presents certain difficulties, or better still,
challenges. Firstly, the fact that flow is a phenomenon, that is, of a momentary nature
as an experience, does not allow researchers to measure it easily. In relation to this, a
second relevant challenge to be overcome is that the study of flow has never been
based on a solid theory. Therefore many critiques who review a submitted paper on
flow state that there is a lack of theoretical support or theoretical framework. Feldman
(2004) shed some light on this by stating that “…There should be room in our field for
both theory‐driven and phenomenon‐driven research; papers that push the envelope
in theory but are disconnected from real world phenomena are no more valuable than
papers that use a hodge‐podge of theories to explain an important real world
phenomenon…” (Feldman, 2004, p. 566). These challenges also form part of the
common critiques that the positive psychology movement receives in terms of its
sometimes poor/weak measures, lack of longitudinal studies, lack of integration of the
two perspectives (‘positive’ and ‘negative’), among others (see Lazarus 2003 for a
review).
Chapter 1
27
In order to overcome these main challenges in flow study, in this thesis we will
study the flow phenomenon from different approaches and with different
methodologies using several samples in various work and study contexts. Therefore
this thesis will not only be an attempt to describe a phenomenon, but will also
measure it with different methods and approaches in order to shed some light on the
study of such a ephemeral and subjective state that flow experience is. In that sense,
specific research aims are developed in the various chapters that compose the current
thesis. Each chapter represents a step forward on the path to clarify flow experience.
Therefore, this thesis explores flow experience at work, specifically the structure,
patterns and antecedents of flow experience, for the main purpose of extending an
existing model of flow.
The first step is to explore the traditional challenges and skills ratio – ‘channel
model of flow’ (Csikszentmihalyi, 1975; 1988) – between two different occupations,
and to combine this model with an alternative flow operationalisation based on
previous flow studies at work (Bakker, 2005; Demerouti, 2006; Salanova et al., 2007).
Specifically in Chapter 2, we assume that workers who perceive that their jobs present
high challenge and high skills will experience flow more frequently than others who
perceive an imbalance between the levels of challenge and skills. Furthermore, we
expect significant differences in the frequency of flow experience (i.e., enjoyment,
intrinsic interest and absorption) among the workers of two different occupations (i.e.,
tile workers and secondary school teachers). More specifically, we expect that
secondary school teachers will experience flow more frequently than tile workers.
The next step consists in the flow experience operationalisation, and
commences with the previous work presented in Chapter 2 where we use an adapted
The story flows on: A multi‐study on the flow experience
28
version of the WOLF scale (WOLF; Bakker, 2001; 2008) to measure flow. In Chapter 3,
we use a self‐constructed specific scale of flow for Information and Communication
Technology (ICT) users to confirm the three dimensional construct of flow (i.e.,
absorption, enjoyment and intrinsic interest) among ICT users (students and workers
who use ICT in their daily working/studying activities) since the use of ICT is apparently
a setting that facilitates the occurrence of flow experiences (Finneran & Zhang, 2003;
Ghani & Deshpande 1994; Trevino & Webster 1992). However, the growing interest in
the study of flow experience operationalisation leads us to consider, in Chapter 4, an
in‐depth explanation of the core components of flow experience while using
technology, which we coin technoflow. In Chapter 4, we explore the elements that
make up the very flow experience while using ICT (technoflow) in two samples of
students who employ ICT in their daily studying tasks. Indeed, we explore the structure
of technoflow among Spanish and Swedish students.
Given the aim of the current thesis to explore the daily flow patterns among
work and non‐work tasks, a challenging method, which the electronic diary study or
ESM is, is employed in Chapter 5. Since this method is a useful tool to analyse flow
experience, we explore the daily flow patterns using an alternative way of flow
operationalisation (absorption and enjoyment) based on previous studies. Besides, we
explore daily flow patterns beyond the prerequisites of flow (traditionally, challenges
and skills), and we explore it in two different samples: healthy and burned‐out
individuals. This also involves an additional feature of the current study and thesis
because flow patterns is not only studied in healthy individuals (a traditional
approach), but also in a contrast group like burned‐out individuals. Furthermore, the
methodology introduces three main novelties: 1) the use of an alternative
Chapter 1
29
operationalisation of flow experience (absorption and enjoyment) beyond its
prerequisites; 2) the use of an electronic device (Palm One) to collect the diary data,
and 3) the period that participants have this diary is increased to two weeks (to
increase the reliability of the method).
As regards flow study antecedents, in Chapter 6 we present a longitudinal
study done among teachers whose basic aim is to explore the role of self‐efficacy
beliefs as an antecedent of flow experience at work. Specifically, the main objective of
this study is to extend Csikszentmihalyi’s ‘channel model’ (1975) by including self‐
efficacy as a predictor and antecedent of the combination of challenges and skills, and
flow experience itself. This study represents a step beyond the research on flow
because once the flow core components are known, it is necessary to look towards
the facilitators or the prerequisites of optimal experience, and to look beyond the
challenges and skills combination. In that sense, the link between efficacy beliefs and
flow experience represents a future direction in optimal experience research.
Finally Chapter 7 is a summary of the main findings of this thesis. In this final
chapter, the steps taken to clarify flow experiences theoretically, the different
methods used, and the strengths and weaknesses of the current thesis are discussed.

The story flows on: A multi‐study on the flow experience
30
Chapter 2
31
Chapter 2. Extending the Channel Model of Flow Experience among Occupations1 Summary
This study has two objectives: 1) to extent the Csikszentmihalyi’s (1975)
‘channel model’ of where flow is experienced more frequently in jobs with high levels
of challenge and high levels of perceived skills; 2) to analyze whether there are
significant differences in the frequency of flow experiences among different
occupations. A retrospective analysis of flow was performed among 957 workers of
private and public organizations (i.e., tile workers and secondary school teachers).
Results confirmed the channel model predictions. People working in jobs characterized
by high levels of challenge and high levels of skills experienced flow more frequently
than people who did not. Results also showed significant differences in the frequency
of flow experience between occupations.
Introduction
Nowadays, interest in health and quality of life at work is a reality in many work
organizations, and research on human strength and optimal functioning has aroused
attention in modern organizations. In this sense, Positive Psychology, considered a
supplement to the traditional focus on psychology on disease, damage, disorder and
disability, has gained more adepts. Based on this positive focus, organizations are
interested in optimizing positive psychosocial emotions and experiences. Concepts
such as job satisfaction, organizational commitment, and job engagement are
increasingly relevant to generate healthy jobs and healthy workers.
1 Chapter 2 has been submitted for publication as: Llorens, S., Salanova, M., & Rodríguez‐Sánchez, A.M. Extending the Channel Model of Flow Experience among Occupations.
The story flows on: A multi‐study on the flow experience
32
One of these positive phenomena receiving more attention in work settings is
‘flow’. The concept of flow has aroused the interest of a growing number of
researchers since Csikszentmihalyi began talking about it and explaining the
phenomena in different papers and books (e.g., Csikszentmihalyi, 1975, 1990, 1997,
2003). He interviewed artists, athletes, composers, dancers, scientists, and so on, so
they could describe the experiences in their activities that made them feel good and
motivated because they were doing something worthwhile for its own sake.
Despite the fact that the first studies on flow were carried out in people who
practised sport, or who did any activity characterized by creativity or enjoyment,
researchers formed a picture of the general characteristics of optimal experience and
its proximal conditions. This research found that flow was reported by people from
different cultures, socio‐economic status, ages and levels of educational in association
with daily activities (Delle Fave & Massimini, 2005a). In a similar way, the results of this
optimal experience show that flow is quite similar between entertainment and work
settings (Nakamura & Csikszentmihalyi, 2002) and study contexts (Delle Fave & Bassi,
2000).
The present study focuses on flow experience in the workplace. Specifically, it
has been conducted among two types of workers: people working with ‘things’ (i.e.,
tile workers) and people working with ‘people’ (i.e., secondary school teachers). This
study extends the ‘channel model’ proposed by Csikszentmihalyi (1975). Furthermore,
whether there are significant differences in the frequency of flow experience among
different occupations (i.e., tile workers and secondary school teachers) is also tested.
Flow experiences at work
Chapter 2
33
Within the framework of Positive Psychology, the flow concept has been
studied in recent decades. Positive Psychology has only been defined as the scientific
study of human strengths and virtues (Sheldon, & King, 2001). Thus, by applying
Positive Psychology to work contexts, the Positive Organizational Psychology (POP)
arises which is defined as “the scientific study of optimal functioning of people and
teams on organizations, besides their effective management”. So, the aim of POP is
“to describe, explain and predict the optimal functioning in those contexts (work and
organizations), thus, to optimize and boost the quality of working life” (Salanova,
Martínez, & Llorens, 2005a, p. 353‐354).
In this framework, Csikszentmihalyi (1975, p.29) has defined flow as a positive
experience that “tends to occur when a person’s skills are fully involved in overcoming
a challenge that is just about manageable. Optimal experiences usually involve a fine
balance between one’s ability to act and the available opportunities for action”
(Csikszentmihalyi, 1997, p. 30).
Thus, following this definition and previous studies, it is important to note four
important features: (1) flow is not a ‘peak’ or extreme experience, but is very common
in daily living (in this case, in work settings), (2) it is determined by the combination of
perceived challenge and skills, (3) any person doing whatever activity, even at work,
can experience flow provided that the above‐mentioned conditions are present and (4)
the quality of this optimal experience changes according to the associated activities
that people do (Delle Fave & Massimini, 2005b).
Although flow operationalisation is still a topic of discussion, recent research
agrees on the cognitive, motivational and emotional components of optimal
experience (for example, Bassi, Steca, Delle Fave, & Caprara, 2007; Delle Fave &
The story flows on: A multi‐study on the flow experience
34
Massimini, 2004 and 2005b; Jackson & Csikszentmihalyi 1999). Based on this, different
scholars show that people who experience flow are engrossed in an activity. This
involvement at work is so deep that nothing else seems to matter at the time. In
addition to the pleasure derived from the activity and the intrinsic interest to continue
doing it, the total immersion in an activity seems to be a central aspect of the flow
experience (Csikszentmihalyi, Rathunde, & Whalen, 1993; Ellis, Voelkl, & Morris,
1994).
If we focus on the work situation, Bakker (2005) as well as Salanova, Bakker
and Llorens (2006) developed the concept of flow during work activities and defined it
as an optimal experience at work that is characterized by work enjoyment (i.e., the
emotional component), intrinsic work motivation (i.e., the motivation component) and
absorption (i.e., the cognitive component). Employees enjoy their work and feel
happy. This enjoyment is the outcome of cognitive and affective evaluations of the
flow experience (cf. Diener, 2000; Diener & Diener, 1999). Intrinsic work motivation
refers to the need to perform a certain work‐related activity with the aim of
experiencing inherent pleasure and satisfaction in the activity (cf. Deci & Ryan, 1985).
Intrinsically motivated employees are continuously interested in the work they are
involved in (Harackiewicz & Elliot, 1998), they want to continue their work and are
fascinated by the tasks they perform (Csikszentmihalyi, 1997). Finally, absorption
refers to a state of total concentration whereby employees are totally immersed in
their work. In this situation, time flies and they forget everything else around them (cf.
Csikszentmihalyi, 1990).
Based on this previous literature about the concept and the dimensions of
flow, in the present study ‘flow at work’ is considered an optimal and momentary
Chapter 2
35
experience attached to a specific activity in work domain where workers experience
enjoyment, intrinsic interest in a specific activity and are absorbed during this activity.
Although the concept of flow is more or less clear, it is necessary to do more research
to clarify what job characteristics help make a ‘flowing’ job.
What makes a ‘flowing’ job?
Several scholars have pointed out the motivational potential of job resources to
facilitate the flow experience at work. For instance, the Conservation of Resources
(COR) theory states that job resources can potentially be motivating in their own right
through the creation, maintenance and accumulation of resources (Hobfoll, 1989 and
2001). This theory states that gaining resources increases the resource pool, which
makes the subsequent acquirement of more resources more likely, and consequently,
motivation and well‐being will increase (see also Houkes, Janssen, de Jonge, & Nijhuis,
2001).
Similarly, the Job Demands‐Resouces (JD‐R) model (Bakker, Demerouti, De
Boer, & Schaufeli, 2003; Demerouti, Bakker, Nachreiner, & Schaufeli, 2001) constitutes
a heuristic and parsimonious model which specifies that motivation (e.g., work
engagement) and organizational commitment may be a consequence of the presence
of available job resources (Schaufeli & Bakker, 2004).
More specifically, the Job Characteristics Model (JCM; Hackman, & Oldham,
1980) proposes that every job has a specific motivational potential that depends on
the presence of five core job characteristics. Different studies have pointed out the
beneficial aspects of these positive characteristics to enhance job satisfaction, health,
performance, low absenteeism, low turnover and high work motivation (Fried & Ferris,
The story flows on: A multi‐study on the flow experience
36
1987; Griffin, 1991; Tierney & Farmer, 2002). One of the task characteristics is the
opportunity to use a variety of skills which is considered as a pivotal element in the
‘channel model’ (Csikszentmihalyi, 1975 and 1990).
Similarly, O’Brien (1983) found an additional task characteristic that might
contribute to job satisfaction and motivation, which is the equivalence between the
challenge of one’s work and the ability to meet it. In the same line, Csikszentmihalyi’s
flow theory proposes that the flow experience (measured by enjoyment, intrinsic
interest and absorption in the present study) depends on the match between two
relevant characteristics of the task: perceived challenge and skills inherent in this task
(Csikszentmihalyi, 1975 and 1990; Csikszentmihalyi & Rathunde, 1993).
According to the ‘channel model’ (Csikszentmihalyi, 1975), flow would be
experienced as a result of the combination of high perceived challenge and high
perceived skills. More recently, this channel model has been extended to the
‘Experience Fluctuation Model’ (Csikszentmihalyi, 1990 and 1997; Massimini & Carli,
1988) which represents a model with eight channels: flow, apathy, anxiety, boredom
arousal, relaxation, worry and control. However, the present study is focused on the
original model (Csikszentmihalyi, 1975) since it was tested using single administration
questionnaires as in the present study. On the one hand, this model allows to
distinguish between flow and other such experiences (e.g., boredom, anxiety) based
on different challenge‐skills formulae. According to this, activities (in our study, work
activities) in which skills and challenge are high would lead to flow experiences. On the
other hand, boredom would appear in activities with high skills compared to challenge;
finally, anxiety would appear in tasks characterized by low skills and high challenge.
Chapter 2
37
Based on these previous studies, there are two criteria to experience flow: (1)
there must be a balance between perceived challenge that an activity possesses and
perceived skills to face challenge and (2) such perceived challenge and skills must be
relatively high in accordance with the subject mean in both variables (Asakawa, 2004;
Massimini & Carli, 1988; Massimini, Csikszentmihalyi, & Carli, 1987; Moneta &
Csikszentmihalyi, 1996).
Although, Csikszentmihalyi and LeFevre (1989) reported that the combination
of high challenge and skills occurred three times more often during work than leisure
(see also Haworth & Hill, 1992), this combination of high challenge and high skills has
been tested in a variety of non employment settings. For example, schooling (Moneta
& Csikszentmihalyi, 1996; Rheinberg, Manig, Kliegl, Engeser, & Vollmeyer, 2007),
computing (Chen, Wigand, & Nilan, 1999), leisure (Csikszentmihalyi, & LeFevre, 1989),
and competitive and recreational sports (Catley & Duda, 1997), while there is a lack of
studies in work settings.
Since flow has normally been tested using diary studies, namely the ‘Experience
Sampling Method’ (ESM) (Csikszentmihalyi, Larson, & Prescott, 1977; Csikszentmihalyi
& LeFevre, 1989), little empirical research using this methodology exists in work
settings because it is more difficult to implement it in these contexts. Although the
ESM permits the assessment of the subjects’ experience in their natural environment
to be repeated (Massimini et al., 1987), sometimes this methodology is not plausible in
work contexts given its repeated assessment nature. In this sense, here we attempt to
investigate the flow channel model in different occupations using a single
The story flows on: A multi‐study on the flow experience
38
administration questionnaire which allowed us to collect information from workers
more easily.
So far, perceived challenge and skills are both antecedents of flow experiences.
Nakamura and Csikszentmihalyi (2002) state these two variables (high perceived skills
well matched with high challenge) are necessary prerequisites to experience flow.
Besides, by applying these conditions related to the organizations, the opportunity to
perform challenging tasks skilfully might have benefits for employees and their
organizations (Eisenberger et al., 2005). Consequently, we assume that employees in
jobs characterized with a balance between these two factors will experience flow more
frequently. However, more research is needed to clarify whether there are some
specific occupations in which workers may experience flow more frequently than
others.
Do all occupations experience flow?
The different occupations used to study flow experience were secondary school
teachers (Salanova, Bakker, & Llorens, 2006), music teachers (Bakker, 2005),
information and communication technology users (Chen et al., 1999; Rodríguez‐
Sánchez, Cifre, Salanova, & Åborg, 2008), and workers from different occupations
(Salanova, Martínez, Cifre, & Schaufeli, 2005b).
At this point, we can expect that workers in any occupation may experience
flow doing job tasks. In this sense, we assume that it is possible in any occupation to
find tasks characterized by high challenge and high perceived skills, considered the
more proximal antecedents of flow according to the channel model (cf. Chen, 2006).
Accordingly, these tasks may potentially generate flow experiences in employees. All
Chapter 2
39
of those studies support the idea that flow can be experienced in any kind of
occupation, whenever all the conditions mentioned above are satisfied.
Although major research on flow has been based on the level of each flow
dimension, this present study has focused on the frequency of flow experience in work
settings. In this sense, the present study centers on the flow experience at ‘jobs’
related to work which was developed over a lengthier period of time (in the last 6
months).
In order to know whether there are some specific occupations in which workers
may experience flow more frequently than others is a further step in this research.
Although a research on this issue is lacking, Salanova et al. (2005b) studied flow in 770
workers from different occupations (i.e., clerical workers, teachers, technical staff,
laboratory workers, sales staff, tile workers and management). This research suggests
significant differences in the three dimensions of flow depending on the type of
occupational group. Generally speaking, managers and teachers (i.e., both people
working with people) showed experiences of flow more frequently than the rest of
occupational workers, particularly more than clerical and tile workers (i.e., people
working with data and things). It could be that managers and teachers work in
occupational settings in which the development of a balance between high challenge
and high perceived skills is more probable.
In this context, the objective of the present study is twofold. On the one hand,
we are interested in extending the ‘channel model’ (Csikszentmihalyi, 1975) related to
the activities within jobs. In this sense, employees whose jobs are characterized by
high challenge and high perceived skills, experience flow. The second objective is to
test whether there are significant differences in the frequency of flow experiences
The story flows on: A multi‐study on the flow experience
40
according to the type of occupation (in our study, tile workers and secondary school
teachers). According to previous research, we expect:
Hypothesis 1): Workers who perceive their jobs with high challenge and high
skills will experience flow more frequently than others with an imbalance between the
levels of challenge and skills.
Hypothesis 2): Significant differences in the frequency of flow experience (i.e.,
enjoyment, intrinsic interest and absorption) between workers from two different
occupations (i.e., tile workers and secondary school teachers). More specifically, we
expect that secondary school teachers will experience flow more frequently than tile
workers.
Method
Participants and Procedure
The total sample consisted of 957 Spanish individuals (53% women and 47%
men). Taking into account the differentiation established by Fine and Cronshaw (1999)
roughly half the sample (n = 474; 51%) were people working with ‘things’; specifically
Sample 1 was composed of tile workers from the ceramic industry (Sample 1). The
other half of the sample (n = 483; 49%) were people working with ‘people’; specifically
Sample 2 was made up of secondary school teachers (Sample 2). The mean age of the
full sample was 36 years and 8 months (sd = 9.0) ranging from 18 to 62 years.
Tile workers worked on the production line of three private tile companies,
whereas secondary school teachers worked in 34 schools, most of which were public
(83%). In Sample 1 (i.e., tile workers) (52% men; 48% woman), ages ranged from 18 to
62 years (M = 33.2; sd = 8.4). In Sample 2 (secondary school teachers) (56% women
Chapter 2
41
and 44% men), ages ranged from 23 to 60 years (M = 40.24; sd = 8.2). Secondary
school teachers were significantly older than tile workers (t(928) = ‐12.73; p < .001);
according to Cohen (1988) and based on the effect size d = .84, this is a ‘large’ effect.
Participants received instructions to fill out the RED questionnaire (Resources,
Emotions/Experiences and Demands at work) in the paper‐and‐pencil version. This
instrument tests three types of variables: (1) personal resources (e.g., skills) and job
resources (e.g., autonomy), (2) emotions and experiences (e.g., burnout, engagement,
flow), and (3) job demands (e.g., quantitative overload). The validity of this instrument
has been tested in previous studies with more than 2,500 workers (e.g., Schaufeli,
Bakker, & Salanova, 2006; Schaufeli, Salanova, González‐Romá, & Bakker, 2002).
Human resources officers and principals distributed the questionnaires in the
tile companies and the secondary schools, respectively, as part of an occupational
health and safety audit. A cover letter explained the purpose of the study, clarifying
that participation was voluntary and that confidentiality was guaranteed. Respondents
received instructions to return the completed questionnaires in a sealed envelope
either to the person who had distributed them or directly to the research team.
Variables
The assessment of the Frequency of flow experiences at work was based on an
adaptation of the WOrk‐reLated Flow scale (WOLF; Bakker, 2001) included in the RED
questionnaire. The WOLF includes sixteen items measuring work enjoyment (4 items),
intrinsic interest (6 items) and absorption (6 items). Participants should answer how
often they had experienced the following experiences at work in the last 6 months (0 =
never, 6 = every day): ‘When I am working, I feel happy’ (work enjoyment), ‘I get my
The story flows on: A multi‐study on the flow experience
42
motivation from the work itself, and not from the rewards for it’ (intrinsic interest) and
‘When I am working, I forget everything else around me’ (absorption).
Challenge was assessed by two items from an adapted Spanish version of the
dedication scale with the Utrecht Work Engagement Scale (UWES; Schaufeli et al.,
2002) included in the RED questionnaire. The items are ‘My job is stimulating and
inspires me’ and ‘My job gives me new challenge’. A seven‐point scale ranging from 0
‘never’ to 6 ‘always/every day’ rated the items.
Skills were measured by six items using an adapted Spanish version (Salanova
et al., 2000) of the professional efficacy scale from the Maslach Burnout Inventory‐
General Survey (MBI‐GS; Schaufeli, Leiter, Maslach, & Jackson, 1996) included in the
RED questionnaire. An example of item is ‘I can effectively solve the problems that
arise in my work’. Participants indicated the extent to which they agreed with each
sentence on a seven‐point rating scale (0 = never, 6 = always/every day). Cronbach’s
alpha of each scale is shown in Table 2.1.
Data Analyses
We computed the means, standard deviations, Cronbach’s alpha coefficients
and bivariate correlations for all scales. Secondly, we used the t‐test to clarify the
characteristics (i.e., challenge and skills) of the most flowing jobs. Finally, we also
computed the Analyses of Variance (ANOVAs) using the occupation as the independent
variable and the three dimension of the flow experience as dependent variables. In
order to interpret the relationship among challenge, skills and flow, ±1sd was used in
this study to select the participants with extreme values in these variables (high levels,
+1sd; low levels, ‐1sd), as recommended by Cohen and Cohen (1983), and by Jaccard,
Turrisi, and Wan (1990).
Chapter 2
43
Results
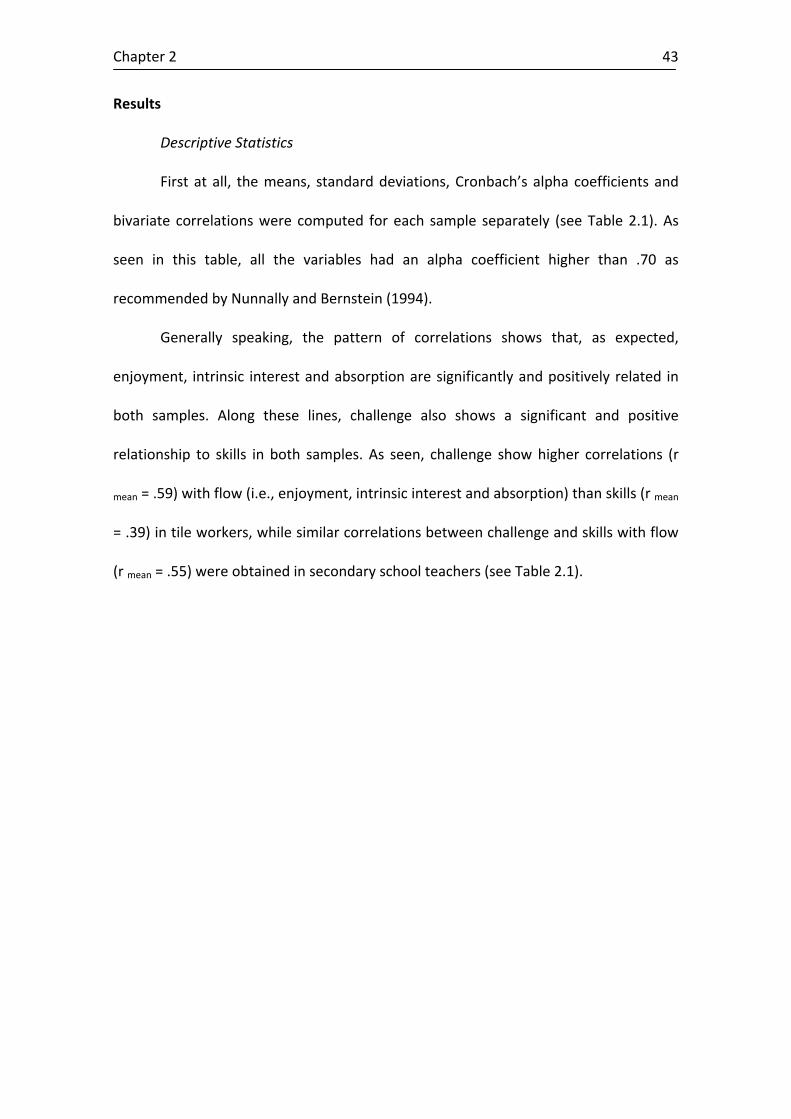
Descriptive Statistics
First at all, the means, standard deviations, Cronbach’s alpha coefficients and
bivariate correlations were computed for each sample separately (see Table 2.1). As
seen in this table, all the variables had an alpha coefficient higher than .70 as
recommended by Nunnally and Bernstein (1994).
Generally speaking, the pattern of correlations shows that, as expected,
enjoyment, intrinsic interest and absorption are significantly and positively related in
both samples. Along these lines, challenge also shows a significant and positive
relationship to skills in both samples. As seen, challenge show higher correlations (r
mean = .59) with flow (i.e., enjoyment, intrinsic interest and absorption) than skills (r mean
= .39) in tile workers, while similar correlations between challenge and skills with flow
(r mean = .55) were obtained in secondary school teachers (see Table 2.1).
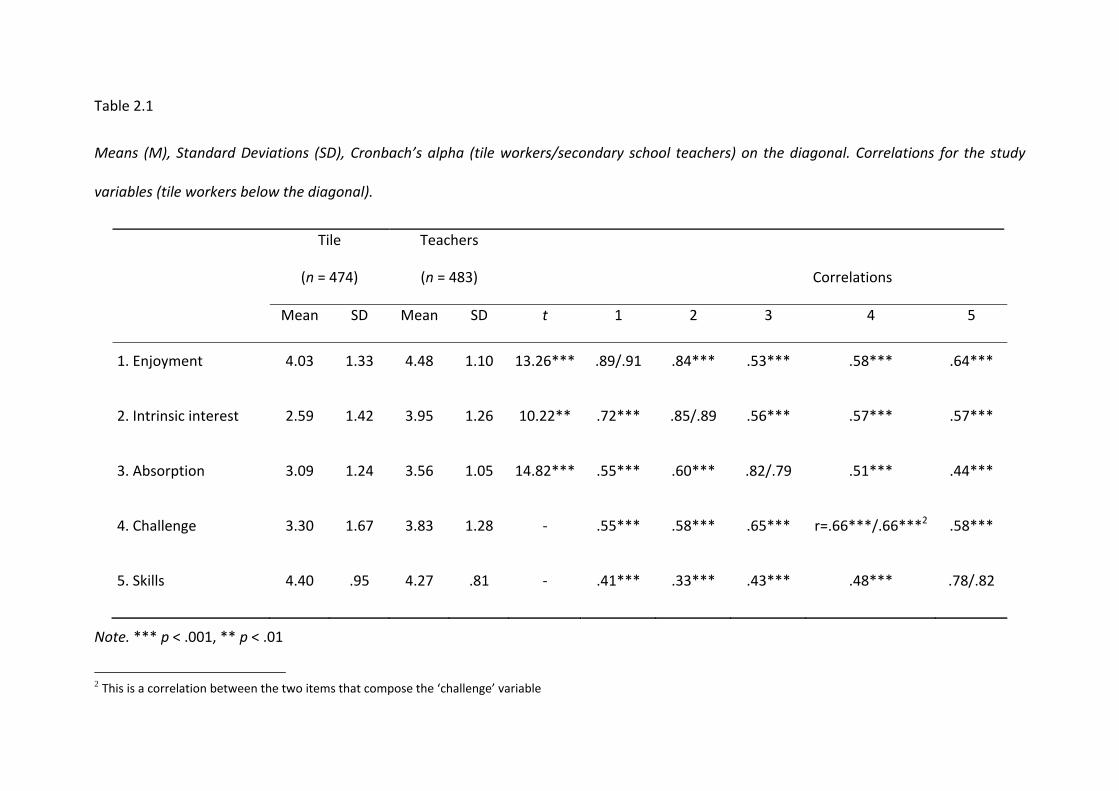
Table 2.1
Means (M), Standard Deviations (SD), Cronbach’s alpha (tile workers/secondary school teachers) on the diagonal. Correlations for the study
variables (tile workers below the diagonal).
Tile
(n = 474)
Teachers
(n = 483)
Correlations
Mean SD Mean SD t 1 2 3 4 5
1. Enjoyment 4.03 1.33 4.48 1.10 13.26*** .89/.91 .84*** .53*** .58*** .64***
2. Intrinsic interest 2.59 1.42 3.95 1.26 10.22** .72*** .85/.89 .56*** .57*** .57***
3. Absorption 3.09 1.24 3.56 1.05 14.82*** .55*** .60*** .82/.79 .51*** .44***
4. Challenge 3.30 1.67 3.83 1.28 ‐ .55*** .58*** .65*** r=.66***/.66***2 .58***
5. Skills 4.40 .95 4.27 .81 ‐ .41*** .33*** .43*** .48*** .78/.82
Note. *** p < .001, ** p < .01
2 This is a correlation between the two items that compose the ‘challenge’ variable
Chapter 2
45
Testing the Flow Channel Model
The first objective of this study was to extend the flow channel model
(Csikszentmihalyi, 1975).According to this, those workers in jobs characterized by high
challenge and high skills will experience flow more frequently than others with other
formulas between challenge and skills. In order to do this, we selected participants in
high levels (+1 sd) and low levels (‐1 sd) of challenge and in high levels (+1 sd) and low
levels (‐1 sd) of skills in both samples taken together (n = 957) (Cohen & Cohen, 1983;
Jaccard, Turrisi, & Wan, 1990).
Following this process, those participants with extreme conditions in both the
simultaneously analyzed samples (i.e., high/low in challenge and high/low in skills)
were selected, and the four groups of the challenge and skills combinations proposed
by the quadrants in the ‘channel model’ (Csikszentmihalyi, 1975) were obtained.
Workers in jobs characterized by high challenge + low skills compose Group 1 (G1) (n =
12); group 2 (G2) includes workers in jobs characterized by high challenge + high skills
(n = 64); group 3 (G3) includes workers in jobs characterized by low challenge + low
skills (n = 71); and finally group 4 (G4) comprises workers with perception of low
challenge + high skills (n = 2).
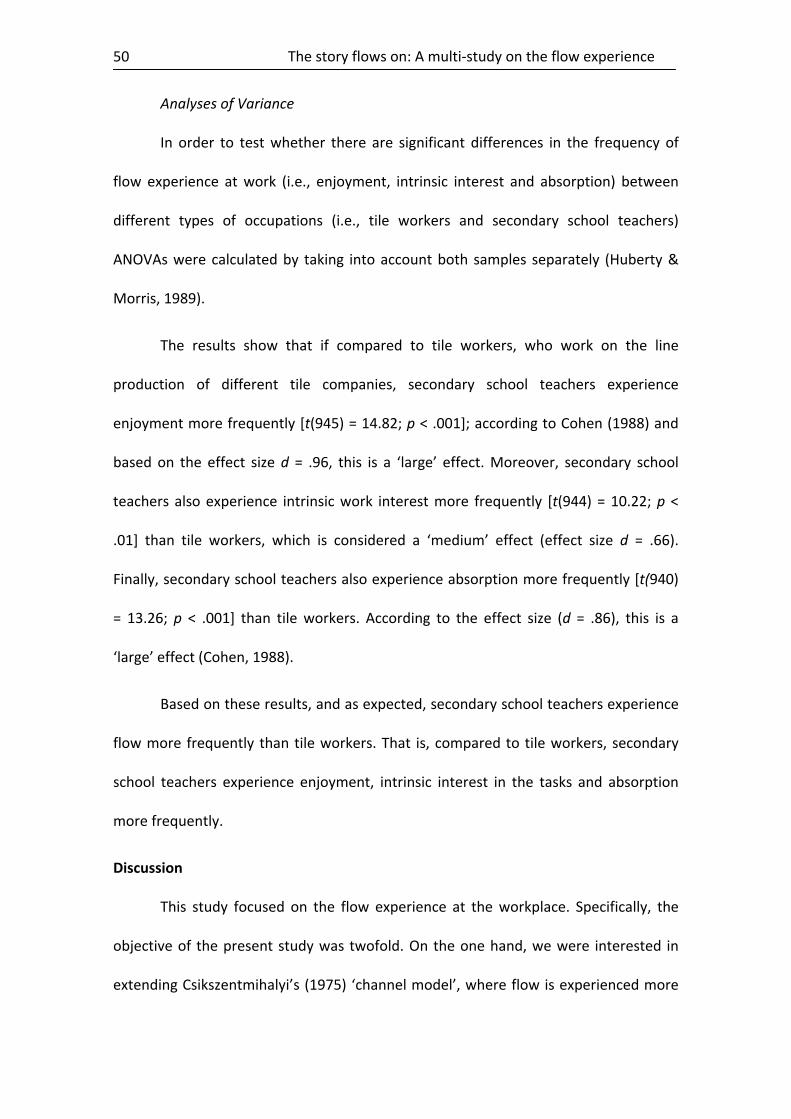
Table 2.2 shows the means and standard deviations in each flow dimension
(i.e., enjoyment, intrinsic interest and absorption) for each group. On the one hand,
only 6% of the workers in our whole sample (n = 957) experienced flow more
frequently than the rest of the groups. These workers belong to Group 2 (G2),
characterized by workers in jobs with a combination of high challenge and high skills.
On the other hand, we see that Group 3 (G3) presents the lowest values for the
frequency of flow experience, which includes workers in jobs with low challenge and
The story flows on: A multi‐study on the flow experience
46
low skills. G3 could experience apathy. According to Csikszentmihalyi (1975) and to
Massimini and Carli (1988), these two groups are opposites and would reflect the
channel model of flow. Moreover, G1 is characterized by workers in jobs with a
combination of high challenge and low skills. Finally, G4 is characterized by workers in
jobs with low challenge and high skills. According to Csikszentmihalyi (1975, 1997) and
to Massimini and Carli (1988), these two groups of workers could have experiences
near to anxiety and to boredom, respectively.
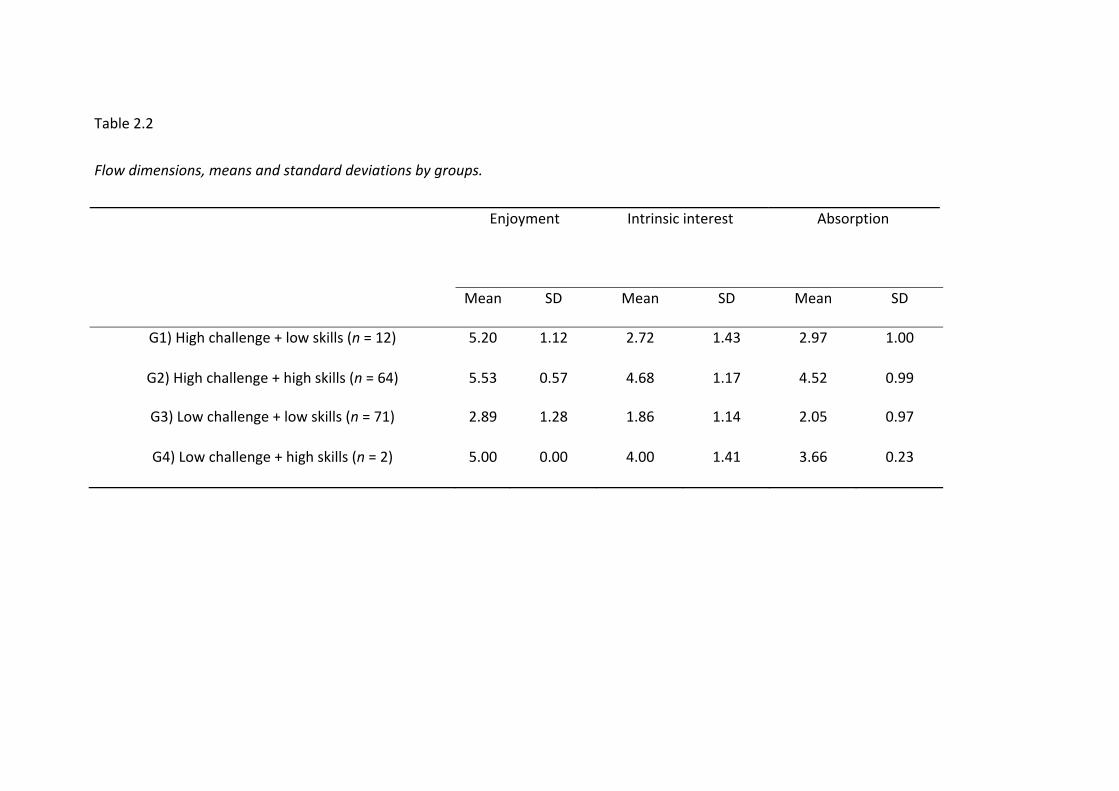
Table 2.2
Flow dimensions, means and standard deviations by groups.
Enjoyment Intrinsic interest Absorption
Mean SD Mean SD Mean SD
G1) High challenge + low skills (n = 12) 5.20 1.12 2.72 1.43 2.97 1.00
G2) High challenge + high skills (n = 64) 5.53 0.57 4.68 1.17 4.52 0.99
G3) Low challenge + low skills (n = 71) 2.89 1.28 1.86 1.14 2.05 0.97
G4) Low challenge + high skills (n = 2) 5.00 0.00 4.00 1.41 3.66 0.23
The story flows on: A multi‐study on the flow experience
48
In the next step, we calculated the t‐test (see Table 2.3) in order to
demonstrate whether differences exist in the experience of flow dimensions in these
two specific groups (G2 and G3). As expected, significant differences in the frequency
of the three dimensions of flow are observed. Thus, significant differences are shown
between G2 and G3 in terms of frequency of experiencing enjoyment [t(133) = 15.75; p
< .001], frequency of intrinsic interest [t(133) = 14.13; p < .001], and frequency of
absorption [t(133) = 14.63; p < .001] in both groups. Moreover according to Cohen
(1988), these significant differences were considered ‘large’ effects based on the effect
size d = 2.73, d = 2.45 and d = 2.53 for enjoyment, intrinsic interest and absorption,
respectively,
In this sense, if we compared G2, the group comprising workers with high
challenge and high skills to workers in jobs characterized by low challenge and low
skills, that is G3, , G2 displays enjoyment, intrinsic work motivation and more
absorption more frequently than G3 (see Table 2.3). These results confirm our
Hypothesis 1.
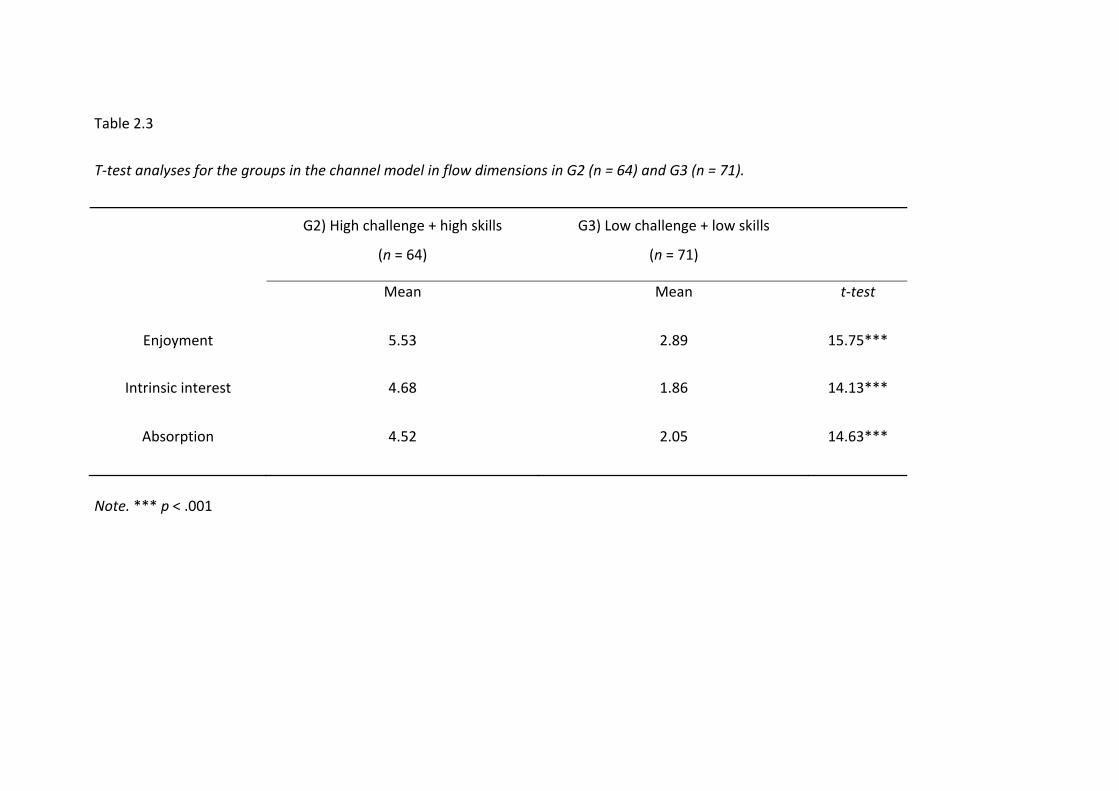
Table 2.3
T‐test analyses for the groups in the channel model in flow dimensions in G2 (n = 64) and G3 (n = 71).
G2) High challenge + high skills
(n = 64)
G3) Low challenge + low skills
(n = 71)
Mean Mean t‐test
Enjoyment 5.53 2.89 15.75***
Intrinsic interest 4.68 1.86 14.13***
Absorption 4.52 2.05 14.63***
Note. *** p < .001
The story flows on: A multi‐study on the flow experience
50
Analyses of Variance
In order to test whether there are significant differences in the frequency of
flow experience at work (i.e., enjoyment, intrinsic interest and absorption) between
different types of occupations (i.e., tile workers and secondary school teachers)
ANOVAs were calculated by taking into account both samples separately (Huberty &
Morris, 1989).
The results show that if compared to tile workers, who work on the line
production of different tile companies, secondary school teachers experience
enjoyment more frequently [t(945) = 14.82; p < .001]; according to Cohen (1988) and
based on the effect size d = .96, this is a ‘large’ effect. Moreover, secondary school
teachers also experience intrinsic work interest more frequently [t(944) = 10.22; p <
.01] than tile workers, which is considered a ‘medium’ effect (effect size d = .66).
Finally, secondary school teachers also experience absorption more frequently [t(940)
= 13.26; p < .001] than tile workers. According to the effect size (d = .86), this is a
‘large’ effect (Cohen, 1988).
Based on these results, and as expected, secondary school teachers experience
flow more frequently than tile workers. That is, compared to tile workers, secondary
school teachers experience enjoyment, intrinsic interest in the tasks and absorption
more frequently.
Discussion
This study focused on the flow experience at the workplace. Specifically, the
objective of the present study was twofold. On the one hand, we were interested in
extending Csikszentmihalyi’s (1975) ‘channel model’, where flow is experienced more
Chapter 3
51
frequently in jobs with high levels of challenge and high levels of perceived skills. In
this sense, we expected that workers who perceive their jobs with high challenge and
high skills will experience flow more frequently than others with an imbalance
between the levels of challenge and skills. The second objective was to analyze
whether there were significant differences in the frequency of flow experience among
different occupations (i.e., tile workers and secondary school teachers). In this sense,
we expected significant differences in the frequency of flow experience between
workers from the two different occupations: secondary school teachers would be
expected to experience flow more frequently than tile workers.
This study contemplated the conceptualization of flow in the workplace as an
optimal experience in daily work activities, which is more frequently produced in jobs
characterized by a combination of high challenge and high skills (Csikszentmihalyi,
1975; Massimini & Carli, 1988). Moreover in the present study, flow has been
characterized by work enjoyment (i.e., the emotional dimension), intrinsic interest
(i.e., the motivational dimension) and absorption (i.e., the cognitive dimension) (Bassi
et al., 2007; Delle Fave & Massimini 2004 and 2005b). Work enjoyment refers to a
positive emotion of feeling happy and endorses a very positive judgment about the
quality of the working life. Intrinsic interest relates to the unbroken interest of
employees in continuing working and to their fascination by the task they perform.
Absorption refers to a state of total concentration whereby employees are totally
immersed in their work; time flies and they forgot everything else around them
(Bakker, 2005).
Another important remark is that this study uses a new way to measure flow in
organizations. That is, we used frequency of flow rather than intensity of flow as tested
The story flows on: A multi‐study on the flow experience
52
by a single administration questionnaire. This measure allows us to know the
frequency of flow (i.e., enjoyment, absorption and intrinsic interest) experienced by
the participants with a single administration questionnaire to overcome the difficulties
in assessing the experience sampling method in work settings. It is also a simple way to
test flow in all the workers of one firm and to establish optimization activities at an
organizational level in order to increase optimal experiences at work.
According to the first objective, we expected that workers who perceive their
jobs with high challenge and high skills would experience flow more frequently than
others with different formulae between the levels of challenge and skills. In this sense,
the t‐test results showed that those employees working in jobs characterized by high
challenge and high skills experienced flow more frequently than others who had an
imbalance between the levels of challenge and skills. In this sense, we obtained
different groups experiencing apathy, anxiety and boredom. Thus Hypothesis 1 is
confirmed given the evidence in favour of extending the ‘channel model’
(Csikszentmihalyi, 1975) using the frequency instead of level of flow. More specifically,
and as expected, those jobs characterized by high challenge and high skills are the right
combination to generate flow experiences in workers more frequently. These findings
are consistent with Csikszentmihalyi’s model and with Csikszentmihalyi and LeFevre
(1989) suggestions that assume that high challenge and high skills create an optimal
subjective experience relative to other combinations of skill and challenge, and that
dispositional differences influence the extent to which high skill and challenge produce
an elevated subjective experience (see also Eisenberger et al., 2005).
It has to be noted that a particular result was found in G4, characterized by low
challenge + high skills. According to the ‘channel model’ (Csikszentmihalyi, 1975), this
Chapter 3
53
group has been characterized by being more prone to boredom. However, it is odd to
note that, according to Table 2.2, this group shows high scores in the three dimensions
of flow (more similar than the values of G2, which is categorized as the flow group).
Although it may be an unexpected result, other research works have obtained similar
results. Thus, Clarke and Haworth (1994) showed a sample of American college
students in which challenge is exceeded by skill, and how a positive relationship exists
with enjoyment, happiness and relaxation.
According to the second objective, we expected significant differences in the
frequency of flow experiences (i.e., enjoyment, intrinsic interest and absorption)
between workers from two different occupations (i.e., tile workers and secondary
school teachers). The results of the ANOVAs supported our second hypothesis. More
specifically, the results showed that secondary school teachers experienced flow more
frequently than tile workers. In this sense, school teachers felt enjoyment, intrinsic
interest and absorption more frequently in comparison to tile workers. This means
that although both samples may experience flow, secondary school teachers, that is,
people working with ‘people’ ‐according to Fine and Cronshaw (1999)‐ are more likely
to experience flow more frequently than tile workers, that is, people working mainly
with ‘things’. These results confirm our Hypothesis 2.
These results are in line with the study of flow in different samples studied by
Salanova et al. (2005b). This suggests the idea that workers in any occupation may
experience flow doing job tasks whenever the conditions of high challenge and high
skill are satisfied. However, people working with ‘people’ are more likely to experience
flow than people working with ‘things’ and ‘data’ (Fine & Cronshaw, 1999). Maybe the
job content of those workers working with ‘people’ (i.e., secondary school teachers)
The story flows on: A multi‐study on the flow experience
54
could be more creative, more controlled and more challenging than jobs with people
working on a production line (i.e., tile workers) (Cifre, Llorens, Salanova, & Martínez,
2003; Gold & Roth, 1993). In fact, these last jobs are defined as being less creative with
less control as workers are only submitted to the pace of the tile machine and the
supervisor’s orders.
Collectively, our results show that flow is a common positive experience in daily
lives at work, and that it is determined by the combination of challenge and skills
irrespectively of the occupation (i.e., tile workers and secondary school teachers).
According to Delle Fave, and Massimini (2005b), any person (in our study, workers)
doing any activity could experience flow when high challenge and high skills are
present. The findings in this study show that, according to the ‘channel model’, flow in
both tile workers and secondary school teachers will be experienced when both
challenge and skills are high (Csikszentmihalyi, 1975). Moreover, other relevant results
suggest that it is possible to differentiate such jobs, and that this is more likely to be
due to experience flow. The results in the present study suggest that secondary school
teachers (i.e., people workers) are more likely to experience flow more frequently
than other workers in other types of job, such as tile workers (i.e., “things” workers).
This suggests that organizations may facilitate ‘flow experience’ in workers by creating
challenging jobs and increasing skills among their employees.
Study limitations and future research
Despite the relevance of this study to generate ‘positive jobs’, it is necessary to
interpret the results with caution because of the non‐experimental nature of this
study. Another limitation is that the study is cross‐sectional in nature. It implies the
necessity to interpret the relationships obtained between challenge, skills and the
Chapter 3
55
frequency of flow experience with caution. Finally, we used self‐report questionnaires
to collect the data used in this study, whose results may be affected by the variance of
the common method. This could be an alternative solution to obtain data in such
contexts where it is more complicated to use the Experience Sampling Method (ESM;
Csikszentmihalyi, Larson, & Prescott, 1977; Csikszentmihalyi & LeFevre, 1989) because
of its repeated assessment nature, but it may be a first step. In this sense,
complementing these with more data, for example using ‘diary studies’ (Stone &
Shiffman, 2002) would be an interesting option. For instance, by implementing diary
studies to a specific subgroup from the initial questionnaire database participants.
Finally, this study is limited to the context of tile workers and secondary school
teachers. Since the hypotheses were confirmed as regards the ‘channel model’ and the
differences in frequency of flow experience across both samples, it would be
interesting and relevant to examine this phenomenon in other occupational fields,
particularly in specific ICT users or in teleworkers, and in workgroups, for example.
Theoretical and practical implications
From the results, we can point out some theoretical and practical implications.
There are two main implications related to the theory development about flow at the
theoretical level. The first relates to the extension of the channel model and to the
comprehension and prediction of the frequency of flow experiences. Generally
speaking, this model focuses on ‘activities’ related to a ‘positive’ experience in time.
People experience flow while doing the activity. In this context, it is usual to test the
intensity of flow experience. In the present study however, the channel model
generalizes ‘jobs’ and experience related to work (in the last 6 months) which is
lengthier in time. In this sense, we have extended the channel model by focusing on
The story flows on: A multi‐study on the flow experience
56
the frequency of this experience over a period of time and not on the intensity of flow
experience.
Regarding this, the second innovation of this study is the adaptation of the
‘channel model’ to a single questionnaire assessment. As we have explained, the
channel model commences with repeated measures from the ESM assessment,
whereas we have used a single administration questionnaire which allowed us to
collect information from workers working in a company more easily. Although some
research works have criticized the use of questionnaires because they do not yield
good quality data for eliciting phenomenological perceptions since subjects are not
used to putting these perceptions into words (Massimini et al., 1987), other works
have shown them as a strategy to not only collect retrospective data of past flow
experiences, but to also obtain a descriptive picture of these positive experiences (for
example, Chen, Wigand, & Nilan, 2000).
The practical implications are twofold. On the one hand, they relate to the job
(re)design in order to increase workers’ challenge and skill perceptions. Thus, only
those jobs characterized by high challenge and high skills will provide employees with
the opportunity to experience flow (Csikszentmihalyi, 1990; Eisenberger et al, 2005).
The opportunity to work in contexts characterized by challenging tasks with accurate
levels of skills will enhance ‘healthy workers’ working in ‘healthy jobs’, which will
increase the positive mood (Csikszentmihalyi, Rathunde, & Whalen, 1993), task
interest (Catley & Duda, 1997) and ‘healthy products’ (Salanova, 2008). On the other
hand, the results suggest that training plays a pivotal role in generating flow more
frequently. This training should focus on promoting the levels of skills that can help

Chapter 3
57
people to perceive themselves more skilfully and of being capable of achieving the
challenge that their work offers.

The story flows on: A multi‐study on the flow experience
58
Chapter 3
59
Chapter 3. Flow Experiences among Information and Communication Technology Users3
Summary
The use of technologies is more common in our daily lives, working with
technologies might be associated with positive experiences such as flow. However,
little empirical research exists on flow experiences in technology settings. The main
aim of this study was to confirm the three dimensional construct of flow, i.e.,
absorption, enjoyment and intrinsic interest, among 517 Information and
Communication Technology (ICT) users (234 students ‐ with a mean age of 23 (SD =
3.8) ‐ from different areas of study, mainly Law, Public Administration, Chemistry and
Psychology, and 283 employees ‐ with a mean age of 33 (SD = 7.8) ‐ of 21 different
companies from various sectors of production namely public administration, industrial
production and services). Results show that, as expected, flow is a three dimensional
psychological construct, what is invariant among samples of technology users. Practical
and theoretical implications as well as future research are discussed.
Introduction
The concept of ‘flow’ has been of interest to researchers since it was
introduced by Csikszentmihalyi (1975, 1990; Csikszentmihalyi & Csikszentmihalyi,
1988). He interviewed professionals such as artists, athletes… and scientists, and asked
them to describe “optimal experiences” that made them feel good and motivated
3 Chapter 3 has been published as: Rodríguez‐Sánchez, A.M., Schaufeli, W.B., Salanova, M. & Cifre, E., (2008). Flow experience among information and communication technology users. Psychological Reports, 102, 29‐39.
The story flows on: A multi‐study on the flow experience
60
them because they were doing something that was worth doing for its own sake. He
coined this experience ‘flow’, because many interviewees used this term
spontaneously to explain what their optimal experience felt like (Csikszentmihalyi &
Csikszentmihalyi, 1988). Thus, flow is defined as an optimal and extremely enjoyable
experience. It is characterized by total concentration and joy and a high degree of
interest in the activity (Moneta & Csikszentmihalyi, 1996).
Flow is a complex concept difficult to operationalize particularly because in the
original description of Csikszentmihalyi (1975, 1990, 1997; Csikszentmihalyi &
Csikszentmihalyi, 1988) the flow experience itself is confounded with its antecedents
and consequences. For instance, Csikszentmihalyi (1990, 1997) describes flow in terms
of nine dimensions: clear goals, immediate feedback, personal skills well suited to
given challenges, merger of action and awareness, concentration on the task, sense
of control, loss of self‐consciousness, altered sense of time, and the experience
becoming “autotelic”, i.e., for its own sake or intrinsically rewarding. However, a closer
look reveals that clear goals, immediate feedback and personal skills well suited to
given challenges can be considered as antecedents or necessary conditions for flow,
whereas the experience becoming “autotelic” might be considered a consequence.
To date, over three decades after the concept of flow was introduced, there is
still no agreement about its operationalisation. For instance, it has been maintained
that flow is characterized by the perception of a balance between high environmental
challenges and adequate personal skills, deep concentration, involvement, enjoyment,
control of the situation, clear‐cut feedback on the course of the activity, and intrinsic
motivation (Deci & Ryan, 1985). Chen (2006) defined flow as a state that is
“characterized by enjoyable feelings, concentration, immersion, and intensive
Chapter 3
61
involvement” (p. 222). In a similar vein, Ghani and Deshpande (1994, p. 383) described
flow in the context of human‐computer interaction, as: “(a) total concentration in an
activity and (b) the enjoyment which one derives from an activity”.
A critical examination of the literature suggests that most definitions of flow
seem to have three elements in common. The first refers to a sense of involvement,
total concentration, focused attention or loss of self‐consciousness, in other words,
being entirely engrossed in the activity at hand (Trevino & Webster, 1992; Ghani &
Deshpande, 1994; Lutz & Guiry, 1994; Moneta & Csikszentmihalyi 1996;
Csikszentmihalyi, 1997; Novak & Hoffman, 1997). Here, this deep involvement is
labelled absorption. A second common element involves positive feelings of
enjoyment that are associated with the activity (Privette & Bundrick, 1987; Ghani &
Deshpande, 1994; Moneta & Csikszentmihalyi, 1996; Novak & Hoffman, 1997).That is,
the activity is perceived as intrinsically enjoyable, so the second characteristic is
labelled enjoyment. The last element refers to the interest in performing the activity
for its own sake rather than for an extrinsic reason (Trevino & Webster, 1992; Moneta
& Csikszentmihalyi 1996; Novak & Hoffman, 1997;). This is labelled intrinsic interest. It
has to be noted that, according to the meaning of flow, items refer to flow like an
optimal experience related with a specific activity rather than a general behaviour
during the work. In such a way, it makes sense to measure intrinsic interest than
intrinsic motivation, also according to the flow definition provided by Moneta and
Csikszentmihalyi (1996), they used the term ‘high interest’ and not motivation related
with a specific activity. We used ‘interest’ instead of ‘motivation’ in order to be closer
to this original definition of flow.
The story flows on: A multi‐study on the flow experience
62
In sum, based on the common elements in various descriptions of flow, we
propose three elements as main components of the flow experience: absorption,
enjoyment, and intrinsic interest. At least three previous studies used this
operationalisation of flow and found that the intercorrelations between these three
flow components were relatively high in samples of music teachers and students
(Bakker, 2005), secondary school teachers (Salanova, Bakker, & Llorens, 2006) and also
in workers from small and medium sized companies (Demerouti, 2006). In these three
studies, correlations between absorption, enjoyment and intrinsic interest scales range
from .40 to .83 (mean correlation: .60) . However, few of these studies examined the
factorial validity of the three dimensional measure of flow.
In addition, all three studies used the same measure of flow, which was rather
general. However, according to the original meaning of flow as a short‐term optimal
experience that is inherent to a specific activity, it seems more appropriate to
operationalize it in terms of a specific work activity, for instance, while using
Information and Communication Technologies (ICT). This specific group was selected
because flow is quite prevalent among those who use ICT, presumably because of the
intrinsically motivating nature of these technologies (Chen, Wigand, & Nilan, 2000).
Specific items that refer to the use of ICT were used for. So instead of including general
flow items such as “I do my work with a lot of enjoyment” and “When I am working, I
forget everything else around me” as was done by the three studies of flow mentioned
above, more specific items were included, such as “I enjoy the work I do using these
technologies/ICT” and “When I’m working with these technologies/ICT, I forget
everything else around me”.
Chapter 3
63
Hence, according to the meaning of flow experience and the need to use
specific measures to assess this optimal experience, the present study had two
hypothesis. First, it was expected that a three‐factorial model including absorption,
enjoyment and intrinsic interest would fit better to the data than a one‐dimensional
model that assumed that all items loaded on one underlying undifferentiated flow
dimension (Hypothesis 1). Second, it was expected that the three factor model would
be invariant across both workers and students who use ICT. (Hypothesis 2).
Method
Participants
Sample 1 consisted of 234 university students (66% women) enrolled in various
graduate and undergraduate programs. Ages ranged from 17 to 43 years (M= 23; SD =
3.8). Only those students who used ICT on a daily basis were included, for instance by
browsing through the internet, word processing, or using spreadsheets or statistical
software packages.
Sample 2 was made up of 283 employees (61% women). Ages ranged from 18
to 60 years (M= 33; SD = 7.8). They worked in 21 different companies and in various
occupational sectors, ranging from agriculture to public administration. Like the
students, the employees were included based on their daily use of ICT.
Measure
The questionnaire included a wide range of variables, among others, both
students and employees were asked to specify the type of software they used and to
describe their daily work activities.
The story flows on: A multi‐study on the flow experience
64
Flow was measured using three subscales (see Appendix 1: Flow items).
Absorption was assessed using a slightly adapted version of the absorption scale of the
Utrecht Work Engagement Scale (UWES; Schaufeli, Salanova, González‐Romá, &
Bakker, 2002). All 5 items were reworded to refer specifically to ICT work; for instance,
the item ‘Time flies when I’m working’ was rephrased as ‘Time flies when I’m working
with technologies’.
Enjoyment and intrinsic interest were each assessed using a self‐constructed 3‐
item scale based on previous research (Rodríguez‐Sánchez, Cifre, & Salanova, 2004;
Rodríguez‐Sánchez, Salanova, & Cifre, 2004). In the introduction, two examples were
given of reformulated items.
The participants were asked to indicate how often they had flow experiences
during the preceding week. All flow items were scored on a 6‐point frequency scale,
the answer scale was: 0 = not at all/never; 1 = hardly at all/a couple of times a year; 2 =
rarely/once a month; 3 = sometimes/a couple of times a month; 4 = fairly often/once a
week; 5 = frequently/a couple of times a week; 6 = always/every day.
Procedure
Students (Sample 1) and employees (Sample 2) were asked to participate in the
study by PhD students who approached various universities and companies. The
sample 1 was chosen for two reasons: first, because students use ICT in their daily
work as students, and second it was a convenient sample easy to approach. Similarly,
sample 2 was chosen because of the companies were familiar to PhD students who
conducted their research. Only respondents from ICT‐jobs were sampled. All
respondents, who voluntarily participated in the study, filled in the paper‐and‐pencil
Chapter 3
65
version of the Resources, Emotions and Demands. Information and Communication
Technologies (RED.TIC) questionnaire. This questionnaire starts with a section dealing
with general information (i.e. age, level of education, kind of job, working hours) that
asks about the kind of technology the person uses, experience with ICT, etc. In the
present study, we used this section to uncover whether both samples studied and
worked using ICT and which kind of ICT‐activities they were involved in.
Results
Descriptive Statistics
Students used word processors (99%), internet (86%), spreadsheet (80%),
database (60%), powerpoint (62%), and statistics packages (38%). Employees used
word processors (94%), electronic mail (91%), spreadsheet (86%), internet (80%), and
intranet (70%). Both samples were asked to fill out the flow items imagining ICT
activities they mentioned previously.
Table 3.1 shows the means, standard deviations, internal consistencies
(Cronbach’s α), and intercorrelations of the three flow scales in both samples.
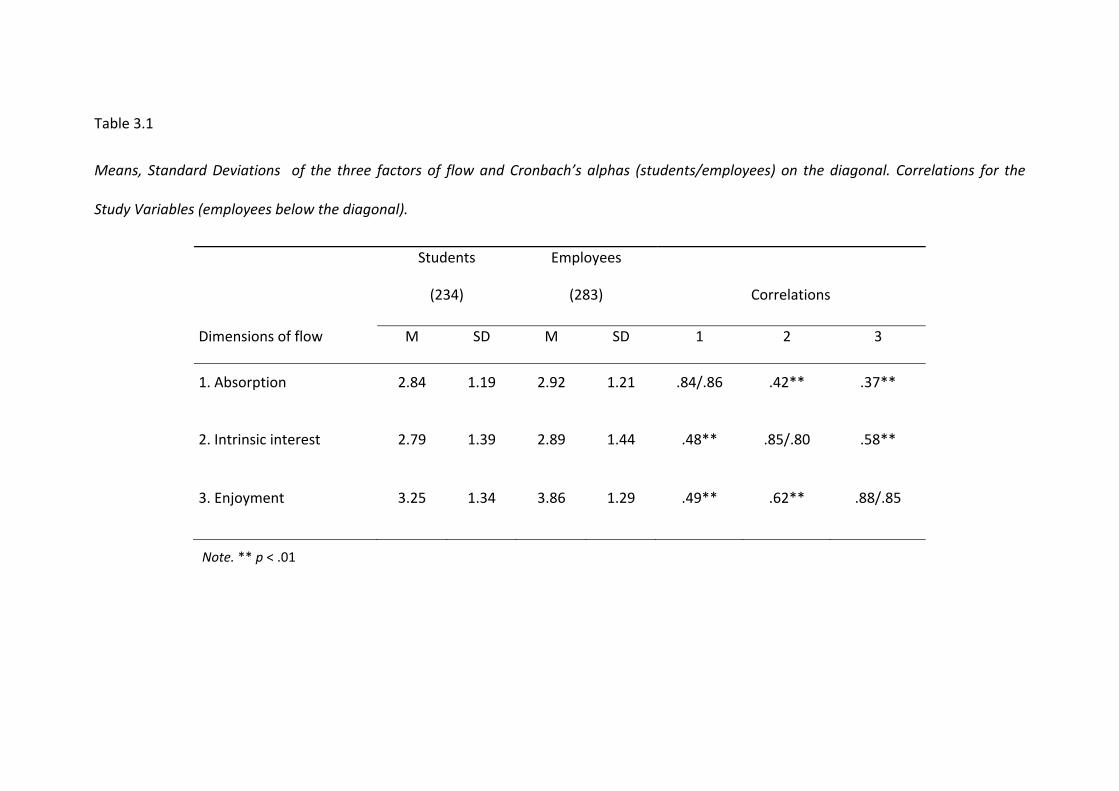
Table 3.1
Means, Standard Deviations of the three factors of flow and Cronbach’s alphas (students/employees) on the diagonal. Correlations for the
Study Variables (employees below the diagonal).
Dimensions of flow
Students
(234)
Employees
(283)
Correlations
M SD M SD 1 2 3
1. Absorption 2.84 1.19 2.92 1.21 .84/.86 .42** .37**
2. Intrinsic interest 2.79 1.39 2.89 1.44 .48** .85/.80 .58**
3. Enjoyment 3.25 1.34 3.86 1.29 .49** .62** .88/.85
Note. ** p < .01
Chapter 3
67
As can be seen from Table 3.1, all variables demonstrated good internal
consistencies by not only satisfying the usual criterion of α greater than .70 (Nunnaly &
Bernstein, 1994), but even the more stringent criterion of α greater than .80 (Henson,
2001). In addition, Table 3.1 shows that absorption, intrinsic interest and enjoyment
correlate positively and significantly. Mean correlation among students and employees
was .46 and .53, respectively.
Factorial structure of flow
In order to test Hypothesis 1, two alternative models were fitted to the data
separately for each sample, using confirmatory factor analyses: a one‐factor model
(M1) that assumed one latent variable underlying all flow items, and a three‐factor
model (M2) that assumed that items would load on three correlated scales,
absorption, intrinsic interest and enjoyment. The AMOS 4.0 software package
(Arbuckle & Wothke, 1999) was used to analyze data. Table 3.2 shows the results for
Sample 1 and Sample 2 for the one‐factor model (M1), the three‐factor model (M2),
and the null model (M3, reference model).
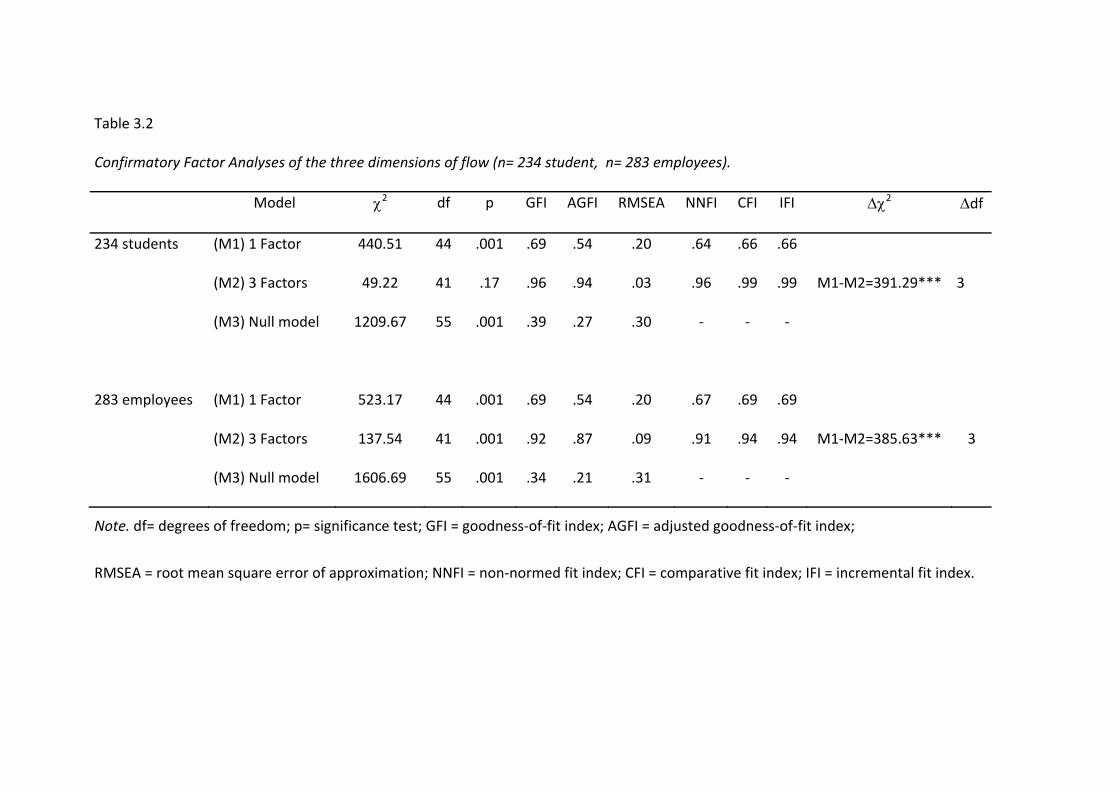
Table 3.2
Confirmatory Factor Analyses of the three dimensions of flow (n= 234 student, n= 283 employees).
Model χ2 df p GFI AGFI RMSEA NNFI CFI IFI Δχ2 Δdf
234 students (M1) 1 Factor 440.51 44 .001 .69 .54 .20 .64 .66 .66
(M2) 3 Factors 49.22 41 .17 .96 .94 .03 .96 .99 .99 M1‐M2=391.29*** 3
(M3) Null model 1209.67 55 .001 .39 .27 .30 ‐ ‐ ‐
283 employees (M1) 1 Factor 523.17 44 .001 .69 .54 .20 .67 .69 .69
(M2) 3 Factors 137.54 41 .001 .92 .87 .09 .91 .94 .94 M1‐M2=385.63*** 3
(M3) Null model 1606.69 55 .001 .34 .21 .31 ‐ ‐ ‐
Note. df= degrees of freedom; p= significance test; GFI = goodness‐of‐fit index; AGFI = adjusted goodness‐of‐fit index;
RMSEA = root mean square error of approximation; NNFI = non‐normed fit index; CFI = comparative fit index; IFI = incremental fit index.
Chapter 3
69
M1 did not fit the data well; the non‐normed fit index (NNFI) and the
comparative fit index (CFI) all fell below the acceptance criterion of .90 (Hoyle, 1995) in
Sample 1 (NNFI= .64; CFI= .66), as well as in Sample 2 (NNFI= .67; CFI= .69). The value
for the root mean square error of approximation (RMSEA) was also higher than the
critical value of .08 (Browne & Cudeck, 1993) in Sample 1 (RMSEA= .20) and also in
Sample 2 (RMSEA= .20). In contrast, the hypothesized model M2 fit the data well, with
values for both relative fit indexes above .90 in Sample 1 (NNFI = .96; CFI = .99) and in
Sample 2 (NNFI = .91; CFI = .94). Also, the value of RMSEA was below .08 in Sample 1
and approached this criterion in Sample 2. The results of the chi‐square difference
between M1 and M2 showed a superior fit of M2 for both samples (see .2 2). Hence, it
was concluded that rather than one undifferentiated dimension, flow includes three
correlated dimensions: absorption, enjoyment and intrinsic interest, which supported
Hypothesis 1.
Factorial Variance/Invariance across samples
In order to assess the invariance of the three‐factor model of flow, it was fitted
simultaneously to the data of both samples, using multigroup analyses (MGA). As can
be seen from Table 3.3, M1 fits well to the data (NNFI, CFI, IFI > .90; RMSEA < .08).
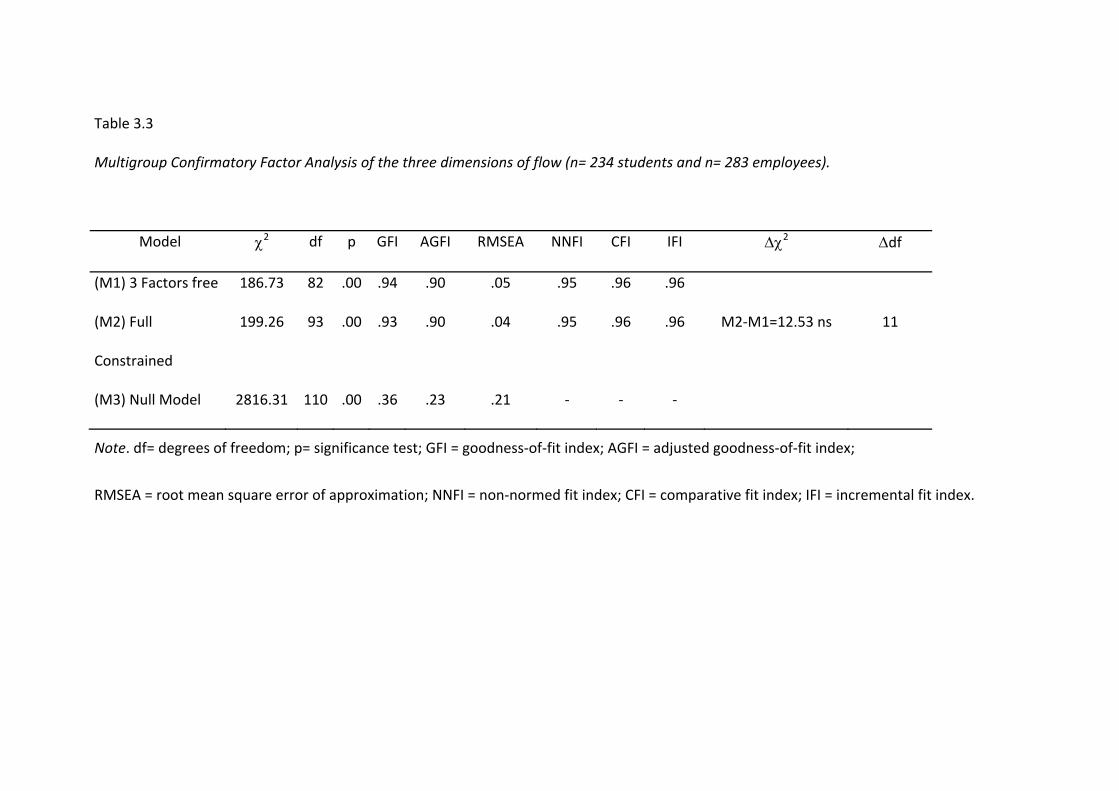
Table 3.3
Multigroup Confirmatory Factor Analysis of the three dimensions of flow (n= 234 students and n= 283 employees).
Model χ2 df p GFI AGFI RMSEA NNFI CFI IFI Δχ2 Δdf
(M1) 3 Factors free 186.73 82 .00 .94 .90 .05 .95 .96 .96
(M2) Full
Constrained
199.26 93 .00 .93 .90 .04 .95 .96 .96 M2‐M1=12.53 ns 11
(M3) Null Model 2816.31 110 .00 .36 .23 .21 ‐ ‐ ‐
Note. df= degrees of freedom; p= significance test; GFI = goodness‐of‐fit index; AGFI = adjusted goodness‐of‐fit index;
RMSEA = root mean square error of approximation; NNFI = non‐normed fit index; CFI = comparative fit index; IFI = incremental fit index.
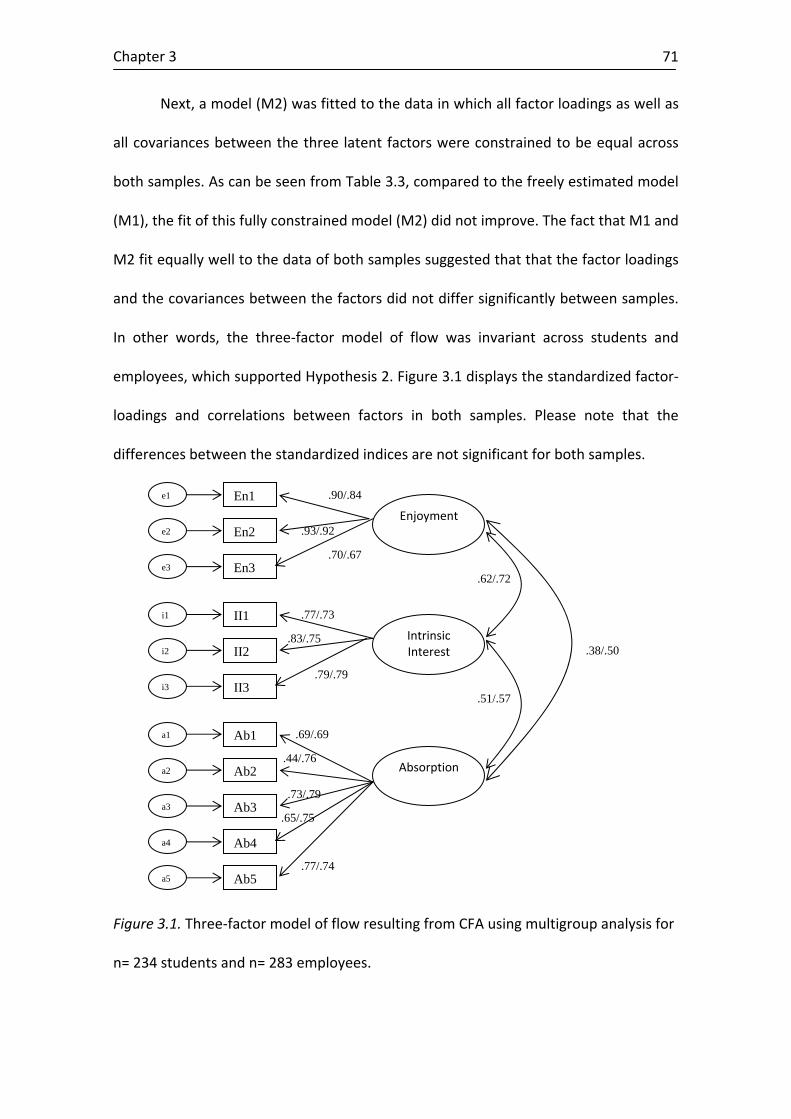
Chapter 3
71
Next, a model (M2) was fitted to the data in which all factor loadings as well as
all covariances between the three latent factors were constrained to be equal across
both samples. As can be seen from Table 3.3, compared to the freely estimated model
(M1), the fit of this fully constrained model (M2) did not improve. The fact that M1 and
M2 fit equally well to the data of both samples suggested that that the factor loadings
and the covariances between the factors did not differ significantly between samples.
In other words, the three‐factor model of flow was invariant across students and
employees, which supported Hypothesis 2. Figure 3.1 displays the standardized factor‐
loadings and correlations between factors in both samples. Please note that the
differences between the standardized indices are not significant for both samples.
Figure 3.1. Three‐factor model of flow resulting from CFA using multigroup analysis for
n= 234 students and n= 283 employees.
.44/.76
.79/.79
.65/.75
.77/.74
.73/.79
.69/.69
.83/.75
.77/.73
.51/.57
.38/.50
.62/.72
.93/.92
II1
Ab1
Ab2
Ab3
Ab4
Ab5
.90/.84
.70/.67
II2
II3
En1
En2
En3
e1
e2
e3
i1
i2
i3
a1
a2
a3
a4
a5
Enjoyment
Absorption
Intrinsic Interest
The story flows on: A multi‐study on the flow experience
72
Discussion
The aim of this study was to investigate the three‐dimensional construct of
flow, absorption, enjoyment and intrinsic interest, among 517 Information and
Communication Technology (ICT) users, and to check its invariance across samples. In
this sense, the results supported Hypothesis 1, that assumed that rather than a unitary
construct, the flow experience is multidimensional and includes absorption, intrinsic
interest and enjoyment. According to the results, 14% and 50% of the variance
between the flow factors was shared, indicating a moderate overlap. In addition, all
the three subscales showed a high degree of internal consistency.
Also, Hypothesis 2 was supported since multigroup analyses showed the
invariance of the three‐factor model of flow across both samples, students and
employees. In other words, the three‐dimensional flow experience can be generalized
across two quite different groups that have in common that they frequently use ICT.
These findings supported the factorial validity of the three‐factor model of flow
that was used in previous studies (Bakker, 2005; Demerouti, 2006; Salanova, et al.,
2006). In addition, the findings also showed that the flow experience can very well be
operationalized using specific rather than general items as used in previous research.
This is a main contribution of the present study. Accordingly, the present study reveals
the need to use items that refer, in this case, to the use of ICT, in order to assess flow
during a specific activity.
As we stated in the introduction, the theoretical framework for the present
study was the three‐dimensional operationalisation of flow used in previous studies
(Bakker, 2005, Demerouti, 2006; Salanova, et al., 2006), except that, in the present
Chapter 3
73
study, flow was considered to be an optimal experience that is by definition related to
specific activities, rather than to the job in general. Although the three previously
mentioned dimensions of flow have been used by others, the present study makes two
main contributions. Firstly, testing the factorial validity of this specific
operationalisation of flow across different samples. And secondly, the use a specific
measure of flow (related to work with ICT) rather a general measure (related to work
in general). In other words, the assessment of the flow experience by means of this
measure was in the context of technology use. Using a specific measure of flow, for
instance in the context of ICT, allows discrimination of flow from a related concept,
work engagement. Work engagement is defined as a persistent, pervasive and positive
affective‐motivational state of fulfilment in employees that is not focused on any
particular object, event, individual or behaviour (Schaufeli, et al., 2002). So the
difference between work engagement and flow is that the former is a more general
and pervasive state of mind that is related to the job as such, whereas the latter is a
specific optimal experience that is of limited duration and is related to a specific
activity. It is plausible that engaged employees are more likely to experience short‐
time, transitory, optimal experiences (flow) during their work, compared to those who
are not engaged. Using the present operationalisation of flow as an optimal experience
that occurs in specific work activities, it was possible to test this hypothesis; In the case
of the more general operationalisation of flow, the concept is almost equivalent with
work engagement. Based on the present results, it is proposed that specific flow
questionnaires be used in future research that are tailored towards specific work
activities such as working with pupils (teachers), manufacturing (craftsmen), research
(R&D employees), solving logistic puzzles (work planners), and so on.
The story flows on: A multi‐study on the flow experience
74
Based on the above reasoning, future research could explore the relationship
between work engagement, as a kind of ‘predisposition’ for experiencing flow, and the
flow experience itself. Also, another relevant issue is to explore the nature of the
activities that are highly related with flow, for instance, in this case it would be
interesting to study the differences, regarding flow experience, between working with
a spreadsheet or working with the PowerPoint. This is also related with a another
avenue for future research, that it is to study the antecedents and consequences of
flow. Various authors have pointed to the issue that in the original definition of flow,
the experience itself is confounded with causes and consequences (Trevino & Webster,
1992; Ghani & Deshpande, 1994; Chen et al., 2000; Finneran & Zhang, 2003). Using the
present flow measure which assesses the flow experience itself, this challenge can be
taken up. Of special interest is to investigate to what extend the three dimensions of
flow that were identified are differently related to antecedents and consequences. In
other words, for future research on flow, it would be interesting to know more about
which the conditions are that are needed to experience flow (antecedents) and the
consequences of its experience.
While it may seem that much has already been achieved, flow research still has
a long way to go. Since Csikszentmihalyi introduced flow in 1975, many researchers
have taken an interest in this intriguing state of optimal experience and studied it in
such different fields as sports, games, music, and work, (Nakamura &
Csikszentmihalyi, 2002). Based on the present results, a brief, specific self‐report
questionnaire that consists of three related dimensions, absorption, enjoyment and
intrinsic interest, could be used for assessing the flow experience itself.
Chapter 4
75
Chapter 4. Technoflow among Spanish and Swedish students: a Confirmatory Factor Multigroup Analysis4
Summary
Despite the relevance of flow in recent research in Positive Psychology, there
exist few studies on this optimal experience in technology settings. The aim of this
study is to confirm the three‐factorial (enjoyment, absorption and intrinsic interest)
structure of technoflow. 154 university students who use computers in their studies
(N=78 Spanish students and N=76 Swedish students) answered a questionnaire.
Confirmatory Factor Analyses showed a better adjustment of a bifactorial model of
technoflow (enjoyment and absorption). Multigroup Analyses showed that the model
is invariant across samples. Practical and theoretical implications as well as future
research are also discussed.
Introduction
Information and Communication Technology (ICT) has become a usual tool in
our daily activities. Literally speaking, computing technology has moved into every
element of our daily lives. Having technology that is useful in our workplaces, homes,
schools, community organizations, is of paramount importance. Then, the study of
Human Computer Interaction is at the center of the evolution of effective tools to
improve the quality of our lives (Olson & Olson, 2003). However, most of the
approaches have been focused on the negative effects of the use of ICT, such as
negative consequences of the implementation of technology (Åborg & Billing, 2003;
Arnetz & Wiholm, 1997; Korunka & Vitouch, 1999; Salanova, 2003; Salanova, Cifre, &
4 Chapter 4 has been published as: Rodríguez‐Sánchez, A.M., Cifre, E., Salanova, M., & Åborg, C. (2008). Technoflow among Spanish and Swedish students: a Confirmatory Factor Multigroup Analysis. Anales de Psicología, 24, 42‐48.
The story flows on: A multi‐study on the flow experience
76
Martin, 1999), burnout (Salanova & Schaufeli, 2000), and technostress (Ballance &
Rogers, 1991; Towell & Lauer, 2001; Salanova et al., 1999). Nevertheless, in the last
decade researchers have turned also their eyes into the positive effects that ICT may
produce, and to the study of the positive attitudes towards ICT and positive
experiences related to this, as affective psychological well‐being (Martínez, Cifre,
Llorens, & Salanova, 2002), engagement and self efficacy (Salanova, Grau, Llorens, &
Schaufeli, 2001; Sensales & Greenfield, 1995; Shih, 2006). Those studies have been
carried out not only in the context of work but also in the context of education.
This desire to understand the positive effects of ICT use might be framed within
the Positive Psychology movement, based on the scientific study of the human virtues
and strengths (Sheldon & King, 2001). One of the most popular concepts in this
context is ‘flow’ (as a ‘good or optimal experience’) as the research and theory on flow
have had its origin in the desire to understand this intrinsic or autotelic (from the
Greek auto‐telos that means intrinsically rewarding by itself) phenomenon.
Flow experience has attracted the interest of a growing number of researchers
since Csikszentmihalyi introduced and explained the concept in his research (e.g.,
Csikszentmihalyi, 1975, 1988, 1990, 1997, 2003). He interviewed artists, athletes,
composers, and scientists, and asked them to describe “optimal experiences” that
made them feel good and motivated because they were doing something that was
worth doing for its own sake. He coined this experience ‘flow’, because many
interviewees used this term spontaneously to explain what their optimal experience
felt like (Csikszentmihalyi & Csikszentmihalyi, 1988). Thus, flow experience is a
condition in which people are so involved in an activity that nothing else seems to
Chapter 4
77
matter at the time; the experience is so enjoyable that people will do it even at great
cost, for the sheer sake of doing it (Csikszentmihalyi, 1990).
Due to flow experience is a phenomenon which is difficult to measure, there is
still no agreement about its operationalisation . However, recently it is generally
accepted that there are three closely related aspects of flow: flow antecedents, flow
experience and flow consequences (Chen, 2006; Chen, Wigand, & Nilan, 1999; Chen,
Wigand, & Nilan, 2000; Ghani & Deshpande, 1994; Trevino & Webster, 1992).These
studies, carried out in the context of ICT use, reveal the necessity to distinguish the
conditions that unleash flow from the flow experience itself. It has to be noted that
researchers interested in the study of flow experience must not confound flow stages
(antecedents, flow experience and flow consequences) with the elements or
dimensions that constitute each stage. In the present study we will focus on the
understanding of flow experience stage by itself.
Experiencing flow using technology: technoflow
Taking up again the issue of ICT positive effects, it might be noticed that flow
experience might easily appear during the use of computers in particular, or ICT in
general, presumably because of the intrinsically motivating nature of these
technologies (Chen et al., 2000; Trevino & Webster,1992) and also because using ICT
represents a clear‐goal activity. Flow while using computers has been studied both in
general (Finneran & Zhan, 2003; Ghani & Deshpande, 1994; Webster, Trevino, & Ryan,
1993) and during performing on‐line or Web activities in particular (Chen, 2006; Chen
et al., 1999; Chen et al., 2000; Skadberg & Kimmel, 2004).
The story flows on: A multi‐study on the flow experience
78
An examination of previous literature reveals that all definitions of flow
experience in general and also in the context of ICT, seem to have three elements in
common. The first refers to the sense of involvement, total concentration, focused
attention or loss of self‐consciousness, in other words, absorption (Chen, 2006;
Csikszentmihalyi, 1975; Ghani & Deshpande, 1994; Novak & Hoffman, 1997; Lutz &
Guiry, 1994; Moneta & Csikszentmihalyi 1996; Trevino & Webster, 1992). A second
common element involves the positive feeling of enjoyment while doing the activity,
which becomes an intrinsically enjoyable experience (Ghani & Deshpande, 1994;
Hedman & Sharafi, 2004; Novak & Hoffman, 1997; Moneta & Csikszentmihalyi, 1996;
Privette & Bundrick, 1987), considered as enjoyment. Last element specifically refers to
the interest in performing the activity for its own sake, not because it has to be done
for one reason or another (Novak & Hoffman, 1997; Moneta & Csikszentmihalyi 1996;
Trevino & Webster, 1992); that is to say, intrinsic interest.
It has to be noted, that intrinsic interest might be understood also as an
antecedent or prerequisite of the flow experience. So, there are still some doubts
about including intrinsic interest as part of the flow experience. Skadberg and Kimmel
(2004) used in their research time distortion (as a result of focused attention and
complete involvement) and enjoyment to measure the state of flow. Also Ghani and
Deshpande (1994) understand that the two key characteristics of flow are (a) total
concentration in an activity and (b) the enjoyment which one derives from an activity.
On the other hand, there are also some studies (Bakker, 2005; Demerouti, 2006;
Salanova, Bakker, & Llorens, 2006) that use the three‐factorial operationalisation
(absorption, enjoyment and intrinsic interest) to measure flow experience. On the
basis of these differences in the operationalisation of flow experience stage, in the
Chapter 4
79
present study we will try to shed some light on this operationalisation. In order to do
that we assume that technoflow (flow in ICT context) is a short‐term peak experience
when using ICT characterized by absorption, enjoyment and intrinsic interest. These
three dimensions might be considered the elements that make up the very experience
of flow while using ICT, or what could be named technoflow.
The aim of the current study is to investigate the structure of technoflow using
two samples (Swedish and Spanish students) in order to test the invariance of the flow
structure. According to previous studies (Novak, Hoffman, & Duhachek, 2003) we will
select only those students that use ICT in their studies (and not in their leisure time), as
it is during these goal‐oriented activities technoflow is more probable to occur.
More specifically, we hypothesize that:
H1: Technoflow experience will be a multidimensional structure composed by
absorption, enjoyment and intrinsic interest.
H2: This three‐factorial structure of technoflow will be invariant across the two
samples.
Method
Participants and Procedure
Sample 1 consisted initially of 234 undergraduate students (66% women) from
five different Spanish universities who voluntary filled out the questionnaire. Ages ranged
from 17 to 43 years old, with a mean age of 23 (SD = 3.8). These students came from
different areas of study from Social Sciences to Technical Sciences. The process of data
collection lasted around 7 months. Although all the students used ICT in their activities
The story flows on: A multi‐study on the flow experience
80
(study, communication and play) we only selected those who reported that they used
ICT in their studies frequently. Thus, the final sample was composed by 78 students, 54
were women (69%) and 24 men (31%). Their mean age was 23 (SD = 3.8).
Sample 2 consisted of 76 undergraduate Swedish students (68% women) from
the Social Sciences and the Technical Sciences area at Örebro University. Ages ranged
from 19 to 37 years old, with a mean age of 24 (SD = 4.2). Data collection lasted
around 1 month. This sample, consists of students who only used computers for their
studies. They voluntarily filled in the questionnaires and returned them directly to the
researcher.
Variables
All students were asked to answer the RED.ICT questionnaire (Resources,
Emotions/Experiences and Demands. Information and Communication Technologies)
in its paper‐and‐pencil version. This questionnaire was developed by the researchers.
The validity of this instrument has been obtained in different previous studies (e.g.,
Salanova, et al., 2006; Schaufeli, Bakker, & Salanova, 2006; Schaufeli, Salanova,
González‐Romá, & Bakker, 2002).The questionnaire is available in Spanish and English.
The Spanish participants filled in the Spanish version and the Swedish students the
English one.
The three dimensions of flow were measured through the following variables
included in the RED.ICT questionnaire, both in Spanish and in English.
Absorption was assessed using a slightly adapted version of the Utrecht Work
Engagement Scale (UWES; Schaufeli et al., 2002). All 5 items were reworded to refer
Chapter 4
81
specifically to ICT work; for instance, the item ‘Time flies when I’m working’ was
rephrased as ‘Time flies when I’m working with computers’.
Intrinsic interest was assessed by 3 self‐constructed items (Salanova et al.,
2006) (e.g., ‘I work with computers because I like them, not because I have to’).
Enjoyment was assessed by 3 self‐constructed items (Salanova et al., 2006)
(e.g., ‘I enjoy the work I do using computers ’).
All items scored on a 6‐point frequency rating scale ranging from ‘0’ (not at
all/never) to ‘6’ (always/every day).
Results
Descriptive Statistics
Data were analysed with the statistical program SPSS 13.0. Descriptive analyses
were performed and internal consistencies were computed for the scales in each
sample separately (see Table 4.1). In all samples values of Cronbach’s α are higher
than the criterion of .70 (Nunnally & Bernstein, 1994). In both samples most scales
satisfied even the more stringent criterion of .80 (Henson, 2001), except for the case of
intrinsic interest in the Swedish sample (α= .77) Then, it can be said that all constructs
that were assessed demonstrated good internal consistencies. Regarding correlations,
we found that the three variables have positive significant correlations with a mean
correlation of r=.57, p<.01. These results are in line with our hypothesis that these
three variables are part of the flow experience.
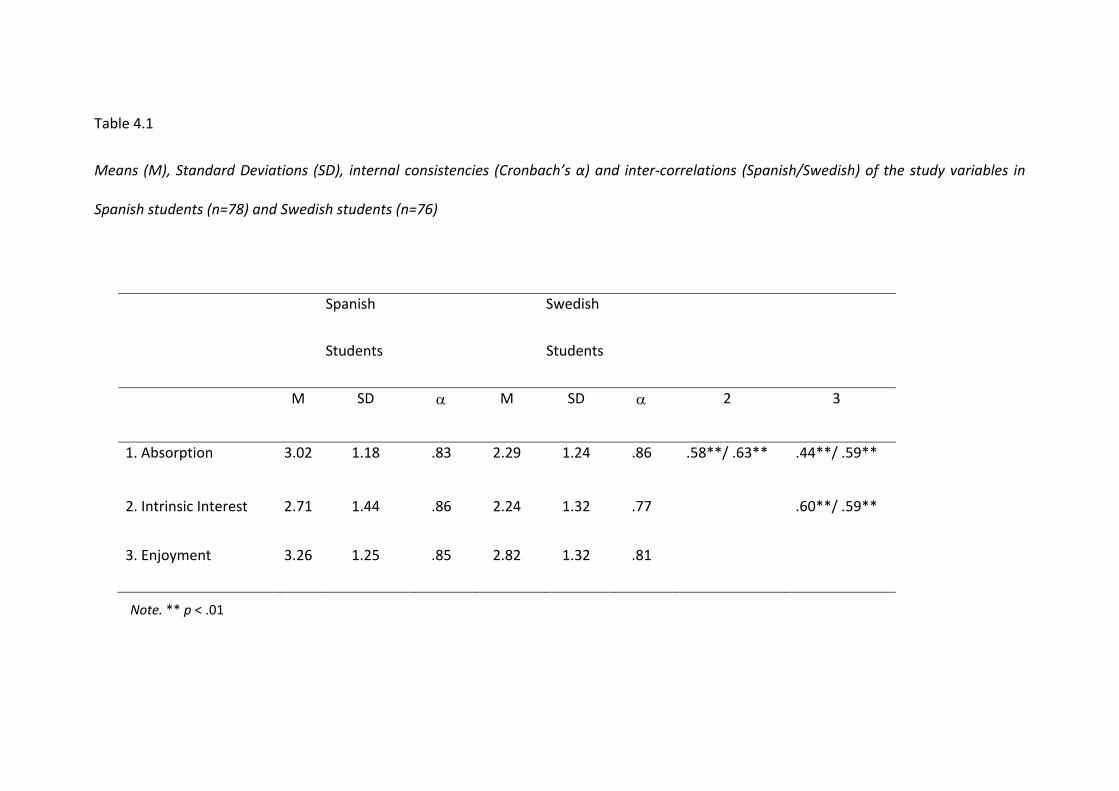
Table 4.1
Means (M), Standard Deviations (SD), internal consistencies (Cronbach’s α) and inter‐correlations (Spanish/Swedish) of the study variables in
Spanish students (n=78) and Swedish students (n=76)
Spanish
Students
Swedish
Students
M SD α M SD α 2 3
1. Absorption 3.02 1.18 .83 2.29 1.24 .86 .58**/ .63** .44**/ .59**
2. Intrinsic Interest 2.71 1.44 .86 2.24 1.32 .77 .60**/ .59**
3. Enjoyment 3.26 1.25 .85 2.82 1.32 .81
Note. ** p < .01
Chapter 4
83
Confirmatory Factor Analyses
In order to test hypothesis 1 Structural Equation Modelling (SEM) was
employed, as implemented by the AMOS program (Arbuckle & Wothke, 1999) to test
two factorial models: (1) the traditional correlated three‐factor flow model including
absorption, intrinsic Interest, and enjoyment (M1); (2) the alternative correlated two‐
factor flow model that includes, what we called, the core of the flow experience
(absorption and enjoyment). Both models were first fitted to the data of each sample
separately, and then, in order to assess factorial invariance across samples, a multi‐
group analysis was performed including both two groups simultaneously, using multi‐
group analyses (Byrne, 2001; pp. 173‐199).
Maximum likelihood estimation methods were used and the input for each
analysis was the covariance matrix of the items. The goodness‐of‐fit of the models was
evaluated using relative and absolute indices. As recommended by Jöreskog and
Sörbom (1986) and Marsh, Balla and Hau (1996), the absolute and relative goodness‐
of‐fit indices computed were: (1) the χ2 goodness‐of‐fit statistic; (2) the Root Mean
Square Error of Approximation (RMSEA); and (3) the Goodness of Fit Index (GFI) (4);
Normed Fit Index (NFI); (5) Incremental Fit Index (IFI); and (6) Comparative Fit Index
(CFI); (7) Expected Cross‐Validation Index (ECVI). Non‐significant values of χ2 indicate
that the hypothesized model fits the data. Values of RMSEA smaller than .08 indicate
an acceptable fit and values greater than 0.1 should lead to model rejection (Cudeck &
Browne, 1993). In contrast, the distribution of the GFI and the AGFI is unknown, so
that no statistical test or critical value is available (Jöreskog & Sörbom, 1986). For all
The story flows on: A multi‐study on the flow experience
84
three relative fit‐indices, as a rule of thumb, values greater than .90 are considered as
indicating a good fit (Hoyle, 1995).
Results of this first step come from performing this three‐factor model using
Confirmatory Factor Analysis (CFA) in order to test hypothesis one. We tested the fit of
M1 (absorption, enjoyment and intrinsic interest) and M2 (absorption and enjoyment)
to the data of all three samples separately.
First of all, CFA were carried out in 234 Spanish students. As can be seen in the
first row in Table 4.2 the three‐factor model (M1) fits the data well. Its fit indexes (GFI,
AGFI, CFI, and NNFI) all meet the acceptance criteria of .90. The value for the RMSEA is
also higher than .08 (.083). Although all this indexes are acceptable, the ECVI, that is
better whenever it is lower, is higher in comparison with the two‐factor model (M2).
The second row in Table 4.2 shows the results for the proposed hypothetical two‐
factor model (M2). We can observe that its fit indexes have values above .90. On the
other hand, the Root Mean Square Error of Approximation (RMSEA) has a value under
.08 (.079). Therefore, the data fit well to the proposed model, with a high quality of
these fit‐indexes, even the ECVI is better and lower than M1.
As a second step, a CFA was performed in order to test the fit of M1
(absorption and enjoyment, including intrinsic interest) and M2 (only absorption and
enjoyment) again in a different sample composed by 76 Swedish students. Results are
shown in third and fourth rows of Table 4.2. As it can be seen M2 fits slightly better
than M1 in the Swedish sample due to the ECVI is better when we test the two‐factor
model.
Chapter 4
85
The third step was to test the model among Spanish students with the same
conditions as the Swedish sample. 78 students were selected from the whole Spanish
sample on the criteria of using ICT only for their studies (as it has been explained
before). Results are shown in fifth and sixth rows of Table 4.2. As it can be seen M2 fits
slightly better than M1 also in the Spanish sample due to the ECVI is better when we
test the two‐factor model.
Hence, on balance, it can be concluded that M2, which includes only two
variables/dimensions as flow core (absorption and enjoyment), fits slightly better or at
least equally well, to the data than the model (M1) which includes also intrinsic
interest.
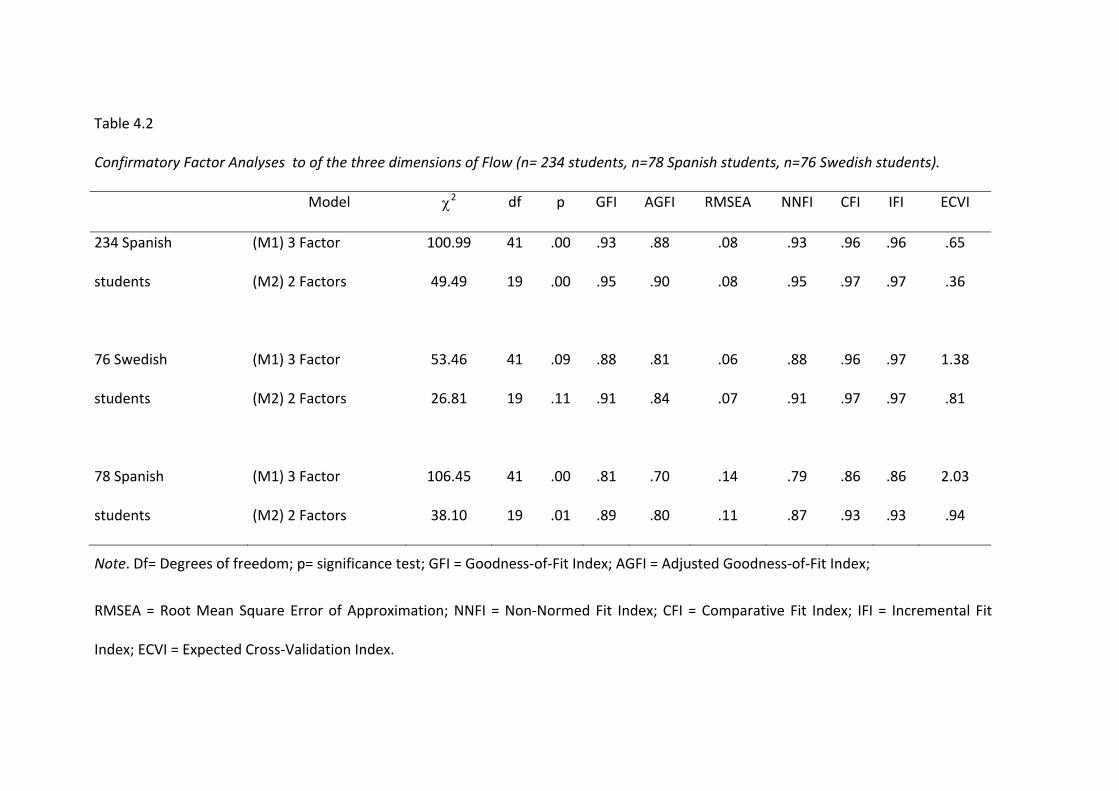
Table 4.2
Confirmatory Factor Analyses to of the three dimensions of Flow (n= 234 students, n=78 Spanish students, n=76 Swedish students).
Model χ2 df p GFI AGFI RMSEA NNFI CFI IFI ECVI
234 Spanish (M1) 3 Factor 100.99 41 .00 .93 .88 .08 .93 .96 .96 .65
students (M2) 2 Factors 49.49 19 .00 .95 .90 .08 .95 .97 .97 .36
76 Swedish (M1) 3 Factor 53.46 41 .09 .88 .81 .06 .88 .96 .97 1.38
students (M2) 2 Factors 26.81 19 .11 .91 .84 .07 .91 .97 .97 .81
78 Spanish (M1) 3 Factor 106.45 41 .00 .81 .70 .14 .79 .86 .86 2.03
students (M2) 2 Factors 38.10 19 .01 .89 .80 .11 .87 .93 .93 .94
Note. Df= Degrees of freedom; p= significance test; GFI = Goodness‐of‐Fit Index; AGFI = Adjusted Goodness‐of‐Fit Index;
RMSEA = Root Mean Square Error of Approximation; NNFI = Non‐Normed Fit Index; CFI = Comparative Fit Index; IFI = Incremental Fit
Index; ECVI = Expected Cross‐Validation Index.
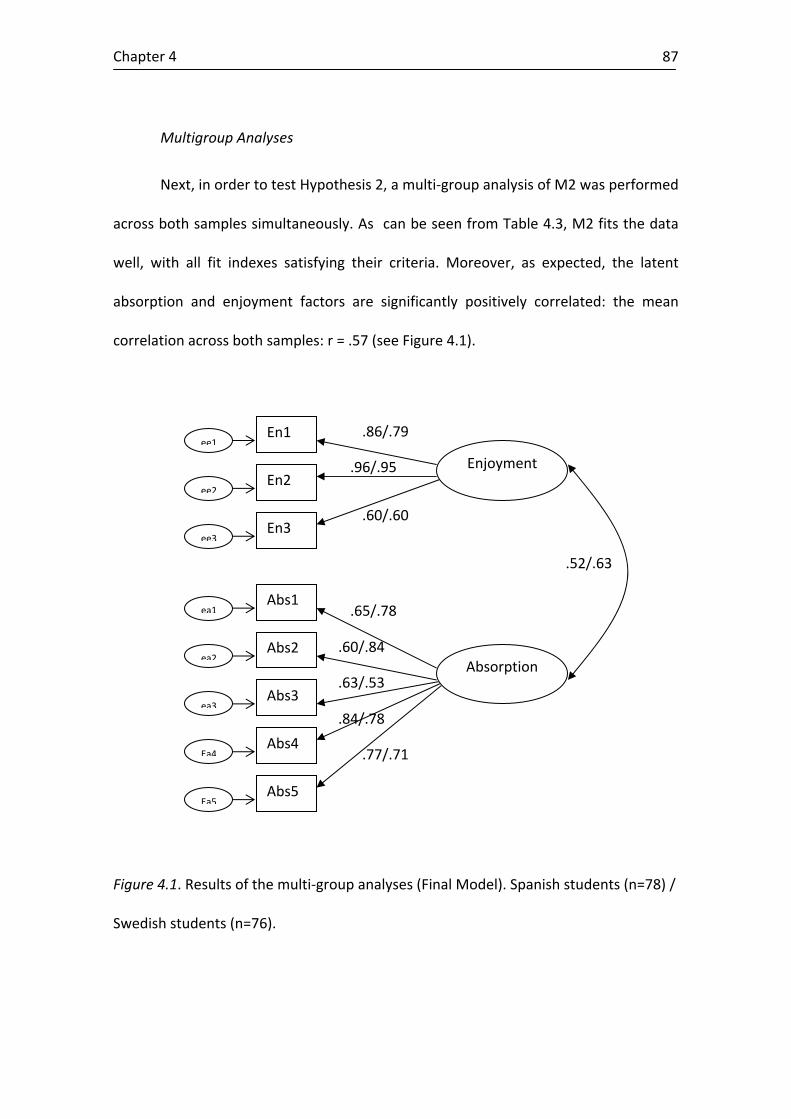
Chapter 4
87
Multigroup Analyses
Next, in order to test Hypothesis 2, a multi‐group analysis of M2 was performed
across both samples simultaneously. As can be seen from Table 4.3, M2 fits the data
well, with all fit indexes satisfying their criteria. Moreover, as expected, the latent
absorption and enjoyment factors are significantly positively correlated: the mean
correlation across both samples: r = .57 (see Figure 4.1).
Figure 4.1. Results of the multi‐group analyses (Final Model). Spanish students (n=78) /
Swedish students (n=76).
.52/.63
Abs1 ea1
Abs2 ea2
Abs3 ea3
Abs4 Ea4
Abs5 Ea5
.65/.78
.60/.84
.63/.53
.77/.71
.84/.78
En1 ee1
En2 ee2
En3 ee3
.86/.79
.96/.95
.60/.60
Enjoyment
Absorption
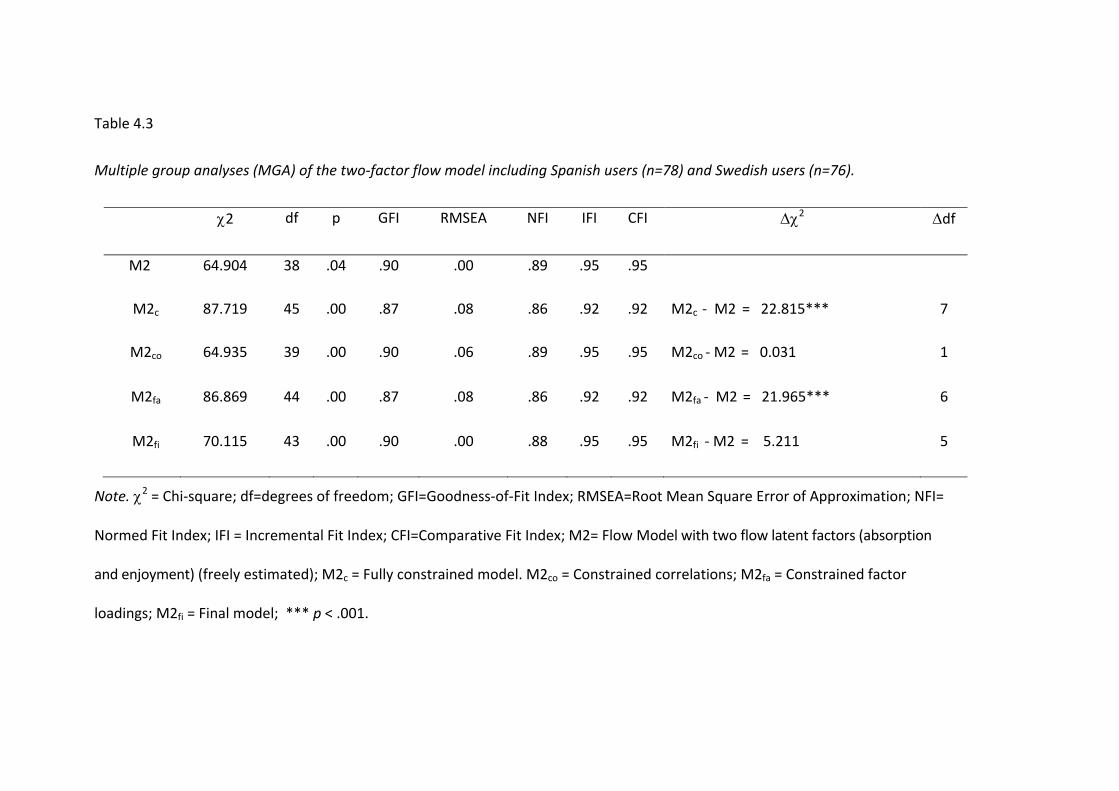
Table 4.3
Multiple group analyses (MGA) of the two‐factor flow model including Spanish users (n=78) and Swedish users (n=76).
χ2 df p GFI RMSEA NFI IFI CFI Δχ2 Δdf
M2 64.904 38 .04 .90 .00 .89 .95 .95
M2c 87.719 45 .00 .87 .08 .86 .92 .92 M2c ‐ M2 = 22.815*** 7
M2co 64.935 39 .00 .90 .06 .89 .95 .95 M2co ‐ M2 = 0.031 1
M2fa 86.869 44 .00 .87 .08 .86 .92 .92 M2fa ‐ M2 = 21.965*** 6
M2fi 70.115 43 .00 .90 .00 .88 .95 .95 M2fi ‐ M2 = 5.211 5
Note. χ2 = Chi‐square; df=degrees of freedom; GFI=Goodness‐of‐Fit Index; RMSEA=Root Mean Square Error of Approximation; NFI=
Normed Fit Index; IFI = Incremental Fit Index; CFI=Comparative Fit Index; M2= Flow Model with two flow latent factors (absorption
and enjoyment) (freely estimated); M2c = Fully constrained model. M2co = Constrained correlations; M2fa = Constrained factor
loadings; M2fi = Final model; *** p < .001.
Chapter 4
89
Following the procedure recommended by Byrne (2001), the invariance of M2
across both samples was investigated (see Table 4.3). The invariance of correlations
between factors and the invariance of factor loadings was assessed by comparing the
fit of the model in which the targeted estimates were constrained to be equal across
all both samples (M2c) with that of the unconstrained model (M2) in which this was
not the case. When the fit did not deteriorate, the model was deemed to be invariant
across samples. However, compared to M2 the fit of the fully constrained model (M2c)
deteriorated significantly, meaning that the correlations and the factor loadings of M2
are not invariant across samples.
Next, a model with only the correlations between the latent factors constrained
to be equal (M2co) as well as a model with only the factor loadings constrained to be
equal (M2fa) was simultaneously fitted to the data of the two samples, respectively.
Again, compared to M2 the fit of M2fa deteriorated significantly but not the fit of
M2co. The model with the correlations where the latent factors were constrained to
be equal was deemed to be invariant across samples. In order to constrain as much
factors loadings as possible, different models with factors loadings constrained were
fitted to data. Finally, a model was tested with factor correlations and all factors
loadings constrained to be equal between both samples, except paths from ABS to
items Abs1 and Abs2 what were free because when were constrained the fit of the
models were deteriorated significantly. Compared to M2 the fit of M2fi did not
deteriorate, so that it can be concluded that the correlations between factors and
almost all the factor loadings are invariant across both samples.
The story flows on: A multi‐study on the flow experience
90
From these results, we can say that hypothesis 1 was partially confirmed,
although the model was consistent among samples, the two dimensional model of
technoflow fits better to the data than the three‐dimensional one. Also this two‐factor
structure is invariant across the two samples. This result confirms the hypothesis 2;
absorption and enjoyment are the core elements of the technoflow experience.
Discussion
The main aim of the current study was to test the dimensions of technoflow
and its invariance across samples. As predicted by Hypothesis 1, technoflow
experience was composed of absorption, enjoyment and also of intrinsic interest.
However, results show that the bifactorial model of technoflow (absorption and
enjoyment) showed a better adjustment to data than the three‐factorial model . Thus,
we can say that the so‐called core of flow is made up by enjoyment and absorption.
This result was consistent among the two samples studied. So, hypothesis one is
partially confirmed.
The role of intrinsic interest in the flow experience is a difficult issue in this
research field due to several reasons. One is because the difficulty, as has been
mentioned, of discriminating it as a part or not of the flow experience. This study tries
to take a step further in the clarification of this question: What kind of role is intrinsic
interest playing in the flow experience? The interesting results found in relation to this
bidimensionality of technoflow concerns the possibility of considering intrinsic interest
as an antecedent of the flow experience. In this line, more research in terms of
antecedents of technoflow need to be done. For instance, it is not a crackpot idea to
think that intrinsic interest could be related to high levels of flow (absorption and
enjoyment) and satisfaction. In fact, there are authors (e.g. Finneran & Zhang, 2003)
Chapter 4
91
that state that task should have particular characteristics (intrinsically interesting) that
may influence the likelihood of an optimal experience.
Another reason why intrinsic interest is a slippery issue is the difficulty to also
operationalise this concept. It has to be noted, that we label this concept intrinsic
interest instead of intrinsic motivation as some authors do (Bakker, 2005; Moneta,
2004). According to the meaning of flow, items refer to flow like a peak experience
related with a specific activity (in this case technology use) rather than a general
behaviour during the studies or daily life. Motivation is a wide and general concept,
and ‘interest’ comes from ‘motivation’ but is related with a very specific activity and
moment. That is why we rather prefer measuring intrinsic interest than intrinsic
motivation.
On the other hand, and regarding Hypothesis 2, a strong point of this study is
its multisampling character. The current findings show the stability of the
bidimensional structure of technoflow among samples. It opens a new slope on the
operationalisation of technoflow experience. The results still need to be interpreted
with some caution and to be seen as tentative because of the small size of the
samples. It also would be interesting to replicate our results in some other countries
using different and heterogeneous samples, in order to test the strength of this
technoflow structure. That is why more research in this line is needed, the present
study takes a first step on it.
Taken together, our results seem to suggest that rather than a three‐factor
model of flow, genuine enjoyment and absorption constitute the core of flow (or
technoflow) experience. This agrees not only with the theoretical view that absorption
The story flows on: A multi‐study on the flow experience
92
is one of the central characteristics of flow (Csikszentmihalyi, 1975), and also
enjoyment is experienced on this optimal experience, but also with previous research
on the structure of flow (Ghani & Deshpande, 1994; Novak & Hoffman, 1997; Moneta
& Csikszentmihalyi, 1996; Privette & Bundrick, 1987). In addition, our findings also
show that the flow experience can very well be operationalised using specific rather
than general items. That is, items that refer – in our case – to the use of ICT. In this
sense, the present work shows the validity of the measures employed in order to
assess technoflow. In sum, the novelty of this study regarding the findings on the
structure of technoflow experience as bidimensional, fulfils the parsimony principle. It
is also a fairly practical measure with an added value: its applicability.
Chapter 5
93
Chapter 5. An Electronic Diary Study on Daily Flow Patterns5
Summary
This study explores the daily flow patterns related to working and non‐working
tasks among healthy and burned‐out individuals using the Experience Sampling
Method. The main aim is to explore patterns of flow in everyday life using an
alternative operationalisation that focuses on the flow experience itself, rather than on
the combination of high challenge and high skills. Forty healthy participants and sixty
clinically burned‐out individuals kept an electronic diary on activities (work/non‐work),
and levels of flow (enjoyment and absorption) for 14 days, and made entries several
times a day (3‐7), thus rendering 5,455 diary entries. A curvilinear daily flow pattern
was observed, with lower levels of flow during working hours (10‐16h). Moreover, we
found differences between both components of flow: enjoyment was higher when
performing non‐working tasks, whereas absorption was higher when working. There
were no differences in daily flow patterns between the healthy and burned‐out group,
although the mean levels of flow differed significantly with the former experiencing
more flow than the latter. In sum, the results confirmed the validity of the alternative
way of measuring flow by using enjoyment and absorption as its indicators.
Introduction
Flow experiences have captured the attention of a growing number of
researchers since Csikszentmihalyi introduced the concept in the mid 1970s (e.g.,
Csikszentmihalyi, 1975, 1988, 1990, 1997, 2003). He interviewed artists, athletes,
composers, and scientists, and asked them to describe the “optimal experiences” that
5 Chapter 5 has been submitted for publication as: Rodríguez‐Sánchez, A.M., Schaufeli, W., Salanova, M., Cifre, E., & Sonnenschein, M. An electronic diary study on daily flow patterns.
The story flows on: A multi‐study on the flow experience
94
made them feel good and motivated as they were doing something that was worth
doing for its own sake. He coined this experience ‘flow’ because many interviewees
used this term spontaneously to explain what their optimal experience felt like
(Csikszentmihalyi & Csikszentmihalyi, 1988). Thus, flow is a condition in which people
are so involved in an activity that nothing else seems to matter at the time, and the
experience is so enjoyable that people will do it even at great cost for the sheer sake of
doing it (Csikszentmihalyi, 1990). Chen (2006) defined flow as a state that is
“characterized by enjoyable feelings, concentration, immersion, and intensive
involvement” (p. 222). In a similar vein, Ghani and Deshpande (1994, p. 383) described
flow in the context of human‐computer interaction, as: “(a) total concentration in an
activity and (b) the enjoyment which one derives from an activity”. Both definitions
include two key elements: enjoyment or pleasure and immersion or absorption.
Although these definitions of flow seem to be clear, some problems exist in
operationalizing the construct. This is mainly due to the difficulty of assessing or
‘capturing’ the flow experience as it is a momentary and brief experience.
Traditionally, the flow experience is measured in terms of the combination (i.e.
product) of high challenges and high skills (Csikszentmihalyi & Lefevre, 1989;
Delespaul, Reis, & deVries, 2004; Delle Fave, Bassi, & Massimini, 2003; Eisenberger,
Jones, Stinglhamber, Shanock, & Randall, 2005). Namely, “when both challenges and
skills are high, the person is not only enjoying the moment, but also stretching his or
her capabilities with the likelihood of learning new skills and increasing self‐esteem
and personal complexity. This process of optimal experience has been called flow”
(Csikszentmihalyi & Lefevre, 1989, p. 816). So, according to Csikszentmihalyi and
Lefevre (1989) perceived challenge and skills are both antecedents of flow and
Chapter 5
95
constitute the experience itself. More recently, Nakamura and Csikszentmihalyi (2002)
concur with this view and state that a match of high perceived skills and high
challenges is a necessary – but not sufficient – prerequisite to experience flow. But
how can flow in everyday life be measured best? In terms of prerequisites (the
combination of high challenges and high skills), or in terms of momentary experience
itself? In our study we decided for the latter because we would like to make a
conceptual distinction between the major antecedent of flow (i.e., the match of high
challenges with high skills) and the actual flow experience itself (i.e., enjoyment and
absorption).
The Nature of Flow
A review of the literature reveals that all definitions of flow experience seem to
have three elements in common. The first refers to a sense of deep involvement and
total concentration, in other words, absorption (Chen, 2006; Csikszentmihalyi, 1975;
Ghani & Deshpande, 1994; Novak & Hoffman, 1997; Lutz & Guiry, 1994; Moneta &
Csikszentmihalyi, 1996; Trevino & Webster, 1992). A second common element involves
the positive feeling of enjoyment while being engaged in the activity, in other words
enjoyment (Ghani & Deshpande, 1994; Hedman & Sharafi, 2004; Novak & Hoffman,
1997; Moneta & Csikszentmihalyi, 1996; Privette & Bundrick, 1987). The final element
specifically refers to the interest in performing the activity for its own sake and not
because of external demands or pressures, in other words intrinsic interest. (Novak &
Hoffman, 1997; Moneta & Csikszentmihalyi 1996; Salanova, Bakker, & Llorens, 2006;
Trevino & Webster, 1992). We would like to point out that ‐‐ in our view ‐‐ rather than
a constituting element of flow, intrinsic interest might acts as an antecedent or
The story flows on: A multi‐study on the flow experience
96
prerequisite of the flow experience itself (Rodríguez‐Sánchez, Cifre, Salanova, & Åborg,
2008). Furthermore, conceptually speaking, intrinsic interest should be conceived as a
motivational factor that drives a person to engage in a particular intrinsically rewarding
activity. By doing so, the likelihood of experiencing flow is increased. However, during
the flow experience itself, intrinsic interest is not experienced. Hence, for empirical
and conceptual reasons we limit the flow experience to enjoyment and absorption,
thereby excluding intrinsic interest (cf. Chen, 2006; Csikszentmihalyi, 1990; Ghani &
Deshpande, 1994). More specifically, enjoyment is considered to be the emotional
component of flow and absorption its cognitive component.
Flow in Healthy and Non‐healthy Individuals
As the flow experience is positive by its very nature, it is plausible that ‘healthy’
individuals are more likely to experience flow than ‘non‐healthy’ individuals. Perhaps
for that reason previous research on flow typically used healthy samples. However, in
the current study, we also use an non‐healthy, burned‐out group by way of contrast. In
doing so we investigate the implicit claim of previous flow studies that flow
experiences are typically found in healthy individuals. Burnout is defined as a chronic,
work‐related stress reaction characterized by exhaustion (i.e., fatigue due to excessive
work demands), cynicism (i.e., indifferent, detached and distant attitudes toward one’s
work) and a lack of professional efficacy (i.e., the tendency to evaluate one’s work
negatively and feel incompetent) (Maslach, Schaufeli, & Leiter, 2001). However, there
is accumulating evidence that exhaustion and cynicism constitute the core of burnout
(Schaufeli & Taris, 2005). Being a positive psychological state that is constituted by
enjoyment and absorption, it is plausible that flow is negatively related to burnout, as
conceived by exhaustion and cynicism. For instance, it is difficult to imagine that a
Chapter 5
97
burned‐out individual, who is cynical and doubts the significance of his or her work,
may experience flow which is characterized by opposite experiences such as
enjoyment and absorption. Therefore, we expect that:
Flow levels are significantly higher in healthy individuals as compared to
burned‐out individuals (Hypothesis 1).
Daily Fluctuations in Flow
Research into the dynamics of daily fluctuations of flow experiences is scarce.
In fact, most of the studies relate flow experiences across the day with particular
activities, such as studying, doing homework, socializing, arts and hobbies (e.g. Carli,
Delle Fave, & Massimini, 1988; Massimini & Carli, 1988). But how does flow fluctuate
across the day? As far as we know, only Guastello, Johnson and Rieke (1999) paid
attention to fluctuations of flow across time, and found that flow fluctuates in a non‐
linear dynamical fashion over a period of one week. However, time‐flow correlation
was not examined in terms of time spent working.
Because flow includes an affective component (enjoyment), the literature on
daily fluctuations of emotions might be helpful in understanding patterns of flow
across time. Research shows that emotions exhibit non‐linear rather than linear
patterns of change in diurnal (e.g. Murray, Allen, Trinder, & Burgess, 2002; Rusting &
Larsen, 1998) and weekly cycles (e.g. Larsen & Kasimatis, 1990). Most likely, the reason
is that human emotions follow diurnal biological rhythms. For instance, Clark, Watson
and Leeka (1989) found that various indicators of positive affect rose sharply from
early morning until noon, then they remained relatively constant until 9 p.m., and then
fell rapidly. Murray (2007) found similar results suggesting that positive affect
The story flows on: A multi‐study on the flow experience
98
displayed a diurnal rhythm in which a quadratic wave form was most prominent,
consistent with the presence of a circadian component, typically experienced as a
positive mood variation with mood being worse upon waking and better in the evening
(Boivin et al., 1997; Koorengevel, Beersma, Gordjin, den Boer, & van den Hoofdakker,
2000). These results suggest that positive affect follows a diurnal rhythm and shows a
non‐linear pattern characterized by an inverted U shape. It seems that the typical
quadratic wave form found in diurnal positive affect under normal sleep‐wake
conditions can be understood as a segment of the 24‐hour circadian rhythm (Clark et
al., 1989).
Since our conceptualization of flow also includes a cognitive component (i.e.,
absorption) research on circadian rhythms in human cognition is of relevance too. For
instance, Schmidt, Collette, Cajochen, and Peigneux (2007) observed that time‐of‐day
modulations impacts the performance on several cognitive tasks, and that these
performance fluctuations are additionally contingent upon inter‐individual differences
in the circadian preference. Besides this study found that some cognitive processes
were particularly sensitive to variations at the circadian arousal level, whereas others
were less affected.
Based on the diurnal variation found in positive affect and some cognitions, we
hypothesize that:
The flow experience is related to time of day according to a diurnal pattern
characterized by inverted U shape (Hypothesis 2).
In addition, fluctuations in positive affect also appear to relate with socially
determined rhythms, including the day of the week and the season of the year (e.g.,
Rossi & Rossi, 1977; Smith, 1979; Stone, Hedges, Neale, & Satin, 1985). In the present
Chapter 5
99
study we also explore differences in flow between weekdays and weekends. Following
Csikszentmihalyi and LeFevre (1989) we expect that flow will be higher during
workdays as compared to with weekends. Please note that we do not simply replicate
this study because the operationalisation differs fundamentally. Whilst
Csikszentmihalyi and LeFevre (1989) use the match of high challenge and high skills,
we use absorption and enjoyment as indicators of the flow experience itself. As
elucidated above, in our view the combination of high challenge and high skills
constitutes a necessary prerequisite for the flow experience but is not identical to the
experience itself. Hence, we hypothesize that:
Levels of flow tend to be higher on working days as compared to weekends
(Hypothesis 3).
Flow in Working and Non‐Working Tasks
As noted above, it has been observed that individuals report more flow
experiences during work than off‐work, but at the same time – and quite paradoxically
– they prefer leisure above work. This is known as the ‘paradox of work’
(Csikszentmihalyi, 1990): work is likely to provoke more flow experiences than leisure,
but leisure is preferred above work. Since we operationalized flow in terms of two
dimensions we are able to study the paradox in greater detail. Namely, on the one
hand, based on the study of Csikszentmihalyi and LeFevre (1989), that was recently
replicated by Rheinberg, Manig, Kliegl, Engeser and Vollmeyer (2007), we expect that
particularly levels of enjoyment are higher in non‐working tasks as compared to
working tasks. On the other hand, working tasks are by definition goal directed and
usually include cognitive processes that require concentration and a certain amount of
absorption (Schmidt et al., 2007). Or put differently, ‘concentration’ (Schallberger &
The story flows on: A multi‐study on the flow experience
100
Pfister, 2001) – or absorption in our terms – is more characteristic for working
activities than for non‐working activities. Thus, we expect that:
Enjoyment is positively related to non‐working tasks, whereas absorption is
positively related to working tasks (Hypothesis 4).
Finally, since there is no a priori reason why ‘healthy’ and ‘non‐healthy’
individuals would differ in terms of their daily patterns of flow experiences, we
hypothesize that the daily patterns of flow experiences are similar for healthy and
burned‐out individuals (Hypothesis 5). Please note that Hypothesis 1 assumes that the
levels of flow differ between healthy and non‐healthy individuals.
Method
Participants
The participants were 40 healthy individuals (M age = 41.8, SD = 9.98: 65%
females; 65% educated at college/university) from different occupational groups, and
60 clinically burned‐out individuals (M age = 42.9, SD = 8.75: 55% females; 58%
educated at college/university). Healthy participants were recruited through
newspaper advertisements (25%) and personal contacts (75%). In order to be labelled
“healthy”, participants had to score below the validated cut‐off points for burnout
(Schaufeli, Bakker, Hoogduin, Schaap, & Kladler, 2001) on the Dutch version of the
Maslach Burnout Inventory – General Survey (MBI‐GS) (Schaufeli & Van Dierendonck,
2000). Sixty healthy participants responded to the call, and 50 healthy participants
(83%) returned the screening questionnaire. Three healthy participants produced
unreliable data because they disregarded the instructions. In addition, seven
participants were excluded given their high burnout scores (MBI; n = 5) or for having
Chapter 5
101
an age exceeding the range (18‐65 years) that was established for the current study (n
= 2).
Clinical burned‐out participants were recruited from new enrollments of Dutch
centers of expertise in burnout treatment (42%) and through the Internet (58%). The
burned‐out and control groups were matched for gender, age and level of education in
order to prevent intergroup differences which may attribute to these variables. We
classified participants as “clinically burned‐out” when they suffered from severe
burnout complaints according to the validated cut‐off points from the MBI‐GS
(Schaufeli, et al., 2001). Burnout recruitment rendered 409 responses, of whom 289
(71%) were willing to participate, and 65 respondents (22%) actually met the inclusion
criteria. The relatively small number of participants that was included was mainly due
to the fact that many clinical burned‐out individuals received another diagnoses as
well (mostly depression), and/or used of antidepressants. Three clinically burned‐out
participants decided to leave the project during the first week of the dairy study
because they considered that the effort required was too high. The data of two
burned‐out participants were lost because of technical problems. The burned‐out and
control groups were matched for gender, age and level of education in order to
prevent intergroup differences which may attribute to these variables.
The final sample was composed of 100 participants, 40 healthy and 60 clinically
burned‐out participants. All burned‐out participants were on sick leave; 53% were on
full sick leave and 47% on partial sick leave. The average period of sick‐leave was four
months (SD= 3.60). Partial sick leave in the Netherlands occurs within the framework
of a rehabilitation program, that is, when an employee is considered fit to work for
only a part of the contractual working hours. Please note that this sample has been
The story flows on: A multi‐study on the flow experience
102
used before in another study on energy erosion and burnout (see: Sonnenschein,
Sorbi, van Doornen, Schaufeli, & Maas, 2007). Instead of burnout, the current study
focuses on flow experiences.
Participants received an informed consent form and a 1‐hour instruction at
home on the use of the electronic diary. They received a telephone call two days later
to discuss their first experiences and potential problems. Telephone support was also
available during the entire recording period, which concluded with a debriefing
interview and the collection of the personal digital assistant pocket computer, and
offering a remuneration of €25 (roughly 30 US$). The Medical Ethics Review
Committee of the Utrecht University Medical Centre approved the study.
The Electronic Diary Study
In order to test our hypotheses, we used a technique that allows the ‘capturing’
and assessment of flow experiences related to any kind of activity and time of the day.
In addition, this technique avoids the retrospection bias produced by questionnaires at
the end of the day or the week, because these require a remembering and cognitive
integration of past experiences (Peters et al., 2000; Stone, Broderick, Shiffman, &
Schwartz, 2004).
Evidence shows that studying the same person repeatedly makes it possible to
estimate stability and change in a person’s everyday life (Zautra, Affleck, Davis,
Tennen, & Fasman, 2007). Thus, diurnal patterns of flow experiences can be
investigated by taking measurements with the Experience Sampling Method (ESM)
several times a day. A number of studies have focused on flow using the ESM
(Csikszentmihalyi, Larson, & Prescott, 1977), since this method allows for the repeated
Chapter 5
103
assessment of subjects’ experiences in their natural environment (Massimini,
Csikszentmihalyi, & Carli, 1987; Christensen, Barrett, Bliss‐Moreau, Lebo, & Kaschub,
2003). Moreover, an electronic diary allows the assessment of within‐person
fluctuations of symptoms (Bolger, Davis, & Rafaeli, 2003). In addition to accuracy and
ecological validity, an electronic diary provides the unique opportunity to acquire
diurnal patterns of the flow experience.
Measurements
All variables used in this study were obtained by means of an electronic diary.
The diary was programmed into a PalmOneTM personal digital assistant (PDA) pocket
computer with an integrated alarm and soft‐touch screen, allowing for simultaneous
presentation and the answering of items. Each day for two consecutive weeks, the
participants filled an average of five alarm‐controlled diaries. A beeping signal occurred
randomly within 2.5 hour time units and prompted participants to fill in the alarm‐
controlled diary. All diary entries were automatically time‐stamped and the variables
of the present study were assessed: enjoyment and absorption with single questions
according to ESM premises; items are to measure states instead of constructs, and
they mimic an internal dialog. They must be concise and presented in a common
language (Delespaul, 1995). Two flow items were selected from the Utrecht Work
Engagement Scale (UWES; Schaufeli, Salanova, González‐Romá, & Bakker, 2002) based
on their face validity and their high factor‐loadings. These items are: “I enjoy what I’m
doing now” (enjoyment) and “I’m engrossed in what I’m doing” (absorption) The
answers were scored on a 7‐point anchored Likert scale ranging from 1 = not at all to 7
= very much. So flow was defined as a continuous variable (cf. Csikszentmihalyi, &
Csikszentmihalyi, 1988; Delle Fave & Massimini, 2005b) consisting of an emotional
The story flows on: A multi‐study on the flow experience
104
(enjoyment) and a cognitive (absorption) component that were averaged in an overall
flow measure.
In addition to flow experiences (i.e. enjoyment and absorption), the diary
provided other information, such as the time of the day the beep signaled, the day of
the week, and if the participant was engaged in working tasks or non‐working tasks.
The study yielded a total of 5,455 alarm‐controlled diaries. On average, a participant
rendered 71 alarm‐controlled diaries, which equals a response of 81%, indicating that
compliance was high in both groups. No influence of the method itself on the
measurements (reactivity) was detected. These results are presented elsewhere; see
Sonnenschein, Sorbi, Van Doornen and Maas (2006).
Statistical Analyses
We carried out descriptive analyses and ANOVAs using the statistical software
package SPSS 15. In order to test the study hypotheses, we employed multilevel
regression modeling (Hox, 2002), a method recommended for ESM‐data (Schwartz, &
Stone, 1998) because it accounts for within‐subject dependencies of data points (since
diary entries are nested within days, which are nested in their turn within
participants). Longitudinal data can be viewed as multilevel data, with repeated
measurements nested within individuals (Hox, 2002). Using multilevel models to
analyze the repeated measures data offers several advantages, which Bryk and
Raudenbush mentioned (1992). One of these advantages is that multilevel analysis can
handle missing data. More accurately, this refers to the ability to handle models with
varying time points. As multilevel regression models do not assume equal numbers of
observations, respondents with missing observations pose no special problems here,
and all cases can remain in the analysis (Hox, 2002). Within multilevel analyses, it is
Chapter 5
105
possible to test and compare several models starting with a null model that includes
only the intercept. In the following steps, the consecutive addition of predictor
variables is possible at the different levels, and improving one model based on a
previous one can be examined using a likelihood ratio statistic (Sonnentag, 2001). To
run multilevel analyses, we employed the MlwiN 2.02 program (Rashbash, Browne,
Healy, Cameron, & Charlton, 2005). In our study, data on three levels were available:
at the beep level (time and working tasks), at the day level (weekend or weekday), and
at the person level (the healthy group or the burned‐out group).
Results
Preliminary Analyses
Table 5.1 shows the means, standard deviations and correlations between the
study variables at the person level, that is to say, we aggregated diary records to
obtain the individual averages (M) and the within‐person variability (SD). Table 5.1 also
displays the correlations between the variables at the same time, that is to say, at the
first level, the beep or time level (n = 4,017 – 5,455). As can be seen in Table 5.1, both
components of flow substantially correlate at the person level (r = .73; p < .001) as well
as at the time level (r = .62; p < .001).
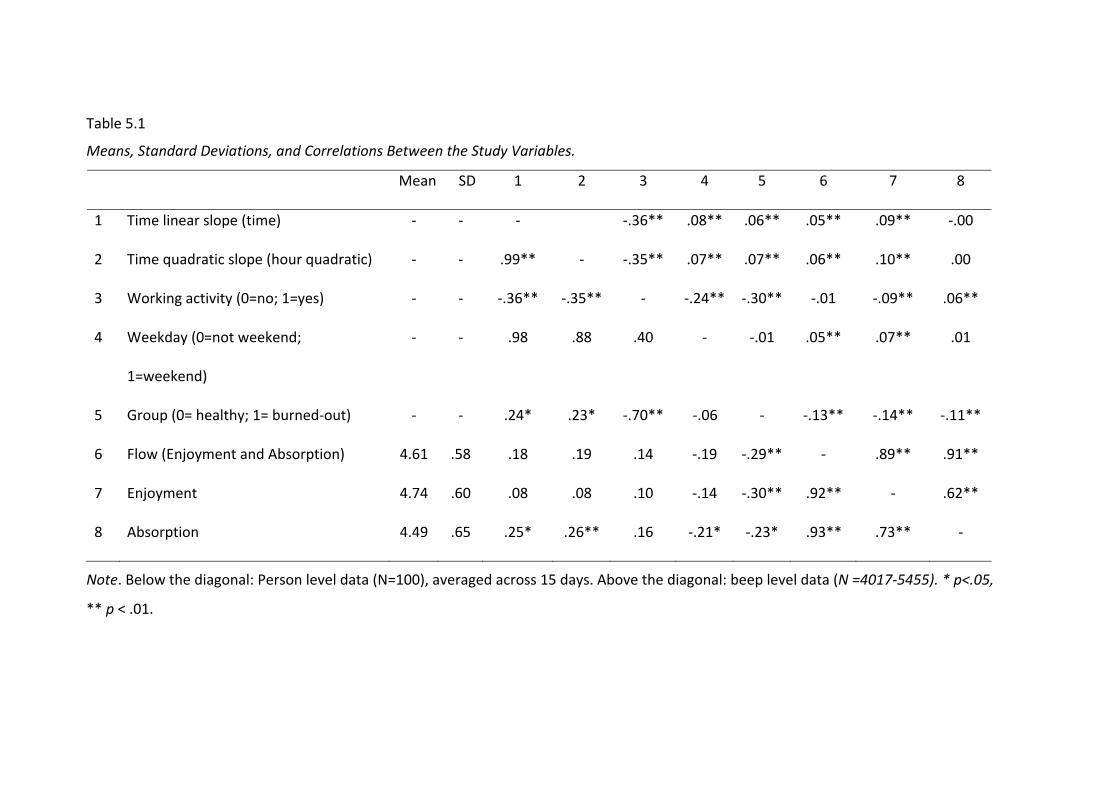
Table 5.1
Means, Standard Deviations, and Correlations Between the Study Variables.
Mean SD 1 2 3 4 5 6 7 8
1
2
Time linear slope (time)
Time quadratic slope (hour quadratic)
‐
‐
‐
‐
‐
.99**
‐
‐.36**
‐.35**
.08**
.07**
.06**
.07**
.05**
.06**
.09**
.10**
‐.00
.00
3 Working activity (0=no; 1=yes) ‐ ‐ ‐.36** ‐.35** ‐ ‐.24** ‐.30** ‐.01 ‐.09** .06**
4 Weekday (0=not weekend;
1=weekend)
‐ ‐ .98 .88 .40 ‐ ‐.01 .05** .07** .01
5 Group (0= healthy; 1= burned‐out) ‐ ‐ .24* .23* ‐.70** ‐.06 ‐ ‐.13** ‐.14** ‐.11**
6 Flow (Enjoyment and Absorption) 4.61 .58 .18 .19 .14 ‐.19 ‐.29** ‐ .89** .91**
7 Enjoyment 4.74 .60 .08 .08 .10 ‐.14 ‐.30** .92** ‐ .62**
8 Absorption 4.49 .65 .25* .26** .16 ‐.21* ‐.23* .93** .73** ‐
Note. Below the diagonal: Person level data (N=100), averaged across 15 days. Above the diagonal: beep level data (N =4017‐5455). * p<.05,
** p < .01.
Chapter 5
107
Before running the multilevel analyses, we examined group differences
(burned‐out versus healthy) in flow by carrying out an Analyses of Variance (ANOVA)
on individual averages (M). We found significant differences between the two groups
(t = 8.70, p < .01): the healthy group scored significantly higher on flow than the
burned‐out group. We observed the same effect for each dimension of flow
separately: enjoyment (t = 9.62, p < .05) and absorption (t = 5.68, p < .05). More
detailed analyses revealed that clinically burned‐out participants on full sick leave
exhibited no significant differences in flow compared to the clinically burned‐out
participants on partial sick leave (t = .00, n.s.). The same was true of each separate
dimension: enjoyment (t = .06, n.s.) and absorption (t = .05, n.s.). Because no
differences were observed between those on partial and full sick‐leave the burned‐out
group was treated as a single, undifferentiated group. Thus, these preliminary analyses
‐ to be confirmed in the multilevel analyses ‐ led us to assert that, as we formulated in
Hypothesis 1, healthy individuals experience more flow than those who are burned‐
out. Whether or not burned‐out employees were on full or partial sick leave appeared
to make no difference to the level of flow they experienced.
Multi‐level Analyses and Test of Hypotheses
Before testing our Hypotheses 2 and 5, we calculated the intraclass correlation
for flow in order to estimate the proportion of variance that is explained at each level
(Hox, 2002). The results showed that 69% of the variance in flow is explained by the
first level, which is at the beep (or time) level. The variance explained on the second
level (day) was 9.56%, and 20.64% at the third level (person), respectively. The results
evidence the existence of three levels of analyses, as suggested by the significant
The story flows on: A multi‐study on the flow experience
108
proportion of variance explained by the time level, that is to say, within‐person
fluctuations across the 3‐7 occasions. The previous results allow us to continue with
multilevel analyses.
In order to test Hypotheses 2 and 5, we tested four nested models: (1) the Null
(intercept‐only) Model; (2) Model 1, in which we added variables at the first level such
as the time of the day, quadratic hour (or quadratic slope), and working/non‐working
activity; (3) Model 2, where we added the variable at the second level (type of day);
and (4) Model 3, in which we added the variable at the third level (group). Besides, we
also tested for interaction effects between group and time linear, and group time
quadratic but they were not significant. Table 5.2 presents unstandardized estimates,
standard errors, and t‐values for all predictor variables of the four models. It also
presents the deviance (‐ 2 x log) of the four models, as well as the differences in the
deviance between the nested models. A significant decrease in the deviance indicates
a better fit of the model.
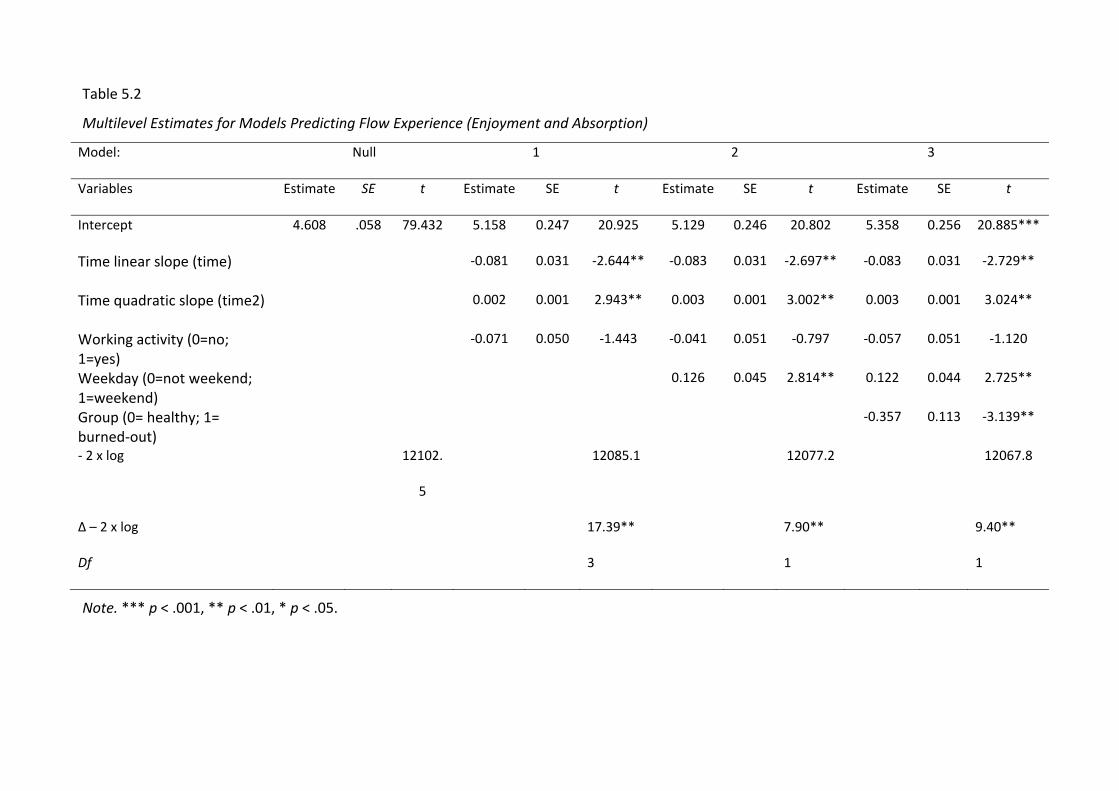
Table 5.2
Multilevel Estimates for Models Predicting Flow Experience (Enjoyment and Absorption)
Model: Null 1 2 3
Variables Estimate SE t Estimate SE t Estimate SE t Estimate SE t
Intercept 4.608 .058 79.432 5.158 0.247 20.925 5.129 0.246 20.802 5.358 0.256 20.885***
Time linear slope (time) ‐0.081 0.031 ‐2.644** ‐0.083 0.031 ‐2.697** ‐0.083 0.031 ‐2.729**
Time quadratic slope (time2) 0.002 0.001 2.943** 0.003 0.001 3.002** 0.003 0.001 3.024**
Working activity (0=no; 1=yes)
‐0.071 0.050 ‐1.443 ‐0.041 0.051 ‐0.797 ‐0.057 0.051 ‐1.120
Weekday (0=not weekend; 1=weekend)
0.126 0.045 2.814** 0.122 0.044 2.725**
Group (0= healthy; 1= burned‐out)
‐0.357 0.113 ‐3.139**
‐ 2 x log 12102.
5
12085.1 12077.2 12067.8
Δ – 2 x log 17.39** 7.90** 9.40**
Df 3 1 1
Note. *** p < .001, ** p < .01, * p < .05.
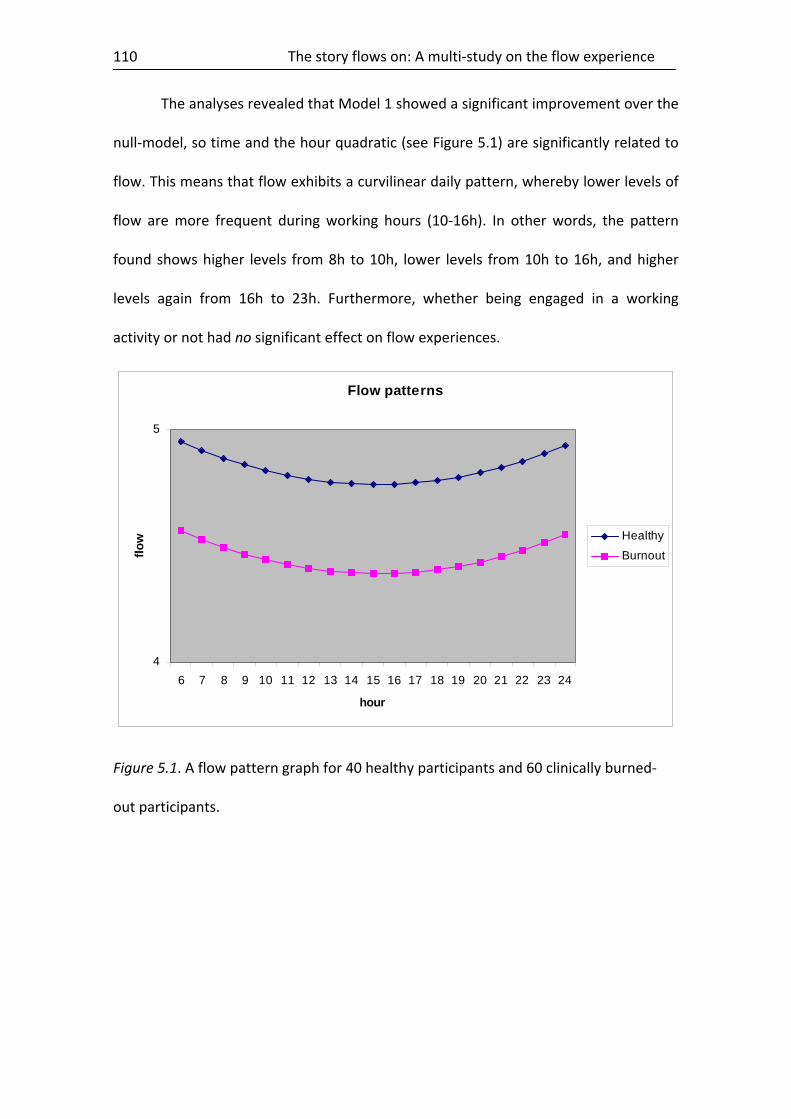
The story flows on: A multi‐study on the flow experience
110
The analyses revealed that Model 1 showed a significant improvement over the
null‐model, so time and the hour quadratic (see Figure 5.1) are significantly related to
flow. This means that flow exhibits a curvilinear daily pattern, whereby lower levels of
flow are more frequent during working hours (10‐16h). In other words, the pattern
found shows higher levels from 8h to 10h, lower levels from 10h to 16h, and higher
levels again from 16h to 23h. Furthermore, whether being engaged in a working
activity or not had no significant effect on flow experiences.
Flow patterns
4
5
6 7 8 9 10 11 12 13 14 15 16 17 18 19 20 21 22 23 24
hour
flow Healthy
Burnout
Figure 5.1. A flow pattern graph for 40 healthy participants and 60 clinically burned‐
out participants.
Chapter 5
111
In the next step, we compared Model 2 with Model 1. Again, this new model
showed a significant improvement. This indicates that including the type of day also
adds to explaining flow. That is to say, weekends positively relate with flow
experiences, or put differently, participant’s level of flow was higher during weekends
than during other days of the week.
In Model 3, significant differences between groups were found, revealing that
healthy participants scored significantly higher on flow than burned‐out participants.
Besides, a significant improvement was observed in comparison with the previous
model (Model 2).
In conclusion, the best fitting model was Model 3 which showed significant
effects of time, weekday, and group; that is, flow experiences follow a particular daily
pattern (partially supporting Hypothesis 2), flow experiences occur at the weekend
rather than on weekdays (not supporting Hypothesis 3), working or non‐working tasks
has a differential effect on flow, depending on its dimension (supporting Hypothesis 4),
and flow levels are higher in healthy individuals than in burned‐out individuals
(supporting Hypothesis 1), whereas flow patterns do not differ for healthy and burned‐
out individuals (supporting Hypothesis 5). Hence, our results fully support Hypotheses
1 and 5, whereas Hypothesis 2 was partially supported and. Hypothesis 3 was not
supported. So far, Hypotheses 4 was not tested, because no differentiation was made
yet between enjoyment and absorption. However, at this stage, Table 5.2 shows that
levels of flow – as assessed with the composite score – did not differ between
working and non‐working tasks.
The story flows on: A multi‐study on the flow experience
112
Differentiating Between Flow Components
In order to further investigate the negative result related to Hypothesis 3 and in
order to test Hypothesis 4, a distinction was made between both components of flow.
Alternative multilevel models were tested with each of the two flow components
separately. Table 5.3 shows the results for enjoyment and Table 5.4 depicts those for
absorption. Regarding Hypothesis 3, levels of enjoyment are higher on weekends as
compared to weekdays (Table 5.3), whereas no difference for absorption was
observed (Table 5.4). Regarding Hypothesis 4 – as expected – enjoyment is significantly
associated with non‐working activities (Table 5.3), whereas absorption is significantly
associated with working activities (Table 5.4). Hence, Hypotheses 4 was supported. In
sum, the combined score of both dimensions of flow does not relate to the type of
activity that the participants engage in. This is most likely caused by the fact that both
dimensions have an opposite effect: enjoyment relates to non‐work activities, whereas
absorption relates to work activities.
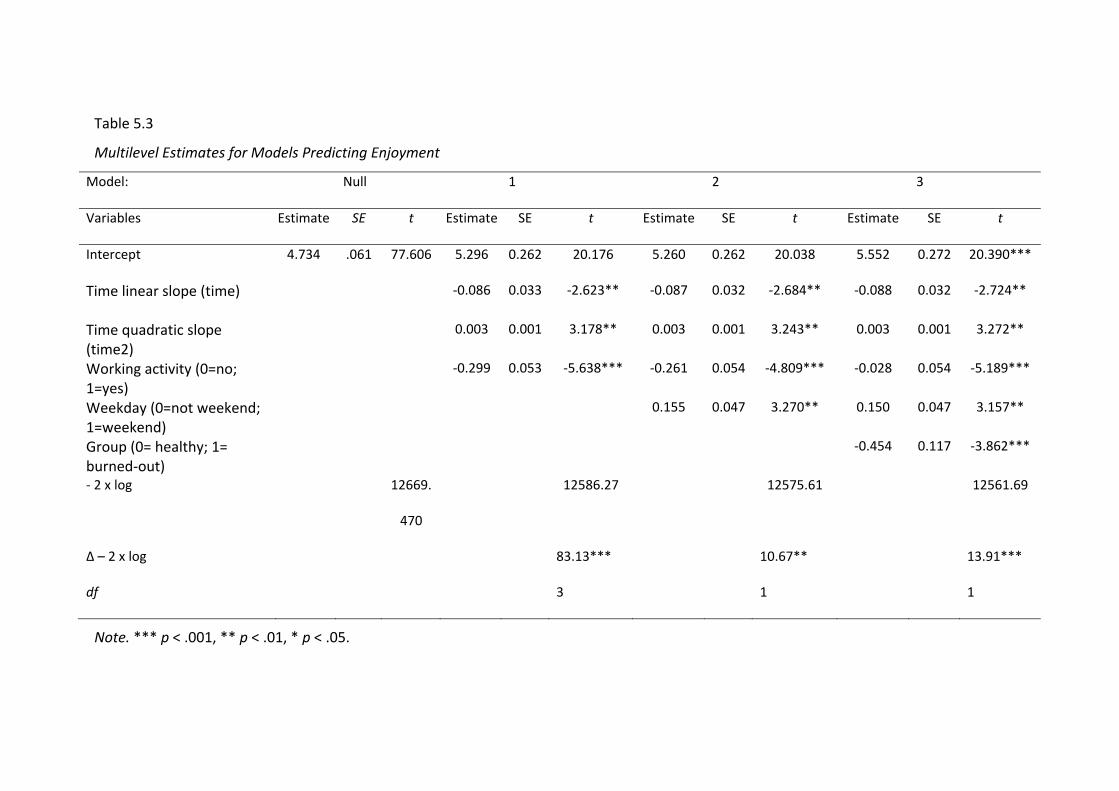
Table 5.3
Multilevel Estimates for Models Predicting Enjoyment
Model: Null 1 2 3
Variables Estimate SE t Estimate SE t Estimate SE t Estimate SE t
Intercept 4.734 .061 77.606 5.296 0.262 20.176 5.260 0.262 20.038 5.552 0.272 20.390***
Time linear slope (time) ‐0.086 0.033 ‐2.623** ‐0.087 0.032 ‐2.684** ‐0.088 0.032 ‐2.724**
Time quadratic slope (time2)
0.003 0.001 3.178** 0.003 0.001 3.243** 0.003 0.001 3.272**
Working activity (0=no; 1=yes)
‐0.299 0.053 ‐5.638*** ‐0.261 0.054 ‐4.809*** ‐0.028 0.054 ‐5.189***
Weekday (0=not weekend; 1=weekend)
0.155 0.047 3.270** 0.150 0.047 3.157**
Group (0= healthy; 1= burned‐out)
‐0.454 0.117 ‐3.862***
‐ 2 x log 12669.
470
12586.27 12575.61 12561.69
Δ – 2 x log 83.13*** 10.67** 13.91***
df 3 1 1
Note. *** p < .001, ** p < .01, * p < .05.
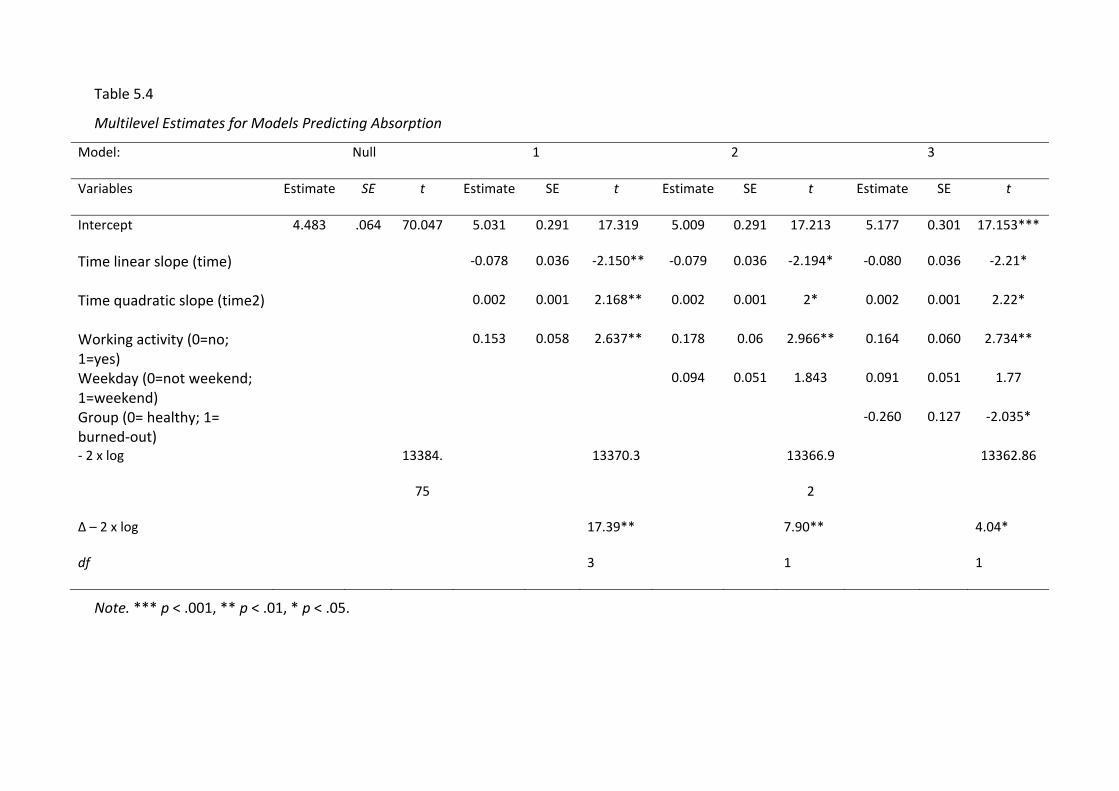
Table 5.4
Multilevel Estimates for Models Predicting Absorption
Model: Null 1 2 3
Variables Estimate SE t Estimate SE t Estimate SE t Estimate SE t
Intercept 4.483 .064 70.047 5.031 0.291 17.319 5.009 0.291 17.213 5.177 0.301 17.153***
Time linear slope (time) ‐0.078 0.036 ‐2.150** ‐0.079 0.036 ‐2.194* ‐0.080 0.036 ‐2.21*
Time quadratic slope (time2) 0.002 0.001 2.168** 0.002 0.001 2* 0.002 0.001 2.22*
Working activity (0=no; 1=yes)
0.153 0.058 2.637** 0.178 0.06 2.966** 0.164 0.060 2.734**
Weekday (0=not weekend; 1=weekend)
0.094 0.051 1.843 0.091 0.051 1.77
Group (0= healthy; 1= burned‐out)
‐0.260 0.127 ‐2.035*
‐ 2 x log 13384.
75
13370.3 13366.9
2
13362.86
Δ – 2 x log 17.39** 7.90** 4.04*
df 3 1 1
Note. *** p < .001, ** p < .01, * p < .05.
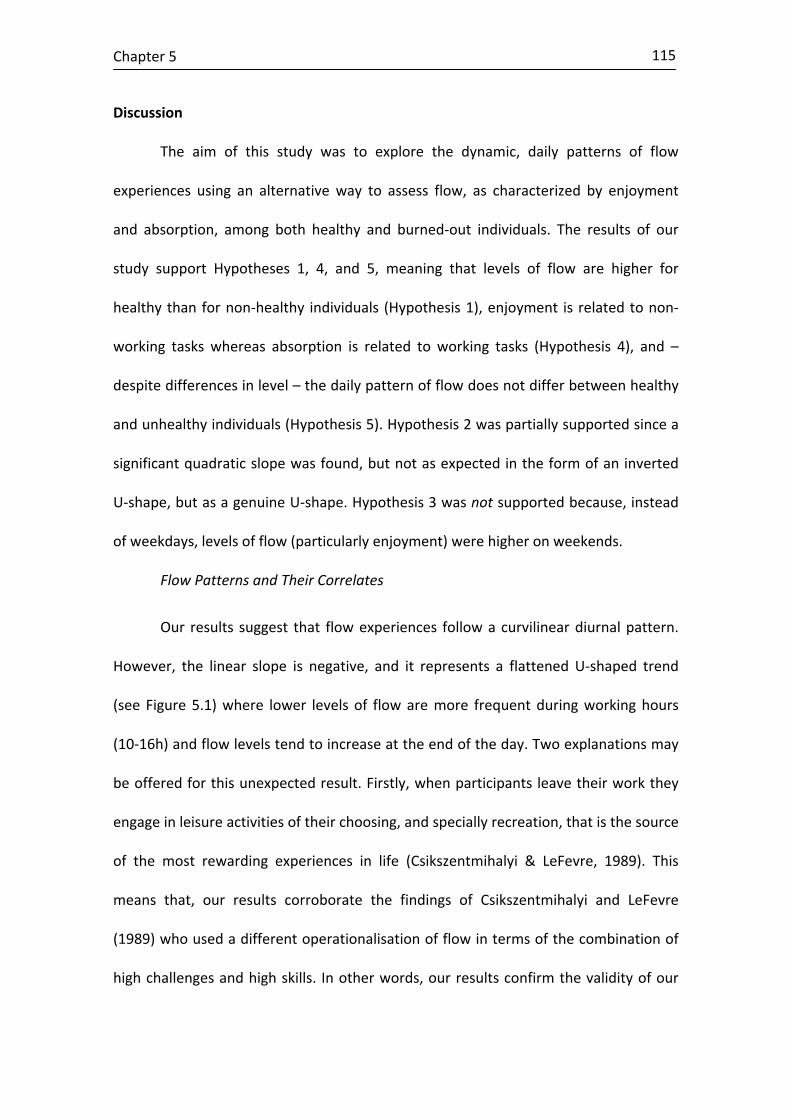
Chapter 5
115
Discussion
The aim of this study was to explore the dynamic, daily patterns of flow
experiences using an alternative way to assess flow, as characterized by enjoyment
and absorption, among both healthy and burned‐out individuals. The results of our
study support Hypotheses 1, 4, and 5, meaning that levels of flow are higher for
healthy than for non‐healthy individuals (Hypothesis 1), enjoyment is related to non‐
working tasks whereas absorption is related to working tasks (Hypothesis 4), and –
despite differences in level – the daily pattern of flow does not differ between healthy
and unhealthy individuals (Hypothesis 5). Hypothesis 2 was partially supported since a
significant quadratic slope was found, but not as expected in the form of an inverted
U‐shape, but as a genuine U‐shape. Hypothesis 3 was not supported because, instead
of weekdays, levels of flow (particularly enjoyment) were higher on weekends.
Flow Patterns and Their Correlates
Our results suggest that flow experiences follow a curvilinear diurnal pattern.
However, the linear slope is negative, and it represents a flattened U‐shaped trend
(see Figure 5.1) where lower levels of flow are more frequent during working hours
(10‐16h) and flow levels tend to increase at the end of the day. Two explanations may
be offered for this unexpected result. Firstly, when participants leave their work they
engage in leisure activities of their choosing, and specially recreation, that is the source
of the most rewarding experiences in life (Csikszentmihalyi & LeFevre, 1989). This
means that, our results corroborate the findings of Csikszentmihalyi and LeFevre
(1989) who used a different operationalisation of flow in terms of the combination of
high challenges and high skills. In other words, our results confirm the validity of our
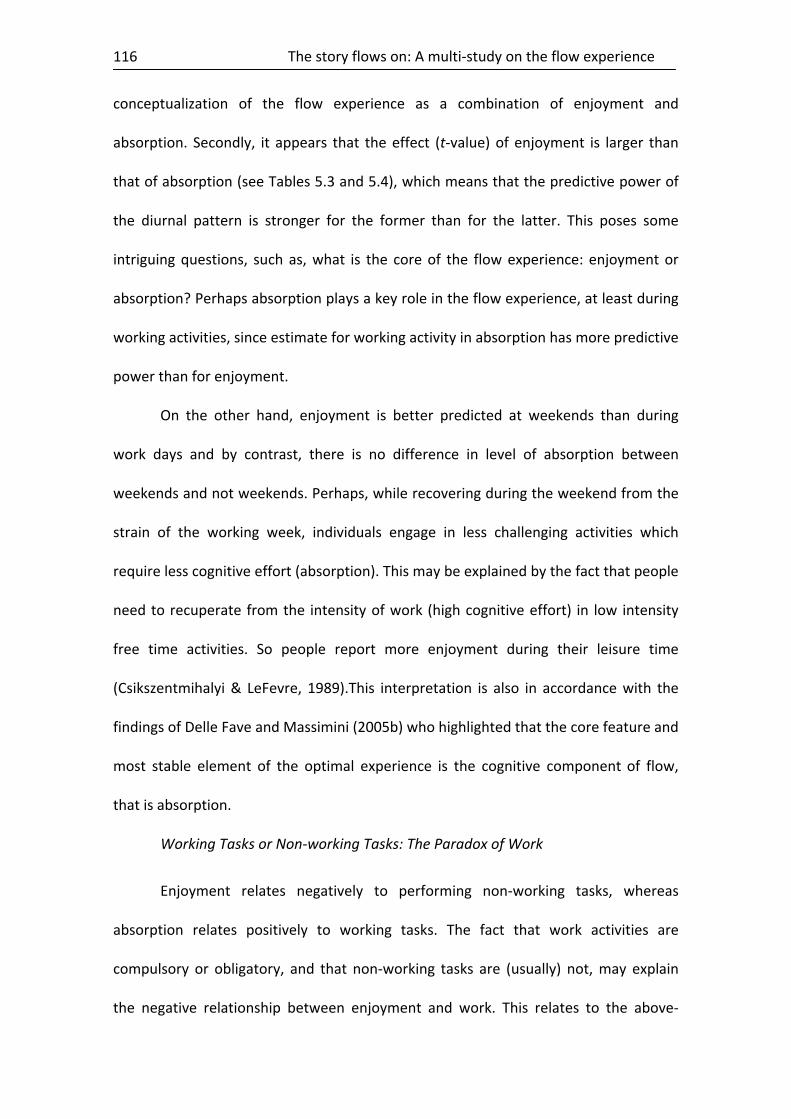
The story flows on: A multi‐study on the flow experience
116
conceptualization of the flow experience as a combination of enjoyment and
absorption. Secondly, it appears that the effect (t‐value) of enjoyment is larger than
that of absorption (see Tables 5.3 and 5.4), which means that the predictive power of
the diurnal pattern is stronger for the former than for the latter. This poses some
intriguing questions, such as, what is the core of the flow experience: enjoyment or
absorption? Perhaps absorption plays a key role in the flow experience, at least during
working activities, since estimate for working activity in absorption has more predictive
power than for enjoyment.
On the other hand, enjoyment is better predicted at weekends than during
work days and by contrast, there is no difference in level of absorption between
weekends and not weekends. Perhaps, while recovering during the weekend from the
strain of the working week, individuals engage in less challenging activities which
require less cognitive effort (absorption). This may be explained by the fact that people
need to recuperate from the intensity of work (high cognitive effort) in low intensity
free time activities. So people report more enjoyment during their leisure time
(Csikszentmihalyi & LeFevre, 1989).This interpretation is also in accordance with the
findings of Delle Fave and Massimini (2005b) who highlighted that the core feature and
most stable element of the optimal experience is the cognitive component of flow,
that is absorption.
Working Tasks or Non‐working Tasks: The Paradox of Work
Enjoyment relates negatively to performing non‐working tasks, whereas
absorption relates positively to working tasks. The fact that work activities are
compulsory or obligatory, and that non‐working tasks are (usually) not, may explain
the negative relationship between enjoyment and work. This relates to the above‐
Chapter 5
117
mentioned ‘paradox of work’ (Csikszentmihalyi & LeFevre, 1989) which states that
individuals experience more flow at work than in their leisure time, and yet they prefer
leisure above work. The fact that the compulsory nature of work masks its positive
experience that it engenders, might be an explanation for this obvious paradox.
Moreover, Csikszentmihaly and LeFevre (1989) argue that in deciding whether
individuals wish to work or not, they judge their desires by social conventions rather
than by the reality of their feelings. Hence, individuals conceive work as a negative and
compulsory activity instead of a creative activity and as an opportunity to live positive
experiences or to find enjoyment in it. Rheinberg et al. (2007) found results that agree
with those from our study, they revealed that flow scores were higher during work,
but scores for happiness/satisfaction were higher during leisure time. Their study
focused on goal adjustment and found that participants' activities at work addressed
attaining goals more often. So, goal adjustment had a strong positive effect on flow,
but not on happiness/satisfaction. It follows from Rheinberg et al. (2007) that the
paradox of work can be partially attributed to stronger goal adjustment during work.
Unlike enjoyment, no affective evaluation is included in the experience of
absorption. For instance, when being completely absorbed by the activity one is
engaged in, it is impossible to concentrate on one’s own inner feelings because all
attention is focussed on the activity at hand. Seen from this perspective, absorption
and enjoyment seem to be relatively independent, at least at the momentary level.
Although enjoyment and absorption share 36% of their variance, about twice as much
of the variance is not explained. In addition, on a more philosophical level, hedonic and
eudemonic perspectives assume that enjoyment is related to the former, whereas
absorption is related to the latter. From a hedonic perspective well‐being is defined in
The story flows on: A multi‐study on the flow experience
118
terms of attaining pleasure and avoiding pain, so its core emotion is pleasure or
enjoyment (Kahneman, Diener, & Schwarz, 1999). In contrast, eudemonia focuses on
the full development of a person’s capabilities for the development of which
engagement and absorption in challenging activities is crucial (Ryan & Deci, 2001).
Hence, absorption, or being entirely engrossed in the activity at hand, is the hallmark
of the flow experience, with enjoyment as an a posteriori affective evaluation (Ghani &
Deshpande, 1994; Lutz & Guiry, 1994; Moneta & Csikszentmihalyi 1996; Trevino, &
Webster, 1992). It should not be overlooked, though, that the flow experience is
positive in itself ‐‐ albeit a posteriori ‐‐ (Csikszentmihalyi, 1975) and that therefore the
positive affective component has to be included in the measurement of flow. So in the
present study we used the combination of absorption and enjoyment to assess the
flow experience; the former being the cognitive component and the latter being the
affective component. We showed that the absorption component relates positively to
working tasks, and that the enjoyment component relates positively to non‐working
tasks
Flow Among Healthy and Burned‐out Individuals
Our results show that flow levels in healthy individuals are significantly higher
than in burned‐out individuals, thus supporting Hypothesis 1. Moreover, as expected,
Hypothesis 5 was also supported which revealed that there are no significant
differences in daily flow patterns between healthy and burned‐out individuals. The
first finding reveals that healthy individuals experience more flow than burned‐out
individuals, which is understandable because burnout is associated with cynicism,
dissatisfaction, lack of concentration, and negative emotions (Le Blanc, Bakker,
Peeters, van Heesch, & Schaufeli, 2001; Schaufeli & van Rhenen, 2006). In addition the
Chapter 5
119
same trend was found regarding flow patterns among the healthy and the burned‐out
participants. Even among those who were on partially or fully on sick leave, the diurnal
pattern was the same. Please note that the latter group also carried out also “working”
tasks, for instance related to household work. The fact that similar daily flow patterns
were found in both groups adds to the robustness of these patterns.
Strengths and Weaknesses
There were three main limitations in this study. First, we did not study the
concurrent validity of both conceptions of flow (the combination of challenges and
skills vs. absorption‐enjoyment) by direct comparison because our main aim was to
study the flow experience by itself and not its prerequisites or antecedents. We
considered that the inclusion of a combination of challenges and skills would
complicate the electronic diary questionnaire too much and increase its duration
beyond what we felt was tolerable for the participants. It would be interesting,
however, to compare and test multilevel models of the flow experience with the flow
antecedents, such as the combination of high challenges and high skills.
Second, although our sample is a heterogeneous sample composed of different
workers from different occupations, this heterogeneity is also a limitation because it
eliminates the opportunity to compare the flow levels of the participants in the same
kind of working tasks. Thus, the role that particular working task plays is not controlled
for in the current study. A suggestion for future research is to collect data from
different kinds of job samples in order to compare the daily flow patterns in different
occupations.
The story flows on: A multi‐study on the flow experience
120
Finally regarding the methodology used, even though the electronic diary is a
very useful method to measure flow experiences, it also has the disadvantage that,
perhaps, the signal‐contingent strategy may interfere with the flow experience.
Consequently, we recommend using the electronic diary together with an end‐of‐the‐
day diary in future studies which would allow the participants to register and indicate
whether they had flow experiences during the day which the diary did not reflect.
The current study has also its strong points. First, conceptually speaking, the
novelty of the present study lies in the study of daily flow patterns because, as far as
we know, there is a lack of research exploring the diurnal pattern of flow (except
Guastello et al., 1999). Second, this is the first study on flow that uses two contrasting
samples (healthy vs. burned‐out). Finally, this study offers an alternative explanation
for the ‘paradox of work’ by differentiating between absorption and enjoyment.
In short, the present study allowed us the chance to explore and find
interesting flow patterns across time, using an alternative operationalisation of the
phenomenon. It also produced in‐depth knowledge of the flow experience itself by
means of a new electronic diary methodology. Like similar previous studies on positive
psychology (Clarke & Haworth, 1994; Oishi, Diener, Choi, Kim‐Prieto, & Choi, 2007), the
current study encourages researchers to use the electronic diary method to investigate
the amazing but also tricky flow experience.
Chapter 6
121
Chapter 6. Self‐efficacy and flow at work: A virtuous circle?6
Summary
The main objective of this study was to extend the Channel Model of Flow
(Csikszentmihalyi, 1975) by including self‐efficacy as a predictor of the challenges X
skills combination, and the flow experience itself, based on the predictions of the
Social Cognitive Theory (Bandura, 1997, 2001). We expect that 1) self‐efficacy will
predict flow experiences (i.e. absorption and enjoyment) directly and indirectly
through the challenges X skills combination, and 2) self‐efficacy and flow will be
reciprocally related, thus constituting a virtuous circle (i.e., the more self‐efficacy at
Time 1, the more flow experiences at Time 2, and vice versa). Structural Equation
Modelling was carried out in a longitudinal study with 258 secondary school teachers.
The results firstly showed that the model including self‐efficacy as an antecedent of
flow fitted the data better than the model including only the challenges X skills
combination. Secondly, the more self‐efficacy, the more flow and higher levels of
challenge X skills were seen which, in turn, predicted flow over time. The influence of
self‐efficacy on flow over time was mediated by the challenges X skills combination at
T2.
Introduction
Since the beginning of this century, increased attention has been paid to what
has been coined positive psychology: the scientific study of human strength and
optimal functioning (Seligman & Csikszentmihalyi, 2000). This approach is considered
6 Chapter 6 is in preparation to be submmitted as: Salanova, M., Rodríguez‐Sánchez, A.M., Cifre, E., & Schaufeli, W. Self‐efficacy and flow at work: A virtuous circle?.
The story flows on: A multi‐study on the flow experience
122
to supplement the traditional focus of psychology on disease, damage, disorder, and
disability. Therefore, those organisations interested in improving the quality of their
employee’s working life have to optimise positive psychosocial emotions and
experiences. Concepts such as job satisfaction, organisational commitment, work
engagement and flow at work are increasingly relevant to generate healthy jobs,
employees and organisations. In the current study, we focused on the relationships
between two positive relevant psychosocial constructs: flow at work and self‐efficacy.
Specifically, it tests the ‘channel model’ of flow originally proposed by Csikszentmihalyi
(1975, 1990, 1997, 2003) which takes flow experience to be a result of the
combination of high challenges and high skills. Furthermore, we tested an expanded
channel model that includes self‐efficacy, such as playing a key role as a flow
experience antecedent, beyond the challenges X skills combination formula.
Dissecting flow: Operationalisation of optimal experiences at work
The optimal momentary experience of flow is complex and difficult to measure
because of its ephemeral and temporary nature. In fact, the literature offers a number
of flow definitions; for instance, flow has been defined as a condition in which people
are so involved in an activity that nothing else seems to matter at the time, and the
experience is so enjoyable that people will do it even at great cost for the sheer sake
of doing it (Csikszentmihalyi, 1990). Flow is recognised as a state that is “characterised
by enjoyable feelings, concentration, immersion, and intensive involvement” (Chen,
2006, p. 222). In the same vein, Ghani and Deshpande (1994, p. 383) described flow
as: “(a) total concentration in an activity and (b) the enjoyment which one derives
from an activity”.
Chapter 6
123
Although operationalisation of flow is still a topic of discussion, we critically
examined previous literature to shed some light on it. This examination revealed that
recent research agrees with the cognitive, motivational and emotional components of
optimal experience (for example, Bassi, Steca, Delle Fave, & Caprara, 2007; Delle Fave
& Massimini, 2004 and 2005b; Jackson & Csikszentmihalyi 1999). Based on this,
different scholars (Chen, 2006; Ghani & Deshpande, 1994; Moneta & Csikszentmihalyi,
1996)have shown that people who experience flow are engrossed in an activity. This
involvement at work is so deep that nothing else seems to matter at the time. In
addition to the enjoyment they feel while doing the activity and the intrinsic interest
to continue doing it, the total immersion in an activity seems to be a central aspect of
the flow experience (Csikszentmihalyi, Rathunde, & Whalen, 1993; Ellis, Voelkl, &
Morris, 1994).
Despite the fact that the first studies on flow were carried out among people
who practiced sports, or who did any activity characterised by creativity, researchers
formed a picture of the general characteristics of optimal experience and its proximal
conditions, and found that the flow experienced while undertaking entertainment and
work activities was quite similar (Nakamura & Csikszentmihalyi, 2002). For instance
Bakker (2005), and Salanova, Bakker and Llorens (2006), developed the flow concept
during work activities and defined it as an optimal experience at work that is
characterised by work enjoyment (i.e., the emotional component), absorption (i.e., the
cognitive component) and intrinsic interest (i.e., the motivational component).
Based on previous definitions of flow however, one might not consider this last
element (i.e., intrinsic interest) to be a part of the flow experience, rather an
antecedent or prerequisite of the flow experience. This was shown in a recent study
The story flows on: A multi‐study on the flow experience
124
which compared two competitive models of flow with three‐ and two‐ factor models
(i.e., enjoyment, absorption and intrinsic interest, and enjoyment and absorption,
respectively). The two‐factor model fitted the data better than the three‐factor model
and found that intrinsic interest (i.e., the motivational component) was more an
antecedent of the flow experience than a dimension of the flow experience itself
(Rodríguez‐Sánchez, Cifre, Salanova, & Åborg, 2008). Meanwhile, absorption refers to
a state of total concentration whereby employees are totally immersed in their work.
In this situation, time flies and they forget everything else around them (cf.
Csikszentmihalyi, 1990), and people enjoy doing the activity at hand (Ghani &
Deshpande, 1994).
Based on this previous research into the concept and the dimensions of flow, in
the present study ‘flow at work’ is considered an optimal and momentary experience
in connection with a specific activity in the work domain where workers experience
enjoyment and are absorbed while performing this activity. Although the flow concept
is more or less clear, flow antecedents and consequences are still tricky questions that
need to be clarified.
The Channel Model of Flow
The first studies on flow by Csikszentmihalyi (1975) considered flow as the
situation where challenges are matched with the person’s skills. Csikszentmihalyi
formed a model based on this challenge‐skill ratio which was coined ‘Channel Model of
Flow’. Later, it was developed and analytically described by Massimini and Carli (1988).
In subsequent studies, this Channel Model has been tested and Csikszentmihalyi
(1988) pointed out that to experience flow, challenges and skills must not only be in
balance, but must also exceed levels in such a way that one must increase the
Chapter 6
125
complexity of the activity by developing new skills and taking on new challenges. Then
when both challenges and skills are high, the flow experience is likely to arise (Delle
Fave & Bassi, 2000). That is in Csikszentmihalyi’s and LeFevre’s words, ‘when both
challenges and skills are high, the person is not only enjoying the moment, but is also
stretching his or her capabilities with the likelihood of learning new skills and
increasing self‐esteem and personal complexity’ (Csikszentmihalyi & LeFevre, 1989, p.
816).
It is important to consider that although the flow experience has been defined
as an optimal experience characterised by high levels of enjoyment and absorption,
the empirical research done on flow has usually found that this experience is measured
in terms of a combination of high challenges and high skills (e.g., Asakawa, 2004;
Csikszentmihalyi & Lefevre, 1989; Delespaul, Reis, & deVries, 2004; Delle Fave, Bassi, &
Massimini, 2003; Eisenberger, Jones, Stinglhamber, Shanock, & Randall, 2005). Thus,
antecedents are usually confounded with the flow experience itself. We believe that
the combination of high challenges and skills boosts the psychological experience of
flow (i.e., feelings of enjoyment and absorption), but that this is not the experience
itself. So it is important to bear in mind that perceived challenges and skills seem to be
antecedents and prerequisites of the flow experience (Nakamura & Csikszentmihalyi,
2002), and that although they are necessary, they are not the only existing
prerequisites of the flow experience. Recently, these authors also stated that apart
from high perceived skills being well matched with high challenges, clear goals and
immediate feedback are also necessary prerequisites to experience flow. However, not
only situational conditions, but also personal conditions (i.e., skills and self‐efficacy)
are not the only prerequisites of the flow experience (i.e., challenges, feedback, clear
The story flows on: A multi‐study on the flow experience
126
goals). Finally, it is worth noting that recent research has shown that self‐efficacy is an
important antecedent that can enhance the flow experience (Bassi et al., 2007;
Salanova et al., 2006).
Self‐efficacy and flow
According to the Social Cognitive Theory (Bandura, 1997, 2001), self‐efficacy is
defined as: “…beliefs in one’s capabilities to organise and execute the courses of action
required to produce given attainments” (Bandura, 1997, p. 3). Beliefs about one’s own
efficacy contribute to motivation by influencing: (a) the challenges people pursue, (b)
the effort they expend, (c) their perseverance in the face of difficulties and (d) how
people feel while doing the activity. Whatever the other factors which serve as guides
and motivators, they are rooted in the core belief that one has the power to produce
desired effects by one’s actions; otherwise, one has little incentive to act or to
persevere in the face of difficulties. Accordingly, self‐efficacy could influence the way
that people perceive challenges according to their skills and, in turn, could lead people
to experience the psychological state of flow. Therefore, self‐efficacy may be
considered an antecedent of flow experience.
Besides, people’s beliefs about their competences and success differ in the
distinct areas of their life, and there is considerable evidence for the positive effects of
self‐efficacy on performance in different domains such as the workplace, school and
sports (Bandura, 1999, 2001). Moreover, one of the sources of self‐efficacy is positive
psychological states; for instance, when people feel happy doing a task, it positively
influences their efficacy beliefs, but when they feel anxious, this influence is negative.
This influence is reciprocal because efficacy beliefs also make people feel better. For
Chapter 6
127
example, research into the work domain shows that high levels of efficacy beliefs have
a positive impact on employee well‐being, such as job satisfaction (Grau, Salanova, &
Peiró, 2001) and job engagement (Llorens, Schaufeli, Bakker, & Salanova, 2004;
Salanova, Llorens, Cifre, Martínez, & Schaufeli, 2003; Salanova, Llorens, & Schaufeli,
2008; Salanova, Schaufeli, Xanthopoulou, & Bakker, 2009).
More specifically, self‐efficacy has also been related with flow experiences. In
academic settings for example, Bassi et al. (2007) found that students with high self‐
efficacy beliefs spend more time learning activities and they experienced more flow
than those with low self‐efficacy beliefs. In addition, research into work settings,
specifically in the teaching context, supports the idea that personal resources (e.g.,
self‐efficacy beliefs) have a positive influence on flow occurring among teachers over
time (Salanova et al., 2006). In the same vein, but in terms of personal resources, the
study of Shin (2006) conducted in schooling contexts underlined that the individual
differences among the variables of flow antecedents, such as having a clear goal and
concentration, were more strongly correlated with flow than to instruction‐related
variables, such as skill and challenge. Collectively, past research has shown that not
only the balance of high challenges‐skills is needed to experience flow, but that
efficacy beliefs also come relatively close to the idea stated by Wigfield and Eccles
(2001) in the schooling context. These authors partially disagreed with the premise of
the flow theory, and contended that students do not necessarily value challenging
tasks optimally, rather tasks with which they believe they can succeed. However, past
research failed to simultaneously test both antecedents of flow experiences, that is,
the challenges X skills combination and efficacy beliefs.
The story flows on: A multi‐study on the flow experience
128
The present study
So far, the present study has integrated efficacy beliefs (Bandura, 1997) into
the Channel Model of Flow Theory (Csikszentmihalyi, 1990, 1997, 2003). There is little
empirical research that connects these two theoretical perspectives, that is, the
Channel Model of Flow Theory (Csikszentmihalyi, 1990, 1997, 2003) and the Social
Cognitive Theory (Bandura, 1997). Although studies like the aforementioned (e.g.,
Bassi, et al., 2007; Salanova et al., 2006; Wigfield & Eccles, 2001) have taken a step
forward in the understanding of how self‐efficacy beliefs contribute to the flow
experience, there is a lack of empirical research into the contribution of efficacy beliefs
to explain flow experience with the Channel Model. Thus, according to the predictions
of Csikszentmihalyi’s Flow Theory and Bandura’s Social Cognitive Theory, the
predictive role verifies that self‐efficacy plays the role of an antecedent of flow
experience at work, and is also novel in that it extends the ‘Channel Model’ in terms of
whether self‐efficacy offers added value to the ‘Channel Model’. Besides, this
relationship will be studied over time as a kind of positive circle. Therefore, we assume
that self‐efficacy predicts flow experience not only directly, but also indirectly through
the challenges X skills combination over time in a kind of virtuous circle
More specifically we expect that:
Hypothesis 1: The extended Channel Model, which includes self‐efficacy as a
predictor of flow experience, will fit the data better than the original Channel Model
(only the challenges X skills combination).
Chapter 6
129
Hypothesis 2: Self‐efficacy and the challenges X skills combination are positively
related to flow (at T1 and T2) . That is, the more self‐efficacy, the more higher levels of
challenges X skills and the more flow at T1, and the same occurs at T2.
Hypothesis 3: Self‐efficacy and flow will both be reciprocally related in a kind of
virtuous circle over time. That is, the more self‐efficacy at T1, the more flow
experiences at T2, and vice versa.
Method
Sample and Procedure
A follow‐up two‐wave study was carried out among secondary school
teachers. At the beginning of the academic year, a letter was sent to 50 secondary
schools explaining the goal of the research. The sample at T1 was composed of 483
teachers (56% women) who taught at 34 different secondary schools (81% response
rate). Ages ranged from 23 to 60 years (M = 40.2; SD= 8 years and 2 months); 13%
held a bachelor degree and the remaining 87% held a Master’s degree. Moreover,
83% worked in public schools.
Teachers were requested to answer a set of self‐report questionnaires at the
beginning of the academic year. Self‐report questionnaires, including scales to
measure the study variables, were delivered in an envelope and handed out to 600
secondary school teachers. A cover letter explained the purpose of the study, and
that participation was voluntary and confidentiality was guaranteed. Respondents
were asked to return the completed questionnaires in a sealed envelope to the
person who had handed them out or directly to the research team.
The story flows on: A multi‐study on the flow experience
130
Eight months later, at the end of the same academic year, questionnaires were
handed out again to the same 34 schools (T2). After deleting missing cases, 258
secondary school teachers (57% women) from the 24 secondary schools participated in
the longitudinal study. Furthermore, 53% of the teachers who participated at T1 also
participated at T2. Ages ranged from 23 to 60 years. The mean age of the sample was
40 years (SD = 7 years and 5 months). Thus the final sample was composed of 258
secondary teachers who participated in the longitudinal study and who answered the
questionnaires at both T1 and T2.
In order to test whether drop‐outs differed from the panel group, we compared
the T1 background variables of both groups (i.e., age, gender, type of school ‐private
vs. public‐, teaching experience and organizational tenure), as well as the main
psychosocial variables considered in the study. The MANOVA results and the χ2
analyses showed that there were no significant differences between the groups in
terms of background and study variables (i.e., self‐efficacy, enjoyment, absorption,
challenges and skills). We therefore concluded that the panel group did not differ
because of drop‐outs in terms of background and study variables.
Measures
Self‐efficacy (SE) is a specific construct adapted from the general self‐efficacy
scale (10 items) by Schwarzer (1999) to a more specific work context (Salanova et al.,
2006). According to the SCT, which specifies the activities for which one judges one’s
efficacy as a requirement, the general items from the original scale were rephrased in
the current study to cover the teachers’ more specific job domains. For instance, we
changed “I can solve most problems if I make the necessary effort” to “I can solve most
Chapter 6
131
problems in my teaching job if I make the necessary effort”. The scoring of the items
ranged from 0 (‘never’) to 6 (‘always’).
Flow experience was assessed by two scales: Absorption and Enjoyment.
Absorption was assessed by 6 items from an adapted Spanish version of the Absorption
Dimension of the Utrecht Work Engagement Scale (UWES; Schaufeli, Salanova,
González‐Romá, & Bakker, 2002). An example of an item is: “When I am working, I
forget everything else around me”. Enjoyment was assessed by 4 self‐constructed
items (Rodríguez‐Sánchez et al., 2008; Salanova et al., 2006). An example of an item is:
“I feel happy while I am working”. The adapted enjoyment and absorption scales were
also validated by Rodríguez‐Sánchez, et al. (2008) in a sample of Swedish and Spanish
students. Participants indicated the frequency of these experiences of enjoyment and
absorption during the preceding week on a 7‐point frequency rating scale ranging from
0 (‘never’) to 6 (‘every day’).
Challenge was assessed by 2 self‐constructed item measures which referred to
the level of challenge and inspiration that work implies for employees. The items were
“My job provides me with new challenges” and “My job is stimulating and inspires me”.
Skill was assessed by 6 items that measure perceived competence from an adapted
Spanish version of the Professional Efficacy Scale from the Maslach Burnout Inventory‐
General Survey (MBI‐GS; Salanova et al., 2000; Schaufeli, Leiter, Maslach, & Jackson,
1996). An example of an item is “In my opinion, I am good at my work”. Participants
indicated the extent to which they agreed with each sentence on a seven‐point rating
scale (0 = never, 6 = every day) in both scales of challenges and skills.
According to the Flow Channel Model (Csikszentmihalyi, 1990, 1997, 2003),
flow is likely to arise when people show high levels of challenges and skills. Therefore,
The story flows on: A multi‐study on the flow experience
132
we used the multiplicative Challenges X Skills variable to find the high levels of both
the challenges and skills that would lead to experiencing flow.
Data Analyses
We computed the means, standard deviations, Cronbach’s alpha coefficients
and bivariate correlations for all the scales. Structural Equation Modelling (SEM)
methods, as implemented by AMOS (Arbuckle & Wothke, 1999), were used to test our
hypotheses longitudinally, and two waves were used in the two models employed: the
Channel Model and the Extended Channel Model (including self‐efficacy). We now go
on to explain the more complex model (the Extended Channel Model).
Firstly, the Stability Model (M1) was tested without cross‐lagged structural
paths, but with temporal stabilities and synchronous correlations. Temporal stabilities
were specified as correlations between the corresponding constructs at T1 and T2. M1
estimated the total stability coefficient between T1 and T2 without specifying the
variance in direct or indirect paths (Pitts, West, & Tein, 1996). Secondly, the fit of this
stability model was compared to the three more complex models: (1) the Causality
Model (M2), which is identical to M1 but includes additional cross‐lagged structural
paths from T1 self‐efficacy to T2 challenges X skills and to T2 flow, as well as from T1
challenges X skills to T2 flow; (2) the Reversed Causation Model (M3) which is also
identical to M1, but includes additional cross‐lagged structural paths from T1
challenges X skills to T2 self‐efficacy, as well as from T1 flow to T2 self‐efficacy and T2
challenges X skills; (3) the Reciprocal Model (M4), which includes reciprocal
relationships among self‐efficacy, challenges X skills and flow and, therefore, includes
all the paths of M2 and M3.
Chapter 6
133
In addition, the measurement errors of the corresponding indicators of T1 and
T2 were allowed to covary over time. According to Pitts et al. (1996), the covariation of
the corresponding measurement errors over time accounts for the systematic
(method) variance associated with each specific indicator (McArdle & Bell, 2000; Pitts
et al., 1996). In fact, failing to specify the covariances between the measurement
errors leads to an overestimation of the size of the stability coefficients and, therefore,
to a poor model fit.
Model fit. Maximum likelihood estimation methods were used, and the input
for each analysis was the covariance matrix of the items. The goodness‐of‐fit of the
models was evaluated with the absolute and relative indices. The absolute goodness‐
of‐fit indices calculated were: the χ2 Goodness‐of‐Fit Statistic, Goodness‐of‐Fit Index
(GFI), Adjusted Goodness‐of‐Fit Index (AGFI), and the Root Mean Square Error of
Approximation (RMSEA).
Because χ2 is sensitive to sample size, the probability of rejecting a
hypothesised model increases when sample size also increases. To overcome this
problem, the computation of relative goodness‐of‐fit indices is strongly recommended
(Bentler, 1990). Following Marsh, Balla and Hau (1996), three such fit indices were
computed: (1) the Comparative Fit Index (CFI); (2) the Incremental Fit Index (IFI); and
(3) the Non‐Normed Fit Index or Tucker‐Lewis Index (TLI). Since the distribution of GFI
and AGFI is unknown, no critical values exist. Values smaller than .08 for RMSEA are
indicative of an acceptable fit, while values greater than 0.1 should lead to model
rejection (Browne & Cudeck, 1993). As a rule of thumb, the values for CFI, IFI, and TLI
greater than .90 are considered a good fit (Hoyle, 1995). Finally, we computed the
The story flows on: A multi‐study on the flow experience
134
Akaike Information Criterion (AIC; Akaike, 1987) and the Expected Cross‐Validation
Index (ECVI) to compare competing models because they were particularly well suited
for comparing the adequacy of non‐nested models that fit to the same correlation
matrix. The lower the AIC and ECVI indices, the better the fit is. The various nested
models were compared by means of the χ2 difference test (Jöreskog & Sörbom, 1986).
Results
Preliminary analyses
Following Caprara, Pastorelly, Regalia, Scabini and Bandura (2005),
Confirmatory Factor Analyses (CFA) were computed to differentiate the constructs
of self‐efficacy and perceived competence (for measuring levels of skills). Three
models were tested: (1) A one‐factor model which hypothesised that the two
constructs were the expression of a single latent factor (i.e., all the covariances
were fixed at 1); (2) A two‐factor orthogonal model which assumed that both
constructs were independent of each other (i.e., all the covariances were fixed at 0);
and (3) a two‐factor oblique model which assumed that the factors interrelated
(i.e., all the covariances were freely estimated).
Table 6.1 presents the results of the CFA tested between self‐efficacy and
perceived competence. The chi‐square (χ2) of all the models was statistically
significant; the oblique model showed the best fit indices (see AIC; Akaike, 1987)
and met the criteria. These results stress that self‐efficacy and perceived
competence were interrelated but had distinct constructs.
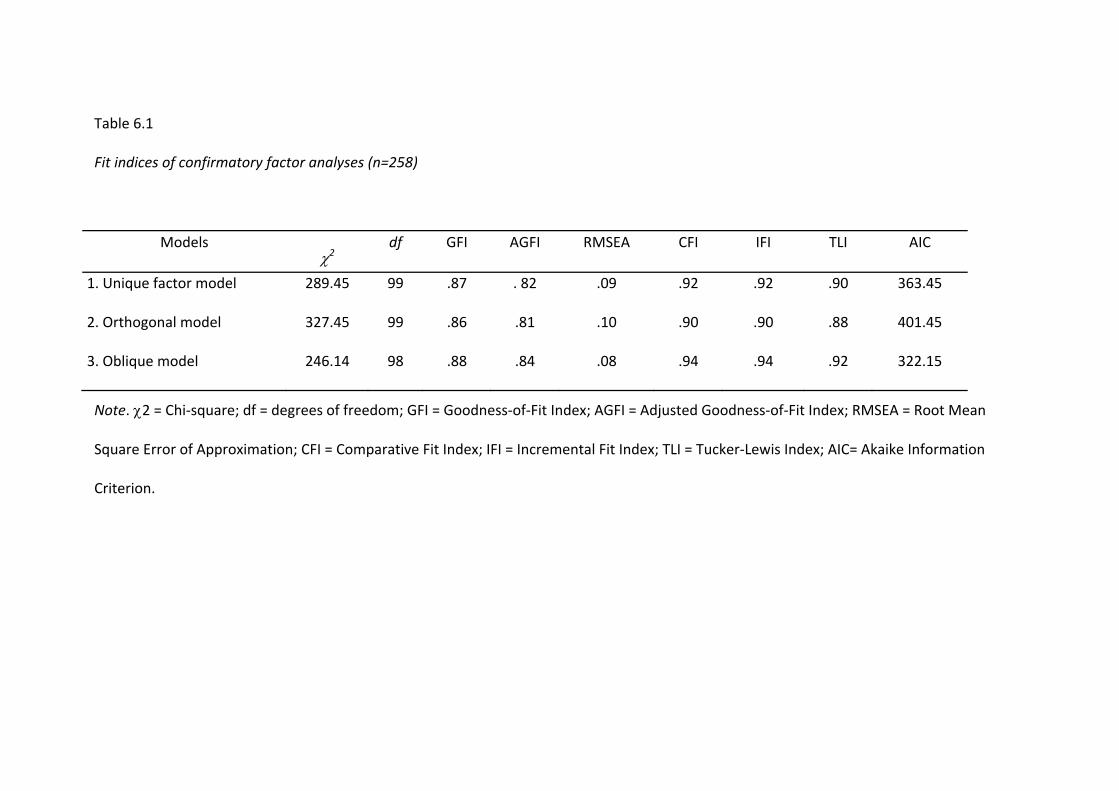
Table 6.1
Fit indices of confirmatory factor analyses (n=258)
Models χ2
df GFI AGFI RMSEA CFI IFI TLI AIC
1. Unique factor model 289.45 99 .87 . 82 .09 .92 .92 .90 363.45
2. Orthogonal model 327.45 99 .86 .81 .10 .90 .90 .88 401.45
3. Oblique model 246.14 98 .88 .84 .08 .94 .94 .92 322.15
Note. χ2 = Chi‐square; df = degrees of freedom; GFI = Goodness‐of‐Fit Index; AGFI = Adjusted Goodness‐of‐Fit Index; RMSEA = Root Mean
Square Error of Approximation; CFI = Comparative Fit Index; IFI = Incremental Fit Index; TLI = Tucker‐Lewis Index; AIC= Akaike Information
Criterion.
The story flows on: A multi‐study on the flow experience
136
Descriptive Analyses
Table 6.2 displays the means, standard deviations, internal consistencies
(Cronbach's α), stabilities and intercorrelations for the scales in the longitudinal study
among secondary school teachers. All the α values met the criterion of .70. As
expected, the pattern of correlations showed that all the scales were significantly and
positively related, both between variables and between variables over time.
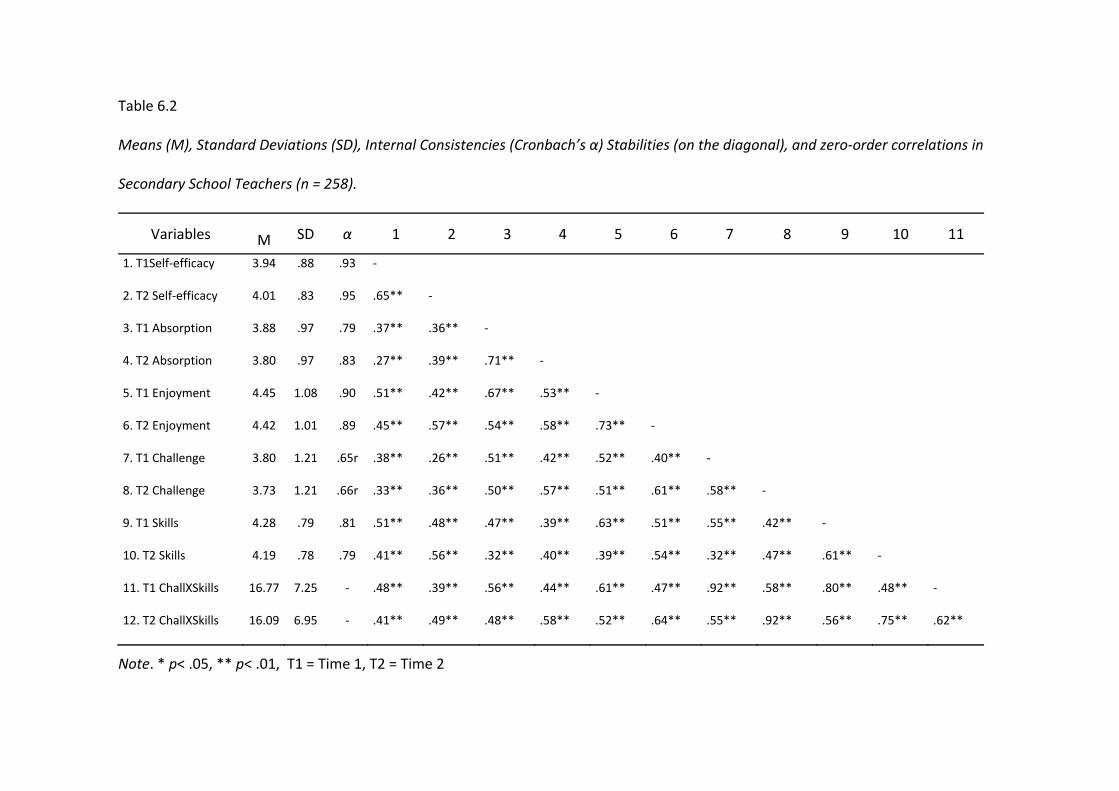
Table 6.2
Means (M), Standard Deviations (SD), Internal Consistencies (Cronbach’s α) Stabilities (on the diagonal), and zero‐order correlations in
Secondary School Teachers (n = 258).
Variables M SD α 1 2 3 4 5 6 7 8 9 10 11
1. T1Self‐efficacy 3.94 .88 .93 ‐
2. T2 Self‐efficacy 4.01 .83 .95 .65** ‐
3. T1 Absorption 3.88 .97 .79 .37** .36** ‐
4. T2 Absorption 3.80 .97 .83 .27** .39** .71** ‐
5. T1 Enjoyment 4.45 1.08 .90 .51** .42** .67** .53** ‐
6. T2 Enjoyment 4.42 1.01 .89 .45** .57** .54** .58** .73** ‐
7. T1 Challenge 3.80 1.21 .65r .38** .26** .51** .42** .52** .40** ‐
8. T2 Challenge 3.73 1.21 .66r .33** .36** .50** .57** .51** .61** .58** ‐
9. T1 Skills 4.28 .79 .81 .51** .48** .47** .39** .63** .51** .55** .42** ‐
10. T2 Skills 4.19 .78 .79 .41** .56** .32** .40** .39** .54** .32** .47** .61** ‐
11. T1 ChallXSkills 16.77 7.25 ‐ .48** .39** .56** .44** .61** .47** .92** .58** .80** .48** ‐
12. T2 ChallXSkills 16.09 6.95 ‐ .41** .49** .48** .58** .52** .64** .55** .92** .56** .75** .62**
Note. * p< .05, ** p< .01, T1 = Time 1, T2 = Time 2
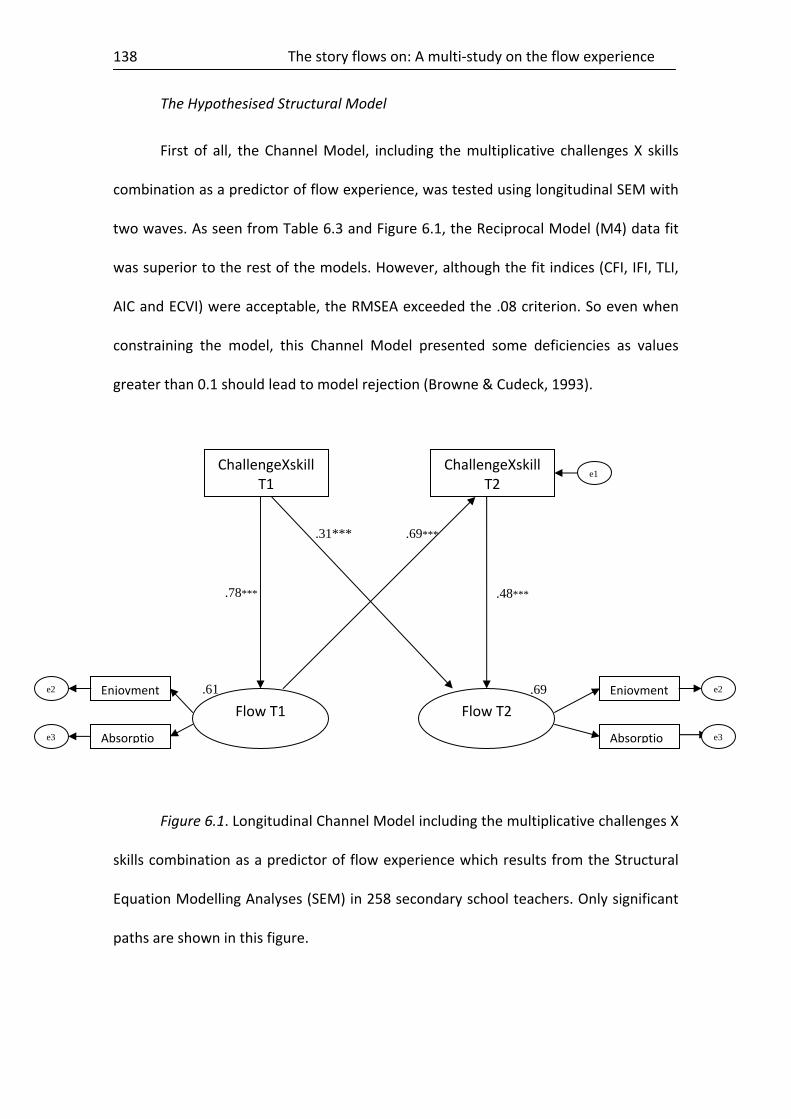
The story flows on: A multi‐study on the flow experience
138
The Hypothesised Structural Model
First of all, the Channel Model, including the multiplicative challenges X skills
combination as a predictor of flow experience, was tested using longitudinal SEM with
two waves. As seen from Table 6.3 and Figure 6.1, the Reciprocal Model (M4) data fit
was superior to the rest of the models. However, although the fit indices (CFI, IFI, TLI,
AIC and ECVI) were acceptable, the RMSEA exceeded the .08 criterion. So even when
constraining the model, this Channel Model presented some deficiencies as values
greater than 0.1 should lead to model rejection (Browne & Cudeck, 1993).
Figure 6.1. Longitudinal Channel Model including the multiplicative challenges X
skills combination as a predictor of flow experience which results from the Structural
Equation Modelling Analyses (SEM) in 258 secondary school teachers. Only significant
paths are shown in this figure.
.69***
ChallengeXskill T1
Flow T1
Absorptio
Enjoyment
e3
e2
.78***
.31***
.61
e3
ChallengeXskill T2
Flow T2
Absorptio
Enjoyment
e1
e2
.48***
.69
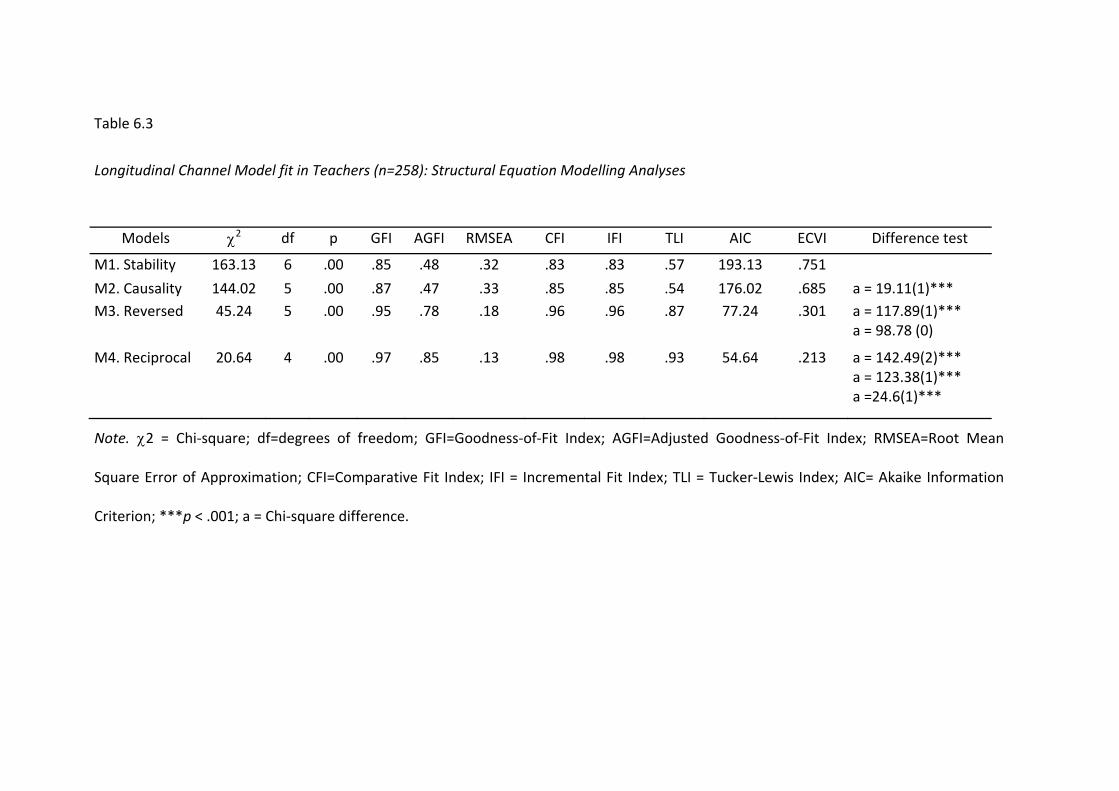
Table 6.3
Longitudinal Channel Model fit in Teachers (n=258): Structural Equation Modelling Analyses
Models χ2 df p GFI AGFI RMSEA CFI IFI TLI AIC ECVI Difference test
M1. Stability 163.13 6 .00 .85 .48 .32 .83 .83 .57 193.13 .751
M2. Causality 144.02 5 .00 .87 .47 .33 .85 .85 .54 176.02 .685 a = 19.11(1)*** M3. Reversed 45.24 5 .00 .95 .78 .18 .96 .96 .87 77.24 .301 a = 117.89(1)***
a = 98.78 (0)
M4. Reciprocal 20.64 4 .00 .97 .85 .13 .98 .98 .93 54.64 .213 a = 142.49(2)*** a = 123.38(1)*** a =24.6(1)***
Note. χ2 = Chi‐square; df=degrees of freedom; GFI=Goodness‐of‐Fit Index; AGFI=Adjusted Goodness‐of‐Fit Index; RMSEA=Root Mean
Square Error of Approximation; CFI=Comparative Fit Index; IFI = Incremental Fit Index; TLI = Tucker‐Lewis Index; AIC= Akaike Information
Criterion; ***p < .001; a = Chi‐square difference.
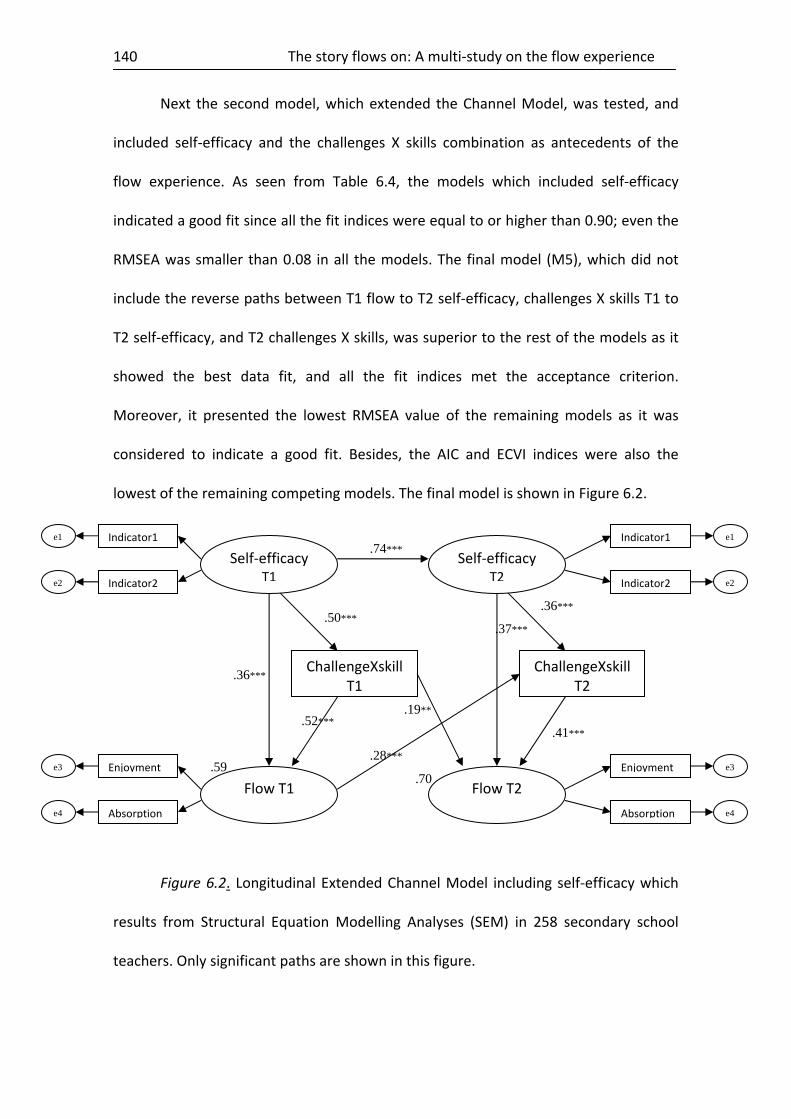
The story flows on: A multi‐study on the flow experience
140
Next the second model, which extended the Channel Model, was tested, and
included self‐efficacy and the challenges X skills combination as antecedents of the
flow experience. As seen from Table 6.4, the models which included self‐efficacy
indicated a good fit since all the fit indices were equal to or higher than 0.90; even the
RMSEA was smaller than 0.08 in all the models. The final model (M5), which did not
include the reverse paths between T1 flow to T2 self‐efficacy, challenges X skills T1 to
T2 self‐efficacy, and T2 challenges X skills, was superior to the rest of the models as it
showed the best data fit, and all the fit indices met the acceptance criterion.
Moreover, it presented the lowest RMSEA value of the remaining models as it was
considered to indicate a good fit. Besides, the AIC and ECVI indices were also the
lowest of the remaining competing models. The final model is shown in Figure 6.2.
Figure 6.2. Longitudinal Extended Channel Model including self‐efficacy which
results from Structural Equation Modelling Analyses (SEM) in 258 secondary school
teachers. Only significant paths are shown in this figure.
Self‐efficacy T1
ChallengeXskill T1
Flow T1
Indicator1
Indicator2
Absorption
Enjoyment
e1
e2
e4
e3
Self‐efficacy T2
ChallengeXskill T2
Flow T2
Indicator1
Indicator2
Absorption
Enjoyment
e1
e2
e4
e3
.36***
.50***
.52***
.74***
.37***
.36***
.41***
.28***
.19**
.59 .70
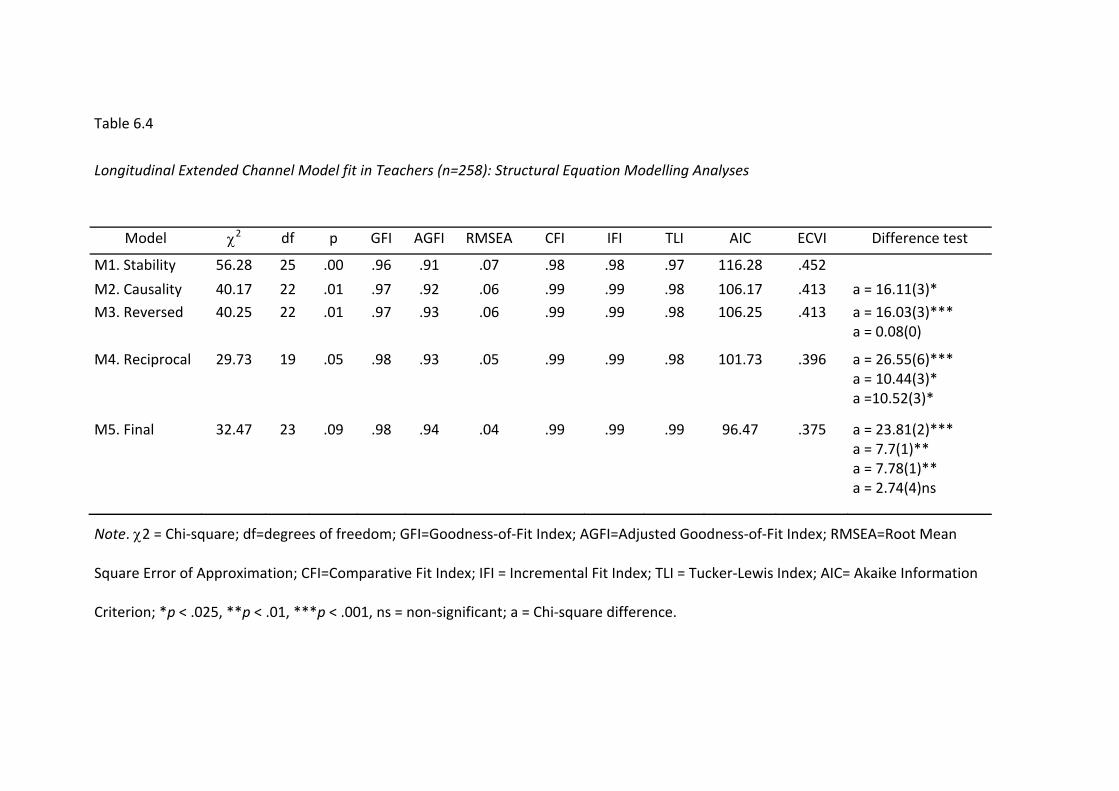
Table 6.4
Longitudinal Extended Channel Model fit in Teachers (n=258): Structural Equation Modelling Analyses
Model χ2 df p GFI AGFI RMSEA CFI IFI TLI AIC ECVI Difference test
M1. Stability 56.28 25 .00 .96 .91 .07 .98 .98 .97 116.28 .452
M2. Causality 40.17 22 .01 .97 .92 .06 .99 .99 .98 106.17 .413 a = 16.11(3)*
M3. Reversed 40.25 22 .01 .97 .93 .06 .99 .99 .98 106.25 .413 a = 16.03(3)*** a = 0.08(0)
M4. Reciprocal 29.73 19 .05 .98 .93 .05 .99 .99 .98 101.73 .396 a = 26.55(6)*** a = 10.44(3)* a =10.52(3)*
M5. Final 32.47 23 .09 .98 .94 .04 .99 .99 .99 96.47 .375 a = 23.81(2)*** a = 7.7(1)** a = 7.78(1)** a = 2.74(4)ns
Note. χ2 = Chi‐square; df=degrees of freedom; GFI=Goodness‐of‐Fit Index; AGFI=Adjusted Goodness‐of‐Fit Index; RMSEA=Root Mean
Square Error of Approximation; CFI=Comparative Fit Index; IFI = Incremental Fit Index; TLI = Tucker‐Lewis Index; AIC= Akaike Information
Criterion; *p < .025, **p < .01, ***p < .001, ns = non‐significant; a = Chi‐square difference.
The story flows on: A multi‐study on the flow experience
142
These results confirm Hypothesis 1 in which we expected that the extended
Channel Model, which included self‐efficacy as a predictor of flow experience, would
show a better data fit than the original Channel Model (which only included the
challenges X skills combination). Specifically, the RMSEA (the original Channel Model =
.13; the Extended Channel Model = .04) index of the original Channel Model should
lead to model rejection. Besides, the rest of the fit indices in the Extended Channel
Model showed a better fit.
With Hypothesis 2, we expected self‐efficacy would not only directly lead to
flow experience, but also indirectly through the challenges X skills combination. From
the results obtained, we observed the significant lagged and positive effects from T1
self‐efficacy to T1 flow, from T1 self‐efficacy to T1 challenges X skills, and from T1
challenges X skills to T1 flow. The same relationships were also shown at T2. Besides,
59% of the T1 flow variance was accounted for by the hypothesised predictors, that is,
T1 self‐efficacy (which accounted for 21.24% of the variance) and T1 challenges X skills
(which accounted for 30.68% of the variance). Hence, Hypothesis 2 is supported.
With Hypothesis 3, we expected both self‐efficacy and flow to be reciprocally
related in a kind of virtuous circle over time; that is, the more self‐efficacy at T1, the
more flow experiences at T2, and vice versa. The results showed that the influence of
T1 self‐efficacy on T2 flow was also observed over time but, in this case, it was
mediated by T2 challenges X skills. Specifically, T2 flow variance (70.0%) was partially
explained by T1 challenges X skills (13.3%), T2 self‐efficacy (25.9%), and by T2
challenges X skills (28.7%). However, the reciprocal relationship between T1 flow as a
predictor of T2 self‐efficacy was not confirmed, although a virtuous positive circle
between challenges X skills and flow at both T1 and T2 was found. The scenario so far
Chapter 6
143
is: the more T1 challenges X skills, the more T2 flow, and vice versa. Thus, Hypothesis 3
was only partially confirmed because a causal relationship was noted between T1 self‐
efficacy and T2 flow, which was mediated by T1 challenge X skills and T2 self‐efficacy.
Further analyses were performed in order to know whether the studied
variable levels increased from T1 to T2.
Moreover, repeated measures analyses were conducted in order to check
whether there were significant differences in all the study variables between T1 and
T2. The results revealed that there were no significant differences among all the
variables, such are self‐efficacy F(1, 251) = 2.07, p = .15; absorption F(1, 256) = 3.84, p
= .06; enjoyment F(1, 256) = .27, p = .60; challenge F(1, 251) = .77, p = .38; and skills
F(1, 253) = 3.62, p = .06.
Discussion
The main objective of this study, which has focused on flow antecedents, was to
extend the channel model (Csikszentmihalyi, 1990, 1997, 2003) by including self‐
efficacy as an additional predictor of the high levels of challenges X skills combination
of the flow experience itself (defined as work absorption and enjoyment). In other
words, we expected self‐efficacy to play a predicting role in flow experience directly
and indirectly, and synchronically and diachronically, through the challenges X skills
combination. The results provided evidence for our predictions. In particular,
Hypotheses 1 and 2 were confirmed, thus favouring our Extended Channel Model.
However, Hypothesis 3, which refers to the virtuous circle over time, was partially
confirmed.
The story flows on: A multi‐study on the flow experience
144
Extending the Channel Model of Flow: self‐efficacy as a flow antecedent
As expected, the results also showed that Hypothesis 1 (the model which
included self‐efficacy) and the Channel Model to be flow predictors, and which fitted
the data better than the Channel Model of Flow with a combination of high scores on
challenges X skills. Hence these data evidence that the current study contributes to
improve the Channel Model formulated by Csikszentmihalyi in 1975 and developed by
Csikszentmihalyi and cols. in following years (Hektner & Csikszentmihalyi, 1996;
Massimini & Carli, 1988; Moneta & Csikszentmihalyi, 1996; Nakamura &
Csikszentmihalyi, 2002). The current study also provides empirical evidence and
supports the idea that not only the combination of high challenges and high skills is
needed to experience flow, but also a belief in one’s skills to overcome the challenge in
the activity at hand in the future. In other words, although high challenges and skills
are necessary, they are not sufficient conditions to experience flow. Thus the
combination of Csikszentmihalyi’s Channel Model and Bandura’s Social Cognitive
Theory resulted in a more complementary and complete model that explains both the
flow experience and its antecedents.
This finding is closely related to Hypothesis 2 which was also confirmed by this
study. Thus, it is confirmed that self‐efficacy works as an antecedent directly and
indirectly leads to flow through the challenges X skills combination. Our study also
shows the relevant role that self‐efficacy plays as an antecedent of flow experience. So
far, both self‐efficacy and the challenges X skills combination are prerequisites of the
flow experience. This assertion is also supported by the results obtained in terms of
the flow variance explained by each variable. According to these results, 21.0% of the
variance of the T1 flow experience is explained by T1 self‐efficacy , and 30.0% of the
Chapter 6
145
variance is explained by T1 challenges X skills. Likewise, these findings are replicated
after 8 months at T2 when T2 self‐efficacy accounted for almost (26.0%) the same
percentage of variance of T2 flow experience as T2 challenges X skills (29.0%).
Flow antecedents over time
The results showed that T2 flow is accounted for by T1 challenges X skills which,
at the same time, is accounted for by T1 self‐efficacy. Specifically, the T2 flow variance
(70.0%) was partially explained by T1 challenges X skills (13.0%). Unexpectedly, no
direct path was found between T1 self‐efficacy and T2 flow, although this cross‐lag
relationship was mediated by the perception of T1 challenges X skills. Apparently, it
was as though feeling efficacious predicted higher levels of challenges and skills which,
in turn, predicted flow experiences over time.
Since flow is a momentary experience, self‐efficacy has to be very specific not
only about the activity that the person is doing at that time, but also about the
perception of a person’s skills to overcome the challenges. In this way, the results
found that T1 self‐efficacy related more strongly to flow experiences, and that this
situation occurred at the same time (T1) as in the flow experience, which took place 8
months later at T2. Finally, this virtuous circle was seen to occur between challenges X
skills and flow over time. So, the more challenges X skills perceived at T1, the more
flow experiences at T2, and vice versa.
Limitations and future research
Despite the relevance of this study extending the Channel Model by taking self‐
efficacy as an antecedent of the flow experience, it is necessary to interpret the results
with caution because of its non‐experimental nature. Thus, the present study has its
The story flows on: A multi‐study on the flow experience
146
limitations. The first is the use of self‐report questionnaires to collect the data used in
this study as their results may be affected by the variance of the common method.
Although some research criticises the use of questionnaires since they do not yield
good quality data to elicit phenomenological perceptions as subjects are not used to
putting those perceptions into words (Massimini, Csikszentmihalyi, & Carli, 1987),
other research works have shown them to be a sufficient strategy to collect
retrospective data of their past flow experiences and to obtain a descriptive picture of
these positive experiences (for example, Chen, Wigand, & Nilan, 2000). So this can be
an alternative solution for collecting data in contexts in which it is more complicated to
use the Experience Sampling Method (ESM; Csikszentmihalyi, Larson, & Prescott, 1977;
Csikszentmihalyi & LeFevre, 1989) given its repeated assessment nature, although it
can be used as a first step. Then, these questionnaires may be complemented with
more data. For instance, one solution could be to implement diary studies to a specific
sub‐group from the initial questionnaire database participants.
A second limitation of this study is that we did not have information about
what kind of tasks the teachers were referring to when they completed the
questionnaire (e.g., teaching, preparing classes, evaluating works). This makes it
difficult to compare self‐efficacy and flow levels over time because; for example, while
a teacher at T1 could answer about teaching, they could be referring to preparing
classes at T2. Therefore, a suggestion for future research would be to collect data
about the activities that teachers do and to focus only on one such activity when
answering the questionnaire at T1 and T2.
Thirdly, this study uses two waves to allow us to explore the circle encountered
since an upward trend was found in self‐efficacy. In order to explore the upward‐
Chapter 6
147
spirals in self‐efficacy and flow, it would be advisable to include three time points, or
more, in future research.
Fourthly, this study is limited to the secondary school teacher context. Since
the main hypotheses regarding causal relationships between self‐efficacy and flow
were confirmed, it would be interesting and relevant to examine this phenomenon in
other occupational fields.
Finally, a conceptual question based on the relationship between flow and
engagement arises and should also be explored in future research. It is worth noting
that these two concepts are very close; in fact they share the absorption variable as a
common variable in both constructs. Work engagement is defined as a persistent,
pervasive and positive affective‐motivational state of fulfilment in employees which
does not focus on any particular object, event, individual or behaviour (Schaufeli, et al.,
2002). So the difference between work engagement and flow is that the former is a
more general and pervasive state of mind related to the job as such, whereas the latter
is a specific optimal experience of a limited duration and relates to a specific activity.
Engagement represents a more long‐term, positive work‐related experience with some
similarities to flow at work (Demerouti, 2006). So it is plausible that engaged
employees are more likely to experience short‐time, transitory, optimal experiences
(flow) at work compared to those who are not engaged. Further research is also
needed to clarify and test the relationship of work engagement and flow.
Theoretical and practical implications
The first theoretical implication is the step forward that this study represents in
the knowledge of flow antecedents, namely self‐efficacy plays a key role as a flow
prerequisite at a given time and also over time, as mediated by high challenges X skills.
The story flows on: A multi‐study on the flow experience
148
So by comparing those models which include self‐efficacy, or not, as an antecedent of
the flow experience, we have shown that the model fits the data better when it
includes self‐efficacy. This result is based on the predictions of Bandura’s Social
Cognitive Theory (SCT, Bandura, 2001), and since self‐efficacy is “the belief in one’s
capabilities to organise and execute the sources of action required to manage
prospective situations” (Bandura, 2001), and refers to the beliefs that individuals hold
about their competences (in this case, about competences or skills related to work), it
influences the perception of their skills and of the challenges to cope. In that sense,
and according to the SCT, people with high efficacy beliefs will perceive more
challenges immediately, and will feel more competent (skilled) which, in turn, will
influence more flow experiences over time.
In the same vein, the testing of the two models, one including the challenges X
skills combination and the other including self‐efficacy beliefs, represents the two
theoretical approaches: the Social Cognitive Theory (Bandura, 1997, 2001) and the
Flow Theory (Csikszentmihalyi, 1975, 1990). The inclusion of self‐efficacy in the
Channel Model is indeed a step forward, which Bassi et al. also began (2007). The
combination of these two theories has demonstrated that the more complete model
including self‐efficacy proves better to explain the optimal experience process. So far,
this step forward has provided researchers with a valid and reliable information about
flow experience as it can be explained by these two theoretical perspectives. A third
conceptual issue is related to the relationship between self‐efficacy and perceived
competence. Although at first glance they may seem to be the same constructs, it
must be noted that professional efficacy is one’s perception of the current capabilities
and skills to do a specific activity (in the present study, teaching). However, self‐
Chapter 6
149
efficacy refers to the beliefs in one’s capabilities to teach (in the present study)
successfully even though the teacher encounters problems or obstacles during the
activity. In other words, professional efficacy refers to the level of skills that teachers
possess, while self‐efficacy is the belief that the teacher can teach using his/her skills in
the future. Furthermore, to avoid the possibility of overlapping problems between
these two constructs, a model test has been carried out in this study. The results
showed that self‐efficacy and professional efficacy were interrelated but had distinct
constructs.
The practical implications are twofold. First the results obtained provide
evidence of the need to (re)design jobs in order to increase the worker’s challenge and
skill perceptions. Thus, only those jobs characterised by high challenges performed by
high skilled workers will provide those employees the chance to experience flow at
work (Csikszentmihalyi, 1990; Eisenberger et al, 2005). The opportunity to work in the
contexts characterised by challenging tasks with accurate levels of skills will enhance
‘healthy workers’ working in ‘healthy jobs’ which, in turn, will increase positive moods
(Csikszentmihalyi, Rathunde, & Whalen, 1993), task interest (Catley & Duda, 1997) and
‘healthy products’ (Salanova, 2008). Then, as self‐efficacy is a relevant antecedent to
experience flow, the results suggest that training plays a pivotal role to generate flow
more frequently (by increasing the perception of challenge and skills at work, but
above all, self‐efficacy levels). This training should focus on promoting the four sources
of efficacy which include a variety of components that are consistent with the
theoretical cues for self‐efficacy building (Bandura, 1997, 1999). These include role‐
playings to provide successful experiences at work (enactive mastery), models of
performance (vicarious experiences), coaching and encouragement (verbal
The story flows on: A multi‐study on the flow experience
150
persuasion), and reduction of the emotional threats of rejection (managing
physiological states) (see Salanova et al., 2003).
In short, the present study allowed us the chance to explore and find such
interesting results in relation to the antecedents of the flow experience. Specifically,
the study allowed us to go beyond the challenges X skills combination as flow
prerequisites by means of self‐efficacy beliefs in teachers. Therefore, it has enabled us
to extend the Channel Model (Csikszentmihalyi, 1975) thanks to its combination and
integration with of the Social Cognitive Theory (Bandura, 1997, 2001). Besides, we also
conclude that, in our case, schools may facilitate ‘flow experiences’ among teachers by
them investing in creating challenging tasks and by promoting the idea that ‘teachers
can do it’.
Chapter 7
151
Chapter 7. Discussion
One never notices what has been done; one can only see what remains to be done.
Marie Curie
The main goal of the current thesis was to obtain a better understanding of the
flow phenomenon, specifically that is, to describe, operationalise and explore the
dynamics and the antecedents of flow experience at work, study and also in non‐work
contexts. Since relatively little empirical research regarding the study of flow has been
conducted on the operationalisation and explanation of this optimal experience at
work, the current thesis has gone one step forward to operationalise and understand
the daily flow dynamics as well as its prerequisites. Thus, the studies that make up the
current thesis have been carried out in different work domains (i.e., tile workers,
heterogeneous sample of workers and technology users) and study settings (i.e.,
university students, secondary school teachers) and countries (Spain, The Netherlands,
Sweden). Moreover, in order to carry out the main research goals, we have also used
different methods and designs (i.e., cross‐sectional, longitudinal, Experience Sampling
Method).
Particularly, the main research aims of the current thesis can be summarised as
follows: (1) To find a clear and practical operationalisation of flow experience that
extends and goes beyond the traditional Channel Model (Csikszentmihalyi, 1990, 1997,
2003), (2) To explore and measure the daily flow patterns and (3) To explore the
antecedents of flow experience. These research questions and the results obtained in
the current thesis will be discussed in the following sections. These sections will be
The story flows on: A multi‐study on the flow experience
152
structured according to the three main aims: operationalisation, measure and
antecedents. Finally, current thesis limitations as well as future research and practical
implications will be discussed.
7. 2. Then….what is flow? Definition and operationalisation
Providing a definition of flow experience may mean having to resort to a larger
number of definitions found in the literature (see Novak & Hoffman, 1997). Thus, first
of all, it is of major interest to understand the components and the process of this
optimal experience. Then, one of our main thesis questions has been what is flow
experience and how it can be operationalised? In other words, what are the main
components of flow experience? Three major steps have been taken to clarify the
operationalisation question throughout this thesis.
The first step taken was to distinguish flow antecedents from flow experience.
In other words, to distinguish the traditional way of considering flow experience as the
combination of challenge and skills from flow experience itself. Traditionally, the study
of flow in different settings has operationalised flow as a product of high challenges
and high skills (e.g., Csikszentmihalyi & LeFevre, 1989). The same assessment has been
followed in the vast majority of the studies done into flow in work settings (e.g.,
Eisenberger, Jones, Stinglhamber, Shanock, & Randall, 2005). Nevertheless in the
current thesis, and in accordance with our conceptual model, we do not completely
agree with this traditional flow operationalisation (‘Channel Model of Flow’
Csikszentmihalyi, 1990, 1997, 2003).
Besides in the literature, challenges and skills have been frequently considered
prerequisites to experience flow, so the role that this combination plays was unclear.
Chapter 7
153
Thus, we proposed a new operationalisation based on the flow descriptions gathered
from Csikszentmihalyi’s studies and on the common flow elements taken from a
literature review on flow definitions (e.g., Chen, 2006; Novak, & Hoffman, 1997), and
from recent previous studies (Bakker, 2005; Demerouti, 2006; Salanova, Bakker, &
Llorens, 2007) that begin to use a different flow operationalisation at work beyond its
prerequisites (i.e., challenges and skills). Our alternative operationalisation, which
comprised three components (i.e., absorption, enjoyment and intrinsic interest), was
tested in Chapter 2 in combination with the traditional ‘Channel Model of Flow’. It was
the first step that supported the validity of our flow operationalisation based on three
components since the results complemented and extended the traditional model by
not only considering the combination of high challenges and high skills as a necessary
condition of flow, but by also measuring experience itself (i.e., absorption, enjoyment
and intrinsic interest).
The second step taken regarding flow operationalisation was the validation and
in‐depth study of the flow experience structure. First we tested the three‐factor model
in Chapter 3 (i.e., absorption, enjoyment and intrinsic interest) in a sample of
technology users made up of workers and students, which supports the robustness of
the three‐factor model. Based on previous definitions of flow, we then considered the
possibility that intrinsic interest could be related to flow, but as an antecedent (this
topic will be developed in Section 7.4) rather than part of the experience itself. Given
our research interest in revealing the core of flow experience, we analysed the main
components that make up flow experience. Then in Chapter 4, we compared two
competitive models of flow: the previous three‐factor model (i.e., enjoyment,
absorption and intrinsic interest) and the new two‐factor model (i.e., enjoyment and
The story flows on: A multi‐study on the flow experience
154
absorption). The results showed that the two‐factor model fitted the data better than
the three‐factor one, thus evidencing that intrinsic interest was not a core part of flow
experience. Briefly, we define flow experience as an optimal and momentary
experience characterised by high levels of absorption and enjoyment while doing an
activity. For example, while the person experiencing flow, for instance an employee
working with his/her computer doing a report, he/she can remain absorbed and
concentrated while doing the report, that is, when finding the proper words and taking
care of the structure, he/she is enjoying the activity, although he/she is not aware of
this feeling at that time. But does this evaluation occur before, after or during the
activity?
The third step was to explore the two core dimensions of flow experience
(absorption and enjoyment). According to the question posed in the Introduction of
this thesis, the answer about the role of enjoyment appears to be solved since the
results in Chapter 4 demonstrated that enjoyment is part of flow experience. However
by using the Experience Sampling Method (ESM, Csikszentmihalyi, Larson, & Prescott,
1977; Csikszentmihalyi & Larson, 1987), the results of an in‐depth exploration of the
core components of flow in Chapter 5 revealed the differentiated role that absorption
and enjoyment play in relation to working tasks. Specifically, enjoyment was higher
when performing non‐working tasks, whereas absorption was higher at work. These
results are in line with the so‐called ‘paradox of work’ (Csikszentmihalyi & LeFevre,
1989). This paradox explains that work is likely to lead to more flow experiences than
leisure, but leisure is preferred to work. In other words, people tend to experience
more flow experiences at work than during their leisure time, although they state they
‘would like to be doing something else’ when they are at work, but not when they are
Chapter 7
155
at leisure. It can be argued that, by definition, work is a compulsory activity that
requires effort, as it can be defined as ‘the expenditure of an effort and energy to
achieve a goal’ (Handbook of Industrial, Work and Organizational Psychology, p. 1,
2001). Then, work is challenging but requires an investment of effort and application
of skills to carry it out. Therefore, people free at leisure tend to disregard challenges
more and make less effort to recover from work. That is why enjoyment in Chapter 5
was related to non‐working activities. Besides, people judge their desires by social
conventions rather than by the reality of their feelings (Csikszentmihalyi & LeFevre,
1989). In that sense, people usually conceive work as a negative and compulsory
activity, which is more a social convention rather than a creative and enjoyable
activity. Then, socially speaking, people are not expected to enjoy themselves at work,
so it may be argued that participants have the mental preconception that one cannot
enjoy work.
In short, although the findings of the current thesis revealed that absorption
and enjoyment are the core components of flow experience, in Chapter 5 we revealed
that the absorption component positively relates to working tasks, while the
enjoyment component positively relates to non‐working tasks. So it seems that the
answer as to whether the core flow components at work are absorption and
enjoyment or maybe only absorption lie in the kind of measurement employed. It is
worth noting that when we measured flow by means of questionnaires (Chapters 4
and 6), a bi‐factorial structure appeared. Yet when we measured flow by means of
ESM, absorption and enjoyment seemed to play different roles, at least while
differentiating work and non‐work domains. Therefore, flow operationalisation is
The story flows on: A multi‐study on the flow experience
156
related to the flow measure question, so to explore flow experience in detail, we
compared the use of two kinds of methods: questionnaires and ESM.
7.3 How to capture flow? The flow measure
Different methods have been used to explore flow experience, such as single
administration questionnaires (Chapters 2, 3 and 4), ESM (Experience Sampling
Method) through electronic diary study (Chapter 5), and a questionnaire‐based two‐
wave field longitudinal study (Chapter 6). Traditionally, researchers interested in flow
experience have focused and specialised in only one measure, for instance, the most
well‐known is the use of ESM. In addition, the most used operationalisation in the
study of flow has been the challenges and skills combination to assess flow experience
by means of questionnaires (e.g., Allison & Duncan, 1988) and also by ESM (e.g.,
Csikszentmihalyi & LeFevre, 1989; Kubey & Csikszentmihalyi, 1990). In the current
thesis, we used a novel approach by not only measuring flow experience by means of
an alternative operationalisation, such as absorption, enjoyment and intrinsic interest
(Chapters 2 and 3), but also the core flow experience, i.e., absorption and enjoyment
(Chapters 4, 5 and 6). We measured flow experience beyond challenges and skills as
we considered this combination to be the antecedents or prerequisites of flow
experience. In order to explore our alternative flow operationalisation, we used
different approaches and combined ESM with questionnaires. The idea was that
different approaches provide scientific benefits because using different measures
allows researchers to understand flow experience from a much broader perspective. In
addition, the use of questionnaires to assess flow offers some advantages over the use
of ESM, and vice versa. Therefore it is important to take into account the possible
Chapter 7
157
results of measuring flow after (questionnaires) and during (ESM) flow experience. We
now take an in‐depth look at this topic.
Some research has criticised the use of questionnaires by not yielding a good
quality of data as the main reason, for eliciting phenomenological perceptions because
subjects are not used to putting these perceptions into words (Massimini,
Csikszentmihalyi & Carli, 1987). However, other research has shown questionnaires as
a strategy to collect retrospective data of their past flow experiences and to obtain a
descriptive picture of these positive experiences (e.g., Chen, Wigand, & Nilan, 2000).
Hence, one pitfall is that questionnaires are retrospective measures that may bias the
results. Then, with hindsight, flow is positively evaluated. For instance, if we asked a
student about flow who had experienced flow while designing a chair towards an
academic assignment with a computer when he/she had finished his/her design,
he/she would probably answer by describing the concentration and positive feelings
he/she had experienced as enjoyment. This affective evaluation is produced “after”
the experience. So far, the fact of not measuring enjoyment “during” the activity does
not mean that the experience was not enjoyed. This question about measuring flow is
indeed tricky. The results from Chapters 2, 3, 4 and 6 provided information about the
relevant role that enjoyment plays as part of flow experience, together with
absorption. So, it seems that measuring flow experience by means of a questionnaire
(which implies a retrospection bias) means considering the core flow experience to be
made up of absorption and enjoyment.
Following Nakamura and Csikszentmihalyi’s (2002) suggestion, questionnaires
are recommended when the goal is not to identify or describe, but rather to measure
dimensions of flow experience and/or differences in its occurrence across contexts or
The story flows on: A multi‐study on the flow experience
158
individuals. Then in the current thesis, questionnaires were employed to assess flow
experience dimensions and to measure the frequency of flow occurrence in different
work settings. Therefore, the use of questionnaires in Chapters 2, 3, 4 and 6 provided
valid information on the flow experience dimensions. So t it has been possible to test
the different flow experience components hanks to the use of this kind of method, and
to later confirm the bi‐factorial structure of flow (absorption and enjoyment).
Therefore, we may confirm that the use of questionnaires is very helpful to assess the
flow dimensions. Besides, the use of these scales has allowed us to test this structure
in a wide range of samples and contexts which would otherwise prove more difficult
with other methods. In fact, the use of questionnaires can be an alternative solution to
collect data in those contexts where the use of the Experience Sampling Method is
more complicated given its repeated assessment nature.
So far, we have talked about measuring flow by means of questionnaires.
Indeed, questionnaires have proved useful to assess flow operationalisation and to
also outline a clear structure of flow experience. But another major goal of the current
thesis was to explore and measure daily flow patterns, in other words, the question of
how flow works during the day remains to be answered. So to answer the issue about
measuring daily flow, the use of electronic diary method (in Chapter 5) is a major
contribution of the current thesis. The electronic diary study method offers complete
information not only about the inter‐person variations in the experience, but also
about the intra‐person differences. That is, the use of this method offers some
advantages, such as reliable person‐level information and it facilitates the analyses of
intra‐persons changes over time (Bolger, Davis, & Rafaeli, 2003). It was also possible to
compare flow with a control group (burned‐out group) for the first time in the study of
Chapter 7
159
flow. In addition, the ESM method represents a novelty in scientific research because it
has been recently used in many areas, apart from the study of flow, such as the study
of burnout (i.e., Sonnenshein, Sorbi, Van Doornen, Schaufeli, & Maas, 2007), work and
recovery activities (i.e., Sonnentag, 2001), job resources and engagement (i.e.,
Xanthopoulou, Bakker, Demerouti, & Schaufeli, 2007), and well‐being (i.e., Oishi,
Diener, Choi, Kim‐Prieto, & Choi, 2007), among others (for an extended review of this
method, see also Bolger, Davis, & Rafaeli, 2003).
So the use of the diary study in this thesis represents a relevant tool to study
flow patterns during both working and non‐working activities. Besides, if we take into
recent research account, it has introduced four main challenges to increase the
accuracy of the method to study flow patterns.
The first challenge was the use of an electronic device such as Palms or
Personal Digital Assistant (PDA) in the assessment of flow. It was a novelty because no
studies were known to use an electronic diary study in the flow contexts; its use was
only found in a similar study using ESM with computers and pop‐up windows with a
questionnaire (Chen, 2006), but it was limited to web users contexts. The use of a PDA
or electronic diary helped the participants to carry this device and to answer questions
easily without the inconvenience of losing information and misplacing booklets, for
instance.
Secondly, although traditionally only one week of sampling period was
considered (Csikszentmihalyi & LeFevre, 1989; Delle Fave, & Massimini, 2005b;
Massimini & Carli, 1988), the sampling period in the current thesis, where participants
had to carry the PDA, was extended to two weeks. We extended the participation
period to collect more information because the data of two weeks is more
The story flows on: A multi‐study on the flow experience
160
representative than those of only one week. In this way, the probability of finding
biased data corresponding to one week was also avoided. It has to be noted that the
data management analysis strategy used was Multilevel Analysis (Hox, 2002). This
technique represents a third challenge or novelty.
The use of Multilevel analysis presents a third challenge, since Z‐scores were
used instead of the the traditional data analysis method, ESM (e.g., Csikszentmihalyi,
Rathunde, & Whalen, 1993; Massimini, & Carli, 1988). The use of Z‐scores does not
take into account the different levels and the variance explained by each level. So,
although Multilevel Analysis is not commonly used in the study of flow, in this thesis it
provided significant information about the beep level, the day level and the person
level, and took into account the nested data structure offered by ESM.
And last but not least, we assessed daily flow patterns using an alternative
operationalisation of flow based on the two flow core components: absorption and
enjoyment. In short, all these challenges allowed us to explore in detail the daily flow
patterns among healthy and burned‐out people beyond the traditional challenges and
skills combination and which contributes to extend the original Channel Model. Thanks
to the use of an electronic diary study, in Chapter 5 it was possible to test that flow
experiences follow a curvilinear diurnal pattern (in the form of a U‐shape), when it had
never before been tested in flow research. Moreover, ESM allowed us to examine the
different functioning in terms of core flow components at work (absorption and
enjoyment). Whereas enjoyment was higher when performing non‐working tasks (or
leisure activities), absorption was higher at work. Once again, these results lead us to
the question about what the core dimensions of flow experience are. Briefly, the
results derived from the questionnaires (retrospective measure) showed a bi‐factorial
Chapter 7
161
flow structure, whereas the ESM results (not retrospective‐biased) illustrated how the
two components develop during the course of the day. The ESM results complemented
the questionnaire‐derived results and explain the differentiated role of the functioning
of the two flow core components; absorption and enjoyment. Therefore it seems that
flow, because of its phenomenological nature, is quite susceptible to the way we
measure it. According to the results of Chapter 5, the daily flow pattern appears to be
the same for its two components, that is, it presents the same curvilinear pattern for
both absorption and enjoyment. In other words, both components share the same
pattern and daily functioning, but one is related to work activities while the other
relates to leisure activities. Then by answering the question about flow core
components, these results can be elucidated by the already explained ‘paradox of
work’ (Csikszentmihalyi & LeFevre, 1989). However, it is worth noting that it is
important to pay special attention to the absorption measure.
Then in Chapter 5, absorption is measured by the item “Ik ben geboeid bezig”
whose English translation would be “I’m engrossed in what I’m doing”. In Dutch,
“geboeid” means positive or fascinating concentration; in other words, it has a positive
connotation. On a more philosophical level, the ‘positive absorption’ relationship –
commonly found in working activities – has to do with the eudemonic and hedonic
perspectives. We assume that while absorption relates to the former, enjoyment
relates to the latter. Eudemonia focuses on the full development of a person’s
capabilities for which the development of absorption in challenging activities is crucial
(Ryan & Deci, 2001). Hence, absorption, or being entirely engrossed in the activity at
hand, is the hallmark of flow experience where enjoyment is an a posteriori affective
evaluation (Ghani & Deshpande, 1994; Moneta & Csikszentmihalyi 1996; Trevino &
The story flows on: A multi‐study on the flow experience
162
Webster, 1992). This is the reason why measuring flow with questionnaires provides
this retrospective affective evaluation, whereas measuring flow by ESM does not offer
the chance to do this affective evaluation. In other words, when asking a person about
flow at work by means of a questionnaire, the person may answer and be thinking
about flow experience while doing a certain working activity (for instance, writing a
financial report). This answer may imply the affective evaluation, which is why
enjoyment is included as part of flow experience when using questionnaires. If,
however, we use the ESM, the beeper will interrupt this flow experience on which the
person is totally focused. Then the person has to answer in a very short time. It can be
argued that perhaps the person is not aware if he/she is enjoying the activity because
when the beep sounds, there is no time for doing this affective evaluation. In short,
the fact that flow experience is positive in itself – albeit a posteriori – should not be
overlooked (Csikszentmihalyi, 1975). Therefore the positive affective component has
to be included in the measurement of flow experience.
To summarise, the use of both measurement tools seems to be an adequate
strategy when studying flow as they complement the information obtained by each
tool.
7.4 Flow antecedents: Extending the Channel Model
One matter of research interest of this thesis has been the understanding of
what facilitates the occurrence of flow experience. Misunderstandings appear
frequently in the literature in terms of mixing the flow experience measure with its
antecedents. For instance and as previously explained, some researchers state that
high challenges and skills combinations are conditions required to experience flow
(Nakamura & Csikszentmihalyi, 2002). However in empirical studies, the challenges
Chapter 7
163
and skills combination has been used as a measure of flow experience (e.g.,
Csikszentmihalyi & LeFevre, 1989; Delle Fave, Bassi, & Massimini, 2003; Eisenberger et
al, 2005). Thus, our research confirmed that the challenges and skills combination is a
necessary but not sufficient prerequisite of flow experience. Besides we began with an
alternative operationalisation of flow experience beyond challenges and skills by
considering flow experience as absorption and enjoyment. Therefore, the answer of
what facilitates flow experience at work is only partially answered in the literature,
that is, by means of high challenges and high skills. But what makes a person perceive
a task as challenging and if he/she has enough skills to meet it? According to our
results, it appears that beliefs in one’s capabilities to perform a task could be an
antecedent of flow experience. In other words, self‐efficacy beliefs.
Therefore, in Chapter 6 of the current thesis we provide empirical support for
the antecedent role that self‐efficacy plays in flow experience. Moreover, a novelty in
the current thesis was to extend the Channel Model (Csikszentmihalyi, 1990, 1997,
2003) – based on challenges and skills as flow prerequisites – by including self‐efficacy
as an additional predictor of the combination of high levels of challenges X skills and
flow experience itself (absorption and enjoyment). We found evidence of the
predicting role that self‐efficacy plays regarding flow experience over time that goes
beyond the challenges and skills combination among teachers. In other words, the
results from Chapter 6 provide evidence of the conceptual link between
Csikszentmihalyi’s Channel Model (Csikszentmihalyi, 1990, 1997, 2003) and Bandura’s
Social Cognitive Theory (SCT, Bandura, 2001) that resulted in a more complementary
and complete model to explain flow experience as well as its antecedents.
The story flows on: A multi‐study on the flow experience
164
As we argued before, another antecedent of flow experience seems to be
“intrinsic interest”. The role of intrinsic interest, though not empirically validated in the
current thesis, seems to be conceptually related to flow antecedents. Thus, intrinsic
interest would be necessary to direct the task and to favour attention to be paid to
carry out the activity. Nevertheless, intrinsic interest is not part of flow experience
itself; it merely comes just before experience. This is why it is so difficult to find the
thin line in research that separates the immediate antecedents from flow experience
per se. We ought to point out that we have preferred to label intrinsic interest as the
state of intrinsic motivation as we do not agree with research on flow employing the
term intrinsic motivation (Bakker, 2005; Moneta & Csikszentmihalyi 1996) as part of
flow experience. For example, according to the Self‐Determination Theory (Deci &
Ryan, 1985), intrinsic motivation is the tendency to engage in tasks because one finds
them interesting and enjoyable. In other words, interest is the key promoter of
intrinsic motivation as it directs and amplifies attention towards the task (Izard, 1977).
This is the reason why we consider the use of interest instead of motivation for a
momentary experience, like flow, as the former is punctual factor task‐related while
the latter is more general long‐term drive.
7. 5 Limitations and challenges for future research
The current thesis has resolved previous questions that exist in flow research,
such as the operationalisation and measure of flow in different contexts (Chapters 2, 3
and 4), the examination of its patterns (Chapter 5) and some of its antecedents
(Chapter 6) by using a wide range of samples (workers, students) and designs (cross‐
sectional, longitudinal, ESM) and data analysis techniques (CFA, SEM, Multilevel, etc.).
Some of strong points of the current thesis have been explained throughout the
Chapter 7
165
conclusions presented, so we will now go on to focus on the limitations and how to
overcome them in the future.
The first question relates to the core flow experience dimensions, specifically
the role of intrinsic interest. Although empirical evidence was found regarding the core
of flow in this thesis, one main limitation was the fact of not specifically testing the
role that intrinsic interest plays. It is clear from results presented in Chapters 3 and 4
that intrinsic interest is related to high levels of flow (absorption and enjoyment). In
fact, some authors (e.g., Finneran & Zhang, 2003) state that tasks should have
particular characteristics (intrinsically interesting) that may influence the likelihood of
an optimal experience. Then although conceptually speaking the role of intrinsic
interest seems to be clear, more research in terms of testing the function as an
antecedent that intrinsic interest plays in the flow process is needed.
Another limitation is the lack of examination of the different activities at
work/study and their relationship with flow. That is, we neither controlled for the
different activities that people do at work in the samples studied, nor how the fact of
doing a particular task can provide flow more frequently than another task. In other
words, exploring the nature of the activities that are highly related with flow. For
instance in the case of technology (Chapters 3 and 4), it would be interesting in future
research to study the differences in terms of the flow experience between working
with a spreadsheet or working with PowerPoint. Despite the diary study (Chapter 5)
having taken activities into account in a general way (working or non‐working
activities), the specific kind of activity the person is doing should also be included in
future research.
The story flows on: A multi‐study on the flow experience
166
In relation to this, a heterogeneous sample of Dutch workers was also studied
in Chapter 5; this also limited the study since it eliminates the opportunity to compare
the participants’ levels of flow in the same kind of working tasks. Thus, once again, the
role that the kind of occupation and related tasks play have not been controlled. A
suggestion for future research is to collect information about the activity (not only
working or non‐working activities) the person is doing at that time. This will enable us
to extend the categories of activities that the person carries out in both the work and
non‐work settings to compare flow levels across activities. Moreover, it would be very
interesting to replicate the same study (Chapter 5) in the future with other samples of
workers to explore whether differences in flow patterns exist among workers of
different countries since most research done on cross‐national differences has focused
on students (Delle Fave & Massimini, 2005b). Besides, although a wide range of
samples from different countries and settings were used in this thesis to test the flow
structure, more heterogeneous samples are needed to generalise the conclusions of
the present thesis.
Thirdly, a challenge for future research implies the understanding of the
relationship of flow with other constructs such as engagement. Specifically,
engagement refers to a ‘persistent, positive affective‐motivational state of fulfilment
that includes three aspects: vigour, dedication, and absorption’ (Schaufeli, Salanova,
González‐Romá, & Bakker, 2002, p. 72). Engagement represents a more long‐term,
positive work‐related experience with some similarities to flow at work (Demerouti,
2006). Therefore, it is not an outlandish idea to think about the close relationship that
may exist between these two constructs. Although flow experience is a momentary
experience unlike the more stable nature of engagement since it is a process, the
Chapter 7
167
absorption component in both constructs is genuinely close. In fact, the absorption
scale used to measure flow in this thesis has been adapted from the absorption
dimension of the commonly used tool to assess engagement (the Utrecht Work
Engagement Scale, UWES; Schaufeli, Salanova, González‐Romá, & Bakker, 2002). Thus,
flow at work can be related to engagement in the sense that if one person can
experience flow at work very often, he/she can also experience absorption and
enjoyment in his/her work. Then, he/she is in a work environment with plenty of work
activities that provide him/her flow experiences. Thus, we can hypothesise that it is
likely that a person who experiences flow may mean that he/she frequently is engaged
in his/her work, or even vice versa. In other words, an engaged employee may
frequently note flow experience at his/her work. Therefore, further research to
investigate this amazing relationship is required.
Finally for further research, it would be highly advisable to explore not only the
antecedents, but also flow consequences. According to Csikszentmihalyi, flow was
used to describe the most positive feelings (Csikszentmihalyi, 1975) and the most
enjoyable experiences possible in human lives as ‘the bottom line of existence’
(Csikszentmihalyi, 1982, p. 13). Nevertheless little empirical research has confirmed
this statement; for instance, research regarding the web use that stated that positive
affects and playfulness are consequences of flow experiences (Chen, 2006). Besides,
we can hypothesise that engagement is a consequence of flow experience. Therefore,
a suggestion for further research would be to clearly explore and identify which factors
may compound the ‘box’ of flow consequences, such as positive emotions,
engagement or even high performance.
The story flows on: A multi‐study on the flow experience
168
7. 6 Practical implications
The main goal of this thesis was to explore and shed some of light on the
explanation of flow experience. Conceptually speaking, therefore, much has been
achieved and practical implications may also be developed. Specifically, there are three
basic practical implications.
First, the use of specific measures to analyse flow in different work (and non‐
work) and study settings, such as use of technology which facilitates its application as a
practical tool to assess flow. In other words, a reliable measure based on the core flow
components (absorption and enjoyment) was built to assess flow in a practical way by
means of questionnaires. This measure involving two short scales can be applied and
adapted to numerous specific settings.
Second, results found in chapter 2 provide evidence of the need to (re)design
jobs in order to increase the worker’s challenge and skill perceptions. Thus, only jobs
characterized by high challenges performed by high skilled workers will provide those
employees the chance to experience flow at work (Csikszentmihalyi, 1990; Eisenberger
et al, 2005). The opportunity to work in contexts characterized by challenging tasks
with accurate levels of skills will enhance ‘healthy workers’ working in ‘healthy jobs’,
which will increase the positive moods (Csikszentmihalyi, Rathunde, & Whalen, 1993),
task interest (Catley & Duda, 1997) and ‘healthy products’ (Salanova, 2008).
Besides, since self‐efficacy is a relevant antecedent to experience flow,
intervention to boost efficacy beliefs will increase positive experiences such as flow. In
fact the results from Chapter 6 suggest that increasing self‐efficacy levels leads to flow
experience. According to the SCT, self‐efficacy influences employees’ behaviour,
thinking, motivations, and feelings (Bandura, 2001). First, it affects how much effort
Chapter 7
169
and persistence is mobilised to overcome obstacles. Second, self‐efficacy influences
the way we think; high levels of self‐efficacy are associated with optimism, whereas
lack of efficacy is associated with pessimism. Finally, high levels of self‐efficacy make us
feel good (Schaufeli & Salanova, 2007) and contribute to seek positive experiences
such as flow. Therefore, training plays a pivotal role in generating flow more frequently
(by increasing the perception of challenge and skills at work, but above all, self‐efficacy
levels). This training should focus on promoting the four sources of self‐efficacy,
including a variety of components that are consistent with theoretical cues for self‐
efficacy building (Bandura, 1997, 1999). These include role‐playings to provide
successful experiences at work (enactive mastery), models of performance (vicarious
experiences), coaching and encouragement (verbal persuasion), and reduction of the
emotional threats of rejection (managing physiological states) (see Salanova et al.,
2003).
7. 7 Final Note: How flow story ‘flowed’ on?
In short, the current thesis contributes to the scientific understanding of flow at
work/study and also in non‐work settings. Specifically, it has been possible to take a
further step forward in the explanation of flow experience, operationalisation,
measures, daily dynamics and antecedents to find empirical evidence of the extension
of the traditional Channel Model (Csikszentmihalyi, 1990, 1997, 2003). That is,
clarifying flow beyond the challenges and skills combination. All in all, with our
conceptual model, we define flow experience as an optimal momentary experience
characterised by high levels of absorption and enjoyment while doing a certain activity.
And this flow experience follows a curvilinear daily pattern with higher levels in the
The story flows on: A multi‐study on the flow experience
170
morning and the afternoon. Besides, self‐efficacy and the challenges and skills
combination are prerequisites of flow experience.
While it may seem that much of what this thesis presents has already been
achieved, flow research still has a long way to go. Moreover, the steps we have taken
have become useful tools to assess flow experience. Nonetheless, it is necessary to
generate ways to apply this knowledge to search how to foster flow at work and
outside work. Finding flow is clearly a good way of finding happiness and of enhancing
well‐being. Then, the need to explore practical ways to boost this optimal experience is
a main objective of further research … and that is how this story flows on.
It does not seem to be true that work necessarily needs to be unpleasant. It may always have to
be hard, or at least harder than doing nothing at all. But there is ample evidence that work can be
enjoyable, and that indeed, it is often the most enjoyable part of life.
(Mihaly Csikszentmihalyi, 1990)
References
171
References
Åborg, C., & Billing, A. (2003). Health effects of 'the Paperless Office'‐‐evaluations of
the introduction of electronic document handling systems. Behaviour &
Information Technology, 22, 389‐396.
Akaike, H. (1987). Factor analysis and AIC. Psychometrika, 52, 317–332
Arbuckle, J. L., & Wothke, W. (1999) Amos 4.0 user's guide. Chicago, IL: SmallWaters
Corp.
Arnetz, B. B., & Wiholm, C. (1997). Technological stress: Psychophysiological symptoms
in modern offices. Journal of psychosomatic research, 43(1), 35‐42.
Asakawa, K. (2004). Flow Experience and Autotelic Personality in Japanese College
Students: How do they Experience Challenges in Daily Life? Journal of
Happiness Studies, 5, 123‐154.
Bakker, A. B. (2001). Questionnaire for the assessment of work‐related flow: The WOLF.
Utrecht University, The Netherlands: Department of Social and Organizational
Psychology.
Bakker, A. B. (2005). Flow among music teachers and their students: The crossover of
peak experiences. Journal of Vocational Behaviour, 66, 26‐44.
Bakker, A. B., Demerouti, E., De Boer, E., & Schaufeli, W. B. (2003). Job demands and
job resources as predictors of absence duration and frequency. Journal of
Vocational Behavior, 62, 341‐356.
The story flows on: A multi‐study on the flow experience
172
Ballance, C. T., & Rogers, S. U. (1991). Psychology of computer use: XXIV. computer‐
related stress among technical college students. Psychological reports, 69,
539‐542.
Bandura, A. (1997). Self‐efficacy: The exercise of control. New York, NY: Freeman.
Bandura, A. (1999). Social cognitive theory of personality. In L. Pervin, & O. John (Eds.),
Handbook of personality (2nd ed., pp. 154‐196). New York: Guilford.
Bandura, A. (2001). Social cognitive theory: An agentic perspective. Annual Review of
Psychology, 52, 1‐26.
Bassi, M., Steca, P., Delle Fave, A., & Caprara, G. (2007). Academic self‐efficacy beliefs
and quality of experience in learning. Journal of Youth and Adolescence, 36,
301‐312.
Bentler, P. M. (1990). Comparative fit indexes in structural equation models.
Psychological Bulletin, 107, 238‐246.
Boivin, D.B., Czeisler, C.A., Dijk, D.J., Duffy, J.F., Folkard, S., Minors, D.S., Totterdell, P.,
& Waterhouse, J.M. (1997). Complex interaction of the sleep–wake cycle and
circadian phase modulates mood in healthy subjects. Archives of General
Psychiatry 54, 145–152.
Bolger, N., Davis, A., & Rafaeli, E. (2003). Diary methods: capturing life as it is lived.
Annual Review of Psychology 54, 576–616.
Browne, M. W., & Cudeck, R. (1993). Alternative Ways of Assessing Model Fit. In K. A.
Bollen & J. Scott Long (Eds.), Testing structural equation models (pp. 136‐
162). Newbury Park, CA: Sage.
References
173
Bryk, A., & Raudenbush, S. (1992). Hierarchical linear models: Applications and data
analysis methods. Thousand Oaks, CA, US: Sage Publications, Inc.
Byrne, B. M. (2001). Structural equation modeling with AMOS, EQS, and LISREL:
Comparative approaches to testing for the factorial validity of a measuring
instrument. International Journal of Testing, 1, 55‐86.
Caprara, G. V., Pastorelli, C., Regalia C., Scabini E., & Bandura A. (2005). Impact of filial
self efficacy on quality of family functioning and satisfaction. Journal of
Research on Adolescence, 15, 71‐97.
Carli, M., Delle Fave, A., & Massimini, F. (1988). The quality of experience in the flow
channels: comparison of Italian and U.S. students. In M. Csikszentmihalyi, & I. S.
Csikszentmihalyi, (Eds.) Optimal experience: Psychological studies of flow in
consciousness (pp. 288‐318). New York, NY, US: Cambridge University Press.
Catley, D., & Duda, J. L. (1997). Psychological antecedents of the frequency and
intensity of flow in golfers. International Journal of Sport Psychology, 28, 309‐
322.
Chen, H. (2006). Flow on the net‐detecting Web users positive affects and their flow
states. Computers in Human Behaviour, 22, 221‐233.
Chen, H., Wigand, R. T, & Nilan, M. S. (1999). Optimal experience of Web activities.
Computers in Human Behaviour, 15, 585‐608.
Chen, H., Wigand, R. T., & Nilan, M. S. (2000). Exploring web users' optimal flow
experiences. Information Technology & People, 13,, 263‐281.
The story flows on: A multi‐study on the flow experience
174
Christensen, T., Barrett, L., Bliss‐Moreau, E., Lebo, K., & Kaschub, C. (2003). A practical
guide to experience‐sampling procedures. Journal of Happiness Studies, 4(1),
53‐78.
Cifre, E., Llorens, S., Salanova, M., & Martínez, I. M. (2003). Salud psicosocial en
profesores: repercusiones para la mejora en la gestión de los recursos humanos
[Psychosocial health in teachers: repercutions to improve the human resources
development]. Estudios financieros, 50, 153‐247.
Clark, L., Watson, D., & Leeka, J. (1989). Diurnal variation in the positive affects.
Motivation and Emotion, 13, 205‐234.
Clarke, S. G. & Haworth, J. (1994). Flow experience in the daily lives of sixth‐form
college students. British Journal of Psychology, 85, 511‐523.
Cohen, J. (1988). Statistical power analysis for the behavioural sciences (2nd Ed.). Hillsdale,
NJ: Lawrence Erlbaum Associates Inc.
Cohen, J., & Cohen, P. (1983). Applied Multiple Regression/Correlation Analysis for the
Behavioural Sciences, 2nd ed. Hillsdale, NJ: Lawrence Erlbaum Associates Inc.
Csikszentmihalyi, M., (1965). Artistic problems and their solution: an exploration of
creativity in the arts. Unpublished doctoral dissertation, University of Chicago.
Csikszentmihalyi, M. (1975). Beyond boredom and anxiety. San Francisco, CA: Jossey‐
Bass.
Csikszentmihalyi, M.(1988). Introduction. In M. Csikszentmihalyi & I. Csikszentmihalyi
(Eds.) Optimal experience: Psychological studies of Flow in consciousness (pp. 3‐
15). New York: Cambridge University Press.
References
175
Csikszentmihalyi, M. (1990). Flow: The Psychology of optimal experience. New York:
Harper & Row.
Csikszentmihalyi, M. (1997). Finding Flow: The psychology of engagement with
everyday life. New York: HarperCollins.
Csikszentmihalyi, M. (2003). Good Business. Leadership, flow and the making of
meaning. London: Coronet Books.
Csikszentmihalyi, M., & Csikszentmihalyi, I. S. (1988). Optimal experience: Psychological
studies of Flow in consciousness. New York: Cambridge University Press.
Csikszentmihalyi, M., & LeFevre, J. (1989). Optimal experience in work and leisure.
Journal of Personality and Social Psychology, 56, 815‐822.
Csikszentmihalyi, M., & Rathunde, K. (1993). The measurement of flow in everyday life:
toward a theory of emergent motivation. Nebraska Symposium on
Motivation, 40, 57‐97.
Csikszentmihalyi, M., Larson, R. W., & Prescott. (1977). The ecology of adolescent
activities and experiences. Journal of Youth Adolescence, 6, 281‐294.
Csikszentmihalyi, M., Rathunde, K., & Whalen, S. (1993). Talented teenagers: The roots
of success and failure. New York: Cambridge University Press.
Cudeck, R., & Browne, M. W. (1993). Alternative ways of assessing model fit. In K.A.
Bollen and J. Scott Long (Eds.), Testing structural equation models (pp. 1‐9).
Newbury Park, CA: Sage.
Deci, E. L. & Ryan, R. M. (1985). Intrinsic motivation and self‐determination in human
behaviour. New York: Plenum Press.
The story flows on: A multi‐study on the flow experience
176
Delespaul, P. A. E. G. (1995). Assessing schizophrenia in daily life: The Experience
Sampling Method. Maastricht, The Netherlands: University Press.
Delespaul, P., Reis, H., & DeVries, M. (2004). Ecological and motivational determinants
of activation: Studying compared to sports and watching TV. Social Indicators
Research, 67, 129‐143.
Delle Fave, A., & Bassi, M. (2000). The quality of experience in adolescents' daily lives:
Developmental perspectives. Genetic, Social, and General Psychology
Monographs, 126(3), 347‐367.
Delle Fave, A., & Massimini, F. (2004). Parenthood and the Quality of Experience in
Daily Life: A Longitudinal Study. Social Indicators Research, 67(1), 75‐106
Delle Fave, A., & Massimini, F. (2005a). The relevance of subjective well‐being to social
policies: optimal experience and tailored intervention. In F. Huppert, N. Baylis
& B. Keverne (Eds.) The science of well‐being (pp. 379‐402). New York, NY, US:
Oxford University Press.
Delle Fave, A., & Massimini, F. (2005b). The Investigation of Optimal Experience and
Apathy: Developmental and Psychosocial Implications. European Psychologist,
10, 264‐274.
Delle Fave, A., Bassi, M., & Massimini, F. (2003). Quality of Experience and Risk
Perception in High‐Altitude Rock Climbing. Journal of Applied Sport Psychology,
15, 82‐98.
Delle Fave, A., Bassi, M., & Massimini, F. (in press). Experiencia optima y evolución
humana. [Optimal experiences and psychological selection]. In C. Vázquez, & G.
References
177
Hervás (Eds.), La Ciencia del bienestar: Fundamentos de una psicología positiva
Madrid: Alianza Editorial.
Demerouti, E. (2006). Job characteristics, flow, and performance: the moderating role
of conscientiousness. Journal of Occupational Health Psychology, 11, 266‐
280.
Demerouti, E., Bakker, A. B., Nachreiner, F., & Schaufeli, W.B. (2001). The Job
Demands‐Resources model of burnout. Journal of Applied Psychology, 86,
499‐512.
Diener, E. (2000). Subjective well‐being, the science of happiness and a proposal for a
national index. American Psychologist, 55, 34‐43.
Diener, E., & Diener, C. (1999). Most people are happy. Psychological Science, 7, 181‐
185.
Eisenberger, R., Jones, J. R., Stinglhamber, F., Shanock, L., & Randall, A. T. (2005). Flow
experiences at work: for high need achievers alone? Journal of Organizational
Behavior, 26, 755‐775.
Ellis, G. D., Voelkl, J. E., & Morris, C. (1994). Measurement and analyses issues with
explanation of variance in daily experience using the flow model. Journal of
Leisure Research, 26, 337‐256.
Feldman, D. C. (2004). What are we talking about when we talk about theory?. Journal
of Management, 30, 565‐567.
Fine, S. F, & Cronshaw, S. A. (1999). Functional job analysis: a foundation for human
resources management. Mahwah, NJ: Lawrence Erlbaum Associates Inc
The story flows on: A multi‐study on the flow experience
178
Finneran, C. M., & Zhang, P. (2003). A person‐artefact‐task (PAT) model of flow
antecedents in computer‐mediated environments. International Journal of
Human‐Computer Studies, 59, 475‐496.
Fried, Y., & Ferris, G. R. (1987). The validity of the job characteristics model: A review
and meta‐analysis. Personnel Psychology, 40, 287‐322.
Ghani, J. A., & Deshpande, S. P. (1994). Task characteristics and the experience of
optimal flow in human‐computer interaction. The Journal of Psychology, 128,
381‐391.
Gold, Y., & Roth, R. (1993). Teaching managing stress and preventing burnout. The
professional health solution. London: The Falmer Press.
Grau, R., Salanova, M., & Peiró, J. M. (2001). Moderating effects of self‐efficacy on
occupational stress. Psychology in Spain, 5, 63‐74.
Griffin, R. (1991). Effects if work redesign on employee perceptions, attitudes and
behaviours. Academy of Management Journal, 34, 425‐435.
Guastello, S. J., Johnson, E. A., & Rieke, M. L. (1999). Nonlinear dynamics of
motivational flow. Nonlinear Dynamics, Psychology, and Life Sciences, 3(3),
259‐273.
Hackman, J. R., & Oldham, G. R. (1980). Work redesign. Reading, MA: Addison Wesley.
Harackiewicz, J. M., & Elliot, A. J. (1998). The joint effects of target and purpose goals
on intrinsic motivation: A mediational analysis. Personality and Social
Psychology Bulletin, 24, 657‐689.
References
179
Haworth, J. T., & Hill, S. (1992). Work, leisure, and psychological well‐being in a sample
of young adults. Journal of Community & Applied Social Psychology, 2, 147‐
160.
Hedman, L., & Sharafi, P. (2004). Early use of internet‐based educational resources:
Effects on students' engagement modes and flow experience. Behaviour &
Information Technology, 23, 137‐146.
Hektner, J., & Csikszentmihalyi, M. (1996). A longitudinal exploration of flow and
intrinsic motivation in adolescents. Paper presented at the annual meeting of
the American Educational Research Association, New York City.
Henson, R. K. (2001). Understanding internal consistency reliability estimates: a
conceptual primer on coefficient alpha. Measurement and Evaluation in
Counseling and Development, 34, 177‐189.
Hobfoll, S. E. (1989). Conservation of Resources: A New Approach at Conceptualizing
Stress. American Psychologist, 44, 513‐524.
Hobfoll, S. E. (2001). The influence of culture, community, and the nested‐self in the
stress process: Advancing conservation of resources theory. Applied
Psychology: An International Review, 50, 337‐421.
Houkes, I., Janssen, P. P, de Jonge, J., & Nijhuis, F. J. (2001). Work and individual
determinants of intrinsic work motivation, emotional exhaustion, and
turnover intention: a multi‐sample analysis. International Journal of Stress
Management, 8, 257‐283.
The story flows on: A multi‐study on the flow experience
180
Hox, J. J. (2002). Multilevel analysis techniques and applications. Manwah, NJ:
Lawrence Erlbaum Associates.
Hoyle, R. H. (1995). The structural equation modeling approach: basic concepts and
fundamental issues. In R. H. Hoyle (Ed.), Structural equation modeling,
concepts, issues, and applications. Thousand Oaks, CA: Sage. Pp. 1‐15.
Huberty, C. J., & Morris, J. D. (1989). Multivariate analysis versus multiple univariate
analyses. Psychological Bulletin, 105, 302‐308.
Jaccard, J., Turrisi, R., & Wan, C. K. (1990). Interaction effects in multiple regression.
Newbury Park, CA: Sage.
Jackson, S. A, & Csikszentmihalyi, M. (1999). Flow in sports: the keys to optimal
experiences and performances. Human Kinetics, Champaign, IL.
Jackson, S. A, & Marsh, H. W. (1996). Development and validation of a scale to
measure optimal experience: The flow state scale. Journal of Sport and Exercise
Psychology, 18, 17‐35.
Jöreskog, K.G., & Sörbom, D. (1986). LISREL user guide version VI (4th Ed.). Mooresville,
Ill: Scientific Software International.
Kahneman, D., Diener, E., & Schwarz, N. (1999). Well‐being: The foundations of
hedonic psychology. New York, NY, US: Russell Sage Foundation.
Koorengevel, K. M., Beersma, D.G.M. , Gordjin, M. C. M., den Boer, J.A., van den
Hoofdakker, R.H. (2000). Body temperature and mood variations during forced
desyncrhonization in winter depression: a preliminary report. Biological
Psychiatry 47, 355–358.
References
181
Korunka, C., & Vitouch, O. (1999). Effects of implementation of information technology
on employees' strain and job satisfaction: A context‐dependent approach.
Work & Stress, 13, 341‐363.
Larsen, R., & Kasimatis, M. (1990). Individual differences in entrainment of mood to
the weekly calendar. Journal of Personality and Social Psychology, 58, 164‐171.
Lazarus, R.S. (2003). Does the Positive Psychology movement have legs?. Psychological
Inquiry, 14, 93‐109.
Le Blanc, P., Bakker, A., Peeters, M., van Heesch, N., & Schaufeli, W. (2001). Emotional
job demands and burnout among oncology care providers. Anxiety, Stress &
Coping: An International Journal, 14, 243‐263.
Llorens, S., Schaufeli, W. B., Bakker, A., & Salanova, M. (2004). Does a positive gain
spiral of resources, efficacy beliefs and engagement exist? Computer in Human
Behavior, 23, 825‐841.
Lutz, R. J., & Guiry, M. (1994). Intense consumption experiences: peaks, performances,
and Flow. Paper presented at the Winter Marketing Educators' Conference, St.
Petersburg, FL.
Marsh, H. W., Balla, J. R., & Hau, K. T. (1996). An evaluation of Incremental Fit Indices:
A clarification of mathematical and empirical properties. In G. A. Marcoulides &
R. E. Schumacker (Eds.), Advanced structural equation modeling, issues and
techniques (pp. 315‐353). Mahwah, NJ: Lawrence Erlbaum Associates
Publishers.
The story flows on: A multi‐study on the flow experience
182
Martínez, I. M., Cifre, E., Llorens, S., & Salanova, M. (2002). Efectos de la tecnología
asistida por ordenador en el bienestar psicológico afectivo. Psicothema, 14(1),
118‐123.
Maslach, C., Schaufeli, W. B., y Leiter, M. P. (2001). Job Burnout. Annual Review of
Psychology, 52, 397‐422.
Maslow, A. (1962). Lessons from the Peak‐experiences. Journal of Humanistic
Psychology, 2, 9‐18.
Massimini, F., & Carli, M. (1988). The systematic assessment of flow in daily
experience. In M. Csikszentmihalyi, & I. S. Csikszentmihalyi, (Eds.) Optimal
experience: Psychological studies of flow in consciousness (pp. 288‐318). New
York, NY, US: Cambridge University Press.
Massimini, F., Csikszentmihalyi, M., & Carli, M. (1987). The monitoring of optimal
experience: A tool for psychiatric rehabilitation. Journal of Nervous and Mental
Disease, 175, 545‐549.
McArdle, J. J. & Bell, R. Q. (2000). An introduction to latent growth models for
developmental data analysis. In T. D. Little, K. W. Schanabel, & J. Baumert (Eds),
Modeling Longitudinal and multilevel data. Practical issues, applied approaches
and specific examples (pp. 69‐107). Mahwah, NJ: Ed. Lawrence Erlbaum
Associates, Inc.
Moneta, G. B. (2004). The flow experience across cultures. Journal of Happiness
Studies, 5, 115‐121.
References
183
Moneta, G. B., & Csikszentmihalyi, M. (1996). The effect of perceived challenges and
skills on the quality of subjective experience. Journal of Personality, 64, 275‐
310.
Murray, G. (2007). Diurnal mood variation in depression: A signal of disturbed
circadian function?. Journal of Affective Disorders, 102(1), 47‐53.
Murray, G., Allen, N., Trinder, J., & Burgess, H. (2002). Is weakened circadian
rhythmicity a characteristic of neuroticism?. Journal of Affective Disorders,
72, 281‐289.
Nakamura, J., & Csikszentmihalyi, M. (2002). The Concept of Flow. In C. R. Snyder, & S.
S. Lopez (eds.), Handbook of Positive Psychology (pp. 89‐105). Oxford: Oxford
University Press.
Novak, T. P., & Hoffman, D. L. (1997). Measuring the flow experience among web
users. Paper Presented at Interval Research Corporation. Retrieved from
http://www2000.ogsm.vanderbilt.edu/research_papers.htm
Novak, T. P., Hoffman, D. L., & Duhachek, A. (2003). The influence of goal‐directed and
experiential activities on online flow experiences. Journal of Consumer
Psychology, 13, 3‐16.
Nunnaly, J. C., & Bernstein, I. H. (1994). Psychometric theory, 3rd ed. New York:
McGraw‐Hill.
O’Brien, G. E. (1983). Skill‐utilization, skill variety and the job characteristics model.
Australian Journal of Psychology, 35, 455‐460.
The story flows on: A multi‐study on the flow experience
184
Oishi, S., Diener, E., Choi, D., Kim‐Prieto, C., & Choi, I. (2007). The dynamics of daily
events and well‐being across cultures: When less is more. Journal of Personality
and Social Psychology, 93, 685‐698.
Olson, G. M., & Olson, J. S. (2003). Human‐computer interaction: Psychological aspects
of the human use of computing. Annual Review of Psychology, 54, 491‐516.
Peters, M. L., Sorbi, M. J., Kruise, D. A., Kerssens, J. J., Verhaak, P. F. M., & Bensing, J.
M. (2000). Electronic diary assessment of pain, disability and psychological
adaptation in patients differing in duration of pain. Pain, 84, 181‐192.
Pitts, S. C., West, S. G., & Tein, J. Y. (1996). Longitudinal measurement models in
evaluation research: Examining stability and change. Evaluation and Program
Planning, 19, 333‐350.
Privette, G., & Bundrick, C. M. (1987). Measurement of experience: construct and
content validity of the Experience Questionnaire. Perceptual and Motor Skills,
65, 315‐332.
Rashbash, J., Browne, W., Healy, M., Cameron, B., & Charlton, C. (2005). MlwiN
(Version 2.02): Interactive software for multilevel analysis. Multilevel Models
Project, Institute of Education, University of London: London.
Rheinberg, F., Manig, Y., Kliegl, R., Engeser, S., & Vollmeyer, R. (2007). Flow bei der
Arbeit, doch Glück in der Freizeit: Zielausrichtung, Flow und Glücksgefühle.
[Flow during work but happiness during leisure time: Goals, flow‐experience,
and happiness]. Zeitschrift für Arbeits und Organisationspsychologie, 51, 105‐
115.
References
185
Rodríguez‐Sánchez, A. M., Cifre, E., & Salanova, M. (2004). Analizando el Flow:
Experiencias óptimas en el uso de Tecnología de la Información y
Comunicación (TIC) en estudiantes [Analyzing Flow: Optimal experiences
using Information and Communication Technology (ICT) in students]. Fòrum
de Recerca. 9. ISSN: 1139‐5486. Facultat de Ciències Humanes i Socials.
Universitat Jaume I.
Rodríguez‐Sánchez, A.M., Cifre, E., Salanova, M. & Åborg, C. (2008). Technoflow among
Spanish and Swedish students: A Confirmatory Factor Multigroup Analysis.
Anales de psicología 24, 42‐48.
Rodríguez‐Sánchez, A. M., Salanova, M., & Cifre, E. (2004). Operationalizing Flow in
professional ICT users. In P. Mondelo, M. Mattilla, W. Karwowski, A. Hale
(Eds.). ORP'2004 Proceedings ‐ 3rd International Conference on Occupational
Risk Prevention. Barcelona: Universitat Politécnica Politècnica de Catalunya.
Rodríguez‐Sánchez, A.M, Salanova, M., Schaufeli, W., y Cifre, E. (2007). Quantifying the
Flow Experience. Paper presented at XIII European Congress of Work and
Organizational Psychology. Stockholm, May.
Rossi, A. S., & Rossi, P. E. (1977). Body time and social time: Mood patterns by
menstrual cycle phase and day of the week. Social Science Research, 6, 273‐
308.
Rusting, C., & Larsen, R. (1998). Diurnal patterns of unpleasant mood: Associations
with neuroticism, depression, and anxiety. Journal of Personality, 66, 85‐103.
The story flows on: A multi‐study on the flow experience
186
Ryan, R., & Deci, E. (2001). On happiness and human potentials: A review of research
on hedonic and eudaimonic well‐being. Annual Review of Psychology, 52, 141‐
166.
Salanova, M. (2003). Trabajando con tecnologías y afrontando el tecnoestrés: El rol de
las creencias de eficacia. Revista de Psicología del Trabajo y de las
Organizaciones, 19, 225‐246.
Salanova, M. (2008). Organizaciones saludables: una aproximación desde la psicología
positiva [Healthy organizations: an approximation from positive psychology]. In
C. Vázquez, & G. Hervás (Eds.), Psicología Positiva: Bases científicas del bienestar
y la resiliencia. Madrid: Alianza Editorial.
Salanova, M., & Schaufeli, W. B. (2000). Exposure to information technology and its
relation to burnout. Behaviour & Information Technology, 19, 385‐392.
Salanova, M., Bakker, A., & Llorens, S. (2006). Flow at Work: Evidence for a Gain Spiral
of Personal and Organizational Resources. Journal of Happiness Studies, 7, 1‐22.
Salanova, M., Cifre, E., & Martín, P. (1999). El proceso de tecnoestrés y estrategias para
su prevención. Prevención, Trabajo y Salud, 1, 18‐28.
Salanova, M., Grau, R., Llorens, S., & Schaufeli, W. B. (2001). Exposición a las
tecnologías de la información, burnout y engagement: el rol modulador de la
autoeficacia profesional. Revista de Psicología Social y Aplicada, 11, 69‐90.
Salanova, M., Llorens, S. & Schaufeli, W.B. (2008). Upward spirals of efficacy beliefs: A
longitudinal and multi‐sample study. Manuscript submitted for publication.
References
187
Salanova, M., Llorens, S., Cifre, E., Martínez, I. M., & Schaufeli, W. B. (2003). Perceived
collective efficacy, subjective well‐being and task performance among
electronic work groups: An experimental study. Small Groups Research, 34, 43‐
73.
Salanova, M., Martínez, I. M., & Llorens, S. (2005a). Psicología Organizacional Positiva
[Positive Organizational Psychology]. In F. Palací (Ed.), Psicología de las
Organizaciones (pp. 349‐376). Madrid: Prentice Hall.
Salanova, M., Schaufeli, W. B., Llorens, S., Peiró, J. M., & Grau, R. (2000). Desde el
‘burnout’ al ‘engagement’: ¿una nueva perspectiva? [From Burnout to
Engagement: A new perspective?]. Revista de Psicología del Trabajo y las
Organizaciones, 16, 117‐134.
Salanova, M., Schaufeli, W.B., Xanthopoulou, D. & Bakker, A. (2009). The gain spiral of
resources and work engagement. In A. Bakker y M. Leiter (Eds.) Work
engagement: Recent developments in theory and research. New York:
Psychology Press.
Salanova, Martínez, I. M., Cifre, E., & Schaufeli, W. B. (2005b). ¿Se pueden vivir
experiencias óptimas en el trabajo? Analizando el flow en contextos laborales
[Can optimal experiences at work be experienced? Analysing flow in laboral
contexts]. Revista de Psicología General y Aplicada, 58, 89‐100.
Schallberger, U., & Pfister, R. (2001). Flow‐Erleben in Arbeit und Freizeit: Eine
Untersuchung zum 'Paradox der Arbeit' mit der Experience Sampling Method
(ESM). Zeitschrift für Arbeits und Organisationspsychologie, 45(4), 176‐187.
The story flows on: A multi‐study on the flow experience
188
Schaufeli, W. B., & Bakker, A. B. (2004). Job demands, job resources and their
relationship with burnout and engagement: A multi‐sample study. Journal of
Organizational Behavior, 25, 293‐315.
Schaufeli, W.B., & Salanova, M. (2008). Enhancing Work Engagement through the
Management of Human Resources, In Näswall, K.; Hellgren J. y Sverke M.
(Eds.), in press.
Schaufeli, W. B., & Van Dierendonck, D. (2000). Utrechtse Burnout Schaal: Handleiding
[Utrecht Burnout Scale: Manual]. Lisse, The Netherlands: Swets Test
Publishers.
Schaufeli, W. B., Bakker, A. B., & Salanova, M. (2006). The measurement of work
engagement with a short questionnaire: A cross‐national study. Educational
and Psychological Measurement, 66, 701‐716.
Schaufeli, W. B., Bakker, A. B., Hoogduin, C. A. L., Schaap, C. P. D. R., & Kladler, A.
(2001). On the clinical validity of the Maslach Burnout Inventory and the
Burnout Measure. Psychology and Health, 16, 565‐582.
Schaufeli, W. B., Leiter, M. P., Maslach, C., & Jackson, S. E. (1996). Maslach Burnout
Inventory ‐ General Survey. In C. Maslach, S. E. Jackson, & M. P. Leiter (Eds.),
The Maslach Burnout Inventory‐Test Manual (3rd ed.). Palo Alto, CA:
Consulting Psychologists Press.
Schaufeli, W. B., Salanova, M., González‐Romá, V., & Bakker, A. (2002). The
measurement of burnout and engagement: a confirmatory factor analytic
approach. Journal of Happiness Studies, 3, 71‐92.
References
189
Schaufeli, W., & van Rhenen, W. (2006). Over de rol van positieve en negatieve
emoties bij het welbevinden van managers: Een studie met de Job‐related
Affective Well‐being Scale (JAWS). Gedrag en Organisatie, 19, 323‐344.
Schaufeli, W.B. & Taris, T.W. (2005). The conceptualization and measurement of
burnout: Common ground and worlds apart. Work & Stress, 19, 356‐262
Schmidt, C., Collette, F., Cajochen, C., & Peigneux, P. (2007). A time to think: Circadian
rhythms in human cognition. Cognitive Neuropsychology, 24, 755‐789.
Schwartz, J., & Stone, A. (1998). Strategies for analyzing ecological momentary
assessment data. Health Psychology, 17, 6‐16.
Schwarzer, R. (1999). General Perceived Self‐efficacy in 14 cultures.
http://www.yorku.ca/faculty/academic/schwarze/worldl4.htm.
Seligman, M.E.P. y Csikszentmihalyi, M. (2000). Positive psychology: an introduction.
American Psychologist, 55, 5‐14.
Sensales, G., & Greenfield, P. M. (1995). Attitudes toward computers, science, and
technology: A cross‐cultural comparison between students in Rome and Los
Angeles. Journal of Cross‐Cultural Psychology, 26, 229‐242.
Sheldon, K. M., & King, L. (2001). Why positive psychology is necessary. American
Psychologist, 56, 216‐217.
Shih, H. (2006). Assessing the effects of self‐efficacy and competence on individual
satisfaction with computer use: An IT student perspective. Computers in Human
Behavior, 22, 1012‐1026.
The story flows on: A multi‐study on the flow experience
190
Shin, N. (2006). Online learner's 'flow' experience: An empirical study. British Journal of
Educational Technology, 37, 705‐720.
Skadberg, Y. X., & Kimmel, J. R. (2004). Visitors' flow experience while browsing a web
site: Its measurement, contributing factors and consequences. Computers in
Human Behavior, 20, 403‐422.
Smith, T. W. (1979). Happiness: Time trends, seasonal variations, intersurvey
differences, and other mysteries. Social Psychology Quarterly, 42, 18‐30.
Sonnenschein, M., Sorbi, M. J., Van Doornen, L. J. F., & Maas, C. J. (2006). Feasibility of
an electronic diary in clinical burnout. International Journal of Behavioral
Medicine, 13, 315‐319.
Sonnenschein, M., Sorbi, M., van Doornen, L., Schaufeli, W., & Maas, C. (2007).
Electronic diary evidence on energy erosion in clinical burnout. Journal of
Occupational Health Psychology, 12, 402‐413.
Sonnentag, S. (2001). Work, recovery activities, and individual well‐being: A diary
study. Journal of Occupational Health Psychology, 6, 196‐210.
Stone, A. A., & Shiffman, S. (2002). Capturing momentary, self‐report data: a proposal
for reporting guidelines. Annals of Behavioral Medicine: a Publication of the
Society of Behavioral Medicine, 24, 236‐243.
Stone, A. A., Hedges, S. M., Neale, J. M., & Satin, M. S. (1985). Prospective and cross‐
sectional mood reports offer no evidence of a "Blue Monday" phenomenon.
Journal of Personality and Social Psychology, 49, 129‐134.
References
191
Stone, A., Broderick, J., Shiffman, S., & Schwartz, J. (2004). Understanding recall of
weekly pain from a momentary assessment perspective: Absolute agreement,
between‐ and within‐person consistency, and judged change in weekly pain.
Pain, 107, 61‐69.
Tierney, P., & Farmer, S. M. (2002). Creative self‐efficacy: Its potential antecedents and
relationship to creative performance. Academy of Management Journal, 45,
1137‐1148.
Towell, E. R., & Lauer, J. (2001). Personality differences and computer related stress in
business students. Mid‐American Journal of Business, 16, 69‐75.
Trevino, L. K., & Webster, J. (1992). Flow in computer‐mediated communication,
Communication Research, 19, 539‐573.
Webster, J., Trevino, L. K., & Ryan, L. (1993). The dimensionality and correlates of flow
in human‐computer interactions. Computers in Human Behavior, 9, 411‐426.
Wigfield, A., & Eccles, J. S. (2001). The development of competence beliefs,
expectancies for success, and achievement values from childhood through
adolescence. In A. Wigfield & J. S. Eccles (Eds.), Development of achievement
motivation (pp. 91‐120). San Diego, CA: Academic Press.
Zautra, A. J., Affleck, G. G., Davis, M. C., Tennen, H., & Fasman, R. (2007). Assessing the
ebb and flow of daily life with an accent on the positive. In A. D. Ong, & M. H.
M. van Dulmen (Eds.), Oxford handbook of methods in positive psychology. (pp.
487‐500). New York, NY, US: Oxford University Press

The story flows on: A multi‐study on the flow experience
192
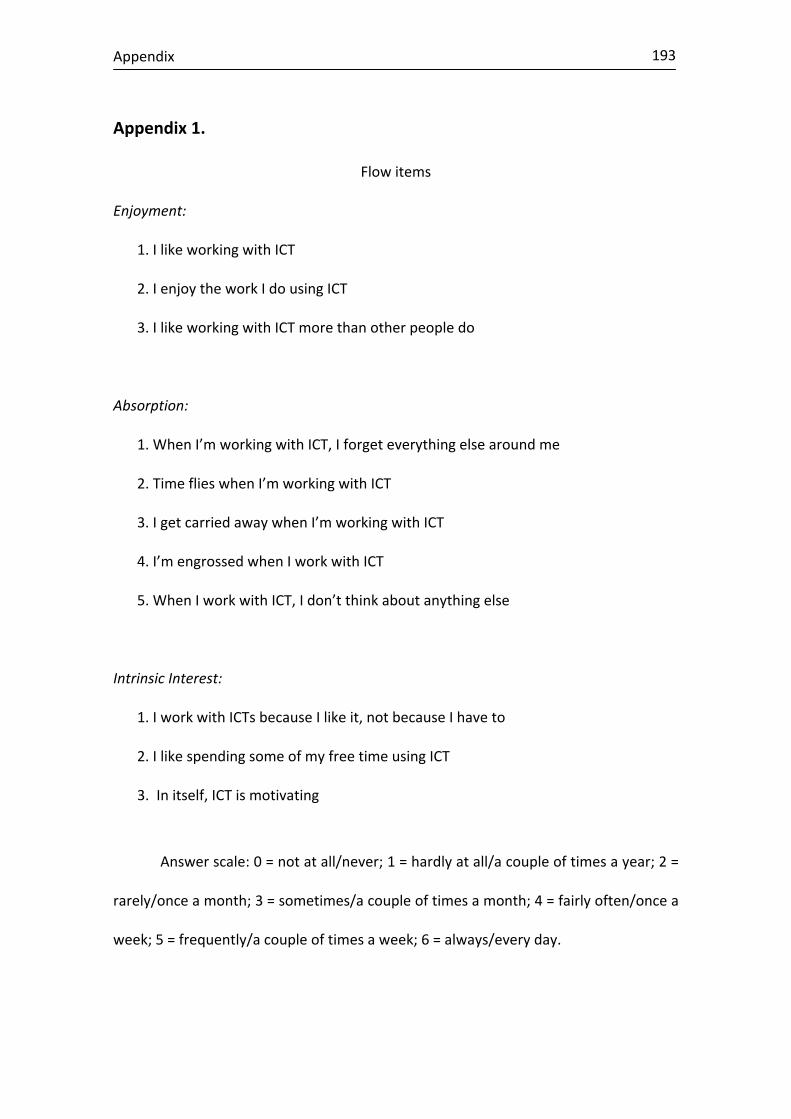
Appendix
193
Appendix 1.
Flow items
Enjoyment:
1. I like working with ICT
2. I enjoy the work I do using ICT
3. I like working with ICT more than other people do
Absorption:
1. When I’m working with ICT, I forget everything else around me
2. Time flies when I’m working with ICT
3. I get carried away when I’m working with ICT
4. I’m engrossed when I work with ICT
5. When I work with ICT, I don’t think about anything else
Intrinsic Interest:
1. I work with ICTs because I like it, not because I have to
2. I like spending some of my free time using ICT
3. In itself, ICT is motivating
Answer scale: 0 = not at all/never; 1 = hardly at all/a couple of times a year; 2 =
rarely/once a month; 3 = sometimes/a couple of times a month; 4 = fairly often/once a
week; 5 = frequently/a couple of times a week; 6 = always/every day.

The story flows on: A multi‐study on the flow experience
194
Resumen (Summary in Spanish)
195
Resumen (Summary in Spanish)
Esta tesis doctoral se enmarca en el contexto de la Psicología Positiva. La
Psicología Positiva no es más que el estudio científico de las fortalezas y el óptimo
funcionamiento humano (Seligman & Csikszentmihalyi, 2000). Este enfoque
complementa el tradicional estudio únicamente en la enfermedad, daños y problemas
a los que está acostumbrado el estudio de la Psicología en general, y también así en el
estudio de la Psicología del trabajo. Por lo tanto el estudio de la experiencia de flow se
está convirtiendo en un tema de especial relevancia hoy en día, debido a este deseo de
mejorar la calidad de vida en distintos contextos (ej., trabajo, estudio, tiempo libre,
etc.). Aunque la mayoría de los estudios sobre flow se han centrado en flow en el
deporte, en actividades artísticas y en el tiempo libre (Jackson & Marsh, 1996), existe
poca evidencia empírica sobre flow en contextos laborales. Así pues, el objetivo
general de dicha tesis ha sido profundizar en el conocimiento de la experiencia de flow
en el trabajo (diferentes tipos de trabajo y trabajo con tecnologías) y también en el
estudio (considerando también el estudio como trabajo). Concretamente, el objetivo
ha sido describir, operacionalizar, explorar la dinámica y estudiar los antecedentes de
la experiencia de flow en distintos contextos de trabajo (ej. trabajadores de cerámica,
trabajadores usuarios de TICs, muestra heterogénea de trabajadores holandeses), de
estudio (estudiantes universitarios, profesores de educación secundaria) y en distintos
países (España, Holanda y Suecia) con el objetivo de extender un modelo existente de
flow. Además, para llevar a cabo este objetivo se han utilizado diferentes métodos y
The story flows on: A multi‐study on the flow experience
196
diseños (ej., estudios cross‐seccionales, longitudinales, método de muestreo de
experiencias /estudio de diario) en los 5 estudios que componen esta tesis.
Principales resultados obtenidos
Los principales resultados obtenidos en esta tesis van en consonancia con los
objetivos centrales de la misma y que pueden ser resumidos en tres puntos: (1)
Encontrar una clara y práctica operacionalización de la experiencia de flow que
extienda y vaya más allá del tradicional Modelo de Canal (Csikszentmihalyi, 1990,
1997, 2003), (2) Explorar y medir los patrones diarios de flow y (3) Explorar los
antecedentes de la experiencia de flow.
Operacionalizando la experiencia de flow
Una de las dificultades encontradas en el estudio de la experiencia de flow es
la complejidad de la experiencia de flow en sí misma, dicha complejidad hace aún más
difícil la medida y operacionalización de este fenómeno. Así, en la literatura
encontramos a menudo una confusión entre la experiencia de flow y sus antecedentes
inmediatos. Por ejemplo es muy común que la experiencia de flow se operacionalice
como producto de altos retos y altas competencias o habilidades (ej., Csikszentmihalyi
& Lefevre, 1989) según el Modelo de Canal (Csikszentmihalyi, 1990, 1997, 2003). La
misma medida ha sido utilizada por la inmensa mayoría de estudios realizados sobre
flow en el trabajo (Ej. Eisenberger, Jones, Stinglhamber, Shanock, & Randall, 2005). Sin
embargo en esta tesis se ha validado una medida alternativa basada en una revisión
previa de los elementos comunes de las definiciones de flow encontradas en la
literatura (ej., Chen, 2006; Novak, & Hoffman, 1997), y en estudios recientes (Bakker,
2005; Demerouti, 2006; Salanova, Bakker, & Llorens, 2007) que comenzaron a utilizar
una operacionalización diferente de flow en el trabajo más allá de sus prerrequisitos
Resumen (Summary in Spanish)
197
(reto y competencia). Con el objetivo de describir y operacionalizar la experiencia de
flow más allá del tradicional Modelo de Canal (Csikszentmihalyi, 1990, 1997, 2003) en
el Capítulo 2 se puso a prueba nuestra operacionalización alternativa de flow,
compuesta por tres componentes (absorción, disfrute e interés intrínseco), en
combinación con el tradicional Modelo de Canal. Los resultados aportaron la primera
evidencia empírica de que nuestra operacionalización (absorción, disfrute e interés
intrínseco) complementaba y extendía el modelo tradicional de flow, no sólo
considerando únicamente la combinación de reto y competencia, sino midiendo la
experiencia de flow.
El siguiente paso hacia la operacionalización de la experiencia de flow fue la
validación y el estudio en profundidad de la estructura de la experiencia de flow.
Concretamente en el Capítulo 3 se puso a prueba un modelo tri‐factorial de flow
(absorción, disfrute e interés intrínseco) en una muestra de trabajadores y otra de
estudiantes que utilizaban tecnología en las labores cotidianas de su trabajo y estudio.
Este análisis factorial confirmatorio multigrupo confirmó la robustez del modelo de
tres factores. Sin embargo, con el objetivo de profundizar en el ‘corazón’ de la
experiencia de flow, y barajando la posibilidad teórica de que el factor interés
intrínseco fuera un prerrequisito más que parte de la misma experiencia de flow, se
procedió a seguir explorando la estructura de flow en otras muestras. Así en el
Capítulo 4 comparamos dos modelos competitivos de flow: el modelo tri‐factorial
(absorción, disfrute e interés intrínseco) y el nuevo modelo bi‐factorial (absorción y
disfrute) utilizando para ello dos muestras de estudiantes usuarios de tecnologías
(suecos y españoles). Los resultados obtenidos revelaron que el modelo de dos
The story flows on: A multi‐study on the flow experience
198
factores mostraba un mejor ajuste que el de tres factores, confirmando así que el
interés intrínseco no era parte del ‘corazón’ de la experiencia de flow.
Patrones diarios de la experiencia de flow
El siguiente paso en el estudio de la experiencia de flow fue explorar estas dos
dimensiones corazón del flow (absorción y disfrute) y estudiar sus patrones diarios en
relación con el trabajo y también fuera del mismo. Para ello se utilizó en el Capítulo 5
el Método de Muestreo de Experiencias (Experience Sampling Method, o ESM,
Csikszentmihalyi, Larson, & Prescott, 1977; Csikszentmihalyi & Larson, 1987) o también
conocido como estudio de diario. Esta novedosa metodología permitió conocer el
funcionamiento de los patrones diarios de la experiencia de flow en una muestra de
trabajadores holandeses sanos y otra muestra de trabajadores holandeses con
burnout. Los principales resultados obtenidos en este estudio fueron (1) el patrón
diario encontrado de los dos componentes de flow (absorción y disfrute) en forma de
U (mayores niveles de flow durante la mañana y durante la tarde a partir de las 5), (2)
las diferencias significativas en la frecuencia e intensidad de la experiencia de flow
entre las dos muestras (los trabajadores sanos mayores niveles de flow que los
empleados con burnout) y (3) el papel diferenciado que juegan la absorción y el
disfrute en relación con las actividades laborales. Concretamente, el disfrute
presentaba unos valores medios más altos al realizar tareas no laborales, mientras que
la absorción era mayor en tareas relacionadas con el trabajo. Estos resultados van en la
línea de la llamada ‘paradoja del trabajo’ (Csikszentmihalyi & LeFevre, 1989) que se
refiere a por qué en el trabajo se da mayor número de experiencias de flow que en el
ocio, pero sin embargo el ocio es preferido al trabajo. Es decir, las personas tienden a a
Resumen (Summary in Spanish)
199
experimentar más flow en el trabajo que en su tiempo libre, aunque ellos afirman que
‘les gustaría estar haciendo otra cosa’ cuando ellos están en el trabajo. Esto se puede
explicar debido a la naturaleza ‘obligatoria’ que presenta el trabajo, éste requiere un
esfuerzo tal y como se define trabajo en el Manual de Psicología del Trabajo y las
Organizaciones (Handbook of Industrial, Work and Organizational Psychology) (pág. 1,
2001). Así pues el trabajo es retador pero requiere un esfuerzo y la utilización de
nuestras habilidades al máximo normalmente para llevarlo a cabo. Sin embargo las
personas solemos necesitar del ocio y tiempo libre para disminuir esas demandas y
realizar menos esfuerzos y así recuperarnos del trabajo. Además, socialmente
hablando, las personas no esperamos disfrutar del trabajo. Los resultados encontrados
en el Capítulo 5 explicarían de este modo esta asunción, ya que el disfrute está más
relacionado con las tareas de ocio, y por el contrario la absorción (más ligada a la
concentración necesaria para llevar a cabo tareas retadoras) está relacionada con
actividades laborales. Estos resultados aunque revelan importantes datos, también nos
llevan a realizarnos nuevas preguntas acerca de cuál es la estructura corazón del flow y
sobretodo lo susceptible que es de la medida empleada. En relación a esto, en esta
tesis también se discuten los resultados obtenidos en función del tipo de diseño
empleado: cuestionarios (medida retrospectiva) vs. estudios de diario (medida on‐
line).
Antecedentes de la experiencia de flow: Extendiendo el Modelo de Canal
Uno de los intereses y objetivos principales de esta tesis ha sido el
conocimiento de aquellos factores que faciliten la ocurrencia de la experiencia de flow.
En la literatura existen algunas confusiones entre lo que es la experiencia de flow y sus
condiciones previas como es la combinación de retos y competencias. No obstante, la
The story flows on: A multi‐study on the flow experience
200
respuesta sobre qué es lo que facilita la ocurrencia de la experiencia de flow en el
trabajo sólo está respondida parcialmente en la literatura, esto es a través de alto reto
y alta competencia. Pero ¿qué es lo que hace que una persona perciba una actividad
como retadora y si esta persona tiene las habilidades suficientes para realizarla? Según
los resultados encontrados en el Capítulo 6, la respuesta reside en las creencias que
tiene una persona en las capacidades que posee para desempeñar una actividad. Esto
sería la autoeficacia. Así pues, en esta tesis se ha avanzado en el conocimiento de uno
de los antecedentes necesarios para experimentar flow como es la autoeficacia.
Concretamente, en el capítulo 6 se ha puesto a prueba una extensión del Modelo de
Canal (Csikszentmihalyi, 1990, 1997, 2003) – basado en la combinación de reto y
competencia como antecedentes del flow – incluyendo la autoeficacia como una
variable predictora adicional a la combinación de reto y competencia. Para ello se
utilizó un estudio longitudinal en una muestra de profesores de enseñanza secundaria.
Los resultados mostraron evidencia empírica del papel predictor que desempeña la
autoeficacia en la experiencia de flow (absorción y disfrute) más allá de la tradicional
combinación de reto y competencia. Además los resultados del Capítulo 6
proporcionan también evidencias a nivel conceptual de la relación existente entre el
Model de Canal de flow de Csikszentmihalyi (1990, 1997, 2003) y la Teoría Social
Cognitiva de Bandura (SCT, Bandura, 2001), lo que resulta en un modelo más completo
y complementario que explica la experiencia de flow así como sus antecedentes.
En resumen, 5 estudios empíricos con distintas muestras de trabajadores y
estudiantes, de tres países distintos y con diferentes diseños metodológicos han
probado la evidencia empírica de una medida práctica y aplicable de la experiencia de
flow en el trabajo, explorando además los patrones diarios y los antecedentes

Resumen (Summary in Spanish)
201
necesarios para que se pueda dar este fenómeno tan escurridizo de medir pero tan
fácilmente identificable por todos, ya que todo el mundo en alguna ocasión hemos
experimentado flow en nuestro trabajo. Ahora sólo queda seguir investigando y poder
aplicar los conocimientos revelados en esta tesis para poder crear puestos de trabajo
que faciliten la experiencia de flow y así crear lugares de trabajo cada vez más
saludables.

The story flows on: A multi‐study on the flow experience
202
Curriculum Vitae
203
Curriculum Vitae
Alma M. Rodríguez‐Sánchez was born on June 27th, 1980 in Castellón, Spain. In 1998
she started studying Psychology at Universitat Jaume I of Castellón. She graduated in
2003 at the same time she was doing a Human Resources Master and starting the PhD
studies on Work and Organisational Psychology (Inter‐university program awarded a
quality mention by the Spanish Ministry of Science and Education) at Universitat
Jaume I. She obtained several research grants collaborating with the WoNT Research
Team from the same University until in 2005 she gained a position as Assistant
Researcher at WoNT Team in the Department of Social Psychology at Universitat
Jaume I. Since then she is involved in several research projects and also teaching at the
same University. Her PhD thesis focuses on flow experience at work. Her research
interests are related to Positive Occupational Health Psychology (flow at work,
resilience, well‐being, self‐efficacy, assertiveness at work...etc), and also the effects of
information and communication technology at work. Her publications mainly deal with
positive psychology and flow at work.