Embed Size (px)
Citation preview

ACTIVITY: Detention Example for HEC-1 & HEC-HMS ST – 12
Knoxville BMP Manual www.knoxvilletn.gov/engineering/
Stormwater Treatment ST-12 - 1 May 2003
Description The purpose of this stormwater treatment BMP is to give a basic example of how to use
the HEC-1 and HEC-HMS hydrograph programs in detention basin routing and design.
The potential user of this BMP is expected to be thoroughly familiar with the TR-55
publication “Urban Hydrology for Small Watersheds” (reference 175) and also the theory
and practical application of detention routing. The detention example for this BMP is the
same one as used in ST-11 (Detention Example for Spreadsheet).
Approach
A brief description of detention requirements and NRCS methods are given in ST-10,
Detention Computations. All hydrologic and hydraulic computations for stormwater
detention facilities must be prepared and stamped by a registered engineer (licensed in the
state of Tennessee) who is proficient in this field. Plans must show sufficient information
to allow the builder to construct the detention structure correctly, and to verify that the
detention facility operates as required.
In Section 22.5-33 of the Knoxville Stormwater and Street Ordinance, hydrologic and
hydraulic computations are required to be in accordance with National Resources
Conservation Service (NRCS) methods. The NRCS Unit Hydrograph shall be used with
average antecedent moisture conditions (AMC II) and Type II rainfall distribution, as
specified by Technical Release 55 (TR-55) publication from June 1986. The TR-55
publication (“Urban Hydrology for Small Watersheds”, reference 175) can be
downloaded at:
http://www.wcc.nrcs.usda.gov/hydro/hydro-tools-models-tr55.html
NRCS Computational Software
A brief description of common hydrograph and detention routing software is given in ST-
10, Detention Computations. This BMP represents one option available to the stormwater
designer. Both HEC-1 and HEC-HMS are freely available software programs that can be
downloaded from the U.S. Army Corps of Engineers website. These programs can
generate hydrographs using several methods and also perform detention storage routing.
The program user generates the elevation-discharge-volume (E-Q-V) curves by manually
computing and analyzing each type of outlet device (by hand or with a spreadsheet)
separately prior to combining the results as input data for the hydrograph routing
program.
Software computations submitted for review to the City of Knoxville must include all of
the necessary input data to reproduce the detention design, including details as needed to
illustrate the outlet structure. Computations should be organized and neatly printed on
standard 8.5” x 11” paper so that the results are easily referenced and located. The
Knoxville Engineering Department may require verification of software programs that are
unproved or not well-known in the Knoxville area.
KK SUB01 Area 1 – Office
BA.00234
………(PH or PC cards)
LS 0 90
UD 0.067
KK RT01 Route through c
RS 1 ELEV 955
SA 0.000 0.005 0.012
SE 955 956 957
SQ 0.00 0.80 1.29
HEC
-1
ACTIVITY: Detention Example for HEC-1 & HEC-HMS ST – 12
Knoxville BMP Manual
Stormwater Treatment ST-12 - 2 May 2003
Overview of
HEC-1
Software
Introduction
HEC-1 is a commonly-used hydrograph program originally developed by the U.S. Army
Corps of Engineers (USACE) over 30 years ago, and adapted to personal computers in the
mid-1980s. The HEC-1 program and the associated HEC-1 user’s manual can be
downloaded from the USACE website at:
http://www.hec.usace.army.mil/software/legacysoftware/hec1/hec1.htm
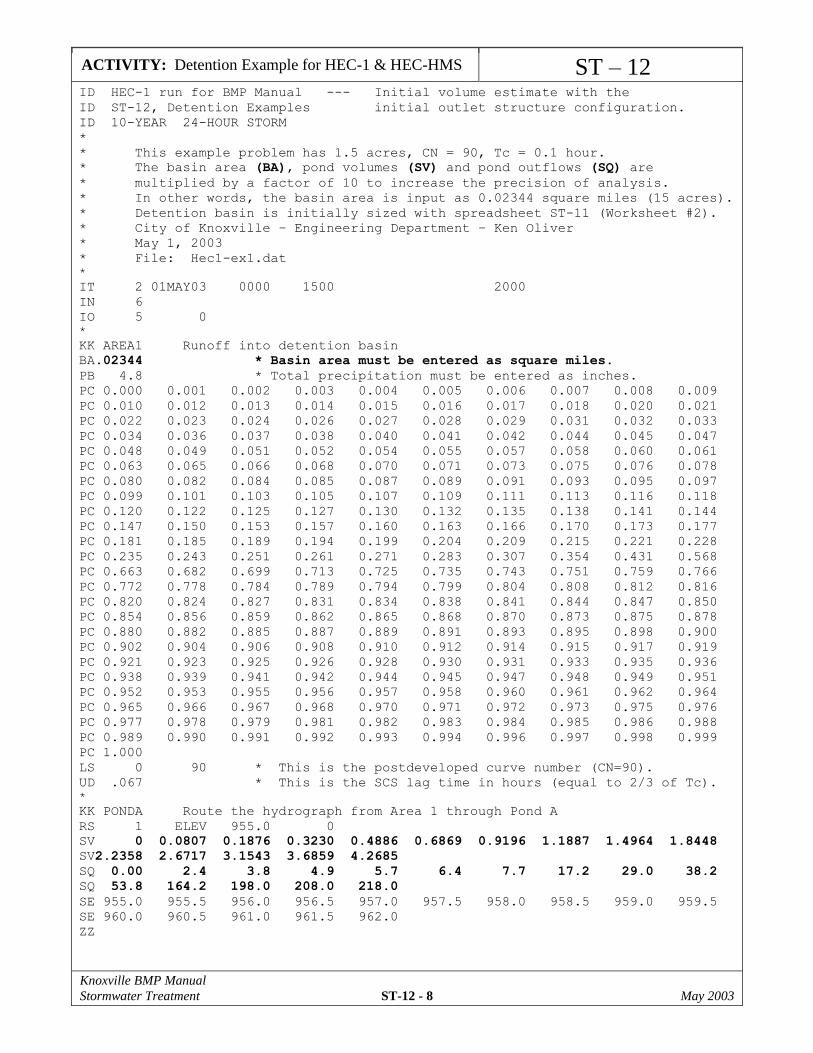
HEC-1 is a DOS-based program for which the user prepares an input data file prior to
running the program. Each line of the HEC-1 input file is called a “card” (from days
when computers used punched cards). See the example input file on page ST-12-8. The
first two letters of each line (columns 1-2) designate the type of data shown on that line.
The example input file on page ST-12-6 uses the following 16 types of cards:
ID = project identification, * = comments, IT = time specification
IN = input data interval, IO = output control, KK = location identifier,
BA = basin area, PB = basin total precipitation,
PC = cumulative precipitation, RS = storage routing, LS = loss rate,
UD = unit dimensionless hydrograph, SQ = discharge data,
SV = storage volume data, SE = elevation data, ZZ = end of run
Appendix A of the HEC-1 User’s Manual provides a complete description for the data
fields. It is recommended that the HEC-1 user should print the input card description for
each type of input card used. Each line contains up to 10 data fields with a maximum line
length of 80 spaces or columns. The data fields are in a “fixed-format” unless otherwise
specified by a *FREE card. The data fields each contain 8 spaces, except for the first
data field which only has 6 spaces (columns 3-8). Numbers should be right-justified
within each 8-space field and/or contain a decimal point.
The NRCS Type II rainfall distribution is entered on PC or PI cards; the example on page
ST-12-8 is shown using cumulative rainfall fractions (PC cards) at intervals of 0.1 hours.
Do not use PH cards to specify the intensity-duration-frequency curve, as this rainfall
pattern does not match the NRCS Type II rainfall distribution.
Postdeveloped watershed input parameters (area, curve number, time of concentration)
are entered on the BA, LS and UD cards. The basin area is entered as square miles on the
first field of the BA card. The curve number is entered on the second field of LS card.
Instead of the time of concentration, the lag time (in hours) is entered on the first field of
the UD card, with the lag time equal to 2/3 of Tc.
The overall elevation-discharge-volume (E-Q-V) relationship is entered on matching
fields of the cards labeled SE, SQ, and SV. The units for the E-Q-V curve are: feet
elevation (SE), cubic feet per second (SQ), and acre-feet (SV). The following pages show
an example of HEC-1 input file (for iteration #1 of the detention basin design *) and
HEC-1 output file (for iteration #2 of the detention basin design **):
Pages Contents of HEC-1 file File name .
ST-12-8 * Initial detention estimate HEC1-ex1.dat
ST-12-9 to ST-12-11 ** Final detention computation output HEC1-ex2.out
* Initial detention estimate corresponds to the example spreadsheet in ST-11.
** Final detention computation using the revised outlet configuration in ST-11.
HEC-1
input
“cards”
Worksheet #2
from ST-11 is
highly
recommended as
a starting point
for storage
volume estimates
ACTIVITY: Detention Example for HEC-1 & HEC-HMS ST – 12
Knoxville BMP Manual
Stormwater Treatment ST-12 - 3 May 2003
To improve the output precision of a HEC-1 run by a decimal point, perform these simple
modifications:
Multiply the basin area (BA card) by a factor of 10.
Multiply either the pond areas or pond volumes (SA or SV cards) by a factor of 10.
Multiply the pond outflows (SQ cards) by a factor of 10.
The example HEC-1 input file on page ST-12-8 includes the three modifications listed
above (shown in bold print), using SV cards rather than SA cards. After running the
HEC-1 file, the peak inflow and outflow values should be divided by 10 to determine the
actual output values.
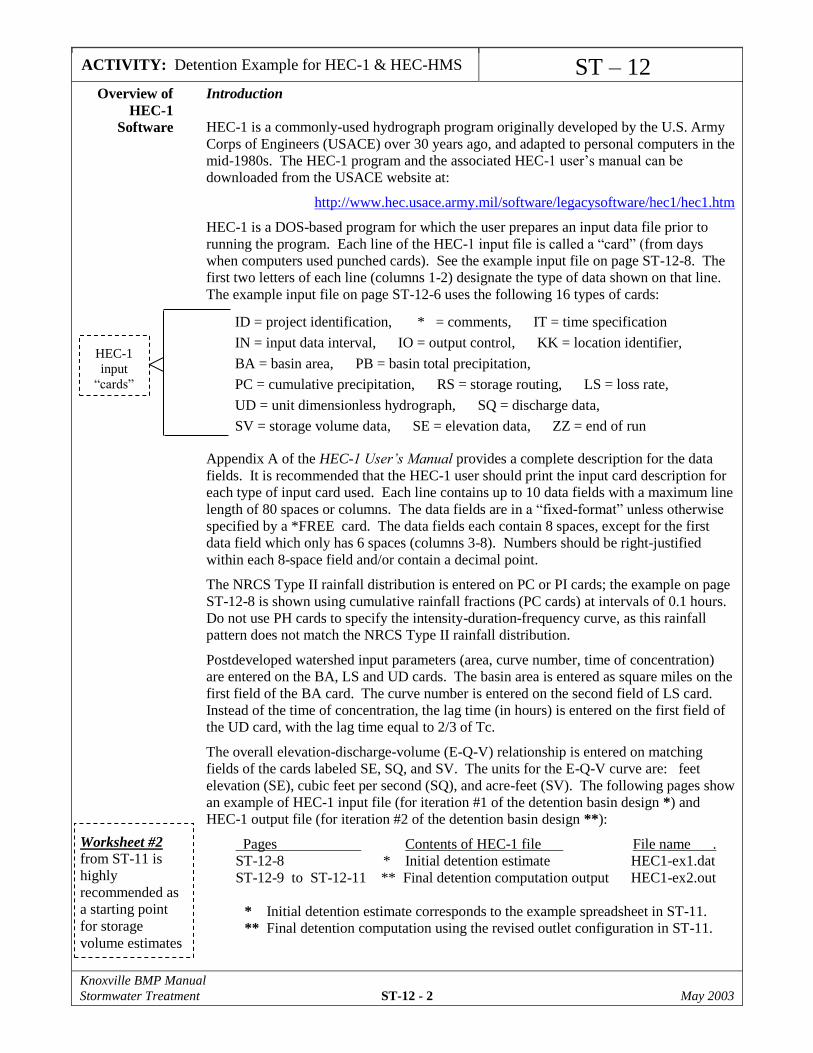
Hints for
Using HEC-1
Example File
After downloading and installing the HEC-1 program, it will run by clicking on
the file HEC-1.EXE. As part of the HEC-1 program, a screen will pop up to ask
for the input filename, the output filename, and an optional DSS filename (which
is not needed). The input file needs to be in the same subdirectory as the HEC-1
program.
The input data files for the initial design configuration (hec1-ex1.dat) and for the
final outlet structure configuration (hec1-ex2.dat) are included in this BMP. The
input data file can be easily edited using any type of ASCII text editor (such as
Notepad). Align input data into the correct columns.
The following cards each only need one value changed: BA, PB, LS, UD, RS.
BA is the basin area in square miles, PB is the 24-hour rainfall in inches, LS is the
postdeveloped curve number, UD is the time of concentration multiplied by 0.67,
and RS is the starting water surface elevation of the analysis.
The following cards need to be recomputed and revised whenever the detention
basin volumes and/or outlet structure configuration are changed: SE, SQ, SV. A
new E-Q-V curve can be computed by hand or by spreadsheet. Provide a
sufficient number of values to accurately reflect the storage and discharge curves.
The HEC-1 output data is formatted by the program for the wide green computer
paper commonly used 30 years ago. To print onto 8.5” x 11” paper, shrink all of
the output text to Courier New, font size 8, with 0.25” margins all around the
page. Or print the results using paper with a landscape orientation.

ACTIVITY: Detention Example for HEC-1 & HEC-HMS ST – 12
Knoxville BMP Manual
Stormwater Treatment ST-12 - 4 May 2003
Overview of
HEC-HMS
Software
Introduction
The HEC-HMS is a windows-based hydrograph program developed by the U.S. Army
Corps of Engineers (USACE) to succeed HEC-1. The HEC-HMS software program and
associated manuals can be downloaded from the USACE website at:
http://www.hec.usace.army.mil/software/software.html
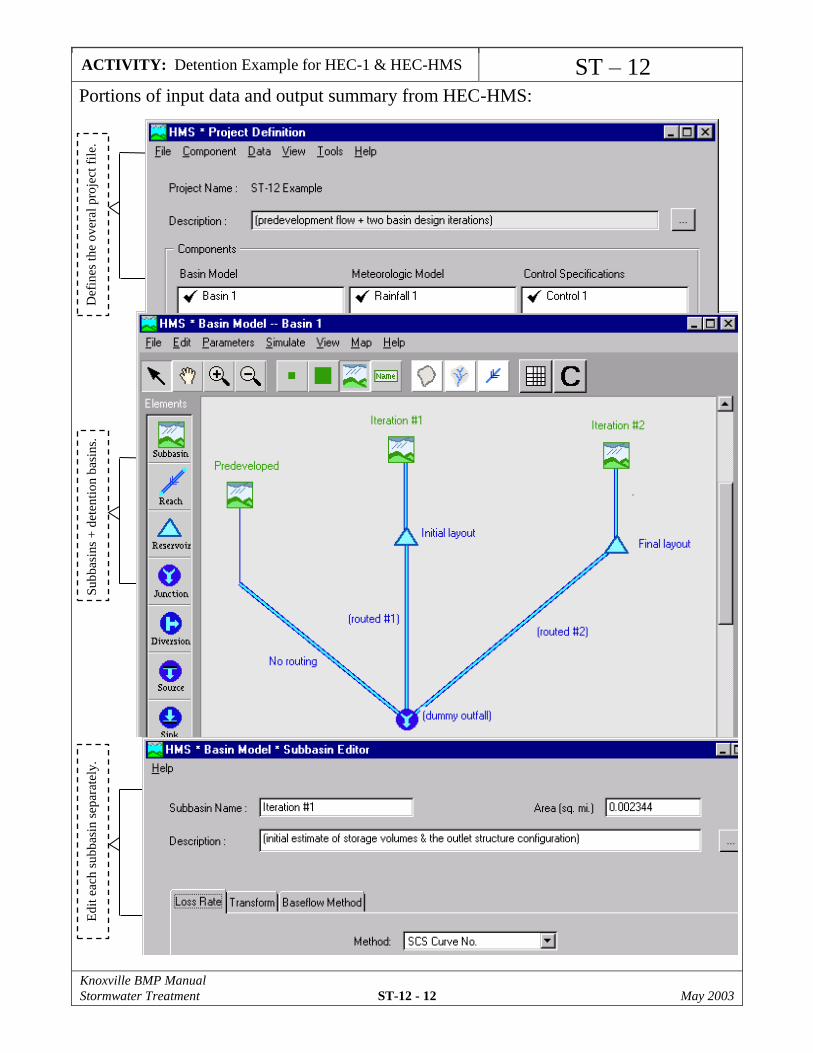
Within the HEC-HMS program, the user creates three different types of components for
each modeling run:
Basin: size, precipitation loss functions, routing parameters, routing lengths
and channels, baseflow, reservoirs.
Meteorological: precipitation gages, rainfall distributions, storm events.
Control: duration of analysis, time intervals, computational increment.
Different basin configurations and outlet structures can be tested by mixing and matching
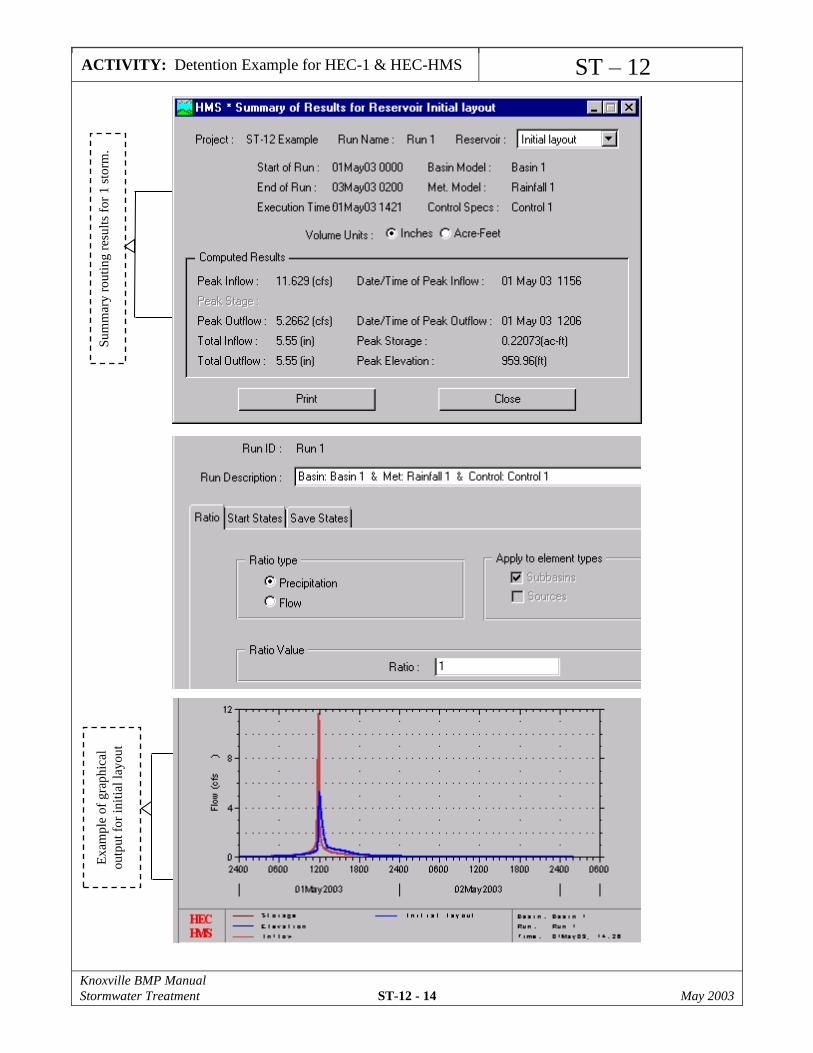
different components for a modeling run. After each modeling run, the routing results
can be displayed by selecting each element from the basin schematic and choosing “View
Results” from the menu. Graphical output and/or a global summary sheet can also be
viewed. The HEC-HMS program can import HEC-1 input files, which can be helpful in
preparing reports and graphs.
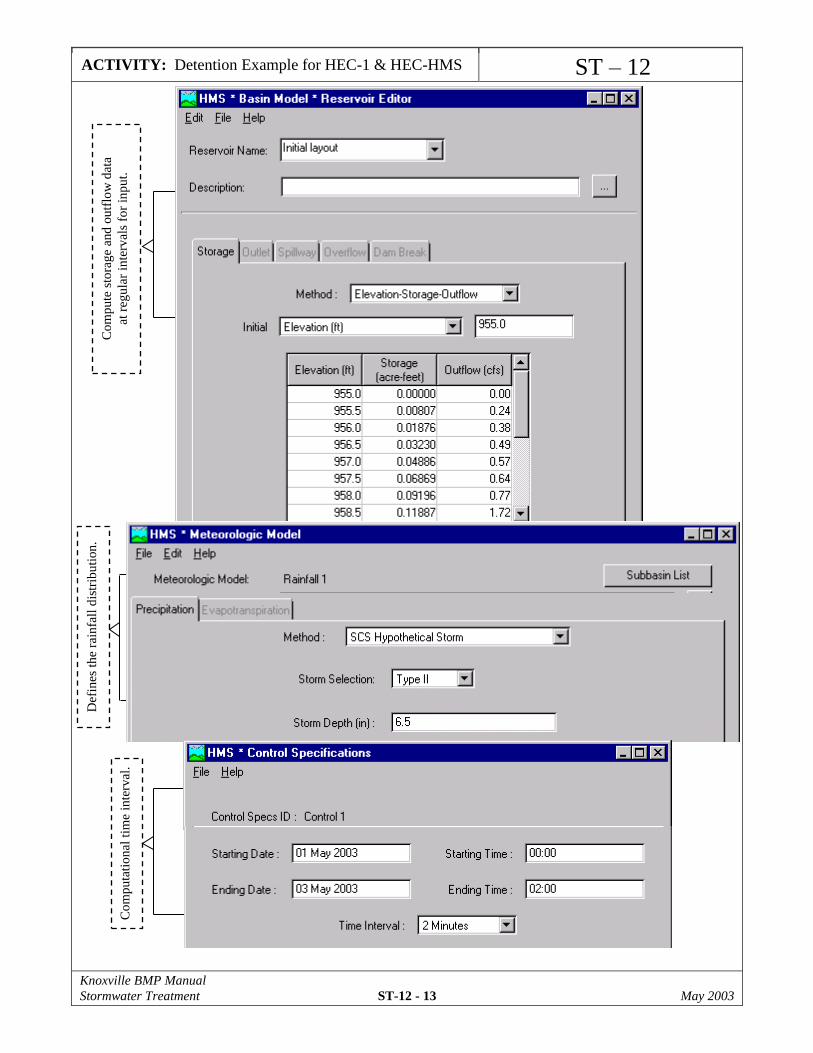
The current version of HEC-HMS will only allow the user to directly input one orifice
and one weir. For structures with more than one orifice, the user will have to compute the
elevation-storage-discharge data separately (by hand or by spreadsheet) prior to entering
the input data.
The HEC-HMS data interface can be confusing. For instance, sometimes it is not obvious
how to edit existing data files for the various components. For most screens, select the
file with the cursor and then choose “Edit” from the pulldown menu.
The HEC-HMS program is much more complicated than the HEC-1 program and will
require a longer learning curve to use effectively. For most engineers, it will take some
patience to learn how to use the HEC-HMS model. Read and review the available
training documents (Users Manual, Technical Reference Manual) while practicing with
the data sets provided by the U.S. Army Corps of Engineers.
The NRCS Type II rainfall distribution can be typed into the precipitation gage data fields
once, and then used over and over again for different projects by transfering gage data
into new project files as needed. The rainfall distribution can be adjusted on each model
run by choosing “Run Options” and then selecting a precipitation ratio.
Other Hints
for Using
HEC-HMS
Software
The program user must save each component as it is being edited, and also must
save the project file prior to exiting the HEC-HMS program.
The component with meteorological data, once it has been edited correctly, can be
used and reused for all project files. The total rainfall amount can be adjusted on
each model run by selecting “Run Options” from the Run Manager screen.
Each iteration (predeveloped & postdeveloped) can be run within the same basin
model (shown on page ST-12-12) by placing the design elements in parallel
alignment, reducing the number of basin files and components needed.
HEC-HMS
components
ACTIVITY: Detention Example for HEC-1 & HEC-HMS ST – 12
Knoxville BMP Manual
Stormwater Treatment ST-12 - 5 May 2003
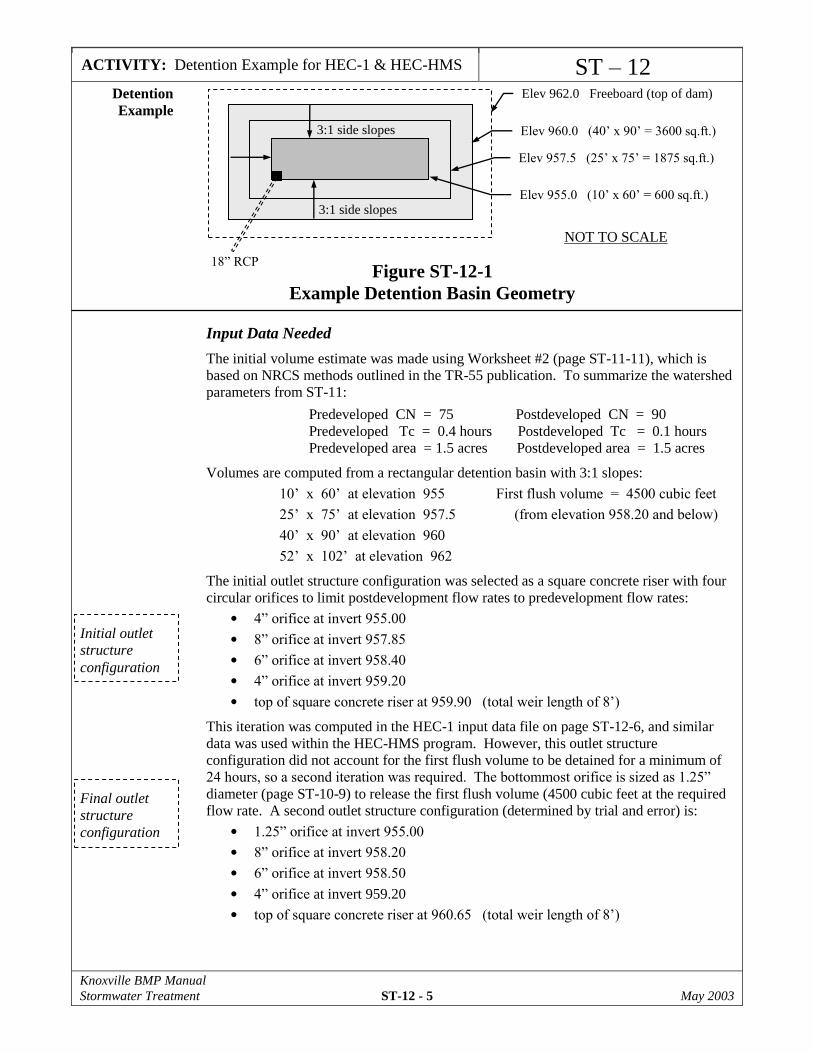
Detention
Example
Input Data Needed
The initial volume estimate was made using Worksheet #2 (page ST-11-11), which is
based on NRCS methods outlined in the TR-55 publication. To summarize the watershed
parameters from ST-11:
Predeveloped CN = 75 Postdeveloped CN = 90
Predeveloped Tc = 0.4 hours Postdeveloped Tc = 0.1 hours
Predeveloped area = 1.5 acres Postdeveloped area = 1.5 acres
Volumes are computed from a rectangular detention basin with 3:1 slopes:
10’ x 60’ at elevation 955 First flush volume = 4500 cubic feet
25’ x 75’ at elevation 957.5 (from elevation 958.20 and below)
40’ x 90’ at elevation 960
52’ x 102’ at elevation 962
The initial outlet structure configuration was selected as a square concrete riser with four
circular orifices to limit postdevelopment flow rates to predevelopment flow rates:
4” orifice at invert 955.00
8” orifice at invert 957.85
6” orifice at invert 958.40
4” orifice at invert 959.20
top of square concrete riser at 959.90 (total weir length of 8’)
This iteration was computed in the HEC-1 input data file on page ST-12-6, and similar
data was used within the HEC-HMS program. However, this outlet structure
configuration did not account for the first flush volume to be detained for a minimum of
24 hours, so a second iteration was required. The bottommost orifice is sized as 1.25”
diameter (page ST-10-9) to release the first flush volume (4500 cubic feet at the required
flow rate. A second outlet structure configuration (determined by trial and error) is:
1.25” orifice at invert 955.00
8” orifice at invert 958.20
6” orifice at invert 958.50
4” orifice at invert 959.20
top of square concrete riser at 960.65 (total weir length of 8’)
Figure ST-12-1
Example Detention Basin Geometry
Elev 962.0 Freeboard (top of dam)
Elev 960.0 (40’ x 90’ = 3600 sq.ft.)
Elev 957.5 (25’ x 75’ = 1875 sq.ft.)
Elev 955.0 (10’ x 60’ = 600 sq.ft.) 3:1 side slopes
3:1 side slopes
18” RCP
NOT TO SCALE
Final outlet
structure
configuration
Initial outlet
structure
configuration
ACTIVITY: Detention Example for HEC-1 & HEC-HMS ST – 12
Knoxville BMP Manual
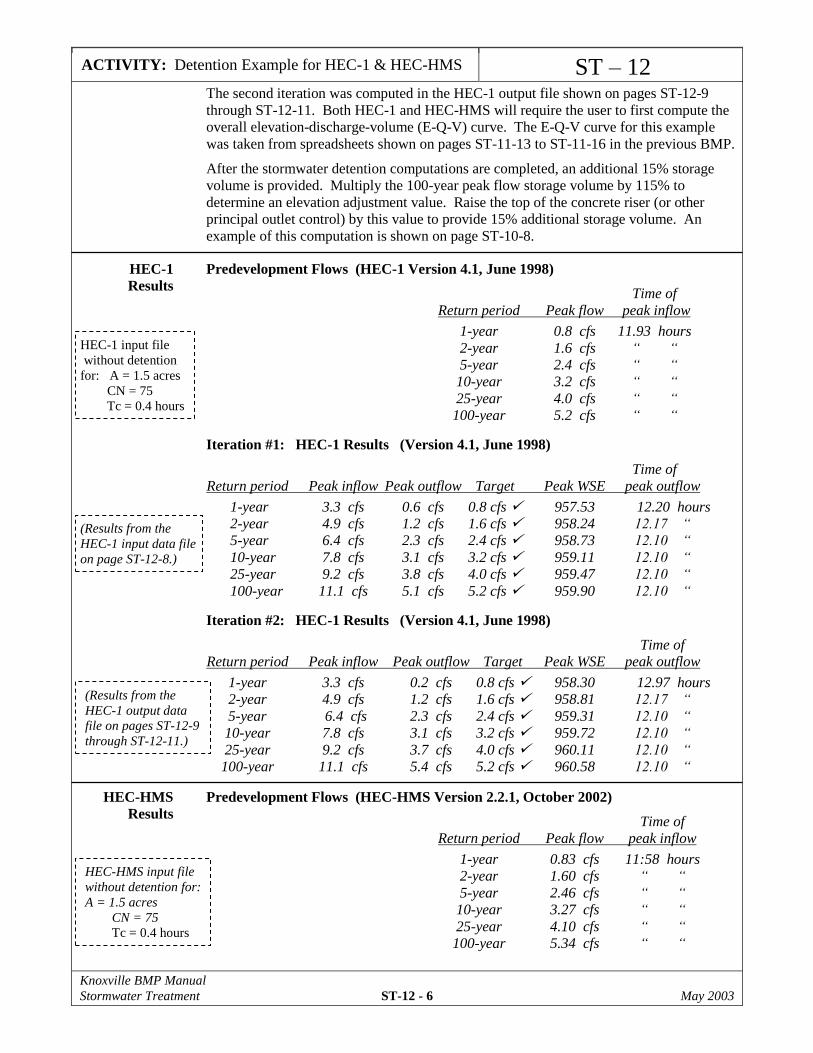
Stormwater Treatment ST-12 - 6 May 2003
The second iteration was computed in the HEC-1 output file shown on pages ST-12-9
through ST-12-11. Both HEC-1 and HEC-HMS will require the user to first compute the
overall elevation-discharge-volume (E-Q-V) curve. The E-Q-V curve for this example
was taken from spreadsheets shown on pages ST-11-13 to ST-11-16 in the previous BMP.
After the stormwater detention computations are completed, an additional 15% storage
volume is provided. Multiply the 100-year peak flow storage volume by 115% to
determine an elevation adjustment value. Raise the top of the concrete riser (or other
principal outlet control) by this value to provide 15% additional storage volume. An
example of this computation is shown on page ST-10-8.
HEC-1
Results
Predevelopment Flows (HEC-1 Version 4.1, June 1998)
Time of
Return period Peak flow peak inflow
1-year 0.8 cfs 11.93 hours
2-year 1.6 cfs “ “
5-year 2.4 cfs “ “
10-year 3.2 cfs “ “
25-year 4.0 cfs “ “
100-year 5.2 cfs “ “
Iteration #1: HEC-1 Results (Version 4.1, June 1998)
Time of
Return period Peak inflow Peak outflow Target Peak WSE peak outflow
1-year 3.3 cfs 0.6 cfs 0.8 cfs 957.53 12.20 hours
2-year 4.9 cfs 1.2 cfs 1.6 cfs 958.24 12.17 “
5-year 6.4 cfs 2.3 cfs 2.4 cfs 958.73 12.10 “
10-year 7.8 cfs 3.1 cfs 3.2 cfs 959.11 12.10 “
25-year 9.2 cfs 3.8 cfs 4.0 cfs 959.47 12.10 “
100-year 11.1 cfs 5.1 cfs 5.2 cfs 959.90 12.10 “
Iteration #2: HEC-1 Results (Version 4.1, June 1998)
Time of
Return period Peak inflow Peak outflow Target Peak WSE peak outflow
1-year 3.3 cfs 0.2 cfs 0.8 cfs 958.30 12.97 hours
2-year 4.9 cfs 1.2 cfs 1.6 cfs 958.81 12.17 “
5-year 6.4 cfs 2.3 cfs 2.4 cfs 959.31 12.10 “
10-year 7.8 cfs 3.1 cfs 3.2 cfs 959.72 12.10 “
25-year 9.2 cfs 3.7 cfs 4.0 cfs 960.11 12.10 “
100-year 11.1 cfs 5.4 cfs 5.2 cfs 960.58 12.10 “
HEC-HMS
Results
Predevelopment Flows (HEC-HMS Version 2.2.1, October 2002)
Time of
Return period Peak flow peak inflow
1-year 0.83 cfs 11:58 hours
2-year 1.60 cfs “ “
5-year 2.46 cfs “ “
10-year 3.27 cfs “ “
25-year 4.10 cfs “ “
100-year 5.34 cfs “ “
HEC-1 input file
without detention
for: A = 1.5 acres
CN = 75
Tc = 0.4 hours
(Results from the
HEC-1 input data file
on page ST-12-8.)
(Results from the
HEC-1 output data
file on pages ST-12-9
through ST-12-11.)
HEC-HMS input file
without detention for:
A = 1.5 acres
CN = 75
Tc = 0.4 hours
ACTIVITY: Detention Example for HEC-1 & HEC-HMS ST – 12
Knoxville BMP Manual
Stormwater Treatment ST-12 - 7 May 2003
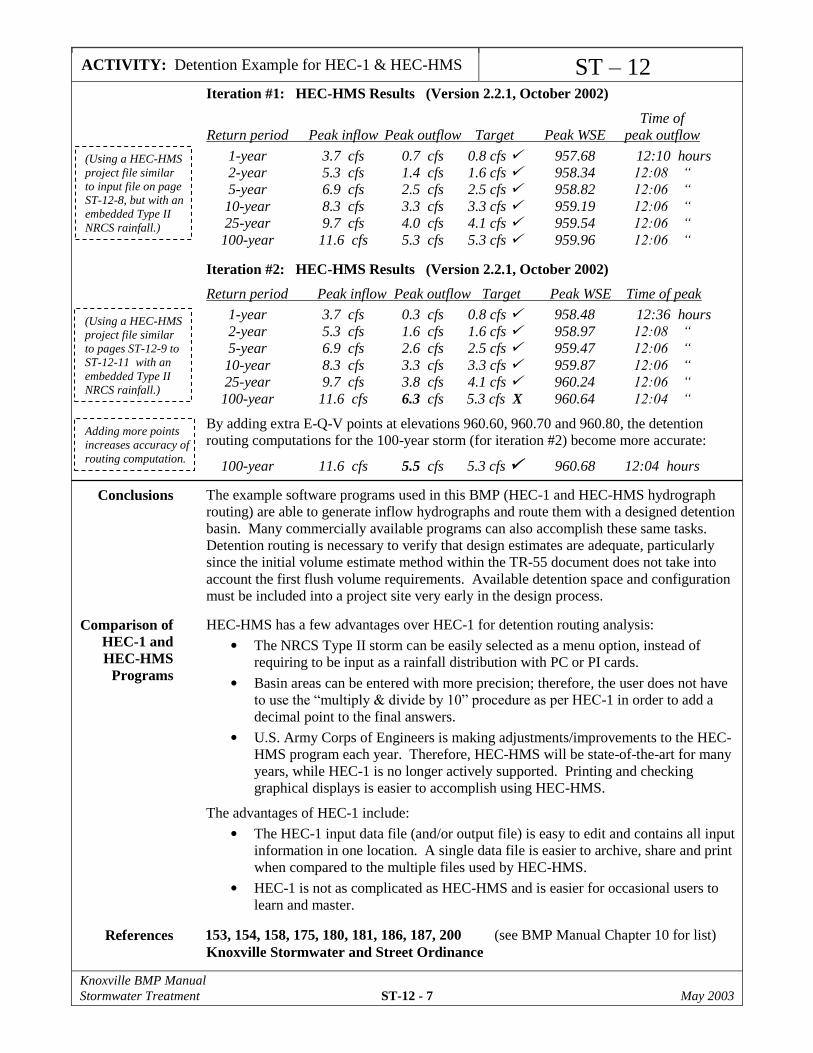
Iteration #1: HEC-HMS Results (Version 2.2.1, October 2002)
Time of
Return period Peak inflow Peak outflow Target Peak WSE peak outflow
1-year 3.7 cfs 0.7 cfs 0.8 cfs 957.68 12:10 hours
2-year 5.3 cfs 1.4 cfs 1.6 cfs 958.34 12:08 “
5-year 6.9 cfs 2.5 cfs 2.5 cfs 958.82 12:06 “
10-year 8.3 cfs 3.3 cfs 3.3 cfs 959.19 12:06 “
25-year 9.7 cfs 4.0 cfs 4.1 cfs 959.54 12:06 “
100-year 11.6 cfs 5.3 cfs 5.3 cfs 959.96 12:06 “
Iteration #2: HEC-HMS Results (Version 2.2.1, October 2002)
Return period Peak inflow Peak outflow Target Peak WSE Time of peak
1-year 3.7 cfs 0.3 cfs 0.8 cfs 958.48 12:36 hours
2-year 5.3 cfs 1.6 cfs 1.6 cfs 958.97 12:08 “
5-year 6.9 cfs 2.6 cfs 2.5 cfs 959.47 12:06 “
10-year 8.3 cfs 3.3 cfs 3.3 cfs 959.87 12:06 “
25-year 9.7 cfs 3.8 cfs 4.1 cfs 960.24 12:06 “
100-year 11.6 cfs 6.3 cfs 5.3 cfs X 960.64 12:04 “
By adding extra E-Q-V points at elevations 960.60, 960.70 and 960.80, the detention
routing computations for the 100-year storm (for iteration #2) become more accurate:
100-year 11.6 cfs 5.5 cfs 5.3 cfs 960.68 12:04 hours
Conclusions The example software programs used in this BMP (HEC-1 and HEC-HMS hydrograph
routing) are able to generate inflow hydrographs and route them with a designed detention
basin. Many commercially available programs can also accomplish these same tasks.
Detention routing is necessary to verify that design estimates are adequate, particularly
since the initial volume estimate method within the TR-55 document does not take into
account the first flush volume requirements. Available detention space and configuration
must be included into a project site very early in the design process.
Comparison of
HEC-1 and
HEC-HMS
Programs
HEC-HMS has a few advantages over HEC-1 for detention routing analysis:
The NRCS Type II storm can be easily selected as a menu option, instead of
requiring to be input as a rainfall distribution with PC or PI cards.
Basin areas can be entered with more precision; therefore, the user does not have
to use the “multiply & divide by 10” procedure as per HEC-1 in order to add a
decimal point to the final answers.
U.S. Army Corps of Engineers is making adjustments/improvements to the HEC-
HMS program each year. Therefore, HEC-HMS will be state-of-the-art for many
years, while HEC-1 is no longer actively supported. Printing and checking
graphical displays is easier to accomplish using HEC-HMS.
The advantages of HEC-1 include:
The HEC-1 input data file (and/or output file) is easy to edit and contains all input
information in one location. A single data file is easier to archive, share and print
when compared to the multiple files used by HEC-HMS.
HEC-1 is not as complicated as HEC-HMS and is easier for occasional users to
learn and master.
References 153, 154, 158, 175, 180, 181, 186, 187, 200 (see BMP Manual Chapter 10 for list)
Knoxville Stormwater and Street Ordinance
(Using a HEC-HMS
project file similar
to input file on page
ST-12-8, but with an
embedded Type II
NRCS rainfall.)
(Using a HEC-HMS
project file similar
to pages ST-12-9 to
ST-12-11 with an
embedded Type II
NRCS rainfall.)
Adding more points
increases accuracy of
routing computation.
ACTIVITY: Detention Example for HEC-1 & HEC-HMS ST – 12
Knoxville BMP Manual
Stormwater Treatment ST-12 - 8 May 2003
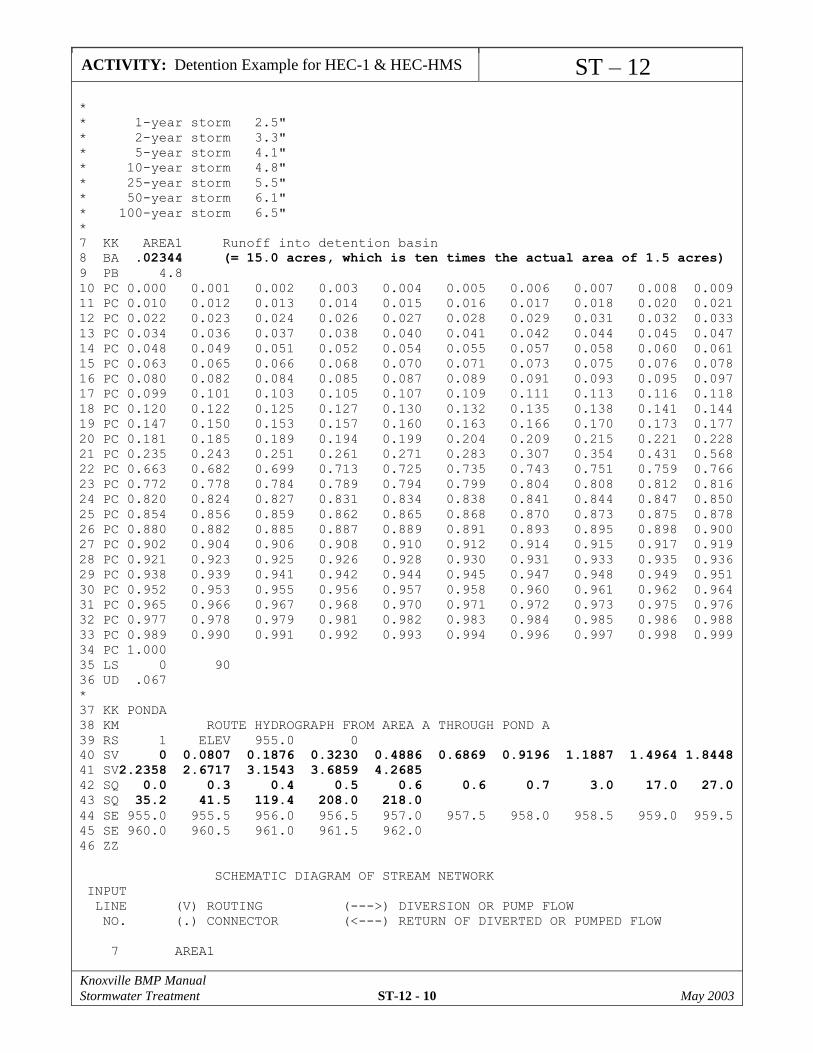
ID HEC-1 run for BMP Manual --- Initial volume estimate with the
ID ST-12, Detention Examples initial outlet structure configuration.
ID 10-YEAR 24-HOUR STORM
*
* This example problem has 1.5 acres, CN = 90, Tc = 0.1 hour.
* The basin area (BA), pond volumes (SV) and pond outflows (SQ) are
* multiplied by a factor of 10 to increase the precision of analysis.
* In other words, the basin area is input as 0.02344 square miles (15 acres).
* Detention basin is initially sized with spreadsheet ST-11 (Worksheet #2).
* City of Knoxville – Engineering Department – Ken Oliver
* May 1, 2003
* File: Hec1-ex1.dat
*
IT 2 01MAY03 0000 1500 2000
IN 6
IO 5 0
*
KK AREA1 Runoff into detention basin
BA.02344 * Basin area must be entered as square miles.
PB 4.8 * Total precipitation must be entered as inches.
PC 0.000 0.001 0.002 0.003 0.004 0.005 0.006 0.007 0.008 0.009
PC 0.010 0.012 0.013 0.014 0.015 0.016 0.017 0.018 0.020 0.021
PC 0.022 0.023 0.024 0.026 0.027 0.028 0.029 0.031 0.032 0.033
PC 0.034 0.036 0.037 0.038 0.040 0.041 0.042 0.044 0.045 0.047
PC 0.048 0.049 0.051 0.052 0.054 0.055 0.057 0.058 0.060 0.061
PC 0.063 0.065 0.066 0.068 0.070 0.071 0.073 0.075 0.076 0.078
PC 0.080 0.082 0.084 0.085 0.087 0.089 0.091 0.093 0.095 0.097
PC 0.099 0.101 0.103 0.105 0.107 0.109 0.111 0.113 0.116 0.118
PC 0.120 0.122 0.125 0.127 0.130 0.132 0.135 0.138 0.141 0.144
PC 0.147 0.150 0.153 0.157 0.160 0.163 0.166 0.170 0.173 0.177
PC 0.181 0.185 0.189 0.194 0.199 0.204 0.209 0.215 0.221 0.228
PC 0.235 0.243 0.251 0.261 0.271 0.283 0.307 0.354 0.431 0.568
PC 0.663 0.682 0.699 0.713 0.725 0.735 0.743 0.751 0.759 0.766
PC 0.772 0.778 0.784 0.789 0.794 0.799 0.804 0.808 0.812 0.816
PC 0.820 0.824 0.827 0.831 0.834 0.838 0.841 0.844 0.847 0.850
PC 0.854 0.856 0.859 0.862 0.865 0.868 0.870 0.873 0.875 0.878
PC 0.880 0.882 0.885 0.887 0.889 0.891 0.893 0.895 0.898 0.900
PC 0.902 0.904 0.906 0.908 0.910 0.912 0.914 0.915 0.917 0.919
PC 0.921 0.923 0.925 0.926 0.928 0.930 0.931 0.933 0.935 0.936
PC 0.938 0.939 0.941 0.942 0.944 0.945 0.947 0.948 0.949 0.951
PC 0.952 0.953 0.955 0.956 0.957 0.958 0.960 0.961 0.962 0.964
PC 0.965 0.966 0.967 0.968 0.970 0.971 0.972 0.973 0.975 0.976
PC 0.977 0.978 0.979 0.981 0.982 0.983 0.984 0.985 0.986 0.988
PC 0.989 0.990 0.991 0.992 0.993 0.994 0.996 0.997 0.998 0.999
PC 1.000
LS 0 90 * This is the postdeveloped curve number (CN=90).
UD .067 * This is the SCS lag time in hours (equal to 2/3 of Tc).
*
KK PONDA Route the hydrograph from Area 1 through Pond A
RS 1 ELEV 955.0 0
SV 0 0.0807 0.1876 0.3230 0.4886 0.6869 0.9196 1.1887 1.4964 1.8448
SV2.2358 2.6717 3.1543 3.6859 4.2685
SQ 0.00 2.4 3.8 4.9 5.7 6.4 7.7 17.2 29.0 38.2
SQ 53.8 164.2 198.0 208.0 218.0
SE 955.0 955.5 956.0 956.5 957.0 957.5 958.0 958.5 959.0 959.5
SE 960.0 960.5 961.0 961.5 962.0
ZZ
ACTIVITY: Detention Example for HEC-1 & HEC-HMS ST – 12
Knoxville BMP Manual
Stormwater Treatment ST-12 - 9 May 2003
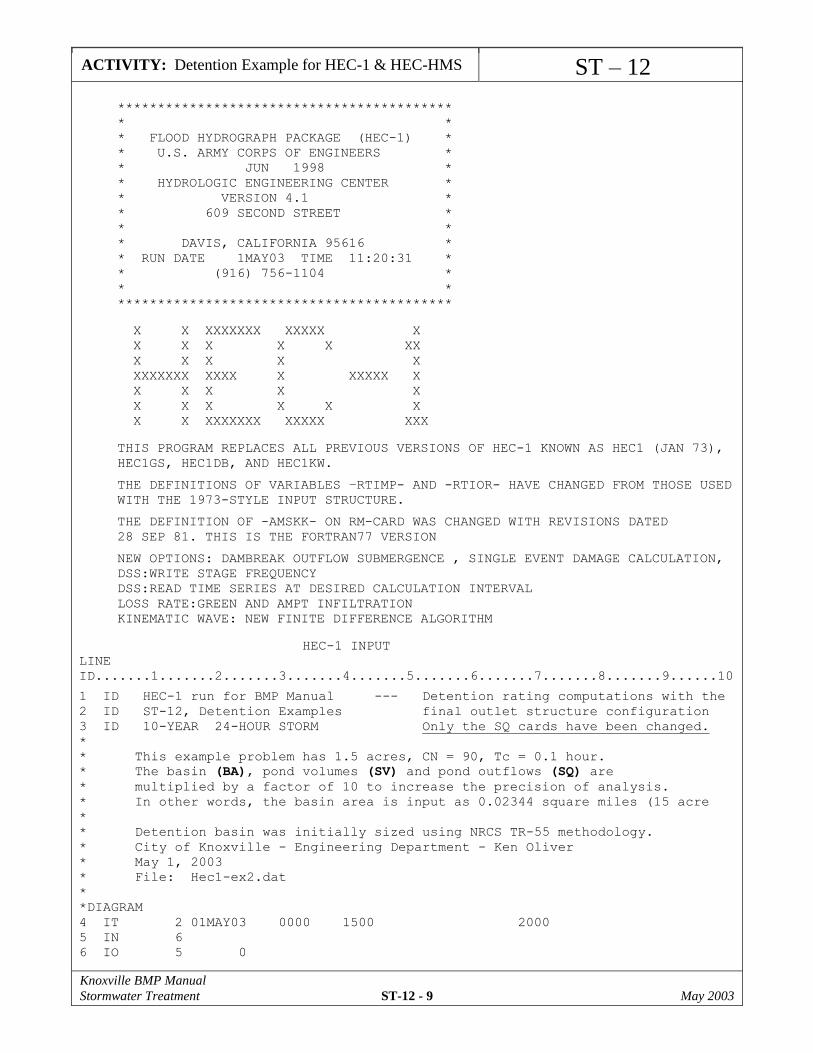
******************************************
* *
* FLOOD HYDROGRAPH PACKAGE (HEC-1) *
* U.S. ARMY CORPS OF ENGINEERS *
* JUN 1998 *
* HYDROLOGIC ENGINEERING CENTER *
* VERSION 4.1 *
* 609 SECOND STREET *
* *
* DAVIS, CALIFORNIA 95616 *
* RUN DATE 1MAY03 TIME 11:20:31 *
* (916) 756-1104 *
* *
******************************************
X X XXXXXXX XXXXX X
X X X X X XX
X X X X X
XXXXXXX XXXX X XXXXX X
X X X X X
X X X X X X
X X XXXXXXX XXXXX XXX
THIS PROGRAM REPLACES ALL PREVIOUS VERSIONS OF HEC-1 KNOWN AS HEC1 (JAN 73),
HEC1GS, HEC1DB, AND HEC1KW.
THE DEFINITIONS OF VARIABLES –RTIMP- AND -RTIOR- HAVE CHANGED FROM THOSE USED
WITH THE 1973-STYLE INPUT STRUCTURE.
THE DEFINITION OF -AMSKK- ON RM-CARD WAS CHANGED WITH REVISIONS DATED
28 SEP 81. THIS IS THE FORTRAN77 VERSION
NEW OPTIONS: DAMBREAK OUTFLOW SUBMERGENCE , SINGLE EVENT DAMAGE CALCULATION,
DSS:WRITE STAGE FREQUENCY
DSS:READ TIME SERIES AT DESIRED CALCULATION INTERVAL
LOSS RATE:GREEN AND AMPT INFILTRATION
KINEMATIC WAVE: NEW FINITE DIFFERENCE ALGORITHM
HEC-1 INPUT
LINE
ID.......1.......2.......3.......4.......5.......6.......7.......8.......9......10
1 ID HEC-1 run for BMP Manual --- Detention rating computations with the
2 ID ST-12, Detention Examples final outlet structure configuration
3 ID 10-YEAR 24-HOUR STORM Only the SQ cards have been changed.
*
* This example problem has 1.5 acres, CN = 90, Tc = 0.1 hour.
* The basin (BA), pond volumes (SV) and pond outflows (SQ) are
* multiplied by a factor of 10 to increase the precision of analysis.
* In other words, the basin area is input as 0.02344 square miles (15 acre
*
* Detention basin was initially sized using NRCS TR-55 methodology.
* City of Knoxville - Engineering Department - Ken Oliver
* May 1, 2003
* File: Hec1-ex2.dat
*
*DIAGRAM
4 IT 2 01MAY03 0000 1500 2000
5 IN 6
6 IO 5 0
ACTIVITY: Detention Example for HEC-1 & HEC-HMS ST – 12
Knoxville BMP Manual
Stormwater Treatment ST-12 - 10 May 2003
*
* 1-year storm 2.5"
* 2-year storm 3.3"
* 5-year storm 4.1"
* 10-year storm 4.8"
* 25-year storm 5.5"
* 50-year storm 6.1"
* 100-year storm 6.5"
*
7 KK AREA1 Runoff into detention basin
8 BA .02344 (= 15.0 acres, which is ten times the actual area of 1.5 acres)
9 PB 4.8
10 PC 0.000 0.001 0.002 0.003 0.004 0.005 0.006 0.007 0.008 0.009
11 PC 0.010 0.012 0.013 0.014 0.015 0.016 0.017 0.018 0.020 0.021
12 PC 0.022 0.023 0.024 0.026 0.027 0.028 0.029 0.031 0.032 0.033
13 PC 0.034 0.036 0.037 0.038 0.040 0.041 0.042 0.044 0.045 0.047
14 PC 0.048 0.049 0.051 0.052 0.054 0.055 0.057 0.058 0.060 0.061
15 PC 0.063 0.065 0.066 0.068 0.070 0.071 0.073 0.075 0.076 0.078
16 PC 0.080 0.082 0.084 0.085 0.087 0.089 0.091 0.093 0.095 0.097
17 PC 0.099 0.101 0.103 0.105 0.107 0.109 0.111 0.113 0.116 0.118
18 PC 0.120 0.122 0.125 0.127 0.130 0.132 0.135 0.138 0.141 0.144
19 PC 0.147 0.150 0.153 0.157 0.160 0.163 0.166 0.170 0.173 0.177
20 PC 0.181 0.185 0.189 0.194 0.199 0.204 0.209 0.215 0.221 0.228
21 PC 0.235 0.243 0.251 0.261 0.271 0.283 0.307 0.354 0.431 0.568
22 PC 0.663 0.682 0.699 0.713 0.725 0.735 0.743 0.751 0.759 0.766
23 PC 0.772 0.778 0.784 0.789 0.794 0.799 0.804 0.808 0.812 0.816
24 PC 0.820 0.824 0.827 0.831 0.834 0.838 0.841 0.844 0.847 0.850
25 PC 0.854 0.856 0.859 0.862 0.865 0.868 0.870 0.873 0.875 0.878
26 PC 0.880 0.882 0.885 0.887 0.889 0.891 0.893 0.895 0.898 0.900
27 PC 0.902 0.904 0.906 0.908 0.910 0.912 0.914 0.915 0.917 0.919
28 PC 0.921 0.923 0.925 0.926 0.928 0.930 0.931 0.933 0.935 0.936
29 PC 0.938 0.939 0.941 0.942 0.944 0.945 0.947 0.948 0.949 0.951
30 PC 0.952 0.953 0.955 0.956 0.957 0.958 0.960 0.961 0.962 0.964
31 PC 0.965 0.966 0.967 0.968 0.970 0.971 0.972 0.973 0.975 0.976
32 PC 0.977 0.978 0.979 0.981 0.982 0.983 0.984 0.985 0.986 0.988
33 PC 0.989 0.990 0.991 0.992 0.993 0.994 0.996 0.997 0.998 0.999
34 PC 1.000
35 LS 0 90
36 UD .067
*
37 KK PONDA
38 KM ROUTE HYDROGRAPH FROM AREA A THROUGH POND A
39 RS 1 ELEV 955.0 0
40 SV 0 0.0807 0.1876 0.3230 0.4886 0.6869 0.9196 1.1887 1.4964 1.8448
41 SV2.2358 2.6717 3.1543 3.6859 4.2685
42 SQ 0.0 0.3 0.4 0.5 0.6 0.6 0.7 3.0 17.0 27.0
43 SQ 35.2 41.5 119.4 208.0 218.0
44 SE 955.0 955.5 956.0 956.5 957.0 957.5 958.0 958.5 959.0 959.5
45 SE 960.0 960.5 961.0 961.5 962.0
46 ZZ
SCHEMATIC DIAGRAM OF STREAM NETWORK
INPUT
LINE (V) ROUTING (--->) DIVERSION OR PUMP FLOW
NO. (.) CONNECTOR (<---) RETURN OF DIVERTED OR PUMPED FLOW
7 AREA1
ACTIVITY: Detention Example for HEC-1 & HEC-HMS ST – 12
Knoxville BMP Manual
Stormwater Treatment ST-12 - 11 May 2003
V
V
37 PONDA
(***) RUNOFF ALSO COMPUTED AT THIS LOCATION
****************************************
* *
* FLOOD HYDROGRAPH PACKAGE (HEC-1) *
* U.S. ARMY CORPS OF ENGINEERS *
* JUN 1998 *
* HYDROLOGIC ENGINEERING CENTER *
* VERSION 4.1 *
* 609 SECOND STREET *
* *
* DAVIS, CALIFORNIA 95616 *
* RUN DATE 1MAY03 TIME 11:20:31 *
* (916) 756-1104 *
* *
****************************************
HEC-1 run for BMP Manual --- Detention rating computations with the
ST-12, Detention Examples final outlet structure configuration
10-YEAR 24-HOUR STORM Only the SQ cards have been changed.
6 IO OUTPUT CONTROL VARIABLES
IPRNT 5 PRINT CONTROL
IPLOT 0 PLOT CONTROL
QSCAL 0. HYDROGRAPH PLOT SCALE
IT HYDROGRAPH TIME DATA
NMIN 2 MINUTES IN COMPUTATION INTERVAL
IDATE 1MAY 3 STARTING DATE
ITIME 0000 STARTING TIME
NQ 1500 NUMBER OF HYDROGRAPH ORDINATES
NDDATE 3MAY 3 ENDING DATE
NDTIME 0158 ENDING TIME
ICENT 20 CENTURY MARK
COMPUTATION INTERVAL .03 HOURS
TOTAL TIME BASE 49.97 HOURS
ENGLISH UNITS
DRAINAGE AREA SQUARE MILES
PRECIPITATION DEPTH INCHES
LENGTH, ELEVATION FEET
FLOW CUBIC FEET PER SECOND
STORAGE VOLUME ACRE-FEET
SURFACE AREA ACRES
TEMPERATURE DEGREES FAHRENHEIT
RUNOFF SUMMARY
FLOW IN CUBIC FEET PER SECOND
TIME IN HOURS, AREA IN SQUARE MILES
PEAK TIME OF AVERAGE FLOW FOR MAXIMUM PERIOD BASIN MAXIMUM TIME OF
OPERATION STATION FLOW PEAK 6-HOUR 24-HOUR 72-HOUR AREA STAGE MAX STAGE
HYDROGRAPH AT AREA1 78. 11.93 7. 2. 1. .02
ROUTED TO PONDA 31. 12.10 6. 2. 1. .02 959.72 12.10
*** NORMAL END OF HEC-1 ***
ACTIVITY: Detention Example for HEC-1 & HEC-HMS ST – 12
Knoxville BMP Manual
Stormwater Treatment ST-12 - 12 May 2003
Portions of input data and output summary from HEC-HMS:
Def
ines
th
e o
ver
al p
roje
ct f
ile.
S
ub
bas
ins
+ d
eten
tio
n b
asin
s.
Ed
it e
ach
su
bb
asin
sep
arat
ely.
ACTIVITY: Detention Example for HEC-1 & HEC-HMS ST – 12
Knoxville BMP Manual
Stormwater Treatment ST-12 - 13 May 2003
Def
ines
th
e ra
infa
ll d
istr
ibu
tion
.
Co
mp
uta
tio
nal
tim
e in
terv
al.
Co
mp
ute
sto
rag
e an
d o
utf
low
dat
a
at r
egu
lar
inte
rval
s fo
r in
pu
t.
ACTIVITY: Detention Example for HEC-1 & HEC-HMS ST – 12
Knoxville BMP Manual
Stormwater Treatment ST-12 - 14 May 2003
S
um
mar
y r
ou
tin
g r
esu
lts
for
1 s
torm
. E
xam
ple
of
gra
ph
ical
ou
tpu
t fo
r in
itia
l la
you
t