Embed Size (px)
Citation preview
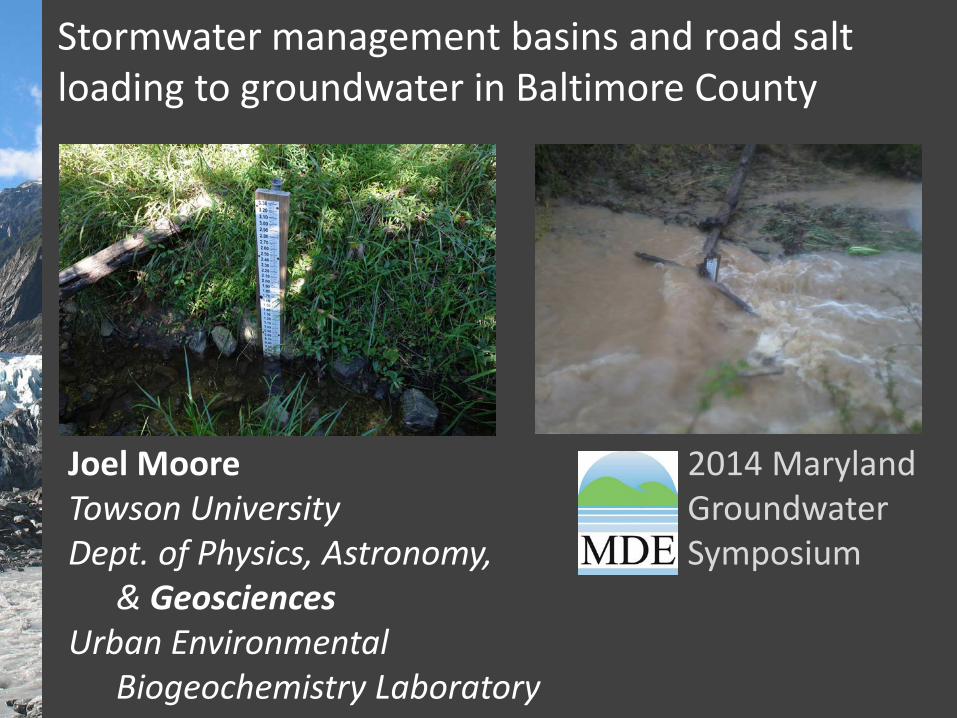
Stormwater management basins and road salt loading to groundwater in Baltimore County
Joel Moore Towson University Dept. of Physics, Astronomy, & Geosciences Urban Environmental Biogeochemistry Laboratory
2014 Maryland Groundwater Symposium
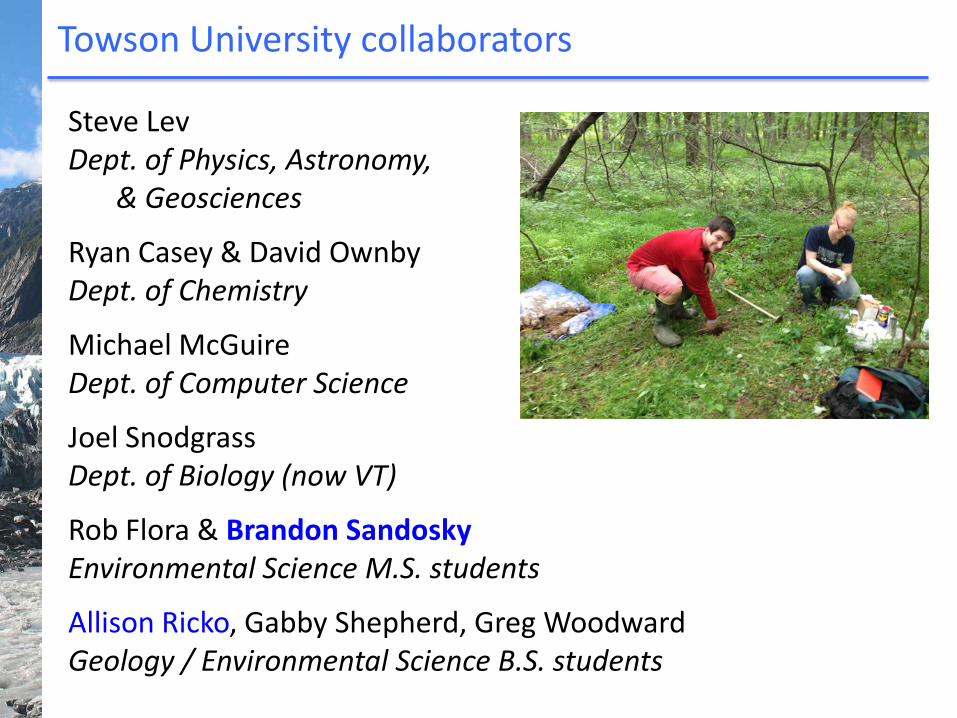
Towson University collaborators
Steve Lev Dept. of Physics, Astronomy, & Geosciences
Ryan Casey & David Ownby Dept. of Chemistry
Michael McGuire Dept. of Computer Science
Joel Snodgrass Dept. of Biology (now VT)
Rob Flora & Brandon Sandosky Environmental Science M.S. students
Allison Ricko, Gabby Shepherd, Greg Woodward Geology / Environmental Science B.S. students
Funding
The National Institute for Water Resources
Maryland Water Resources Research Center
US Geological Survey via
Jess & Mildred Fisher Endowed Chair of
Geological Sciences
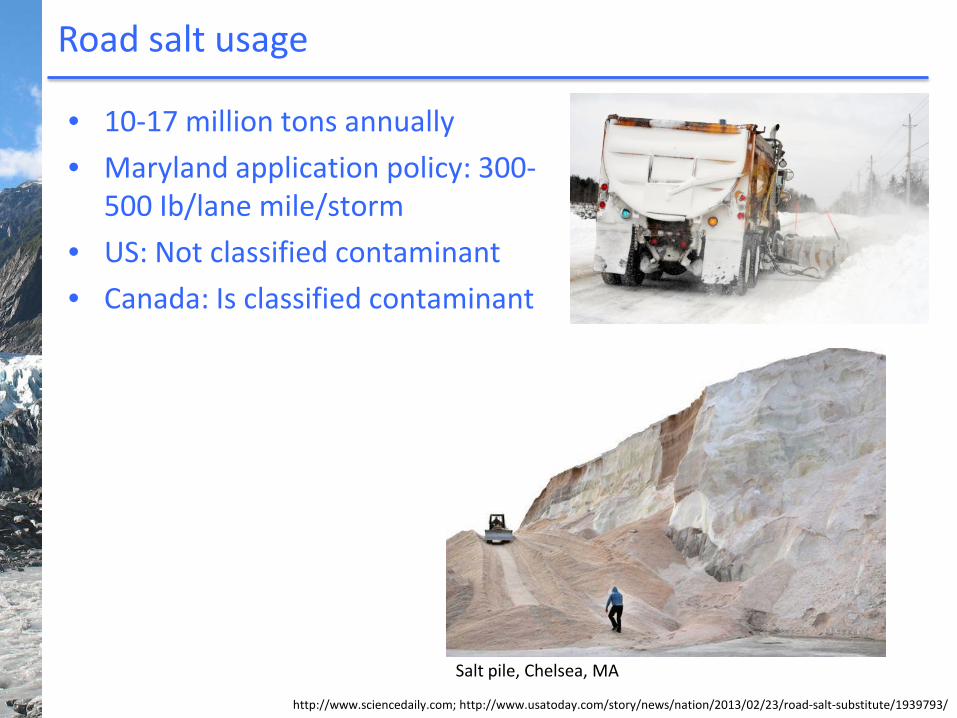
Road salt usage
http://www.post-gazette.com
http://www.sciencedaily.com; http://www.usatoday.com/story/news/nation/2013/02/23/road-salt-substitute/1939793/
Salt pile, Chelsea, MA
• 10-17 million tons annually • Maryland application policy: 300-
500 Ib/lane mile/storm • US: Not classified contaminant • Canada: Is classified contaminant

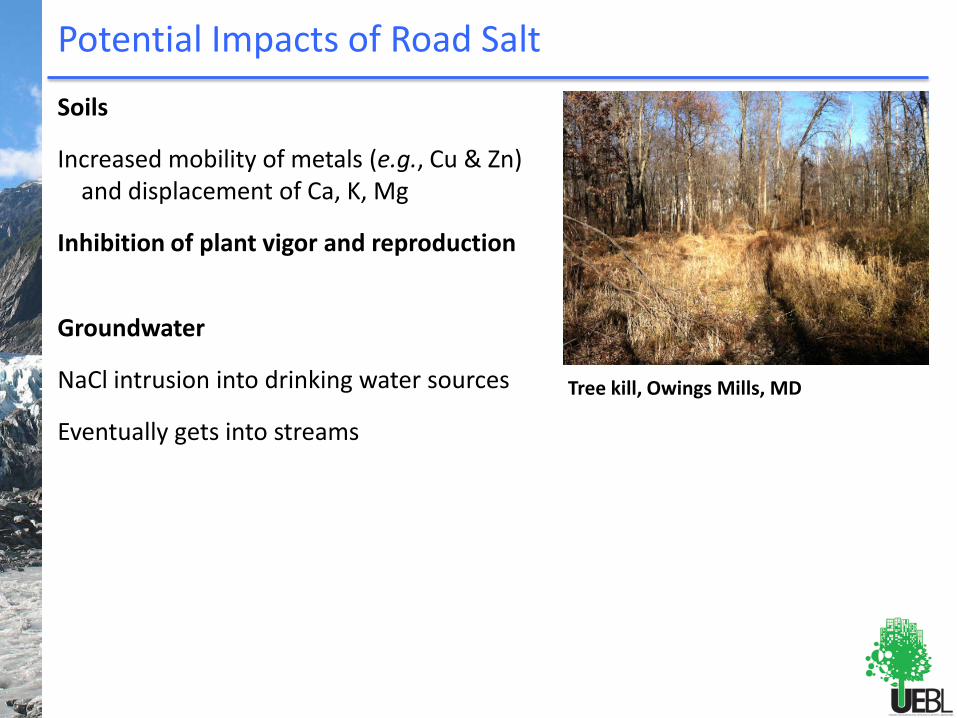
Potential Impacts of Road Salt
Soils
Increased mobility of metals (e.g., Cu & Zn) and displacement of Ca, K, Mg
Inhibition of plant vigor and reproduction
Tree kill, Owings Mills, MD
Potential Impacts of Road Salt
Soils
Increased mobility of metals (e.g., Cu & Zn) and displacement of Ca, K, Mg
Inhibition of plant vigor and reproduction
Groundwater
NaCl intrusion into drinking water sources
Eventually gets into streams
Tree kill, Owings Mills, MD
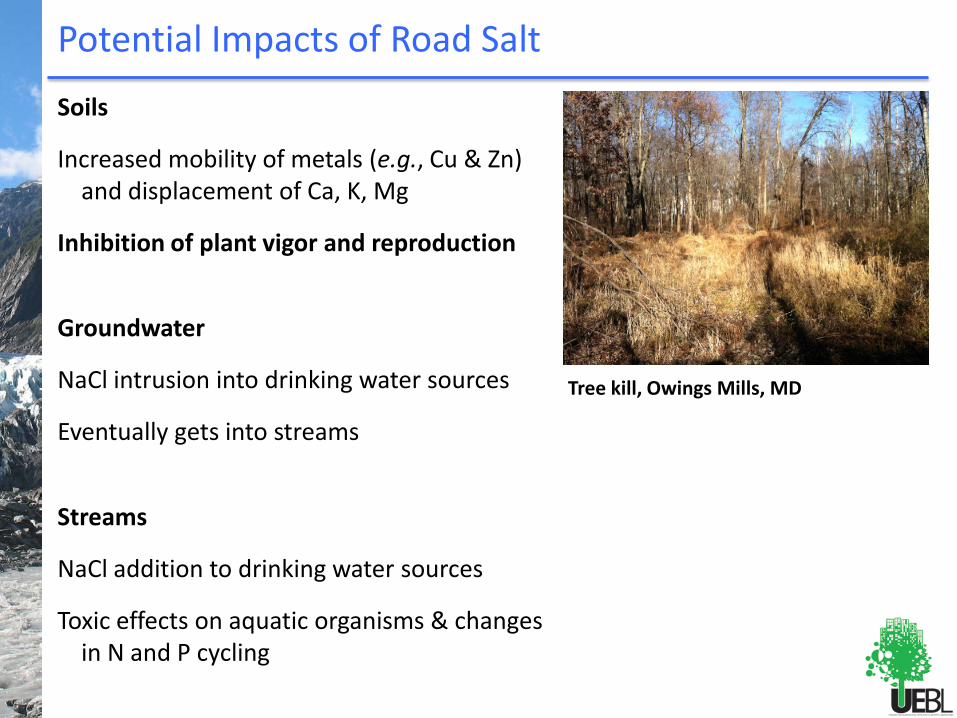
Potential Impacts of Road Salt
Soils
Increased mobility of metals (e.g., Cu & Zn) and displacement of Ca, K, Mg
Inhibition of plant vigor and reproduction
Groundwater
NaCl intrusion into drinking water sources
Eventually gets into streams
Streams
NaCl addition to drinking water sources
Toxic effects on aquatic organisms & changes in N and P cycling
Tree kill, Owings Mills, MD
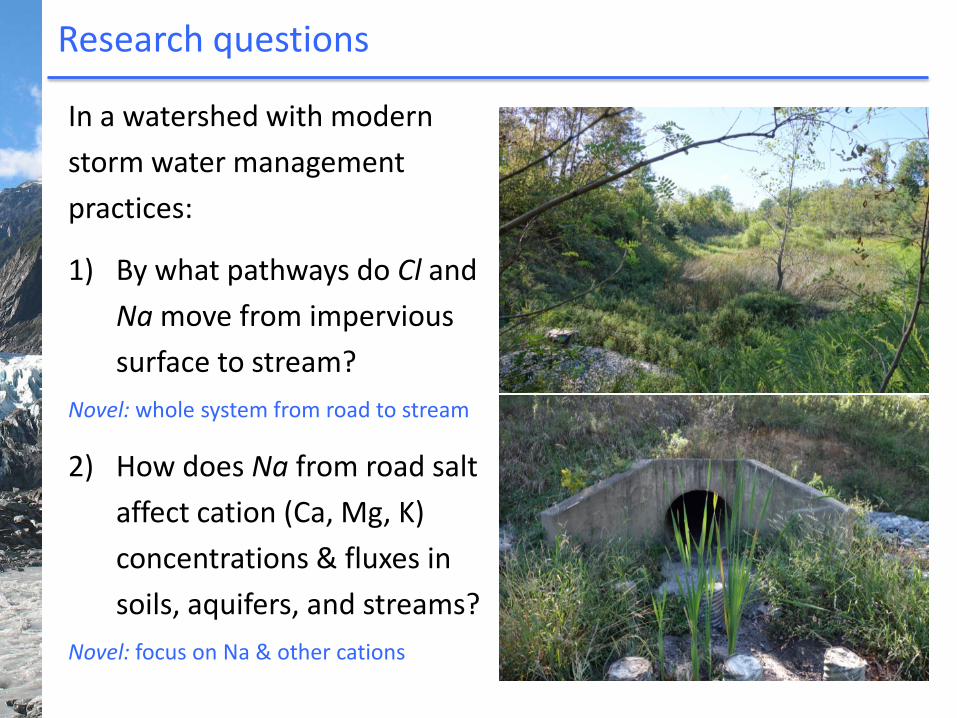
Research questions
In a watershed with modern storm water management practices:
1) By what pathways do Cl and Na move from impervious surface to stream?
Novel: whole system from road to stream
2) How does Na from road salt affect cation (Ca, Mg, K) concentrations & fluxes in soils, aquifers, and streams?
Novel: focus on Na & other cations
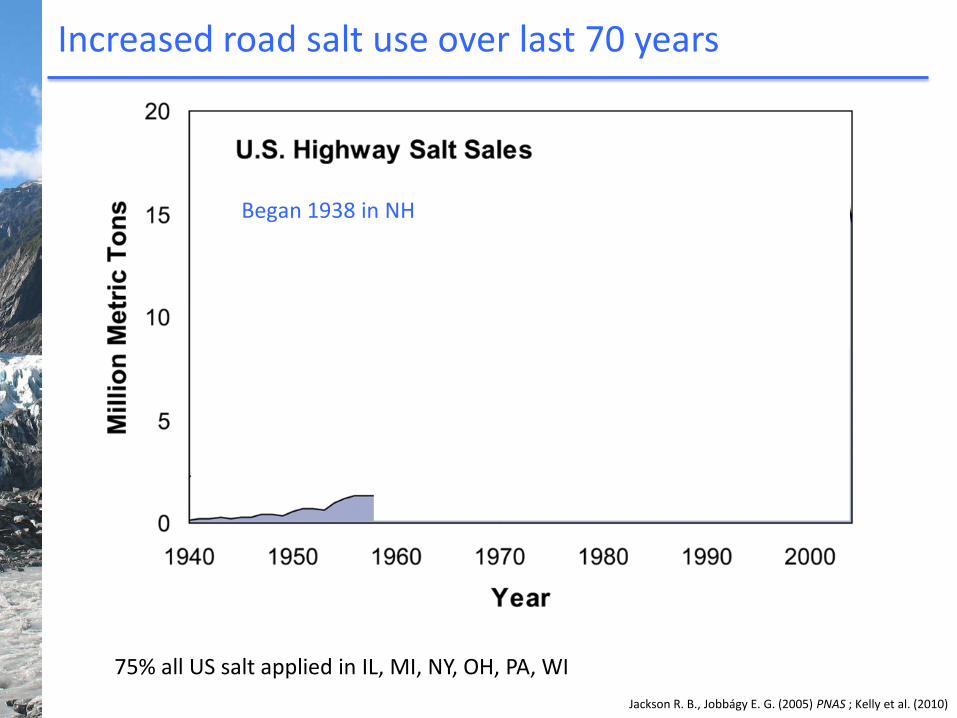
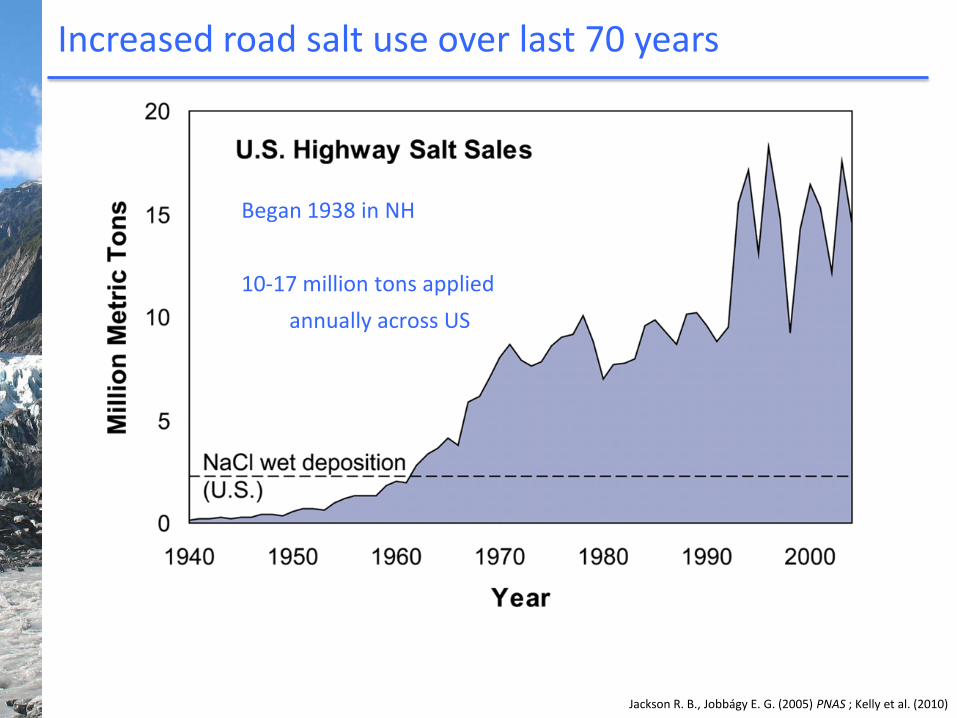
Increased road salt use over last 70 years
Jackson R. B., Jobbágy E. G. (2005) PNAS ; Kelly et al. (2010)
Began 1938 in NH
75% all US salt applied in IL, MI, NY, OH, PA, WI
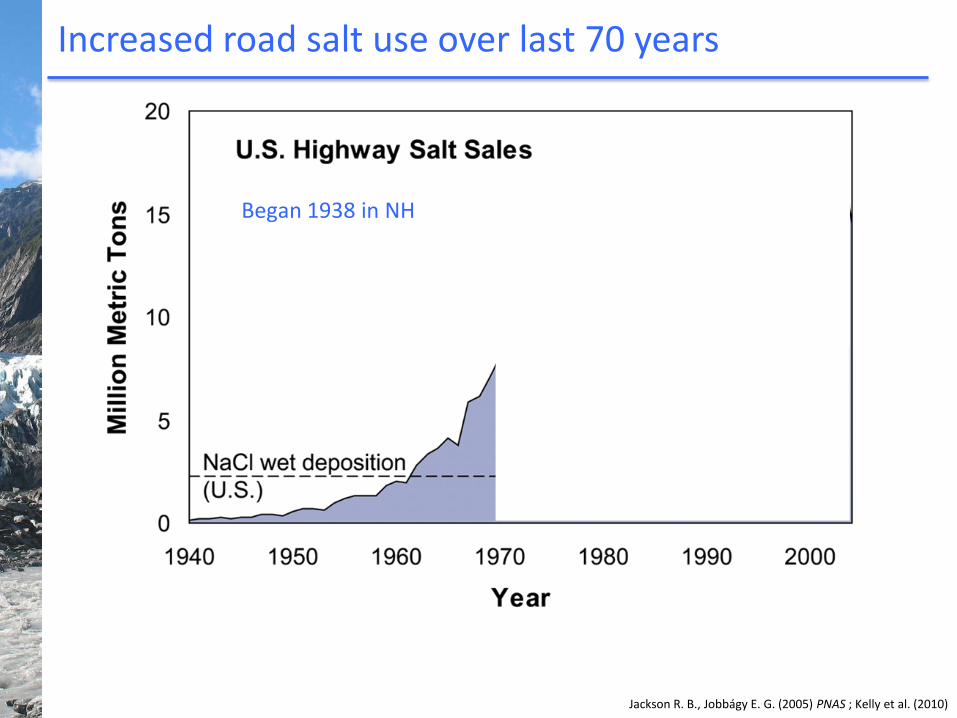
Increased road salt use over last 70 years
Jackson R. B., Jobbágy E. G. (2005) PNAS ; Kelly et al. (2010)
Began 1938 in NH
Increased road salt use over last 70 years
Jackson R. B., Jobbágy E. G. (2005) PNAS ; Kelly et al. (2010)
Began 1938 in NH 10-17 million tons applied annually across US
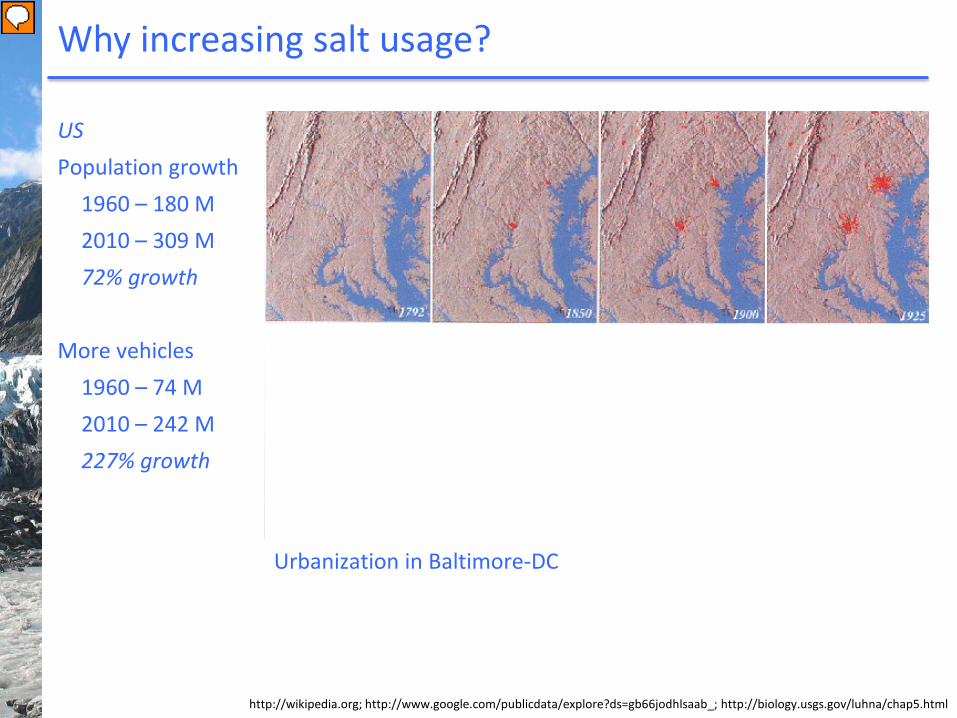
Why increasing salt usage?
http://wikipedia.org; http://www.google.com/publicdata/explore?ds=gb66jodhlsaab_; http://biology.usgs.gov/luhna/chap5.html
US Population growth 1960 – 180 M 2010 – 309 M 72% growth More vehicles 1960 – 74 M 2010 – 242 M 227% growth
Urbanization in Baltimore-DC
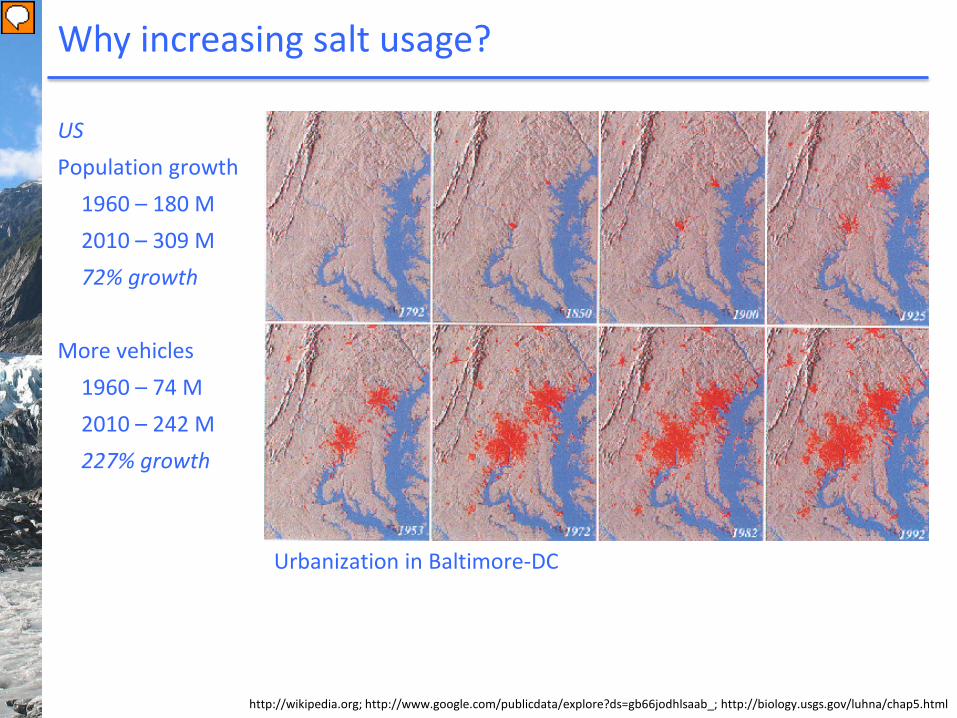
Why increasing salt usage?
http://wikipedia.org; http://www.google.com/publicdata/explore?ds=gb66jodhlsaab_; http://biology.usgs.gov/luhna/chap5.html
Urbanization in Baltimore-DC
US Population growth 1960 – 180 M 2010 – 309 M 72% growth More vehicles 1960 – 74 M 2010 – 242 M 227% growth
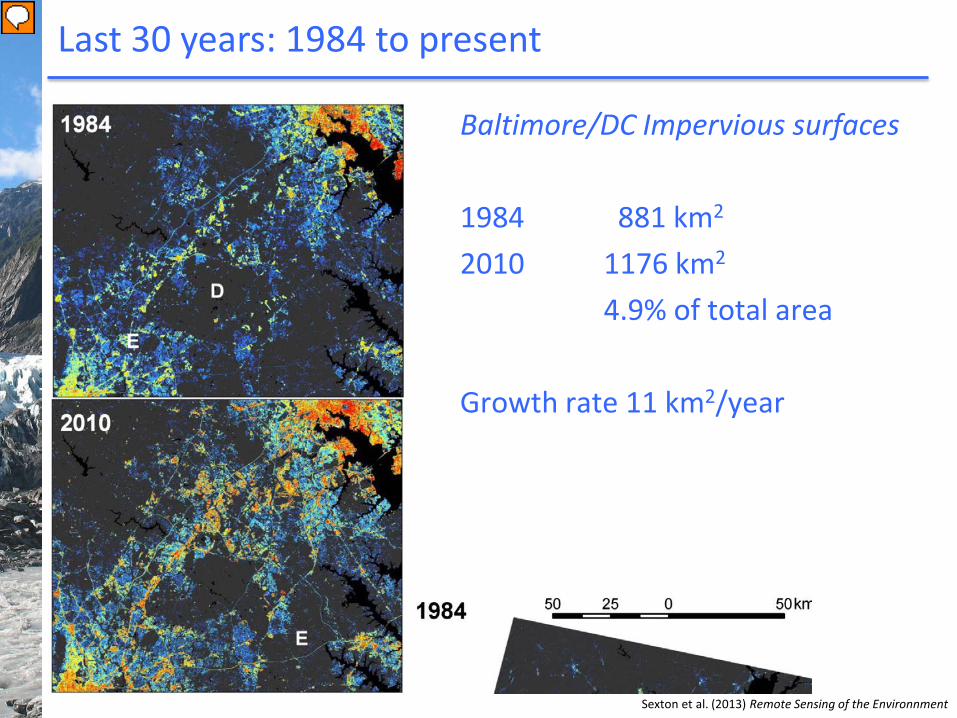
Last 30 years: 1984 to present
Sexton et al. (2013) Remote Sensing of the Environnment
Baltimore/DC Impervious surfaces 1984 881 km2 2010 1176 km2
4.9% of total area Growth rate 11 km2/year
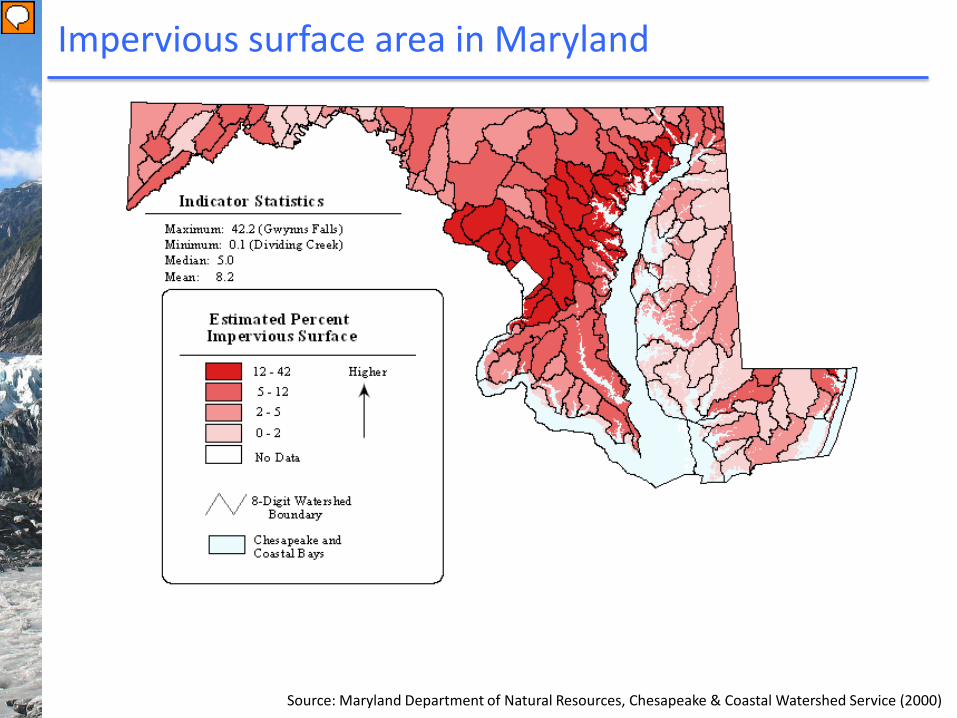
Impervious surface area in Maryland
Source: Maryland Department of Natural Resources, Chesapeake & Coastal Watershed Service (2000)
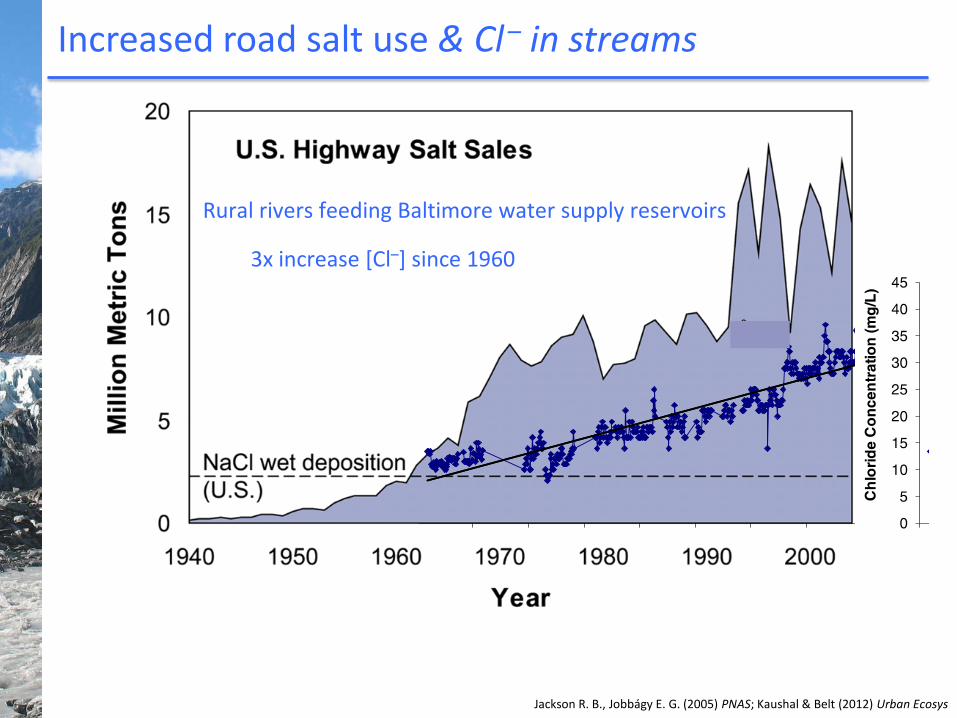
Increased road salt use & Cl – in streams
Jackson R. B., Jobbágy E. G. (2005) PNAS; Kaushal & Belt (2012) Urban Ecosys
Rural rivers feeding Baltimore water supply reservoirs
3x increase [Cl–] since 1960
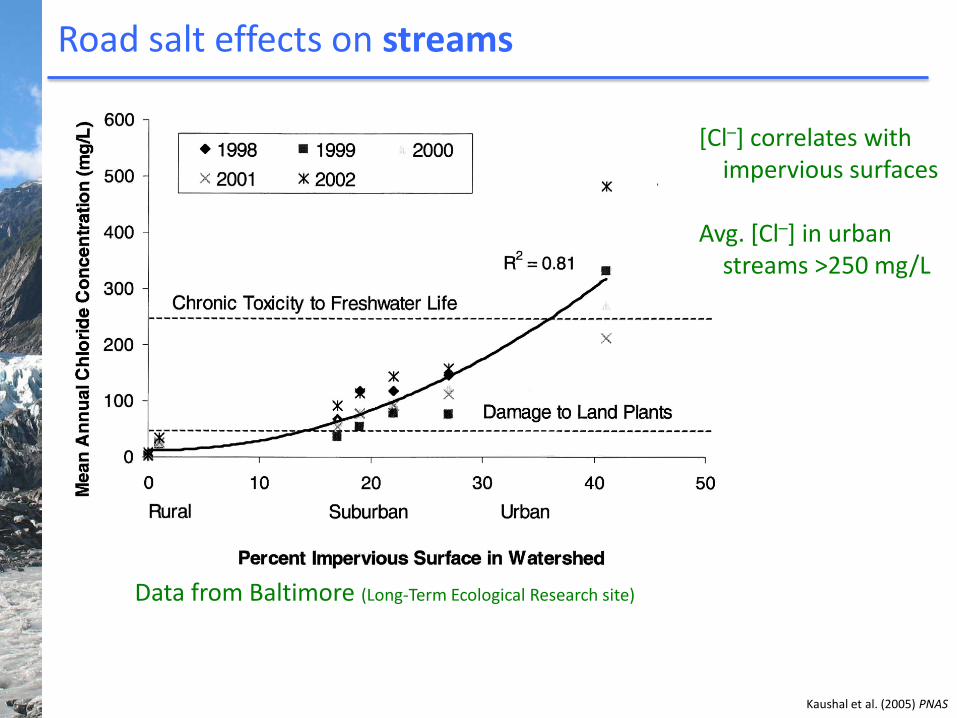
Road salt effects on streams
Kaushal et al. (2005) PNAS
[Cl–] correlates with impervious surfaces
Avg. [Cl–] in urban
streams >250 mg/L
Data from Baltimore (Long-Term Ecological Research site)
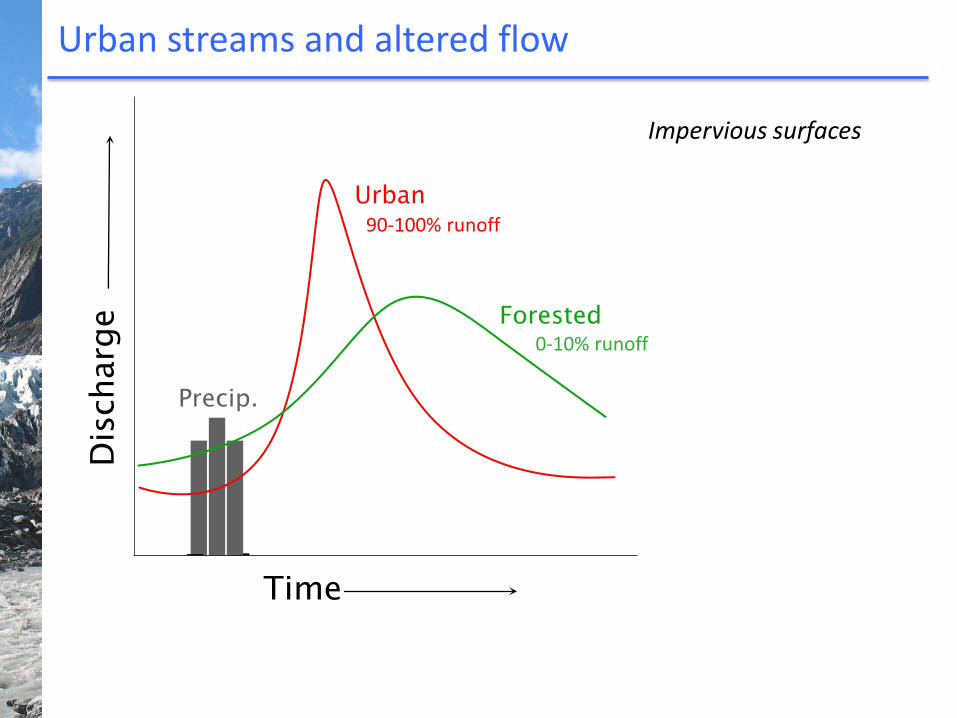
Urban streams and altered flow
Impervious surfaces
0-10% runoff
90-100% runoff
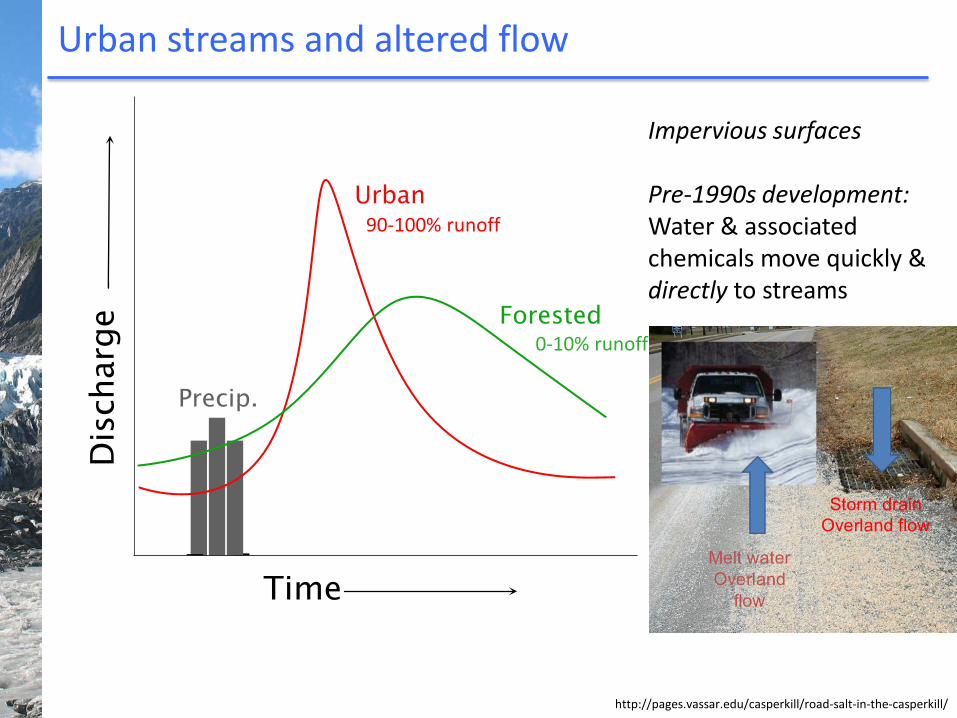
Urban streams and altered flow
Impervious surfaces Pre-1990s development: Water & associated chemicals move quickly & directly to streams
http://pages.vassar.edu/casperkill/road-salt-in-the-casperkill/
0-10% runoff
90-100% runoff
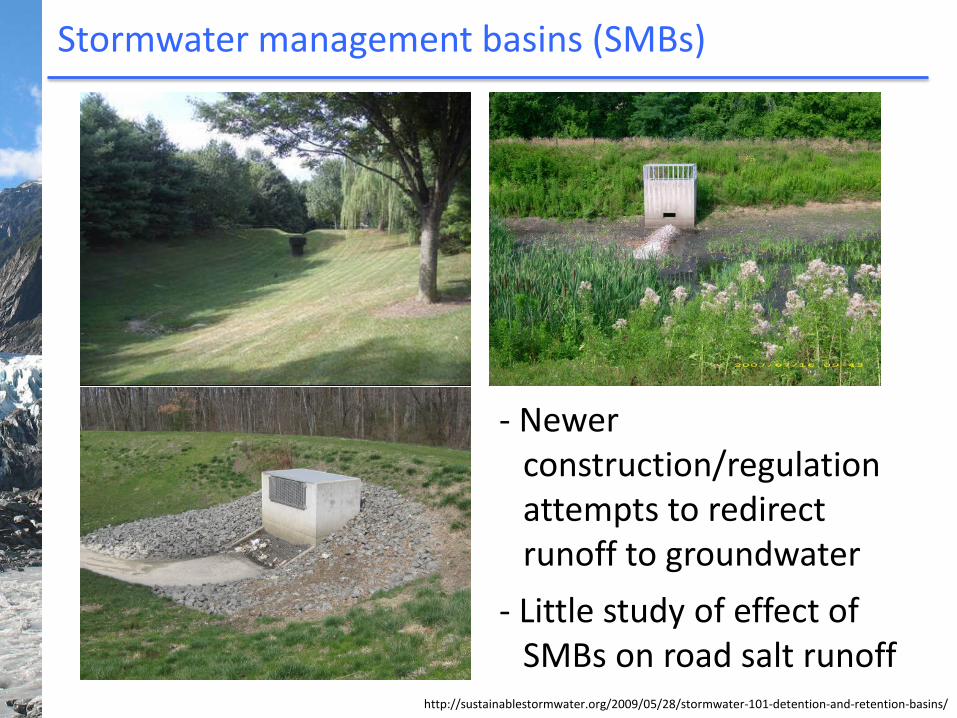
Stormwater management basins (SMBs)
http://sustainablestormwater.org/2009/05/28/stormwater-101-detention-and-retention-basins/
- Newer construction/regulation attempts to redirect runoff to groundwater
- Little study of effect of SMBs on road salt runoff
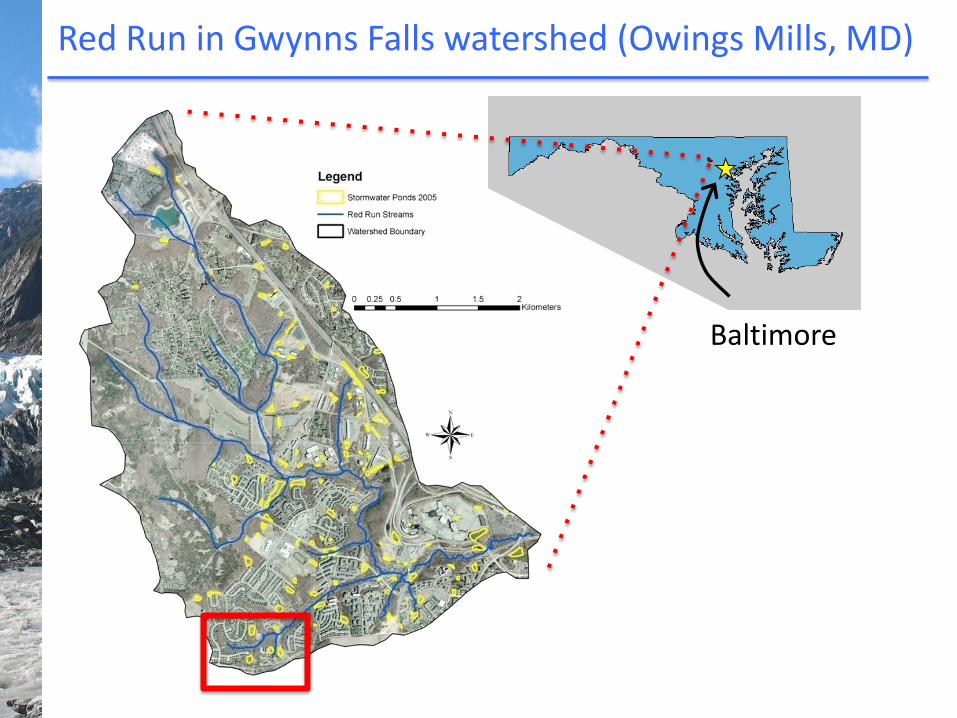
Baltimore
Red Run in Gwynns Falls watershed (Owings Mills, MD)
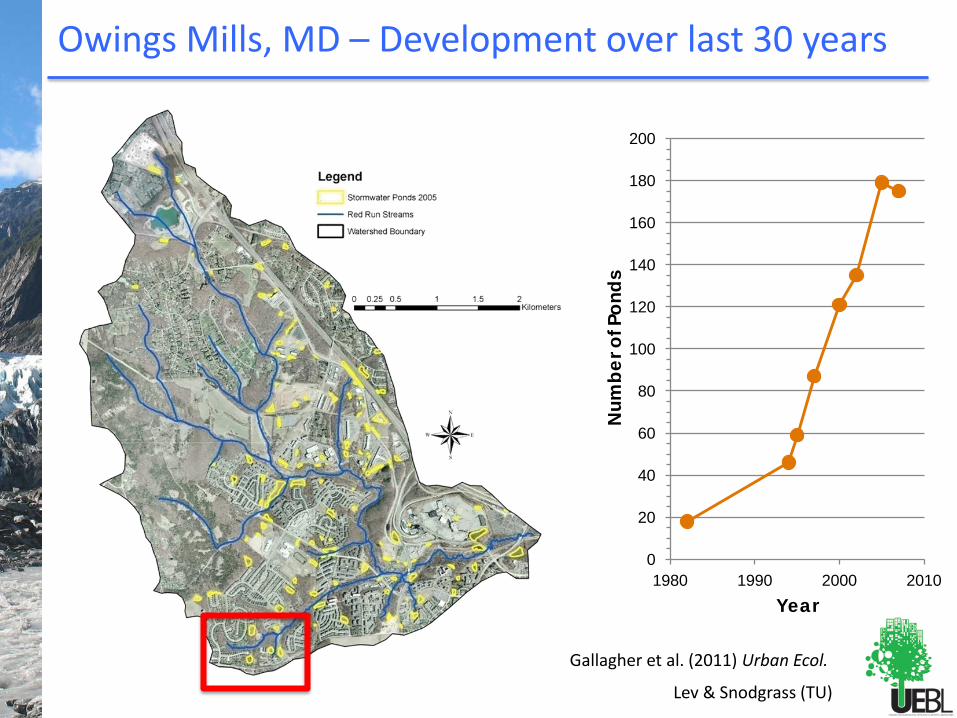
Owings Mills, MD – Development over last 30 years
0
20
40
60
80
100
120
140
160
180
200
1980 1990 2000 2010
Num
ber o
f Pon
ds
Year
Lev & Snodgrass (TU)
Gallagher et al. (2011) Urban Ecol.
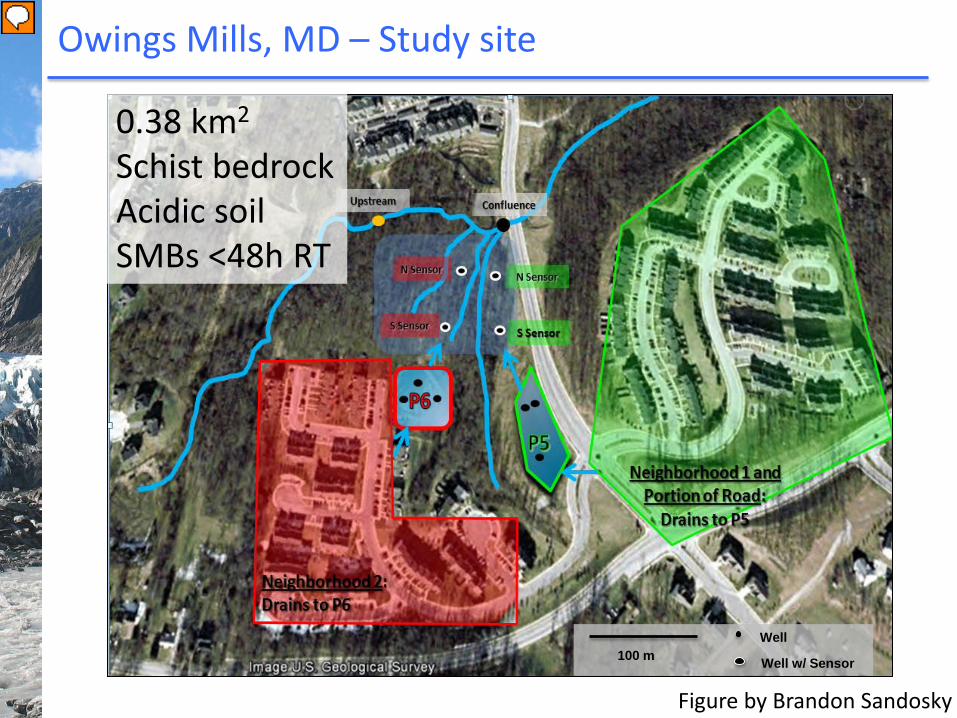
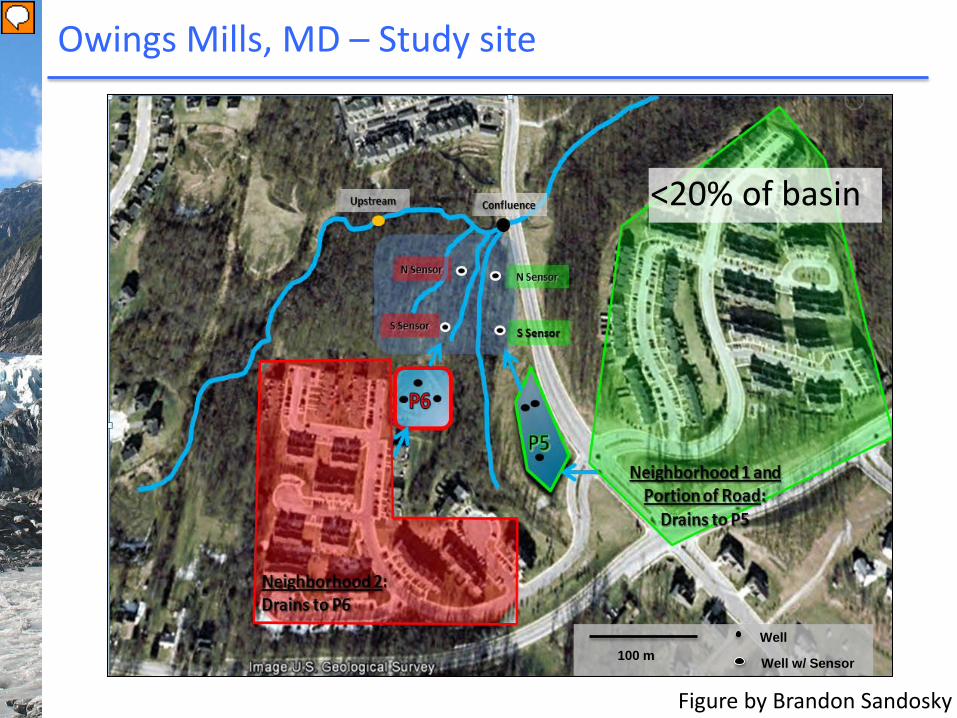
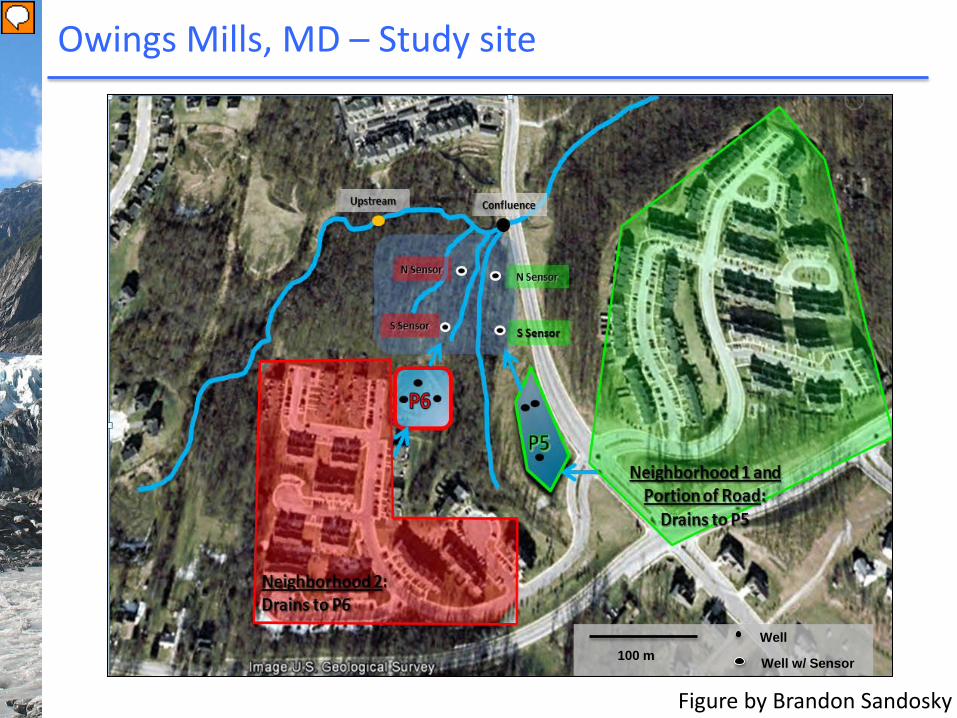
Owings Mills, MD – Study site
Well
Well w/ Sensor 100 m
0.38 km2 Schist bedrock Acidic soil SMBs <48h RT
Figure by Brandon Sandosky
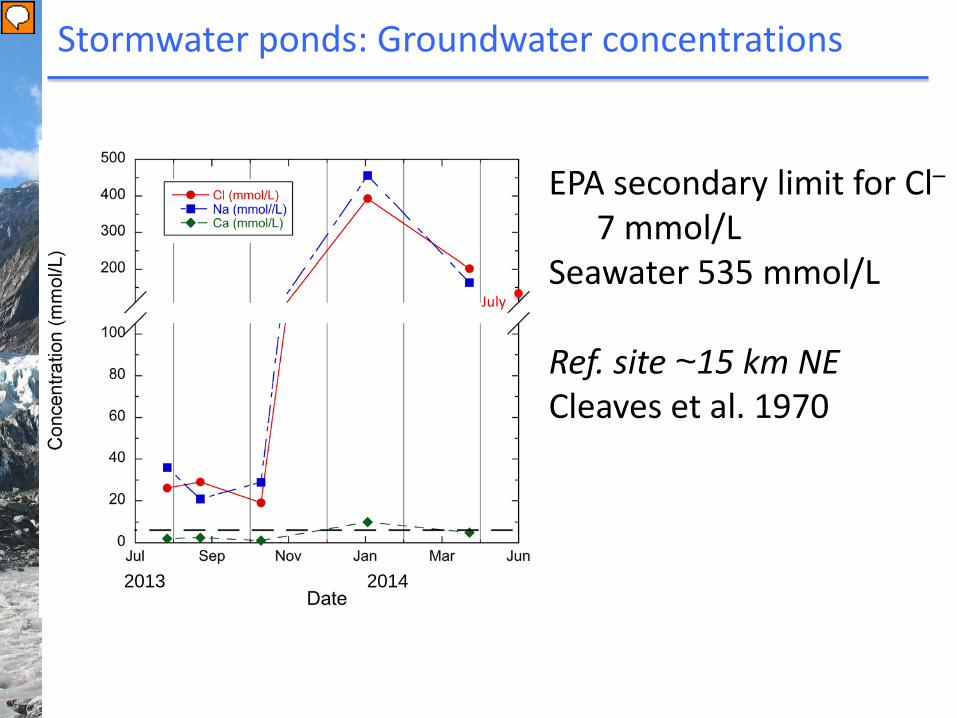
Stormwater ponds: Groundwater concentrations
EPA secondary limit for Cl– 7 mmol/L Seawater 535 mmol/L Ref. site ~15 km NE Cleaves et al. 1970
2013 2014
July
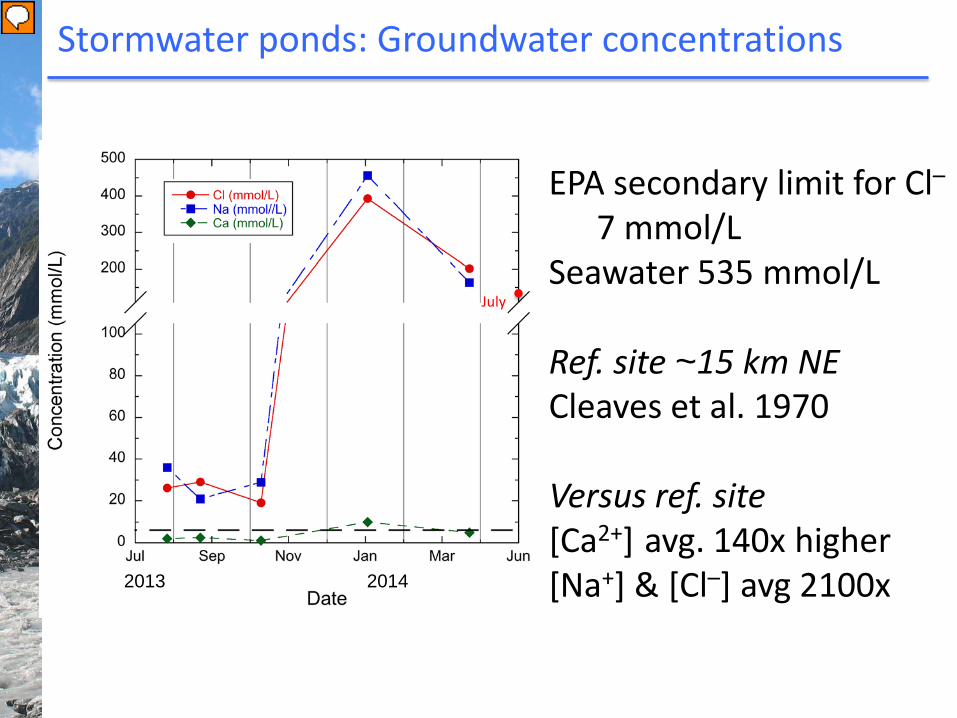
Stormwater ponds: Groundwater concentrations
EPA secondary limit for Cl– 7 mmol/L Seawater 535 mmol/L Ref. site ~15 km NE Cleaves et al. 1970 Versus ref. site [Ca2+] avg. 140x higher [Na+] & [Cl–] avg 2100x 2013 2014
July
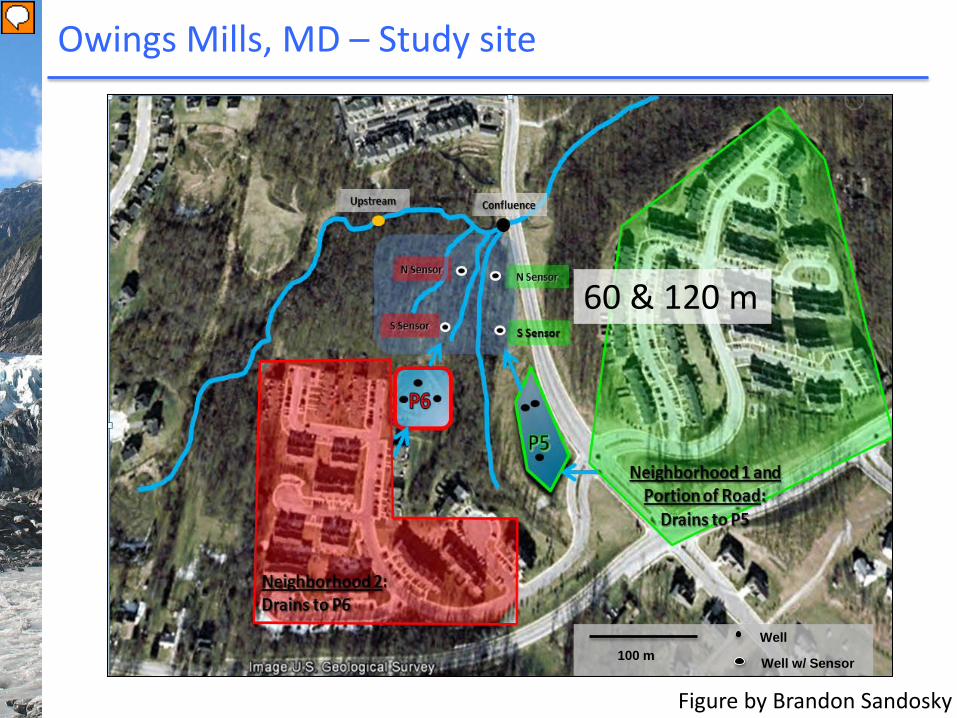
Owings Mills, MD – Study site
Well
Well w/ Sensor 100 m
60 & 120 m
Figure by Brandon Sandosky
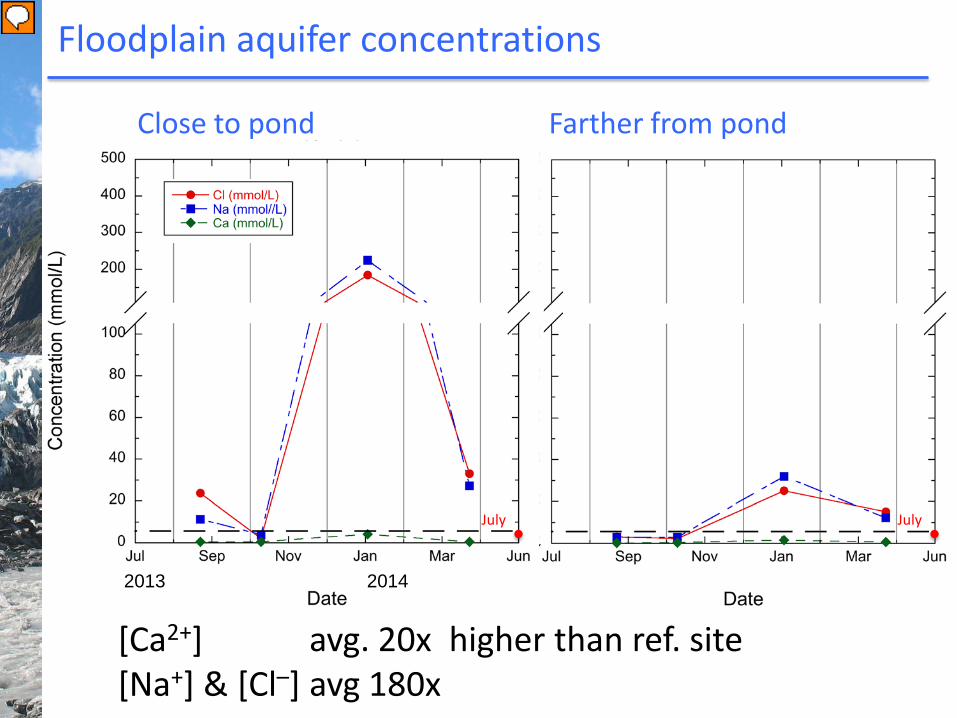
Floodplain aquifer concentrations
Close to pond
[Ca2+] avg. 20x higher than ref. site [Na+] & [Cl–] avg 180x
Farther from pond
2013 2014
July July
Owings Mills, MD – Study site
Well
Well w/ Sensor 100 m
<20% of basin
Figure by Brandon Sandosky
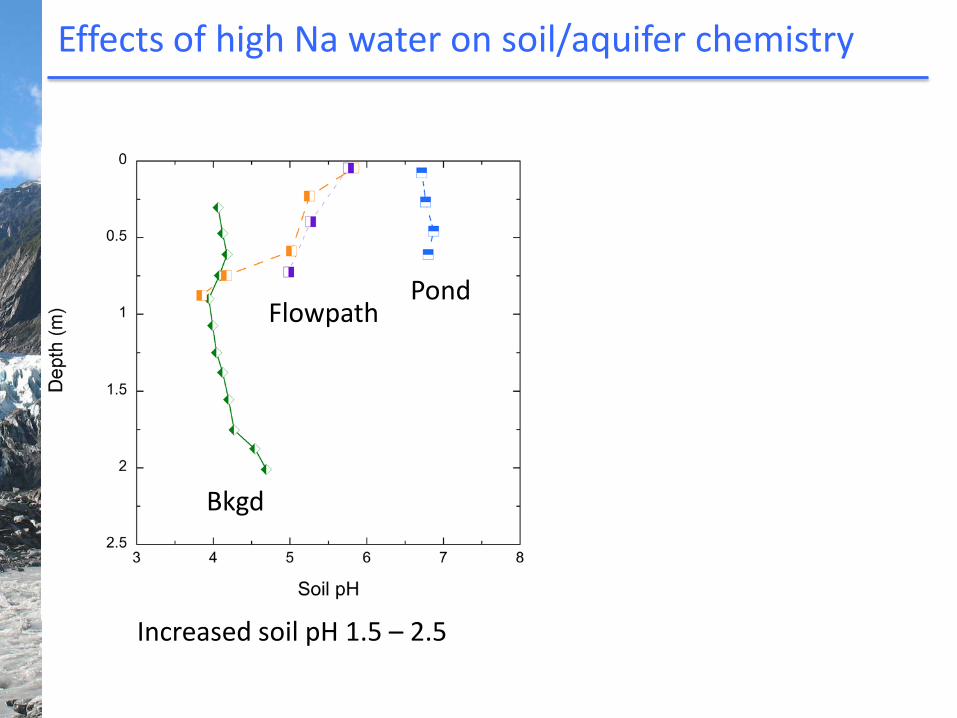
Effects of high Na water on soil/aquifer chemistry
Bkgd
Pond Flowpath
Increased soil pH 1.5 – 2.5
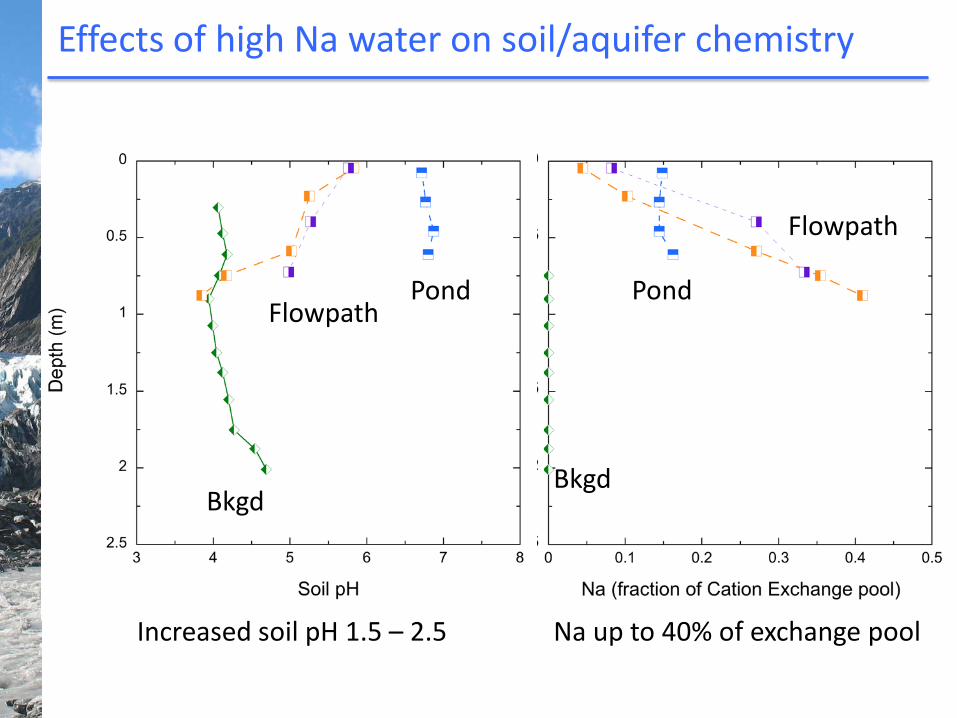
Effects of high Na water on soil/aquifer chemistry
Bkgd
Pond Flowpath
Bkgd
Pond
Flowpath
Increased soil pH 1.5 – 2.5 Na up to 40% of exchange pool
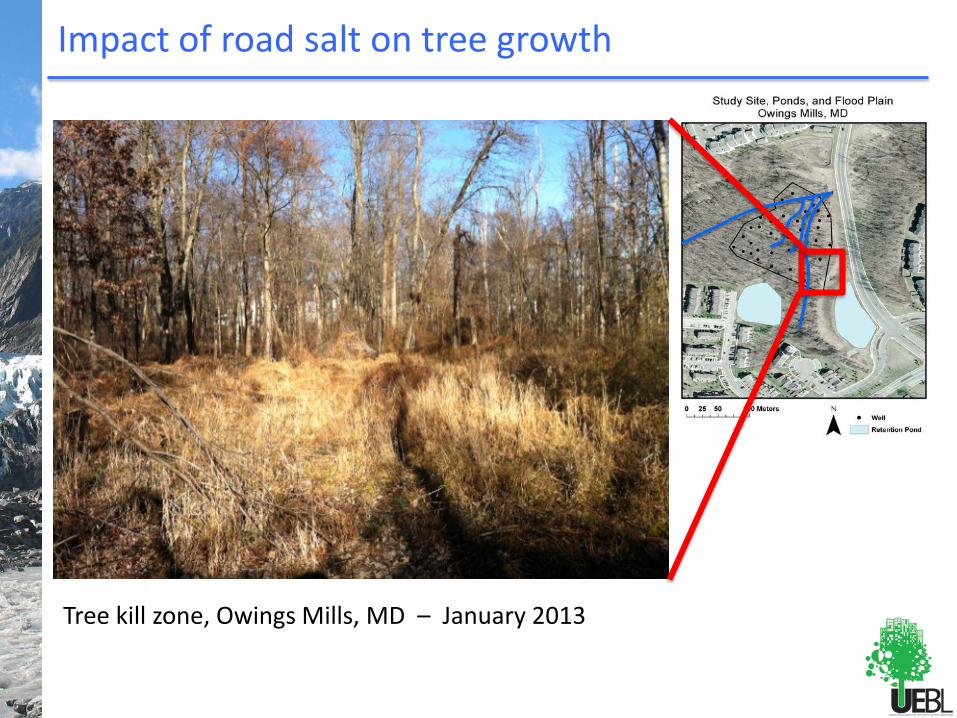
Impact of road salt on tree growth
Tree kill zone, Owings Mills, MD – January 2013
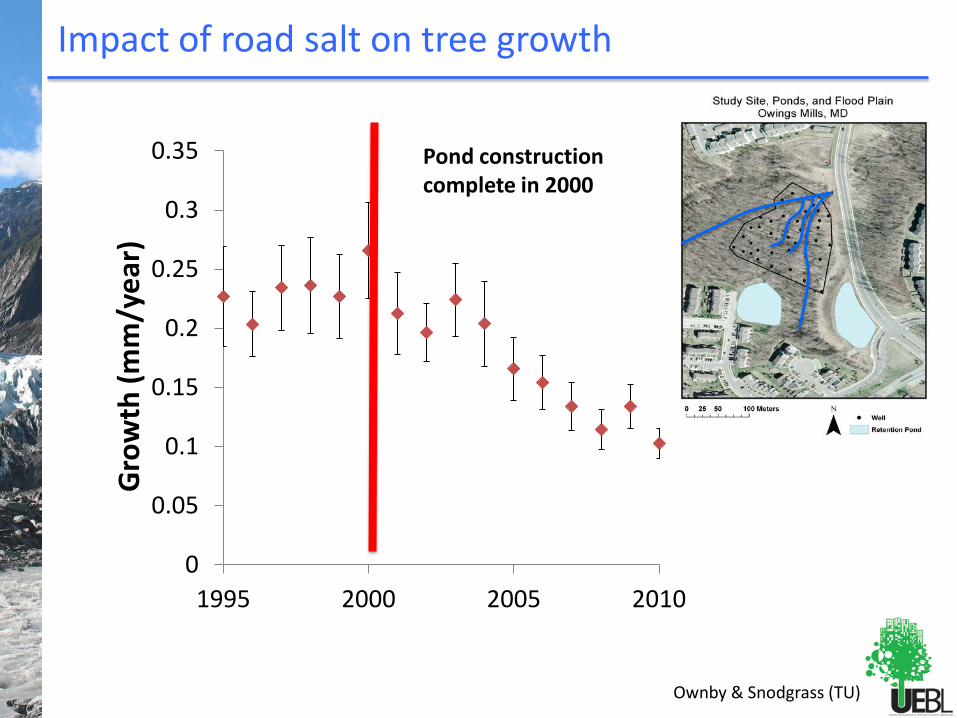
Impact of road salt on tree growth
Ownby & Snodgrass (TU)
0
0.05
0.1
0.15
0.2
0.25
0.3
0.35
1995 2000 2005 2010
Gro
wth
(mm
/yea
r)
Pond construction complete in 2000
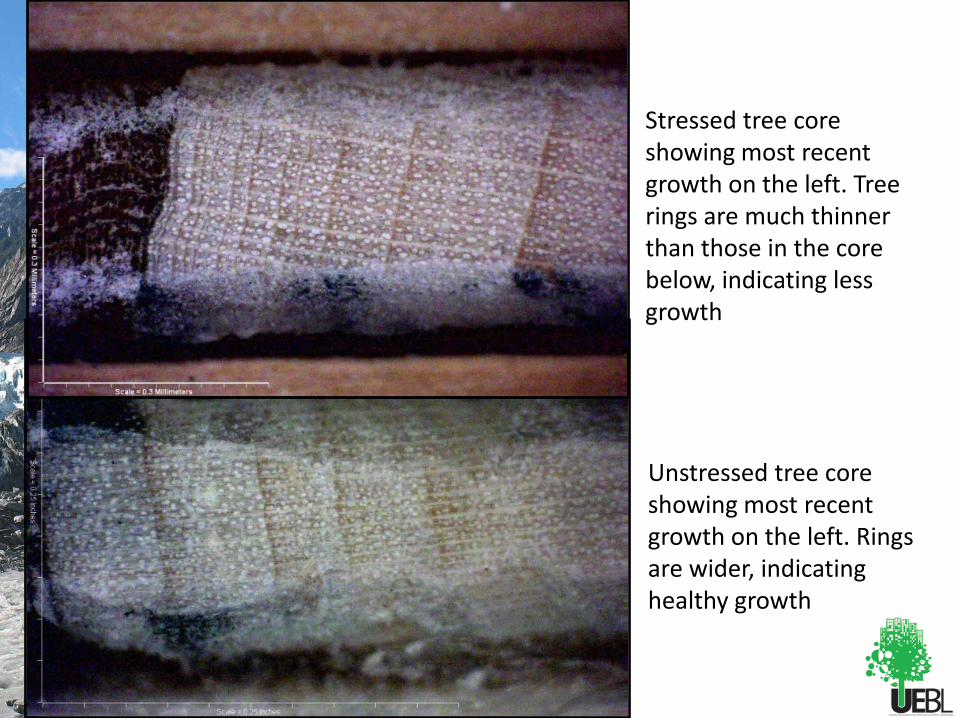
Stressed tree core showing most recent growth on the left. Tree rings are much thinner than those in the core below, indicating less growth
Unstressed tree core showing most recent growth on the left. Rings are wider, indicating healthy growth
Owings Mills, MD – Study site
Well
Well w/ Sensor 100 m
Figure by Brandon Sandosky
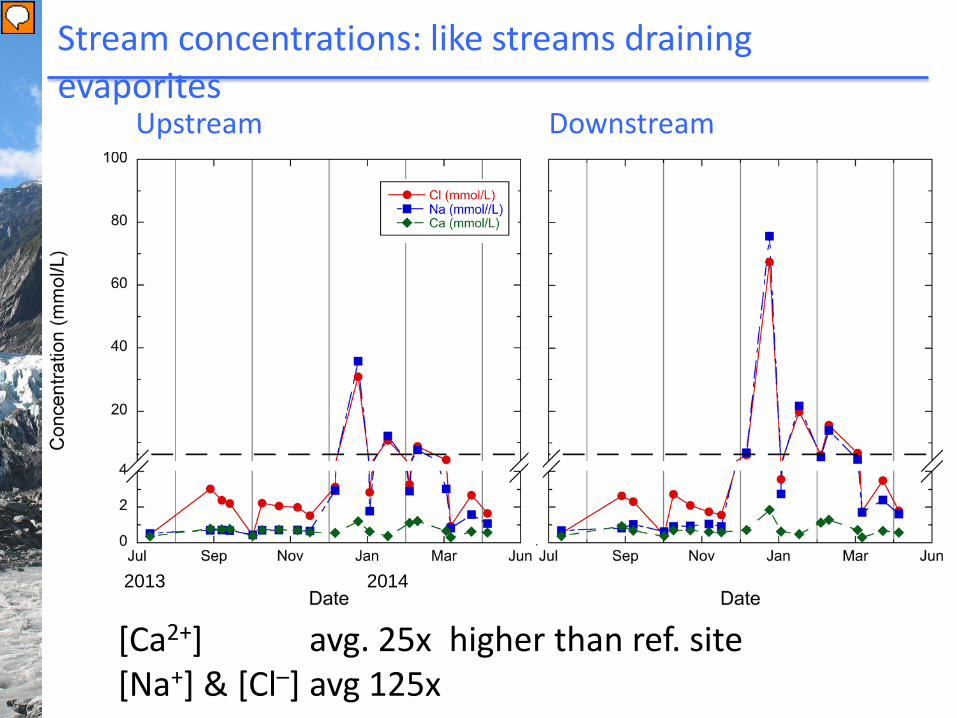
Stream concentrations: like streams draining evaporites
Downstream Upstream
[Ca2+] avg. 25x higher than ref. site [Na+] & [Cl–] avg 125x
2013 2014
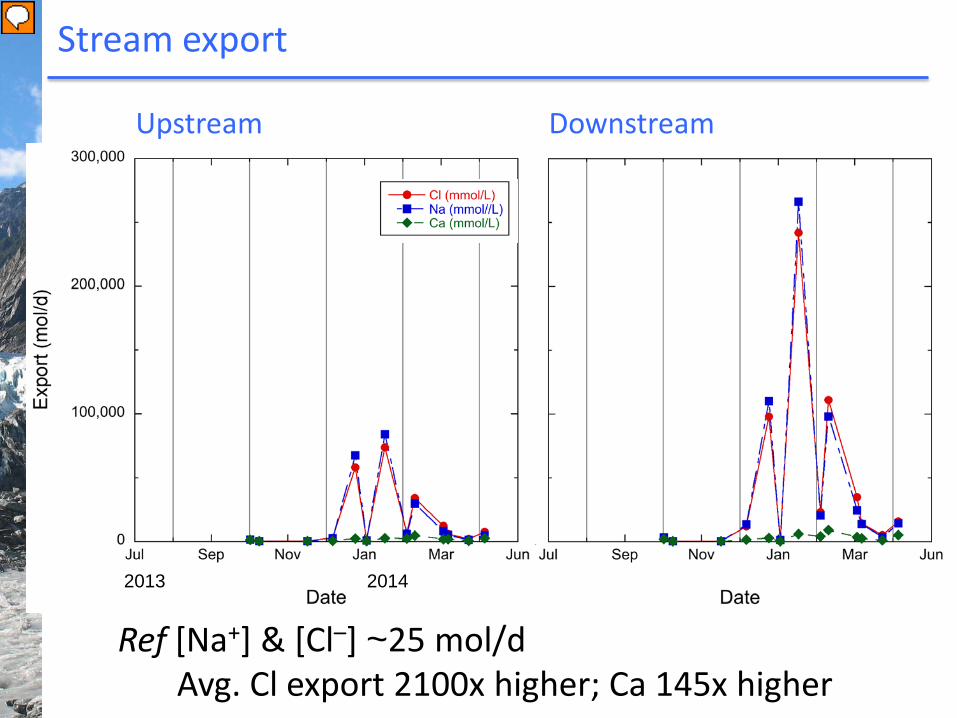
Stream export
Downstream Upstream
2013 2014
Ref [Na+] & [Cl–] ~25 mol/d Avg. Cl export 2100x higher; Ca 145x higher
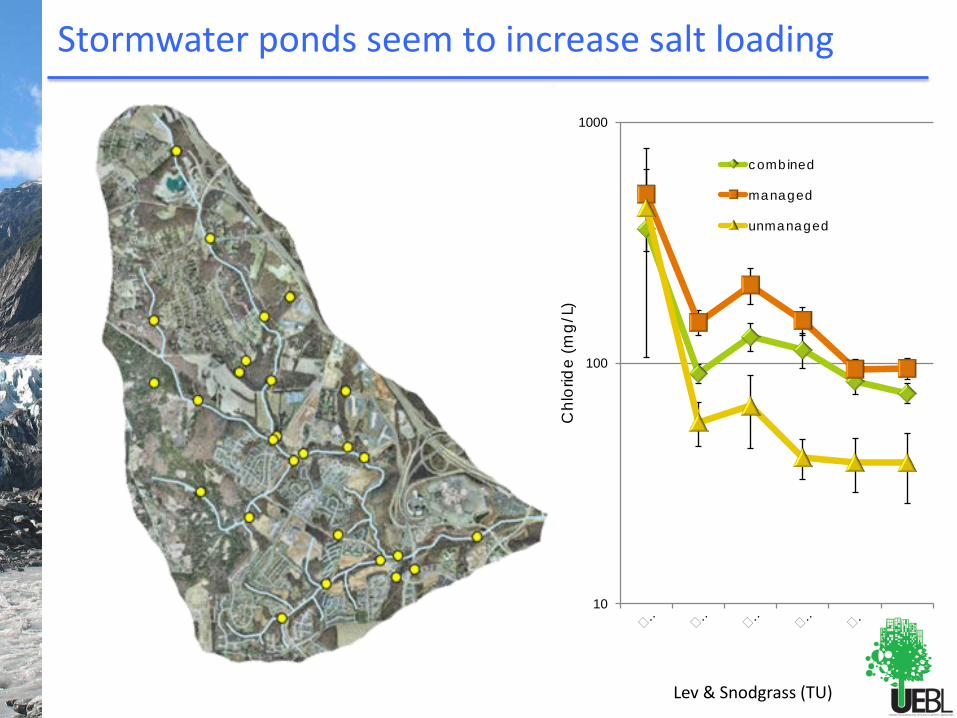
Stormwater ponds seem to increase salt loading
10
100
1000
Chl
orid
e (m
g/L)
combined
managed
unmanaged
Lev & Snodgrass (TU)
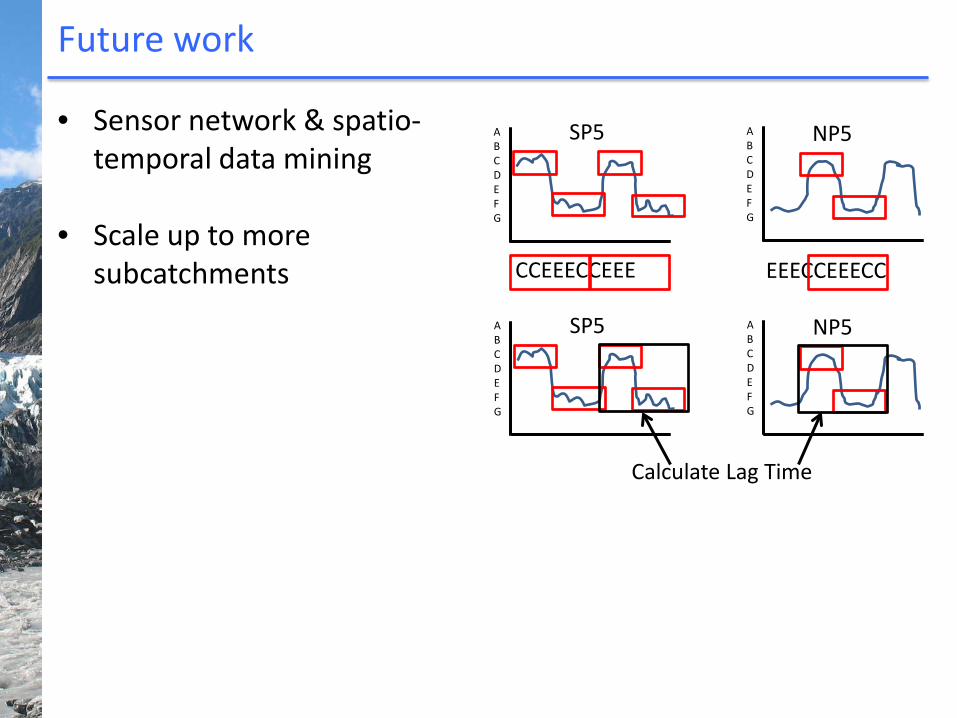
Future work
A B C D E F G
A B C D E F G
SP5 NP5
CCEEECCEEE EEECCEEECC
A B C D E F G
A B C D E F G
SP5 NP5
Calculate Lag Time
• Sensor network & spatio-temporal data mining
• Scale up to more
subcatchments
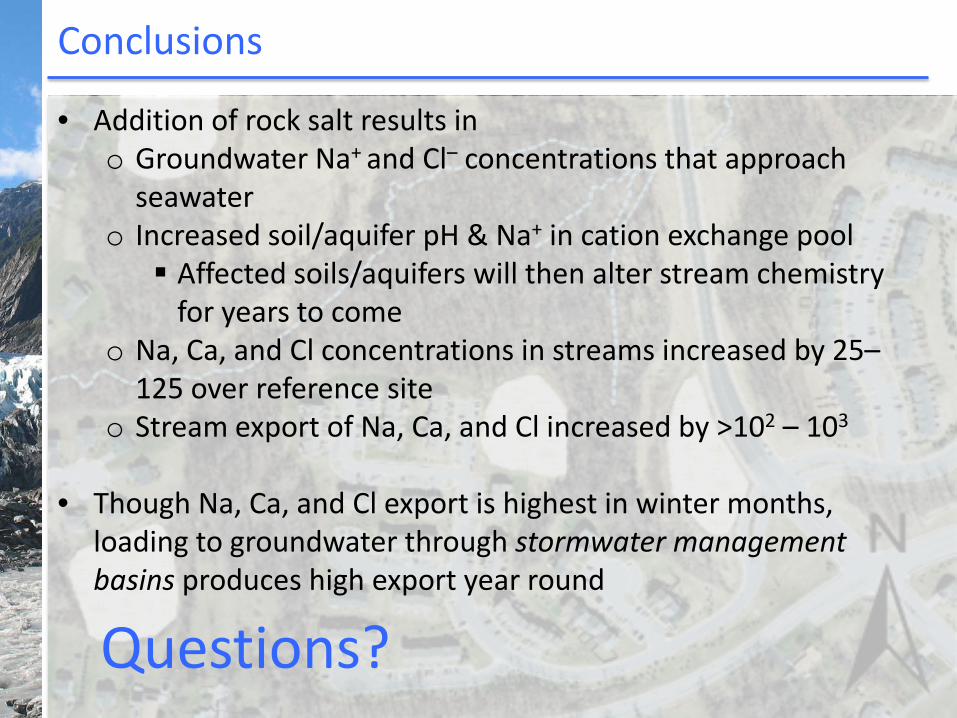
Conclusions
• Addition of rock salt results in o Groundwater Na+ and Cl– concentrations that approach
seawater o Increased soil/aquifer pH & Na+ in cation exchange pool Affected soils/aquifers will then alter stream chemistry
for years to come o Na, Ca, and Cl concentrations in streams increased by 25–
125 over reference site o Stream export of Na, Ca, and Cl increased by >102 – 103
• Though Na, Ca, and Cl export is highest in winter months,
loading to groundwater through stormwater management basins produces high export year round Questions?
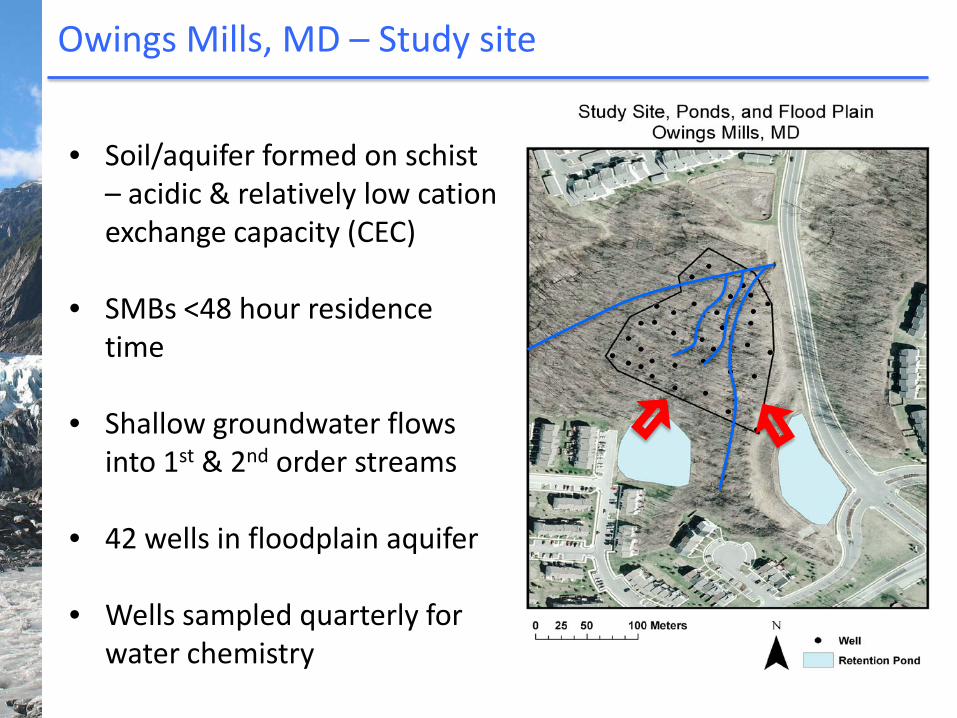
Owings Mills, MD – Study site
• Soil/aquifer formed on schist – acidic & relatively low cation exchange capacity (CEC)
• SMBs <48 hour residence time
• Shallow groundwater flows into 1st & 2nd order streams
• 42 wells in floodplain aquifer
• Wells sampled quarterly for water chemistry
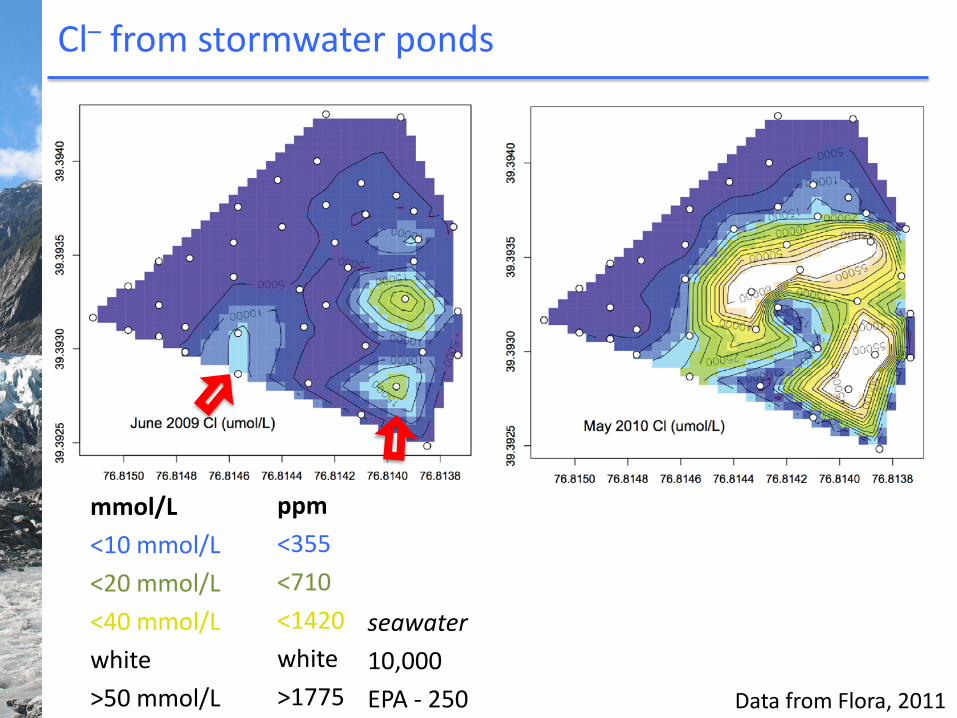
Cl– from stormwater ponds
mmol/L <10 mmol/L <20 mmol/L <40 mmol/L white >50 mmol/L Data from Flora, 2011
ppm <355 <710 <1420 white >1775
seawater 10,000 EPA - 250
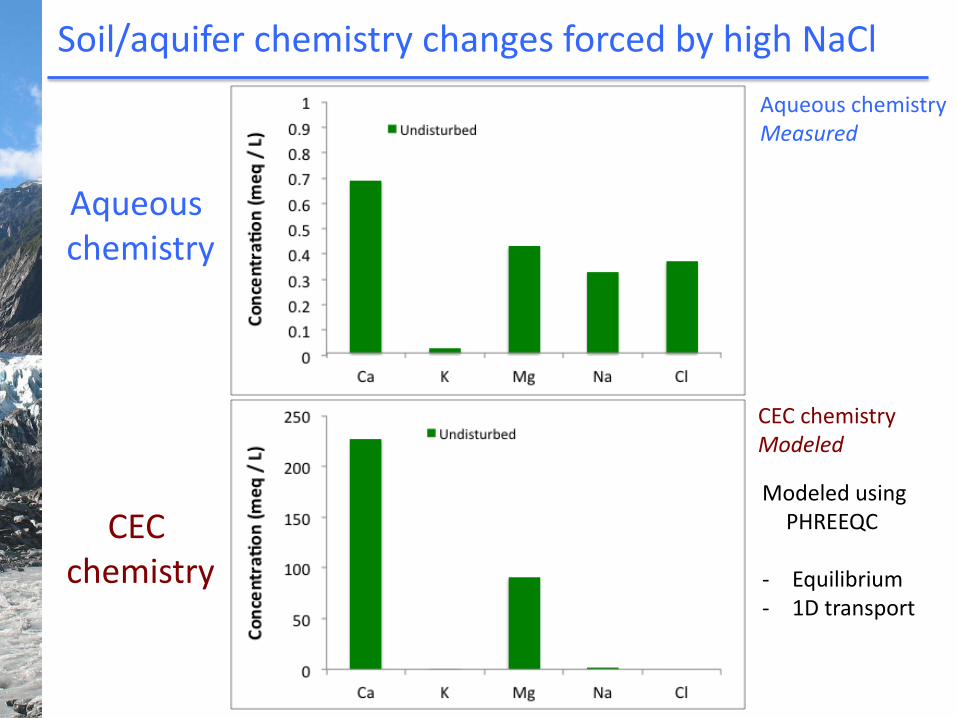
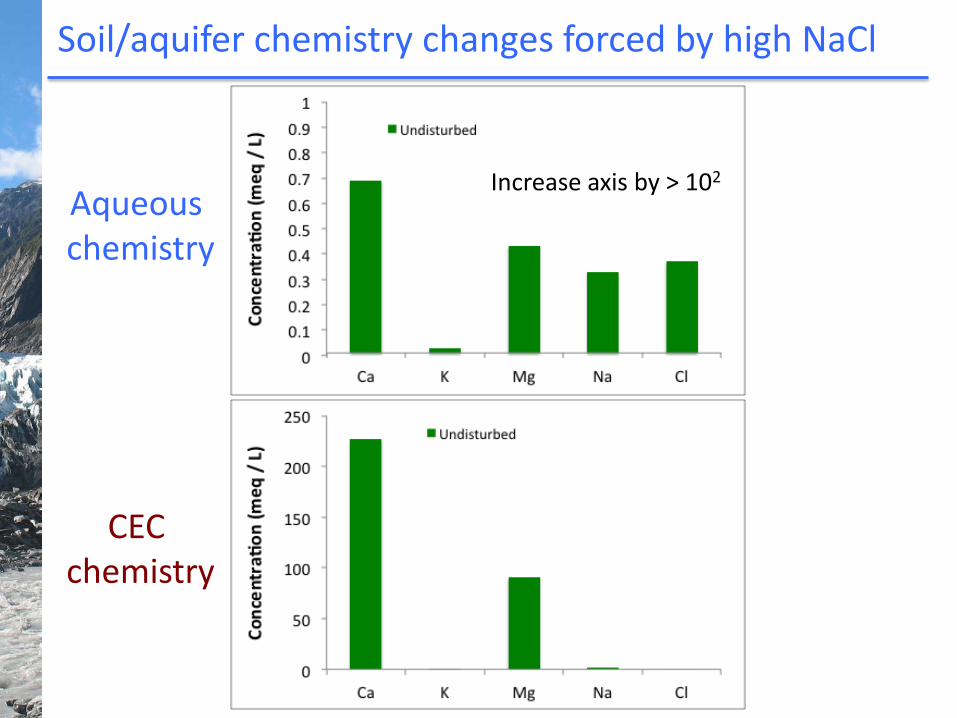
Soil/aquifer chemistry changes forced by high NaCl
Aqueous chemistry
CEC chemistry
Aqueous chemistry Measured
CEC chemistry Modeled
Modeled using PHREEQC
- Equilibrium - 1D transport
Soil/aquifer chemistry changes forced by high NaCl
Aqueous chemistry
CEC chemistry
Increase axis by > 102
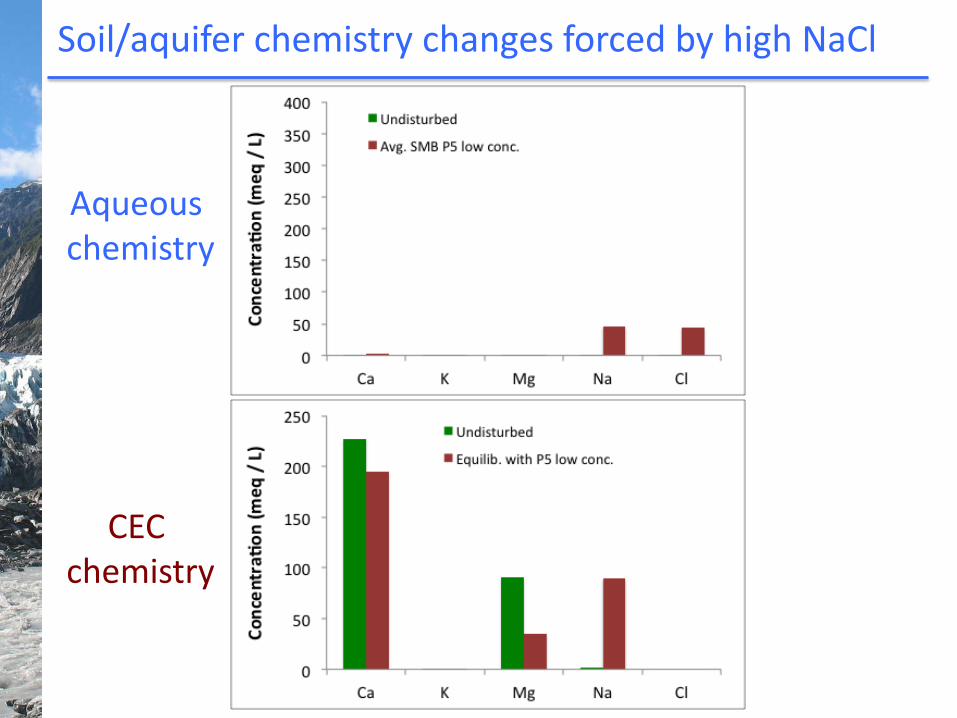
Soil/aquifer chemistry changes forced by high NaCl
Aqueous chemistry
CEC chemistry
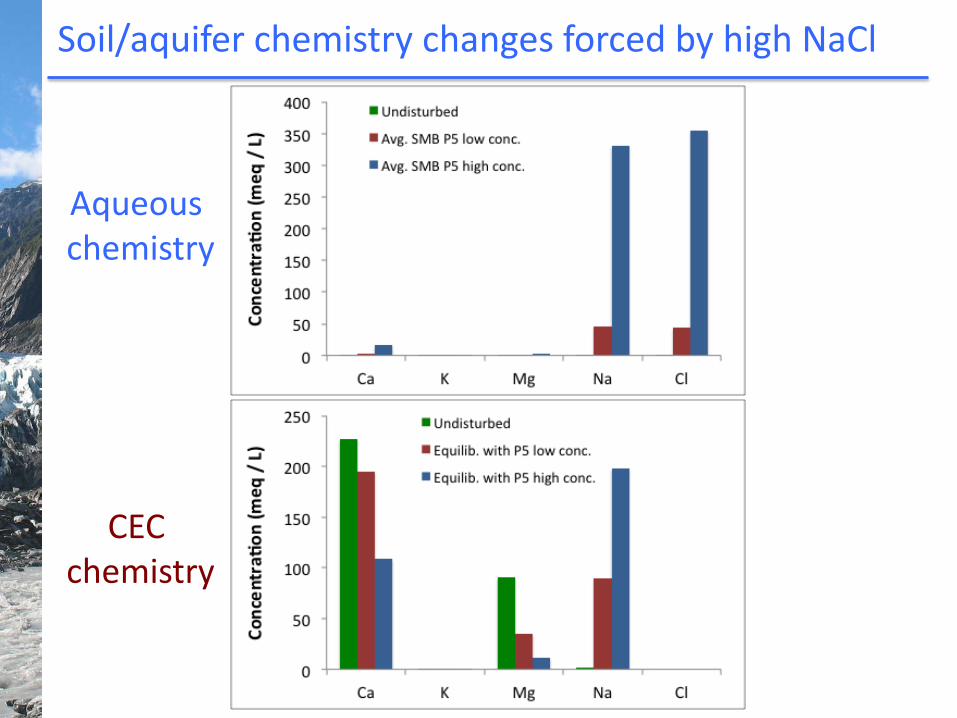
Soil/aquifer chemistry changes forced by high NaCl
Aqueous chemistry
CEC chemistry
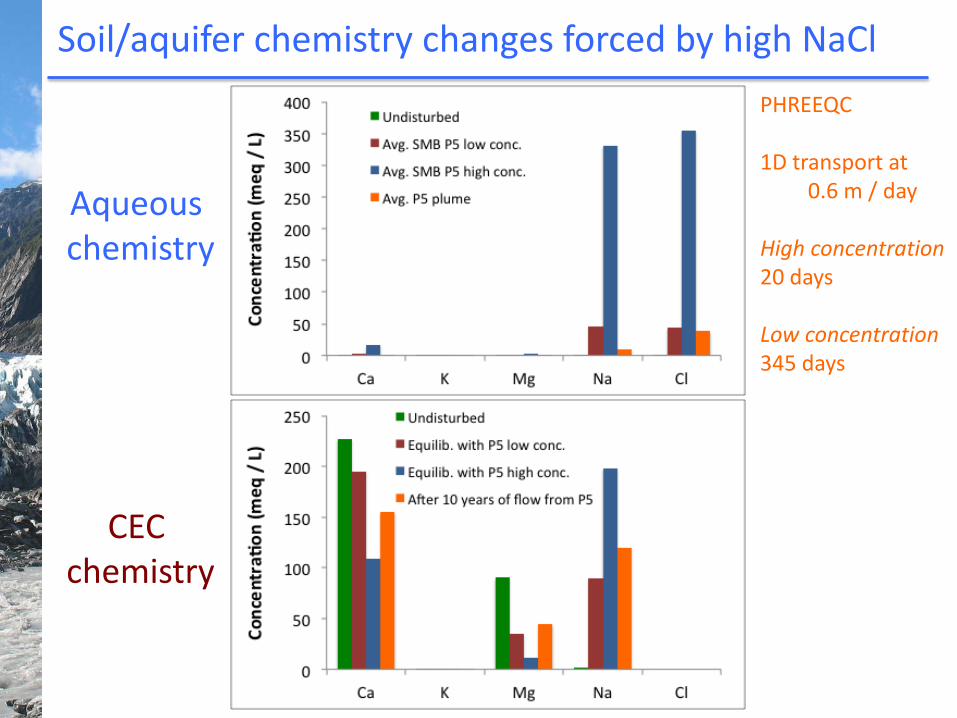
Soil/aquifer chemistry changes forced by high NaCl
Aqueous chemistry
CEC chemistry
PHREEQC 1D transport at 0.6 m / day High concentration 20 days Low concentration 345 days
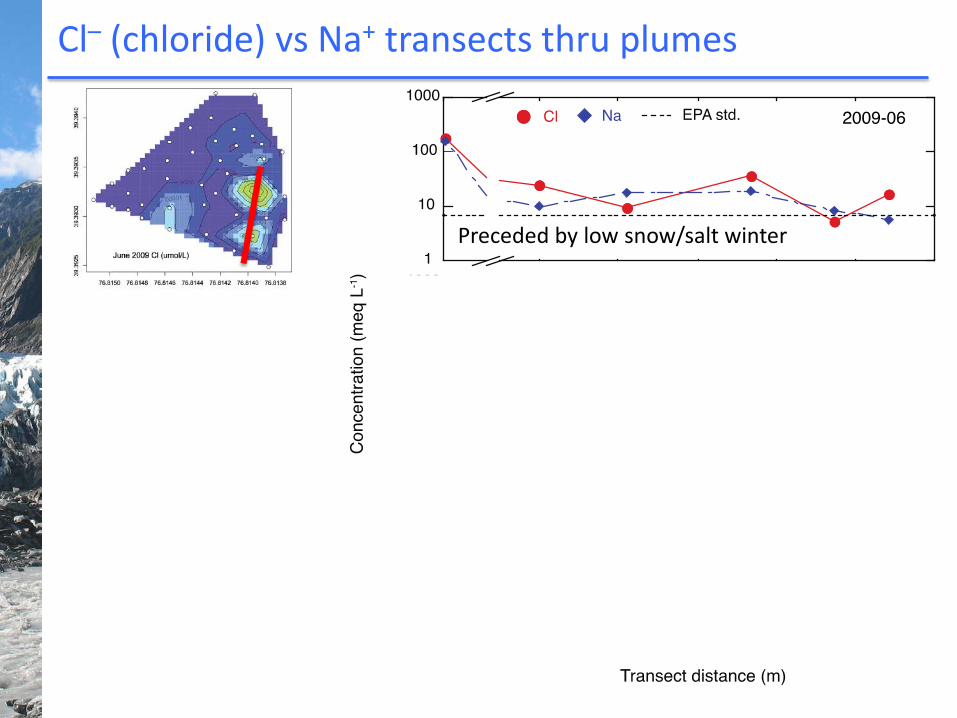
Cl– (chloride) vs Na+ transects thru plumes
Preceded by low snow/salt winter
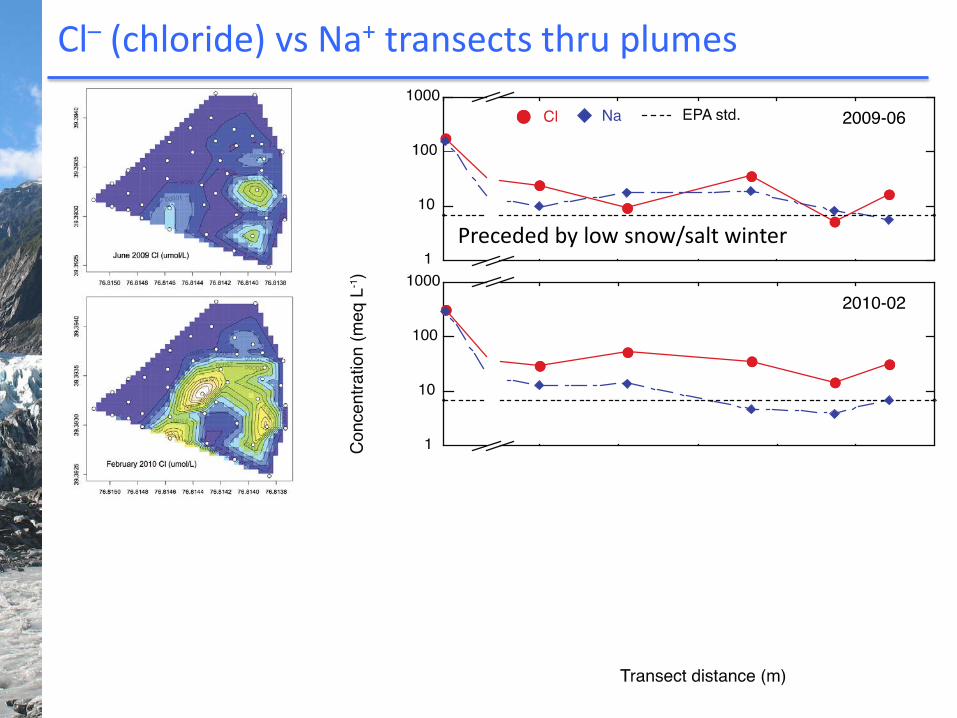
Cl– (chloride) vs Na+ transects thru plumes
Preceded by low snow/salt winter
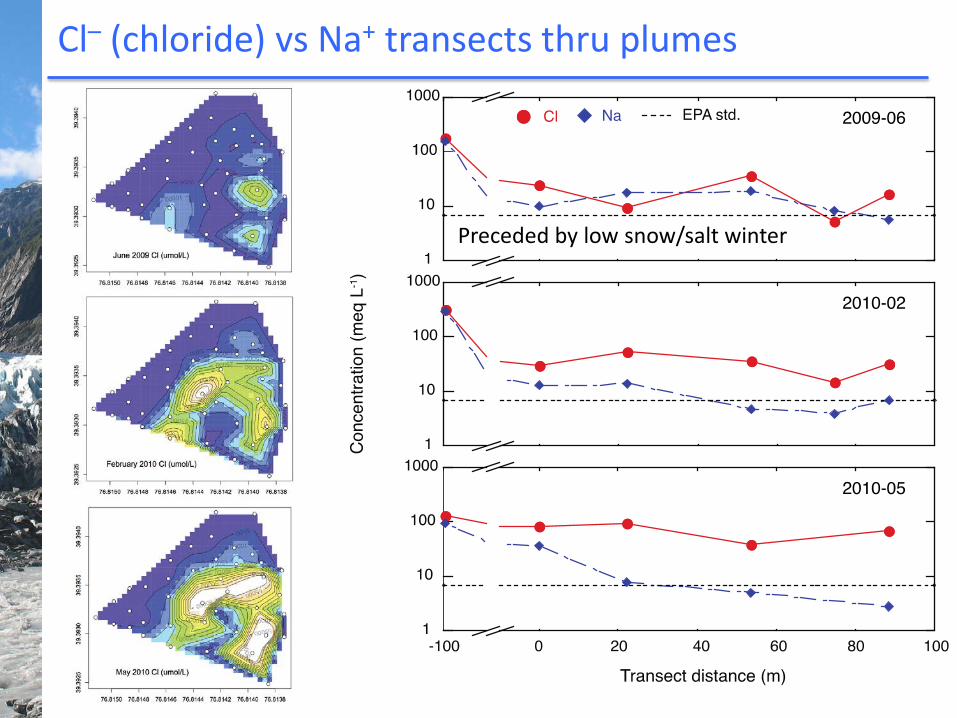
Cl– (chloride) vs Na+ transects thru plumes
Preceded by low snow/salt winter
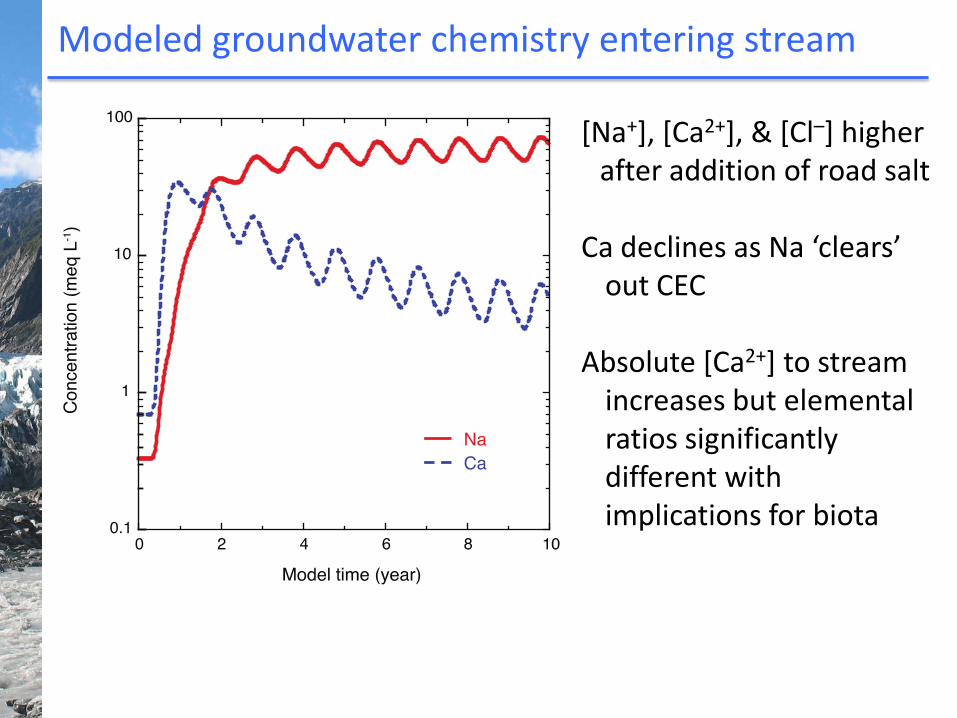
Modeled groundwater chemistry entering stream
[Na+], [Ca2+], & [Cl–] higher after addition of road salt
Ca declines as Na ‘clears’
out CEC Absolute [Ca2+] to stream
increases but elemental ratios significantly different with implications for biota
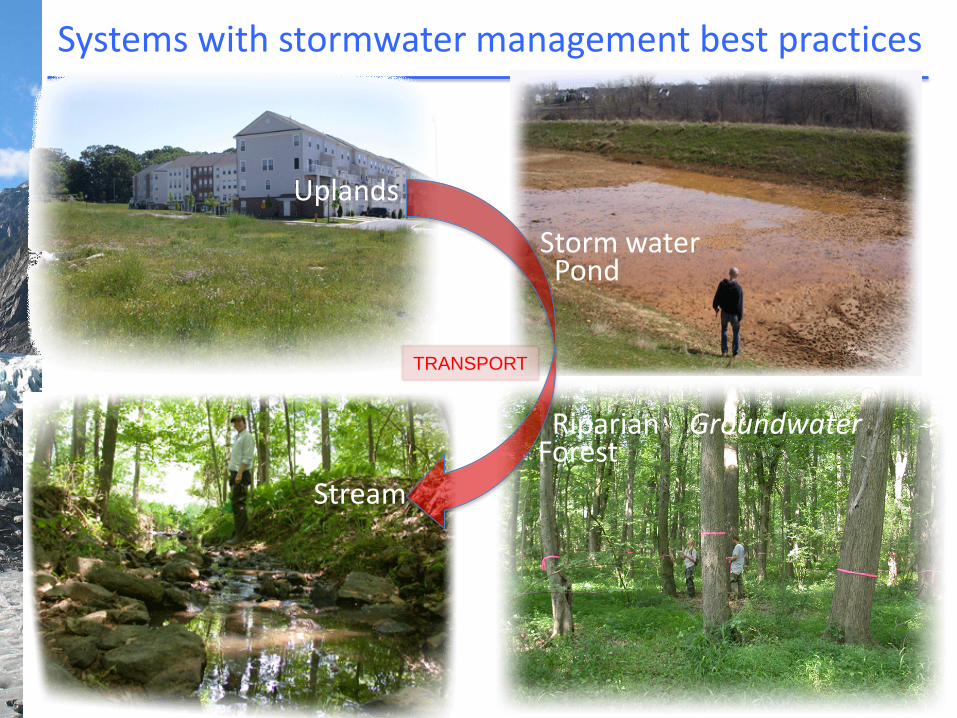
Systems with stormwater management best practices
Uplands
Storm water Pond
Stream
Riparian Forest
TRANSPORT
Groundwater
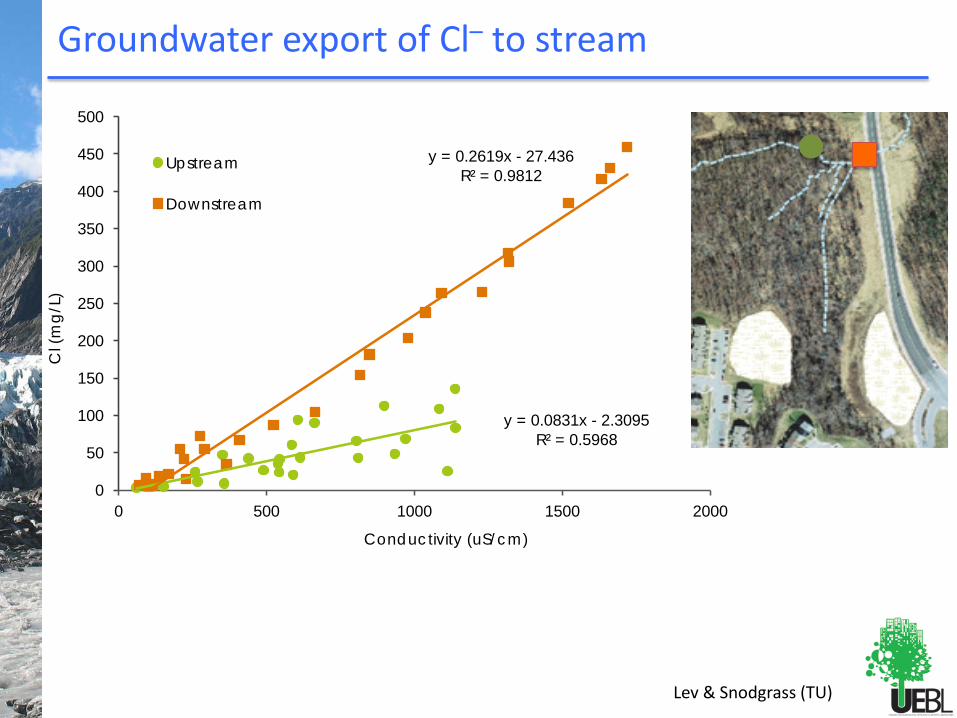
Groundwater export of Cl– to stream
y = 0.0831x - 2.3095 R² = 0.5968
y = 0.2619x - 27.436 R² = 0.9812
0
50
100
150
200
250
300
350
400
450
500
0 500 1000 1500 2000
Cl (
mg/
L)
Conductivity (uS/cm)
Upstream
Downstream
Lev & Snodgrass (TU)
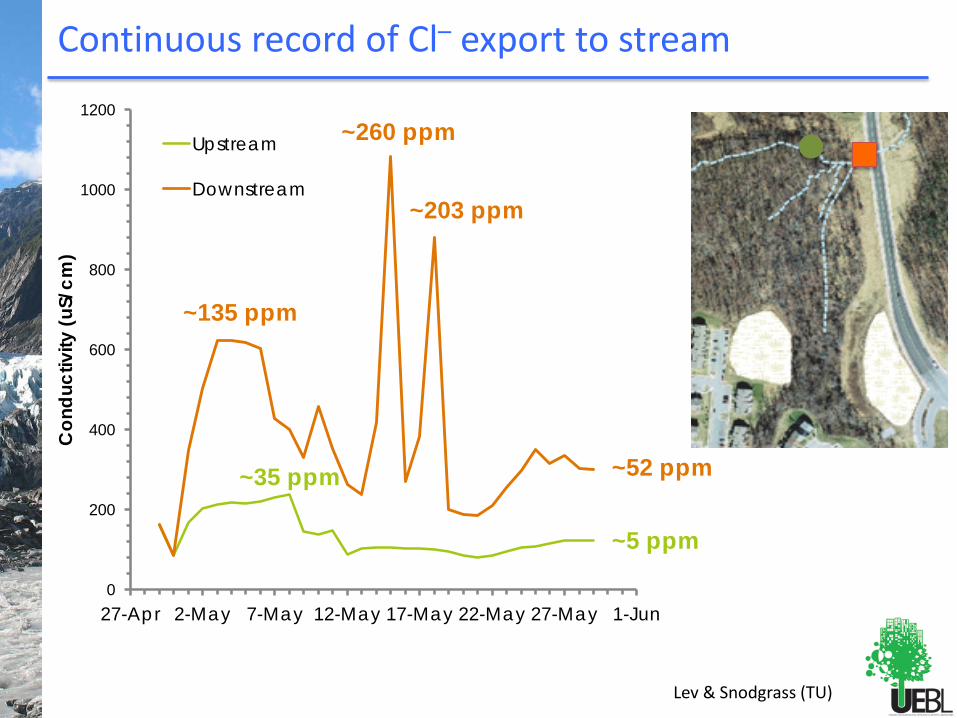
Continuous record of Cl– export to stream
Lev & Snodgrass (TU)
0
200
400
600
800
1000
1200
27-Apr 2-May 7-May 12-May 17-May 22-May 27-May 1-Jun
Con
duct
ivity
(uS/
cm)
Upstream
Downstream
~135 ppm
~260 ppm
~203 ppm
~5 ppm
~52 ppm ~35 ppm