Embed Size (px)
Citation preview
Storms Statistics for Texas"a small portion of"TxDOT RMC-3Research Project0-4194
U.S. Geological Survey
Texas Tech University
Lamar University
University of Houston
Presentation byDr. William H. Asquith,
USGS, Austin
March 18, 2004
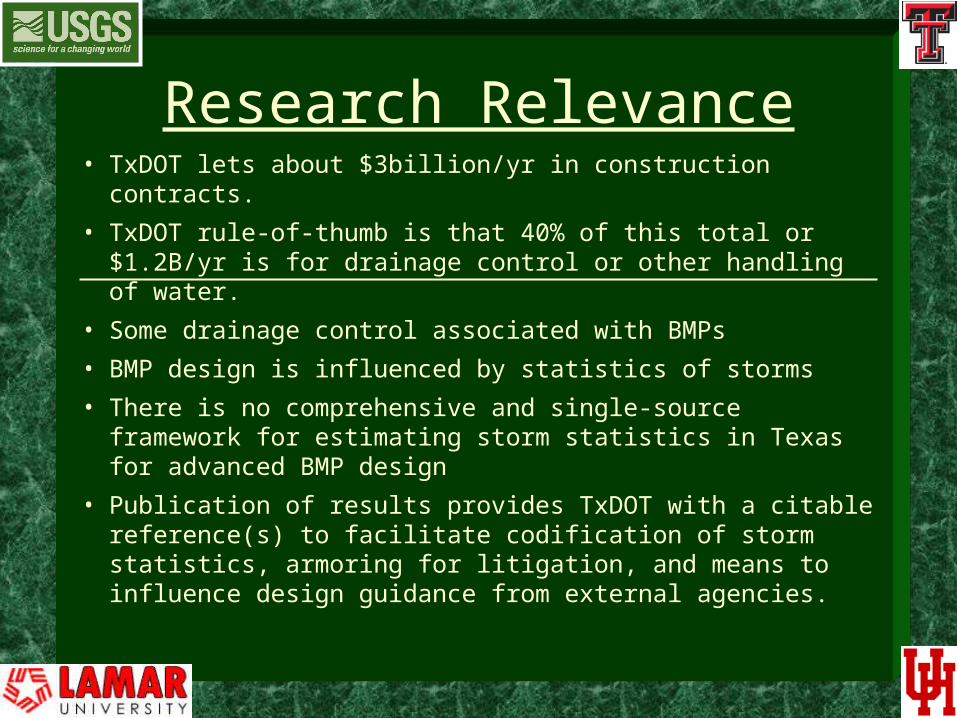
Research Relevance• TxDOT lets about $3billion/yr in construction contracts.
• TxDOT rule-of-thumb is that 40% of this total or $1.2B/yr is for drainage control or other handling of water.
• Some drainage control associated with BMPs
• BMP design is influenced by statistics of storms
• There is no comprehensive and single-source framework for estimating storm statistics in Texas for advanced BMP design
• Publication of results provides TxDOT with a citable reference(s) to facilitate codification of storm statistics, armoring for litigation, and means to influence design guidance from external agencies.
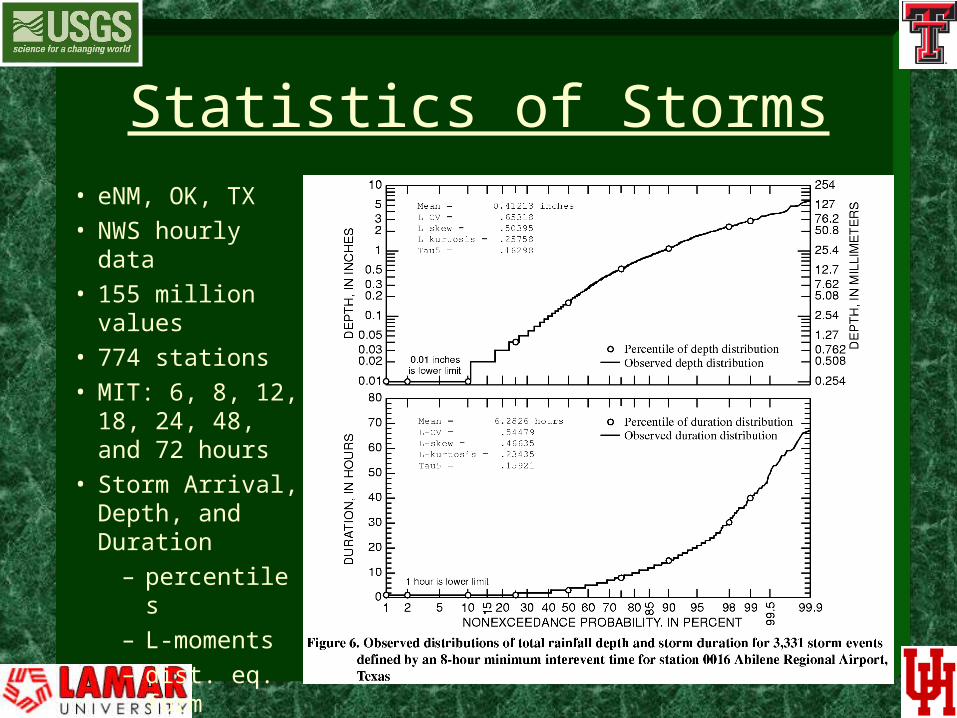
Statistics of Storms• eNM, OK, TX
• NWS hourly data
• 155 million values
• 774 stations
• MIT: 6, 8, 12, 18, 24, 48, and 72 hours
• Storm Arrival, Depth, and Duration
– percentiles
– L-moments
– dist. eq. form
• Hyetographs
– new analysis
• Example Problems
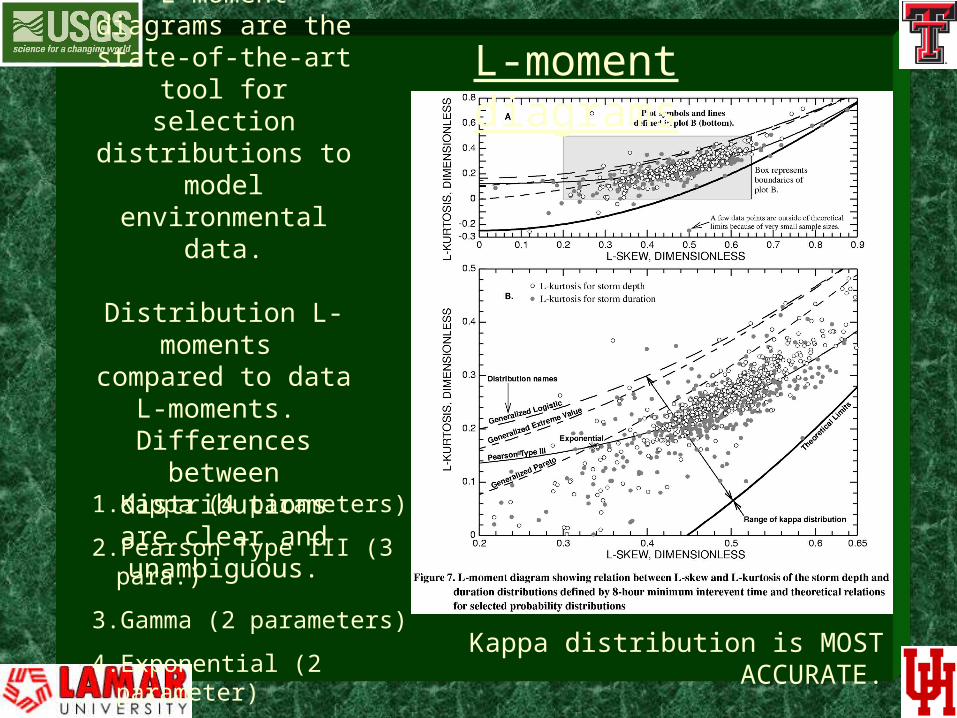
L-moment diagrams are the state-of-the-art tool
for selection distributions to model environmental data.
Distribution L-moments compared to data
L-moments. Differences between distributions are clear
and unambiguous.
L-moment diagrams
1. Kappa (4 parameters)
2. Pearson Type III (3 para.)
3. Gamma (2 parameters)
4. Exponential (2 parameter) Kappa distribution is MOST ACCURATE.
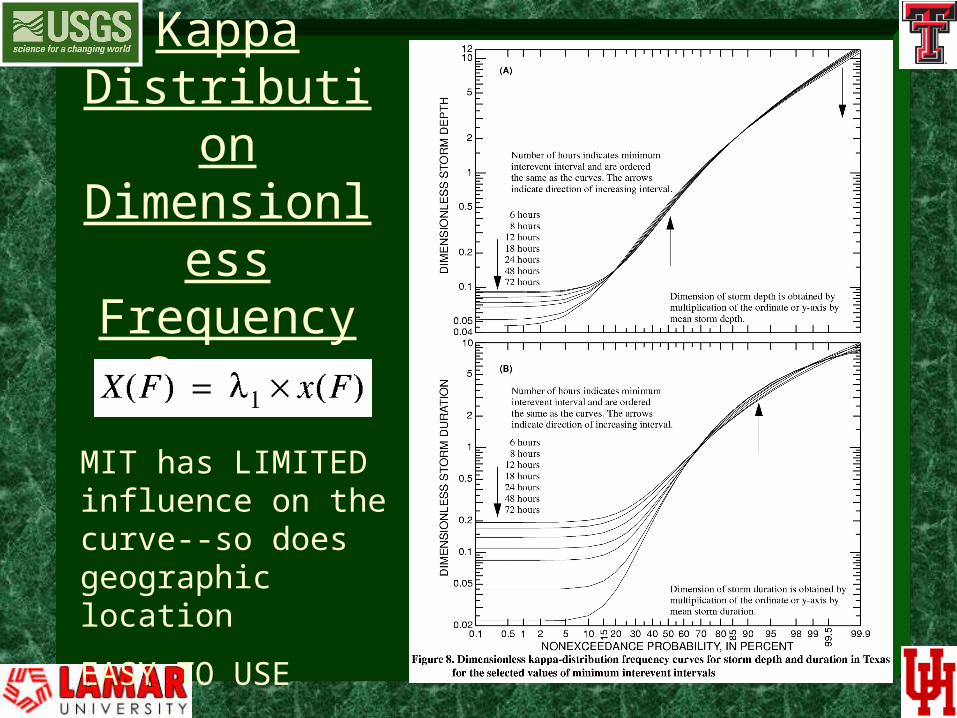
Kappa Distribution
Dimensionless Frequency
Curves
MIT has LIMITED influence on the curve--so does geographic location
EASY TO USE
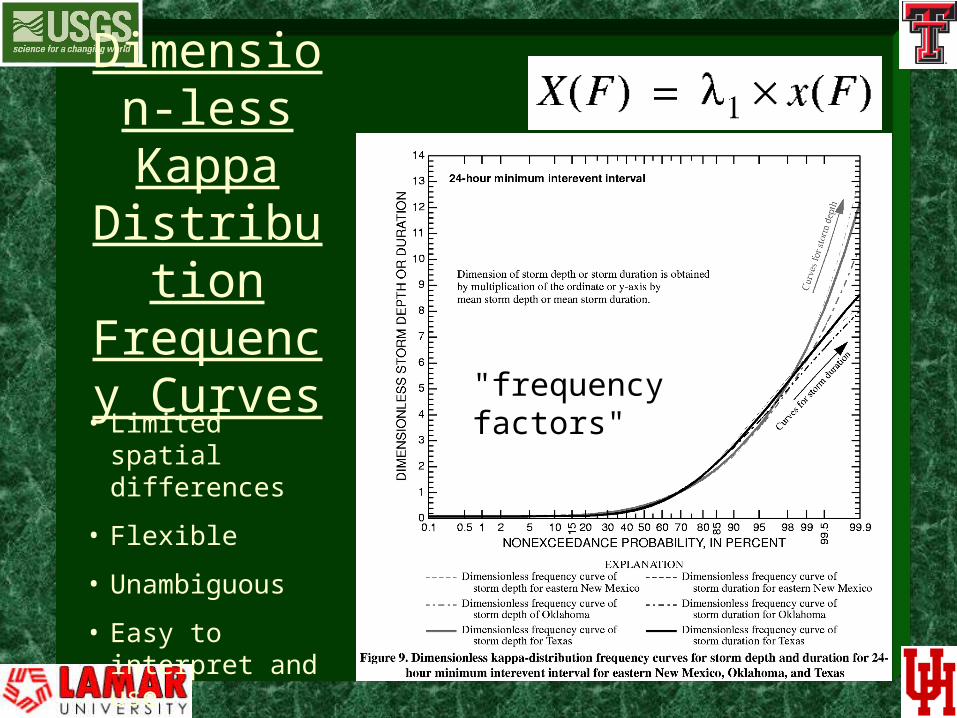
Dimension-less Kappa Distribution Frequency
Curves
• Limited spatial differences
• Flexible
• Unambiguous
• Easy to interpret and use
"frequency factors"
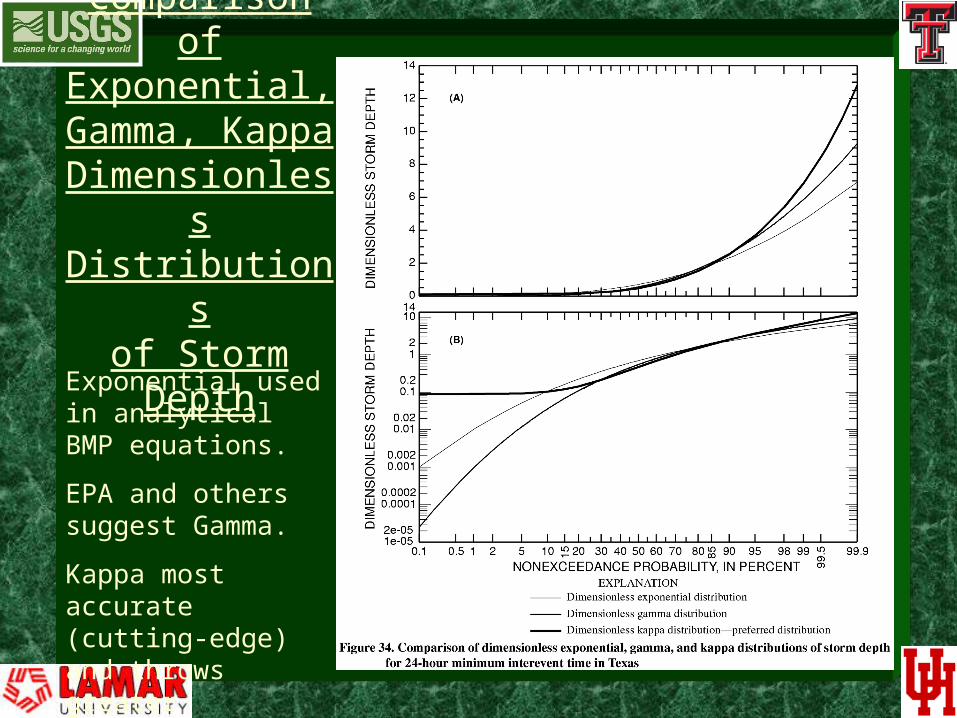
Comparison of Exponential,
Gamma, KappaDimensionless Distributions
of Storm Depth
Exponential used in analytical BMP equations.
EPA and others suggest Gamma.
Kappa most accurate (cutting-edge) and throws greater outliers.
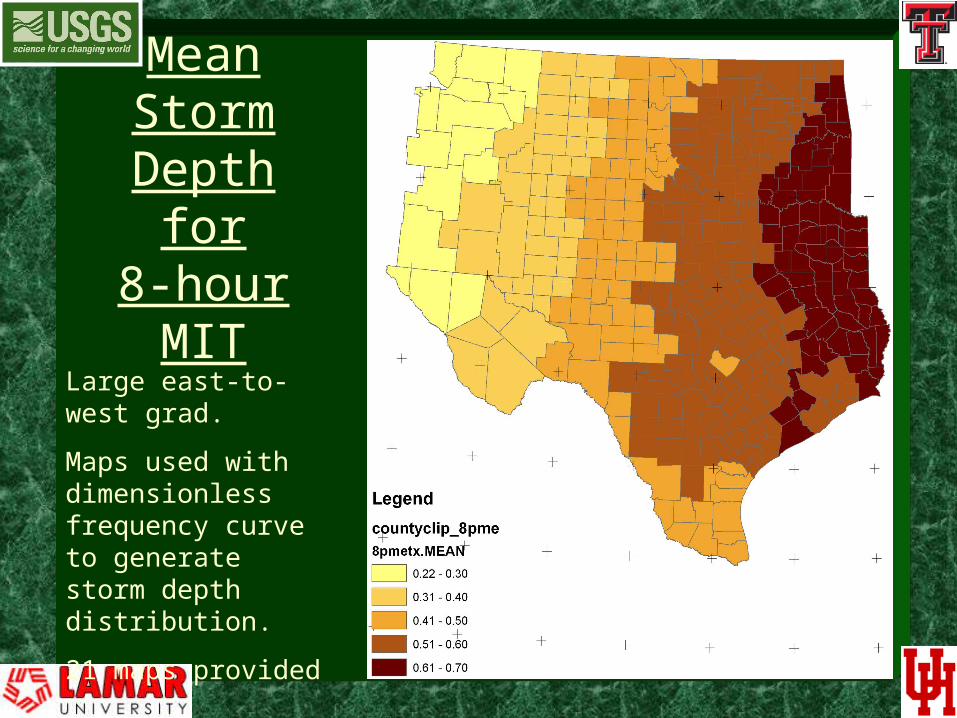
Mean Storm Depth for
8-hour MIT
Large east-to-west grad.
Maps used with dimensionless frequency curve to generate storm depth distribution.
21 maps provided
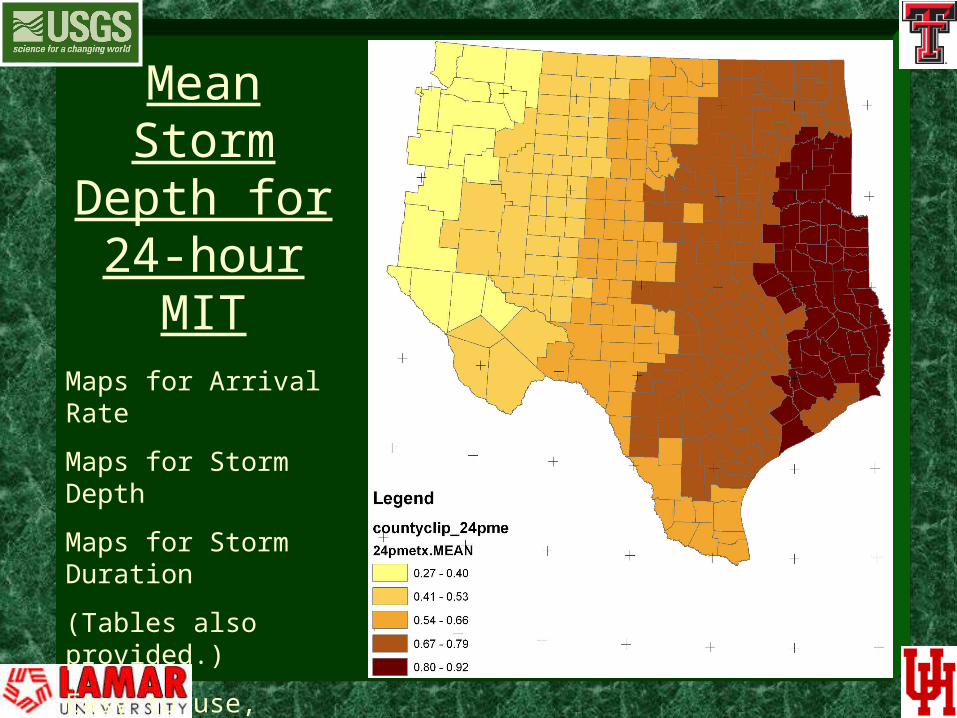
Mean Storm Depth for
24-hour MIT
Maps for Arrival Rate
Maps for Storm Depth
Maps for Storm Duration
(Tables also provided.)
Easy to use, consistent, and logical with many administrative subdivisions.
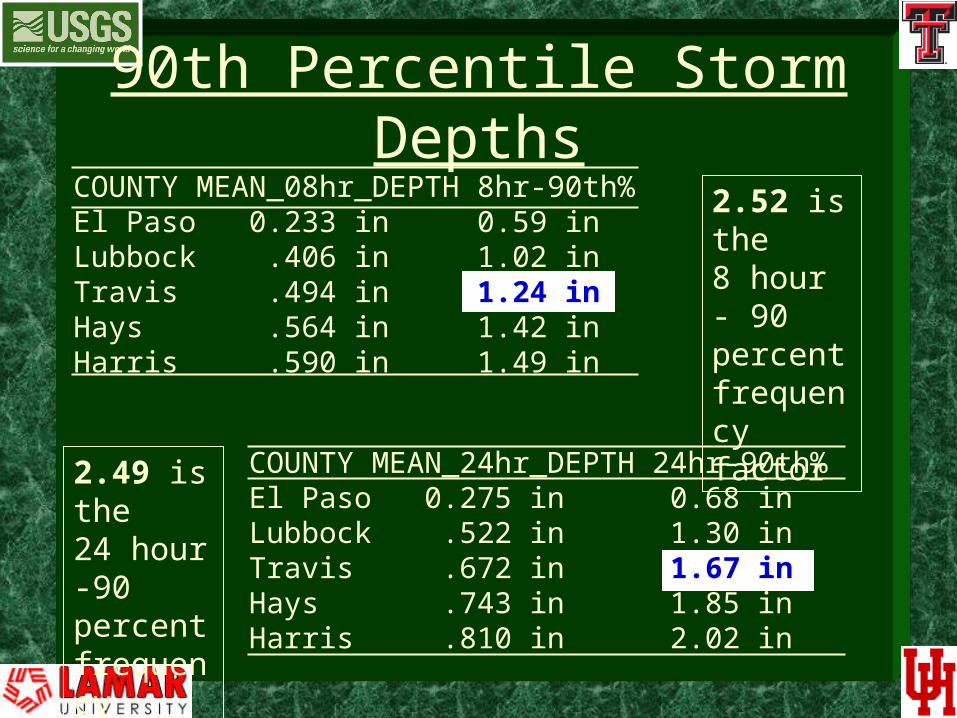
COUNTY MEAN_08hr_DEPTH 8hr-90th% El Paso 0.233 in 0.59 inLubbock .406 in 1.02 inTravis .494 in 1.24 inHays .564 in 1.42 inHarris .590 in 1.49 in
COUNTY MEAN_24hr_DEPTH 24hr-90th% El Paso 0.275 in 0.68 inLubbock .522 in 1.30 inTravis .672 in 1.67 inHays .743 in 1.85 inHarris .810 in 2.02 in
90th Percentile Storm Depths
2.52 is the8 hour - 90 percent frequency factor
2.49 is the24 hour -90 percent frequency factor
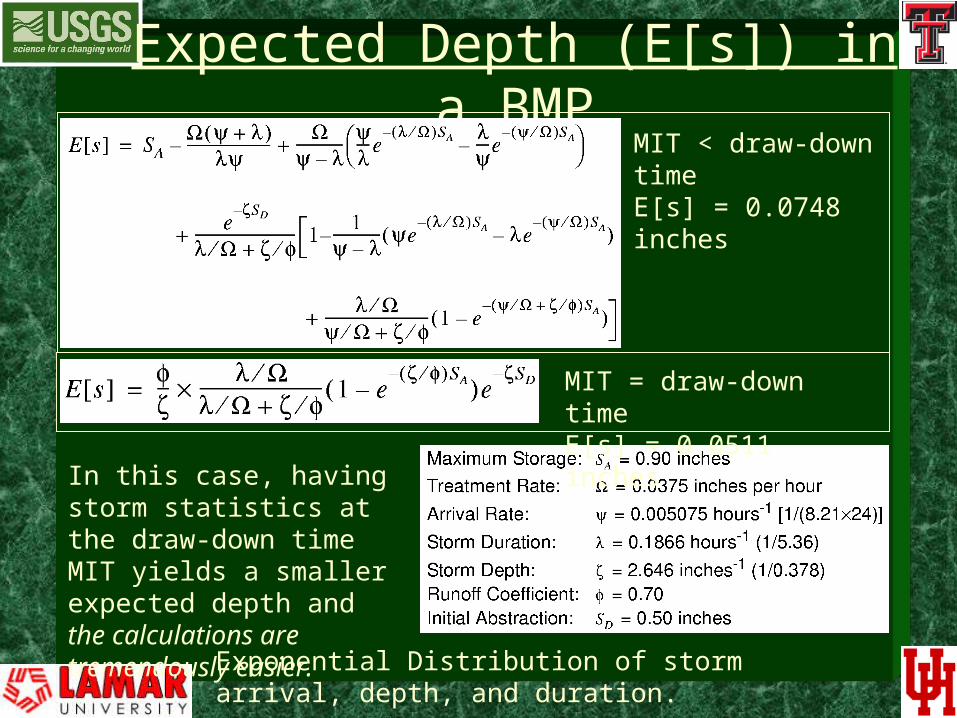
Expected Depth (E[s]) in a BMPMIT < draw-down timeE[s] = 0.0748 inches
MIT = draw-down timeE[s] = 0.0511 inches
In this case, having storm statistics at the draw-down time MIT yields a smaller expected depth and the calculations are tremendously easier.
Exponential Distribution of storm arrival, depth, and duration.
THANKS

APPENDIX
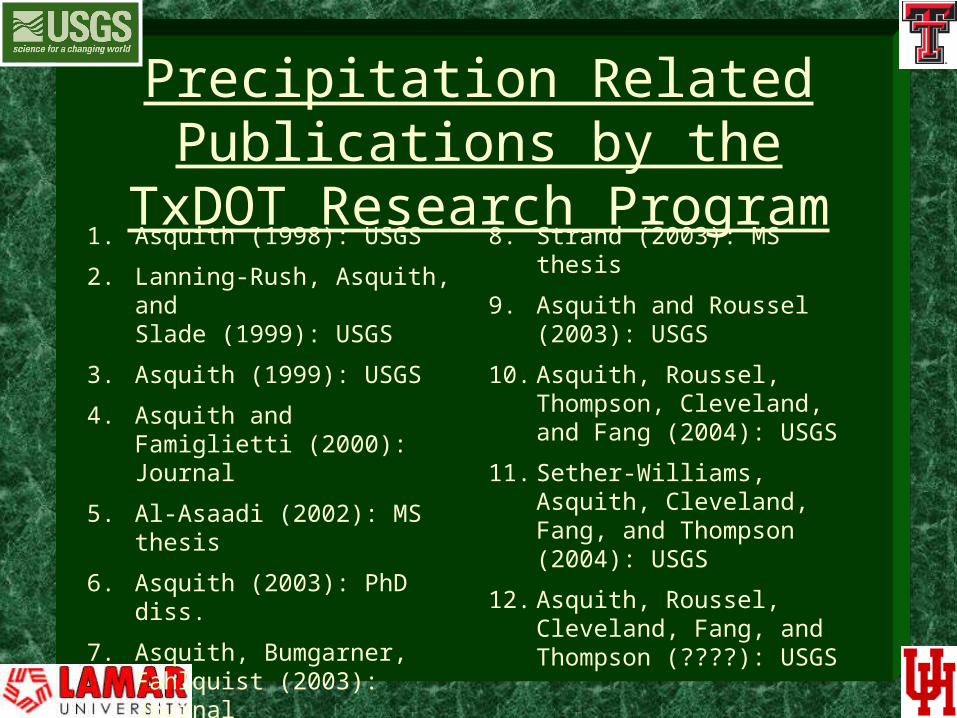
Precipitation Related Publications by the TxDOT Research Program
1. Asquith (1998): USGS
2. Lanning-Rush, Asquith, andSlade (1999): USGS
3. Asquith (1999): USGS
4. Asquith andFamiglietti (2000): Journal
5. Al-Asaadi (2002): MS thesis
6. Asquith (2003): PhD diss.
7. Asquith, Bumgarner,Fahlquist (2003): Journal
8. Asquith and Thompson (2003): Proceedings
8. Strand (2003): MS thesis
9. Asquith and Roussel (2003): USGS
10. Asquith, Roussel, Thompson, Cleveland, and Fang (2004): USGS
11. Sether-Williams, Asquith, Cleveland, Fang, and Thompson (2004): USGS
12. Asquith, Roussel, Cleveland, Fang, and Thompson (????): USGS
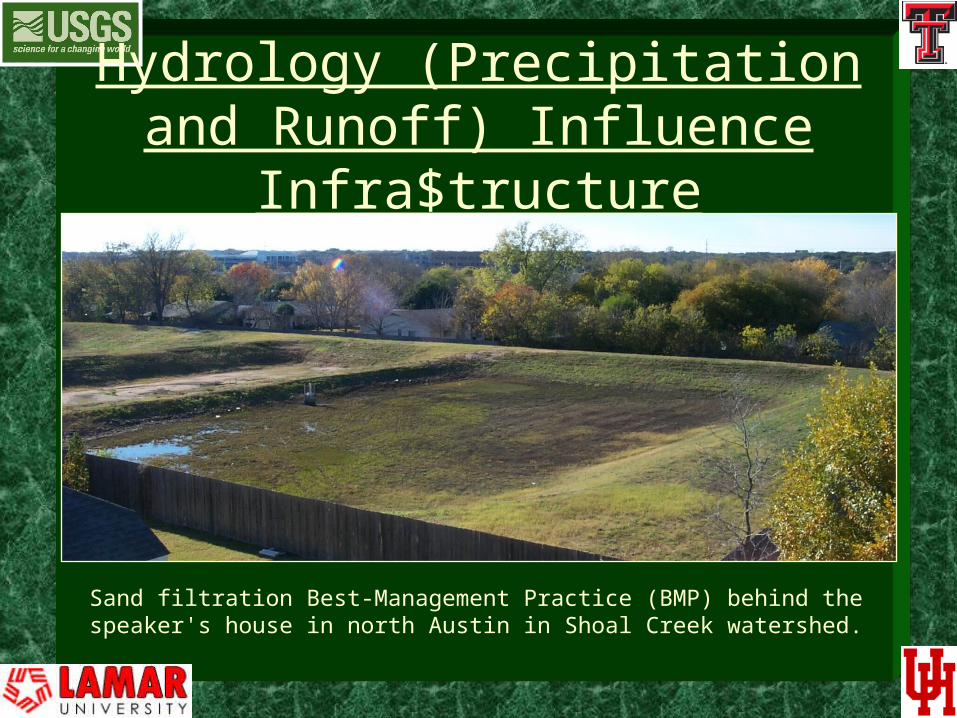
Hydrology (Precipitation and Runoff) Influence Infra$tructure
Sand filtration Best-Management Practice (BMP) behind the speaker's house in north Austin in Shoal Creek watershed.
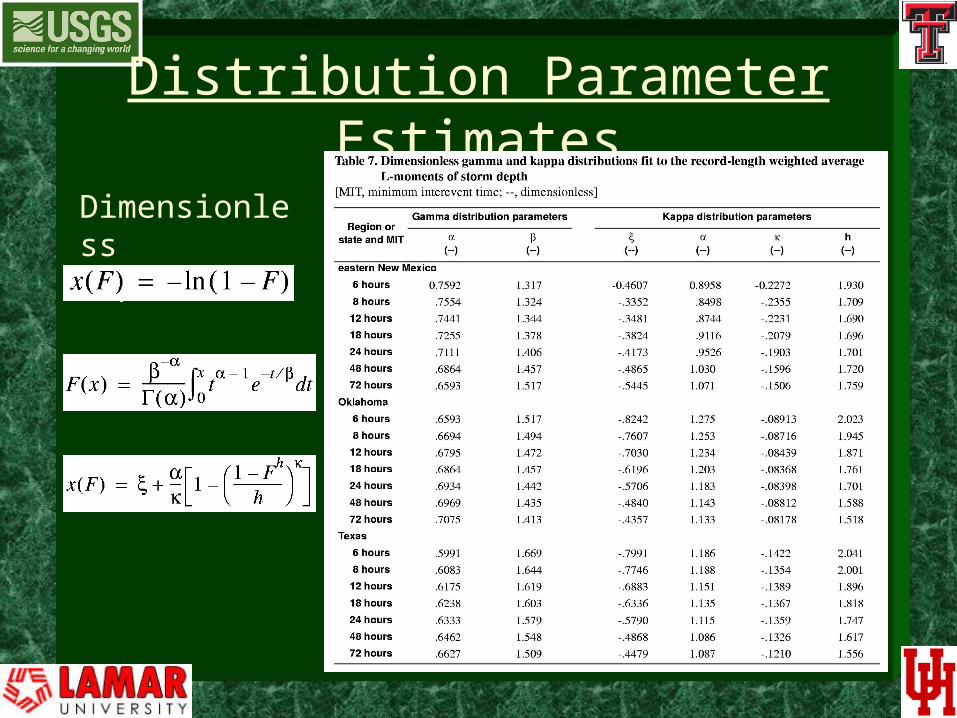
Dimensionless Exponential
Gamma
Kappa
Distribution Parameter Estimates
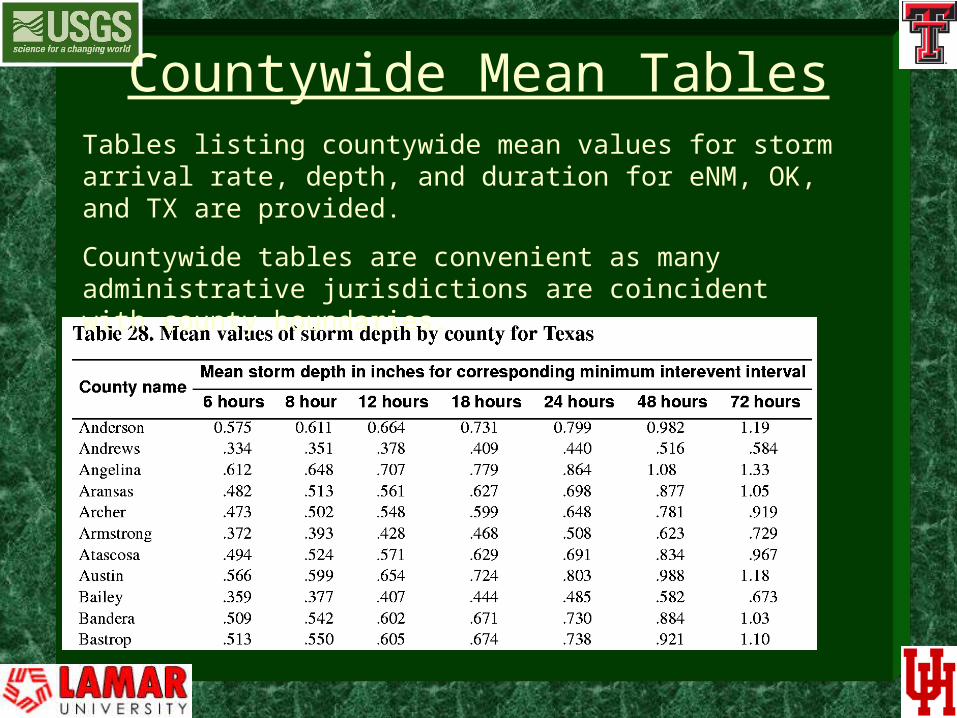
Countywide Mean TablesTables listing countywide mean values for storm arrival rate, depth, and duration for eNM, OK, and TX are provided.
Countywide tables are convenient as many administrative jurisdictions are coincident with county boundaries.
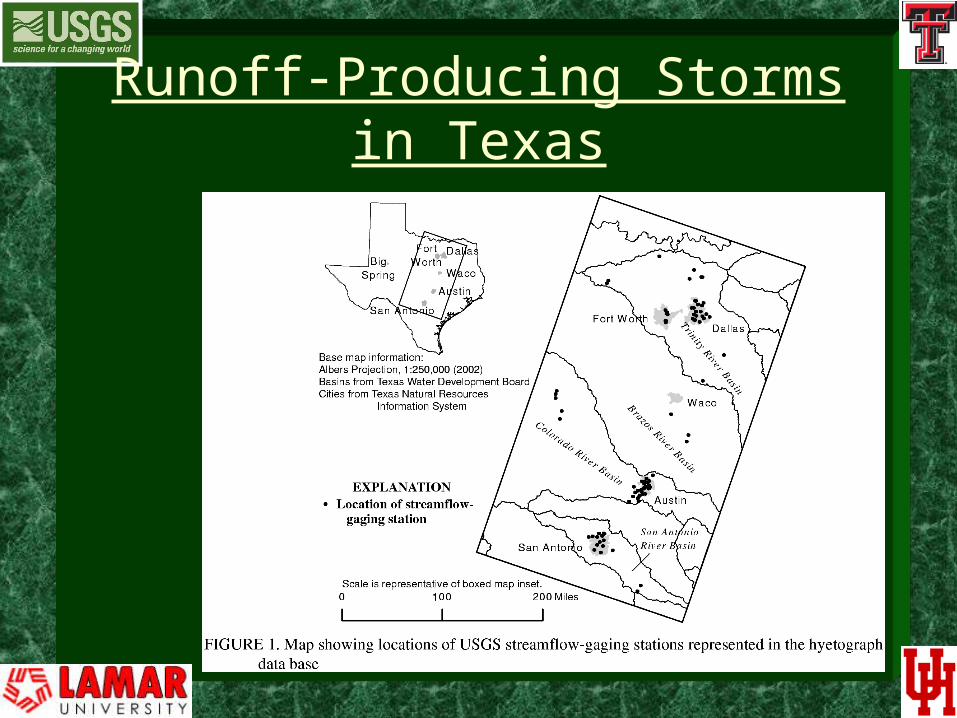
Runoff-Producing Storms in Texas
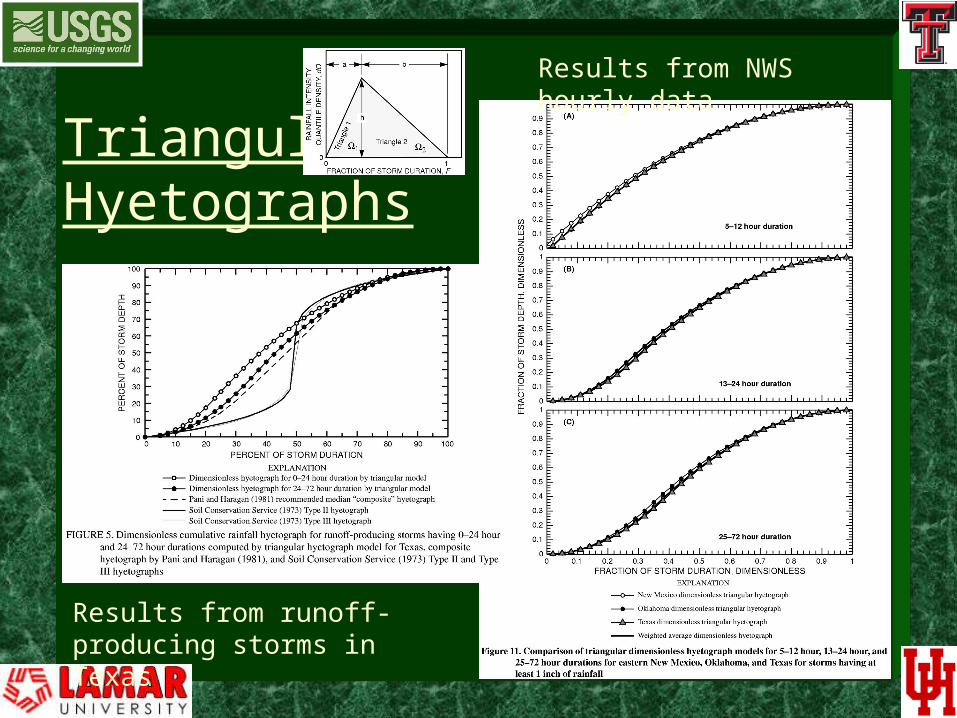
Triangular Hyetographs
Results from NWS hourly data
Results from runoff-producing storms in Texas
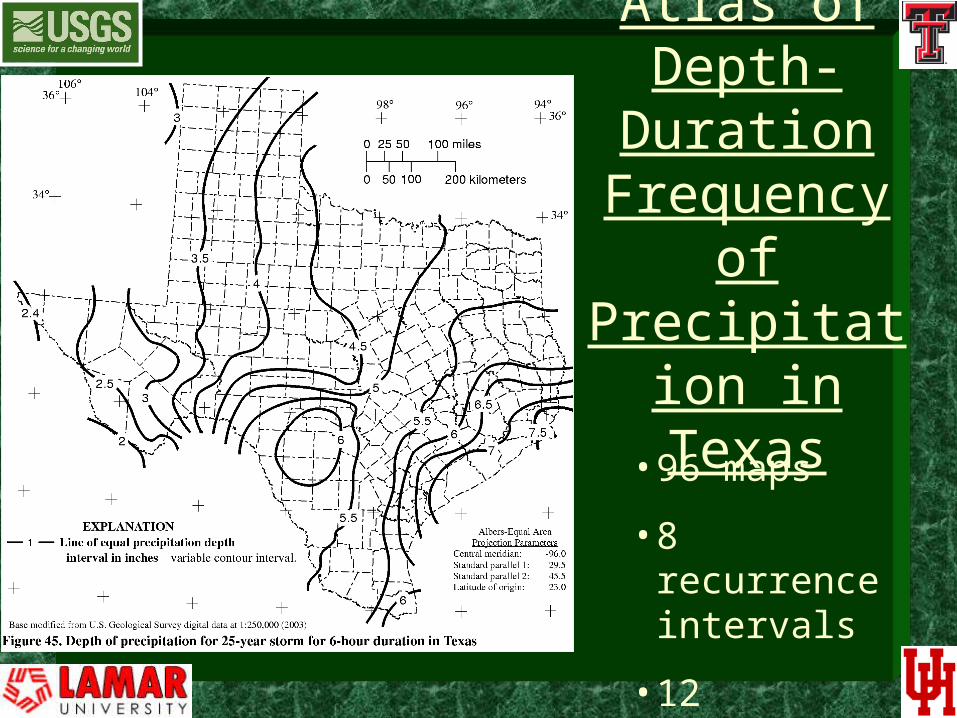
Atlas ofDepth-
Duration Frequency of Precipitation
in Texas
• 96 maps
• 8 recurrence intervals
• 12 durations
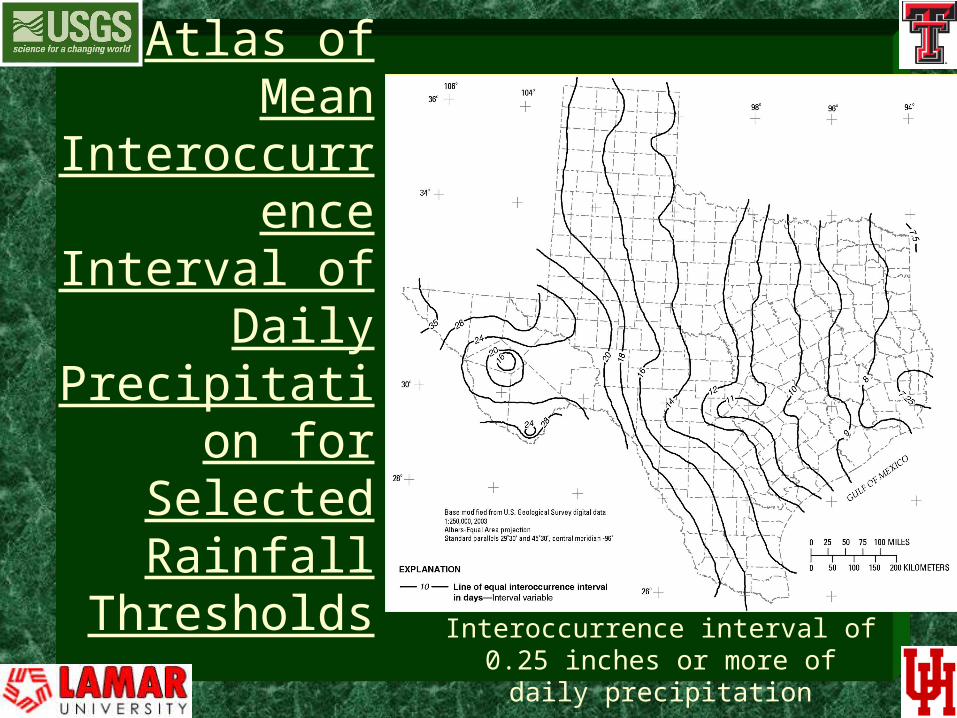
Atlas of Mean Interoccurrence
Interval of Daily Precipitation for
Selected Rainfall
Thresholds
Interoccurrence interval of0.25 inches or more of daily
precipitation
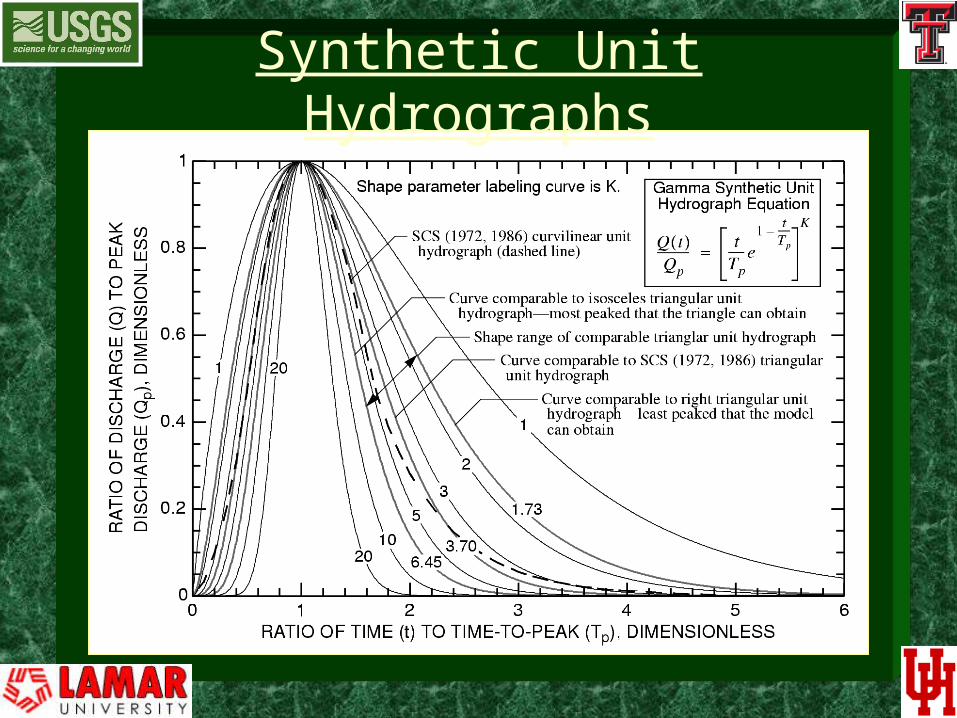
Synthetic Unit Hydrographs


![University of Texas at The University of Texas at … · [1] Maymester 2009 The University of Texas at Austin Photo: University of Texas at Austin School of Social Work professor](https://img.pdfslide.us/doc/110x75/5b8153fe7f8b9a2b678c1fff/university-of-texas-at-the-university-of-texas-at-1-maymester-2009-the-university.jpg)