Embed Size (px)
Citation preview

Storming to the forefront in the Driving World
2003 ANNUAL REPORT

This annual report contains performance results, financial data as well as the business outlook and strategies of KIA MOTORS Corp. The statements herein representManagement’s objective judgment, but KIA MOTORS’ actual results in the future could differ materially from those presented here. Please understand, therefore, the accuracyand completeness of forward-looking statements cannot be guaranteed.
2003 Annaul Report
All-out. Going global, and going for the top.

Kia Motors has already begun its powerful advance onto the world stage, backed by a
global R&D network, world-class quality, and premium customer services. The company is
applying core technology and producing environment-friendly vehicles to emerge as one
of the top players in the world automotive industry of the 21st century. With Kia, you can
experience the pride of leadership in being the best.
02 Profile
04 Chairman’s Message
06 President’s Message
12 2003 at a Glance
14 Domestic Business
16 Overseas Business
24 Production & Quality
26 Research & Development
28 Marketing
32 IR Information
34 Certifications & Awards
36 Business Ethics & Environment
38 Coporate Citizenship
42 Management’s Discussion &
Analysis
46 Audit Report
84 Five-Years Summary
85 Board of Director
86 History
88 Affiliates
89 Global Networks
Table of Contents _

04 Kia Motors Corporation
C h a i r m a n ' s M e s s a g e
Kia Motors CorporationChairman & CEO,
Mong-Koo Chung

2003 Annual Report 05
Year 2004A Chapter for Stability and Momentum in Our Global Operation
The automobile industry has a profound impact on the stability and
strength of national economies. In Korea, this dynamic sector is influencing a
widening portion of the country’s economy, particularly through its tremendous
creation of jobs. Kia Motor’s expanding role continues to shape this crucial
industry.
Kia, although late entering the global automobile complex, has
steadily closed the technology gap with industry leaders in recent years. This trend
demonstrates Kia’s competitive nature and future as a prominent automotive
manufacturer in the global market. Kia Motors is proud of its many successes and
looks forward to a future of continued excellence in shaping the automotive
industry of Korea.
The year ahead will be marked by consolidation and expansion of
our global enterprise. We will secure the resources required to be a major global
player by continuing to raise our brand value, develop our human resources and
grow operations, which will allow us to be a global player.

06 Kia Motors Corporation
P r e s i d e n t ’ s M e s s a g e
∙Build a system to support localization∙Lay the foundation for overseas plants to flourish∙Bolster global R&D capabilities
∙Maximize income by achieving performance targets∙Ensure operational transparency is up to global standards ∙Lower costs and expand future-oriented investment
Secure the Competencies for Continuous Growth Put People First
Accelerate global operations Raise Brand Value
∙Pursue operational innovation∙Build systems for protecting the environment and ensuring ethical practices∙Improve fundamental relations through labor-management cooperation
∙Secure the global specialists needed to run diverse overseas operations∙Efficiently allot support for core human resources∙Hire topnotch engineers to develop hit models
Building the Means to Rise to the Global Top 5
Kia Motors CorporationPresident & CEO,
Kook-Jin Yoon
Kia Motors boasts 60 years of experience while embracing a
new sprit of challenge. Our employee resolution is to make
the Kia-Hyundai partnership fifth in world automobile
production by 2010.

2003 Annual Report 07
To Our Shareholders :
Our company has certainly been faced with numerous challenges during 2003. Yet, I am happy to
announce that in spite of these difficulties, we have managed not only to further strengthen our
operation, but also to make another big stride forward. Although we experienced a 4% year-on-
year drop to 858,697 units sold, our sales revenue increased by 5.6% to just under KRW12.84
trillion. Net profits for the period rose by 10% to KRW705.4 billion; our best performance ever.
Our aggressive marketing effort in the US, Europe and China pushed exports to 539,902 units, up
an impressive 19.8% year on year. Our newly established European subsidiaries, having introduced
the Sorento, Carens and Carnival diesel lines, provided Kia with the fastest sales growth of
automotive makers in the European market. Meanwhile, the TianLiMa has been a huge success in
China, driving up Kia sales there impressively. Kia Motors’ aggregate exports of finished models
surpassed the 4 million mark in 2003, and the company received the US$5 Billion Export Tower
Award from the Korean government for the year.
The past year has also given rise to major enhancements in our product quality. Our product
rankings have risen steadily on the North American IQS index, which surveys American consumers.
Additionally, the repeat buyer rate published by JD Power and Associates ranked Kia Motors 12th;
again demonstrating that our sustained efforts to improve product quality are now paying off.
Kia’s prospects for membership among the elite club of world-class automotive manufactures are
bright, indeed.
Finally, new models like Opirus and Cerato have boosted our competitiveness in the passenger
vehicle market, while we improved our financial health by lowering our debt-to-equity ratio to
109.8% by the end of 2003. We completed the capacity expansion of our Gwangju plant to
350,000 units a year and relocated our research center, maximizing the synergy of our new
product development competencies. We have also established a mid-/long-term brand strategy
for enhancing our brand value significantly.
Certainly, none of these achievements could have been realized without the support of you, our
shareholders. All of us at Kia will continue to honor the trust you have invested in us by working
hard to maintain this robust growth and advancement.
With that in mind, it is important to mention that this coming year will be trying for us. Raw
material prices are expected continue to rise steadily, while the Won is appreciating sharply against
the Dollar. Moreover, prospects for Korean economic recovery in the current domestic market are
bleak.
Even so, Kia Motors has set ambitious operation goals for this year, aiming at a 27.4% year-on-
year growth, raising finished unit sales to just under 1.1 million vehicles. We aim to earn KRW1.2
trillion in ordinary income on total sales exceeding just over KRW15.8 trillion.
Sales (Korean won in billions)
11,129.212,158.1
12,839.9
01 02 03
Units Sold (Units)
899,788 894,268858,697
01 02 03

08 Kia Motors Corporation
P r e s i d e n t ’ s M e s s a g e
2003
(Korean won in millions)
Current assets
Non-current assets
Total assets
Current liabilities
Long-term liabilities
Total liabilities
Capital stock
Capital surplus
Retained earnings
Capital adjustments
Total shareholders’ equity
Total liabilities and shareholders’ equity
Summarized Non-Consolidated Balance Sheets
3,251,294
7,959,838
11,211,132
3,839,030
2,029,923
5,868,953
1,848,652
1,700,956
841,078
951,493
5,342,179
11,211,132
₩
₩
2002
2,921,333
6,191,315
9,112,648
2,679,543
2,339,421
5,018,964
1,848,652
1,699,924
316,427
228,681
4,093,684
9,112,648
₩
₩
2001
2,419,877
6,018,589
8,438,466
2,540,899
2,504,551
5,045,450
1,847,987
1,699,924
-324,952
170,057
3,393,016
8,438,466
₩
₩
2003
(Korean won in millions)
Sales
Cost of sales
Gross profit
Selling and administrative expenses
Operating income
Other income
Other expense
Ordinary income
Extraordinary item
Income before income tax
Income tax expense
Net income
Summarized Non-Consolidated Statements of Income
12,839,881
10,084,078
2,755,803
1,943,363
812,440
456,205
415,046
853,599
-
853,599
148,176
705,423
₩
₩
2002
12,158,113
9,581,392
2,576,721
1,918,228
658,493
542,725
399,908
801,310
-
801,310
159,931
641,379
₩
₩
2001
11,129,204
8,531,616
2,597,588
2,075,347
522,241
404,375
502,465
424,151
197,301
621,452
69,217
552,235
₩
₩

2003 Annual Report 09
Kook-Jin Yoon
President & CEO
To achieve these goals, our focus for 2004 is on achieving stable labor-management relations, a
prerequisite for improved productivity and product quality, implementing marketing strategies for
launching new models and ensuring steady growth in overseas markets.
Meanwhile, this year marks the opening of a new chapter in Kia Motors’ global operation. Our
Chinese plant will begin producing the Carnival, and annual output will be expanded from the
current 50,000 to 130,000 units. An additional plant will be built in Zilina, Northern Slovakia, with
an initial annual output capacity of 200,000 vehicles, bolstering our European operations.
Regarding investments, we plan to allocate just under KRW1.43 trillion, or about 9% of annual
sales revenue. These funds are earmarked for developing new models as well as constructing a
new engine and transmission plant to boost our potential for future growth.
To give us a stronger competitive edge, new models such as the Bongo III(Medium Van) and the
Morning/Picanto(mini-car) have already been released early in 2004. One of our most ambitious
projects, a new compact SUV called KM, will be on the market by June. These new models, once
available in the US and European markets, will greatly augment Kia’s brand value.
The year 2004 will be a crucial juncture for the future of Kia Motors. We will be tapping into the
business potential of our global operation to the fullest extent, reaching to surpass the million-car
mark in sales and the trillion-Won mark in profit.
We believe that there is no challenge or ambition too high for the 30,000 person team we call Kia
Motors, so long as we stand united. We are committed, more than ever, to producing results and
reaching our high goals, to reward you, our shareholders, for your support and trust.
We appreciate your continued support and interest and our warmest wishes to each and all of you
for the year ahead.
Operating Income(Korean won in billions)
522.2
658.5
812.4
01 02 03
Net Income(Korean won in billions)
552.2
641.3
705.4
01 02 03

Kia Motors
Forcing our Wheels into the Leader’s Domain.
Kia Motors’ global expansion continues to accelerate while the brand name is steadily enjoying
broader recognition. Leading testing institutions around the world have endorsed Kia’s product
quality and consumer love of the company’s special services. The company continues to break
into new markets with the determination to be a proud global leader.
▲ Rigorous preparations were made from the initial design stage to position the Opirus for
the global market. The development project for this luxury full-sized sedan cost W300 billion
and took 36 months to complete, with all available resources being mobilized for the
production and marketing effort.

Opirus / Amantia Dream SedanAny car fine enough to lead the times
provides special satisfaction. The Opirus
boasts the magnificent styling,
cutting-edge technology and extravagant
interior to be the trendsetter today. This is
the ultimate sedan-the standard
to which all other sedans aspire.
>> RegalProud to Be the BestThe value of excellence is self-evident.
The Regal is defined by unrivaled
performance, a luxurious interior and
uncompromising safety. Even the most
discriminating driver would be proud to
own this exceptional sedan.
>> New Optima / MagentisQuieter and Safer than EverThis sedan is destined for greatness.
Unique styling projects a dignified image,
while state-of-the-art engineering
offers the best possible ride and comfort
in a mid-sized sedan.
>>
Passenger Line-up

Competitive Edge in Passenger Vehichles Sharpened by
Opirus and Cerato
Kia Motors, unchallenged in its number-one position in the RV (SUV
and MPV) market with the Sorento and Carnival II, is now setting its
sights on the passenger vehicle market for this year. Competitveness
in Korea has been boosted with the launch of the full-sized luxury
Opirus in March, followed by the Cerato, a compact sedan, in
November. Opirus, having already been launched in Europe and the
US, has become the first full-sized passenger car from Korea to
compete in the overseas luxury vehicle markets. The Cerato was
developed at Kia’s special pilot plant using a state-of-the-art quality
assurance system. This flagship car boasting unprecedented quality
sports a sleek European-style exterior and has scored five stars in the
NCAP safety test. The model is loaded with top-grade components
and features like the curtain airbag, which will continue to attract
strong interest and attention within the C-segment car market.
4 Millionth Unit Exported, US$ 5 Billion Export Tower
Award Received
Kia Motors exported its first vehicles in 1975 with the shipment of 10
Brisa Pickups to Qatar. The company’s overseas marketing operations
acquired a massive export network through its North-American
distribution of the Pride in 1987. Kia successively passed the million-
car export mark in 1995, the 2 million mark 1998 and the 3 million
mark in 2001. In November this year, aggregate exports broke 4
million-units. Kia Motor’s market share is growing at a dazzling
speed, particularly in the US and Europe. Nine years after its
automobiles first entered the US market, Kia Motors’ cumulative
sales surpassed 1 million units there in February 2003. Meanwhile,
Canadian sales reached 100,000 units in September, only 48 months
after the company’s market debut. Kia Motor’s remarkable success
received official recognition on November 28 during the 40th
International Trade Day, when the company was awarded the US$5
Billion Export Tower Award.
Average Exported Automobile Price Reaches US$ 10,000
The average price for Kia’s exported vehicles has been rising steadily.
The average price per unit was a mere US$8,700 in 2000, climbed to
US$9,400 in 2001, US$9,800 in 2002, and on to US$11,200 in
2003. Such a sharp rise in price is largely due to expansion of value-
added models. SUVs and large-size passenger cars are occupying a
greater portion of the sales mix, which once almost exclusively
consisted of low-end and mid-market models. The improved prices
indicate Kia Motors is not only selling more cars each year, the
company is also growing into a maker of high-quality, high-value-
added automobiles.
Notable Expansion in the China Market
The TianLiMa, produced and marketed by DYK(Dongfeng-Yueda-Kia), a
joint venture with local automobile makers, proved to be a huge success,
giving rise to a ‘Korean car fever’ in China. A mere 3 months after its
market debut, sales of the compact model soared to an impressive 10,000
units, and by 2003, a total of 43,900 cars were sold. Chinese respondents
to consumer surveys described the TianLiMa as ‘the best-quality and the
most dynamic car,’ ‘the car the most favored by young adult drivers,’ and
‘a contemporary car in keeping with the temperament of our times.’ The
TianLiMa has indeed captured the local consumers’ hearts, becoming one
of the most popular economy models in the market. Dongfeng-Yueda-
Kia sold close to close to 51,000 units in 2003, a 150% rise year on year,
and the upward trend is expected to continue.
Sports Marketing Beefed Up for Heightened Brand
Recognition
Kia Motor’s sports marketing operation, launched as an effort to boost
brand recognition, turned out to be right on the mark. The positive
outcome of the campaign has prompted Kia Motors to extend its contract
for the main sponsorship of the Australian Open, originally entered for the
Australian Open 2003, for five more years. The company has also
concluded a three-year contract to be an official sponsor for the Davis Cup
tournaments in Europe and Africa through 2005 in an all-out bid to
broaden recognition of the Kia brand. Meanwhile, Kia sponsored the
Korean national team at the 21st Winter Olympics early in 2003, and the
squad garnered two gold medals. The company was also the official
sponsor for Le Tour de Langkawi 2003, one of the world’s most prestigious
bicycle races.
12 Kia Motors Corporation
2 0 0 3 a t a G l a n c e

Inaugural Year of Environment Management
In June, Kia Motors proclaimed 2003 to be the inaugural year of its
new environment management initiative, and the company launched
an ambitious campaign to bolster environmental protection activities
company wide. Importantly, all domestic operations have now been
ISO 14001 certified, starting with the Hwasung plant in May, the
Gwangju plant in November, and the Sohari plant and all other service
centers in December. Kia Motors is intent on expanding the scope of
this effort to protect the environment, steadily reducing pollution
emissions, reinforcing the environmental quality monitoring system
and broadening participation in community environment projects.
Expanded Overseas Sales and Service Infrastructures
Kia Motors expanded its pool of European dealerships from 1,100 to
1,300 in 2003, and strengthened its dealer networks across the
continent. These efforts were part of a move to expand the overall
overseas sales network and included the opening of the “Europe
Technical Hotline,” an internet resource providing real-time support
on technical issues to service managers and mechanics from overseas
sales centers and dealerships. The Hotline was designed to maximize
customer satisfaction by enabling overseas servicing staff to provide
speedy support to local customers. The company has also opened a
global web portal that will further increase customer satisfaction
through smoother overseas sales and service operation and more
efficient information sharing. The portal will be the cornerstone of
Kia’s Customer Relationship Management platform.
Sorento Performance Quality Tested and Proven
The superior quality and performance of Kia’s SUVs were proven to
the world once more in 2003. The Sorento received the Consumer
Satisfaction Quality Award in the mid-size SUV sedan category from
Strategic Vision, an authoritative American consulting firm
specialized in the automobile industry, and a customer satisfaction
award from AutoPacific, another automotive consulting firm. The
vehicle has created a sensation in the US market. It earned five stars
(the maximum score) on a crash safety test administered by the US
National Transportation Safety Board, was selected as the best SUV
under US$25,000 by the New England Motor Press Association, and
won the “Best SUV Award” from the Northwest Automotive Press
Association.
Consolidated Hyundai-Kia R&D Center Launched
In May 2003, Hyundai Motor and Kia Motors relocated their R&D
facil it ies at diverse locations to the Namyang Research and
Development Center. The centralized facility was expanded and
realigned to be more competitive in the global automotive industry,
shorten the development cycles and cut costs by sharing platforms
and components among different automobiles. This state-of-the-art
R&D center is the largest of its kind in Asia and can be used for
performing basic research and all processes required in new vehicle
development on site. In addition, the Hyundai-Kia Design & Technical
Center opened in California in
February 2003, followed by the opening of the Hyndai-Kia Europe
R&D Center in September to form a global R&D network.
Fastest Sales Growth in EU
Kia Motors achieved the fastest sales growth of any automaker in
the EU market during 2003. According to the ACEA (Association des
Constructeurs Europeens d’Automobiles), sales of Kia automobiles in
the EU soared 48.4%, from 72,529 units in 2002 to 107,631 in
2003, elevating the company’s market share by 0.8%. Mazda
recorded the second-fastest annual sales growth rate of 30.4%.
Although, overall automobile sales in Europe were 1.3% lower in
2003 than in the previous year, the market is expected to rebound in
the coming year, Kia Motors plans to continue its blistering sales
growth rate by introducing new models that cater to European
tastes.
2003 Annual Report 13

Sluggish Domestic Demand and Shrinking Passenger
Vehicle Sales Required a New Approach
14 Kia Motors Corporation
D o m e s t i c B u s i n e s s

2003 Annual Report 15
Lower Results in Spite of Best Efforts Despite extraordinary efforts to cope with deteriorating domestic demand, the market slump exceeded
even the worst-case scenario. Domestic automobile sales for the year totaled a mere 319,795 units,
28% lower than the previous year’s figure. The Korea Automobile Manufacturers’ Association (KAMA)
reported Korea’s industry-wide demand dwindled i18.7% year on year in 2003. In addition to a general
economic downturn, poor passenger vehicle sales and production halts from protracted strikes at Kia
plants resulted in a reduction of Kia Motor’ domestic market share from 26.5% in 2002 to 23.8% a year
later.
Building Momentum for Long-term Competitiveness Some very positive developments occurred as well, however. The launch of the Opirus and Cerato has
geared Kia Motors up for long-term competitiveness in the passenger vehicle market. The Opirus has
emerged solidly as Kia’s flagship model, and an aggressive marketing campaign has been undertaken to
broaden the Cerato’s hold within the target segment of the passenger vehicle market. Faced with severe
competition, Kia has focused on identifying prospective customers and winning them over with sales
promotions. The copany is also engaging in sports and cultural marketing as well as joint-marketing
campaigns with other popular brands to enhance the Kia image. Importantly, the customer database is
being used successfully to enhance sales effectiveness, while training programs and seminars have greatly
boosted professionalism of the sales personnel. The Customer Satisfaction training program has been
reinforced, and personalized servicing programs are offered to new customers. A computer telephony
interface system has been adopted to make customer service more responsive to requests, thus
significantly increasing customer satisfaction.
Gathering Forces for a New Growth Surge In 2004, Kia aims to sell 144,000 passenger vehicles, 177,000 RVs (SUVs, Mini-Vans, MPVs), and 94,000
commercial vehicles, 415,000 units in all, for a 27%, share of the domestic market estimated at
1,520,000 units by KAMA. To this end, The company will continue to strengthen competitiveness in the
passenger vehicle market with the Cerato, Opirus and Morning. The strong Kia brand in the RV segment
will be maintained, and the company’s number two position in Korea will be strengthened. Kia will also
develop new models that can compete effectively with surging imports of foreign cars into Korea.
▶ The “X-Trek Tour to Experience Nature” programwas kicked off as a marketing tool as well as a wayto elevate the company’s environment-friendlyimage.
▶▶ Press conference for the initial launch of theSerato, as Kia takes aim at passenger car marketsat home and overseas in 2003.
■ Kia■ Others
∙ Source KAMA (Korea Automobile
Manufacturers Association)
Market Share
27.0%
26.5%
23.8%
01 02 03
Sales Volume(units in thousands)
1,4511,622
1,193
1,318
1,005
01 02 03
392
1,059
429 313

Differentiation Strategy Vanquishes Adversity -
500,000 Cars Exported, Amounting to US$5 Billion
16 Kia Motors Corporation
O v e r s e a s B u s i n e s s

2003 Annual Report 17
Astounding Growth in Spite of the Global Economic SlowdownIn a stark contrast with the lackluster domestic sales, exports jumped 19.8% year in year to a
phenomenal 538,902 units, largely offsetting the under-performance on the home front. This was the
first year ever for Kia to exceed 500,000 units in finished car exports. The total value was worth over
US$5 billion, as the average price per unit also surpassed US$10,000. Notably, in November, aggregate
exports passed the 4 million-car marks.
Galloping Growth in the EU MarketBy region, the sharpest growth was realized in the EU market, where exports amounted to 156,675 units,
or 29.2% of total exports, nearly 7% higher than the 21.9% figure for 2002. The EU was the second
largest export market after the US, and Kia’s phenomal sales growth there was largely due to the
expansion of the regional sales network and an improved product mix, introducing diesel engine models
and other new models better suited for European tastes. Kia also enjoyed robust sales increases in the
Asia Pacific and Canada, regions that now contribute significantly to overseas operations.
An Upgraded Website for Global UsersStarting from August 2003, non-Korean visitors to the Kia website could be redirected from
www.kiamotors.com to the new overseas website. Dealers and customers, both inside and outside Korea
can access Kia information more easily, and new online services were introduced from September 1st.
The Challenge to Break New Records Persists Kia has set the 2004 export goal at 380,000 passenger vehicles, 257,000 RVs (SUVs, Mini Vans, MPVs),
and 42,000 commercial vehicles for a total of 679,000 units shipped. To achieve this objective, the
company will focus on launching the Picanto, Cerato, Opirus, KM and small-sized commercial vehicles;
boosting brand image through stepped-up corporate advertising, and strengthening sports marketing
through the sponsorship of the Australian Open and the Davis Cup tennis tournaments. Sales operation
efficiency will also be raised by increasing the number of directly operated European sales centers and
improving and broadening the dealership network.
▶ Kia Motors has received high marks from overseasdealers, consumers and journalists alike whileachieving record-breaking sales growth outsideKorea in 2003.
▶▶ On September 22, 2003, the Morning Queenarrived at Vancouver’s New Westminster Harbor,carrying the 100,000th vehicle exported to Canadain the past 48 months.
N. America 48.2%
29.2%
5.5%
7.7%
9.4%
Europe
Mid East / Africa
Latin America
Asia / Pacific
∙ Source Company data
Export Volume Growth(units in thousands)
488
450
539
01 02 03
2003 Export Breakdown by Region(Based on Number of Shipment Units)

Kia Motors America Inc.
Regional HQ
• Location : Western Region(Irvine, CA)
• No. of Dealers : 133
• Location : Eastern Region HQ (Philadelphia, PA)
• No. of Dealers : 174
• Location : Central Region HQ (Chicago, IL)
• No. of Dealers : 139
• Location : Southern Region HQ (Atlanta, GA)
• No. of Dealers : 191
• Total : 637
PDC Center : Chino, Allen Town, Lawrenceville
18 Kia Motors Corporation
O v e r s e a s B u s i n e s s
United States
Contending with the World’s Best in the
World’s Largest Market
Chicago
Atlanta
Philadelphia
KMA

2003 Annual Report 19
Still Going Strong The US demand was sluggish, heavily affected by an economic slowdown. Despite offering a bold
incentive package, Kia’s total automobile sales amounted to 237,417 units in 2003, only slightly higher
(0.1%) than in the previous year. While sales decreased by 6.6% in passenger vehicles, sales in the more
profitable RVs segment jumped 11.6%, despite an inventory shortage following strikes in September and
October.
Boosting Brand Value through Product Quality A survey conducted by J. D. Power and Associates, the American automobile market research firm,
revealed that the repeat buy rate of Kia products has quintupled over the past two years to 50%. Kia
Motors is now ranked 12th in terms of repeat customers. Meanwhile, the New York Times praised the
Sorento in a test drive review: “If the best compliment you can make about a car is that this car can be
seriously considered for purchase, the Sorento seems to be just that car.” These gratifying results were
made possible by a determined effort to improve quality improvement and engage in customer-centered
marketing campaigns.
Stronger Product Mix to Increase Market Share US sales are expected to see strong growth into 2004 on the expanded sales of the Cerato and Opirus
and the second-half introduction of the KM, a new-concept SUV. All-out marketing and PR campaigns
are planned to ensure a successful market debut for the Amanti, Cerato and KM, while quality
enhancement efforts will continue unabated. The company will work to improve the brand image still
further by achieving a higher IQS score and stepping up sales support to dealers for optimal
competitiveness.
▶ Kia dealers throughout the US enjoyed a briskbusiness in 2003, thanks to the improved price-to-performance level of their products.
▶▶ A nationwide dealers’ convention is held each yearto improve information exchange and secure asolid position in the US market.
∙ Source Company data
Market Share
1.31%
1.41%1.42%
01 02 03
Sales Volume(units)
223,721237,345 237,471
01 02 03

Regional HQ
• KME : Kia Motors Europe (Bremen, Germany)
Europe Sales Subsidiaries
• KMD : Kia Motors Deutschland (Frankfurt, Germany)
• KMUK : Kia Motors United Kingdom
• KMAS : Kia Motors Austria
• KMBL : Kia Motors Belgium
• KMS : Kia Motors Sweden
• KMIB : Kia Motors Iberia
• KMP : Kia Motors Poland
• KMH : Kia Motors Hungary
• KMCZ : Kia Motors Czech Republic
• KMIE : Kia Motors Ireland
Kia Motors Europe Manufacturing Plant
• Zilina, Slovak Republic
Determination and Steady Growth Paving
the Way toward Prominence in the European
Automotive Market
20 Kia Motors Corporation
O v e r s e a s B u s i n e s s
Europe
KMUK
KMIE
KMB
KMIB
KMS
KME
KMAS KMH
Europe PlantKMP
KMCZ
KMD

2003 Annual Report 21
Number One Sales Growth-a Hard Act to Follow Although the EU market experienced a decline in demand, Kia Motors achieved an unprececented 48%
growth in sales during 2003, the fastest of any automaker. This strong showing was due to an increased
number of directly operated sales centers, an expanded regional sales network, and the new diesel
models for the Sorento, Carens and Carnival. Kia’s share of the European market surpassed 1% for the
first time.
New Technical Hotline Improves Maintenance Service The Technical Hotline first opened in Germany, Austria and the UK in January 2003 and is now available
across Europe. This website provides real-time technical support to managers and mechanics at overseas
sales centers and dealer service centers. In 2004, the Customer Assistance Center will be launched to
receive customer requests and feedback, and a Roadside Assistance program will be introduced. A
Customer Relationship Management system is planned for 2005 to better track individual customer
histories and send personal notifications on vehicle maintenance and servicing.
Sprinting Ahead Just as in 2003, Europe promises to be a region where Kia Motors can achieve strong growth in the
coming year. The company expects to sell 148,000 passenger vehicles, 78,000 RVs and 12,000
commercial vehicles-238,000 units in all-in Europe in 2004, a 50% increase over the 2003 total. To this
end, the company will introduce the entry-level Picanto, and expand its diesel lineup with a new Cerato
model and the KM, a compact SUV. The EU office and dealer network will also be overhauled and further
investments made in sports marketing as part of market expansion efforts prior to the construction of a
European plant.
▶ The dealers’ convention in the UK strengthenslocal presence in a market that, along withGermany, is leading Kia’s advance across Europe.
▶▶ The Picanto is unveiled at the Frankfurt MotorShow. This entry-level automobile was styled tocater to economy-minded European drivers.
Market Share
0.5% 0.6%
0.8%
01 02 03
Sales Volume(units)
99,173105,504
149,021
01 02 03

Dongfeng Yueda Kia Motors
• Location : Yancheng, Jiangsu, China
• Total Capital : US$ 70 million
• Kia Invested Capital : US$ 35 million
• Ownership : 50%
• Capacity : 50,000 units p.a. (2003YE) Planned
expansion to 130,000 units by 2004
• Product Focus : Small / compact passenger cars /
Mini-Van
• Other Shareholders : Yueda Group (25%)
Dongfeng (25%)
Lead in China and Lead the World
China
22 Kia Motors Corporation
O v e r s e a s B u s i n e s s
Beijing
Yancheng
Shanghai

2003 Annual Report 23
TianLiMa Captivating China The TianLiMa, designed exclusively for the China market mode and locally produced and distributed, is
achieving stupendous growth. A total of 43,934 units were sold during 2003, making it China’s best
selling economy car. The robust sales performance continues to be strong despite bold incentives and
drastic price reductions offered by big name competitiors.
Continued Success ExpectedKia will exploit its current momentum in China, a strategically important, high-growth market. The
company will introduce a new Carnival model in the second half and expects sales for the year to
increase 39% to 71,000 units.
The Pride and TianLiMa have already proven the strong potential for success in China. The country is
experiencing a personal transport vehicle boom, and Chinese consumers are showing growing interest in
passenger cars as well as SUVs and vans. Company officials raised their estimation of sales prospects for
the Carnival and decided to launch it earlier than originally planned. Carnival production began in
Yencheng, Jiangsu Province in 2004, and annual output capacity will be increased from the current
50,000 units to 130,000 units at year’s end, and 400,000 units by 2010. This reflects an overseas
production expansion plan that aims to make Kia and Hyundai the world’s fifth largest automaker by
2010.
A Resounding Reception for Opirus in China Kia Motors participated in the Shanghai Motor Show between April 21 and April 24, 2003, showcasing
ten models including the new-concept KCV Ⅱ, Opirus, Optima / Magentis, Spectra, Rio, Sorento,
Carnival, Carens and two TianLiMa produced by Dongfeng-Yueda-Kia. At a preshow press conference
on the 20th, Kia officially unveiled the Opirus, which drew a highly favorable response from local
journalists, who were impressed by its distinguished and classy design.
▶ Surging local production and sales have made theTianLiMa a top selling economy car in China.
▶▶ A visit to the Kia Head Office by Chairman &General Manager of the Jiangsu Yueda Group, amajor Chinese partner, has helped to boostcooperative ties.
Growth Trend(units)
Pride
53,546
02 03
Production Capacity(units in thousands)
50
130
(P)03 04
Tianlima
CBU
30,408(+131.4%)
23,138

Beyond Quantity, Kia to Focus on Building Brand Value
as a maker of High-end Automobiles
24 Kia Motors Corporation
P r o d u c t i o n & Q u a l i t y

2003 Annual Report 25
Slight Decline in Overall Output, but Stepped up Sorento SalesKia Motors’ three domestic plants boast an annual output capacity of 1,150,000 units, but actual
production for 2003 was 852,598 units, down 2.2% year on year. The total breaks down as 280,640 at
Sohari, 427,595 at Hwasung plant, and 144,363 at Gwangju. The plants operated at 74% of total
capacity, slightly lower than in 2002. Major factors contributing to this drop in output were, sluggish
domestic sales throughout the year; readjusting output at the Gwangju plant to 300,000 units in the
wake of the July-August strike; resource allocations needed to launch new models; production delays
during wage negotiations; and the introduction of a 40-hour workweek.
However, positive changes have also been made at the Kia plants in 2003. Utilization rate of the Line 1 at
Hwasung has increased from 40 units per hour to 44.4, enabling the company to accommodate
increased demand for the Sorento. Lines 2 and 3 at Hwasung are now fully ready for mass production of
the Cerato and Opirus. Importantly, the quality index has improved throughout production operations,
and receipt of ISO 14001 certification by all three plants has bolstered the corporate image related to
environmental protection.
High Quality Assessment Received Overseas Ongoing quality improvement efforts have resulted in highly positive ratings for Kia vehicles from
numerous overseas automobile evaluation organizations. The Sorento was ranked first among 12 mid-
sized SUV models covered in an AutoPacific vehicle satisfaction survey of American consumers (results
released in May 2003). The Kia SUV also topped a total quality index study conducted by Strategic Vision
(results released in June) in the mid-sized SUV category. The Carnival, meanwhile, was ranked third
among 13 models surveyed.
The quality of Kia products has been clearly recognized. An IQS survey by J.D.Power and Associates
included an assessment that said Kia Motors had achieved the most extensive quality enhancement over
the past two years. Specifically noted were the consistant quality of components and improvement in
adherence to basic quality standards. Kia officials are confident the outstanding quality of new models
recently introduced will further boost the company’s quality ratings in 2004.
Output Capacity Stepped Up and Operation Rate Made More Efficient The expansion of the Gwangju plant capacity from 210,000 units to 350,000 units and raised total
annual output capability to 1,250,000 units. The company expects to produce 992,000 vehicles in 2004,
which would be an operation rate of 80%. Moreover, Donghee Auto, a partner with a plant in Seosan,
Korea capable of turning out up to 150,000 units a year, will be commissioned to build 110,000 units of
the Morning, one of Kia’s latest models, in 2003. Kia’s goal is to reach the pinnacle of operations
performance in the world automobile industry, by 2007.
▶ Customer satisfaction has improved after Kiaimplemented various pre-shipment procedures toensure new cars are delivered at their very best.
▶▶ The Namyang Research and Development Center,jointly operated by Kia Motors and Hyundai Motor,has made quality enhancement its top priority.The state-of-the-art facility boasts some of thebest engineers in the business.
∙Annual Full Capacity 1,150,000 Units∙OEM Included
Hwasung 600,000 units▶ ’03 : 427,595 Units
Gwangju 210,000 units▶ ’03 : 144,363 Units
Sohari 340,000 units▶ ’03 : 280,640 Units
∙ FY03 Donghee Automotive production
excluded
Utilization Rate
74%
76%
74%
01 02 03
Production(Units)
851,740
872,086 852,598
01 02 03
Production Capacity

A Promise to Deliver Vehicles that Exceed
Customer Expectations
26 Kia Motors Corporation
R e s e a r c h & D e v e l o p m e n t

2003 Annual Report 27
Consolidation of R&D Resources at Namyang R&D Center - ImprovedDevelopment Efficiency and Synergy Effect In May 2003, Kia and Hyundai’s various R&D centers in Ulsan, Namyang and Sohari were consolidated
into one centralized research and development hub. The Namyang Research and Development Center
has become the heart of automobile research and development in Korea. Situated on a 3,465,000m2 site,
the Center boasts a full range of equipment and a broad pool of manpower, offering the means to carry
out all phases of automobile development, from body design, engineering design, testing and power
train development, basic research, electronics research and a pilot production center. The new facility will
greatly increase development efficiency and generate synergy.
Design and Technical Center Inaugurated in North AmericaHyndai and Kia Motors have announcee the inauguration of the Hyundai/Kia Motors Design & Technical
Center in Irvine, California. The construction initiated in November 2001 has been completed, resulting in
a compound over an area spanning 29,200m2 with a total floor area of 8,250m2. The state-of-the-art,
2-story R&D center is a platform for researching concept cars and adjusting vehicles already in mass-
production to better satisfy local market requirements. The Center conducts a broad range of research on
both Kia and Hyundai models, and the two companies will certainly benefit from the synergy created in
such a collaborative environment. Some 100 Korean and American automobile designers, engineers, and
prototype and model markers will work at this Center.
Massive Proving Ground under Construction in the US The construction of a 17,160,000m2 proving ground is underway in California’s Mohave Desert.
Scheduled for completion in late May, 2004, the US$50 million facility will be equipped with a four lane
tracks 10.4km long, a parking facility of nearly 200,000m2 and an onsite R&D center. This proving ground
and test site, will to serve as a strategic developmental launchpad for the North-American operation for
both Kia and Hyundai. It will conduct performance and durability tests on Hyundai and Kia cars and their
locally developed automotive components.
KRW1.4 Trillion Earmarked for Investment in 2004Kia Motors plans to invest KRW1.428 trillion, or about 9% of total sales revenue, in 2004. The budget
will cover stepped up R&D on new models, the cost for building or expanding engine and transmission
plants, and remodeling of the Gwangju plant. Meanwhile, the market debut of Cerato in late 2003 will
be followed by other models to be successively launched in 2004. In January 2004, the Bongo III(Light
Cargo Truck), built around an environment-friendly engine, was launched in response to stiffening
environmental regulations, and in February, the Morning, a next-generation, lightweight export model
was launched. Second half launches include the KM, a new-concept SUV, and the JB, the successor to
the Rio, providing additiional opportunities to expand domestic and overseas sales.
▶ The J-2.9 common-rail diesel engine equippedwith turbocharger inter-cooler.
▶▶ Kia researchers are testing performance andsteadily improving quality so that the company canrank among the world’s top five in terms of qualityby 2010.
■ R&D■ PP&E
∙ Increased R&D investments for
new car development
∙ Building and expanding engine &
transmission production facilities
∙ PP&E investment for rationalizing
& remodeling of Gwangju plant
CAPEX Trend(Korean Won in billions)
623
214
409
760
234
526
1,425
413
1,012
01 02 03
CAPEX Trend(of Revenue)
5.6%
6.3%
11.1%
01 02 03

Innovative Marketing Approaches to Maximize
Product Value
28 Kia Motors Corporation
M a r k e t i n g

2003 Annual Report 29
Proactive Company-wide Marketing Organization The entire Kia organization was overhauled in 2003 to improve the capabilties to forecast changing
market trends and respond to them more effectively. The Product Planning Division was expanded and
restructured to raise efficiency.
Geared up for Global Marketing In 2003, Kia Motors completed a master plan for mid-/long-term marketing strategies and consolidated
the overseas marketing network for enhanced competitiveness. Marketing specialists were dispatched to
the overseas regional headquarters and offices to oversee local sales and marketing activities. In October,
the “Brand Strategy Task Force” was formed to strengthen the Hyundai and Kia brands and promote the
quality aspects of Kia and Hyundai vehicles as part of the effort to join theglobal Top Five automakers by
2010. The current brand status has already been carefully assessed, and global brand identity strategies
are now being developed. Once these are in place, brand management and brand asset management
systems are planned.
Stronger Product Competitiveness As new models such as the Opirus and Cerato are launched, Kia is improving their marketability by
carefully determining the sales prices that best reflect local market conditions and ensuring designs and
specifications match local needs. At the same time, the company seeks to identify new car concepts
ahead of the competition and reflect them in new model development.
Diverse Marketing Approaches, Strengthened Sports Marketing Kia is bolstering its domestic market position by targeting women, offering VIP programs, organizing
cultural events for customers, and utilizing customer relation management. Overseas, product unveilings
are held for major international motor shows. Finally, the company sponsors the Australian Open, the
Davis Cup and other international sporting events to raise brand recognition.
▶ Kia Motors attends all the leading motors shows(Frankfurt, Detroit and Tokyo, among them) toengage in marketing and exhibit concept cars thatmanifest world-class technology.
▶▶ Kia has concluded contracts to sponsor theAustralian Open and other major sporting events,projecting a dynamic worldwide image that helpsboost sales.
Motor Show Attended in 2003
March 4 ~ March 16
Geneva International Motor Show
April 21 ~ April 27
Shanghai Motor Show
September 9 ~ September 21
Frankfurt Auto Show
October 1 ~ October 12
Busan International Motor Show
October 22 ~ November 5
Tokyo Motor Show
Sports Marketing
EventParticipation
Capacity
Australian Open
Tennis
Championship
Davis Cup
Korean National
Ski Team
Tour de Lankawi
Bicycle Race
Official Sponsor
(2002 ~ to date)
Official Sponsor
(2003 ~ to date)
Sponsor
Official Sponsor
(2003-2005)

Kia’s determination to keep growing has not been dampened by the global economic downturn,
and trade barriers have not dampened the corporate spirit of challenge. The company has
elevated annual exports to 500,000 units, worth some US$5 billion, by remaining focused on
developing next-generation technology, improving quality, and diversifying overseas markets.
Global customer satisfaction is the key to generating revenue, and every effort is also being
made to satisfy shareholders.
▲ Strategic Vision, a US-based automotive consulting firm, made the Sorento its top pick in
the 2003 Total Quality Index for the mid-sized SUV category and praised the vehicle in the
New York Times. The Sorento’s superior quality and price competitiveness has made it an
important component in Kia’s global advance.

Passenger Line-up
it’s a test of pure mastery.
To the top five automakers, it’s not a race,
CeratoCompact Sedan with a New FeelThe Cerato is setting new trends in near
mid-sized sedans, coupling sexy styling
and responsive handling with a luxurious
interior. This car promises a driving
experience that will exceed all
expectations.
>> Rio SFSedan with Top-class SafetyA buyer’s decision is made with extra care
when loved ones are involved; safety,
power and styling are all concerns. You
want to ensure your new car will be safe,
technologically advanced and
comfortable, making the Rio SF, with
unsurpassed safety, the easy choice.
>> Morning / PicantoRunning Free The Morning is not just a car; it’s your
fashion statement designed for safety and
that special feel. And the 1,000cc engine
will provide a freedom that’s yours alone.
It will be love at first sight, and the car will
continue to grow on you the longer you
drive it.
>>

Increase market value (share price)
Raise outsider confidence (higher credit rating)
Strengthen internal competencies
∙Build IR support network → investor management system∙Improve ability to provide timely IR information → upgraded homepage contents∙Cultivate IR specialists
Improve external IR activities
∙Hold corporate briefings, organize road shows∙Raise transparency by providing timely financial data → take advantage of online channel∙Expand top management's involvement in IR activities
A Commitment to Shareholders’ Interest
32 Kia Motors Corporation
I R I n f o r m a t i o n
IR Activities in 2003
·March Moody’s Corporate Credit Ratings Review
Deutsche Securities Investors Conference
Annual Report Release (Korean, English)
Annual General Shareholder’s Meeting
·May 1st Quarter Business Results Briefing
S&P Corporate Credit Ratings Review
IR Activities in 2003
·June Non-Deal Road Show in US
·August 1st Half Business Results Briefing
·October Non-Deal Road Show in Europe
China Plant Tour for Investment Institutions
·November Non-Deal Road Show in Asia
3rd Quarter Business Results Briefing
2004 IR Strategies

Kia Motors
January 2003 February March April May June July August September October November December
130
(%)
125
120
115
110
105
100
95
90
85
80
75
KOSPI
2003 Annual Report 33
KIA Motors Share Price vs. KOSPIThe price of Kia Motors stock moved along with the composite price index early in 2003, but fell below the average rate of share price changes from July.
Kia shares indicated the first signs of a rebound in October and were back on pace with the overall market by year’s end. The reasons Continued labor
unrest in July and August and a general economic downturn in Korea kept the share prices low through the third quarter. However, domestic sales rose in
the fourth quarter and overseas operations outperformed original expectations, enabling the company to achieve its 2003 performance targets. Kia
management is resolutely determined to achieve even better results in the year ahead to boost value for the investor.
2003
No. of Shares (in thousands)
Stock Price(Based on the Closing price, KRW)
Liability / Equity
Total Debt / Total Asset
Net Debt / Equity
Total Debt / EBITDA
EBITDA / Interest Expense
PER (Price Earnings Ratio)
EPS (Earnings per Share, KRW)
ROE (Return on Equity)
EV / EBITDA
Equity held by Foreigners
Dividend Rate
Dividend Propensity
359,730
10,900
109.9%
19.1%
3.8%
1.67x
11.90x
5.64x
1,947
14.95%
3.22x
33.10%
7%
17.8%
2002
369,730
8,800
122.6%
16.5%
Net Cash
1.35x
7.39x
5.05x
1,743
17.13%
2.88x
17.26%
5%
14.35%
2001
369,597
8,860
148.7%
24.4%
40.5%
2.11x
5.15x
6.22x
1,424
17.11%
4.77x
13.41%
-
-

34 Kia Motors Corporation
C e r t i f i c a t i o n s & A w a r d s
Motivated by Acclaims and Honors to Work Even HarderThe ISO 14001 certifications obtained by all three domestic plants are enhancing Kia’s public image. The Hwaseong plant has
been granted an internationally recognized national calibration and testing laboratory accreditation for 5 years (May 2003 to
May 2008) on 20 length measurements such as torque wrench, vernier calipers and vehicle inspection equipment as well as one
category related to torque measurement. Meanwhile, many areas were improved to ready the plant for the various ISO
certification inspections by the Korea Agency for Technology and Standards under the auspices of the Ministry of Commerce,
Energy & Energy. The upgrades at the Hwaseung plant have dramatically improved the quality of parts and components and
slashed raw-material costs.
Motorweek Driver’s Choice AwardThe Sorento and Carnival earned the highest recognition in the US. The Sorento was honored as the best mid-size SUV in the
2003 Motorweek Drivers’ Choice Awarda, part of a weekly program aired on the US channel PBS. Meanwhile, the Carnival was
selected as the best mini-van by Car Book; and the Sorento scored high in all rating categories.
Receiving Acclaims and Honors Is Even
More Reason to Work Harder

2003 Annual Report 35
Sorento Wins the 2003 Customer Satisfaction Award by Strategic VisionStrategic Vision, a renowned American automobile industry consultancy selected Sorento for its 2003 Customer Satisfaction
Award in the mid-size SUV category. This comes on the heels of receiving AutoPacific’s Customer Satisfaction Award. The
Sorento has been hailed as a new prodigy among mid-sized SUVs. Industry watchers point to the Sorento’s outstanding
stability, high quality parts, features that outclass the other SUV’s of its size, and industry-leading warranty. The Sorento has
also been selected as the Best SUV US$25,000 by the New England Motor Press Association, and the Best SUV of its class by
the Northwest Automotive Press Association.
Kia Recognized for Contribution to Korean Exports On November 28, Kia Motors was awarded the US$5 Billion Export Tower Award on the government’s 40th International Trade
Day. Vice-Chairman Noe-Myeong Kim was also awarded the Gold Tower Order of Industrial Service Merit for his contribution
to the export achievement. The record-breaking achievement was largely due to Kia’s focus on new model development,
strengthened overseas dealer network and ongoing quality improvement. The market responded enthusiastically to the Opirus
and Cerato in 2003, and Kia Motors is aiming for more great hits in the coming year. The economical Picanto; the CT, which is
a Pregio upgrade; and the compact SUV to be known as KM are all scheduled for launch.

Proclamation of Ethical ManagementIn 2003, Kia Motors and Hyndai Motor jointly pledged to ensure equity and transparency in all business dealings. To this end,
the companies engage in public biddings and have adopted an online procurement system. The “Ethical Management”
proclamation encompasses the following areas: ▲Protecting consumer rights and interests, and keeping all promises ▲
Protecting the environment, participating in community action programs, contributing to business transparency in Korea ▲
Implementing fair and open bidding processs.
At the Top for Environment Management, Too Kia Motors and Hyndai Motor have pledged a common commitment to the environment. They are resolved to be ranked
among the world’s top five for environmental management performance by 2010. The detailed action plan included the
following tasks: ▲Set up a system for environment-friendly vehicles to meet the requirements of ever-stricter environmental
regulations ▲Reduce pollution emissions and waste generation, practice green procurementand production ▲Practice
environmental management at points of contact with customers.
Healthy Corporation for a Healthy Society
36 Kia Motors Corporation
B u s i n e s s E t h i c s & E n v i r o n m e n t
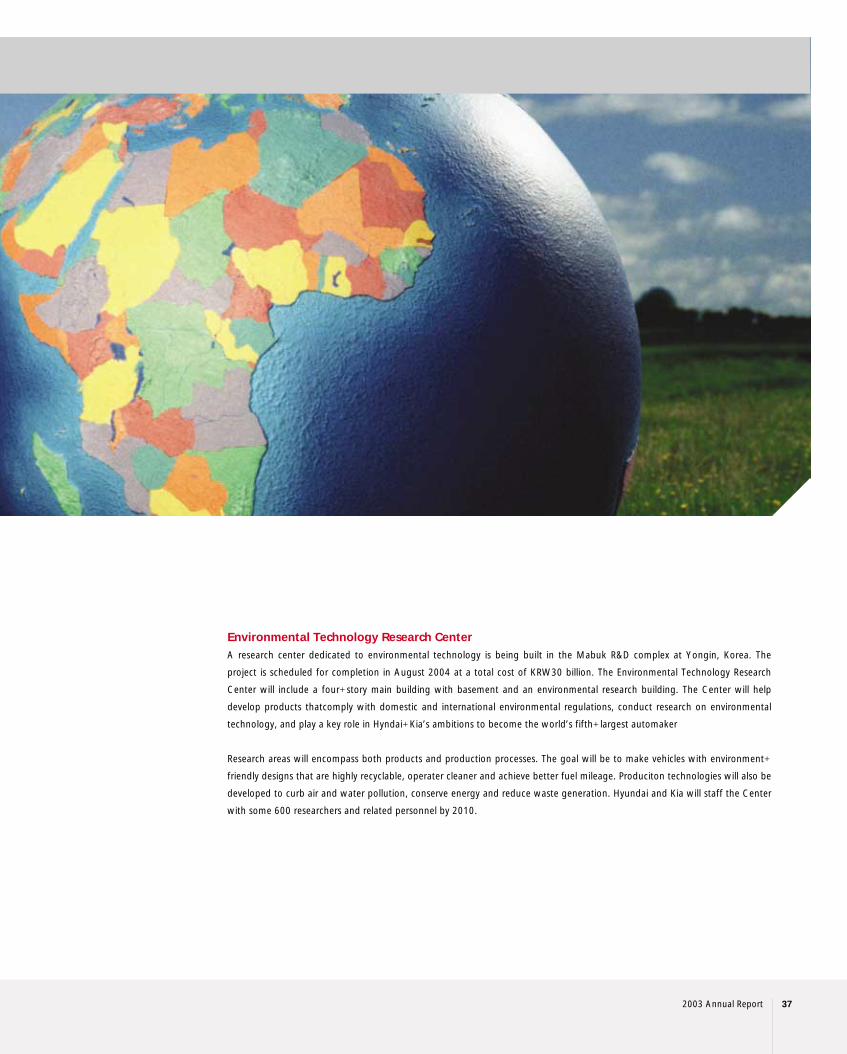
Environmental Technology Research Center A research center dedicated to environmental technology is being built in the Mabuk R&D complex at Yongin, Korea. The
project is scheduled for completion in August 2004 at a total cost of KRW30 billion. The Environmental Technology Research
Center will include a four-story main building with basement and an environmental research building. The Center will help
develop products thatcomply with domestic and international environmental regulations, conduct research on environmental
technology, and play a key role in Hyndai-Kia’s ambitions to become the world’s fifth-largest automaker
Research areas will encompass both products and production processes. The goal will be to make vehicles with environment-
friendly designs that are highly recyclable, operater cleaner and achieve better fuel mileage. Produciton technologies will also be
developed to curb air and water pollution, conserve energy and reduce waste generation. Hyundai and Kia will staff the Center
with some 600 researchers and related personnel by 2010.
2003 Annual Report 37

Ambulances for Earthquake-stricken AlgeriaKia Motors donated six Pregio ambulances effort after an earthquake-devastated Algeria. The company also dispatched a
mechanic to service Kia cars damaged in the quake.
Bus for Gwangju’s Sangmu Soccer Team The company donated a Granbird bus to Sangmu Bulsajo, the Gwangju football team. The donation was made after Kia
management learned the team was having problems in getting to their games away from the home stadium. The Kia Tigers, a
professional baseball team, also has Gwangju as its home base and one of Kia’s three domestic plants is located in the
southwestern Korean city.
Special Help for Flood-striken Areas In September 2003, Kia Motors, Hyundai Motor, and Hyundai Mobis (a parts supplier) jointly ran a Disaster Relief Headquaters
that dispatched emergency relief teams to devastated areas. The companies also offered repair services for vehicles damaged in
the floods. A disaster relief fund of KRW 5 billion raised by Chairman & CEO, Mong-Koo Chung, and the employees was
donated to the National Association for Disaster Relief.
A Corporation in and for the Community,
Enjoying the Respect of Citizens
38 Kia Motors Corporation
C o r p o r a t e C i t i z e n s h i p
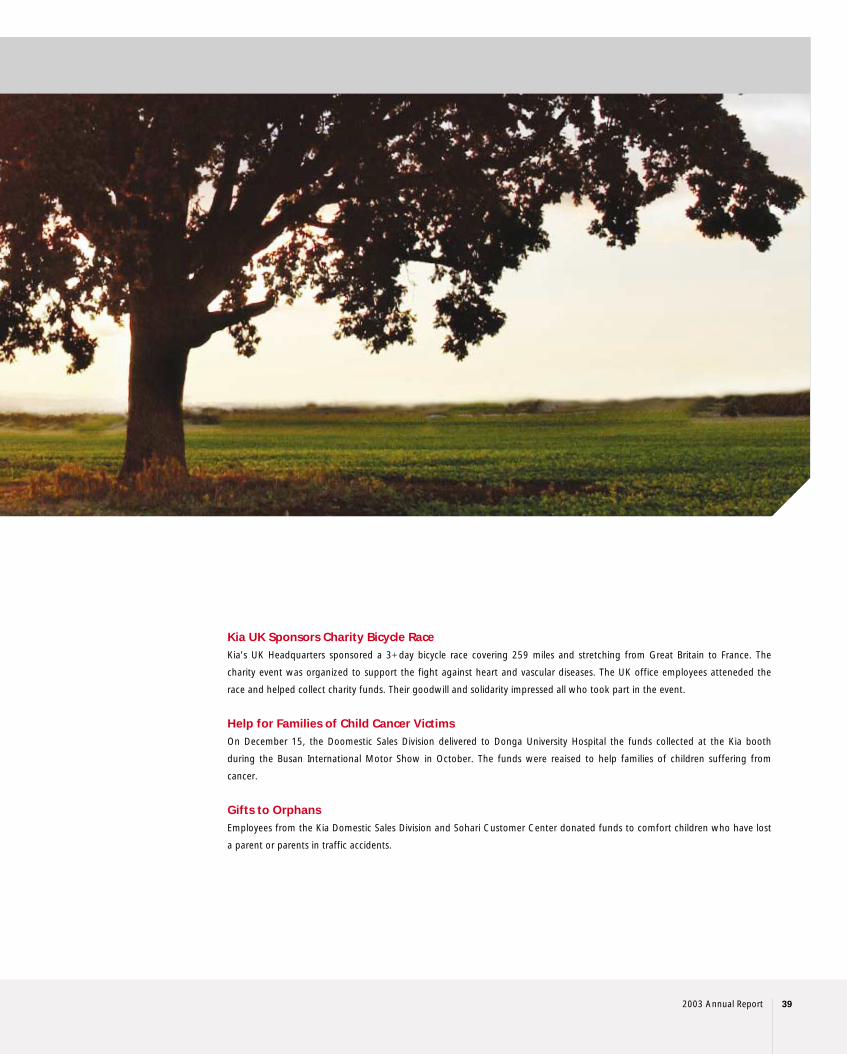
Kia UK Sponsors Charity Bicycle Race Kia’s UK Headquarters sponsored a 3-day bicycle race covering 259 miles and stretching from Great Britain to France. The
charity event was organized to support the fight against heart and vascular diseases. The UK office employees atteneded the
race and helped collect charity funds. Their goodwill and solidarity impressed all who took part in the event.
Help for Families of Child Cancer VictimsOn December 15, the Doomestic Sales Division delivered to Donga University Hospital the funds collected at the Kia booth
during the Busan International Motor Show in October. The funds were reaised to help families of children suffering from
cancer.
Gifts to Orphans Employees from the Kia Domestic Sales Division and Sohari Customer Center donated funds to comfort children who have lost
a parent or parents in traffic accidents.
2003 Annual Report 39

Kia’s corporate interests are not confined to the automotive industry. The company is committed
to fulfilling all social obligations as a global corporation to help make the world a better place.
Kia sponsors major international sporting events to solidify its global presence, and the
shareholders play an important role in Kia’s effort to make a positive difference.
▲ The Morning/Picanto, a European-style A-segment car with 1,000cc engine, was
officially launched in February 2004. The new mini-car targets buyers who want to save
money and is designed to appeal especially to women who value roominess and safety.
KIA. Using our resources to YOUR advantage.

RV Lineup
Sorentoa Beautiful PerformerMore than powerful, the
Sorento is beautiful.
Curtain-type airbags and
upgraded features take
safety and luxury to new
heights for added value
and greater satisfaction.
>> Carnival IIKorea’s Best-selling MinivanThe Carnival II promises stability and
reliability under all driving conditions, with
the looks and power to lead in its class.
The noble character of this minivan remains
unchanged over time, and its quality is well
documented: The Carnival II is sold in over
70 countries, and it won top marks for
customer satisfaction in the US.
>> Carens IIAll the Comforts of HomeThe Carens II is loaded with
features for maximum comfort.
Originally equipped with a
powerful yet surprisingly
economical LPG or gasoline
engine, it is now also available
with a gasoline engine that delivers
a car-like feel.
>> Xtrekthe Multi-Purpose VehicleThis vehicle was designed to put
more zest in life, making driving a
pleasure in both rural and urban
settings. SUV styling and minivan
functionality, versatile interior, and
powerful common-rail diesel
engine add up to fun.
>>

SalesKia sold 319,795 finished vehicles in Korea in 2003, down 28% from the previous year. However, exports
were up 19.8% to 538,902 units, for 858,697 total finished units sold, 4% lower than in 2002.
The Korean automobile industry suffered from sluggish domestic demand as a result of a protracted
economic downturn. Extended strikes by workers and less industrial demand for passenger cars were the
principle reasons for the reduction in units produced and sold. Kia’s market share of the domestic
passenger car fell 2.7% points to 23.8% during 2003.
On the other hand, Kia retained the top share of the Korean RV (SUV/MPV collectively) market even
though the number of units sold was down 21% year on year. Performance was buoyed by the robust
sales of the Sorento, Carens and X-Trek lines.
Despite the poor domestic sales, the export volume reached 538,902 units, or 19.8% higher than in
2002. Of these growing exports, 156,675 units were shipped to Europe, which represented 29.2% of
total exports in 2003, nearly 7% points higher than in 2002. As the result, Europe has quickly become
the company’s second largest export market.
Revenue in 2003 totaled just under ₩12.84 trillion, a 5.6% year-on-year rise that reflects an adjustment
for vendor sales of goods to be repurchased post-manufacture. The domestic market represented 40% of
the total revenue, and the remaining 60% was from overseas. The ₩618.8 billion growth in total
Sales (Units)
Domestic
Export
Sales (KRW in millions)
Domestic
Export
Cost of Sales (KRW in millions)
Cost of Sales Ratio
2003
858,697
319,795
538,902
12,839,881
5,126,358
7,713,523
10,084,078
78.5%
894,268
444,444
449,824
12,158,113
6,304,394
5,853,719
9,581,392
78.8%
899,788
411,321
488,467
11,129,204
5,146,620
5,982,584
8,531,616
76.7%
2002 2001
Management’s Discussion & Analysis
42 Kia Motors Corporation
Export Breakdown by Region(Based on Number of Shipment Units)
Export Shipment(Units)
538,902 Units
02
9.4%
7.7%
5.5%
29.2%
48.2%
03
* KD Shipments Excluded ** Local Production Included
U.S
Europe*
China**
2003
229,426
156,675
55,074
222,872
98,665
22,536
233,008
100,499
14,587
2.9%
58.8%
144.4%
2002 2001 Growth (2003-2002)
Sales(KRW in Billions)
11,129.2
5,146.6
5,982.6
12,158.1
6,304.4
5,853.7
12,839.9
5,126.4
7,713.5
01 02 03
RV Sales(KRW in Billions)
4,259
2,064
2,195
6,060
3,190
2,870
6,648
2,625
4,023
01 02 03
■ Domestic■ Export
■ Domestic■ Export
Asia / Pacific
Mid East / Africa
Latin America
Europe
N. America
449,824 Units
55.2%
21.9%
7.2%
8.1%
7.6%

2003 Annual Report 43
revenue included a ₩495.8 billion increase from a better product mix, and additional ₩203.8 billion
from increased knocked-down unit export and other sales. Meanwhile, exchange rate fluctuations
reduced the total revenue figure by ₩17.8 billion.
ProfitabilityOperating income in 2003 was 6.3% of total sales, the highest profitability ever. The better performance
can be attributed to stronger competitiveness from successful new models, overall better quality, and an
improved cost structure. The steadily rising profitability will continue in the future.
The number of total units sold in 2003 was lower than the 2002 figure, and the Won/Dollar rate fell
₩52 during the year to ₩1,192. The steadily improving product mix has been a major reason for the
higher profitability. The large passenger cars, SUVs and MPVs are the company’s most profitable lines,
and their portion of total sales has risen from 33% in 2001 to 41% in 2002 and 47% in 2003. This
growth has allowed the company to earn more money while selling fewer units per year because of the
sharp decline in the domestic market. The average sales price (ASP) per unit has also risen to ₩15.1
million for domestic market and US$11,200 for export market, helping to boost overall profitability.
Cost of Goods SoldCOGS in 2003 exceeded ₩10.84 trillion, or 78.5% of total sales, up 5.2% (₩502.7 billion) from that in
2002. Raw materials cost was elevated ₩380.3 billion in 2003 to over ₩7.89 trillion by the greater
number of high-value-added models sold in the product mix. Manufacturing cost was also increased by
₩13.1 billion in 2003 totaling about ₩1.12 trillion. However, due to the increase in the total revenue,
the ratios as percentage of total revenue for raw materials cost (61.5%) and manufacturing cost (7.8%)
were decreased by 0.3% year-on-year. Salary and wage hikes drove labor expenses up 10% year on year
to ₩109.3 billion, with the ratio of labor expense to total revenue rising 0.4% points to 9.2%.
SG&A ExpensesSG&A was increased 1.3% (₩25.1 billion) to approximately ₩1.94 trillion in 2003. On the other hand,
the ratio of SG&A to total revenue fell 0.7% points, from 15.8% to 15.1% during the year because of
the higher total revenue.
Despite the wage increase, the total labor expense was increased only 3% year on year. It was due to the
decreased domestic sales incentive payment for sales personnel resulted by poor domestic automobile
sales condition. The lower overseas sales promotion expense in 2003 was possible by improved product
quality and brand value, but the sluggish domestic sales forced the company to step up its domestic
promotional effort. On balance, the overall sales promotion expense was down by 12.3% year-on-year.
The warranty expense was down 3.4%(₩14.4 billion) compare to the previous year. The actual warranty
expense increased ₩32.9 billion. However, the end-of-life vehicle (ELV) cost burden in Europe was
ASP Change
9.4
12.1
9.9
13.615.1
11.2
01 02 03
Domestic (Million KRW)
Export (Thousand US$)
Product Mix Change
0.5% 0.3%2.6%
01 02 03
32.3%
44.6%RV (SUV, Mini-Van, MPV)
Full Size Passenger
Sales
Operating Income
Operating Margin
Net Income
Net Margin
Earnings per Share(KRW)
2003
12,839,881
812,440
6.3%
705,423
5.5%
1,947
12,158,113
658,493
5.4%
641,379
5.3%
1,743
11,129,204
522,241
4.7%
552,235
5.0%
1,424
2002 2001
40.7%
(Korean won in millions)

Management’s Discussion & Analysis
44 Kia Motors Corporation
shifted from the Head Office to Eurpean subsidiaries, and also the costs for proactive vehicle inspections
increased as the company worked to correct problems before they became customer complaints. In
addition, improved product quality lowered warranty claims in North America, which caused decrease in
the provisions for warranties.
Non-operating Income & ExpensesNon-operating income reached ₩456.2 billion in 2003, which was ₩86.5 billion lower than that for the
previous year. The main factors behind this drop: The gain on foreign currency translation, which is linked
to exchange rates, was down ₩154.8 billion; the gain on equity evaluation method rose ₩9.5 billion,
and other non-operating income was ₩57.9 billion higher than in 2002. .
Non-operating expenses increased ₩15.1 billion year on year to ₩415 billion in 2003. The lower
average balance in borrowings and market interest rates brought the interest expense down ₩43.8
billion from the 2002 figure, but foreign exchange losses from fluctuating exchange rates increased
₩42.5 billion. New facilities expansion at the engine and transmission plants prompted the sale or
shutdown of old facilities. As a result, losses on the disposal of tangible assets were 26.5 billion higher in
2003 than they were a year earlier. Meanwhile, other non-operating expenses were down ₩10.1 billion.
Net Income/EPS/Income TaxesThe improved 2003 performance resulted in a net income of ₩705.4 billion, up 10% year on year.
Earnings per share improved 11.7% to ₩1,947, and company officials are confident that this rising trend
will continue. On the other hand, income taxes were ₩11.7 billion lower because ₩20 billion in tax
credits generated since the closure of the 2002 books were applied against the income tax expense for
2003.
Assets
Tangible Assets
The cash inflow was boosted by increased sales of automobiles with higher added value. In 2003, short-
term financial instruments with maturity within 90 days were treated as cash or deposits, driving this
account up 88% year on year to ₩675 billion. Cash & Cash equivalent, which includes short-term
financial instruments and marketable securities, rose ₩395.3 billion to almost ₩1.94 trillion. The drop in
2003 domestic sales volume caused automobile trade receivables to decrease by ₩139.8 billion from
that for the previous year, while greater product inventories boosted overall inventories by ₩109.7
billion.
Assets
Liabilities
Shareholders’ Equity
Debt-to-Equity Ratio
Equity-to-Asset Ratio
2003
11,211,132
5,868,953
5,342,179
109.9%
47.7%
9,112,648
5,018,964
4,093,684
122.6%
44.9%
8,438,466
5,045,450
3,393,016
148.7%
40.2%
2002 2001
Earnings per Share(Korean won)
1,424
1,743
1,947
01 02 03
Debt-to-Equity Ratio
148.7%
122.6%
109.9%
01 02 03
(Korean won in millions)

2003 Annual Report 45
Fixed Assets
The acquisition of affiliated company stocks and capital increases at overseas subsidiaries to ensure
smooth parts supply and boost exports caused long-term investment securities and equity method gains
to grow ₩214.4 billion year on year. Increases in the share prices for marketable securities such as
Hyundai Mobis also helped to boost investments of ₩819.4 billion to almost ₩1.12 trillion at the end of
2003.
Investments related to new model development were increased. At the same time, engine and
transmission production facilities were either expanded or newly built, and the production line at the
Gwangju plant was expanded. As a result, overall annual investments were ₩494.5 billion higher in
2003 than it had been the year before.
Intangible assets also increased ₩154.1 billion because R&D expenses related to such new models as the
Sorento, Morning and KM mini-SUV were capitalized.
Liabilities
Current Liabilities
Increased overseas sales drove up raw material costs and parts procurement, resulting in a modest ₩96.3
billion growth in trade accounts payable year on year. The company issued ₩500 billion in commercial
paper to ensure constant usable liquidity in a domestic capital market beset by widespread credit card
delinquency problems in 2003. The higher banker’s usance from a change in import methods and the rise
in exports elevated short-term borrowings ₩147.7 billion to ₩748.6 billion in 2003. In addition, the
current portions of debentures and of long-term debt was increased to ₩369.6 billion as corporate
bonds came within one year of maturity.
Long-term Liabilities
Long-term borrowings and debentures totaling ₩480.4 billion were redeemed as matured borrowings
and reclassified on the books as current borrowings. The surge in overseas sales volume was expected to
boost overall warranty provision (including both short and long term) significantly. However, steadily
improved quality and the shifting of responsibility for European ELV provision from the Head Office to
local subsidiaries kept the year-on-year increase in warranty provision to ₩27.8 billion. Kia Motors
engaged in various derivative transactions in 2003, and a rising exchange rate at the end of the
accounting year caused a temporary loss on evaluation. Derivative instruments credit has increased by
₩96.9 billion from the 2002 figure.
Shareholders’ EquityThe stock option rights granted in year 2000 were exercised to generate a ₩1 billion gain on the
disposition of treasury stock, causing capital surplus to rise in 2003. A net income of ₩705.4 billion was
generated in 2003, but a 2002 dividend payout of ₩92.0 billion was followed by a ₩88.7 billion share
buyback and cancellation in 2003. As a result, retained earnings increased only ₩524.6 billion year on
year. Meanwhile, profit on paper (valuation income) increased to ₩762.7 billion as a result of higher
prices for listed stocks held by the company. On the other hand, ₩41.6 billion of valuation losses of
short-term(within 12 months) derivative investments occured. Total Capital adjustment was increased by
₩722.8 billion.
Change in Number of Shares(Shares in Millions)
449
369359
00 02 03
Equity-to-Asset Ratio
40.2%
44.9%47.7%
01 02 03

Report of Independent Public Accountants▶ English Translation of a Report Originally Issued in Korean
46 Kia Motors Corporation
We have audited the accompanying non-consolidated balance sheets of Kia Motors Corporation as of December 31, 2003 and
2002, and the related non-consolidated statements of income, appropriations of retained earnings and cash flows for the
years then ended, all expressed in Korean won.
These financial statements are the responsibility of the Company's management. Our responsibility is to express an opinion on
these financial statements based on our audits.
We conducted our audits in accordance with auditing standards generally accepted in the Republic of Korea.
Those standards require that we plan and perform the audit to obtain reasonable assurance about whether the financial
statements are free of material misstatement.
An audit includes examining, on a test basis, evidence supporting the amounts and disclosures in the financial statements.
An audit also includes assessing the accounting principles used and significant estimates made by management, as well as
evaluating the overall financial statements presentation. We believe that our audits provide a reasonable basis for our opinion.
In our opinion, the financial statements referred to above present fairly, in all material respects, the financial position of Kia
Motors Corporation as of December 31, 2003 and 2002, and the results of its operations, changes in its retained earnings and
its cash flows for the years then ended in conformity with financial accounting standards in the Republic of Korea (see Note 2).
The translated amounts in the accompanying financial statements have been translated into U.S. dollars, solely for the
convenience of the reader, on the basis set forth in Note 2.
As explained in Note 2, the Company implemented the Statements of Korea Accounting Standards (“SKAS”) No. 2- “Interim
Financial Reporting”, No. 3 - ”Intangible Assets”, No. 4 -”Revenue Recognition”, No. 5 - ”Tangible Assets”, No. 8 -
“Investments in Securities” and No. 9 - “Convertible Securities” in preparing its 2003 financial statements, which are effective
from January 1, 2003. For comparative purposes, certain accounts in the 2002 financial statements were reclassified.
Also, the statement of income for the year ended December 31, 2002 was revised in conformity with SKAS No. 4. These
reclassification and revision do not affect the net assets and net income but resulted in the decrease of sales and cost of sales
by ₩1,898,338 million (US$1,584,854 thousand) compared with the results based on the previous method.
As discussed in Note 14, the Company completed the stock retirement of 10 million treasury stock on July 2, 2003, which had
been acquired for such retirement purpose under the resolution of the Board of Directors on May 9, 2003. As of December 31,
2003, remaining shares of common stock are 359,730,455 shares.
Accounting principles and auditing standards and their application in practice vary among countries. The accompanying non-
consolidated financial statements are not intended to present the financial position, results of operations and cash flows in
To the Shareholders and Board of Directors of
Kia Motors Corporation:

2003 Annual Report 47
accordance with accounting principles and practices generally accepted in countries and jurisdictions other than the Republic of
Korea.
In addition, the procedures and practices utilized in the Republic of Korea to audit such financial statements may differ from
those generally accepted and applied in other countries.
Accordingly, this report and the accompanying financial statements are intended for use by those knowledgeable about Korean
accounting procedures and auditing standards and their application in practice.
Anjin Deloitte LLC (A Member Firm of Deloitte Touche Tohmatsu)
February 4, 2004 Seoul, Korea
Notice to Readers
This report is effective as of February 4, 2004, the auditors' report date. Certain subsequent events or
circumstances may have occurred between the auditors' report date and the time the auditors' report is read.
Such events or circumstances could significantly affect the accompanying financial statements and may result in
modifications to the auditors’report.

NON-CONSOLIDATED BALANCE SHEETS▶ AS OF DECEMBER 31, 2003 AND 2002
48 Kia Motors Corporation
Korean won (in millions) Translation into U.S.dollars (in thousands)
ASSETS
Current assets:
Cash and cash equivalents
Short-term financial instruments
Marketable securities (Note 6)
Trade notes and accounts receivable, net of
unamortized present value discount of
₩771 million in 2003 and ₩2,540 million in
2002, and allowance for doubtful accounts
of ₩212,553 million in 2003 and ₩217,738
million in 2002
Inventories (Notes 3 and 8)
Other receivables, net of unamortized present
value discount of ₩5,734 million in 2003,
and ₩9,638 million in 2002 and allowance
for doubtful accounts of ₩109,382 million
in 2003 and ₩102,971 million in 2002
Advances and other current assets, net of
allowance for doubtful accounts of
₩33,822 million in 2003 and ₩32,524
million in 2002
Total current assets
Non-current assets:
Long-term investment securities, net of
unamortized present value discount of
₩5,234 million in 2003 (Note 4)
Equity securities accounted for using the equity
method (Note 5)
Investments, net of unamortized present value
discount of ₩23,341 million in 2002
(Note 6)
Property, plant and equipment, net of
accumulated depreciation of ₩2,151,627
million in 2003 and ₩1,882,817 million in
2002 (Notes 7 and 8)
Intangibles, net of amortization (Note 9)
Other assets (Note 10)
Deferred income tax assets (Note 18)
Total non-current assets
Total assets
1,438,661
500,000
-
460,910
675,739
125,818
50,166
3,251,294
1,237,217
719,705
-
4,663,360
453,814
268,397
617,345
7,959,838
11,211,132
₩
₩
2003 2002 2003 2002
763,739
760,131
19,565
589,040
485,018
147,123
156,717
2,921,333
-
378,281
499,775
4,166,854
299,724
240,338
606,343
6,191,315
9,112,648
1,201,086
417,432
-
384,797
564,150
105,042
41,881
2,714,388
1,032,908
600,856
-
3,893,270
378,873
224,075
515,399
6,645,381
9,359,769
637,618
634,606
16,335
491,768
404,924
122,827
130,838
2,438,916
-
315,814
417,243
3,478,757
250,228
200,649
506,214
5,168,905
7,607,821
₩
₩
$
$
$
$

2003 Annual Report 49
Korean won (in millions) Translation into U.S.dollars (in thousands)
LIABILITIES AND SHAREHOLDERS’EQUITY
Current liabilities:
Short-term borrowings (Note 11)
Current maturities of long-term debt and
debentures, net of discount on debentures
issued of ₩571 million in 2003 and nil in
2002 (Note 12)
Trade notes and accounts payable
Accrued warranties
Accounts payable-other
Accrued expenses and other current liabilities
Total current liabilities
Long-term liabilities:
Long-term debt and debentures, net of
current maturities and net of discount on
debentures issued of ₩3,477 million in
2003 and ₩8,700 million in 2002 (Note 12)
Accrued severance benefits, net of National
Pension paid for employees of ₩44,892
million in 2003 and ₩48,018 million in
2002, and individual severance insurance
deposits of ₩771,330 million in 2003 and
₩668,441 million in 2002 (Note 2)
Derivative instruments credit
Long-term accrued warranties
Other long-term liabilities
Total long-term liabilities
Total liabilities
Commitments and contingencies (Note 13)
Shareholders’equity:
Capital stock (Note 14)
Capital surplus (Note 15)
Retained earnings
(Net income of ₩705,423 million in 2003
and ₩641,379 million in 2002)
Capital adjustments (Note 16)
Total shareholders’equity
Total liabilities and shareholders’equity
789,942
482,138
1,674,366
259,415
475,937
157,232
3,839,030
870,278
523,846
96,880
519,061
19,858
2,029,923
5,868,953
-
1,848,652
1,700,956
841,078
951,493
5,342,179
11,211,132
41,299
112,551
1,578,099
253,865
549,384
144,345
2,679,543
1,350,726
477,770
-
491,860
19,065
2,339,421
5,018,964
-
1,848,652
1,699,924
316,427
228,681
4,093,684
9,112,648
659,494
402,519
1,397,868
216,576
397,343
131,268
3,205,068
726,564
437,340
80,882
433,345
16,578
1,694,709
4,899,777
-
1,543,373
1,420,067
702,185
794,367
4,459,992
9,359,769
34,479
93,965
1,317,498
211,943
458,661
120,507
2,237,053
1,127,673
398,872
-
410,636
15,917
1,953,098
4,190,151
-
1,543,373
1,419,205
264,174
190,918
3,417,670
7,607,821
2003 2002 2003 2002
₩
₩
₩
₩
₩
₩
$
$
$
$
$
$

NON-CONSOLIDATED STATEMENTS OF INCOME▶ FOR THE YEARS ENDED DECEMBER 31, 2003 AND 2002
50 Kia Motors Corporation
2003 2002 2003 2002
Translation into U. S. dollars(in thousands, except per share amounts)
Sales (Note 24)
Cost of sales
Gross profit
Selling and administrative expenses (Note 23)
Operating income
Other income (expenses), net:
Interest income (expense), net
Foreign exchange gain (loss), net
Reversal of allowance for doubtful accounts
Loss on valuation of inventories
Gain on valuation of equity securities
accounted for using the equity method
(Note 5)
Loss on disposal of accounts receivable
Gain on disposal of investments
Impairment loss of investments (Note 4)
Loss on valuation of derivatives (Note 21)
Loss on disposal of property, plant and
equipment
Other
Ordinary income
Extraordinary item
Income before income tax
Income tax expense (Note 18)
Net income
Basic ordinary income per common share
(Note 2)
Diluted ordinary income per common share
(Note 2)
Basic earnings per common share (Note 2)
Diluted earnings per common share (Note 2)
12,839,881
10,084,078
2,755,803
1,943,363
812,440
32,837
(1,579)
6,251
(3,395)
53,250
(33,965)
5,563
-
(48,820)
(55,755)
86,772
41,159
853,599
-
853,599
148,176
705,423
1,947
1,945
1,947
1,945
12,158,113
9,581,392
2,576,721
1,918,228
658,493
(13,865)
150,480
5,921
(2,520)
43,776
(40,420)
1,767
(2,550)
-
(42,874)
43,102
142,817
801,310
-
801,310
159,931
641,379
1,743
-
1,743
-
10,719,555
8,418,834
2,300,721
1,622,444
678,277
27,414
(1,319)
5,219
(2,834)
44,457
(28,356)
4,645
-
(40,758)
(46,548)
72,442
34,362
712,639
-
712,639
123,707
588,932
1.63
1.62
1.63
1.62
10,150,369
7,999,157
2,151,212
1,601,460
549,752
(11,575)
125,630
4,943
(2,104)
36,547
(33,745)
1,476
(2,129)
-
(35,794)
35,984
119,233
668,985
-
668,985
133,521
535,464
1.46
-
1.46
-
₩
₩
₩
₩
₩
₩
₩
₩
₩
₩
₩
₩
$
$
$
$
$
$
$
$
$
$
$
$
Korean won (in millions, except per share amounts)

2003 Annual Report 51
NON-CONSOLIDATED STATEMENTS OF APPROPRIATION OF RETAINED EARNINGS▶ FOR THE YEARS ENDED DECEMBER 31, 2003 AND 2002
2003 2002 2003 2002
Korean won (in millions) Translation into U.S. dollars (Note 2) (in thousands)
Unappropriated retained earnings:
Beginning of year
Stock retirement as a deduction of retained
earnings (Note 14)
Net income
Appropriations:
Legal reserve
Reserve for technology development
Cash dividends (Note 19)
Unappropriated retained earnings, end of year
597
(88,742)
705,423
617,278
12,600
478,500
125,448
616,548
730
(324,952)
-
641,379
316,427
9,300
214,500
92,030
315,830
597
499
(74,088)
588,932
515,343
10,519
399,483
104,731
514,733
610
(271,290)
-
535,464
264,174
7,764
179,078
76,833
263,675
499
₩
₩
₩
₩
$
$
$
$

NON-CONSOLIDATED STATEMENTS OF CASH FLOWS ▶ FOR THE YEARS ENDED DECEMBER 31, 2003 AND 2002
52 Kia Motors Corporation
2003 2002 2003 2002
Korean won (in millions) Translation into U.S. dollars (Note 2) (in thousands)
Cash flows from operating activities:
Net income
Adjustments to reconcile net income to net
cash provided by operating activities:
Depreciation and amortization
Provision for severance benefits
Provision for warranties
Reversal of allowance for doubtful accounts
Loss (gain) on foreign currency translation,
net
Loss on valuation of inventories
Gain on valuation of equity securities
accounted for using the equity method,
net
Gain on disposal of investments, net
Impairment loss of investments
Loss on disposal of property, plant and
equipment, net
Amortization of present value discount, net
Compensation expenses on stock options,
net
Loss on valuation of derivatives
Loss on disposal of accounts receivables
Miscellaneous loss
Changes in operating assets and liabilities:
Decrease in trade notes and accounts
receivable
Decrease (Increase) in long-term notes and
accounts receivable
Increase in inventories
Decrease in advances and other receivables
Decrease (Increase) in other current assets
Decrease (Increase) in deferred income tax
assets
Increase in trade notes and accounts payable
Increase (Decrease) in accounts payable-
other
Decrease in other current liabilities
Increase in corporate income tax payable
Payment of warranties
Payment of severance benefits
Other
705,423
468,105
209,909
344,610
(6,251)
19,338
3,395
(53,250)
(5,563)
-
55,755
(4,145)
1,064
48,820
33,965
-
122,675
4,731
(194,115)
47,122
6,613
(11,002)
95,160
(74,981)
(11,153)
23,912
(311,859)
(64,145)
3,200
1,457,333
641,379
459,630
222,579
374,783
(5,921)
(47,661)
2,520
(43,776)
(1,767)
2,550
42,873
864
(368)
-
40,420
3,631
218,008
(1,164)
(67,121)
195,072
(13,750)
54,561
282,928
50,216
(26,730)
70,099
(296,366)
(55,409)
3,590
2,105,670
588,932
390,805
175,246
287,703
(5,219)
16,144
2,834
(44,457)
(4,645)
-
46,548
(3,460)
888
40,758
28,356
-
102,417
3,950
(162,060)
39,340
5,520
(9,185)
79,445
(62,599)
(9,311)
19,964
(260,360)
(53,552)
2,673
1,216,675
535,464
383,728
185,823
312,893
(4,943)
(39,790)
2,104
(36,547)
(1,476)
2,129
35,794
721
(308)
-
33,745
3,031
182,007
(972)
(56,037)
162,859
(11,479)
45,551
236,207
41,924
(22,316)
58,523
(247,425)
(46,259)
2,996
1,757,947
₩ ₩ $ $
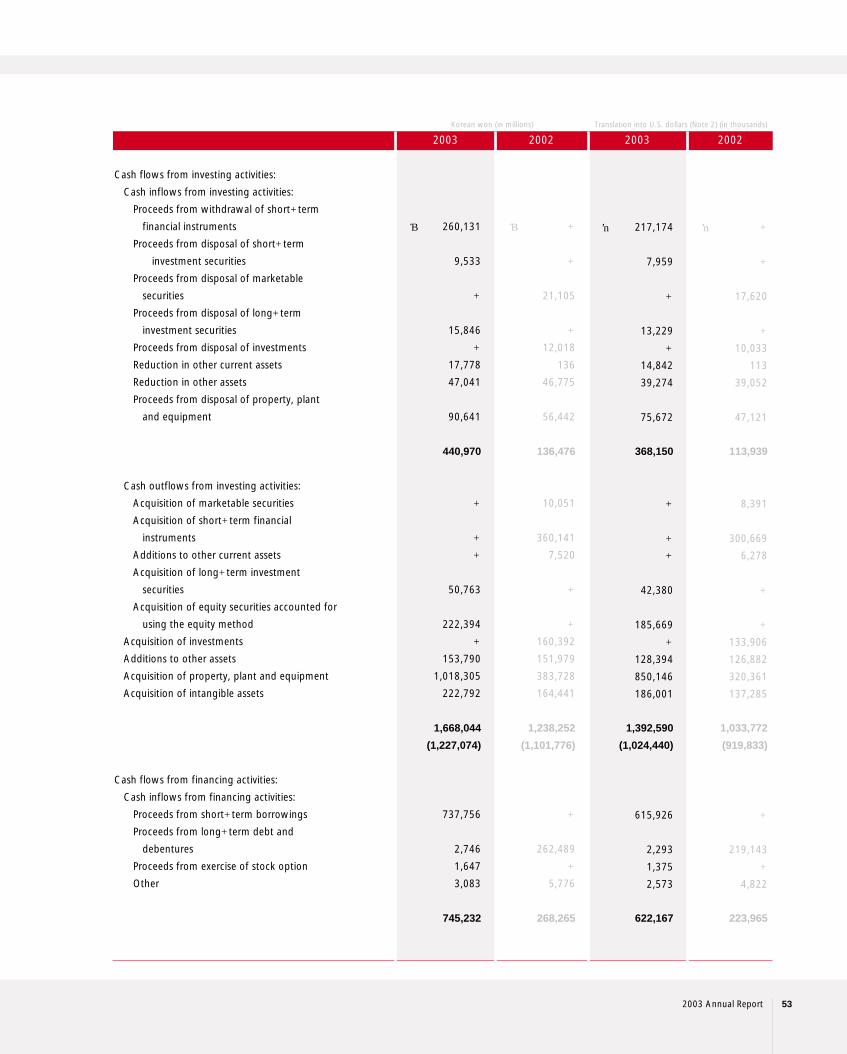
2003 Annual Report 53
2003 2002 2003 2002
Korean won (in millions) Translation into U.S. dollars (Note 2) (in thousands)
Cash flows from investing activities:
Cash inflows from investing activities:
Proceeds from withdrawal of short-term
financial instruments
Proceeds from disposal of short-term
investment securities
Proceeds from disposal of marketable
securities
Proceeds from disposal of long-term
investment securities
Proceeds from disposal of investments
Reduction in other current assets
Reduction in other assets
Proceeds from disposal of property, plant
and equipment
Cash outflows from investing activities:
Acquisition of marketable securities
Acquisition of short-term financial
instruments
Additions to other current assets
Acquisition of long-term investment
securities
Acquisition of equity securities accounted for
using the equity method
Acquisition of investments
Additions to other assets
Acquisition of property, plant and equipment
Acquisition of intangible assets
Cash flows from financing activities:
Cash inflows from financing activities:
Proceeds from short-term borrowings
Proceeds from long-term debt and
debentures
Proceeds from exercise of stock option
Other
260,131
9,533
-
15,846
-
17,778
47,041
90,641
440,970
-
-
-
50,763
222,394
-
153,790
1,018,305
222,792
1,668,044
(1,227,074)
737,756
2,746
1,647
3,083
745,232
-
-
21,105
-
12,018
136
46,775
56,442
136,476
10,051
360,141
7,520
-
-
160,392
151,979
383,728
164,441
1,238,252
(1,101,776)
-
262,489
-
5,776
268,265
217,174
7,959
-
13,229
-
14,842
39,274
75,672
368,150
-
-
-
42,380
185,669
-
128,394
850,146
186,001
1,392,590
(1,024,440)
615,926
2,293
1,375
2,573
622,167
-
-
17,620
-
10,033
113
39,052
47,121
113,939
8,391
300,669
6,278
-
-
133,906
126,882
320,361
137,285
1,033,772
(919,833)
-
219,143
-
4,822
223,965
₩ ₩ $ $

NON-CONSOLIDATED STATEMENTS OF CASH FLOWS ▶ FOR THE YEARS ENDED DECEMBER 31, 2003 AND 2002
54 Kia Motors Corporation
2003 2002 2003 2002
Korean won (in millions) Translation into U.S. dollars (Note 2) (in thousands)
Cash outflows from financing activities:
Repayment of short-term borrowings
Repayment of current maturities of long-
term debt and debentures
Repayment of long-term debt and
debentures
Acquisition of treasury stock
Payment of cash dividend
Other
Net increase in cash and cash equivalents
Cash and cash equivalents, beginning of year
Cash and cash equivalents, end of year
9,859
306,962
314,848
-
-
2,217
633,886
(409,921)
428,193
209,425
637,618
-
94,031
4,076
74,088
76,827
1,912
250,934
371,233
563,468
637,618
1,201,086
11,809
367,679
377,125
-
-
2,656
759,269
(491,004)
512,890
250,849
763,739
-
112,630
4,882
88,742
92,023
2,292
300,569
444,663
674,922
763,739
1,438,661
₩
₩
₩
₩
₩
₩
$
$
$
$
$
$

2003 Annual Report 55
NOTES TO NON-CONSOLIDATED FINANCIAL STATEMENTS▶ DECEMBER 31, 2003 AND 2002
1. THE COMPANY :
Kia Motors Corporation (the “Company”), incorporated in December 1944 under the laws of the Republic of Korea, is one of the leading motor
vehicle manufacturers in Korea producing and offering for sale a range of passenger cars, recreational vehicles and commercial vehicles both in
the domestic and the export markets. The Company owns and operates three principal automobile production bases: the Sohari factory, the
Hwasung factory and the Kwangju factory. The shares of the Company have been listed on the Korea Stock Exchange since 1973.
Overseas subsidiaries for export sales include Kia Motors America, Inc. (KMA) in America, Kia Canada, Inc. (KCI) in Canada, Kia Motors
Deutschland GmbH (KMD) and Kia Motors Europe GmbH (KME) in Germany.
As of December 31, 2003, the largest shareholder is Hyundai Motor Company, which holds 37.3 percent of the Company’s stock.
In common with other Asian countries, the economic environment in the Republic of Korea continues to be volatile. In addition, the Korean
government and the private sector continue to implement structural reforms to historical business practices including corporate governance.
The Company may be either directly or indirectly affected by these economic conditions and the reform program described above. The
accompanying financial statements reflect management’s assessment of the impact to date of the economic environment on the financial
position and results of operations of the Company. Actual results may differ materially from management’s current assessment.
2. SUMMARY OF SIGNIFICANT ACCOUNTING POLICIES :
Basis of Financial Statement Presentation
The Company maintains its official accounting records in Korean won and prepares statutory non-consolidated financial statements in the
Korean language (Hangul) in conformity with the accounting principles generally accepted in the Republic of Korea. Certain accounting
principles applied by the Company that conform with financial accounting standards and accounting principles in the Republic of Korea may not
conform with generally accepted accounting principles in other countries. Accordingly, these financial statements are intended for use by those
who are informed about Korean accounting principles and practices. The accompanying financial statements have been condensed, restructured
and translated into English (with certain expanded descriptions) from the Korean language financial statements. Certain information included in
the Korean language financial statements, but not required for a fair presentation of the Company's financial position, results of operations or
cash flows, is not presented in the accompanying financial statements.
The U.S. dollar amounts presented in these financial statements were computed by translating the Korean won into U.S. dollars based on the
Bank of Korea Basic Rate of ₩1,197.80 to US$1.00 at December 31, 2003, solely for the convenience of the reader. This convenience
translation into U.S. dollars should not be construed as a representation that the Korean won amounts have been, could have been, or could in
the future be, converted at this or any other rate of exchange.
Implementation of Statements of Korea Accounting Standards
The Korea Accounting Standards Board (KASB), a standard setting body of the Korea Accounting Institute (KAI), has issued Statements of Korea
Accounting Standards (“SKAS”) No. 1 to No. 13, to enhance the usefulness of accounting information and global convergence of the existing
Korea Financial Accounting Standards.
The Company prepared its non-consolidated financial statements as of December 31, 2003 in accordance with the existing Korea Financial
Accounting Standards and the SKAS No. 1-”Accounting Changes and Corrections of Errors”, SKAS No. 2-”Interim Financial Reporting”, No.
3-”Intangible Assets”, No. 4-”Revenue Recognition”, No. 5-”Tangible Assets”, No. 6-”Events Occurring after the Balance Sheet Date”, No.
7-”Capitalization of Financing Costs’, No. 8-”Investments in Securities” and No. 9-”Convertible Securities”. The Company has applied SKAS
No. 1, No. 6 and No. 7 since the year ended December 31, 2002 and did not adopt SKAS No. 10 through No. 13, which are effective for fiscal
year subsequent to December 31, 2003 ; however, early adoption is allowed.

NOTES TO NON-CONSOLIDATED FINANCIAL STATEMENTS▶ DECEMBER 31, 2003 AND 2002
56 Kia Motors Corporation
For comparative purposes, certain accounts in the 2002 financial statements were reclassified. These reclassifications do not affect the net assets
and net income of the Company.
The significant accounting policies followed by the Company in the preparation of its non-consolidated financial statements are summarized
below.
Revenue Recognition
Sales, including long-term instalment sales, are recognized at the time of shipment of motor vehicles and parts, which is when the significant
risks and rewards of ownership of the goods have been transferred to the buyer. The interest income arising from long-term instalment sales
contracts is recognized using the level yielding method.
The Company applied SKAS No. 4 - “Revenue Recognition” from January 1, 2003. In conformity with SKAS No. 4, the Company changed the
accounting method for revenue recognition of sales to vendors to be repurchased under the outsourcing contracts from a gross basis to net
basis. For comparative purposes, the statement of income for the year ended December 31, 2002 was revised in conformity with SKAS No. 4.
This application of SKAS No.4 does not affect the net asset and net income of the Company ; however, the sales and cost of sales decreased as
follows :
Accrued Warranties
The Company generally provides a warranty to the ultimate consumer for each product sold and accrues warranty expense at the time of sale
based on actual claims history. In addition, the Company recognizes accrued liabilities of the provision for the projected costs for dismantling
and recycling vehicles that the Company sold in the European Union region to comply with a European Parliament directive regarding End-of-
Life Vehicles (ELV), in which either the manufactures or sellers are financially responsible for a portion of the cost of the dismantling and
recycling of vehicles placed in service, except for the vehicles sold in the countries where overseas sales subsidiaries are contracted with the
Company to respond to such obligation (See Note 13).
Allowance for Doubtful Accounts
The Company provides an allowance for doubtful accounts based on management’s estimate of the collectibility of the receivables.
Inventories
Inventories are stated at the lower of cost or net realizable value, cost being determined by the moving average method except for materials in
transit for which cost is determined using the specific identification method.
Investments in Securities other than those Accounted for Using the Equity Method
▶ Classification of Securities
At acquisition, the Company classifies securities into one of the three categories : trading, held-to-maturity securities or available-for-sale.
Trading securities are those that were acquired principally to generate profit from short-term fluctuations in prices. Held-to-maturity securities
are those with fixed or determinable payments and fixed maturity that an enterprise has the positive intent and ability to hold to maturity.
2003 2002 2003 2002
Korean won (in millions) U.S. dollars (Note 2) (in thousands)
Decrease in sales
Decrease in cost of sales
Net effect
2,298,508
2,298,508
-
1,898,338
1,898,338
-
1,918,941
1,918,941
-
1,584,854
1,584,854
-
₩
₩
₩
₩
$
$
$
$

2003 Annual Report 57
Available-for-sale securities are those not classified either as held-to-maturity or trading securities. Trading securities are classified as short
term investment securities, whereas available-for-sale securities and held-to-maturity securities are classified as long-term investment
securities, except for those whose maturity dates or whose likelihood of being disposed of are within one year from the balance sheet date,
which are classified as short-term investment securities.
▶ Valuation of Securities
Investments in securities are initially measured at cost, which consists of the market price of the consideration given to acquire them and
incidental expenses. If the market price of the consideration given is not available, the market prices of the securities purchased are used as the
basis for measurement. If neither the market price of the consideration given nor those of the acquired securities are available, the acquisition
cost is measured at the best estimates of its fair value.
After initial recognition, held-to-maturity securities are valued at amortized cost. The difference between their acquisition costs and face values
is amortized over the remaining term of the securities by applying the effective interest method and added to or subtracted from the acquisition
costs and interest income of the remaining period. Trading securities are valued at fair value, with unrealized gains or losses included in current
operations. Available-for-sales securities are also valued at fair value, with unrealized holding gains or losses recognized in capital adjustments,
until the securities are sold or if the securities are determined to be impaired and the lump-sum cumulative amount of capital adjustments are
reflected in current operations. However, available-for-sales securities that are not traded in an active market and whose fair value cannot be
reliably measured are valued at cost.
If the estimated recoverable amount of securities is less than the acquisition cost of equity securities or amortized cost of debt securities and any
objective evidence for such impairment loss exists, impairment loss is recognized in current operations in the period when it arises.
Equity Securities Accounted for Using the Equity Method
Equity securities held for investment in companies in which the Company is able to exercise significant influence over the operating and financial
policies of the investees are accounted for using the equity method. The Company’s share in the net income or net loss of investees is reflected
in current operations. Changes in the retained earnings, capital surplus or other capital accounts of investees are accounted for as an adjustment
to retained earnings or to capital adjustments.
Property, Plant and Equipment and Related Depreciation
Property, plant and equipment are stated at cost, except for assets revalued upward in accordance with the Asset Revaluation Law of Korea.
Routine maintenance and repairs are expensed as incurred. Expenditures that result in the enhancement of the value or extension of the useful
lives of the facilities involved are treated as additions to property, plant and equipment.
Depreciation is computed using the straight-line method based on the estimated useful lives of the assets as follows :
The Company charges all financing cost to current operations in accordance with SKAS No. 7 - “Capitalization of Financing Costs”. In addition,
the Company assesses possible recognition of impairment loss when there is an indication that expected future economic benefits of an asset is
considerably less than its carrying amount, as a result of technological obsolescence or rapid declines in market value. When it is determined that
an asset may have been impaired and that its estimated total future cash flows from continued use or disposal is less than its carrying amount,
Useful lives (years)
Buildings and structures
Machinery and equipment
Tools, dies and moulds
Vehicles
Office equipment
20 ~ 40
15
5
5
5

NOTES TO NON-CONSOLIDATED FINANCIAL STATEMENTS▶ DECEMBER 31, 2003 AND 2002
58 Kia Motors Corporation
the carrying amount of the asset is reduced to its recoverable amount and the difference is recognized as an impairment loss. If the recoverable
amount of the impaired asset exceeds its carrying amount in subsequent reporting period, the amount equal to the excess is treated as the
reversal of the impairment loss; however, it cannot exceed the carrying amount that would have been determined had no impairment loss were
recognized.
Intangibles
Intangible assets are stated at cost, net of amortization computed using the straight-line method over the estimated economic useful lives of
related assets. Development costs are amortized over the estimated economic useful life (not exceeding 3 years) from the usable date of the
related productions. Ordinary development and research expenses are charged to current operations. Cost in excess of net identifiable assets
acquired (goodwill) is amortized over 5 years and industrial property rights and other intangibles are amortized over the period between five and
ten years. If the recoverable amount of an intangible asset becomes less than its carrying amount as a result of obsolescence, sharp decline in
market value or other causes of impairment, the carrying amount of the intangible asset is reduced to its recoverable amount and the reduced
amount is recognized as impairment loss. If the recoverable amount of a previously impaired intangible asset exceeds its carrying amount in
subsequent periods, an amount equal to the excess shall be recorded as reversal of impairment loss ; however, it shall not exceed the carrying
amount that would have been determined had no impairment loss were recognized in prior years.
Valuation of Receivables and Payables at Present Value
Receivables and payables arising from long-term installment transactions, long-term cash loans (borrowings) and other similar loan (borrowing)
transactions are stated at present value, if the difference between nominal value and present value is material. The present value discount is
amortized using the effective interest rate method, and the amortization is included in interest expense or interest income. As of December 31,
2003 and 2002, an interest rate of 10.0 percent is used in valuing the receivables and payables at present value.
Accrued Severance Benefits
Employees and directors with more than one year of service are entitled to receive a lump-sum payment upon termination of their service with
the Company, based on their length of service and rate of pay at the time of termination. The accrued severance benefits that would be payable
assuming all eligible employees were to resign amount to ₩1,340,068 million (US$1,118,774 thousand) and ₩1,194,229 million (US$997,019
thousand) as of December 31, 2003 and 2002, respectively.
Accrued severance benefits are approximately 58 percent and 56 percent funded at December 31, 2003 and 2002, respectively, through an
individual severance insurance plan. Individual severance insurance deposits, in which the beneficiary is a respective employee, are presented as
deduction from accrued severance benefits.
Before April 1999, the Company and its employees paid 3 percent and 6 percent, respectively, of monthly pay (as defined) to the National
Pension Fund in accordance with the National Pension Law of Korea. The Company paid half of the employees’6 percent portion and is paid
back at the termination of service by offsetting the receivable against the severance payment. Such receivables, totalling ₩44,892 million
(US$37,479 thousand) and ₩48,018 million (US$40,088 thousand) as of December 31, 2003 and 2002, respectively, are presented as a
deduction from accrued severance benefits. Since April 1999, according to a revision in the National Pension Law, the Company and its
employees each pay 4.5 percent of monthly pay to the Fund.
Stock Options
The Company computes total compensation expense to stock options, which are granted to employees and directors, by fair value method using
the option-pricing model. The compensation expense has been accounted for as a charge to current operations and a credit to capital
adjustments from the grant date using the straight-line method.
2003 Annual Report 59
Derivative Instruments
All derivative instruments are accounted for at fair value with the valuation gain or loss recorded as an asset or liability. If the derivative
instrument is not part of a transaction qualifying as a hedge, the adjustment to fair value is reflected in current operations. The accounting for
derivative transactions that are part of a qualified hedge based both on the purpose of the transaction and on meeting the specified criteria for
hedge accounting differs depending on whether the transaction is a fair value hedge or a cash flow hedge. Fair value hedge accounting is
applied to a derivative instrument designated as hedging the exposure to changes in the fair value of an asset or a liability or a firm commitment
(hedged item) that is attributable to a particular risk. The gain or loss both on the hedging derivative instruments and on the hedged item
attributable to the hedged risk is reflected in current operations. Cash flow hedge accounting is applied to a derivative instrument designated as
hedging the exposure to variability in expected future cash flows of an asset or a liability or a forecasted transaction that is attributable to a
particular risk. The effective portion of gain or loss on a derivative instrument designated as a cash flow hedge is recorded as a capital
adjustment and the ineffective portion is recorded in current operations.
The effective portion of gain or loss recorded as a capital adjustment is reclassified to current earnings in the same period during which the
hedged forecasted transaction affects earnings. If the hedged transaction results in the acquisition of an asset or the incurrence of a liability, the
gain or loss in capital adjustment is added to or deducted from the asset or the liability.
Accounting for Foreign Currency Transactions and Translation
The Company maintains its accounts in Korea won. Transactions in foreign currencies are recorded in Korean won based on the prevailing rates
of exchange on the transaction date. Monetary accounts with balances denominated in foreign currencies are recorded and reported in the
accompanying non-consolidated financial statements at the exchange rates prevailing at the balance sheet dates. The balances have been
translated using the Bank of Korea Basic Rate, which was ₩1,197.80 and ₩1,200.40 to US$1.00 at December 31, 2003 and 2002, respectively,
and the translation loss and gain is reflected in current operations.
Income Tax Expense
The Company recognizes deferred income taxes. Accordingly, income tax expense is determined by adding or deducting the total income tax
and surtaxes to be paid for the current period and the changes in deferred income tax debits (credits). The difference between the income tax
expense and the amount of income tax shown in the current period’s tax return will be offset against the deferred income tax credits (debits),
which will occur in subsequent periods.
Earnings Per Share
Ordinary income per common share and earnings per common share are computed by dividing ordinary income (after deduction for tax effect)
and net income, respectively, by the weighted average number of common shares outstanding during period. The numbers of shares used in
computing earnings per common share are 362,335,493 and 367,993,115 for the years ended December 31, 2003 and 2002, respectively.
Diluted ordinary income per share and diluted earnings per share are computed by dividing ordinary income and net income, after addition for
the effect of expenses related to diluted securities on net income, by the number of the weighted average number of common shares plus the
number of dilutive potential common shares. Stock options, which have dilutive effect, are regarded as being exercised at the beginning of the
period, and the number of dilutive potential common shares computed using treasury stock method (352,306 shares in 2003) is added to the
diluted number of common shares. Stock options granted to employees and directors as of December 31, 2002 have no dilutive effect on
ordinary income per share and earnings per share.

NOTES TO NON-CONSOLIDATED FINANCIAL STATEMENTS▶ DECEMBER 31, 2003 AND 2002
60 Kia Motors Corporation
3. INVENTORIES :
Inventories as of December 31, 2003 and 2002 consist of the following :
4. LONG-TERM INVESTMENT SECURITIES :
(1) Long-term investment securities as of December 31, 2003 consist of the following :
(2) Available-for-sale securities included in long-term investment securities as of December 31, 2003 consist of the following :
2003 2002 2003 2002
Korean won (in millions) U.S. dollars (Note 2) (in thousands)
Finished goods and merchandise
Semi-finished goods and work in process
Raw materials and supplies
Materials in transit
282,933
199,986
134,279
58,541
675,739
195,570
116,130
126,631
46,687
485,018
236,211
166,960
112,105
48,874
564,150
163,274
96,953
105,720
38,977
404,924
₩
₩
₩
₩
$
$
$
$
Acquisition cost Book value Book value Percentage of ownership (%)
Korean won (in millions)U.S. dollars (Note 2)
(in thousands)
Listed equity securities:
Hyundai MOBIS
INI Steel Co., Ltd.
LG Telecom Co., Ltd.
KT Freetel Co., Ltd.
Kia Steel Co., Ltd.
Kanglim Specific Equipment Automotive
Co., Ltd.
Stock Market Stabilization Fund
Other
Unlisted equity securities:
Dongwon Capital Co., Ltd.
Asset Management Co., Ltd.
Kihyup Technology Banking Corp.
Mobil.com Co., Ltd.
Dongyung Industries Co., Ltd.
Namyang Industrial Co., Ltd.
The Korea Economic Daily Co., Ltd.
Other
119,000
99,999
10,056
7,200
854
347
2,411
30
3,000
950
700
600
241
200
168
3,339
249,095
997,275
190,675
6,702
4,251
703
48
9,646
1
3,000
950
700
600
241
200
168
789
1,215,949
832,589
159,188
5,595
3,549
587
40
8,053
1
2,505
793
584
501
201
167
140
659
1,015,152
18.35
18.36
0.66
0.12
0.17
0.38
-
-
4.62
19.99
2.41
5.80
19.35
8.00
0.22
-
₩
₩
$
$
2003 2003
Korean won (in millions) U.S. dollars (Note 2) (in thousands)
Available-for-sale securities
Held-to-maturity securities
1,215,949
21,268
1,237,217
1,015,152
17,756
1,032,908
₩
₩
$
$
₩
₩

2003 Annual Report 61
Available-for-sale securities are valued at fair value. However, available-for-sale securities that do not have a quoted market price in an active
market and whose fair value cannot be reliably measured are valued at cost. The difference between the book value and the acquisition cost of
available-for-sale securities, amounting to ₩966,854 million (US$807,192 thousand) as of December 31, 2003, consist of gain on valuation of
long-term investment securities of ₩969,404 million (US$809,320 million) reflected in capital adjustments and an impairment loss of
investment of ₩2,550 million (US$2,129 thousand) in 2002.
(3) Held-to-maturity securities as of December 31, 2003 consist of the following :
As the interest rates and repayment periods of corporate bonds were changed by mutual agreement in 1999, the difference between nominal
value and present value was presented as bad debt expense, and amortized using the effective interest method over the remaining period.
Maturities of held-to-maturity securities are as follows :
(4) The Company has pledged the following long-term investment securities as collateral for various short-term and long-term borrowings as
of December 31, 2003 :
Acquisition cost Present value discount Book value Book value
Korean won (in millions)U.S. dollars (Note 2)
(in thousands)
Government and municipal bonds
Corporate bonds:
Acrowave Co., Ltd.
Subordinated bonds:
Seoul Guarantee Insurance Company
10,213
89
16,200
26,502
-
-
5,234
5,234
10,213
89
10,966
21,268
8,526
74
9,156
17,756
₩
₩
₩
₩
₩
₩
$
$
Maturity
2003Maturity 2003
Korean won (in millions) U.S. dollars (Note 2) (in thousands)
1 ~ 5 years
6 ~ 10 years
24,269
2,233
26,502
20,261
1,864
22,125
₩
₩
$
$
Number of shares pledged 2003 2003
Korean won (in millions)
U.S. dollars (Note 2) (in thousands)
Kia Steel Co., Ltd.
Kisan Mutual Saving’s & Finance
Other
8,755
306,160
1,500
84
-
320
404
70
-
267
337
₩
₩
$
$
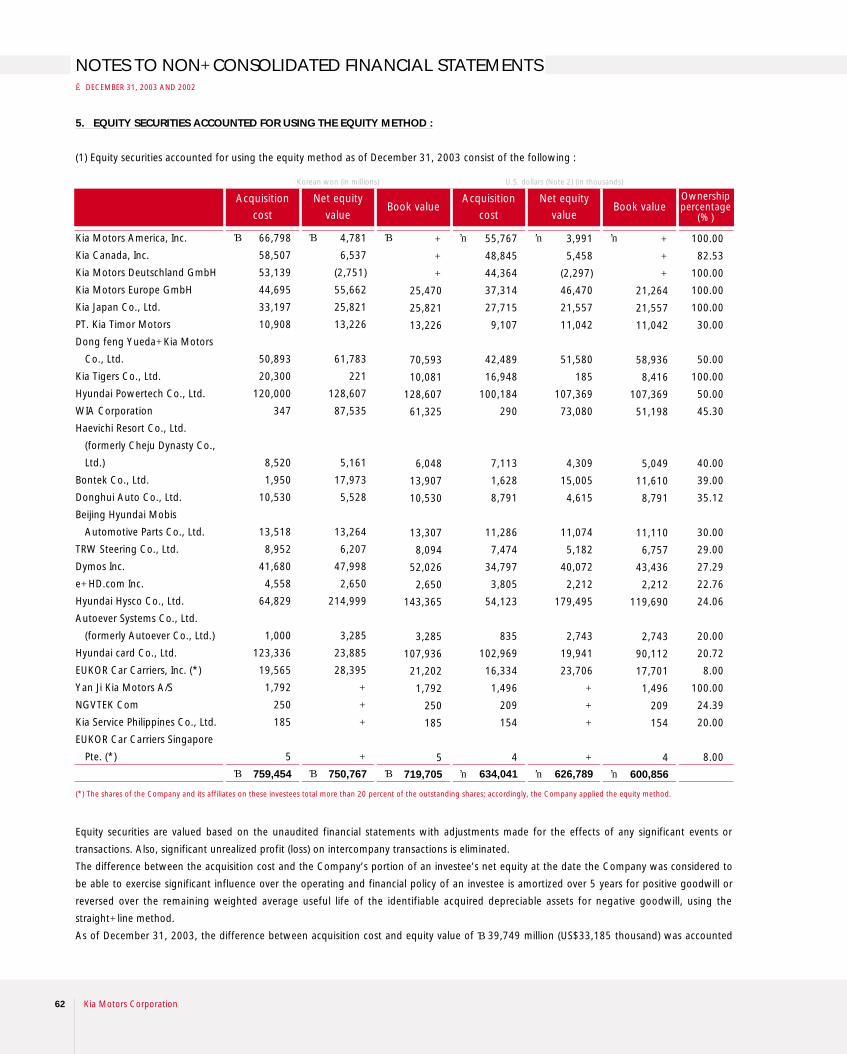
NOTES TO NON-CONSOLIDATED FINANCIAL STATEMENTS▶ DECEMBER 31, 2003 AND 2002
62 Kia Motors Corporation
5. EQUITY SECURITIES ACCOUNTED FOR USING THE EQUITY METHOD :
(1) Equity securities accounted for using the equity method as of December 31, 2003 consist of the following :
Equity securities are valued based on the unaudited financial statements with adjustments made for the effects of any significant events or
transactions. Also, significant unrealized profit (loss) on intercompany transactions is eliminated.
The difference between the acquisition cost and the Company’s portion of an investee’s net equity at the date the Company was considered to
be able to exercise significant influence over the operating and financial policy of an investee is amortized over 5 years for positive goodwill or
reversed over the remaining weighted average useful life of the identifiable acquired depreciable assets for negative goodwill, using the
straight-line method.
As of December 31, 2003, the difference between acquisition cost and equity value of ₩39,749 million (US$33,185 thousand) was accounted
Acquisition
cost
Korean won (in millions) U.S. dollars (Note 2) (in thousands)
Kia Motors America, Inc.
Kia Canada, Inc.
Kia Motors Deutschland GmbH
Kia Motors Europe GmbH
Kia Japan Co., Ltd.
PT. Kia Timor Motors
Dong feng Yueda-Kia Motors
Co., Ltd.
Kia Tigers Co., Ltd.
Hyundai Powertech Co., Ltd.
WIA Corporation
Haevichi Resort Co., Ltd.
(formerly Cheju Dynasty Co.,
Ltd.)
Bontek Co., Ltd.
Donghui Auto Co., Ltd.
Beijing Hyundai Mobis
Automotive Parts Co., Ltd.
TRW Steering Co., Ltd.
Dymos Inc.
e-HD.com Inc.
Hyundai Hysco Co., Ltd.
Autoever Systems Co., Ltd.
(formerly Autoever Co., Ltd.)
Hyundai card Co., Ltd.
EUKOR Car Carriers, Inc. (*)
Yan Ji Kia Motors A/S
NGVTEK Com
Kia Service Philippines Co., Ltd.
EUKOR Car Carriers Singapore
Pte. (*)
(*) The shares of the Company and its affiliates on these investees total more than 20 percent of the outstanding shares; accordingly, the Company applied the equity method.
66,798
58,507
53,139
44,695
33,197
10,908
50,893
20,300
120,000
347
8,520
1,950
10,530
13,518
8,952
41,680
4,558
64,829
1,000
123,336
19,565
1,792
250
185
5
759,454
₩
₩
Net equity
value
4,781
6,537
(2,751)
55,662
25,821
13,226
61,783
221
128,607
87,535
5,161
17,973
5,528
13,264
6,207
47,998
2,650
214,999
3,285
23,885
28,395
-
-
-
-
750,767
₩
₩
Book value
-
-
-
25,470
25,821
13,226
70,593
10,081
128,607
61,325
6,048
13,907
10,530
13,307
8,094
52,026
2,650
143,365
3,285
107,936
21,202
1,792
250
185
5
719,705
₩
₩
Acquisition
cost
55,767
48,845
44,364
37,314
27,715
9,107
42,489
16,948
100,184
290
7,113
1,628
8,791
11,286
7,474
34,797
3,805
54,123
835
102,969
16,334
1,496
209
154
4
634,041
$
$
Net equity
value
3,991
5,458
(2,297)
46,470
21,557
11,042
51,580
185
107,369
73,080
4,309
15,005
4,615
11,074
5,182
40,072
2,212
179,495
2,743
19,941
23,706
-
-
-
-
626,789
$
$
Book value
-
-
-
21,264
21,557
11,042
58,936
8,416
107,369
51,198
5,049
11,610
8,791
11,110
6,757
43,436
2,212
119,690
2,743
90,112
17,701
1,496
209
154
4
600,856
$
$
Ownershippercentage
(%)
100.00
82.53
100.00
100.00
100.00
30.00
50.00
100.00
50.00
45.30
40.00
39.00
35.12
30.00
29.00
27.29
22.76
24.06
20.00
20.72
8.00
100.00
24.39
20.00
8.00

2003 Annual Report 63
for as a charge to beginning retained earnings for ₩120,904 million (US$100,938 thousand) up to prior year, gain on valuation of ₩53,250
million (US$44,457 thousand) reflected in current operations and gain on valuation of equity securities accounted for using the equity method
of ₩27,905 million (US$23,296 thousand) reflected in capital adjustments.
Equity securities accounted for using the equity method as of December 31, 2002 consist of the following :
As of December 31, 2002, the difference between acquisition cost and equity value of ₩131,707 million (US$109,957 thousand) was
accounted for as a charge to beginning accumulated deficit for ₩164,680 million (US$137,485 thousand) up to prior year, gain on valuation of
₩43,776 million (US$36,547 thousand) reflected in current operations and loss on valuation of equity securities accounted for using the equity
method of ₩10,803 million (US$9,019 thousand) reflected in capital adjustments.
Acquisition
cost
Korean won (in millions) U.S. dollars (Note 2) (in thousands)
Kia Motors America, Inc.
Kia Canada, Inc.
Kia Motors Deutschland GmbH
Kia Motors Europe GmbH
Kia Japan Co., Ltd.
PT. Kia Timor Motors
Dong feng Yueda-Kia Motors
Co., Ltd.
Kia Tigers Co., Ltd.
Hyundai Powertech Co., Ltd.
WIA Corporation
Haevichi Resort Co., Ltd.
Bontek Co., Ltd.
Donghui Auto Co., Ltd.
TRW Steering Co., Ltd.
Dymos Inc.
e-HD.com Inc.
Hyundai Hysco Co., Ltd.
Autoever Systems Co., Ltd.
Yan Ji Kia Motors A/S
NGVTEK Com
Kia Service Philippines Co.
66,798
58,507
53,139
41,060
33,197
10,908
22,316
20,300
70,000
347
8,520
1,950
10,530
8,952
30,850
4,558
64,829
1,000
1,792
250
185
509,988
₩
₩
Net equity
value
36,305
(341)
(1,779)
38,911
23,479
11,532
15,259
290
70,263
61,911
3,438
11,891
29,716
6,564
27,077
3,329
192,689
2,186
-
-
-
532,720
₩
₩
Book value
-
-
-
20,666
23,479
11,532
19,007
14,094
70,263
32,425
4,788
6,470
10,530
9,080
33,119
3,329
115,086
2,186
1,792
250
185
378,281
₩
₩
Acquisition
cost
55,767
48,845
44,364
34,280
27,715
9,107
18,631
16,948
58,440
290
7,113
1,628
8,791
7,474
25,756
3,805
54,123
835
1,496
209
154
425,771
$
$
Net equity
value
30,310
(285)
(1,485)
32,485
19,602
9,628
12,739
242
58,660
51,687
2,870
9,927
24,809
5,480
22,606
2,779
160,869
1,825
-
-
-
444,748
$
$
Book value
-
-
-
17,253
19,602
9,628
15,868
11,767
58,660
27,070
3,997
5,402
8,791
7,581
27,651
2,779
96,081
1,825
1,496
209
154
315,814
$
$
Ownershippercentage
(%)
100.00
82.53
100.00
100.00
100.00
30.00
50.00
100.00
50.00
45.30
40.00
39.00
35.12
29.00
27.07
22.76
21.57
20.00
100.00
24.39
20.00

NOTES TO NON-CONSOLIDATED FINANCIAL STATEMENTS▶ DECEMBER 31, 2003 AND 2002
64 Kia Motors Corporation
(2) The changes in goodwill or negative goodwill incurred from the equity securities of affiliates subject to equity method accounting for the year
ended December 31, 2003 are as follows :
The changes in goodwill or negative goodwill incurred from the equity securities of affiliates subject to equity method accounting for the year
ended December 31, 2002 are as follows:
Beginning of periodKorean won (in millions)
U.S. dollars (Note 2) (in thousands)
Kia Tigers Co., Ltd.
Dong feng Yueda-Kia
Motors Co., Ltd.
Haevichi Resort Co., Ltd.
TRW Steering Co., Ltd.
Dymos Inc.
Hyundai Hysco Co., Ltd.
WIA Corporation
Bontek Co., Ltd.
17,749
-
1,812
3,145
8,056
(83,573)
(32,762)
(6,776)
(92,349)
₩
₩
Increase
-
4,685
-
-
-
-
-
-
4,685
₩
₩
Amortization
3,945
937
462
629
2,014
(5,970)
(3,276)
(1,355)
(2,614)
₩
₩
End of period
13,804
3,748
1,350
2,516
6,042
(77,603)
(29,486)
(5,421)
(85,050)
₩
₩
End of period
11,524
3,129
1,127
2,101
5,044
(64,788)
(24,617)
(4,526)
(71,006)
$
$
Korean won (in millions)U.S. dollars (Note 2)
(in thousands)
Kia Tigers Co., Ltd.
Dong feng Yueda-Kia Motors
Co., Ltd.
Haevichi Resort Co., Ltd.
TRW Steering Co., Ltd.
Dymos Inc.
Hyundai card Co., Ltd.
Beijing Hyundai Mobis
Automotive Parts Co., Ltd.
Hyundai Hysco Co., Ltd.
WIA Corporation
Bontek Co., Ltd.
EUKOR Car Carriers, Inc.
13,804
3,748
1,350
2,516
6,042
-
-
(77,603)
(29,486)
(5,421)
-
(85,050)
₩
₩
Increase
-
7,500
-
-
-
93,389
47
-
-
-
(7,572)
93,364
₩
₩
Amortization
3,944
2,438
463
629
2,014
9,338
4
(5,969)
(3,276)
(1,355)
(379)
7,851
₩
₩
End of period
9,860
8,810
887
1,887
4,028
84,051
43
(71,634)
(26,210)
(4,066)
(7,193)
463
₩
₩
End of period
8,232
7,355
741
1,575
3,363
70,171
36
(59,805)
(21,882)
(3,395)
(6,005)
386
$
$
Beginning of period

2003 Annual Report 65
(3) Details of valuation using the equity method for the year ended December 31, 2003 are as follows :
Beginning of periodKorean won (in millions)
U.S. dollars (Note 2) (in thousands)
Kia Motors America, Inc.
Kia Canada, Inc.
Kia Motors Deutschland GmbH
Kia Motors Europe GmbH
Kia Japan Co., Ltd.
PT. Kia Timor Motors
Dong feng Yueda-Kia Motors
Co., Ltd.
Kia Tigers Co., Ltd.
Hyundai Powertech Co., Ltd.
WIA Corporation
Haevichi Resort Co., Ltd.
Bontek Co., Ltd.
Donghui Auto Co., Ltd.
Beijing Hyundai Mobis
Automotive Parts Co., Ltd.
TRW Steering Co., Ltd.
Dymos Inc.
e-HD.com Inc.
Hyundai Hysco Co., Ltd.
Autoever Systems Co., Ltd.
Hyundai card Co., Ltd.
EUKOR Car Carriers, Inc.
Yan Ji Kia Motors A/S (*)
NGVTEK Com (*)
Kia Service Philippines Co.(*)
EUKOR Car Carriers Singapore
Pte. (*)
-
-
-
20,666
23,479
11,532
19,007
14,094
70,263
32,425
4,788
6,470
10,530
-
9,080
33,119
3,329
115,086
2,186
-
-
1,792
250
185
-
378,281
₩
₩
Gain / Loss
-
-
-
(10,283)
(122)
1,067
22,669
(4,013)
8,339
28,900
1,260
7,437
-
(287)
(986)
6,567
(670)
17,608
1,099
(25,278)
(57)
-
-
-
-
53,250
₩
₩
Others (**)
-
-
-
15,087
2,464
627
28,917
-
50,005
-
-
-
-
13,594
-
12,340
(9)
10,671
-
133,214
21,259
-
-
-
5
288,174
₩
₩
End of period
-
-
-
25,470
25,821
13,226
70,593
10,081
128,607
61,325
6,048
13,907
10,530
13,307
8,094
52,026
2,650
143,365
3,285
107,936
21,202
1,792
250
185
5
719,705
₩
₩
End of period
-
-
-
21,264
21,557
11,042
58,936
8,416
107,369
51,198
5,049
11,610
8,791
11,110
6,757
43,436
2,212
119,690
2,743
90,112
17,701
1,496
209
154
4
600,856
$
$
(*) Excluded from using the equity method as individual beginning balance of assets are less than the required assets level of £ 7,000 million and the differences arising from the use of the
equity method are not considered material, which are stated at cost.
(**) Others are composed of acquisition or disposal amounts of equity securities, the changes in retained earnings and capital adjustments.

NOTES TO NON-CONSOLIDATED FINANCIAL STATEMENTS▶ DECEMBER 31, 2003 AND 2002
66 Kia Motors Corporation
Details of valuation using the equity method for the year ended December 31, 2002 are as follows :
(4) The cumulative losses not recognized by the Company due to the suspension of the valuation of equity securities accounted for using the
equity method as of December 31, 2003 consist of the following :
Beginning of periodKorean won (in millions)
U.S. dollars (Note 2) (in thousands)
Kia Motors America, Inc.
Kia Canada, Inc.
Kia Motors Deutschland GmbH
Kia Motors Europe GmbH
Kia Japan Co., Ltd.
PT. Kia Timor Motors
Dong feng Yueda-Kia Motors
Co., Ltd.
Kia Tigers Co., Ltd.
Hyundai Powertech Co., Ltd.
WIA Corporation
Haevichi Resort Co., Ltd.
Bontek Co., Ltd.
Donghui Auto Co., Ltd.
TRW Steering Co., Ltd.
Dymos Inc.
e-HD.com Inc.
Hyundai Hysco Co., Ltd.
Autoever Systems Co., Ltd.
Yan Ji Kia Motors A/S (*)
NGVTEK Com (*)
Kia Service Philippines Co. (*)
-
-
-
-
23,598
11,205
267
18,221
34,393
347
4,828
1,950
-
8,952
31,531
1,505
91,320
1,000
1,792
250
185
231,344
₩
₩
Gain / Loss
-
-
-
(20,395)
(197)
(327)
1,753
(4,127)
6,109
32,078
(40)
4,520
-
128
1,649
(254)
21,693
1,186
-
-
-
43,776
₩
₩
Others (**)
-
-
-
41,061
78
654
16,987
-
29,761
-
-
-
10,530
-
(61)
2,078
2,073
-
-
-
-
103,161
₩
₩
End of period
-
-
-
20,666
23,479
11,532
19,007
14,094
70,263
32,425
4,788
6,470
10,530
9,080
33,119
3,329
115,086
2,186
1,792
250
185
378,281
₩
₩
End of period
-
-
-
17,253
19,602
9,628
15,868
11,767
58,660
27,070
3,997
5,402
8,791
7,581
27,651
2,779
96,081
1,825
1,496
209
154
315,814
$
$
(*) Excluded from using the equity method as individual beginning balance of assets are less than the required assets level of £ 7,000 million and the differences arising from the use of the
equity method are not considered material, which are stated at cost.
(**) Others are composed of acquisition or disposal amounts of investment securities, the changes in retained earnings and capital adjustments.
Cumulative losses Unrealized gains Cumulative losses Unrealized gains
Korean won (in millions) U.S. dollars (Note 2) (in thousands)
Kia Motors America, Inc.
Kia Motors Deutschland GmbH
Kia Canada, Inc.
-
2,751
-
2,751
133,364
26,088
7,756
167,208
-
2,297
-
2,297
111,341
21,780
6,475
139,596
₩
₩
₩
₩
$
$
$
$

2003 Annual Report 67
The cumulative losses not recognized by the Company due to the suspension of the valuation of equity securities accounted for using the equity
method as of December 31, 2002 consist of the following :
(5) The Company has pledged the following equity securities accounted for using the equity method as collateral for long-term borrowings as
of December 31, 2003 :
6. MARKETABLE SECURITIES AND INVESTMENT SECURITIES :
(1) Marketable securities as of December 31, 2002 are stated at fair value and consist of the following :
(2) Investment securities as of December 31, 2002 consist of the following :
Cumulative losses Unrealized gains Cumulative losses Unrealized gains
Korean won (in millions) U.S. dollars (Note 2) (in thousands)
Kia Motors America, Inc.
Kia Motors Deutschland GmbH
Kia Canada, Inc.
-
38,210
11,208
49,418
110,983
24,990
8,954
144,927
-
31,900
9,357
41,257
92,657
20,863
7,475
120,995
₩
₩
₩
₩
$
$
$
$
Number of shares pledged 2003 2003
Korean won (in millions)U.S. dollars (Note 2)
(in thousands)
EUKOR Car Carriers, Inc.
EUKOR Car Carriers Singapore, Pte.
1,760,000
8,000
21,202
5
21,207
17,701
4
17,705
₩
₩
$
$
2002 2002Korean won (in millions) U.S. dollars (Note 2) (in thousands)
Debt securities 19,565 16,335₩ $
2002 2002
Korean won (in millions) U.S. dollars (Note 2) (in thousands)
Marketable investment equity securities
Unlisted equity securities
Debt securities
433,234
40,895
25,646
499,775
361,691
34,141
21,411
417,243
₩
₩
$
$

NOTES TO NON-CONSOLIDATED FINANCIAL STATEMENTS▶ DECEMBER 31, 2003 AND 2002
68 Kia Motors Corporation
(3) Marketable investment equity securities as of December 31, 2002 consist of the following :
(4) Unlisted equity securities as of December 31, 2002 consist of the following :
The value of investments in equity securities of Daeshin Factoring Co., Ltd. and A.P. Co., Ltd. has declined and is not expected to recover, and
accordingly, the difference between the book value and the fair value has been charged to current operations as an investment impairment loss.
(5) Debt securities as of December 31, 2002 consist of the following :
Acquisition cost Book value Book value Percentage of ownership (%)
Korean won (in millions)U.S. dollars (Note 2)
(in thousands)
Hyundai MOBIS
INI Steel Co., Ltd.
LG Telecom Co., Ltd.
Kia Steel Co., Ltd.
Kanglim Specific Equipment Automotive
Co., Ltd.
SK Telecom Co., Ltd.
Samho Co., Ltd.
Samlip General Food Co., Ltd.
Stock Market Stabilization Fund
70,047
99,999
10,056
96
347
837
16
14
6,442
187,854
302,107
105,325
8,020
169
68
5,716
1
-
11,828
433,234
252,218
87,932
6,696
141
57
4,772
1
-
9,874
361,691
16.26
15.60
0.59
0.52
0.38
0.03
-
-
-
₩
₩
₩
₩
$
$
Acquisition cost Book value Book value Percentage of ownership (%)
Korean won (in millions)U.S. dollars (Note 2)
(in thousands)
EUKOR Car Carries, Inc
Wuhan Grand Motor Co., Ltd.(*)
KT I Com Co., Ltd.
Dongwon Capital Co., Ltd.
Daeshin Factoring Co., Ltd.
Asset Management Co., Ltd.
Kihyup Technology Banking Corp.
Mobil.com Co., Ltd.
A.P. Co., Ltd.
Dongyung Industries Co., Ltd.
Namyang Industrial Co., Ltd.
The Korea Economic Daily Co., Ltd.
Other
19,565
7,500
7,200
3,000
2,000
950
700
600
550
241
200
168
771
43,445
19,565
7,500
7,200
3,000
-
950
700
600
-
241
200
168
771
40,895
16,334
6,261
6,011
2,505
-
793
584
501
-
201
167
140
644
34,141
8.00
21.40
0.40
4.62
3.33
19.99
2.41
6.02
9.20
19.23
8.00
0.22
-
₩
₩
₩
₩
$
$
(*) Excluded from using the equity method as the investment was regarded temporary.
Acquisition cost Present Value Discount Book value
Korean won (in millions)U.S. dollars (Note 2)
(in thousands)
Corporate bonds:
Kia Steel Co., Ltd.
Acrowave Co., Ltd.
Subordinated bonds:
Seoul Guarantee Insurance Company
32,698
89
16,200
48,987
16,959
-
6,382
23,341
15,739
89
9,818
25,646
₩
₩
₩
₩
₩
₩
Book value
13,140
74
8,197
21,411
$
$

2003 Annual Report 69
As the interest rates and repayment periods of corporate bonds were changed by mutual agreement in 1999, the difference between nominal
value and present value was presented as bad debt expense, and amortized using the effective interest method over the remaining period.
7. PROPERTY, PLANT AND EQUIPMENT :
Property, plant and equipment as of December 31, 2003 and 2002 consist of the following :
The changes in property, plant and equipment in 2003 are as follows :
2003 2002 2003 2002
Korean won (in millions) U.S. dollars (Note 2) (in thousands)
Buildings and structures
Machinery and equipment
Vehicles
Dies, moulds and tools
Other equipment
Less: Accumulated depreciation
Land
Construction in progress
1,348,211
2,189,241
46,274
1,192,788
194,345
4,970,859
(2,151,627)
2,819,232
1,422,030
422,098
4,663,360
1,222,836
1,987,189
44,632
1,077,454
176,730
4,508,841
(1,882,817)
2,626,024
1,399,283
141,547
4,166,854
1,125,573
1,827,719
38,632
995,816
162,251
4,149,991
(1,796,316)
2,353,675
1,187,201
352,394
3,893,270
1,020,902
1,659,032
37,262
899,527
147,546
3,764,269
(1,571,895)
2,192,374
1,168,211
118,172
3,478,757
₩
₩
₩
₩
$
$
$
$
Beginning of
period
Korean won (in millions)U.S. dollars (Note 2)
(in thousands)
1,399,283
1,021,484
1,226,206
23,504
271,147
83,683
141,547
4,166,854
₩
₩
Acquisition
-
-
-
-
-
-
1,018,305
1,018,305
₩
₩
Transfer
34,829
134,765
348,240
14,794
146,802
28,240
(707,670)
-
₩
₩
Disposal
(12,082)
(5,992)
(70,323)
(2,001)
(996)
(918)
(54,084)
(146,396)
₩
₩
Depreciation
-
(46,810)
(192,293)
(8,438)
(122,765)
(29,097)
-
(399,403)
₩
₩
Other
changes
-
-
-
-
-
-
24,000
24,000
₩
₩
End of period
1,422,030
1,103,447
1,311,830
27,859
294,188
81,908
422,098
4,663,360
₩
₩
End of period
1,187,201
921,228
1,095,200
23,258
245,607
68,382
352,394
3,893,270
$
$
Land
Buildings and
structures
Machinery and
equipment
Vehicles
Dies, molds and
tools
Other
equipment
Construction
in progress
End of the
period

NOTES TO NON-CONSOLIDATED FINANCIAL STATEMENTS▶ DECEMBER 31, 2003 AND 2002
70 Kia Motors Corporation
The changes in property, plant and equipment in 2002 are as follows :
As of December 31, 2003, the Company's property, plant and equipment are pledged as collateral for various long-term debt to a maximum of
₩1,114,423 million (US$930,392 thousand), and certain buildings and machinery of ₩78,231 million (US$65,312 thousand) are mortgaged for
various loans (see Notes 11 and 12).
The published value of the Company-owned land totals ₩1,257,885 million (US$1,050,163 thousand), and ₩1,110,428 million (US$927,056
thousand) as of December 31, 2003 and 2002, respectively, in terms of land prices officially announced by the Korean government.
8. INSURANCE :
As of December 31, 2003, inventories and property, plant and equipment are insured for ₩3,236,826 million (US$2,702,309 thousand). In
addition, the Company carries general insurance for vehicles and workers' compensation and casualty insurance for employees. Also, the
Company has insurance to cover potential product liability arising from its product liability claims in North America with maximum coverage of
US$75,000 thousand and in the domestic with maximum coverage of ₩2,000 million (US$1,670 thousand).
9. INTANGIBLES :
Intangibles as of December 31, 2003 consist of the following :
Beginning of
period
Korean won (in millions)U.S. dollars (Note 2)
(in thousands)
1,433,236
1,044,816
1,325,493
20,702
305,978
74,567
98,645
4,303,437
₩
₩
End of
period
-
-
-
-
-
-
383,728
383,728
₩
₩
Transfer
1,425
26,738
136,590
14,359
124,371
37,341
(340,824)
-
₩
₩
Disposal
(35,378)
(5,333)
(43,221)
(3,354)
(11,153)
(874)
(2)
(99,315)
₩
₩
Depreciation
-
(44,737)
(192,656)
(8,203)
(148,049)
(27,351)
-
(420,996)
₩
₩
Other
changes
-
-
-
-
-
-
-
-
₩
₩
End of period
₩
₩
End of period
1,168,211
852,800
1,023,715
19,623
226,371
69,865
118,172
3,478,757
$
$
Land
Buildings and
structures
Machinery and
equipment
Vehicles
Dies, molds and
tools
Other
equipment
Construction
in progress
End of the
period
Acquisition cost Accumulated amortization Book value
Korean won (in millions)U.S. dollars (Note 2)
(in thousands)
Industrial property rights
Right of utilization
Development costs
9,303
18,662
556,562
584,527
4,404
7,556
118,753
130,713
4,899
11,106
437,809
453,814
₩
₩
₩
₩
₩
₩
Book value
4,090
9,272
365,511
378,873
$
$
1,399,283
1,021,484
1,226,206
23,504
271,147
83,683
141,547
4,166,854

2003 Annual Report 71
Intangibles as of December 31, 2002 consist of the following :
The changes in book value of intangible assets for the year ended December 31, 2003 are as follows :
The changes in book value of intangible assets for the year ended December 31, 2002 are as follows :
Research and development costs for the years ended December 31, 2003 and 2002 are as follows :
Acquisition cost Accumulated amortization Book value
Korean won (in millions)U.S. dollars (Note 2)
(in thousands)
Industrial property rights
Right of utilization
Development costs
7,531
18,662
335,541
361,734
3,715
5,690
52,605
62,010
3,816
12,972
282,936
299,724
₩
₩
₩
₩
₩
₩
Book value
3,186
10,829
236,213
250,228
$
$
Industrial propertyrights
Korean won (in millions)U.S. dollars (Note 2)
(in thousands)
Beginning of the year
Addition: Expenditures
Deduction: Amortization
End of the year
3,816
1,772
(689)
4,899
₩
₩
Right of utilization
12,972
-
(1,866)
11,106
₩
₩
Development costs
282,936
221,020
(66,147)
437,809
₩
₩
Total
299,724
222,792
(68,702)
453,814
₩
₩
Total
250,228
186,001
(57,356)
378,873
$
$
Industrial propertyrights
Korean won (in millions)U.S. dollars (Note 2)
(in thousands)
Beginning of the year
Addition: Expenditures
Deduction: Amortization
Other
End of the year
3,476
964
(624)
-
3,816
₩
₩
Right of utilization
14,838
-
(1,866)
-
12,972
₩
₩
Development costs
158,569
163,477
(36,144)
(2,966)
282,936
₩
₩
Total
176,883
164,441
(38,634)
2,966
299,724
₩
₩
Total
147,673
137,285
(32,254)
2,476
250,228
$
$
2003 2002 2003 2002
Korean won (in millions) U.S. dollars (Note 2) (in thousands)
Development costs
Research costs (Manufacturing cost)
Research costs (SG&A)
Other expense
221,020
79,773
126,799
-
427,592
163,477
114,147
114,348
541
392,513
184,522
66,599
105,860
-
356,981
136,481
95,297
95,465
452
327,695
₩
₩
₩
₩
$
$
$
$

NOTES TO NON-CONSOLIDATED FINANCIAL STATEMENTS▶ DECEMBER 31, 2003 AND 2002
72 Kia Motors Corporation
10. OTHER ASSETS :
Other assets as of December 31, 2003 and 2002 consist of the following :
11. SHORT-TERM BORROWINGS :
Short-term borrowings as of December 31, 2003 and 2002 amount to ₩789,942 million (US$659,494 thousand) and ₩41,299 million
(US$34,479 thousand), respectively, and consist of bank loans and commercial papers with annual interest rate ranging from 0.34 percent to
4.63 percent. These borrowings are secured by certain bank deposits, investment securities and property, plant and equipment (See Notes 4, 5
and 7).
12. LONG-TERM DEBT :
Long-term debt as of December 31, 2003 and 2002 consists of the following :
2003 2002 2003 2002
Korean won (in millions) U.S. dollars (Note 2) (in thousands)
Long-term deposits
Long-term trade notes and accounts receivable,
net of unamortized present value discount of
₩1,446 million in 2003 and ₩2,369 million in
2002 (see Note 2)
Lease and rental deposits
Other
56,423
7,780
143,721
60,473
268,397
59,261
11,588
134,849
34,640
240,338
47,106
6,495
119,988
50,486
224,075
49,475
9,674
112,581
28,919
200,649
₩
₩
₩
₩
$
$
$
$
2003 2002 2003 2002
Korean won (in millions)Annual interest rate (%) U.S. dollars (Note 2) (in thousands)
Debentures
Local currency loans
Reorganization claims
Other loans
Foreign currency loans
Reorganization claims
Total long-term debt
Less : Current maturities
403,775
436,309
21,527
457,836
121,596
983,207
(112,929)
870,278
769,476
524,855
20,335
545,190
148,611
1,463,277
(112,551)
1,350,726
337,097
364,259
17,972
382,231
101,516
820,844
(94,280)
726,564
642,408
438,183
16,976
455,169
124,071
1,221,638
(93,965)
1,127,673
₩
₩
₩
₩
$
$
$
$
2003
2.6~9.4
5.11
1.0~6.0
5.11

2003 Annual Report 73
Debentures as of December 31, 2003 and 2002 consist of the following :
Local currency loans as of December 31, 2003 consist of the following :
2003 2002 2003 2002
Korean won (in millions)Annual interest rate (%) U.S. dollars (Note 2) (in thousands)
250,000
227,582
119,780
179,670
777,032
(3,477)
773,555
(369,780)
403,775
250,000
228,076
120,040
180,060
778,176
(8,700)
769,476
-
769,476
208,716
190,000
100,000
150,000
648,716
(2,903)
645,813
(308,716)
337,097
208,716
190,412
100,217
150,326
649,671
(7,263)
642,408
-
642,408
₩
₩
₩
₩
$
$
$
$
2003Series Maturity
Local currency :
259 th
Foreign currency :
260 th
261 th
262 th
February 15, 2004
July 11, 2006
December 10, 2004
May 3, 2005
Less : Discount of debentures issued
Less : Current maturities of debentures
7.0
9.4
3.3
2.6
2003 2002 2003 2002
Korean won (in millions) U.S. dollars (Note 2) (in thousands)
Reorganization claims:
Korea Development Bank
Kyobo Life Insurance Co.
SG ABS Ltd.
Korea Development Leasing Corp.
Hanaro Finance
Korea Investment Trust Co., Ltd.
Nara Banking
Hyundai Investment & Securities
Korea Seoul Guarantee Insurance
Others
Other loans
Sub total
Less: Current maturities
111,952
41,365
27,998
24,607
22,393
20,139
18,468
14,012
12,561
142,814
436,309
21,527
457,836
(88,612)
369,224
134,339
49,636
33,595
29,527
26,868
24,165
22,161
16,813
13,849
173,901
524,854
20,336
545,190
(87,784)
457,406
93,465
34,534
23,374
20,544
18,695
16,813
15,418
11,698
10,487
119,231
364,259
17,972
382,231
(73,980)
308,251
112,155
41,439
28,047
24,651
22,431
20,174
18,501
14,037
11,562
145,186
438,183
16,976
455,159
(73,287)
381,872
₩
₩
₩
₩
$
$
$
$
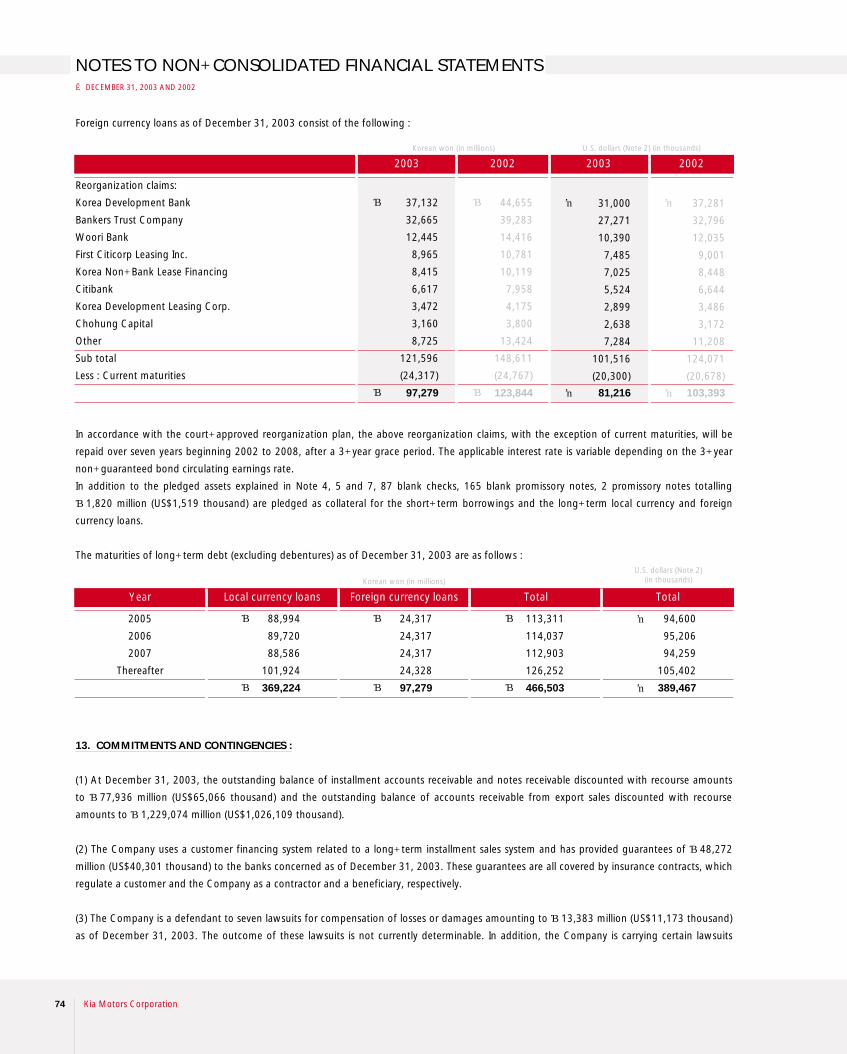
NOTES TO NON-CONSOLIDATED FINANCIAL STATEMENTS▶ DECEMBER 31, 2003 AND 2002
74 Kia Motors Corporation
Foreign currency loans as of December 31, 2003 consist of the following :
In accordance with the court-approved reorganization plan, the above reorganization claims, with the exception of current maturities, will be
repaid over seven years beginning 2002 to 2008, after a 3-year grace period. The applicable interest rate is variable depending on the 3-year
non-guaranteed bond circulating earnings rate.
In addition to the pledged assets explained in Note 4, 5 and 7, 87 blank checks, 165 blank promissory notes, 2 promissory notes totalling
₩1,820 million (US$1,519 thousand) are pledged as collateral for the short-term borrowings and the long-term local currency and foreign
currency loans.
The maturities of long-term debt (excluding debentures) as of December 31, 2003 are as follows :
13. COMMITMENTS AND CONTINGENCIES :
(1) At December 31, 2003, the outstanding balance of installment accounts receivable and notes receivable discounted with recourse amounts
to ₩77,936 million (US$65,066 thousand) and the outstanding balance of accounts receivable from export sales discounted with recourse
amounts to ₩1,229,074 million (US$1,026,109 thousand).
(2) The Company uses a customer financing system related to a long-term installment sales system and has provided guarantees of ₩48,272
million (US$40,301 thousand) to the banks concerned as of December 31, 2003. These guarantees are all covered by insurance contracts, which
regulate a customer and the Company as a contractor and a beneficiary, respectively.
(3) The Company is a defendant to seven lawsuits for compensation of losses or damages amounting to ₩13,383 million (US$11,173 thousand)
as of December 31, 2003. The outcome of these lawsuits is not currently determinable. In addition, the Company is carrying certain lawsuits
2003 2002 2003 2002
Korean won (in millions) U.S. dollars (Note 2) (in thousands)
Reorganization claims:
Korea Development Bank
Bankers Trust Company
Woori Bank
First Citicorp Leasing Inc.
Korea Non-Bank Lease Financing
Citibank
Korea Development Leasing Corp.
Chohung Capital
Other
Sub total
Less : Current maturities
37,132
32,665
12,445
8,965
8,415
6,617
3,472
3,160
8,725
121,596
(24,317)
97,279
44,655
39,283
14,416
10,781
10,119
7,958
4,175
3,800
13,424
148,611
(24,767)
123,844
31,000
27,271
10,390
7,485
7,025
5,524
2,899
2,638
7,284
101,516
(20,300)
81,216
37,281
32,796
12,035
9,001
8,448
6,644
3,486
3,172
11,208
124,071
(20,678)
103,393
₩
₩
₩
₩
$
$
$
$
Local currency loansYear
Korean won (in millions)U.S. dollars (Note 2)
(in thousands)
2005
2006
2007
Thereafter
88,994
89,720
88,586
101,924
369,224
₩
₩
24,317
24,317
24,317
24,328
97,279
₩
₩
113,311
114,037
112,903
126,252
466,503
₩
₩
94,600
95,206
94,259
105,402
389,467
$
$
Foreign currency loans Total Total

2003 Annual Report 75
pertaining to the disputes with the Brazilian government and the Brazilian shareholders of Asia Motors Do Brazil S.A., which was established as a
joint venture by Asia Motors with a Brazilian investor, in Brazilian court. Also, in 2002, the Company brought the case to the International Court
of Arbitration to settle the disputes. The Company, stockholder of AMB, has already written off this investment of ₩14,057 million, and the
Company estimates that the above matter does not and will not affect the Company’s financial statements at this time.
(4) The Company made an agreement with its overseas sales subsidiaries in Germany, Belgium, the United Kingdom and Austria for them to be
responsible for projected costs for dismantling and recycling vehicles sold in corresponding countries to comply with European Parliament
directive regarding End-of-Life vehicles (ELV).
14. CAPITAL STOCK :
Capital stock as of December 31, 2003 and 2002 consist of the following :
In accordance with the court-approved reorganization plan, on February 2, 1999 all issued shares of common stock, except those owned by
specific related persons, were reduced by a ratio of 10 to 1, and the shares owned by the specific related persons were extinguished.
Also, under the court-approved reorganization plan, on March 30, 1999, ₩5,482,181 million (US$ 4,576,875 thousand) of the Company’s
debt was forgiven, including its guaranteed obligations, and an additional ₩1,799,999 million (US$1,502,754 thousand) of its liabilities was
converted into capital stock for which 119,999,932 new shares were issued at ₩15,000 per share.
On December 7, 2000, ₩714 million (US$596 thousand) of a creditor’s claims in dispute was additionally determined by the court as the
Company’s reorganization claim and converted into capital stock for which 142,953 new shares were issued.
In accordance with the take-over contract with the Hyundai Motor Company, representing the Hyundai Motor Consortium, effective December
1, 1998, the Company issued new common stock of 172,431,118 shares amounting to ₩938,656 million (US$783,650 thousand) and the
Hyundai Motor Consortium acquired 153,000,000 shares amounting to ₩841,500 million (US$702,539 thousand) for 51 percent as of March
30, 1999.
Financial institutions, with loans to the Company that had been forgiven or converted into the Company’s common stock, and Hyundai Motor
Consortium were granted rights to subscribe to the registered non-voting preferred stock with a par value of ₩5,000. On December 28, 1998,
the financial institutions acquired rights equal to 10 percent of the forgiven debt and liabilities converted into new capital stock. Also, on
December 28, 1998, the Hyundai Motor Consortium acquired rights up to the extent that the Consortium shall own up to 51 percent of all the
additional preferred shares to be issued. These pre-emptive rights can be exercised at once or several times in the fifth or tenth year from
December 28, 1999, the date the court finally approved the reorganization plan, and the Company shall pay the dividend equal to at least 2
percent for the preferred shares to be issued for the exercise of the rights. In 2003, the fifth year from the December 28, 1999, no pre-emptive
right was exercised. In addition, the Asia Motors-invested financial institutions and Hyundai Motor Consortium were granted pre-emptive
rights under the same conditions as described above.
The Company completed stock retirement of 10 million treasury stock on July 2, 2003, which had been acquired for such retirement purpose
under the decision of the Board of Directors on May 9, 2003 and remaining shares of common stock are 359,730,455 shares. Due to this stock
retirement, the sum of face value of stock issued (₩1,798,652 million) differs from the capital stock amount.
AuthorizedYear U.S. dollars (Note 2) (in thousands)
2003
2002
820,000,000 shares
820,000,000 shares
Issued
359,730,455 shares
369,730,455 shares
Par value
5,000
5,000
₩
₩
1,848,652
1,848,652
₩
₩
1,543,373
1,543,373
$
$
Korean won (in millions)

NOTES TO NON-CONSOLIDATED FINANCIAL STATEMENTS▶ DECEMBER 31, 2003 AND 2002
76 Kia Motors Corporation
15. CAPITAL SURPLUS :
Capital surplus as of December 31, 2003 and 2002 consist of the following :
As a result of the capital reduction on February 2, 1999, the Company recognized the gain in capital surplus in the amount of ₩340,848 million
(US$284,562 thousand). In 2001, the Company accounted for the loss from the stock retirement amounting to ₩220,989 million (US$184,496
thousand) as a charged against the gain on capital reduction.
16. CAPITAL ADJUSTMENTS :
Capital adjustments as of December 31, 2003 and 2002 consist of the following :
(1) Treasury stock
As of December 31, 2003 and 2002, the Company has 1,309,723 shares and 1,609,158 shares of treasury stock, respectively, arising mainly
from cross-holdings of investment equity securities due to mergers, and has recorded treasury stock at acquisition cost in capital adjustments as
of those dates.
2003 2002 2003 2002
Korean won (in millions) U.S. dollars (Note 2) (in thousands)
Paid-in capital in excess of par value
Gain on capital reduction
Other
1,580,065
119,859
1,032
1,700,956
1,580,065
119,859
-
1,699,924
1,319,139
100,066
862
1,420,067
1,319,139
100,066
-
1,419,205
₩
₩
₩
₩
$
$
$
$
2002 2003 2002
Korean won (in millions) U.S. dollars (Note 2) (in thousands)
Treasury stock
Loss on valuation of derivatives
Stock option cost
Gain on valuation of long-term investment
securities
Gain (Loss) on valuation of equity securities
accounted for using the equity method
(see Note 5)
Gain on valuation of investment securities
(7,839)
(41,599)
3,622
969,404
27,905
-
951,493
(9,631)
-
3,735
-
(10,803)
245,380
228,681
(6,544)
(34,729)
3,024
809,320
23,296
-
794,367
(8,040)
-
3,118
-
(9,019)
204,859
190,918
₩
₩
₩
₩
$
$
$
$
2003

2003 Annual Report 77
(2) Stock option cost
Stock options granted as of December 31, 2003 are summarized below.
If all of the stock options, which require at least two-year continued service, are exercised treasury stock will be issued in accordance with the
decision of the Board of Directors. The Company calculates the total compensation expense using the option-pricing model. In the model, the
risk-free rate of 10.0 percent and 4.74 percent, the expected exercise period of 5.5 years and the expected variation rate of stock price of
0.8387 and 0.9504, are adopted for the 1st and 2nd stock options, respectively. Total compensation expense has been accounted for as a
charge to current operations and a credit to capital adjustments over the required period of service from the grant date using the straight-line
method. In 2003, the Company has accounted for stock option expense amounting to ₩1,064 millions (US$ 888 thousand) and 299,435 shares
of treasury stock issued for stock option exercised.
17. FOREIGN CURRENCY DENOMINATED ASSETS AND LIABILITIES :
The assets and liabilities denominated in foreign currencies as of December 31, 2003 and 2002 are summarized below.
Shares
1st 2nd
Granted
Cancelled
Exercised
Remaining
Grant date
Beginning date of
exercise
Exercise price
950,000
(15,000)
(299,435)
635,565
3,735
(59)
(1,177)
2,499
March 17, 2000
March 18, 2003
5,500
February 20, 2003
February 21, 2006
8,200
₩
₩
₩
3,118
(49)
(983)
2,086
$
$
Shares
695,000
(85,000)
-
610,000
2,974
(364)
-
2,610
₩
₩
₩
2,483
(304)
-
2,179
$
$
2003
Korean won (in millions)Foreign currencies (in thousands)
Assets
Liabilities
USD 336,251
EUR 77,299
CS 9,110
AUS 265
JPY 18,812,581
USD 666,019
EUR 16,588
AUS 2,119
DM 3,596
PD 329
SF 124
SK 100
CS 1
-
USD 310,639
EUR 70,264
AUS 265
DEM 96
JPY 11,764,694
USD 642,708
EUR 6,469
AUS 534
DM 4,463
PD 190
SF 101
SK 205
DK 1,131
FRF 488
402,762
116,149
8,437
238
527,586
210,626
797,757
24,924
1,900
2,763
700
119
17
1
-
1,038,807
₩
₩
₩
₩
372,896
88,347
180
62
461,485
119,161
771,507
8,134
362
2,869
365
88
28
192
94
902,800
₩
₩
₩
₩
2002 2003 2002
Korean won (in millions) U.S. dollars (Note 2) (in thousands)
Korean won (in millions) U.S. dollars (Note 2) (in thousands)
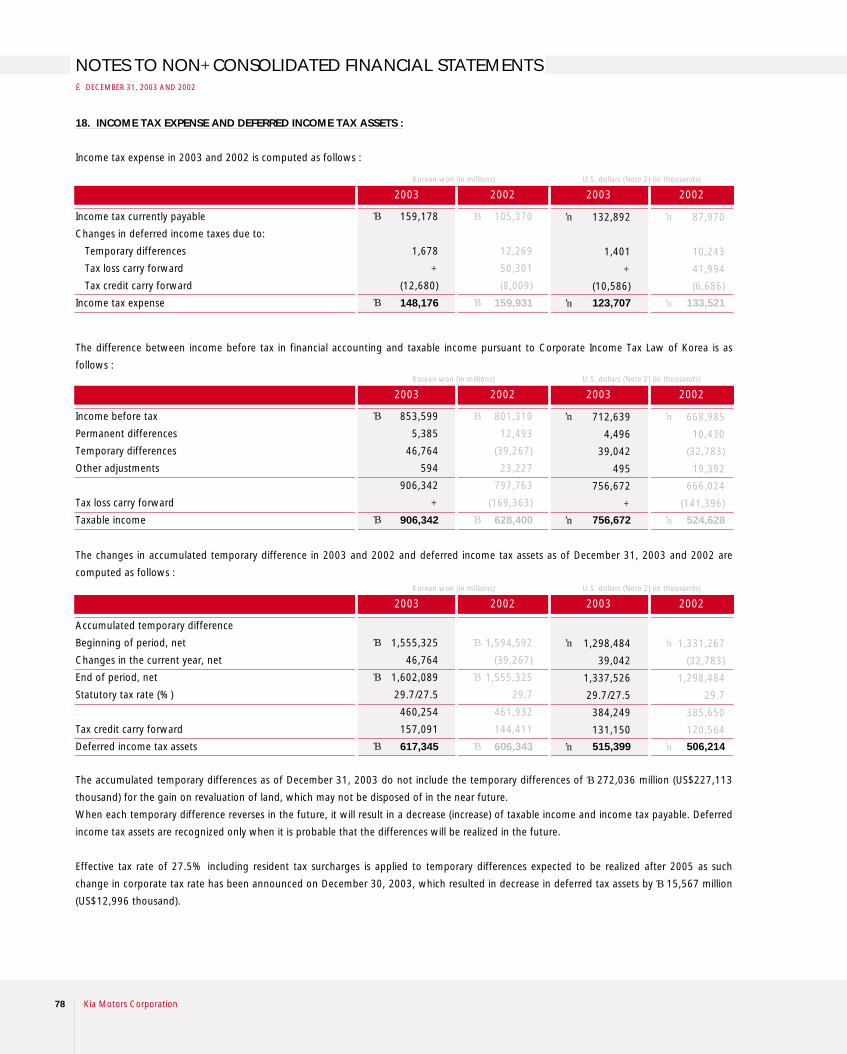
NOTES TO NON-CONSOLIDATED FINANCIAL STATEMENTS▶ DECEMBER 31, 2003 AND 2002
78 Kia Motors Corporation
18. INCOME TAX EXPENSE AND DEFERRED INCOME TAX ASSETS :
Income tax expense in 2003 and 2002 is computed as follows :
The difference between income before tax in financial accounting and taxable income pursuant to Corporate Income Tax Law of Korea is as
follows :
The changes in accumulated temporary difference in 2003 and 2002 and deferred income tax assets as of December 31, 2003 and 2002 are
computed as follows :
The accumulated temporary differences as of December 31, 2003 do not include the temporary differences of ₩272,036 million (US$227,113
thousand) for the gain on revaluation of land, which may not be disposed of in the near future.
When each temporary difference reverses in the future, it will result in a decrease (increase) of taxable income and income tax payable. Deferred
income tax assets are recognized only when it is probable that the differences will be realized in the future.
Effective tax rate of 27.5% including resident tax surcharges is applied to temporary differences expected to be realized after 2005 as such
change in corporate tax rate has been announced on December 30, 2003, which resulted in decrease in deferred tax assets by ₩15,567 million
(US$12,996 thousand).
2003 2002 2003 2002
Korean won (in millions) U.S. dollars (Note 2) (in thousands)
Income tax currently payable
Changes in deferred income taxes due to:
Temporary differences
Tax loss carry forward
Tax credit carry forward
Income tax expense
159,178
1,678
-
(12,680)
148,176
105,370
12,269
50,301
(8,009)
159,931
132,892
1,401
-
(10,586)
123,707
87,970
10,243
41,994
(6,686)
133,521
₩
₩
₩
₩
$
$
$
$
2003 2002 2003 2002
Korean won (in millions) U.S. dollars (Note 2) (in thousands)
Income before tax
Permanent differences
Temporary differences
Other adjustments
Tax loss carry forward
Taxable income
853,599
5,385
46,764
594
906,342
-
906,342
801,310
12,493
(39,267)
23,227
797,763
(169,363)
628,400
712,639
4,496
39,042
495
756,672
-
756,672
668,985
10,430
(32,783)
19,392
666,024
(141,396)
524,628
₩
₩
₩
₩
$
$
$
$
2003 2002 2003 2002
Korean won (in millions) U.S. dollars (Note 2) (in thousands)
Accumulated temporary difference
Beginning of period, net
Changes in the current year, net
End of period, net
Statutory tax rate (%)
Tax credit carry forward
Deferred income tax assets
1,555,325
46,764
1,602,089
29.7/27.5
460,254
157,091
617,345
1,594,592
(39,267)
1,555,325
29.7
461,932
144,411
606,343
1,298,484
39,042
1,337,526
29.7/27.5
384,249
131,150
515,399
1,331,267
(32,783)
1,298,484
29.7
385,650
120,564
506,214
₩
₩
₩
₩
₩
₩
$
$
$
$

2003 Annual Report 79
19. DIVIDENDS :
The computation of the proposed dividends in 2003 and 2002 is as follows :
20. SUPPLEMENTARY INFORMATION FOR COMPUTATION OF VALUE ADDED :
The accounts and amounts needed for calculation of value added are as follows :
21. DERIVATIVE INSTRUMENT :
The Company has entered into derivative instrument contracts to hedge the exposure to variability in expected future cash flows of forecasted
export sales that is attributable to changes in foreign exchange rate.
Derivative instrument contracts as of December 31, 2003 are summarized below.
The effective portion of the derivative contracts for cash flow hedging purpose from forecasted export sales recorded as a capital adjustment,
amounting ₩41,599 million (US$34,730 thousand) as of December 31, 2003, all of which were included in the determination of net income in
2004 and the ineffective portion of the derivative contracts recorded in current operations, amounting ₩48,820 million (US$40,758 thousand)
2003 2002 2003 2002
Korean won (in millions, except per share amount)U.S. dollars (Note 2)
(in thousands, except per share amount)
Number of shares eligible for dividend
Face value per share
Face value dividend rate
Dividend
Dividend to net income
Dividend yield ratio
358,420,732
5,000
7%
125,448
17.8%
3.4%
368,121,297
5,000
5%
92,030
14.3%
2.6%
₩ ₩
358,420,732
4
7%
104,731
17.8%
3.4%
368,121,297
4
5%
76,833
14.3%
2.6%
$ $
2003 2002 2003 2002
Korean won (in millions) U.S. dollars (Note 2) (in thousands)
Ordinary income
Labor costs
Interest expense, net
Rent
Taxes and dues
Depreciation
853,599
1,766,597
(32,837)
13,932
19,521
401,958
3,022,770
801,310
1,609,923
13,865
10,984
20,011
423,486
2,879,579
₩
₩
₩
₩
712,639
1,474,868
(27,414)
11,631
16,297
335,580
2,523,601
668,985
1,344,067
11,575
9,170
16,706
353,553
2,404,056
$
$
$
$
Korean won (in millions)Contract amounts
(in thousand)
U.S. dollars (Note 2) (in thousands)
Koram Bank and other
Koram Bank and other
EUR 907,000
EUR 907,000
Fair valueBank
(73,025)
(17,394)
(90,419)
Valuation loss Capital adjustments Fair value
(31,426)
(17,394)
(48,820)
₩
₩
₩
₩
(41,599)
-
(41,599)
₩
₩
(60,966)
(14,522)
(75,488)
$
$

NOTES TO NON-CONSOLIDATED FINANCIAL STATEMENTS▶ DECEMBER 31, 2003 AND 2002
80 Kia Motors Corporation
22. RELATED PARTY TRANSACTIONS :
Significant transactions with affiliated companies and related balances for the year ended and as of December 31, 2003 are summarized below.
Revenues Expenses Revenues Expenses
Korean won (in millions) U.S. dollars (Note 2) (in thousands)
Hyundai Motor Company
Hyundai MOBIS
Hyundai Hysco Co., Ltd.
Hyundai Capital Services, Inc.
Hyundai Powertek Co., Ltd.
Dymos Inc.
WIA Corporation
Bontec Co., Ltd.
Autoever Systems Co., Ltd.
KEFICO Corporation
Hankook Logitech Co., Ltd.
Asset Management Co., Ltd.
GLOVIS Co., Ltd.
Overseas subsidiaries and other
Total
414,956
46,798
120
30,361
12,797
1,291
125,505
27
1,515
2,034
3
43
1,812
4,745,643
5,382,905
1,181,764
488,651
76,872
110
199,208
22,851
530,519
77,736
29,540
60,377
47,656
123,293
63,223
304,346
3,206,146
346,432
39,070
100
25,347
10,684
1,078
104,780
23
1,265
1,698
3
36
1,513
3,961,966
4,493,995
986,612
407,957
64,178
92
166,312
19,077
442,911
64,899
24,662
50,407
39,786
102,933
52,783
254,087
2,676,696
₩
₩
₩
₩
$
$
$
$
Receivables Payables Receivables Payables
Korean won (in millions) U.S. dollars (Note 2) (in thousands)
Hyundai Motor Company
Hyundai MOBIS
Hyundai Hysco Co., Ltd.
Hyundai Capital Services, Inc.
Hyundai Powertek Co., Ltd.
Dymos Inc.
WIA Corporation
Bontec Co., Ltd.
Autoever Systems Co., Ltd.
KEFICO Corporation
Asset Management Co., Ltd.
GLOVIS Co., Ltd.
Donghui Auto Co., Ltd.
Overseas subsidiaries and other
Total
19,316
33,031
-
2
21
-
610
3,183
3
-
-
9
55,740
168,082
279,997
253,439
150,626
7,919
4
47,009
5,927
83,812
12,446
12,324
10,092
52,047
13,420
119
19,336
668,520
16,126
27,576
-
2
18
-
509
2,657
3
-
-
8
46,535
140,326
233,760
211,587
125,752
6,611
3
39,246
4,948
69,972
10,391
10,289
8,425
43,452
11,204
99
16,143
558,122
₩
₩
₩
₩
$
$
$
$
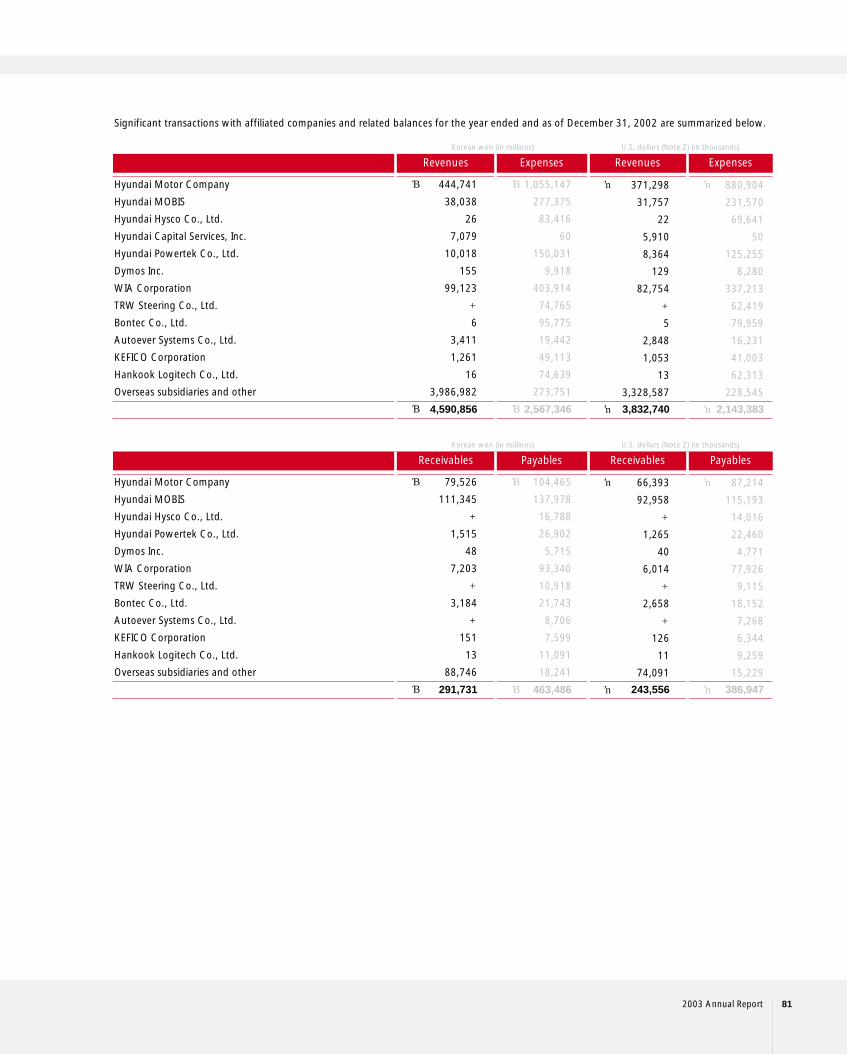
2003 Annual Report 81
Significant transactions with affiliated companies and related balances for the year ended and as of December 31, 2002 are summarized below.
Revenues Expenses Revenues Expenses
Korean won (in millions) U.S. dollars (Note 2) (in thousands)
Hyundai Motor Company
Hyundai MOBIS
Hyundai Hysco Co., Ltd.
Hyundai Capital Services, Inc.
Hyundai Powertek Co., Ltd.
Dymos Inc.
WIA Corporation
TRW Steering Co., Ltd.
Bontec Co., Ltd.
Autoever Systems Co., Ltd.
KEFICO Corporation
Hankook Logitech Co., Ltd.
Overseas subsidiaries and other
444,741
38,038
26
7,079
10,018
155
99,123
-
6
3,411
1,261
16
3,986,982
4,590,856
1,055,147
277,375
83,416
60
150,031
9,918
403,914
74,765
95,775
19,442
49,113
74,639
273,751
2,567,346
371,298
31,757
22
5,910
8,364
129
82,754
-
5
2,848
1,053
13
3,328,587
3,832,740
880,904
231,570
69,641
50
125,255
8,280
337,213
62,419
79,959
16,231
41,003
62,313
228,545
2,143,383
₩
₩
₩
₩
$
$
$
$
Receivables Payables Receivables Payables
Korean won (in millions) U.S. dollars (Note 2) (in thousands)
Hyundai Motor Company
Hyundai MOBIS
Hyundai Hysco Co., Ltd.
Hyundai Powertek Co., Ltd.
Dymos Inc.
WIA Corporation
TRW Steering Co., Ltd.
Bontec Co., Ltd.
Autoever Systems Co., Ltd.
KEFICO Corporation
Hankook Logitech Co., Ltd.
Overseas subsidiaries and other
79,526
111,345
-
1,515
48
7,203
-
3,184
-
151
13
88,746
291,731
104,465
137,978
16,788
26,902
5,715
93,340
10,918
21,743
8,706
7,599
11,091
18,241
463,486
66,393
92,958
-
1,265
40
6,014
-
2,658
-
126
11
74,091
243,556
87,214
115,193
14,016
22,460
4,771
77,926
9,115
18,152
7,268
6,344
9,259
15,229
386,947
₩
₩
₩
₩
$
$
$
$

NOTES TO NON-CONSOLIDATED FINANCIAL STATEMENTS▶ DECEMBER 31, 2003 AND 2002
82 Kia Motors Corporation
23. SELLING AND ADMINISTRATIVE EXPENSES :
Selling and administrative expenses in 2003 and 2002 are as follows
24. GEOGRAPHIC SEGMENT INFORMATION :
The following is a summary of sales by geographic area in 2003 and 2002 :
2003 2002 2003 2002
Korean won (in millions) U.S. dollars (Note 2) (in thousands)
Salaries and wages
Sales promotion
Travel
Communications
Utilities
Taxes and dues
Rent
Depreciation and amortization
Repairs and maintenance
Advertising
Freight
Supplies and stationery
Commissions and fees
Education and training
Ordinary research and development
Overseas marketing
Export expenses
Warranty
Miscellaneous
409,995
213,924
14,243
9,494
7,445
6,447
13,256
29,034
3,602
94,051
31,537
3,282
115,589
6,654
126,799
83,270
357,021
412,560
5,160
1,943,363
394,158
264,175
14,473
9,880
7,422
7,688
10,269
27,680
3,136
90,954
40,343
5,353
91,067
6,177
114,348
91,269
308,003
427,013
4,820
1,918,228
342,290
178,597
11,891
7,926
6,216
5,382
11,067
24,239
3,007
78,520
26,329
2,740
96,501
5,555
105,860
69,519
298,064
344,431
4,310
1,622,444
329,068
220,550
12,083
8,248
6,196
6,418
8,573
23,109
2,618
75,934
33,681
4,469
76,029
5,157
95,465
76,197
257,141
356,498
4,026
1,601,460
₩
₩
₩
₩
$
$
$
$
2003 2002 2003 2002
Korean won (in millions) U.S. dollars (Note 2) (in thousands)
Domestic sales
Export sales
North America
Middle and south America
Europe
Other
5,126,358
3,731,397
320,788
2,145,117
1,516,221
7,713,523
12,839,881
6,304,394
3,344,308
363,486
1,071,728
1,074,197
5,853,719
12,158,113
4,279,811
3,115,209
267,814
1,790,881
1,265,840
6,439,744
10,719,555
5,263,311
2,792,042
303,461
894,747
896,808
4,887,058
10,150,369
₩
₩
₩
₩
$
$
$
$

2003 Annual Report 83
25. THE ACTUAL APPROVAL OF THE FINANCIAL STATEMENTS :
The 2003 financial statements of the Company, which will be submitted to the shareholders’ meeting, are scheduled to be approved by the
Board of Directors on February 20, 2004.
26. SUMMARY OF RESULTS OF OPERATIONS FOR THE LAST QUARTER :
Results of operations for the last quarters of 2003 and 2002 are as follows.
2003 2002 2003 2002
Korean won (in millions, except per share amount)U.S. dollars (Note 2)
(in thousands, except per share amount)
Sales
Gross profit
Operating income
Ordinary income
Net income
Ordinary income per common share
Earnings per common share
3,938,214
887,262
402,310
335,894
290,748
812
812
3,701,403
795,704
309,986
360,224
292,826
796
796
3,287,873
740,743
335,874
280,426
242,735
678
678
3,090,168
664,305
258,796
300,738
244,470
665
665
₩ ₩ $ $

84 Kia Motors Corporation
F i v e - Y e a r s S u m m a r y
Sales Volume
Domestic
Export
Revenue
Domestic
Export
Operating Income
Ordinary Income
Net Income
Total Assets
Current Assets
Non-current Assets
Total Liabilities
Current Liabilities
Long-term Liabilities
Total Shareholders' equity
Capital Stock
Capital Surplus
Retained Earnings
Net Operating
Net Investment
Net Financing
Change in Cash
2003
858,697
319,795
538,902
12,839,881
5,126,358
7,713,523
812,440
853,599
705,423
11,211,132
3,251,294
7,959,838
5,868,953
3,839,030
2,029,923
5,342,179
1,848,652
1,700,956
841,078
1,457,333
(-)1,227,074
444,663
674,922
2002
894,268
444,444
449,824
12,158,113
6,304,394
5,853,719
658,493
801,310
641,379
9,112,648
2,921,333
6,191,315
5,018,964
2,679,543
2,339,421
4,093,684
1,848,652
1,699,924
316,427
2,105,670
(-)1,101,776
(-)491,004
512,890
2001
899,788
411,321
488,467
11,129,204
5,146,620
5,982,584
522,241
424,151
552,235
8,438,466
2,419,877
6,018,589
5,045,450
2,540,899
2,504,551
3,393,016
1,847,987
1,699,924
(-)324,952
1,162,165
(-)835,164
(-)107,785
219,216
2000
856,045
408,378
447,667
9,744,843
4,996,026
4,748,817
353,127
369,713
330,704
8,169,281
2,542,022
5,627,259
5,107,764
2,601,221
2,506,543
3,061,517
2,247,987
1,920,913
(-)783,887
422,713
(-)383,627
(-)20,800
18,286
1999
769,641
300,998
468,643
7,930,638
4,196,565
3,734,073
48,847
227,863
135,745
7,681,295
2,374,999
5,306,296
4,584,082
2,371,448
2,212,634
3,097,213
2,247,273
1,921,058
(-)1,044,503
(-)429,972
(-)874,989
1,136,936
(-)152,074
(Units, Korean won in millions)
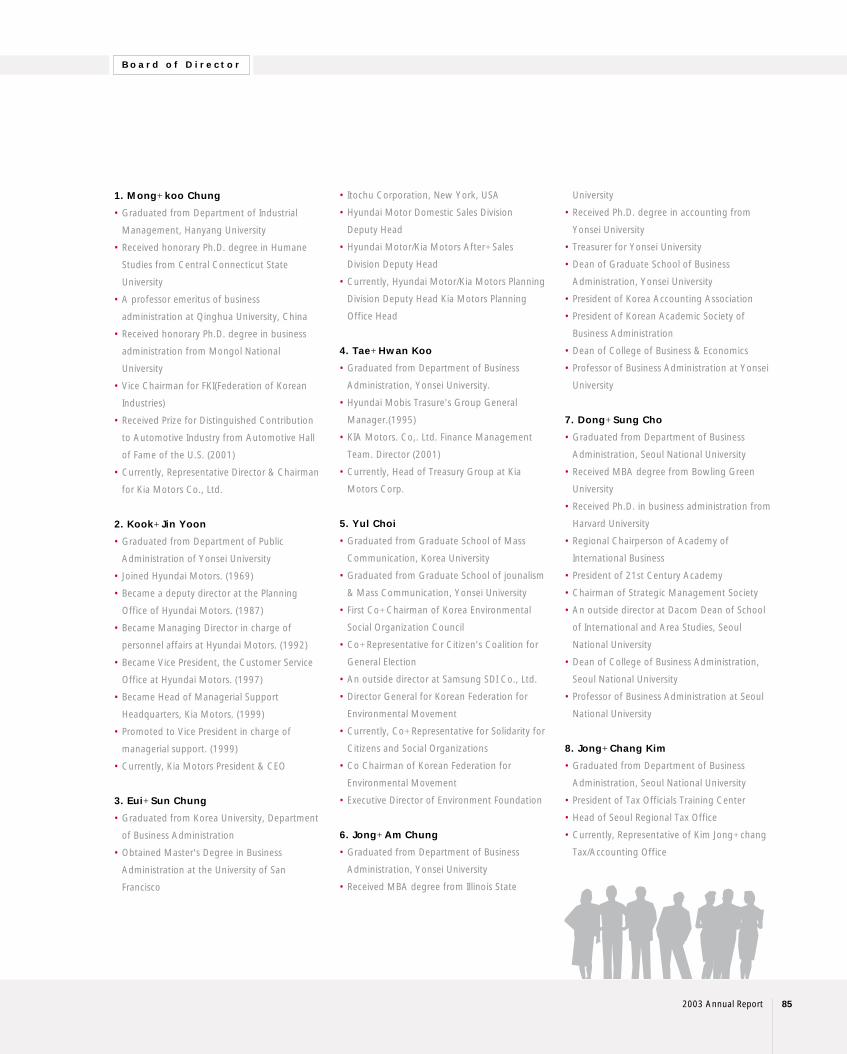
2003 Annual Report 85
B o a r d o f D i r e c t o r
1. Mong-koo Chung
• Graduated from Department of Industrial
Management, Hanyang University
• Received honorary Ph.D. degree in Humane
Studies from Central Connecticut State
University
• A professor emeritus of business
administration at Qinghua University, China
• Received honorary Ph.D. degree in business
administration from Mongol National
University
• Vice Chairman for FKI(Federation of Korean
Industries)
• Received Prize for Distinguished Contribution
to Automotive Industry from Automotive Hall
of Fame of the U.S. (2001)
• Currently, Representative Director & Chairman
for Kia Motors Co., Ltd.
2. Kook-Jin Yoon
• Graduated from Department of Public
Administration of Yonsei University
• Joined Hyundai Motors. (1969)
• Became a deputy director at the Planning
Office of Hyundai Motors. (1987)
• Became Managing Director in charge of
personnel affairs at Hyundai Motors. (1992)
• Became Vice President, the Customer Service
Office at Hyundai Motors. (1997)
• Became Head of Managerial Support
Headquarters, Kia Motors. (1999)
• Promoted to Vice President in charge of
managerial support. (1999)
• Currently, Kia Motors President & CEO
3. Eui-Sun Chung
• Graduated from Korea University, Department
of Business Administration
• Obtained Master's Degree in Business
Administration at the University of San
Francisco
• Itochu Corporation, New York, USA
• Hyundai Motor Domestic Sales Division
Deputy Head
• Hyundai Motor/Kia Motors After-Sales
Division Deputy Head
• Currently, Hyundai Motor/Kia Motors Planning
Division Deputy Head Kia Motors Planning
Office Head
4. Tae-Hwan Koo
• Graduated from Department of Business
Administration, Yonsei University.
• Hyundai Mobis Trasure's Group General
Manager.(1995)
• KIA Motors. Co,. Ltd. Finance Management
Team. Director (2001)
• Currently, Head of Treasury Group at Kia
Motors Corp.
5. Yul Choi
• Graduated from Graduate School of Mass
Communication, Korea University
• Graduated from Graduate School of jounalism
& Mass Communication, Yonsei University
• First Co-Chairman of Korea Environmental
Social Organization Council
• Co-Representative for Citizen's Coalition for
General Election
• An outside director at Samsung SDI Co., Ltd.
• Director General for Korean Federation for
Environmental Movement
• Currently, Co-Representative for Solidarity for
Citizens and Social Organizations
• Co Chairman of Korean Federation for
Environmental Movement
• Executive Director of Environment Foundation
6. Jong-Am Chung
• Graduated from Department of Business
Administration, Yonsei University
• Received MBA degree from Illinois State
University
• Received Ph.D. degree in accounting from
Yonsei University
• Treasurer for Yonsei University
• Dean of Graduate School of Business
Administration, Yonsei University
• President of Korea Accounting Association
• President of Korean Academic Society of
Business Administration
• Dean of College of Business & Economics
• Professor of Business Administration at Yonsei
University
7. Dong-Sung Cho
• Graduated from Department of Business
Administration, Seoul National University
• Received MBA degree from Bowling Green
University
• Received Ph.D. in business administration from
Harvard University
• Regional Chairperson of Academy of
International Business
• President of 21st Century Academy
• Chairman of Strategic Management Society
• An outside director at Dacom Dean of School
of International and Area Studies, Seoul
National University
• Dean of College of Business Administration,
Seoul National University
• Professor of Business Administration at Seoul
National University
8. Jong-Chang Kim
• Graduated from Department of Business
Administration, Seoul National University
• President of Tax Officials Training Center
• Head of Seoul Regional Tax Office
• Currently, Representative of Kim Jong-chang
Tax/Accounting Office

86 Kia Motors Corporation
H i s t o r y
1944
Since its foundation in 1944, Kia Motors hasdevoted itself for more than half a century to thesole purpose of personal mobility. Kia's productdevelopment history extends from Korea's firstdomestically produced bicycle through two-wheelmotorbikes, three-wheel vehicles, and four-wheel-drive trucks, to the family car, telling astory all its own.
1944 _ Company founded as Kyungsung Precision Industry
1952 _ Company produces first Korean-made bicycle, the Samcheolli model
1957 _ Siheung Plant completed
1961 _ C-100 motorcycle enters production
1962 _ K-360 3-wheel truck introduced
1973
1973 is a watershed in the history of Kia andKorea's automobile history as it marks the open-ing of the Sohari Plant and the start of mass pro-duction. With it Kia introduced the nation's firstconveyor-system production line, set up a pro-duction structure based on a single continuousprocess, and produced the first four-wheel trucksand cars to be made in Korea, thus breaking newground as an all-round vehicle manufacturer.
1971 _ Kia Service Corp. established Titan and Boxer four-wheel trucks enter
production
1973 _ Sohari factory built
1973 _ Kia produces first Korean-made gasoline engine (2,000cc)
1974 _ Kia begins production of first Korean-made passenger car, Brisa
1975 _ First export of finished automobile (Brisa pickup)
1976 _ Take-over of Asia Motors Co.
1978 _ Diesel engine enters production
1979 _ Assembly of Peugot 604 sedan commenced
1979 _ Assembly of Fiat 132 sedan commenced
1980
The boom years for Kia Motors, the 1980s beganwith landmark events including the assassinationof President Park Chung Hee and the secondworld oil shock. But Kia turned crisis into oppor-tunity as external events were used to spur inno-vation and the achievement of unprecedentedgrowth through far-reaching cost reductions,technological development, and a bold salesstrategy.
1980 _ Bongo Truck small cargo vehicle produced
1981 _ Bongo Coach minibus produced
1983 _ Ceres multipurpose farm truck produced
1986 _ Besta minibus produced
1986 _ Kia basketball team formed
1986 _ Pride (Festiva) passenger car produced
1986 _ First export of Pride model
1986 _ Concord mid-size passenger car produced
1988 _ Trade 2.5-ton truck produced
1986 _ Rhino 5-ton truck marketed
1986 _ Total vehicle production to date reaches 1 million units
1989 _ Capital mid-size passenger car launched
1990
In the 90s, Kia laid down a concrete plan of actioncentered on a global management strate-gy.With the construction of the Hwasung Plant, theproduction system was expanded to an inter-national scale, and by developing its own first newmodel, Kia gained technological competi-tivenessin the global market. A change of name from KiaIndustries to Kia Motors, along with a new logo,helped bring Kia into the ranks of full- lineautomobile manufacturers.
1990 _ Asan Bay Plant constructed
1990 _ Company name changed to Kia Motors Corp.
1991 _ Sephia compact sedan and Sportage SUV appear in 29th Tokyo Motor Show
1992 _ Sephia and Potentia luxury sedan enter commercial production
1990 _ New company headquarters constructed
1990 _ Kia Japan Corp. established
1990 _ Kia Motors America established
1993 _ Total vehicle production reaches 3 million units Sportage enters commercial
production

2003 Annual Report 87
1990 _ Comprehensive vehicle proving ground constructed
1994 _ Kia Motors celebrates 50th anniversary
1990 _ Group corporate Identity revised
1990 _ Avella (Aspire) enters production
1990 _ Sephia and Sportage exported to U.S.A.
1995 _ Credos (Clarus) mid-size sedan introduced
1990 _ Tokyo R&D center opened
1990 _ Pregio minibus produced
1996 _ Sephia and Credos exported to Europe Elan sports roadster produced
1990 _ Kia Sihwa Research Center constructed
1990 _ Total vehicle production reaches 5 million units
1997 _ Enterprise luxury sedan launched
1990 _ Bongo Frontier produced
1990 _ Sephia wins China World Rally
1990 _ Sephia II produced
1990 _ Plant constructed for joint venture in China
1990 _ Shuma mid-size sports sedan introduced
1998 _ Carnival minivan produced
1990 _ Credos II mid-size sedan produced
1990 _ Frontier Tilting cap 1-ton truck produced
1990 _ Parktown multipurpose 7-passenger wagon produced
1990 _ Total exports to date reach 2 million units
1999 _ Asan Bay Plant renamed to Hwasung Plant
1990 _ Kia New Start 2000 event held
1990 _ Exhibition of new models,
1990 _ Visto compact car, Carstar RV and Millennium Rio produced
2000
Kia Motors staged a stunning turnaround after thefinancial difficulties brought on by the for-eigncurrency crisis of 1997. A company-widemanagement overhaul following the crisis achieveda complete normalization of manage-ment, and in2001 the company achieved its highest annualprofit since its foundation.Kia is now preparing to join the ranks of theworld's top five car manufacturers by 2010.
2000 _ Kia Sportage completes Paris-Dakar Rally
2000 _ BI logo introduced to whole range of Kia vehicles in domestic market
2000 _ Spectra produced
2000 _ Carens 2.0 Di LPG-powered vehicle produced
2000 _ Optima mid-size sedan produced
2000 _ Retona Cruiser jeep produced
2000 _ Sportage wins Baja 2000 Rally
2001_ Carnival II marketed
2000 _ Kia receives Korea HR management award (12th)
2000 _ Kia wins grand prize in Korea Quality Management Award
2000 _ Kia Tigers baseball team formed Full entry into Chinese automobile market
2002 _ Carnival Common Rail marketed
2000 _ Sorento luxury SUV marketed
2000 _ Kia Q Service enters full operation
2000 _ Diesel-powered Carens II marketed
2000 _ Cumulative production reaches 10 million units
2000 _ First Skill World Cup Competition held
2000 _ Regal mid-size sedan marketed
2000 _ Company awarded 2002 Value Management Award
2000 _ Upgraded compact sedan Rio SF marketed
2000 _ Subsidiary companies established in 5 European countries
2000 _ Company awarded Grand Prize in Korea Service Quality Award
2000 _ Sorento begins exports to overseas market
2003 _ Opirus/Amanti launched
2003 _ Main sponsorship agreement signed for Australian Open through 2008.
2003 _ X-Trek launched.
2003 _ Visto Fuel Mileage Championship held.
2003 _ ISO 14401 certification received.
2003 _ Kia and Hyundai R&D units merged; ground broken for new Environment
Technology Center
2003 _ Global environmental management initiative declared.
2003 _ 2 millionth Bongo van sold.
2003 _ Official cars provided for Daegu Universiade.
2003 _ Carnival production begun in Malaysia.
2003 _ Company participates in 2nd Annual Busan Motor Show.
2003 _ Opirus / Amanti launched in North American market.
2003 _ Exports break 4 million mark.
2003 _ Cerato launched.
2003 _ 2003 Global Dealer Conference opened in Sydney.
2003 _ US$5 Billion Export Award received on Trade Day.
2004 _ Cerato briefing held at North American International Motor Show.
2003 _ Bongo III truck/bus launched.
2003 _ 1st Dongfung-Yueda Dealer Convention opened (on Jeju Island).
2003 _ Morning / Picanto launched.

88 Kia Motors Corporation
A f f i l i a t e s
Hyudai MotorThis major Korean automaker bexported its first
cars (the Pony) in 1976. Hyndai now exports
over 1.6 million units a year. Kia Motors and
Hyundai Motor are now working together in
R&D as well as marketing to claim thier place
among the world’s top five by 2010.
NGV TekEstablished in October 2000, the firm is
developing next-generation automobile
technologies in collaboration with universities
and research institutes at home and abroad.
Hyundai MobisHyundai Mobis was initially launched under the
name of Hyundai Precision Industry in 1977.
This is Korea’s largest automotive parts supplier,
serving domestic and overseas customers.
KEPICO CorporationHyundai Motor, Robert Bosch Ltd (Germany)
and Mitsubishi Electric (Japan), established
KEPICO as a joint-venture in 1987 to develop
and manufacture automotive engine control
systems, automatic transmission control systems
and various parts that enhance vehicular safety
and comfort.
DymosDymos is Korea’s leading maker of transmissions
and automobile axles for commercial vehicles
and SUVs. The company also manufactures
automatic transmissions for Korean-model
electric trains (K1A1), reduction drive units for
high-speed electric trains and heavy-duty
automobile axles.
Hyundai-PowertechHyundai-Powetech is an automatic
transmission manufacturer currently based in
the Seosan Industrial Complex. Created in 2001
as a joint-venture firm by Kia Motors and
Hyundai Motor, the company started up mass
production in August 2001 and is now growing
into a major world player working in
cooperation with some of the world’s leading
makers of automatic transmissions.
INI SteelThis Incheon-based firm specializes in section
steel, steel rod, steel rails, stainless steel, rolled
steel, heavy equipment and machinery, INI Steel
boasts high quality and cost competitiveness
and excellent customer services.
Hyundai HyscoHyundai Hysco was founded under the name of
Kyung-il Industrial Co., Ltd. in 1975 and has
been a domestic leadier in steel pipe for the
past 30 years. An innovative and aggressive
management style and ongoing development
efforts are driving the company to the forefront
of the Korean steel industry.
BNG Steel Co.BNG Steel specializes in stainless steel plates.
The company plants in Changwon and Ulsan
have an annual output capacity of 23,000 tons
and command a 30% share of the domestic
market.
Autoever Systems Co.Autoever Systems Co. offers the Hyundai Motor
Group system management and system
integration services as well as information
system consulting.
e-HD.com Inc.This firm was created in a satellite imaging
project conducted by Hyundai Space and
Aircraft Co. in April 2000. Equipped with a
state-of-the-art satellite image processing
system and operation technology, e-HD.com is
spurring technology development to provide a
full range of image products and related service
to the public and private sectors.
Glovis Co., LtdCreated in February 2001, Glovis is a total
logistics solution provider. The company takes
advantage of the logistics know-how of the
Hyundai Group and its own worldwide logistics
network, which includes e-commerce and a
supply chain management system.
Hyundai Capital Service Inc.Hyndai Capital Service operates 34 branch
offices and 13 service points nationwide,
assisting consumers and corporate customers
with their financing.
Amco Corp.Amco Corp was established in 2002. The
company is specialized in build automobile and
automotive parts plants.

2003 Annual Report 89
G l o b a l N e t w o r k s
• Head Office 1
• Regional Headguarter 4
• Overseas Subsidiary 13
• Joint Corporation 1
• Regional Office 15
• R&D Center 7
• Domestic Plant 3
• KD Plant 12
• KD Partner 11
• Distributor 143
With operations in 160 countries around the world,
Kia Motors is a true global playerKia is expanding its global capabilities to answer customer needs around the world.
Hwasung Plant(Sorento, Carens, Opirus/Amanti, Cerato,Optima/Magentis, etc,.)
Gwangju Plant(BongoⅢ, Compact SUV, Military Vehicles,Large Bus, etc,.)
Sohari Plant(Carnival / Sedona, Rio)
• Domestic Plant 3
• Overseas Plant 1
••
•

231, Yangjae-Dong, Seocho-Gu,Seoul, Korea, 137-938TEL : 82-2-3464-1114www.kia.co.krwww.kmcir.com
For Environmental protection,this catalog can be recycled
Copyright
ⓒ2003by
KIA
MO
TORS
Corp.
Producedby
IR-Plus


![PM[A] - PICANTO 1.2 EX - Naza EX.pdf · PICANTO 1.2 EX TECHNICAL DATA PICANTO 1.2 EX STANDARD SPECIFICATIONS ... Naza Kia Malaysia reserves the right to change prices and specifications](https://img.pdfslide.us/doc/110x75/5b27d5f87f8b9a5f2d8b4d87/pma-picanto-12-ex-expdf-picanto-12-ex-technical-data-picanto-12-ex.jpg)