Embed Size (px)
Citation preview

Construction Safety Analytics Mining your data and construction industry insurance data to develop a measurable strategic business plan
© 2016 Willis Towers Watson. All rights reserved.
22nd Annual Willis Towers Watson Construction Risk Management Conference
September 14, 2016
Mike Fredebeil, CSP Willis Towers Watson National Construction Practice

Annual Investment for Construction Risk Control Professionals
$12M
Full time Construction Risk Control Professionals
30
WTW-AGC CSEA Judging process for 30 years
2,400 Best Practice presentations shared
Customized Risk Control Analytics forecast higher risk project phases for resource utilization Key Leading Performance Indicators Risk Avoidance Systems Management engagement Gap Analysis Performance Dashboards

Current Situation
• Structural change taking place in the insurance market with an increasing focus on data and analytics
• Brokers and Carriers are investing in data and analytics
• Data allows a deeper understanding of the Client and works to their benefit.
• Data allows for better safety management
• Data helps clarify Risk, Exposures, and Severity
• Better data leads to better risk assessment and more accurate pricing.
• Carriers are moving toward data driven analytics

Underwriting Uncertainty Control of Exposures Construction is a dangerous business Risk = Rate
.45 Mod and .89 TRIR
Results
Risk Control
??
? ?
Big Industry Data

High Cost Construction WC Accident Study by Type 91% of the total costs for Construction in 2014
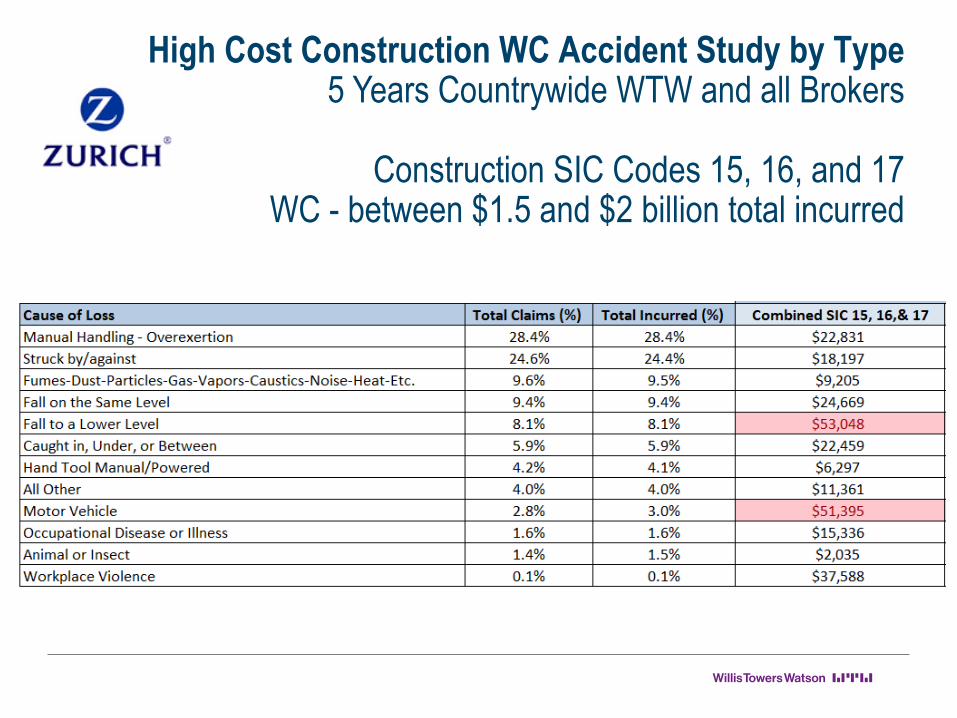
High Cost Construction WC Accident Study by Type 5 Years Countrywide WTW and all Brokers
Construction SIC Codes 15, 16, and 17
WC - between $1.5 and $2 billion total incurred

High Cost Construction Auto Accident Study by Type 5 Years Countrywide WTW and all Brokers
Construction SIC Codes 15, 16, and 17
Between $250 and $500 million in total incurred

2016 Liberty Mutual Workplace Safety Index

I-285 and SR400 Reconstruction Project Risk and Exposure Think Sheets

Risks and Exposures - I-285 and SR400 Reconstruction Project
Damage or Impact to Surrounding Homes and Businesses Damage or Impact to Surrounding Sidewalks, Streets and Roads Public and Worker Pedestrian Traffic Project Site Internal Traffic Control Design for Safety Course of Construction Worker Safety Worker Participation and Ownership Schedule Utilities – above and below ground QA and QC Visitors/Tours Security - Vandalism – Theft Claim and Loss Management Coordination with emergency services and authorities FAA requirements – specifically crane heights Public Relations and Involvement

Bridge and Road Construction WC Accident Study by Type SIC Code 1611 Highway and Street Construction SIC Code 1622 Bridge and Elevated Highway Construction 3 ½ Years – 3,300 WC Claims Total Incurred would be between $25 million and $150 million. Claims < $1,000 removed

Bridge and Road Construction WC Accident Study by Type SIC Code 1611 Highway and Street Construction SIC Code 1622 Bridge and Elevated Highway Construction 3 ½ Years – 3,300 WC Claims Total Incurred would be between $25 million and $150 million. Claims < $1,000 removed

Data Driven Analytics
• Pinpointing opportunities to reduce claim frequency • Mitigating severity on future, potentially serious loss types
• Reducing litigation rates or cost patterns • Revealing troubled spots beyond the usual exposure analysis through heat mapping techniques
• Assessing and helping to better understand industry benchmarks utilizing benchmarking against our database on loss types, similar occupation codes etc.

What Does “Big Red” Say?

ENR Top 200 $350M – CCIP Program 1-1-10 to 12-31-14 Losses valued 1-29-15
WC Accident Type Claim Count Total Incurred Cost
Struck by/against 76 $1,236,304
Overexertion 81 $869,313
Fall from Elevation 36 $601,566
Fall same Level 41 $342,179
Caught in, Under or Between 24 $178,405
Hand Tool Manual/Powered 30 $129,991
Electrical Contact 4 $106,148
Animal or Insect 4 $21,760
Fumes/Dust/Gas/Caustics/Noise Etc. 27 $15,543
Occupational Disease or Illness 4 $5,543
GRAND TOTAL 327 $3,506,752
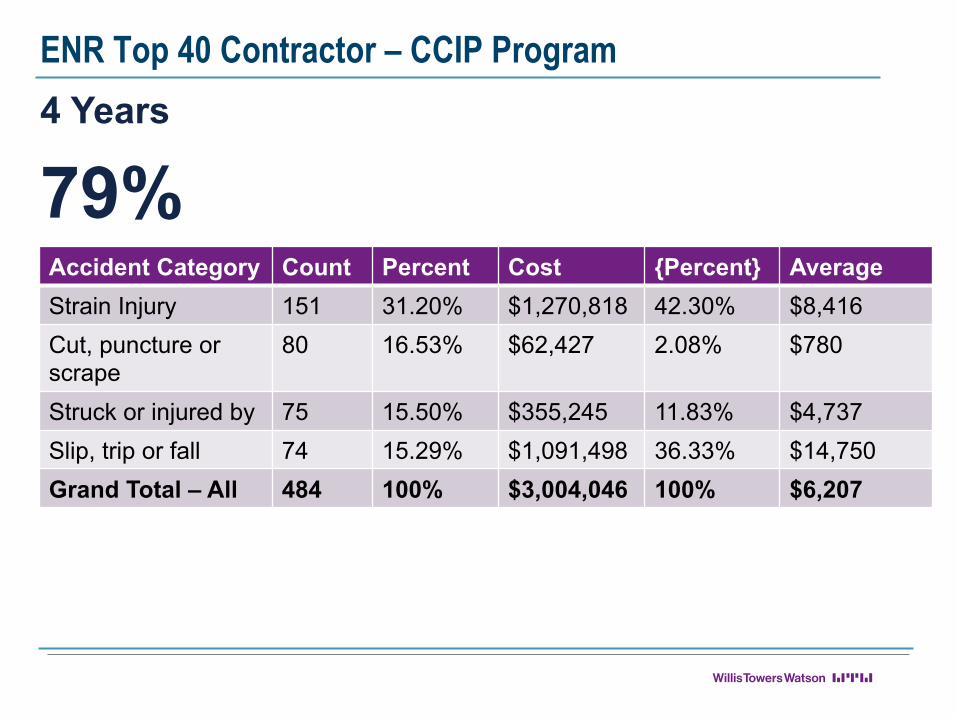
ENR Top 40 Contractor – CCIP Program 4 Years
79% Accident Category Count Percent Cost {Percent} Average Strain Injury 151 31.20% $1,270,818 42.30% $8,416 Cut, puncture or scrape
80 16.53% $62,427 2.08% $780
Struck or injured by 75 15.50% $355,245 11.83% $4,737 Slip, trip or fall 74 15.29% $1,091,498 36.33% $14,750 Grand Total – All 484 100% $3,004,046 100% $6,207

Accident Type Analysis 86% 1-1-10 to 11-3-14 Losses valued 11-3-14
Accident Type Claim Count
Total Incurred Cost
Average Cost
Manual Handling – Overexertion 118 $2,395,561 $20,301
Fall to Lower Level 38 $1,601,293 $42,139
Fall Same Level 46 $942,885 $20,498
Hand Tool Manual/Powered 48 $302,850 $6,309
Struck by/against 54 $267,133 $4,947
Caught in, under or between 25 $162,472 $6,499
Other 10 $41,772 $4,177
Fumes/Dust/Particles/Gas/Vapors/Caustics/Noise/Heat etc.
54 $22,220 $411
Occupational Disease of Illness 2 $1,910 $955
Animal or Insect 1 $1,108 $1,108
Electrical Contact 1 $99 $99
GRAND TOTAL 397 $5,739,303 $30,367

Type Errors – Major Construction Carrier loss runs 306 total claims for $7,528,971
18 © 2016 Willis Towers Watson. All rights reserved. Proprietary and Confidential. For Willis Towers Watson and Willis Towers Watson client use only.

So What

Accident Type Analysis 86% 1-1-10 to 11-3-14 Losses valued 11-3-14
Accident Type Claim Count
Total Incurred Cost
Average Cost
Manual Handling – Overexertion 118 $2,395,561 $20,301
Fall to Lower Level 38 $1,601,293 $42,139
Fall Same Level 46 $942,885 $20,498
Hand Tool Manual/Powered 48 $302,850 $6,309
Struck by/against 54 $267,133 $4,947
Caught in, under or between 25 $162,472 $6,499
Other 10 $41,772 $4,177
Fumes/Dust/Particles/Gas/Vapors/Caustics/Noise/Heat etc.
54 $22,220 $411
Occupational Disease of Illness 2 $1,910 $955
Animal or Insect 1 $1,108 $1,108
Electrical Contact 1 $99 $99
GRAND TOTAL 397 $5,739,303 $30,367

Construction Safety and Risk Control Plan
21
Dashboard - Concept
© 2016 Willis Towers Watson. All rights reserved. Proprietary and Confidential. For Willis Towers Watson and Willis Towers Watson client use only.

Construction Safety and Risk Control Plan
22
Dashboard - Prototype
© 2016 Willis Towers Watson. All rights reserved. Proprietary and Confidential. For Willis Towers Watson and Willis Towers Watson client use only.

Safety Management Continuum
ReactiveCompliance
Driven
Employee Focused
ManagementAccountability
Safety ExcellenceAnd Leadership
§ Production Driven§ Disciplinary culture§ Safety Manager
“owns” safety program
§ Job Intimidation§ Authority§ Visibility§ Unsafe Conditions§ Spotty
documentation§ Band-Aid fixes§ “Safety Cop”
enforcement
§ It’s the law§ Minimum compliance
levels§ Safety Manager
“owns” safety program
§ Policies & Procedures “cookie cutter”
§ Safety Manual§ Safety Manager with
minimal enforcement authority
§ “Hector the Inspector”
§ Management reactive
§ Finger Pointing§ Safety Manager
“owns” safety program
§ Safety committees§ Incentive programs§ Static safety training§ Suggestion box§ Stretch and Flex only§ Unsafe acts§ Why did that happen
again?
§ Management Involvement & Commitment
§ Management mentoring
§ Pre-bid Risk analysis§ Scheduling
assessments§ Communication
technology§ Marketing safety
(internal & external)§ Cost allocation§ Data analysis§ Issues report§ Near miss procedure§ Risk measurement
§ Management Passion & Focus
§ Shared values all levels of Mgmt.
§ Safety integrated in Mgmt. systems
§ Contribution at all levels
§ Safe behavior reflects Mgmt. systems
§ Continual process of evaluation and improvement
§ Measure control of risk§ No fear environment§ Employee retention§ Leadership
mentoring/shadowing§ Networking§ Competitive advantage
© 2016 Willis Towers Watson. All rights reserved. Proprietary and Confidential. For Willis Towers Watson and Willis Towers Watson client use only. 1
Con
trol o
f Ris
k


Leadership Safety Engagement Analysis Part 1
Area Name Project ResposibilitySupport and Participation in
the Safety Management Process 1-1-16
CommentsSupport and Participation in
the Safety Management Process 1-1-17
Maryland Projects Adam Quinlan Senior Project Manager 2 - EngagedVirginia Projects Adam Thompson Senior Project Manager 4 - Not EngagedMaryland Projects Allen McCullough Vice President 3 - Sort of EngagedMaryland Projects Allen Snyder Project Manager 2 - EngagedMaryland Projects Allyson Myers Project Engineer 3 - Sort of EngagedWashington D.C. Projects Andrew Gonzalez Quality Control Inspector 1 - Highly EngagedVirginia Projects Andy van Scoy Project Manager (PDA) 2 - EngagedWashington D.C. Projects Ben Simcik Project Engineer (PDA) 3 - Sort of EngagedMaryland Projects Bill Straub Project Superintendent 2 - EngagedNorth Carolina Projects Brian Kuhnle Project Manager 1 - Highly EngagedVirginia Projects Carlos Dahmen Project Engineer 4 - Not EngagedVirginia Projects Carroll Noel Foreman 3 - Sort of EngagedNorth Carolina Projects Chad Braby Vice President 3 - Sort of EngagedMaryland Projects Chris Kay Project Manager 3 - Sort of EngagedNorth Carolina Projects Chris Looper Project Manager (PDA 3 - Sort of EngagedOhio Projects Chuck Orick Project Superintendent (PDA) 2 - EngagedWashington D.C. Projects Daniel Kemlage Project Engineer 2 - EngagedVirginia Projects Danny Trusty Area Superintendent 4 - Not EngagedMaryland Projects Darryl Register Project Superintendent 3 - Sort of Engaged

Leadership Safety Engagement Analysis
Highly Engaged
3%
24% Engaged
Project Leaders
98
47%
Sort of Engaged
Not Engaged 11%
71%
Potential to Influence Engagement Gap

Occupation Analysis

Phase of Work Cost Analysis
Phase of Work Claim Count Total Incurred CostBuilding Exterior Envelope 23 $1,697,358Super Structure 154 $1,639,441Interior Systems 117 $1,427,494Interior Buildout and Finishes 131 $1,167,020Site Work and Underground Utilities 8 $362,627Not Listed 14 $316,059Landscape - Hardscape 2 $32,518
Grand Total 449 $6,642,517

Craft cost analysis and type Top 4 in incurred cost

Craft cost analysis and type Top 4 in incurred cost

Phase of Work Risk Rating
31 © 2016 Willis Towers Watson. All rights reserved. Proprietary and Confidential. For Willis Towers Watson and Willis Towers Watson client use only.
Phase of Work Definitions Risk Rating Color
Pre-constructionMaking sure all contractual Safety and Liability requirements are met prior to NTP
Site WorkGrading, drainage, exterior signage, parking, pedestrian protection, site lighting, fencing, laydown, delivery entrance/exit
Sub-StructureFoundation, underground utilities, and below grade waterproofing
Super StructureIron work, concrete forming and pouring, pre-cast structural members, structural concrete block, structural wood framing, etc.
Building Exterior EnvelopeRoof system, parapet, exterior doors, mosonry work, windows, expansion joints, and waterproofing
Interior Systems
HVAC, plumbing, sanitary plumbing, fire protection piping, power service and distribution, lighting, communication wiring, fire detection, security systems, and finished elevator/escalator.
Interior Buildout Insulation, drywall, painting, decorative lighting, floor coverings, cabinetry, fixtures, furnishings, and Commications
LandscapingOnsite utilities, lighting, lawns & plantings, drainage systems, lot paving, sidewalks & curbs, fencing, and storm water management systems

Project Risk Matrix
32 © 2016 Willis Towers Watson. All rights reserved. Proprietary and Confidential. For Willis Towers Watson and Willis Towers Watson client use only.
Project Name Location Phase of Work Rating
Focus 4 Trade Loss Driver
Rating
PM Engagement
Score
Genral Contractor
Engagement Score
Overall Risk
Project ABC XYZ 1.00 2.75 3.67 3.80 2.80
Project ABC XYZ 2.00 2.20 3.67 3.80 2.92
Project ABC XYZ 3.00 2.00 3.33 3.80 3.03
Project ABC XYZ 3.00 2.20 2.50 3.80 2.88
Project ABC XYZ 3.00 2.00 2.50 3.80 2.83
Project ABC XYZ 2.00 2.00 2.33 3.80 2.53
Project ABC XYZ 2.00 2.00 2.33 3.80 2.53
Project ABC XYZ 1.00 1.80 2.17 3.80 2.19
Project ABC XYZ 1.00 1.80 2.17 3.60 2.14
Project ABC XYZ 1.00 1.80 2.17 3.60 2.14
Project ABC XYZ 1.00 1.80 2.17 3.60 2.14
Project ABC XYZ 1.00 0.00 2.17 3.60 1.69
Project ABC XYZ 1.00 0.00 1.83 3.60 1.61
Project ABC XYZ 1.00 0.00 1.67 3.60 1.57
Project ABC XYZ 1.00 1.50 1.67 2.60 1.69

Construction Safety and Risk Control
33
Dashboard - Prototype
© 2016 Willis Towers Watson. All rights reserved. Proprietary and Confidential. For Willis Towers Watson and Willis Towers Watson client use only.

On-Site Risk Evaluation

Construction Safety and Risk Control Report to Leadership
35 © 2016 Willis Towers Watson. All rights reserved. Proprietary and Confidential. For Willis Towers Watson and Willis Towers Watson client use only.

Other Risk Rating Resources

BEST Underwriting Guides – Building GC’s

BEST Underwriter’s Checklist – Building GC’s These questions require on-site verification

BEST Underwriting Guides – Paving Contractors

BEST Underwriter’s Checklist – Paving Contractors
These questions require on-site verification

BEST Underwriting Guides – Electrical Contractor

BEST Underwriter’s Checklist – Electrical Contractor
These questions require on-site verification

Carrier #1 uses a 5-tiered evaluation for all accounts VERY GOOD, GOOD, ACCEPTABLE, MARGINAL OR POOR
Characteristics:
VERY GOOD – customer exhibits several best practice protocols in regards to risk management and safety compliance. Uses standards/regulations for only baseline measurements and overall employee body accepts safety as an integral part of their culture. Will have more than one person dedicated to safety. Losses are low due to positive actions and programs. Upper management uses safety as a measurement tool at all levels. GOOD – customer has one or two best practices in place and upper management has a rather good attitude towards safety. May or may not have a dedicated safety professional on staff. Losses are low and accountability is present.
Very Good Good Acceptable Marginal Poor

Carrier #1 uses a 5-tiered evaluation for all accounts
VERY GOOD, GOOD, ACCEPTABLE, MARGINAL OR POOR
Very Good Good Acceptable Marginal Poor
ACCEPTABLE – can also be used as SATISFACTORY. Customer has an overall good safety program. Accidents are adequately investigated and corrective actions are disseminated to the field. Losses can be high but trending down. MARGINAL – customer has adverse losses and control measures are not in place or have been recognized however not implemented. There is a disconnect between upper management and line staff where either the message is not relayed up to provide for capital or mid-level staff does not push safety down to the line staff at the direction of upper management. POOR – customer does not have a safety culture, has adverse losses and is not interested in addressing issues.

Carrier #2 uses an internal 5-tiered evaluation for all accounts A – B – C – D – F A or B rated risks are OK for the Underwriter to Pursue C - rated risks will have one or two important recommendations attached to it. UW may still pursue it; however will want additional information regarding Risk’s intent to comply with the recs. D - rated risks are not pursued by UW; however will note the several “important” recommendations that are attached to it and ask that Risk Control follow-up the next policy year to determine if the recs have been implemented (assuming Travelers is being asked to quote on it the next year). F - rated risks are an account that barks, & in the Risk Control Consultant’s opinion, will likely remain as a dog due to the lack of management support.

Carrier #3 uses an internal 5-tiered evaluation for all accounts
1 – 2 – 3 – 4 – 5
5 – Best in class (Top 10%) 4 – Above average within their class 3 – Average within their class 2 – Below average within their class 1 – Worst in class (Bottom 10%)

Carrier #4 uses an internal 3-tiered evaluation for large contractors
Preferred – ( The best ) Acceptable – ( the middle ) Unacceptable – ( the bottom )

Getting to next Level

What is the Doctors Diagnoses?
• Urinalysis
• Blood Work
• Blood Pressure • ENT look
• Stethoscope
• Weight
• Family history
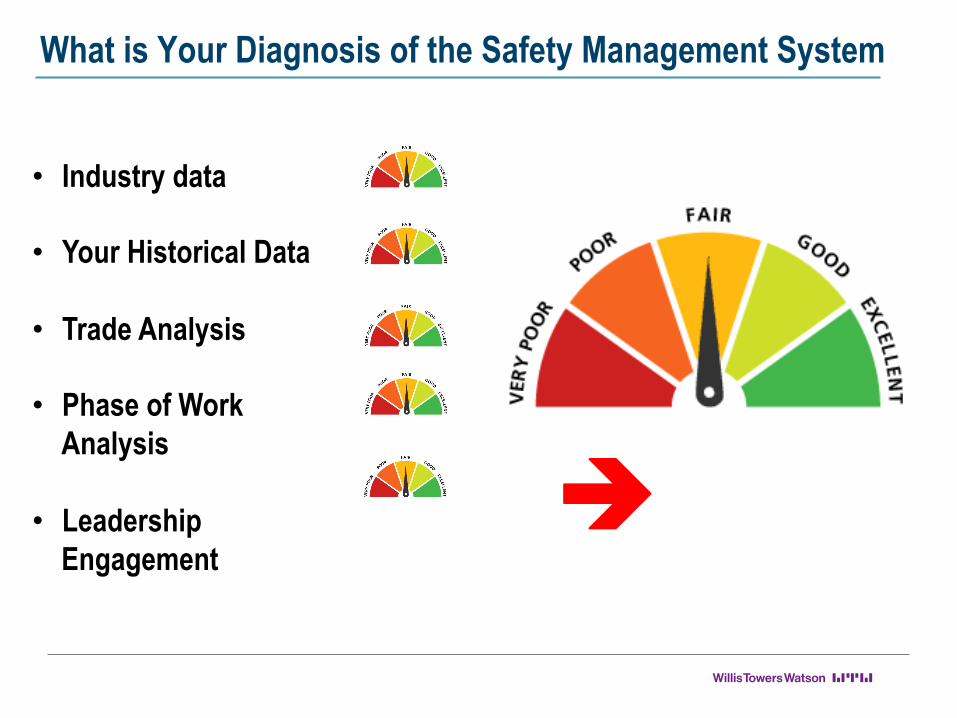
What is Your Diagnosis of the Safety Management System
• Industry data • Your Historical Data • Trade Analysis • Phase of Work
Analysis
• Leadership Engagement

Q&A

THANK YOU!
Mike Fredebeil, CSP Willis National Director Construction Safety
770.815.6006