Embed Size (px)
Citation preview
0 FUJITSU INTERNAL Copyright 2014 FUJITSU
shaping tomorrow with you 13th June 2014
Storage Performance Basics & Considerations
1 FUJITSU INTERNAL
Why this webcast?
Giving you the basics of storage performance calculation
Showing you the potential pitfall's
Enabling you to build configurations based on customer
requirements
Making you more competitive
Helping you to avoid customer escalations because of
performance problems
Copyright 2012 FUJITSU
2 FUJITSU INTERNAL
What this short Webcast is NOT about:
Its not a technical deep dive into performance tuning
Its not a technical training how to fix existing performance
problems
Its not a session to discuss performance related competitive
information
Its not a training how to use the Fujitsu tools to size and create
configurations (special Webcasts available)
We only take a look into the storage, not the infrastructure, not
in the host, into the network, the OS or the application
Copyright 2012 FUJITSU
3 FUJITSU INTERNAL
What this short Webcast IS about:
Basic understanding about storage performance
Understanding the pros and cons of different media and
raid levels
Basic understanding of AST and Thin Provisioning and
how it impacts performance
Giving general rules of thumb to create valid
configurations, based on customer requirements
Explanations are simplified to make it easier
Copyright 2012 FUJITSU
4 FUJITSU INTERNAL
Agenda
Topic
Media types and their characteristics
Raid Levels and their performance impact
Basic IO calculation and impact of cache
Thin Provisioning Basics and best practices
Automated Storage Tiering basic concept and considerations
5 FUJITSU INTERNAL
Media Types

6 FUJITSU INTERNAL
Base definitions
IOPs (random or sequential)
Input / Output operations per second
e.g. a read or a write
Block Size
Size of a single IO to or from the host
Measured in kB
Throughput
Amount of data going in or out of the storage
Measured in MB/s (IOs x block size= throughput)
Response time
Time it takes until the server gets the data or acknowledge from the storage

7 FUJITSU INTERNAL
SAS Drives
SED Self-Encrypting Drive
15,000 rpm, 12 Gbit/s
1,200 GB 900 GB
Non-encrypting drive
Self-encrypting drive (SED)
300 GB 600 GB 1,200 GB 900 GB
10,000 rpm, 12 Gbit/s
2.5" SAS drive
300 GB 600 GB*
~200 random IOs per 15k drive
~175 random IOs per 10k drive
Performance is the same regardless
of drive size
No performance degradation of
SEDs
8 FUJITSU INTERNAL
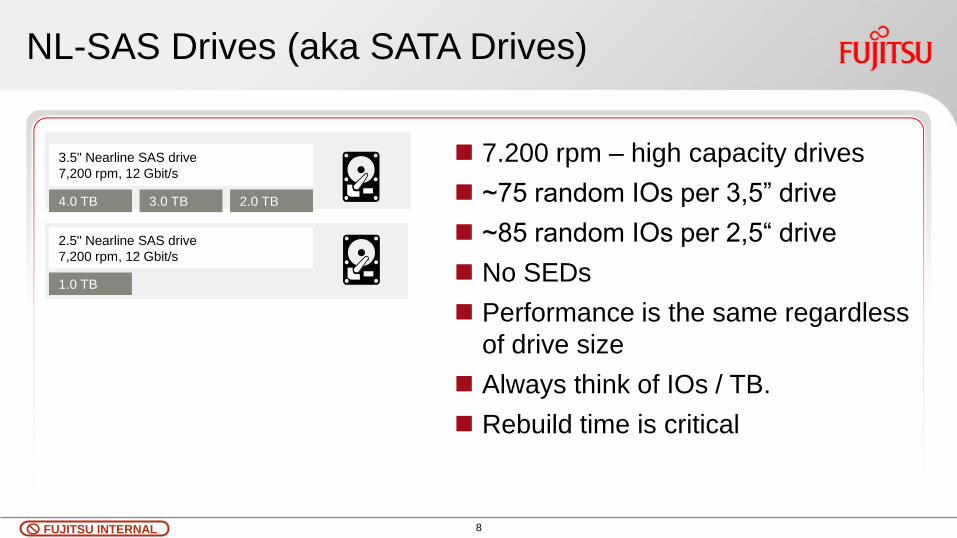
NL-SAS Drives (aka SATA Drives)
2.5" Nearline SAS drive
7,200 rpm, 12 Gbit/s
1.0 TB
3.5" Nearline SAS drive
7,200 rpm, 12 Gbit/s
2.0 TB 3.0 TB 4.0 TB
7.200 rpm – high capacity drives
~75 random IOs per 3,5” drive
~85 random IOs per 2,5“ drive
No SEDs
Performance is the same regardless
of drive size
Always think of IOs / TB.
Rebuild time is critical
9 FUJITSU INTERNAL
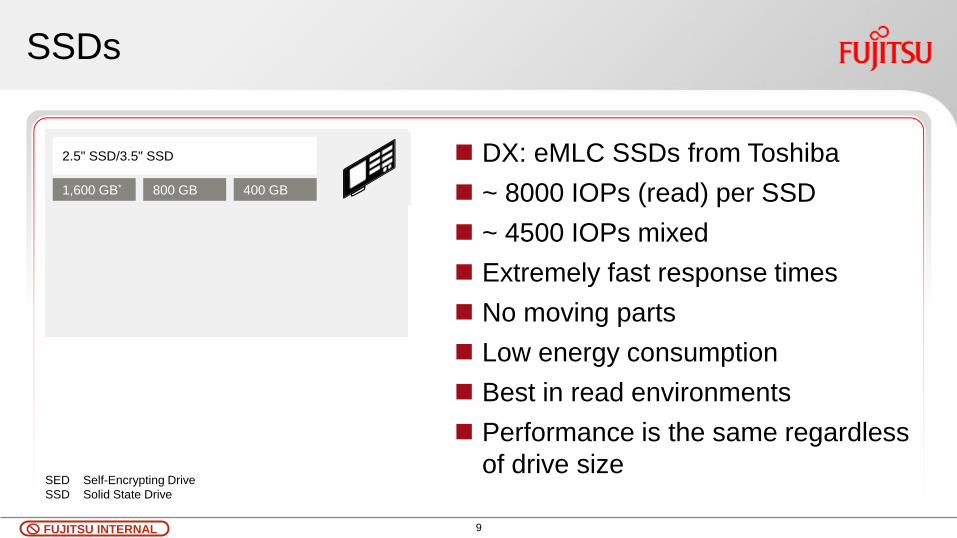
SSDs
SED Self-Encrypting Drive
SSD Solid State Drive
2.5" SSD/3.5" SSD
400 GB 800 GB 1,600 GB*
DX: eMLC SSDs from Toshiba
~ 8000 IOPs (read) per SSD
~ 4500 IOPs mixed
Extremely fast response times
No moving parts
Low energy consumption
Best in read environments
Performance is the same regardless
of drive size

10 FUJITSU INTERNAL
Key take away for storage media types
More drives = better performance
For best €/TB use NL-SAS
For best €/IO use SSDs
NL-SAS are below 50% of what SAS drives can do
NL-SAS are not as reliable SAS drives are
NL-SAS drives requiring longer rebuild times
IO/TB is a key indicator
Copyright 2012 FUJITSU

11 FUJITSU INTERNAL
Raid Levels
12 FUJITSU INTERNAL
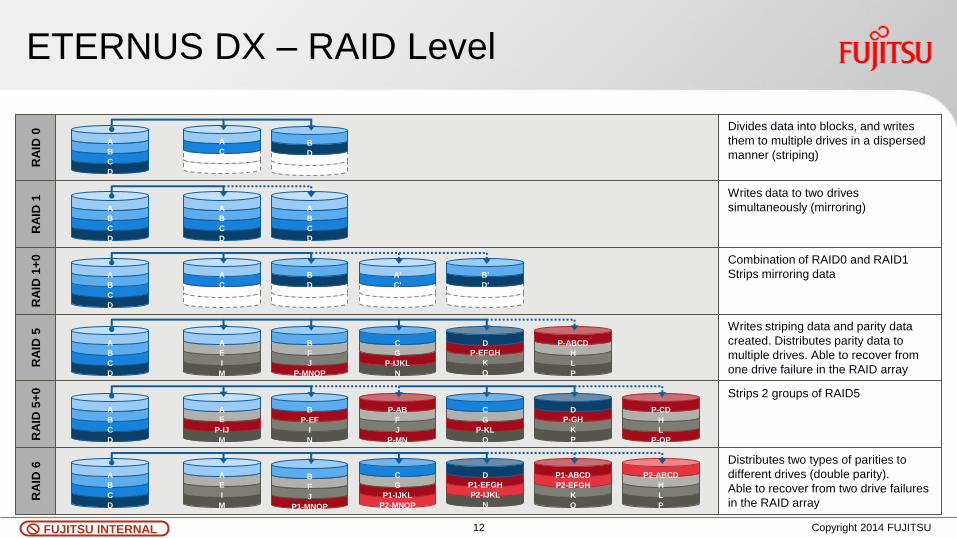
ETERNUS DX – RAID Level
Copyright 2014 FUJITSU
D
C
B
A
C
A
D
B
D
C
B
A
D
C
B
A
D
C
B
A
D
C
B
A
C
A
D
B
C'
A'
D'
B'
D
C
B
A
O
K
P-EFGH
D
M
I
E
A
P-MNOP
J
F
B
N
P-IJKL
G
C
P
L
H
P-ABCD
D
C
B
A
P
K
P-GH
D
M
P-IJ
E
A
N
I
P-EF
B
O
P-KL
G
C
P-OP
L
H
P-CD
P-MN
J
F
P-AB
D
C
B
A
N
P2-IJKL
P1-EFGH
D
M
I
E
A
P1-MNOP
J
F
B
P2-MNOP
P1-IJKL
G
C
O
K
P2-EFGH
P1-ABCD
P
L
H
P2-ABCD
RA
ID 0
R
AID
1
RA
ID 1
+0
R
AID
5
RA
ID 5
+0
R
AID
6
Divides data into blocks, and writes
them to multiple drives in a dispersed
manner (striping)
Writes data to two drives
simultaneously (mirroring)
Combination of RAID0 and RAID1
Strips mirroring data
Writes striping data and parity data
created. Distributes parity data to
multiple drives. Able to recover from
one drive failure in the RAID array
Strips 2 groups of RAID5
Distributes two types of parities to
different drives (double parity).
Able to recover from two drive failures
in the RAID array
13 FUJITSU INTERNAL
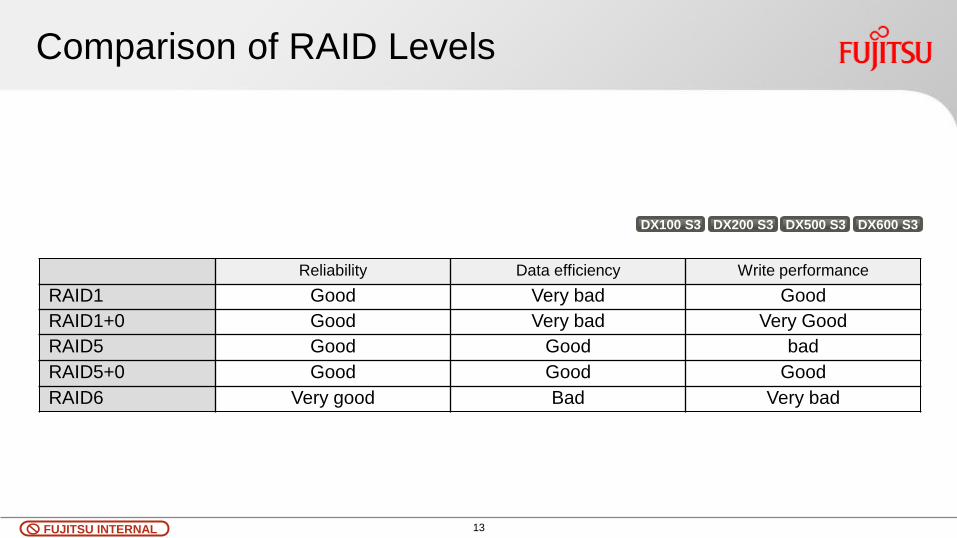
Comparison of RAID Levels
Reliability Data efficiency Write performance
RAID1 Good Very bad Good
RAID1+0 Good Very bad Very Good
RAID5 Good Good bad
RAID5+0 Good Good Good
RAID6 Very good Bad Very bad
DX200 S3 DX100 S3 DX600 S3 DX500 S3
14 FUJITSU INTERNAL
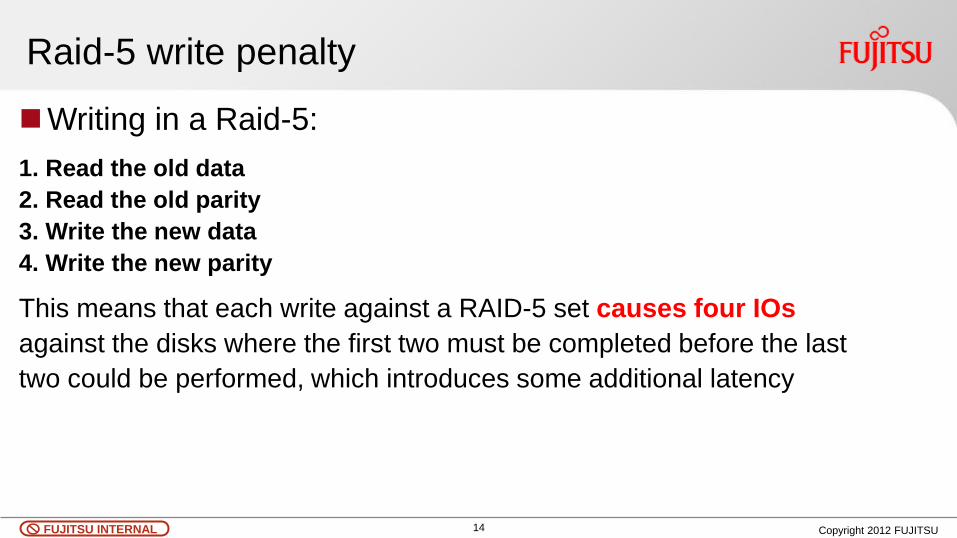
Raid-5 write penalty
Writing in a Raid-5:
1. Read the old data
2. Read the old parity
3. Write the new data
4. Write the new parity
This means that each write against a RAID-5 set causes four IOs
against the disks where the first two must be completed before the last
two could be performed, which introduces some additional latency
Copyright 2012 FUJITSU
15 FUJITSU INTERNAL
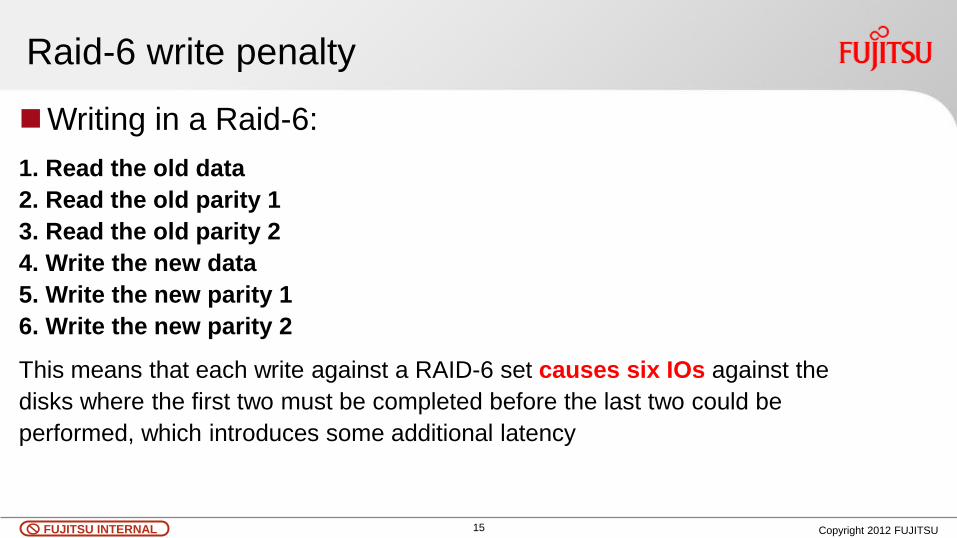
Raid-6 write penalty
Writing in a Raid-6:
1. Read the old data
2. Read the old parity 1
3. Read the old parity 2
4. Write the new data
5. Write the new parity 1
6. Write the new parity 2
This means that each write against a RAID-6 set causes six IOs against the
disks where the first two must be completed before the last two could be
performed, which introduces some additional latency
Copyright 2012 FUJITSU
16 FUJITSU INTERNAL
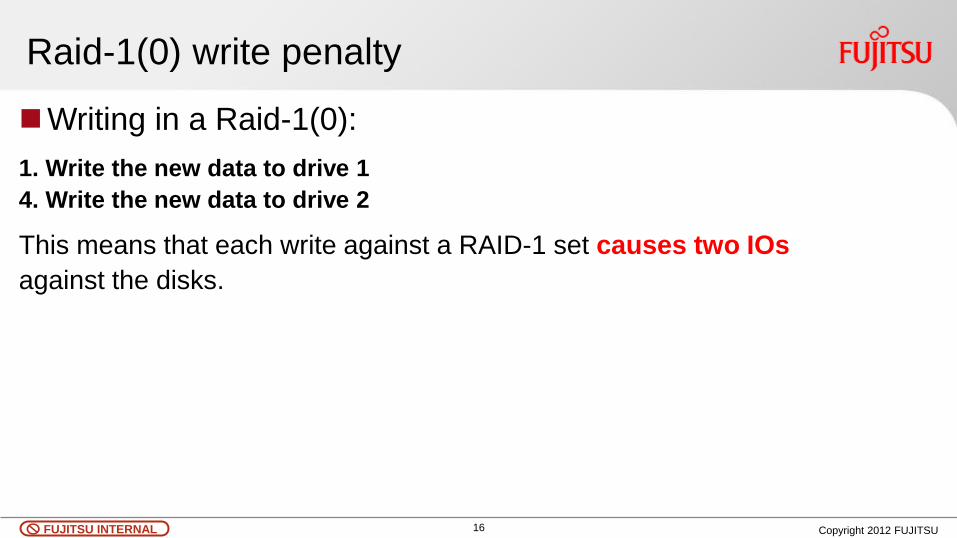
Raid-1(0) write penalty
Writing in a Raid-1(0):
1. Write the new data to drive 1
4. Write the new data to drive 2
This means that each write against a RAID-1 set causes two IOs
against the disks.
Copyright 2012 FUJITSU
17 FUJITSU INTERNAL
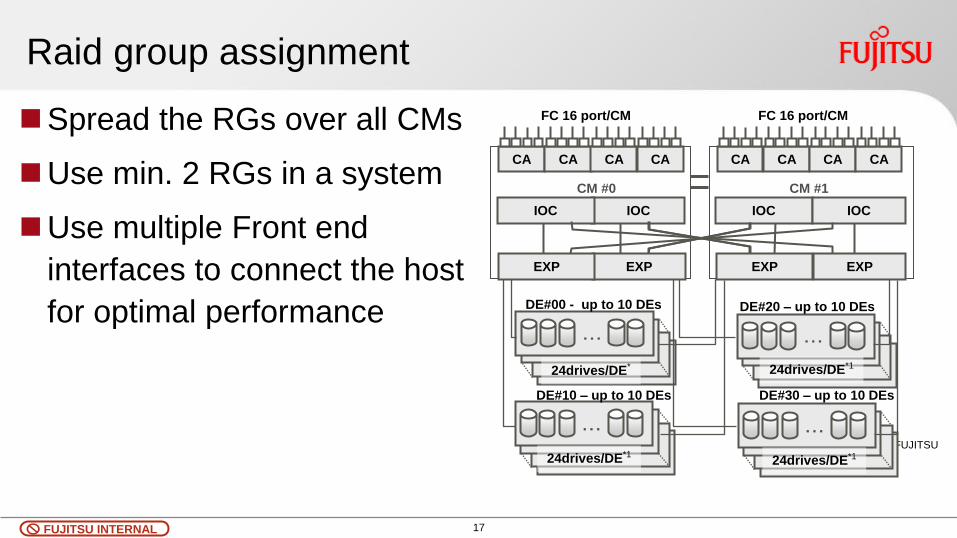
Raid group assignment
Spread the RGs over all CMs
Use min. 2 RGs in a system
Use multiple Front end
interfaces to connect the host
for optimal performance
Copyright 2012 FUJITSU
Copyright 2011 FUJITSU
CA CA CA CA
IOC
EXP
IOC
EXP
CA CA CA CA
IOC
EXP
IOC
EXP
・・・
・・・
・・・
・・・
DE#00 - up to 10 DEs
DE#10 – up to 10 DEs
DE#20 – up to 10 DEs
DE#30 – up to 10 DEs
FC 16 port/CM FC 16 port/CM
CM #0 CM #1
24drives/DE*
24drives/DE*1
24drives/DE*1
24drives/DE*1
18 FUJITSU INTERNAL
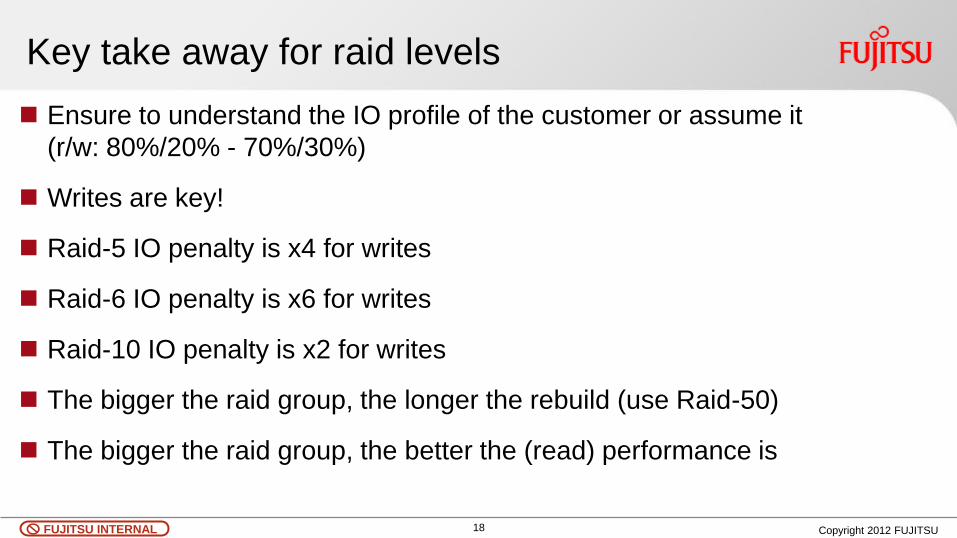
Key take away for raid levels
Ensure to understand the IO profile of the customer or assume it
(r/w: 80%/20% - 70%/30%)
Writes are key!
Raid-5 IO penalty is x4 for writes
Raid-6 IO penalty is x6 for writes
Raid-10 IO penalty is x2 for writes
The bigger the raid group, the longer the rebuild (use Raid-50)
The bigger the raid group, the better the (read) performance is
Copyright 2012 FUJITSU
19 FUJITSU INTERNAL
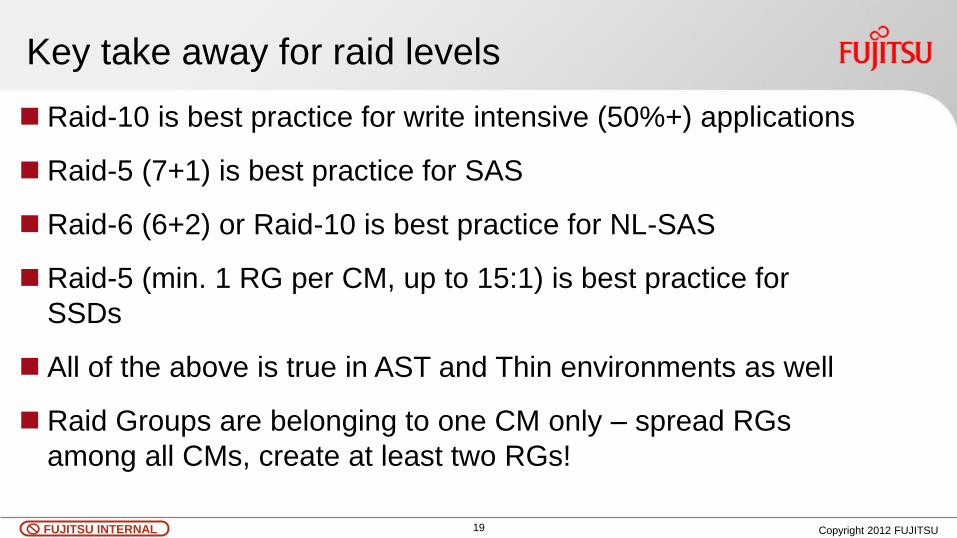
Key take away for raid levels
Raid-10 is best practice for write intensive (50%+) applications
Raid-5 (7+1) is best practice for SAS
Raid-6 (6+2) or Raid-10 is best practice for NL-SAS
Raid-5 (min. 1 RG per CM, up to 15:1) is best practice for
SSDs
All of the above is true in AST and Thin environments as well
Raid Groups are belonging to one CM only – spread RGs
among all CMs, create at least two RGs!
Copyright 2012 FUJITSU

20 FUJITSU INTERNAL
Basic IO Calculation
21 FUJITSU INTERNAL
Customers requirements:
# of TB
# of IOs
# of MB/s
Required response time in ms
Write portion?
Block size?
Peak or average?
Copyright 2012 FUJITSU

22 FUJITSU INTERNAL
Example 1:
Customer asks for 40 TB of storage
Solution 1:
ETERNUS DX 100 with 32 x 2TB NL-SAS
2.400 IOs – LP 51k€ - 60 IOs/TB
Solution 2:
ETERNUS DX 100 with 88 x 600 GB 10k
15.400 IOs – LP 72k€ - 385 IOs/TB
Copyright 2012 FUJITSU
23 FUJITSU INTERNAL
Example 2:
Customer asks for 40 TB and 20.000 IOs
Assume a read / write ratio of 70% to 30% (or 80% to
20%), or ask
Assume a block size of 4-16k, or ask
How to calculate:
Copyright 2012 FUJITSU
24 FUJITSU INTERNAL
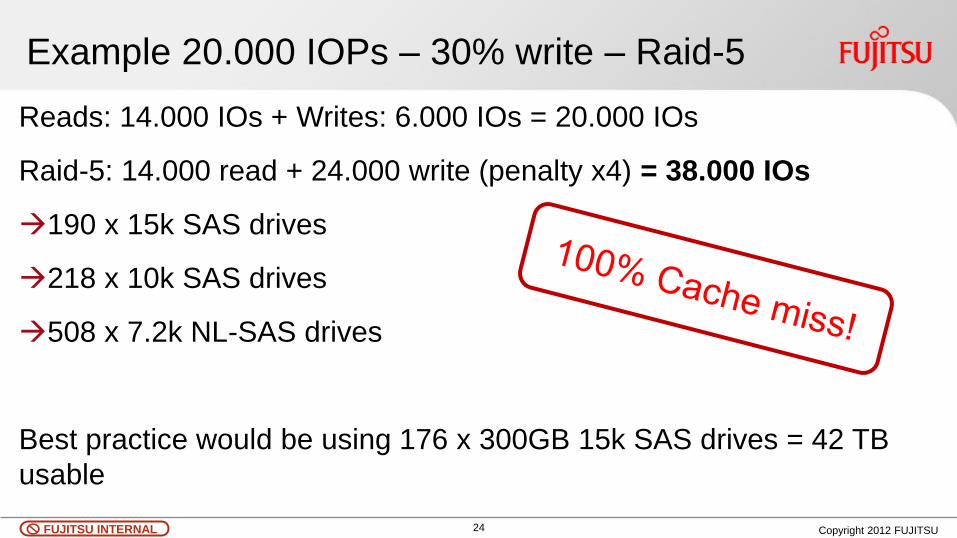
Example 20.000 IOPs – 30% write – Raid-5
Reads: 14.000 IOs + Writes: 6.000 IOs = 20.000 IOs
Raid-5: 14.000 read + 24.000 write (penalty x4) = 38.000 IOs
190 x 15k SAS drives
218 x 10k SAS drives
508 x 7.2k NL-SAS drives
Best practice would be using 176 x 300GB 15k SAS drives = 42 TB
usable
Copyright 2012 FUJITSU
25 FUJITSU INTERNAL
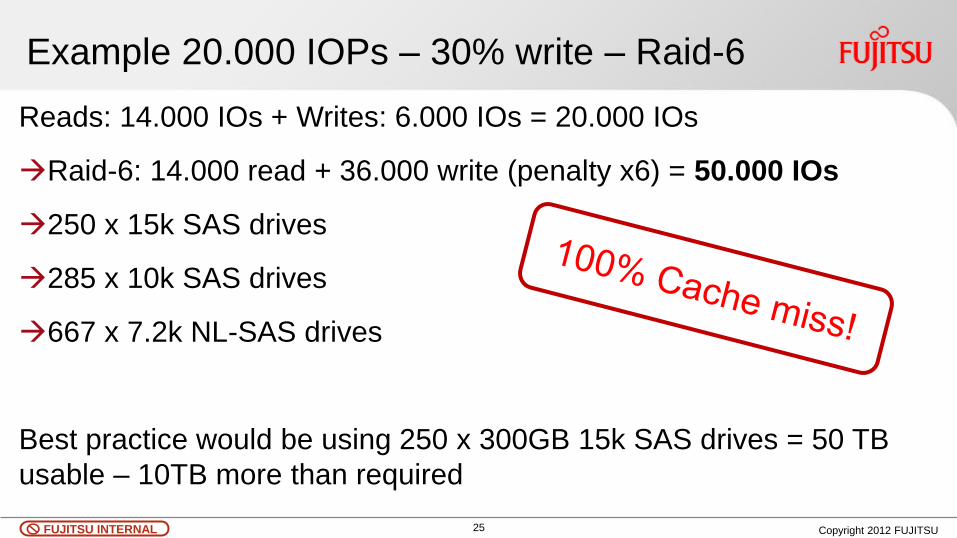
Example 20.000 IOPs – 30% write – Raid-6
Reads: 14.000 IOs + Writes: 6.000 IOs = 20.000 IOs
Raid-6: 14.000 read + 36.000 write (penalty x6) = 50.000 IOs
250 x 15k SAS drives
285 x 10k SAS drives
667 x 7.2k NL-SAS drives
Best practice would be using 250 x 300GB 15k SAS drives = 50 TB
usable – 10TB more than required
Copyright 2012 FUJITSU
26 FUJITSU INTERNAL
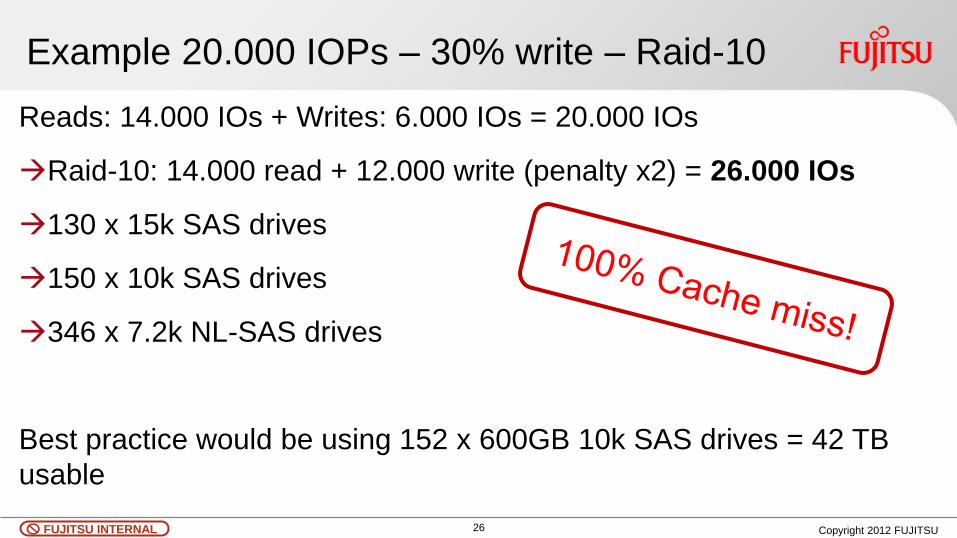
Example 20.000 IOPs – 30% write – Raid-10
Reads: 14.000 IOs + Writes: 6.000 IOs = 20.000 IOs
Raid-10: 14.000 read + 12.000 write (penalty x2) = 26.000 IOs
130 x 15k SAS drives
150 x 10k SAS drives
346 x 7.2k NL-SAS drives
Best practice would be using 152 x 600GB 10k SAS drives = 42 TB
usable
Copyright 2012 FUJITSU
27 FUJITSU INTERNAL
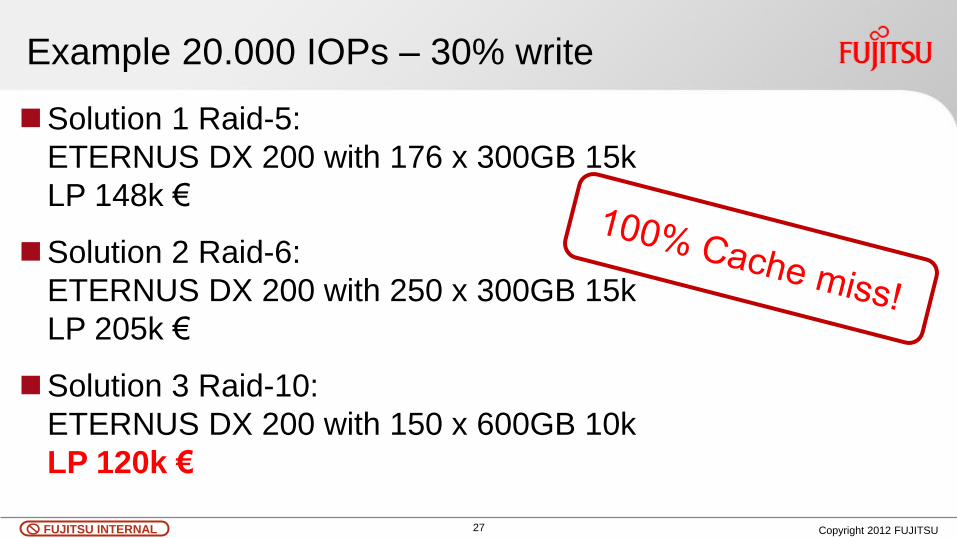
Example 20.000 IOPs – 30% write
Solution 1 Raid-5:
ETERNUS DX 200 with 176 x 300GB 15k
LP 148k €
Solution 2 Raid-6:
ETERNUS DX 200 with 250 x 300GB 15k
LP 205k €
Solution 3 Raid-10:
ETERNUS DX 200 with 150 x 600GB 10k
LP 120k €
Copyright 2012 FUJITSU
28 FUJITSU INTERNAL
Impact of Cache
29 FUJITSU INTERNAL
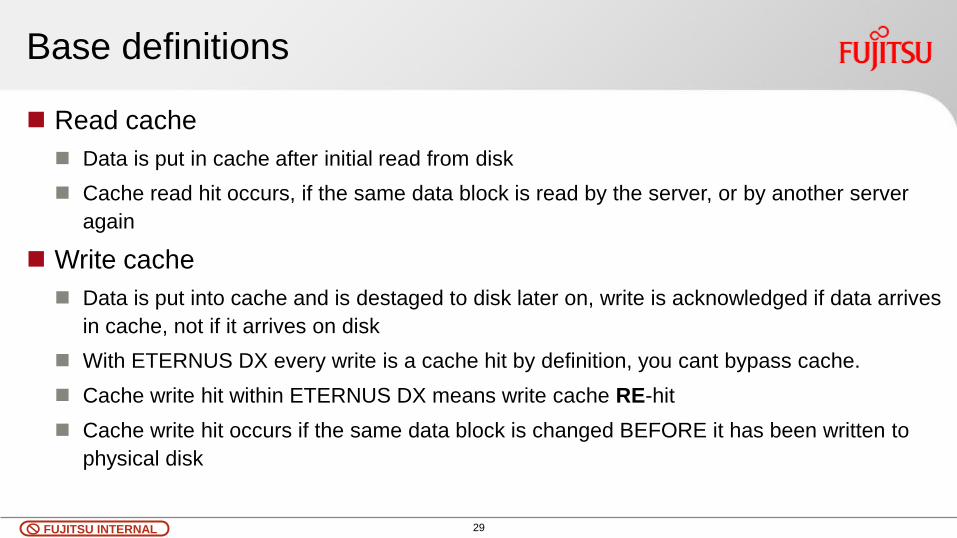
Base definitions
Read cache
Data is put in cache after initial read from disk
Cache read hit occurs, if the same data block is read by the server, or by another server
again
Write cache
Data is put into cache and is destaged to disk later on, write is acknowledged if data arrives
in cache, not if it arrives on disk
With ETERNUS DX every write is a cache hit by definition, you cant bypass cache.
Cache write hit within ETERNUS DX means write cache RE-hit
Cache write hit occurs if the same data block is changed BEFORE it has been written to
physical disk
30 FUJITSU INTERNAL
Key take away for Cache impact
Cache effectiveness is very application specific, but from
a „box“ level you can use averages.
The more cache, the better the performance is
Adjusting cache hit parameters is influencing the
configuration calculation heavily
In general ETERNUS DX is providing a big amount of
cache, self tuning for reads and writes, with a very
effective cache algorithm, allowing higher cache hit rates.
Copyright 2012 FUJITSU
31 FUJITSU INTERNAL
Key take away for Cache impact
Read Cache hit rate should be assumed from 30%-75%
depending on system, cache size and application
Write Re-hit Cache rate should be assumed from 10%-
25% depending on system, cache size and application
Physical (read)Cache be enhanced up to 5,6 TB of Flash
with PCIe based Extreme Cache option (DX500 &
DX600)
Copyright 2012 FUJITSU
32 FUJITSU INTERNAL
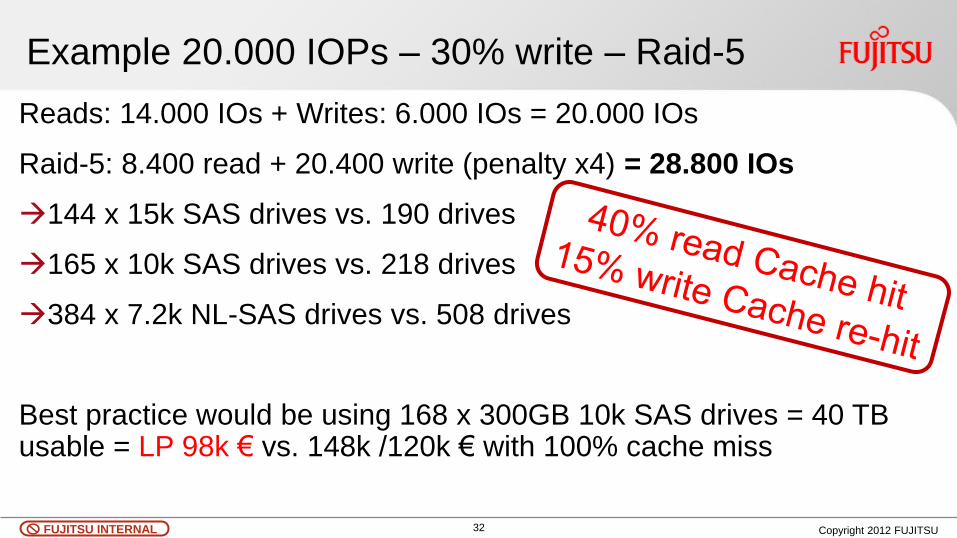
Example 20.000 IOPs – 30% write – Raid-5
Reads: 14.000 IOs + Writes: 6.000 IOs = 20.000 IOs
Raid-5: 8.400 read + 20.400 write (penalty x4) = 28.800 IOs
144 x 15k SAS drives vs. 190 drives
165 x 10k SAS drives vs. 218 drives
384 x 7.2k NL-SAS drives vs. 508 drives
Best practice would be using 168 x 300GB 10k SAS drives = 40 TB usable = LP 98k € vs. 148k /120k € with 100% cache miss
Copyright 2012 FUJITSU
33 FUJITSU INTERNAL
Data mirroring
34 FUJITSU INTERNAL
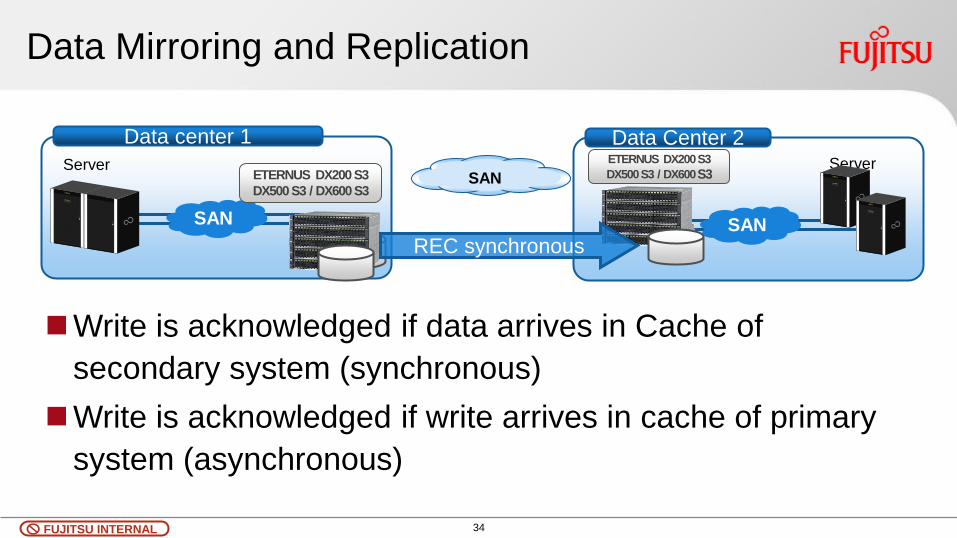
Data Mirroring and Replication
Data center 1 Data Center 2
Server Server SAN
SAN SAN
ETERNUS DX200 S3
DX500 S3 / DX600 S3
ETERNUS DX200 S3
DX500 S3 / DX600 S3
REC synchronous
Write is acknowledged if data arrives in Cache of
secondary system (synchronous)
Write is acknowledged if write arrives in cache of primary
system (asynchronous)
35 FUJITSU INTERNAL
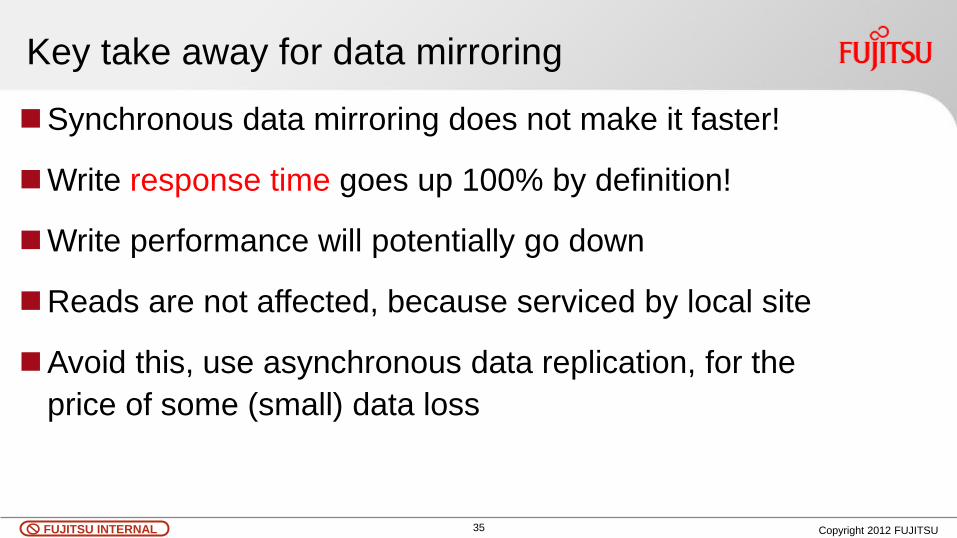
Key take away for data mirroring
Synchronous data mirroring does not make it faster!
Write response time goes up 100% by definition!
Write performance will potentially go down
Reads are not affected, because serviced by local site
Avoid this, use asynchronous data replication, for the
price of some (small) data loss
Copyright 2012 FUJITSU
36 FUJITSU INTERNAL
Thin provisioning basics
37 FUJITSU INTERNAL
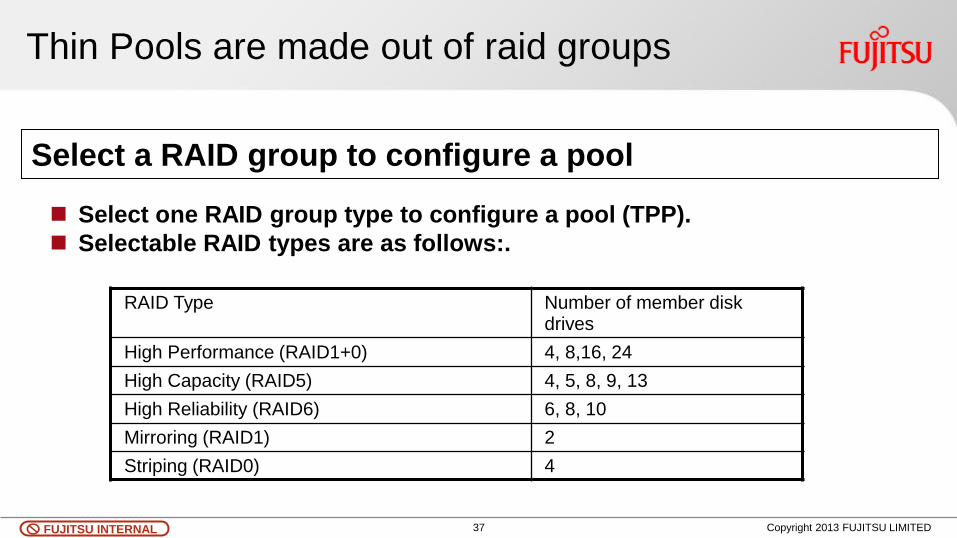
Thin Pools are made out of raid groups
Select one RAID group type to configure a pool (TPP).
Selectable RAID types are as follows:.
Select a RAID group to configure a pool
RAID Type Number of member disk drives
High Performance (RAID1+0) 4, 8,16, 24
High Capacity (RAID5) 4, 5, 8, 9, 13
High Reliability (RAID6) 6, 8, 10
Mirroring (RAID1) 2
Striping (RAID0) 4
Copyright 2013 FUJITSU LIMITED
38 FUJITSU INTERNAL
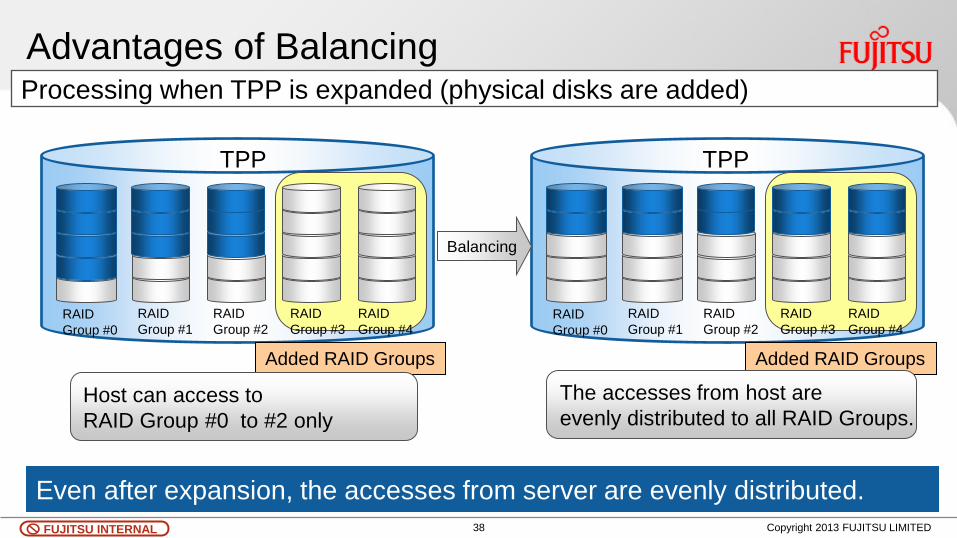
Advantages of Balancing
RAID
Group #0
RAID
Group #1
RAID
Group #2
TPP
RAID
Group #3
RAID
Group #4
Added RAID Groups
RAID
Group #0
RAID
Group #1
RAID
Group #2
TPP
RAID
Group #3
RAID
Group #4
Added RAID Groups
Balancing
Host can access to
RAID Group #0 to #2 only
The accesses from host are
evenly distributed to all RAID Groups.
Processing when TPP is expanded (physical disks are added)
Even after expansion, the accesses from server are evenly distributed.
Copyright 2013 FUJITSU LIMITED

39 FUJITSU INTERNAL
Key take away for Thin Provisioning
TP is spreading the data among all drives in the pool
The more raid groups in the pool the better the performance of
the pool is
Raid Level and geometry needs to be unique in the pool
Rebalancing ensures data is spread evenly in the pool after
capacity enhancement
Space reclamation is supported for various OS
TP is a free of charge feature of the ETERNUS DX S3
Copyright 2012 FUJITSU
40 FUJITSU INTERNAL
Automated storage Tiering considerations
41 FUJITSU INTERNAL
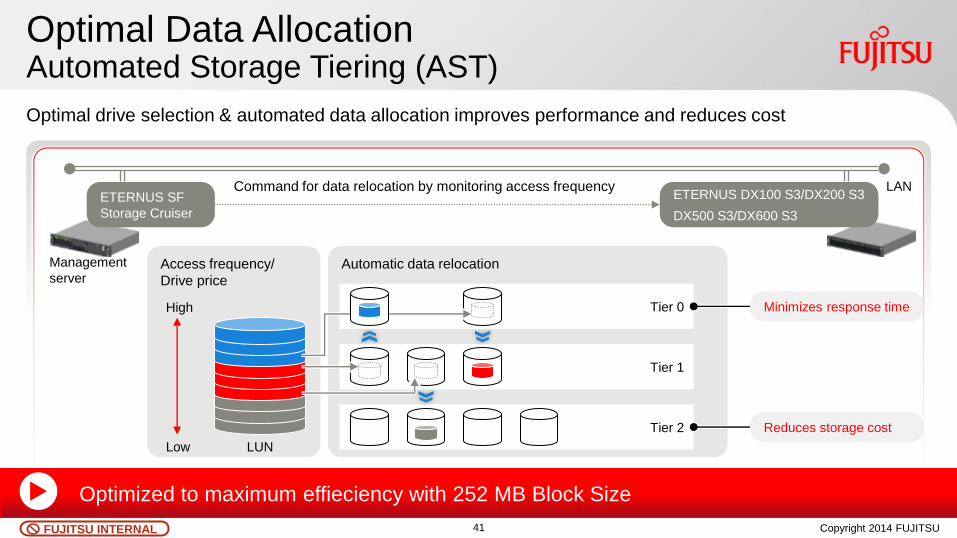
Optimal Data Allocation Automated Storage Tiering (AST)
Optimal drive selection & automated data allocation improves performance and reduces cost
Management
server
ETERNUS SF
Storage Cruiser
LAN Command for data relocation by monitoring access frequency ETERNUS DX100 S3/DX200 S3
DX500 S3/DX600 S3
Access frequency/
Drive price
High
Low LUN
Automatic data relocation
Tier 0 Minimizes response time
Tier 1
Tier 2 Reduces storage cost
Copyright 2014 FUJITSU
Optimized to maximum effieciency with 252 MB Block Size
Copyright 2014 FUJITSU

42 FUJITSU INTERNAL
Key take away for AST
NL-SAS issues are not going away with AST
Use media type and Raid level in the tiers according to
customer requirements
Use different AST pools for different SLAs and applications
In the classic 3-Tiers environments try to get to 15% / 50% /
35% mix instead of 5% / 15% / 80% mix
Copyright 2012 FUJITSU
43 FUJITSU INTERNAL
Key take away for AST
Flex Pools and Thin Pools are sharing the same
concepts, including rebalancing
You need to have a critical mass to use AST to get
enough drives in the different tiers.
Always calculate where your capacity is and where your
IOs are, balance it reasonable.
Don't forget restores and backup windows
Copyright 2012 FUJITSU
44 FUJITSU INTERNAL
Final take away
Understanding the IO profile is key
Writes are bad
Write penalties exists
More drives – more performance
2-Site Data mirroring does not make it faster
Cache Hits are extremely important
Copyright 2012 FUJITSU
45 FUJITSU INTERNAL
Questions & Feedback
Copyright 2011 FUJITSU
46 FUJITSU INTERNAL