Embed Size (px)
Citation preview
Stopwatch Graph Home
Behaviour of WavesLesson 1: Types of WavesLesson 2: Wave Speed
ReflectionLesson 3: Refraction
Total Internal ReflectionLesson 4: Refraction in WaterLesson 5: Refractive IndexLesson 6: Refraction in WaterLesson 7: Refractive IndexLesson 8: DiffractionLesson 9: Transmitting InformationLesson 10: Sound
Stopwatch Graph Home
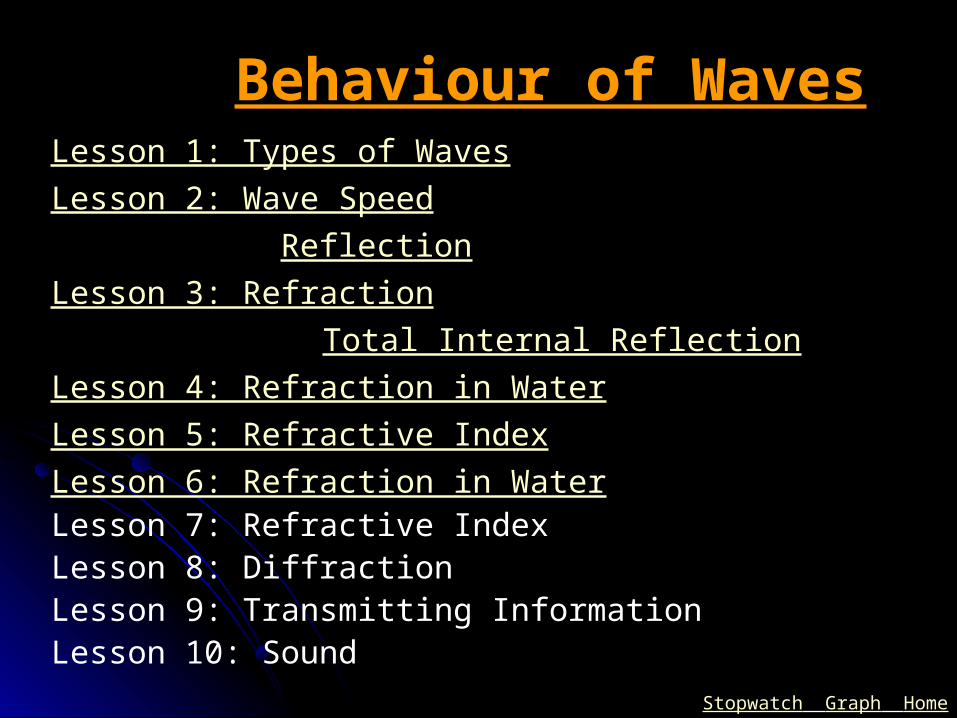
Syllabus Double AwardProperties of waves describe longitudinal and transverse waves in ropes, springs and water where appropriate state the meaning of amplitude, frequency, wavelength and period of a wave recall that waves transfer energy and information without transferring matter recall and use the relationship between the speed, frequency and wavelength of a wave:
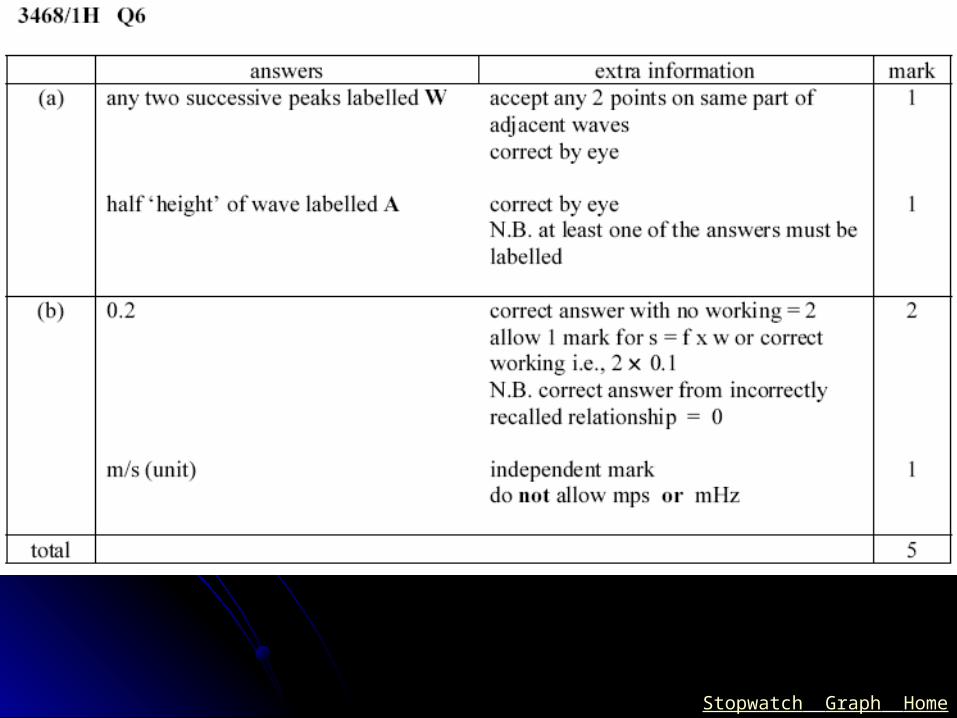
wave speed = frequency × wavelength v = f × λ
use the relationship between frequency and time period: frequency = 1 / time period f = 1 / T
use the above relationships in different contexts including sound waves and electromagnetic waves Light and sound recall that light waves are transverse waves which can be reflected and refracted recall that the angle of incidence equals the angle of reflection construct ray diagrams to illustrate the formation of a virtual image in a plane mirror describe experiments to investigate the refraction of light, using rectangular blocks, semicircular blocks and triangular prisms recall and use the relationship between refractive index, angle of incidence and angle of
refraction n = sin (i) / sin (r)
describe an experiment to determine the refractive index of glass, using a glass block describe the role of total internal reflection in transmitting information along optical fibres and in prisms recall and use the relationship between critical angle and refractive index
sin c = 1 / n recall that sound waves are longitudinal waves which can be reflected recall that the frequency range for human hearing is 20 Hz – 20 000 Hz describe how to measure the speed of sound in air by a simple direct method
Stopwatch Graph Home
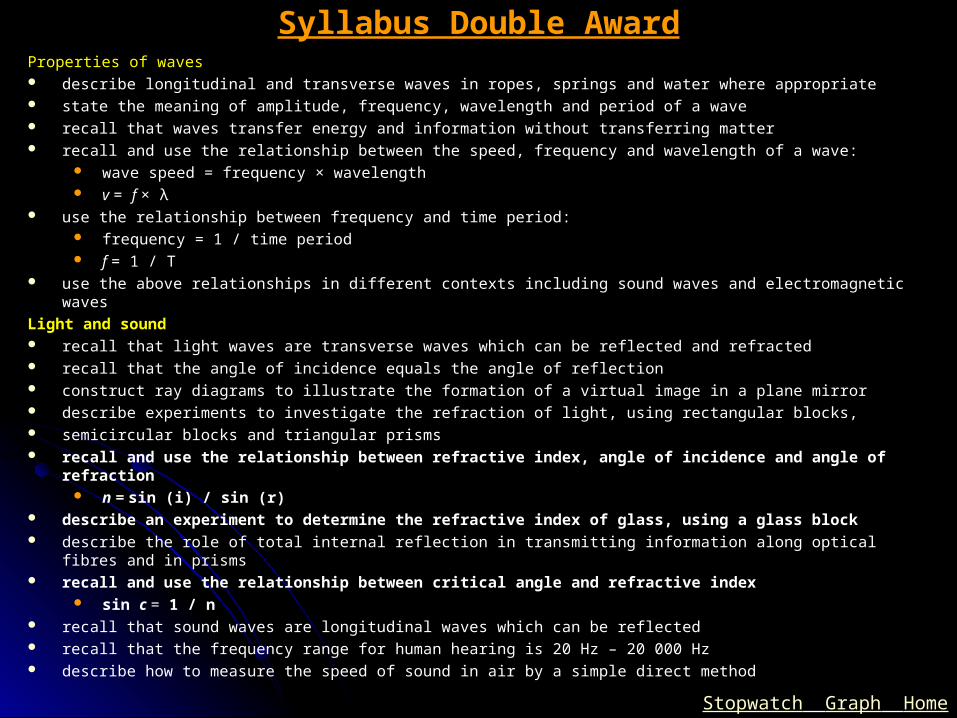
Syllabus Separate ScienceProperties of waves describe longitudinal and transverse waves in ropes, springs and water where appropriate state the meaning of amplitude, frequency, wavelength and period of a wave recall that waves transfer energy and information without transferring matter recall and use the relationship between the speed, frequency and wavelength of a wave:
wave speed = frequency × wavelength v = f × λ
use the relationship between frequency and time period: frequency = 1 / time period f = 1 / T
use the above relationships in different contexts including sound waves and electromagnetic waves understand that waves can be diffracted through gaps or when they pass an edge, and that the extent of diffraction depends on
the wavelength and the physical dimension of the gapLight and sound recall that light waves are transverse waves which can be reflected, refracted and diffracted recall that the angle of incidence equals the angle of reflection construct ray diagrams to illustrate the formation of a virtual image in a plane mirror describe experiments to investigate the refraction of light, using rectangular blocks, semicircular blocks and triangular prisms recall and use the relationship between refractive index, angle of incidence and angle of refraction
n = sin(i) / sin(r) describe an experiment to determine the refractive index of glass, using a glass block describe the role of total internal reflection in transmitting information along optical fibres and in prisms recall the meaning of critical angle c recall and use the relationship between critical angle and refractive index
sin c = 1 / n understand the difference between analogue and digital signals recall that sound waves are longitudinal waves which can be reflected, refracted and diffracted recall that the frequency range for human hearing is 20 Hz – 20 000 Hz describe how to measure the speed of sound in air by a simple direct method understand how an oscilloscope and microphone can be used to display a sound wave use an oscilloscope to determine the frequency of a sound wave and appreciate that the pitch of a sound depends on the
frequency of vibration appreciate that the pitch of a sound depends on the frequency of vibration of the source appreciate that the loudness of a sound depends on the amplitude of vibration

Stopwatch Graph Home
Types of Waves 04/19/23
Aims To define the properties of waves To identify the types of waves
Starter: True or False1) Sound travels faster than light2) Sound travels faster in solid objects than in liquids or
air3) Echoes are caused by sound waves bouncing of walls4) Sound waves are caused by the vibration of
molecules5) Sound travels faster at the top of Mt. Everest6) Light waves bounce off walls

Stopwatch Graph Home
A Wave Waves transfer energy from one place to
another The disturbance moves along the wave not
the particles

Stopwatch Graph Home
A wave in the sea: • disturbance is molecules of water going up and down• medium = water
Stopwatch Graph Home
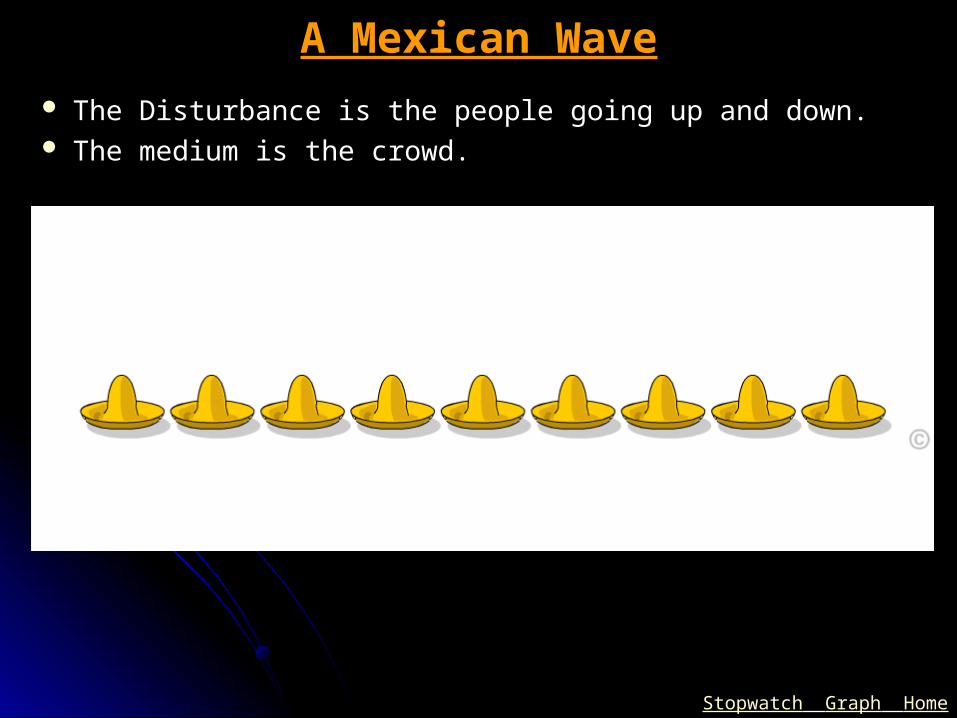
A Mexican Wave
The Disturbance is the people going up and down. The medium is the crowd.
Stopwatch Graph Home
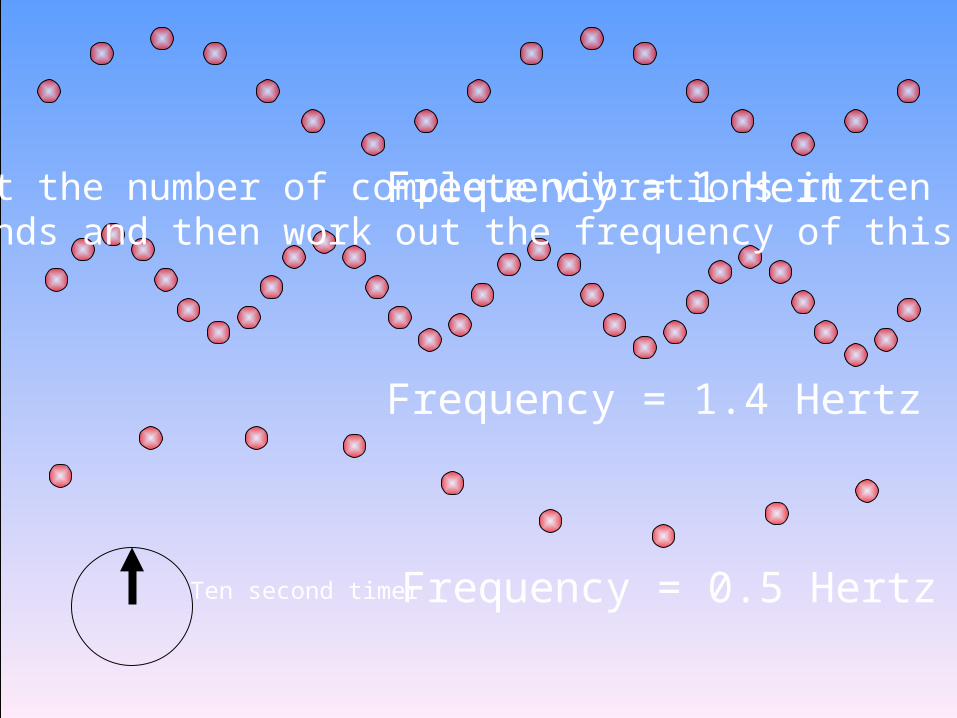
Frequency = 1 Hertz
Frequency = 1.4 Hertz
Frequency = 0.5 HertzTen second timer
Count the number of complete vibrations in ten seconds and then work out the frequency of this wave

Stopwatch Graph Home
Note that the waves are carrying energy from oneplace to another but the water particles are nottransferred.
previous next

Stopwatch Graph Home
Frequency Number of waves per second Either passing one point or generated Symbol: f Units: Hz (s-1)
Stopwatch Graph Home
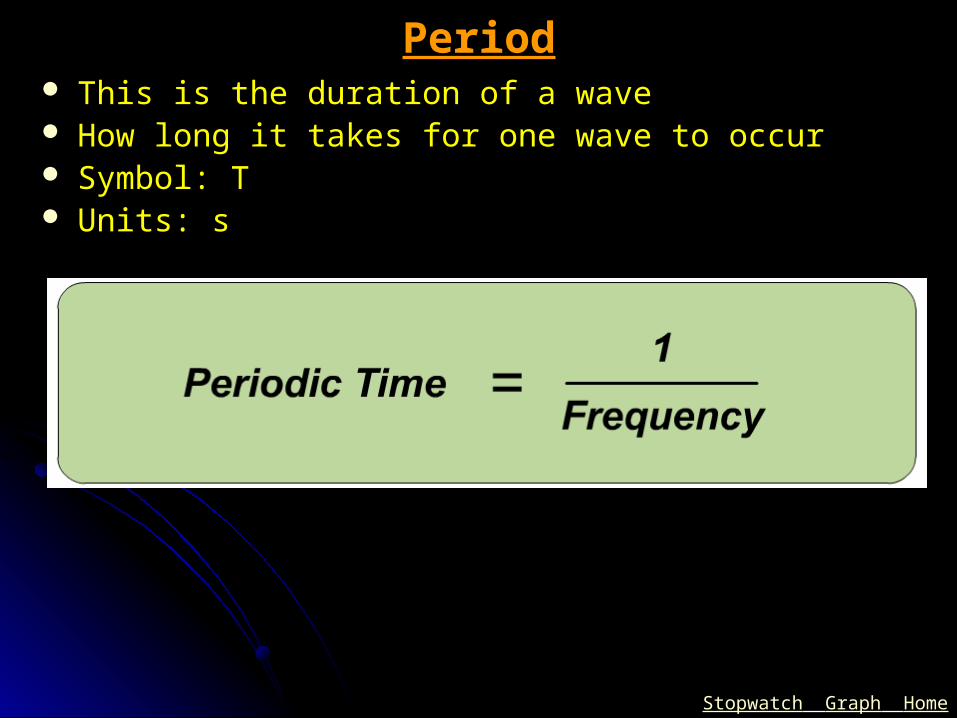
Period This is the duration of a wave How long it takes for one wave to occur Symbol: T Units: s

Stopwatch Graph Home
time Heart monitor
1 second
We often need to analyse waveforms produced by scientific instruments. For example:- A Cathode Ray Oscilloscope (CRO)is used to monitor heartbeats.
0.5seconds
Steady Steve
David Deadman
Helen Heart-attack
Stopwatch Graph Home
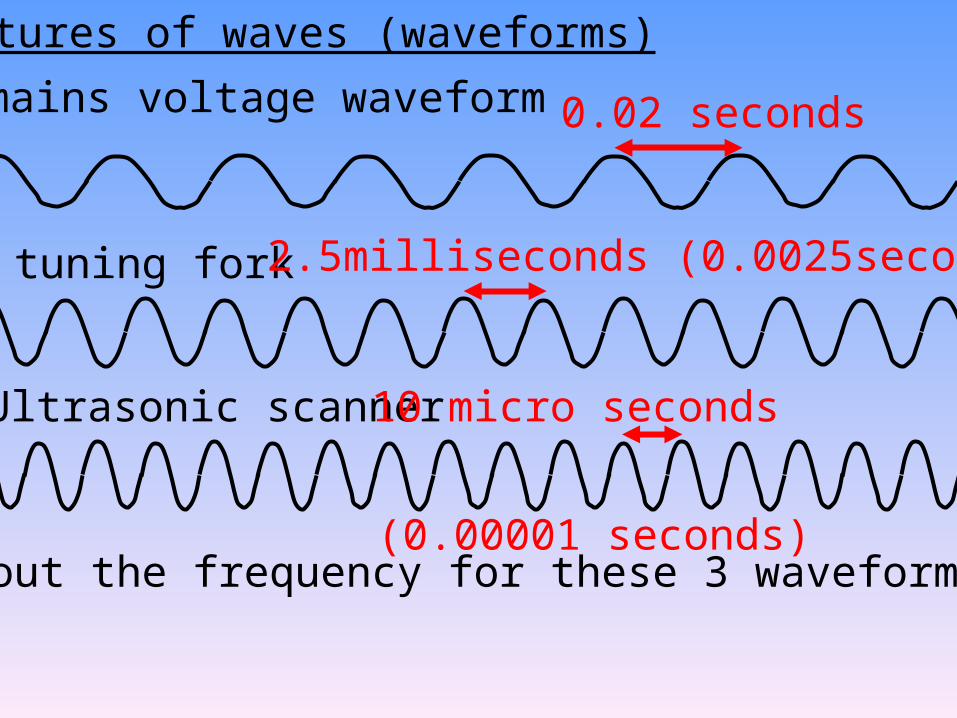
Pictures of waves (waveforms)
2 tuning fork
1 mains voltage waveform
3 Ultrasonic scanner
0.02 seconds
2.5milliseconds (0.0025seconds)
10 micro seconds
(0.00001 seconds)Work out the frequency for these 3 waveforms

Stopwatch Graph HomePictures of waves (waveforms)
Which animals made these sounds?
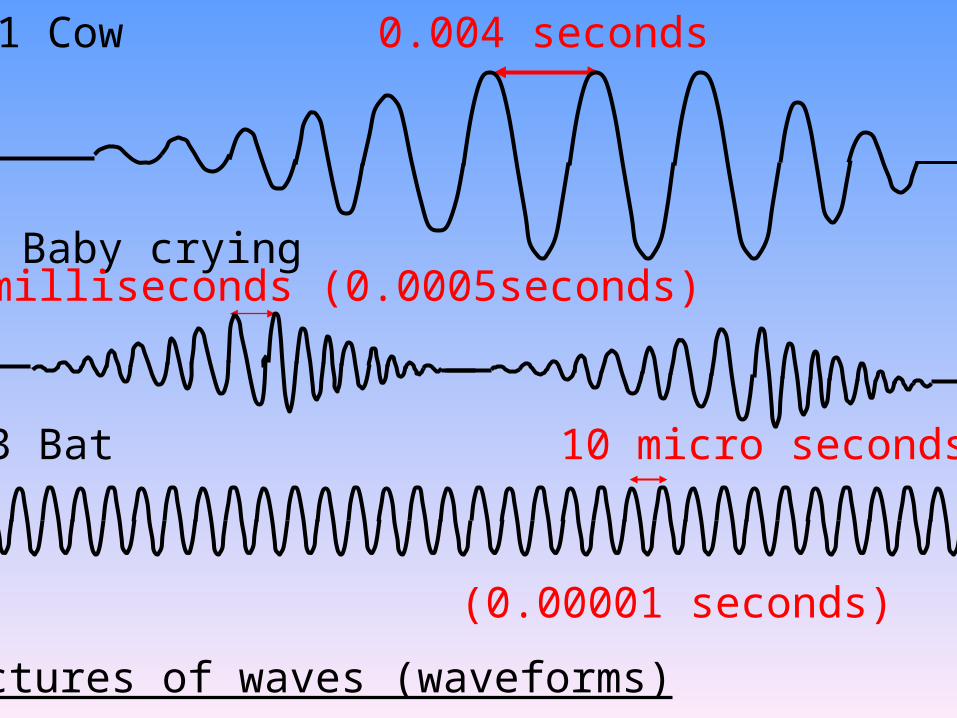
Stopwatch Graph HomePictures of waves (waveforms)
2 Baby crying
1 Cow
3 Bat
0.004 seconds
0.5milliseconds (0.0005seconds)
10 micro seconds
(0.00001 seconds)

Stopwatch Graph Home
Wavelength

Stopwatch Graph Home
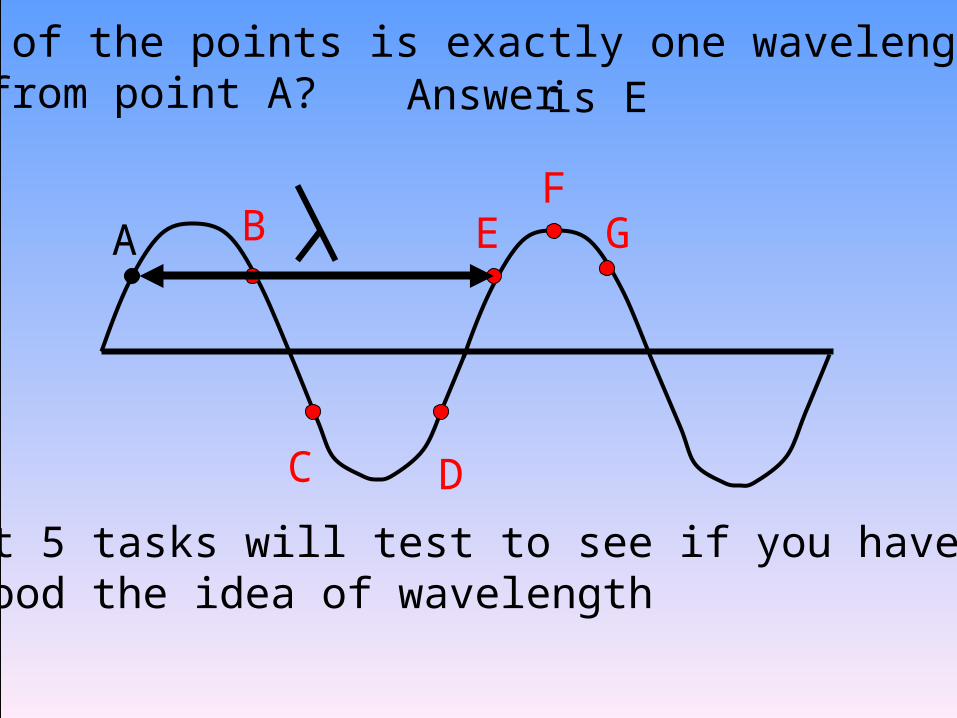
Wavelength The length of one complete wave peak to peak or trough to trough Symbol: λ Units: m
Stopwatch Graph Home
A B
C D
EF
G
Which of the points is exactly one wavelength away from point A? Answeris E
The next 5 tasks will test to see if you have understood the idea of wavelength

Stopwatch Graph Home
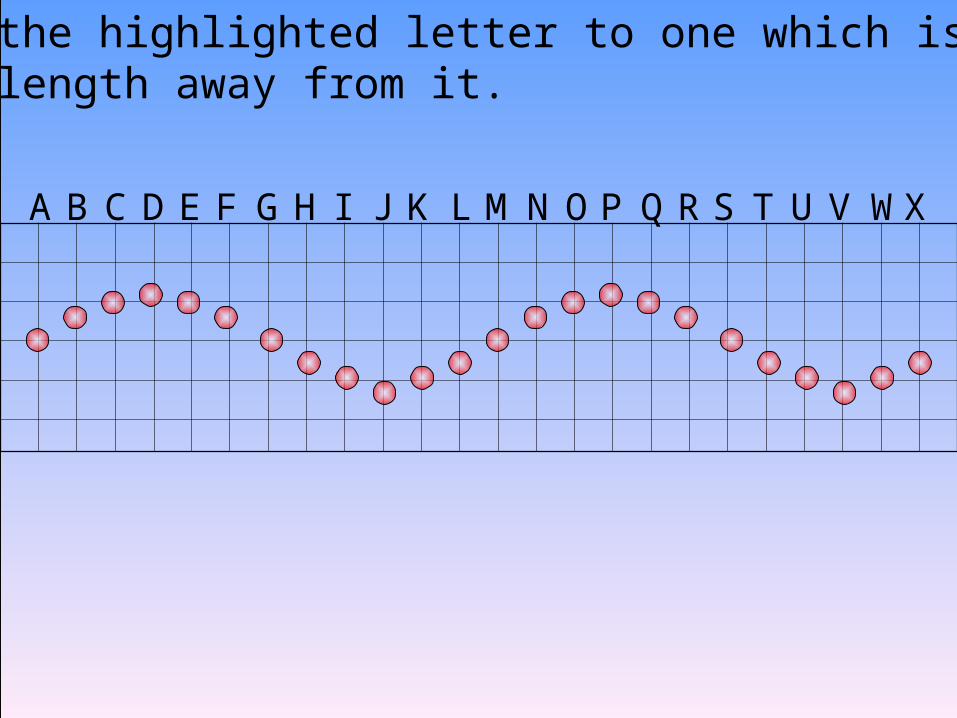
A B C D E F G H I J L M O P Q R S T U V WXK N
1 Match the highlighted letter to one which is exactly one wavelength away from it.

Stopwatch Graph Home
A B C D E F G H I J L M O P Q R S T U V WXK N
2 Match the highlighted letter to one which is exactly one wavelength away from it.

Stopwatch Graph Home
A B C D E F G H I J L M O P Q R S T U V WXK N
3 Match the highlighted letter to one which is exactly one wavelength away from it.
Stopwatch Graph Home
A B C D E F G H I J L M O P Q R S T U V WXK N
4 Match the highlighted letter to one which is exactly one wavelength away from it.

Stopwatch Graph Home
A B C D E F G H I J L M O P Q R S T U V WXK N
5 Match the highlighted letter to one which is exactly one wavelength away from it.
Stopwatch Graph Home
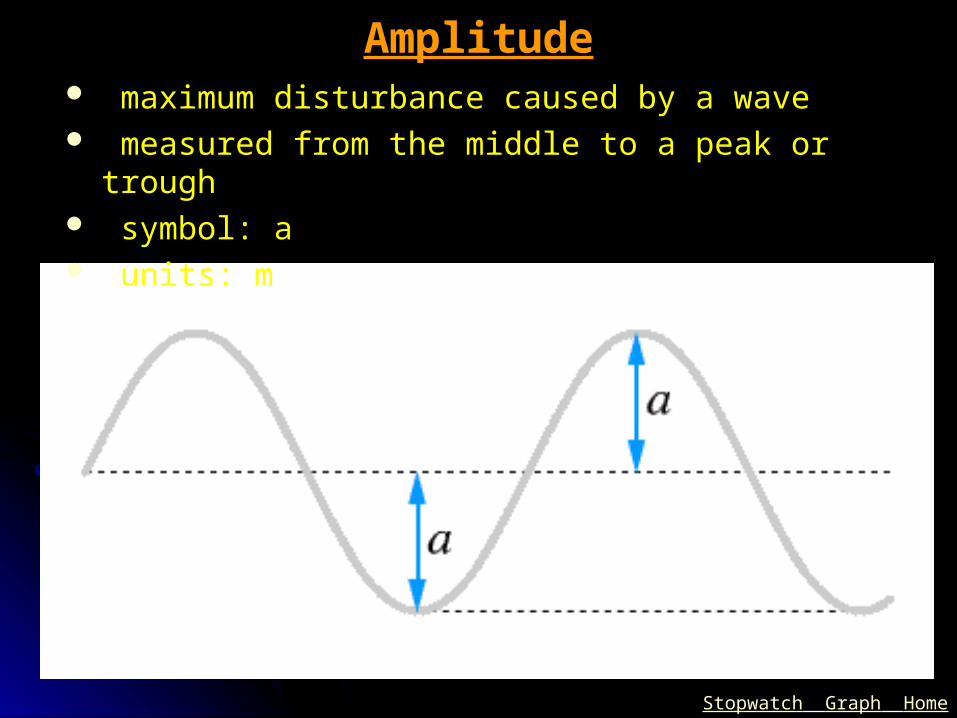
Amplitude maximum disturbance caused by a wave measured from the middle to a peak or trough symbol: a units: m
Stopwatch Graph Home
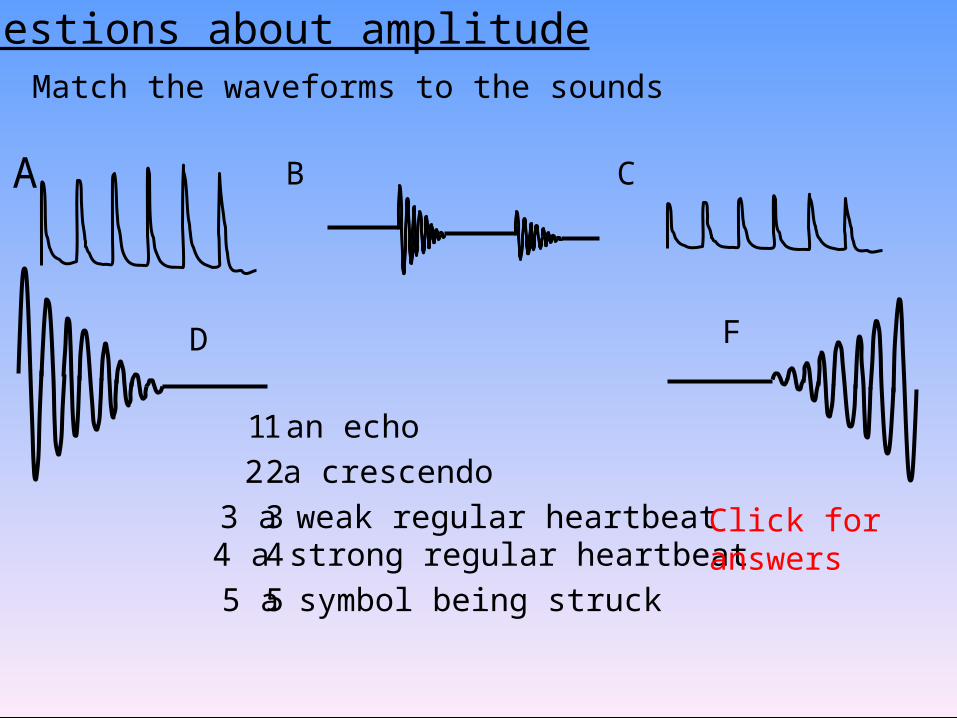
Questions about amplitudeMatch the waveforms to the sounds
A B C
D F
1 an echo2 a crescendo
4 a strong regular heartbeat3 a weak regular heartbeat
5 a symbol being struck
12345
Click foranswers
Stopwatch Graph Home
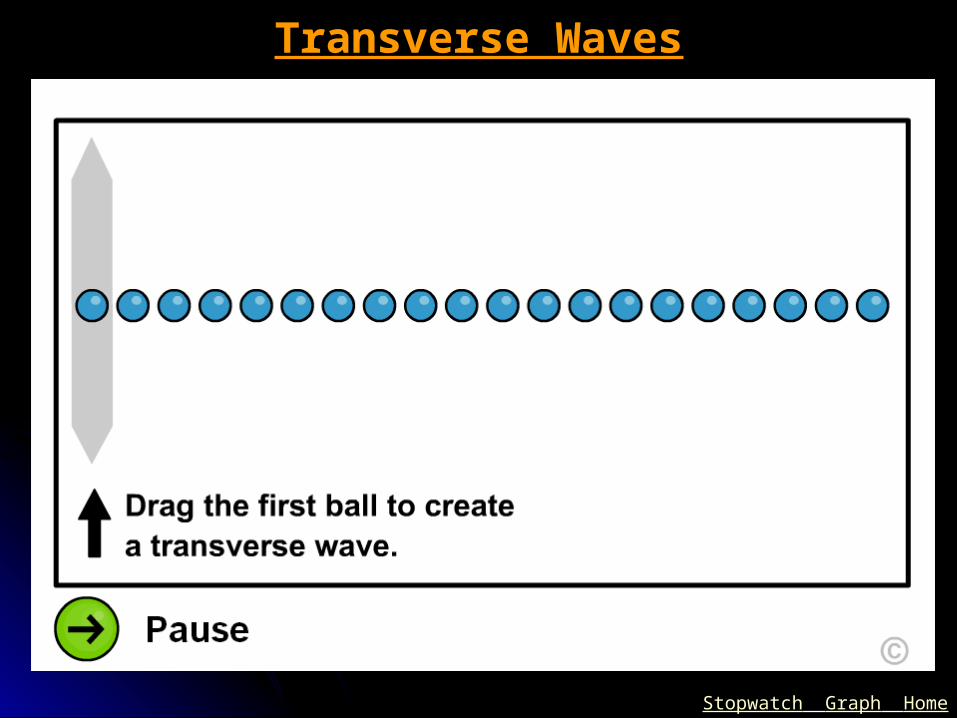
Transverse Waves
Stopwatch Graph Home
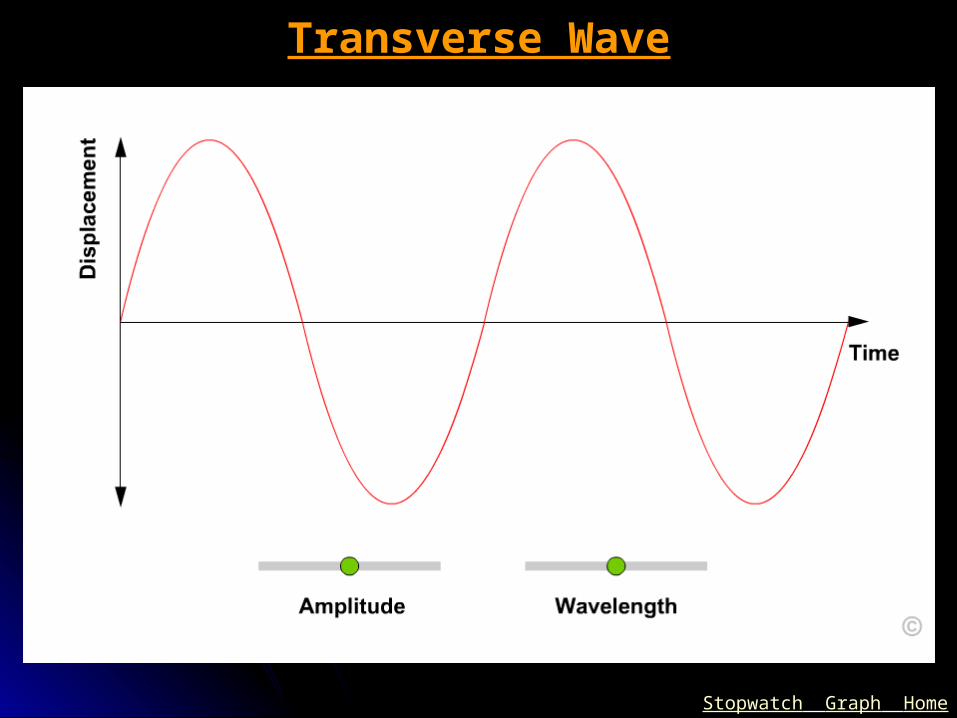
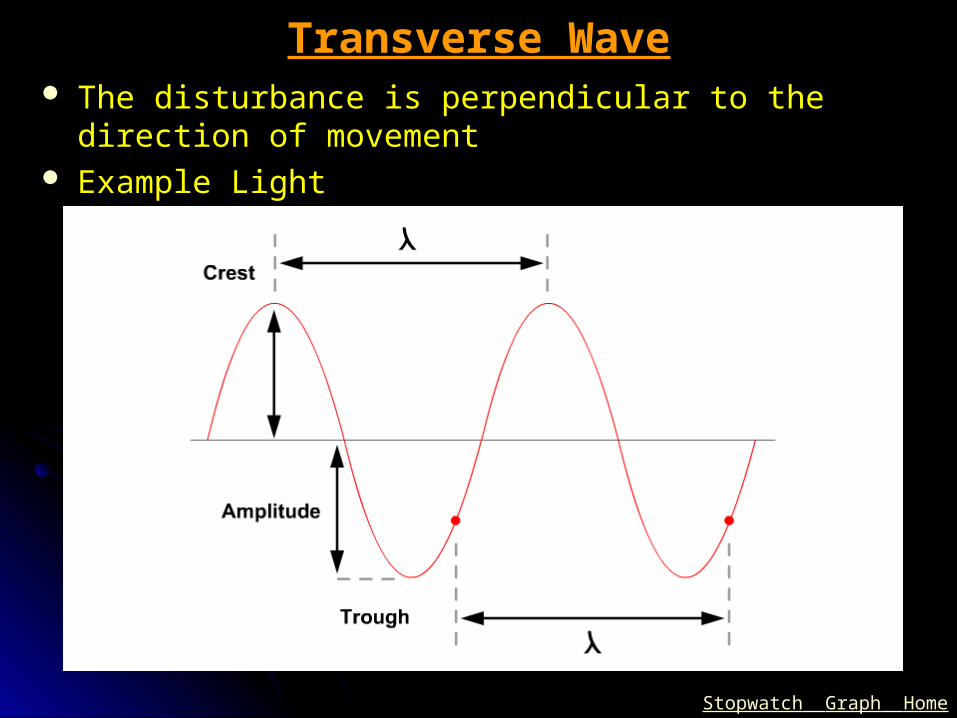
Transverse Wave
Stopwatch Graph Home
Transverse Wave The disturbance is perpendicular to the direction of
movement Example Light
Stopwatch Graph Home
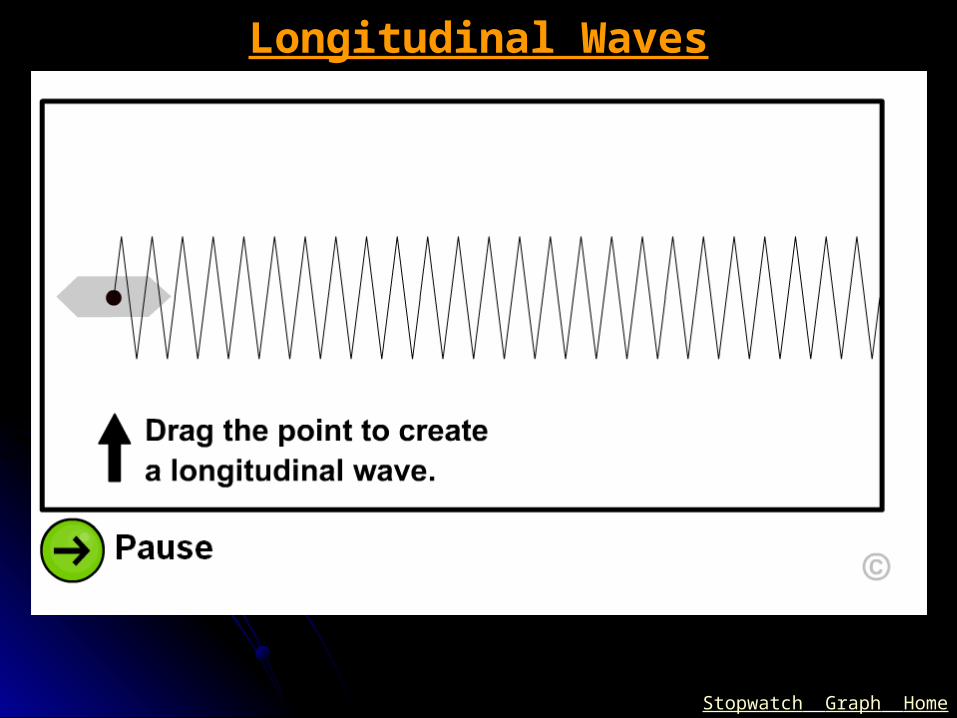
Longitudinal Waves

Stopwatch Graph Home
Longitudinal Waves The disturbance is parallel to the direction of
movement Aka: pressure, compression waves Example sound Sketch on board

Stopwatch Graph Home
Stopwatch Graph Home
Wave Behaviour recap
Aim To define the properties of waves To identify the types of waves

Wave Speed 19/04/23
Aim: To calculate the speed of waves To Revise Reflection
Starter:• Draw a transverse wave in rough and label the
wavelength and amplitude• The frequency of a wave is 5 Hz what is it’s
Period? (check back in your book if you need to)

Stopwatch Graph Home
•How fast the wave is travelling•Symbol v•Units m/s

Stopwatch Graph Home
ENERGYspeed
VIBRATIONS
The speed is how fast the disturbance travels (how fast the energy is transferred)

Stopwatch Graph Home
speed
ENERGY
speed
Notice that both waves have the same speed but different wavelengths and frequencies. The wave equation can explain this mathematically.

Stopwatch Graph Home
Calculating the Speed of Wave
Speed = DistanceTime
An explosion happens 1000m away and takes 3 seconds to reach you what is the speed of sound?Speed = Distance
TimeSpeed = 1000
3 = 333 m/s
Stopwatch Graph Home
Wave speed, wavelength and frequency arerelated by the wave equation

Stopwatch Graph Home
The Wave Equation
The wave equation relates the speed of the wave to its frequency and wavelength:
Wave speed (v) = frequency (f) x wavelength ()
in m/s in Hz in m
V
fWorksheet
Stopwatch Graph Home
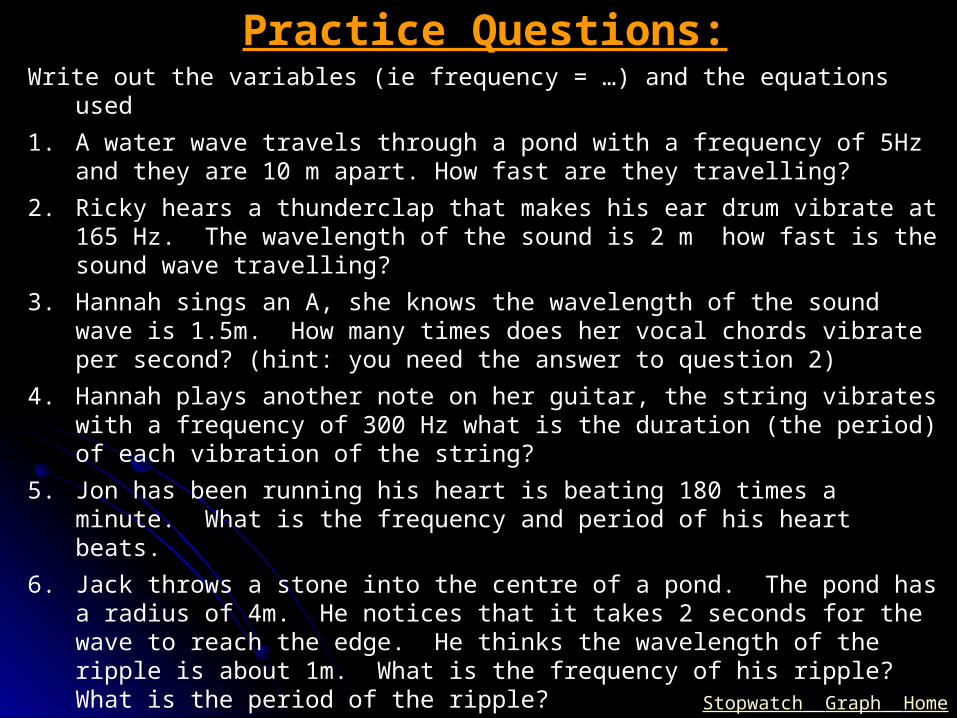
Practice Questions:Write out the variables (ie frequency = …) and the equations used
1. A water wave travels through a pond with a frequency of 5Hz and they are 10 m apart. How fast are they travelling?
2. Ricky hears a thunderclap that makes his ear drum vibrate at 165 Hz. The wavelength of the sound is 2 m how fast is the sound wave travelling?
3. Hannah sings an A, she knows the wavelength of the sound wave is 1.5m. How many times does her vocal chords vibrate per second? (hint: you need the answer to question 2)
4. Hannah plays another note on her guitar, the string vibrates with a frequency of 300 Hz what is the duration (the period) of each vibration of the string?
5. Jon has been running his heart is beating 180 times a minute. What is the frequency and period of his heart beats.
6. Jack throws a stone into the centre of a pond. The pond has a radius of 4m. He notices that it takes 2 seconds for the wave to reach the edge. He thinks the wavelength of the ripple is about 1m. What is the frequency of his ripple? What is the period of the ripple?
7. Purple light has a wavelength of around 6x10⁻⁷m. If its frequency is 5x10¹⁴ Hz what is the speed of light?
8. Red light travels at the same speed. Work out its frequency if its wavelength is about 4x10⁻⁷m.

Stopwatch Graph Home
Stopwatch Graph Home

Stopwatch Graph Home
Stopwatch Graph Home

Stopwatch Graph Home
Reflection
Incident ray
Normal
Reflected ray
Angle of incidence
Angle of reflection
Mirror
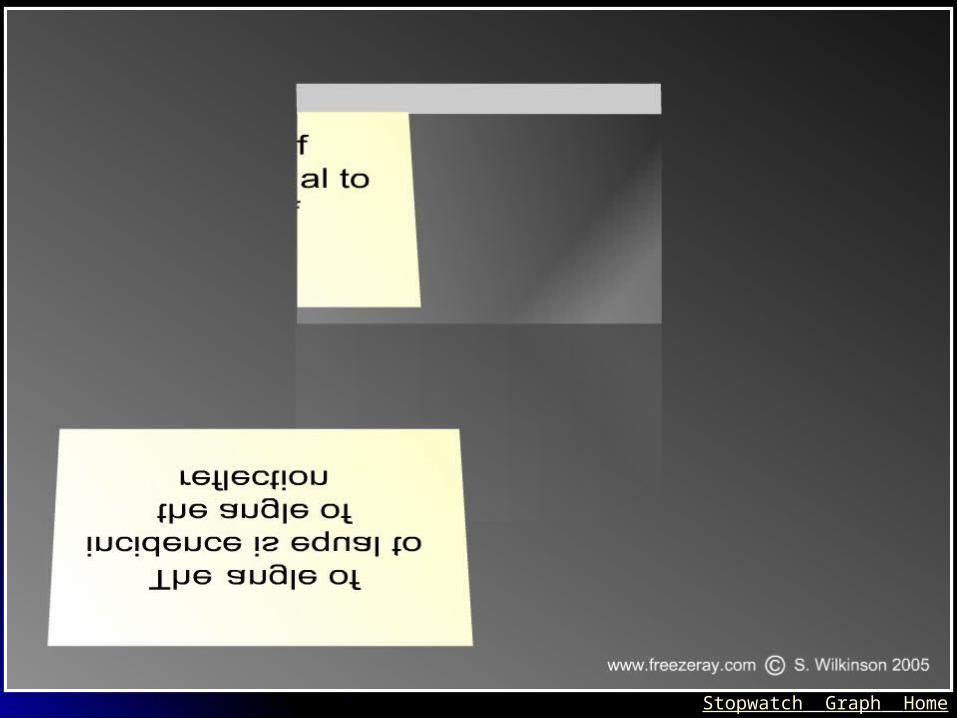
Angle of incidence = Angle of reflection
Movie Worksheet
Stopwatch Graph Home
Stopwatch Graph Home
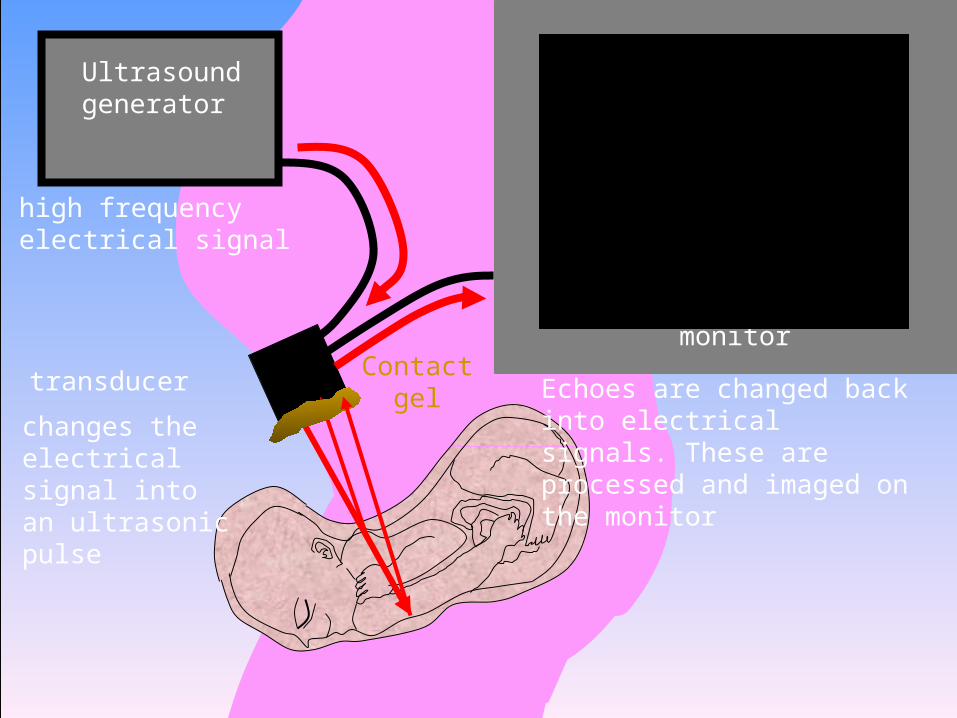
monitor
transducer
Ultrasoundgenerator
high frequencyelectrical signal
changes theelectricalsignal into an ultrasonic pulse
Echoes are changed back into electricalsignals. These areprocessed and imaged on the monitor
Contactgel
Stopwatch Graph Home
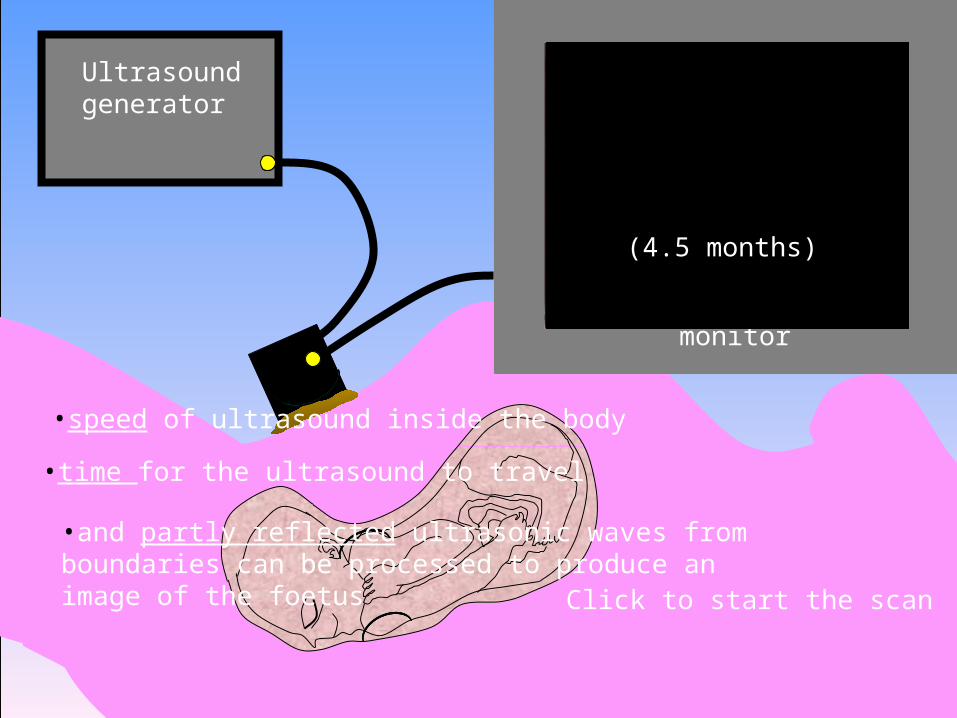
monitor
Ultrasoundgenerator
Click to start the scan
(4.5 months)
•and partly reflected ultrasonic waves from boundaries can be processed to produce an image of the foetus
•speed of ultrasound inside the body
•time for the ultrasound to travel
Stopwatch Graph Home
Wave Speed recap
Aim: To calculate the speed of waves To Revise Reflection

Stopwatch Graph Home
Refraction 19/04/23
Aims: To demonstrate refraction To explain the cause of refraction To observe total internal reflectionStarter:Why does the magic trick of the Disappearing Coin work?
Home

Stopwatch Graph Home
Refraction at a Boundary
Stopwatch Graph Home
Refraction is when waves ____ __ or slow down due to changing _________. A medium is something that waves will travel through.
Refraction
Movie
Stopwatch Graph Home
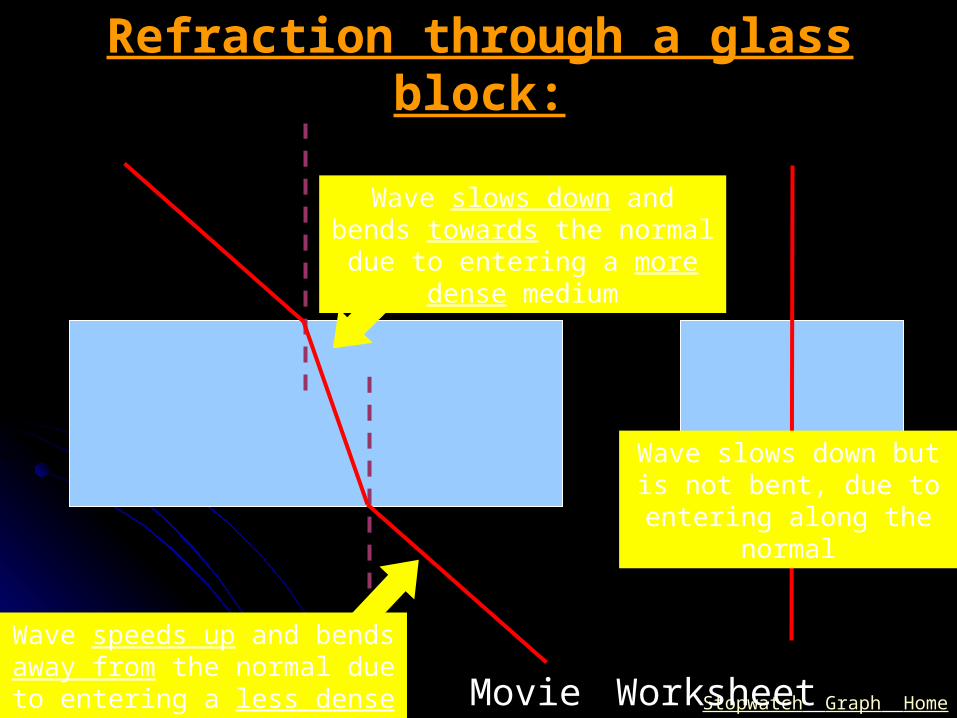
Refraction through a glass block:
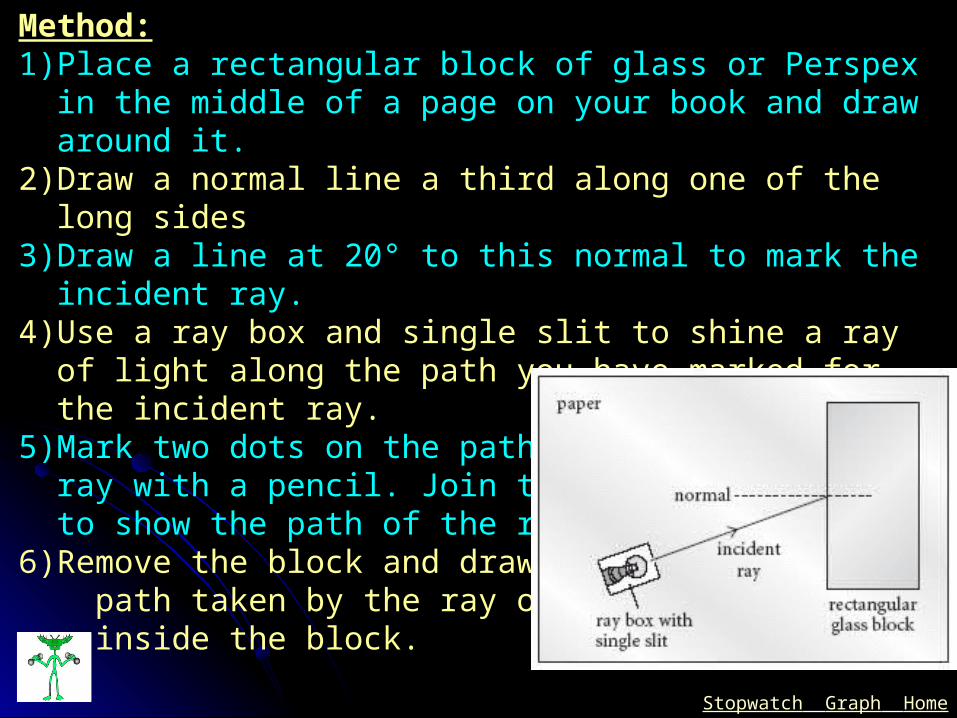
Method:1) Place a rectangular block of glass or Perspex in the
middle of a page on your book and draw around it.2) Draw a normal line a third along one of the long sides3) Draw a line at 20° to this normal to mark the incident
ray.4) Use a ray box and single slit to shine a ray of light
along the path you have marked for the incident ray.5) Mark two dots on the path of the refracted ray with a
pencil. Join the dots with a ruler to show the path of the refracted ray.
6) Remove the block and draw the path taken by the ray of light inside the block.
Stopwatch Graph Home

Stopwatch Graph Home
This wheel slows first
The car travels
slower on the sand
than tarmac
The cars direction changes
This wheel continues to move fast
The cars direction changes
This wheel speeds up

Stopwatch Graph Home
Stopwatch Graph Home
Refraction through a glass block:
Wave slows down and bends towards the normal due to
entering a more dense medium
Wave speeds up and bends away from the normal due to entering a less dense
medium
Wave slows down but is not bent, due to
entering along the normal
Movie Worksheet

Stopwatch Graph Home
What is total internal reflection?Method:
1) Place a semi circular block of glass or Perspex in the middle of a sheet of plain paper and draw around it.
2) Draw a normal line at the middle of the flat side
3) Use a ray box and single slit to shine a ray of light to the normal line
4) Change the angle of the ray of light until total internal reflection if found.
5) Then change the angle until the light is refracted along the horizontal side.
6) Mark two dots on the path of the refracted ray with a pencil. Join the dots with a ruler to show the path of the refracted ray.
6) Measure the critical angle

Stopwatch Graph Home
Total internal reflection – simulation
Stopwatch Graph Home
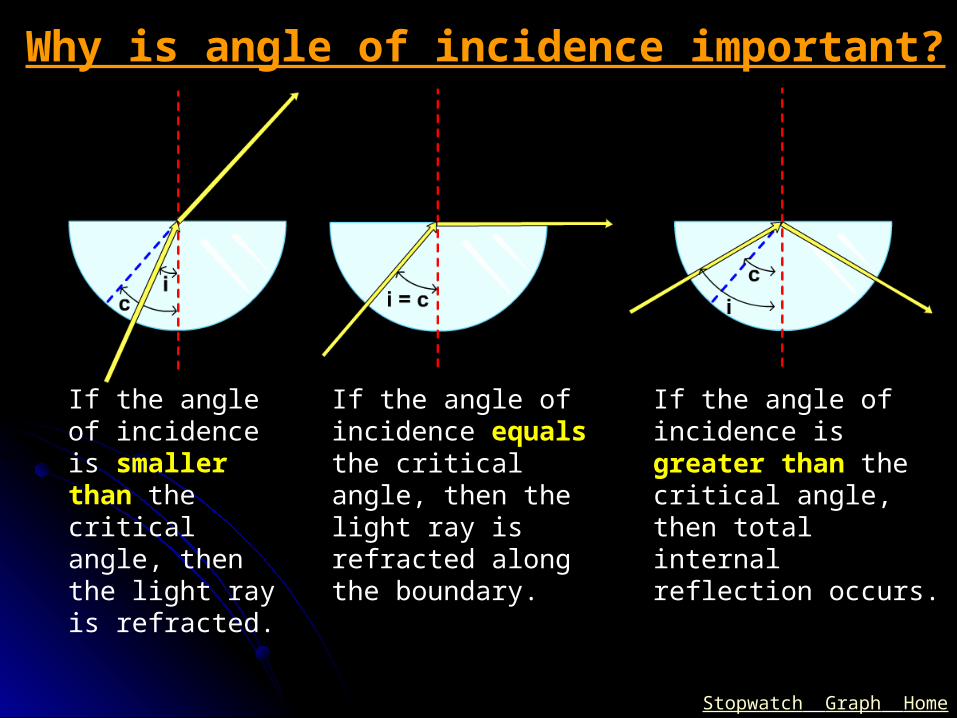
Why is angle of incidence important?
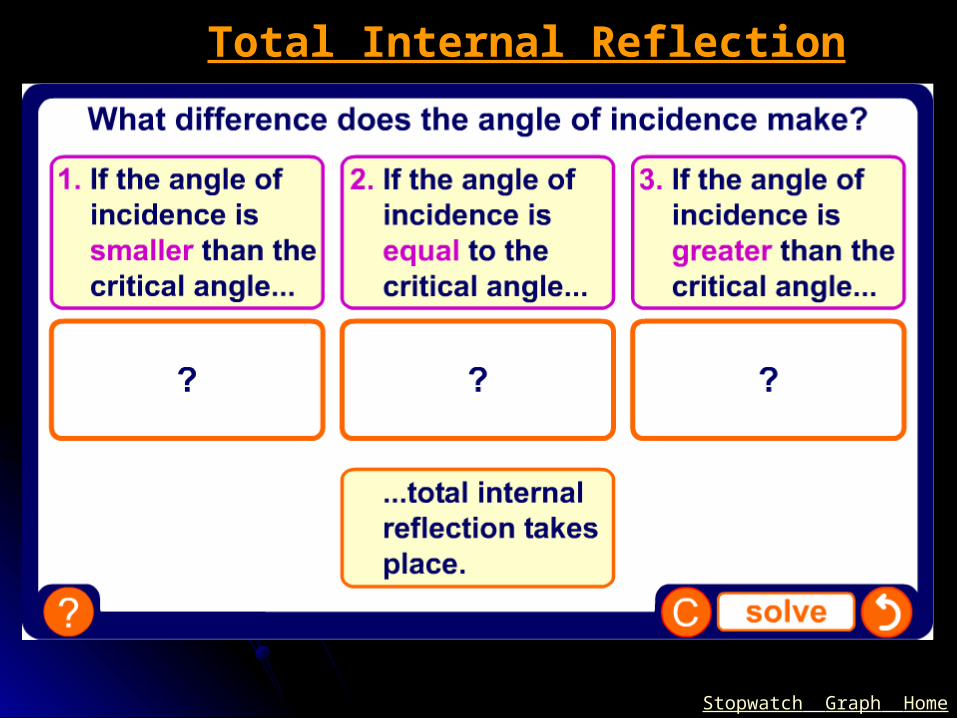
If the angle of incidence is smaller than the critical angle, then the light ray is refracted.
If the angle of incidence equals the critical angle, then the light ray is refracted along the boundary.
If the angle of incidence is greater than the critical angle, then total internal reflection occurs.

Stopwatch Graph Home
Is the critical angle always the same?The critical angle is the smallest angle of incidence at which total internal reflection occurs.
Diamond has the lowest critical angle at 24°.
49°
42°
41°
24°
water
acrylic plastic
glass
diamond
Critical angleMaterial
Different materials have a specific value for the critical angle:
This means that diamond reflects more light than the other materials and accounts for its characteristic sparkle.
Stopwatch Graph Home
Total Internal Reflection
Stopwatch Graph Home
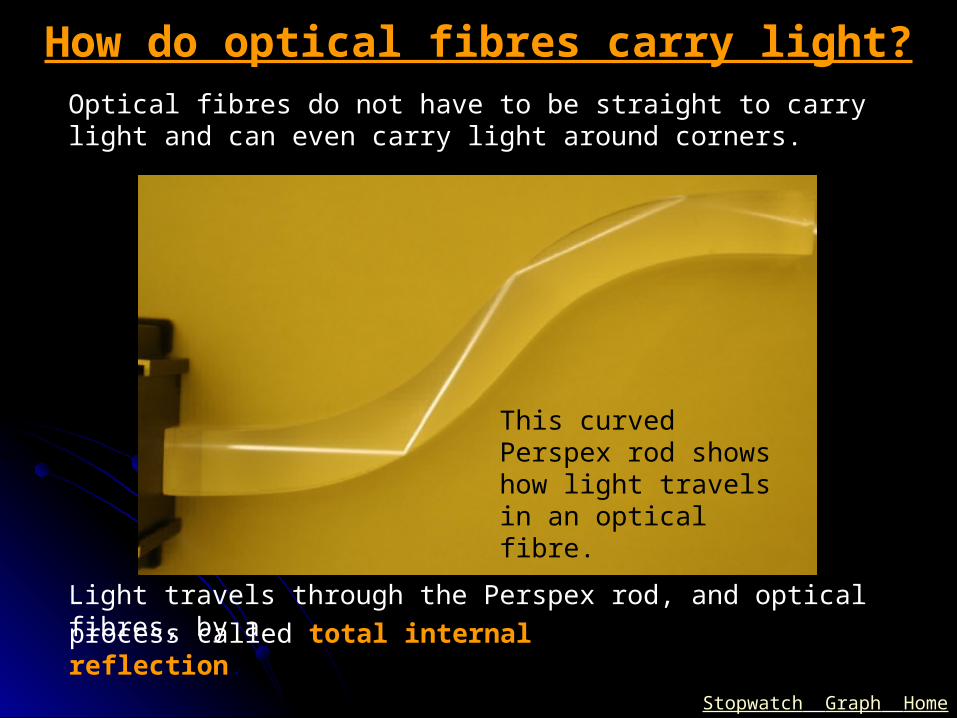
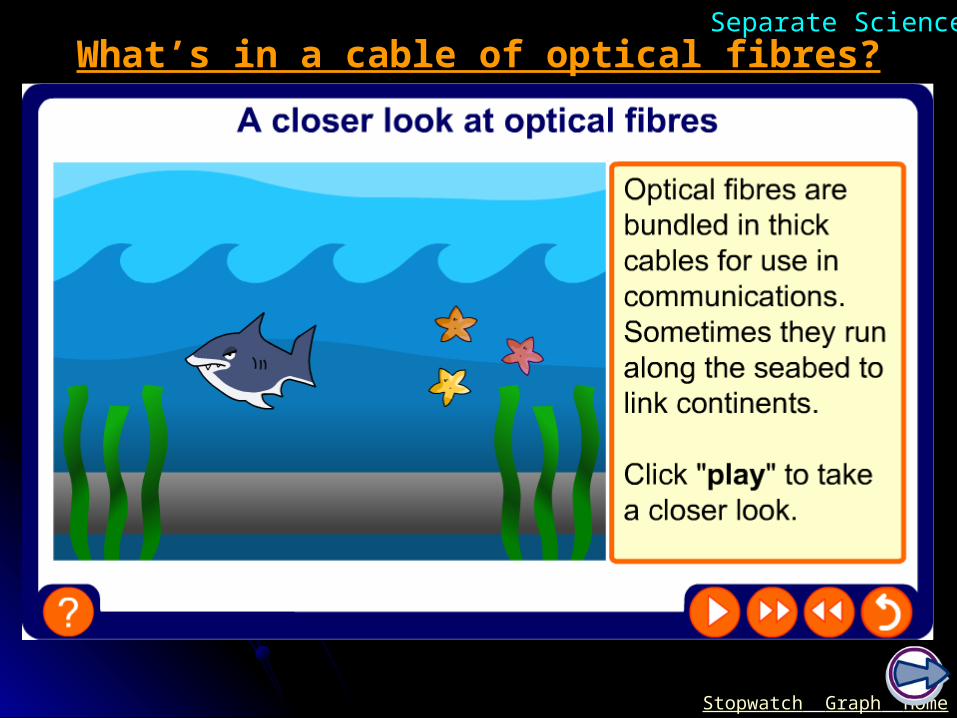
Optical fibres do not have to be straight to carry light and can even carry light around corners.
How do optical fibres carry light?
Light travels through the Perspex rod, and optical fibres, by aprocess called total internal reflection.
This curved Perspex rod shows how light travels in an optical fibre.
Stopwatch Graph Home
Total Internal Reflection recap
Aims: To describe the effect of the critical angle To know some uses of the critical angle
Home

Stopwatch Graph Home
Refraction in Water 19/04/23
Aim Experimentally determine the effect of water
depth on speed and establish if there is a relationship between the two
Stopwatch Graph Home
Experiment: Wave SpeedYou are expected to: Write a method Draw a graph of results Write a analysis / conclusion Write an evaluation
Overview: Work out what you are going to do before you start You need at least 6 different depths for a graph The effect is only noticed on small depths (mm not cm) You need to make sure that the effect is not drowned out
by your reaction time You need to make sure that one mistake does not ruin your
results

Stopwatch Graph Home
Refractive Index 19/04/23
Aim Experimentally determine the refractive index of
glass describe an experiment to determine the refractive
index of glass

Stopwatch Graph Home
Finding the Refractive Index of GlassMethod: Draw around the semi circular block. Draw a normal line in the middle of the straight edge of the
block. Draw Incident lines every 10° from 0° to 70° Use a ray box to send incident rays into the semi circular box
and mark out the refracted rays. Measure the refracted angles
Results: Create a table of the incident, refracted angles, sin i, and sin r. Plot a graph of sin i (x) against sin r (y)
Stopwatch Graph Home
Work To Do:
Results: Create a table of the incident, refracted angles, sin
i, and sin r. Plot a graph of sin i (x) against sin r (y)
Analysis What shape is your graph? Add an extra column to your table with the heading
refractive index (n) n = sin(i) ÷ sin (r) Calculate the gradient of your graph The critical angle of glass (c) = 41° Calculate sin(c)

Stopwatch Graph Home
Equations to Learn:
A measure of how much light is refracted (bends) in a material. glass n = 1.6 Diamond n = 2.5
Refractive index (n): n = sin i
sin rCritical Angle (c):
sin c = 1n
Critical angle
refracted angle
incident angle

Stopwatch Graph Home
Refractive Index recap
Aim Experimentally determine the refractive index of
glass describe an experiment to determine the refractive
index of glass

Stopwatch Graph Home
Diffraction 19/04/23
Aims: To define diffraction To see reflection and refraction in water waves
Starter:Worksheet
Separate Science

Stopwatch Graph Home
Separate Science

Stopwatch Graph Home
Barrier
Water wavesare reflectedby the barrier
Separate Science
Stopwatch Graph Home
Separate Science
Stopwatch Graph Home
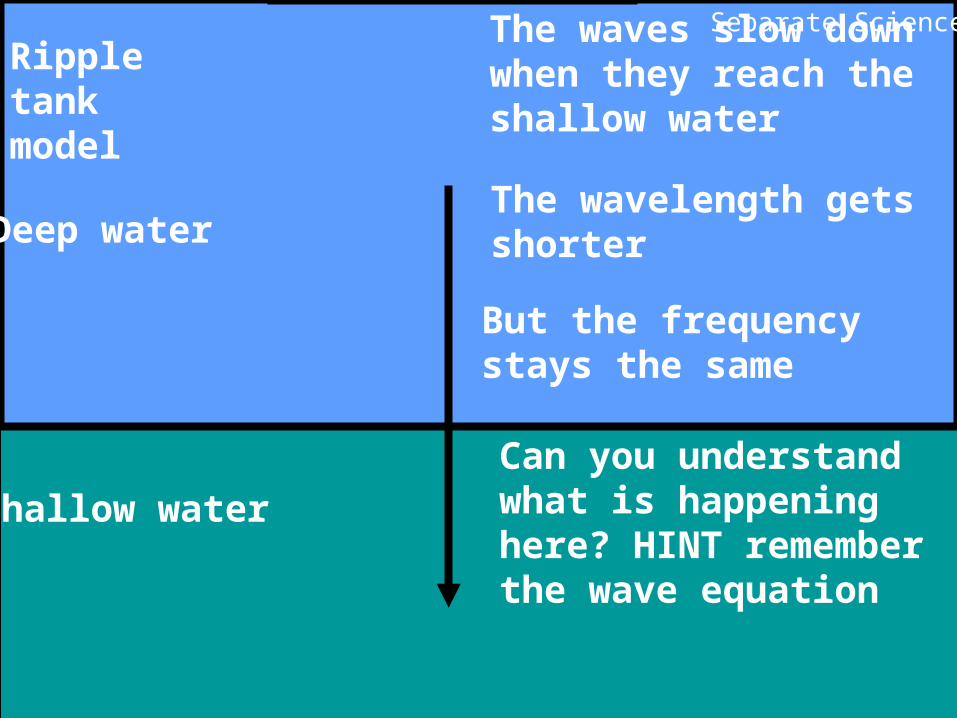
Deep water
Shallow water
The waves slow downwhen they reach the shallow water
Ripple tankmodel
The wavelength getsshorter
But the frequency stays the same
Can you understandwhat is happening here? HINT remember the wave equation
Separate Science

Stopwatch Graph Home
Deep water
Shallow water
Water wavesIf the waves reach theshallow water at anangle the waves stillslow down.
The waves alsochange direction. We call this effect refraction.
Separate Science

Stopwatch Graph Home
Separate Science

Stopwatch Graph Home
•Diffraction is the spreading out of waves at edges and gaps.
•All types of waves can be diffracted.•The amount of diffraction is affected by the
size of the gap and the wavelength.
Separate Science

Stopwatch Graph Home
Separate Science

Stopwatch Graph Home
Separate Science

Stopwatch Graph Home
Separate Science

Stopwatch Graph Home
Small amount of spreading (diffraction)
The wavelength of the waves is much smallerthan the size of the gap
Separate Science

Stopwatch Graph Home
The wavelength is thesame size as the gapso there is very goodspreading (diffraction)
Separate Science

Stopwatch Graph Home
For EdgesLong wavelengths diffract more than shortwavelengths.
For GapsThe wavelength should be the same sizeas the gap to get good diffraction.
Separate Science

Stopwatch Graph Home
Typical frequency = 440Hertz
Speed of sound in air = 330m/s
Speed = wavelength x frequency
Work out the wavelength of these sound waves
Wavelength = speed/frequency
Wavelength = 330/440 = 0.75metres
About the same size as the width of a door
Separate Science

Stopwatch Graph Home

Stopwatch Graph Home
To get spreading (diffraction) of the lightthe gap it passes through has to be verysmall-because the wavelength of light isvery small
Separate Science
Stopwatch Graph Home
Separate Science

Stopwatch Graph Home
Separate Science

Stopwatch Graph Home
The aerial is on a poleto try and improve thereception of radio waves.
Separate Science
Stopwatch Graph Home
Separate Science

Stopwatch Graph Home
Separate Science

Stopwatch Graph Home
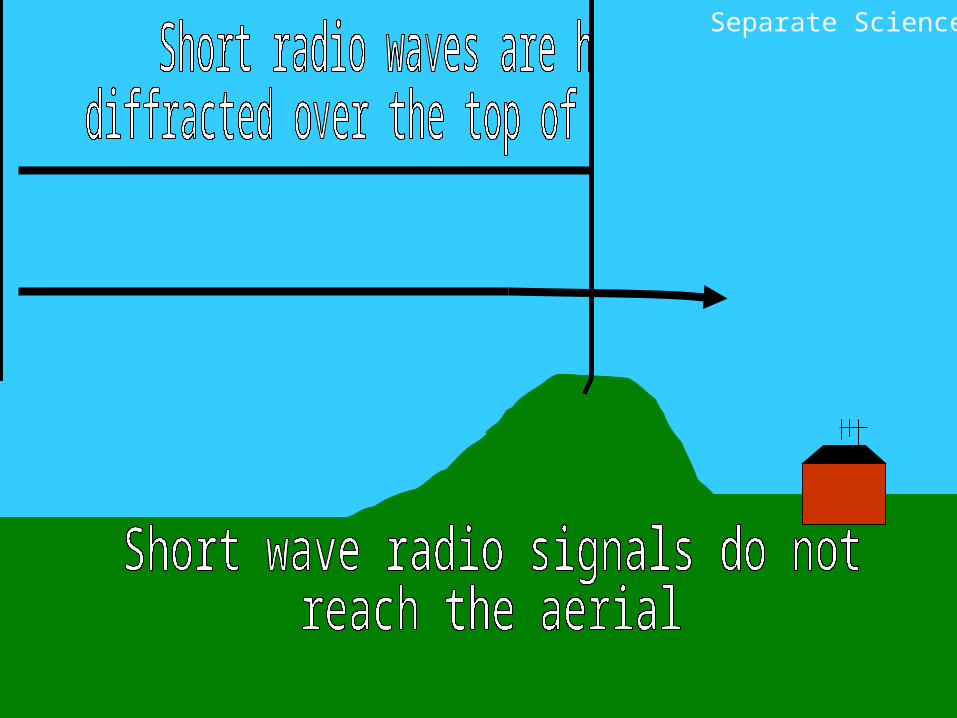
There is very little diffraction of short wavelength radio waves when they pass between two hills
Separate Science

Stopwatch Graph Home
Long wavelength radio waves are more likely to be diffracted when they pass between hills and are more likely to be detected by the aerial.
Separate Science

Stopwatch Graph Home
Separate Science

Stopwatch Graph Home
Copy and complete this email:To [email protected] are having difficulty with the signal strength on your short wave radio because…
Helpful words/phrases to use: long wavelengthshort wavelength, diffracted, gap, edge.Copy and complete the diagrams to illustrate youranswer.
Separate Science

Stopwatch Graph Home
A
B
C
D
Which of these show how rays are(a) reflected? (b) diffracted at a gap?(c) refracted? (d) diffracted at an edge?
Separate Science
Stopwatch Graph Home
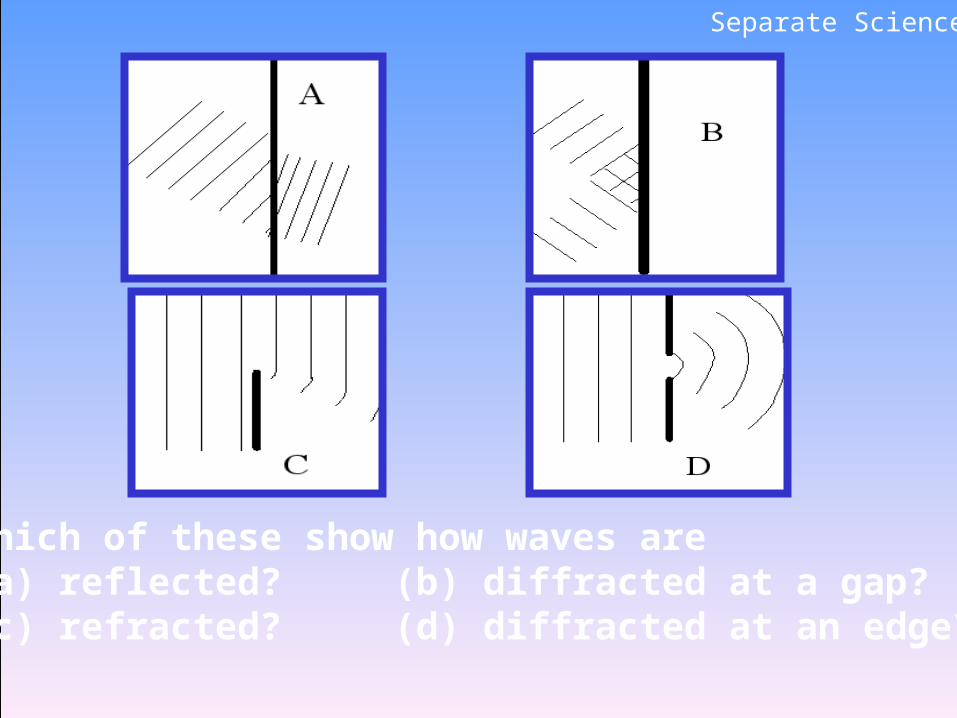
Which of these show how waves are(a) reflected? (b) diffracted at a gap?(c) refracted? (d) diffracted at an edge?
Separate Science

Stopwatch Graph Home
Diffraction recap
Aims: To define diffraction
Home
Worksheet

Stopwatch Graph Home
Transmitting Information 19/04/23Aim To explain the difference between analogue and
digital signals
Separate Science
Stopwatch Graph Home
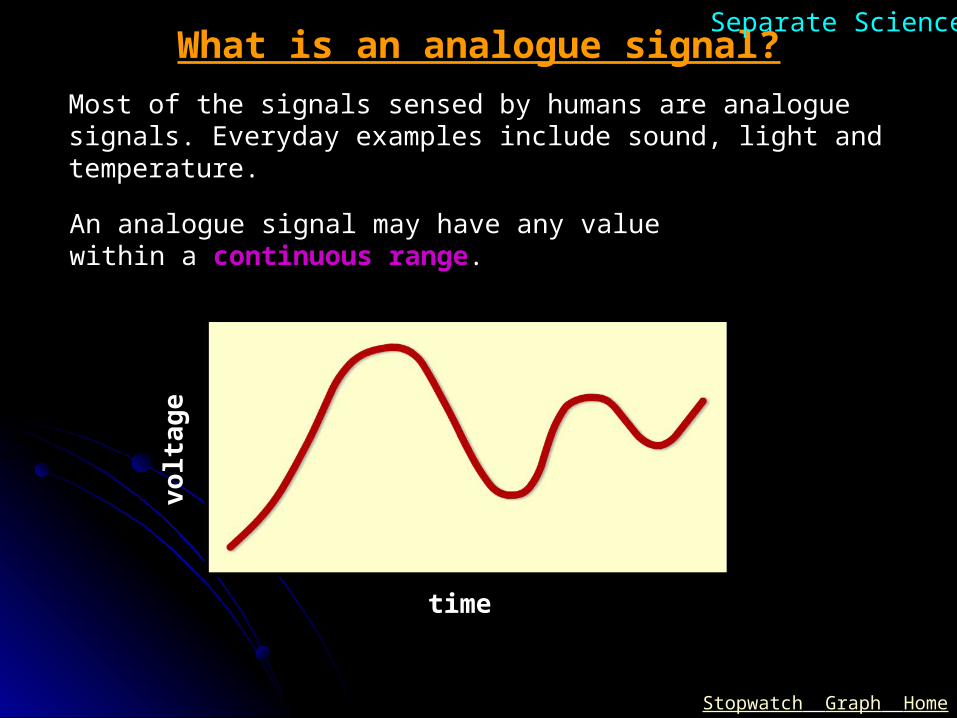
What is an analogue signal?
Most of the signals sensed by humans are analogue signals. Everyday examples include sound, light and temperature.
An analogue signal may have any value within a continuous range.
time
volt
ag
e
Separate Science

Stopwatch Graph Home
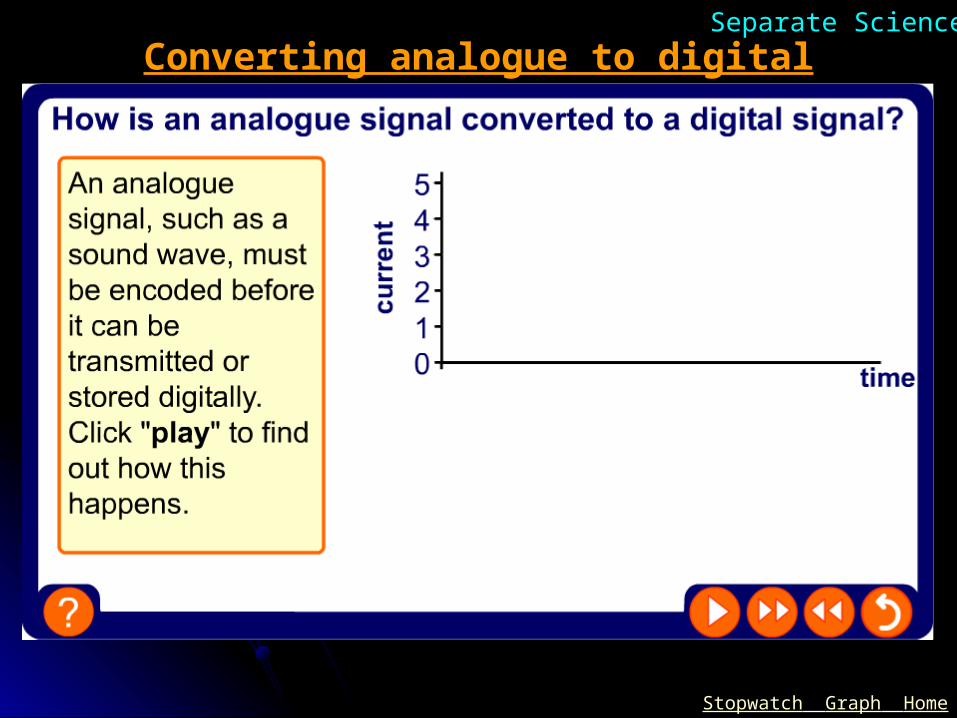
What is a digital signal?Modern communication systems carry information from analogue signals as digital signals.
A digital signal only contains two values: ‘0’ (off) and ‘1’ (on). These are used to encode analogue information.
time
cu
rren
t
Separate Science
Stopwatch Graph Home
Converting analogue to digitalSeparate Science
Stopwatch Graph Home
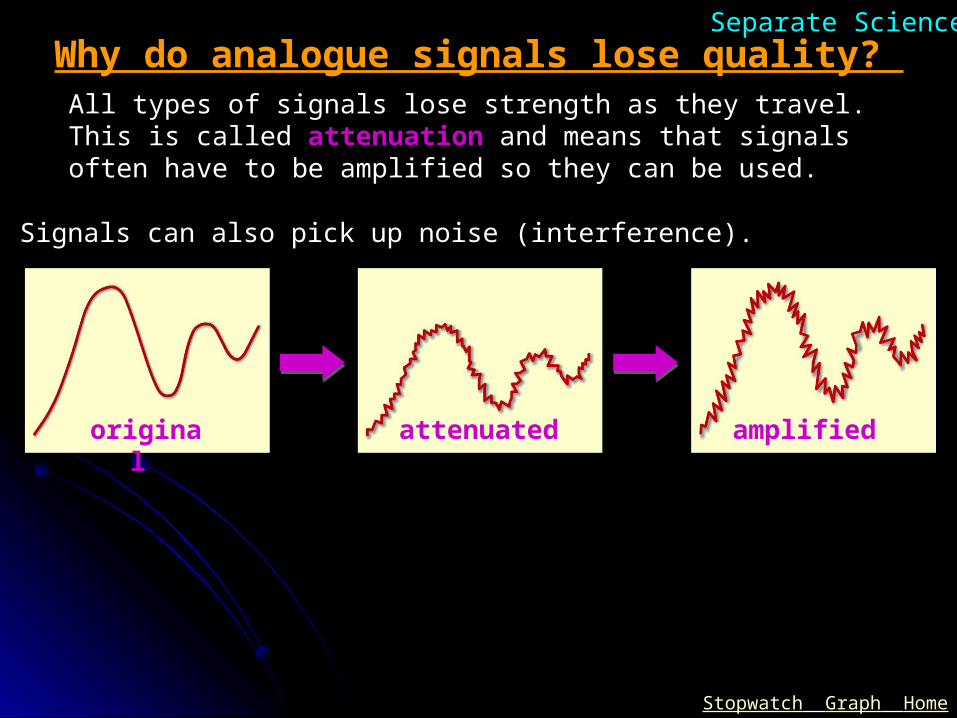
Why do analogue signals lose quality? All types of signals lose strength as they travel. This is called attenuation and means that signals often have to be amplified so they can be used.
original attenuated amplified
Signals can also pick up noise (interference).
Separate Science
Stopwatch Graph Home
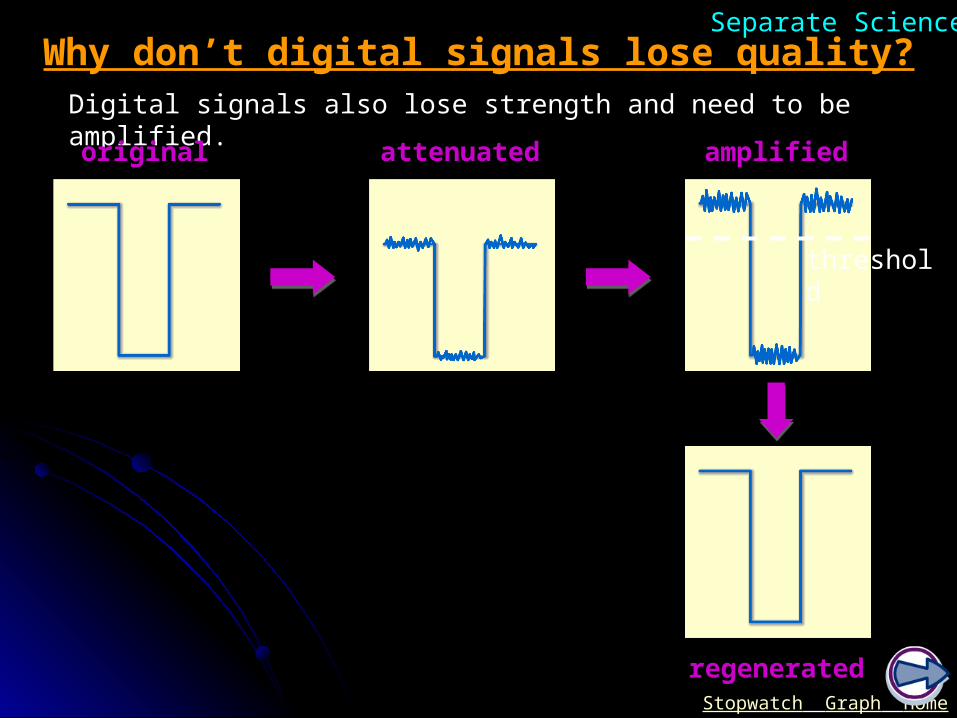
Why don’t digital signals lose quality?Digital signals also lose strength and need to be amplified.
attenuated amplifiedoriginal
regenerated
threshold
Separate Science
Stopwatch Graph Home
Digital vs Analogue Analogue signals are continually changing. Digital signals are either zero or one This means if the signal gets distorted you can work
out the digital signal (it should either be zero or one) but you will not be able to tell the original analogue signal
Stopwatch Graph Home
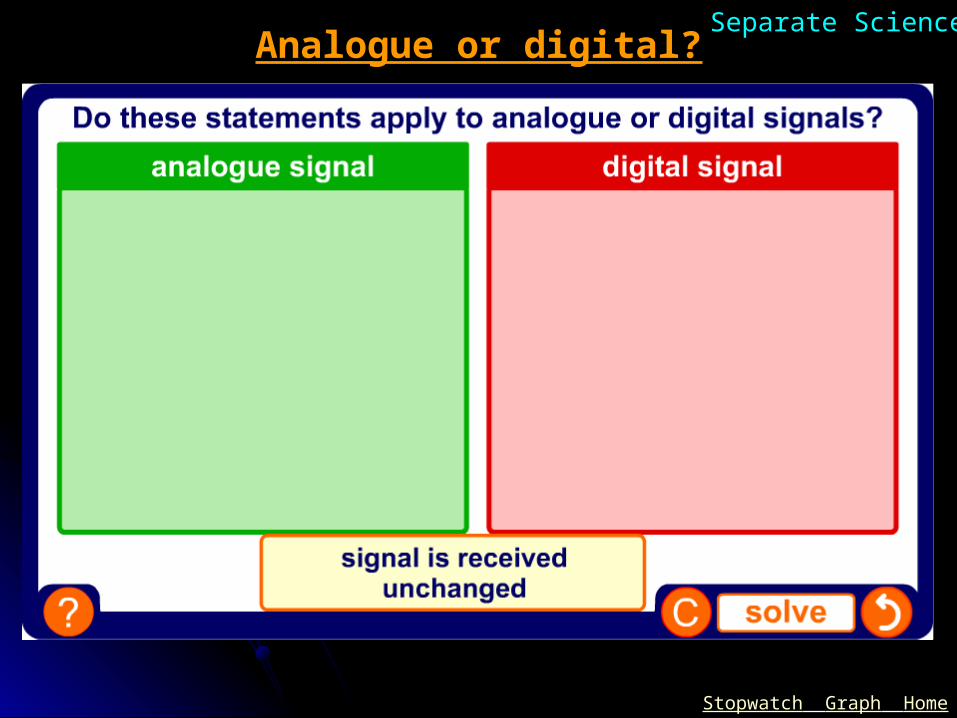
Analogue or digital?Separate Science
Stopwatch Graph Home
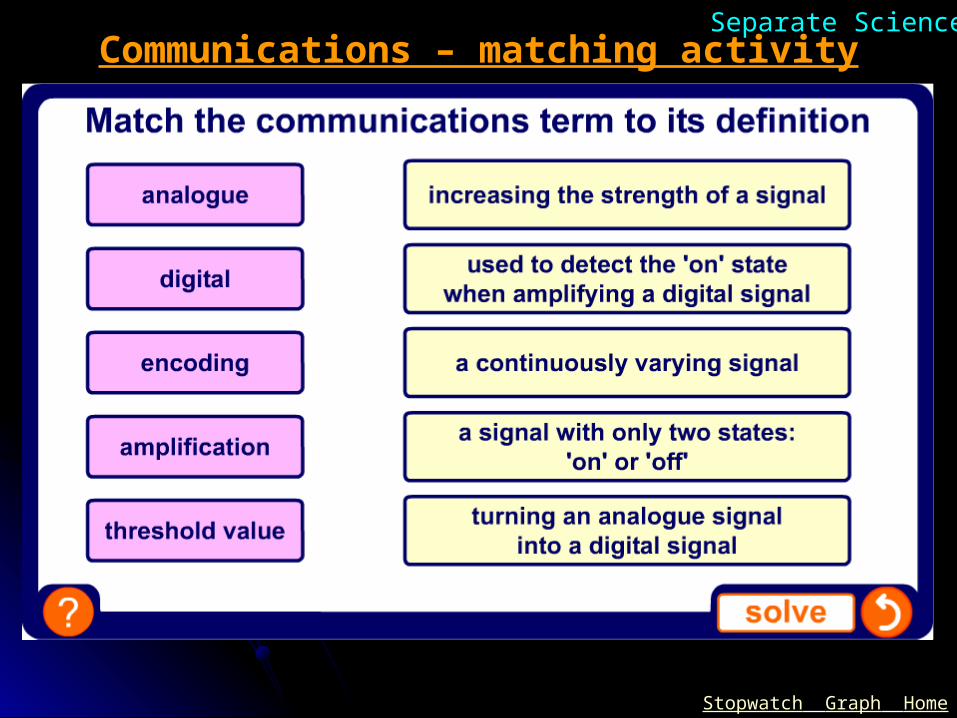
Communications – matching activitySeparate Science

Stopwatch Graph Home
Opinions on analogue and digitalSeparate Science
Stopwatch Graph Home
What’s in a cable of optical fibres?Separate Science

Stopwatch Graph Home
How do messages travel along optical fibres? Separate Science

Stopwatch Graph Home
Sending messagesSeparate Science

Stopwatch Graph Home
Optical fibres – true or false?Separate Science

Stopwatch Graph Home
Transmitting Information recapAim To explain the difference between analogue and
digital signals

Stopwatch Graph Home
Sound 19/04/23Aim Measure the Speed of Sound Know the human hearing range
Stopwatch Graph Home
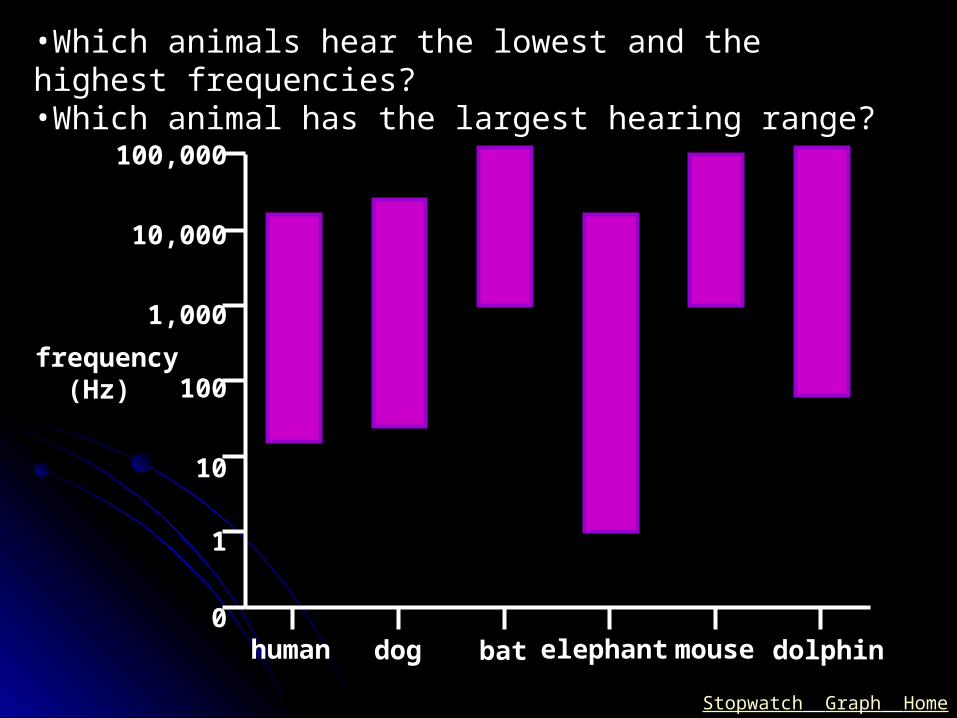
100,000
10,000
1,000
100
10
1
0human dog elephantbat mouse dolphin
•Which animals hear the lowest and the highest frequencies?•Which animal has the largest hearing range?
frequency(Hz)
Stopwatch Graph Home
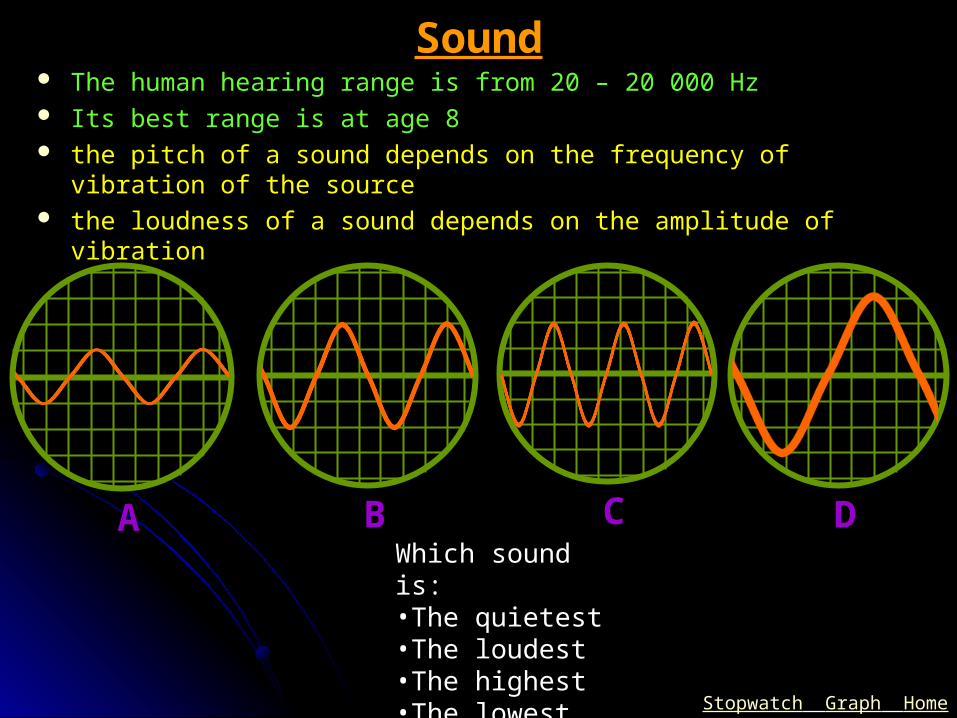
Sound The human hearing range is from 20 – 20 000 Hz Its best range is at age 8 the pitch of a sound depends on the frequency of vibration of
the source the loudness of a sound depends on the amplitude of vibration
BA C DWhich sound is:•The quietest•The loudest•The highest•The lowest

Stopwatch Graph Home
100 m
00:0000
START
00:0034
STOP
1. When you see the cymbals crash, press START.2. When you hear the cymbals crash, press STOP.
This investigation to calculate the speed of sound should be carried out in a quiet open space.
Speed of sound experiment

Stopwatch Graph Home
Experiment distance (m)
time(s)
speed(m/s)
1
Look at the results of the sound experiment.
=294 m/s distance tim
e
speed =
=100
0.34
100 0.34 294
Speed of sound experiment – results table
How are these values used to estimate the speed of sound?

Stopwatch Graph Home
Speed of Sound Experiment Write a method for our speed of sound experiment Write out the results Calculate the speed of sound Are our results accurate? Why might they not be?
Stopwatch Graph Home
Movie CB