Embed Size (px)
Citation preview

www.equalityhumanrights.com
Stop and think againTowards race equality in police PACE stop and search
Equality and Human Rights Commission

2
Stop and think again
Contents
Acknowledgements 3
Executive summary 4
Chapter 1: Introduction 8
Chapter 2: Thames Valley Police 14
Chapter 3: Leicestershire Constabulary 19
Chapter 4: Dorset Police 24
Chapter 5: The Metropolitan Police Service 28
Chapter 6: West Midlands Police 34
Chapter 7: Conclusions 39
Appendix 1 40
Appendix 2 44

3
Acknowledgements
We would like to thank the following Commission staff for their contributions: John Wadham,
former General Counsel, who authorised and oversaw the project; Marc Verlot, who managed
the project, succeeded by Anna Henry; Brenda Parkes, who provided legal guidance, succeed-
ed by Rosemary Lloyd; Karen Hurrell, who provided statistical expertise; Katie Burke, who
analysed initial information from the police forces concerned; Finola Kelly, who planned and
managed public engagement; Valentine Murombe-Chivero who planned and managed media
engagement; and Phil Pavey, who worked with the forces and produced successive drafts of
the report.
Our thanks also to Robin Allen QC who drafted the formal legal agreements which were drawn
up with two of the forces.

4
Stop and think again
Executive summary
In March 2010 the Equality and Human Rights Commission published Stop and think which
showed that the police in England and Wales conducted about a million stops and searches
of members of the public every year, the great majority under the Police and Criminal
Evidence Act 1984 (PACE) and similar laws requiring officers to have ‘reasonable grounds for
suspicion’. The power has always been controversial, and when Stop and think was published,
Asian people were stopped and searched about twice as often as white people, and black
people about six times as often. Stop and think also identified geographical differences; for
example, little race disproportionality in much of the north of England, and relatively high
levels in some southern forces. There were also wide ranges year on year between some
neighbouring similar forces, and also between comparable London boroughs. The report
concluded that unless forces could convincingly evidence that their race inequalities were
justified their practice would be unlawful and discriminatory.
Following the report the Commission applied criteria, including extent of disproportionality
and trends, to identify five forces for further inquiries. It found that their explanations
were not firmly substantiated by evidence, nor could they define how much of their force’s
disproportionality might stem from these factors.
The Commission therefore initiated legal compliance action against two forces, Leicestershire
and Thames Valley, which in each case was subsequently succeeded by a formal agreement
detailing a programme of action over 18 months (spring 2011–autumn 2012).
Dorset Police and the Metropolitan Police (initially in one borough) had arranged to
implement the service’s own ‘Next Steps’ programme for securing best practice in stop and
search, so the Commission decided to take no action so as to identify what impact on race
disproportionality Next Steps might have without influencing the outcome. West Midlands
Police drew together its own programme of measures and again the Commission agreed to
scrutinise its progress rather than intervene.
Action by the forcesLeicestershire and Thames Valley’s agreed programmes included a revised policy, training
for all officers, detailed statistical ethnic monitoring down to local level, scrutiny by senior
management group meetings and a community reference group, and leadership by an ACPO
rank officer. Each force appointed a middle-ranking officer to engage with local commanders
regarding the race patterns in their areas, and extended monitoring down to the level of
individual officers.

5
www.equalityhumanrights.com
The Commission engaged closely with the process and was impressed in both cases with the
quality of delivery.
The Commission engaged with Dorset and the Metropolitan Police after their short intensive
programme with the national Next Steps team, to assess changes in practice and outcomes.
The Next Steps programme focused on securing full recording (inter alia to eliminate
distortions in race patterns), practice based on reliable intelligence not ‘hunch’, eliminating
formal or tacit numerical performance targets encouraging mass usage, and fostering a clear
understanding of what does and does not constitute ‘reasonable grounds’.
West Midlands Police’s programme included a revision of stop and search policy, training
for all officers, the creation of local scrutiny panels and clear action to eliminate performance
targets encouraging prolific rather than carefully judged usage. They also pursued analyses to
demonstrate the element of disproportionality that could be accounted for by skews towards
areas recording high crime levels and towards young people.
OutcomesThe race disproportionality ratios were necessarily calculated on a different basis from the
figures in Stop and think because (i) 2001 census figures were used as a base since they were
broken down to local level, which more recent population estimates were not, and (ii) they
were based on self-classification instead of officer perception, which became national practice
for data after those used in Stop and think.
Thames Valley
z From March 2011 to August 2012 Thames Valley Police’s black: white disproportionality
fell from 3.5 to 3.2, and its Asian: white figure from 2.5 to 1.9.
z The overall number of stops and searches recorded in the same period fell from 5916 in the
first quarter to 4758 in the sixth quarter.
z Meanwhile the downward direction in recorded crime in the force’s area continued
uninterrupted.

6
Stop and think again
Leicestershire
z From April 2011 to October 2012 Leicestershire Constabulary’s black: white
disproportionality began and ended at 4.2, and its Asian: white figure rose from 1.5 to 1.9.
z However, falls in disproportionality amongst the most prolific users at the end of
the period suggested imminent falls in the overall figures, and this was subsequently
confirmed (April– November 2012, 3.9 and 1.7).
z The overall number of stops and searches recorded in the same period also fell steeply
from 4183 in the first quarter to 1660 in the sixth quarter, while the downward direction in
recorded crime in the force’s area continued uninterrupted.
In both force areas negative drug searches formed a large proportion of the total and appeared
to be a major driver of race disproportionality.
Dorset
z In summer 2011 Dorset Police’s disproportionality ratios remained unchanged at
approximately 6.0 for the black: white figure and close to parity for the Asian: white one.
The national Next Steps team assessed that this was justified – and exaggerated – by
incoming non-resident drug dealers in Boscombe.
z In late 2012, however, the Commission calculated from Dorset’s raw data that black: white
disproportionality had fallen from 5.5 in 2008-09 to 4.4 in 2009-10 and 3.9 in 2010-11,
despite no reduction in Boscombe drug dealers.
z Overall usage also fell from 7048 to 6847 in this period.
z Both usage and disproportionality subsequently rose but not back to previous levels. The
Commission assessed that Next Steps had been thoroughly implemented and underpinned
with training and intensive scrutiny of local unequal race patterns.
The Metropolitan Police
z By autumn 2012 race disproportionality in the London borough of Lewisham, which had
implemented Next Steps, had increased. The explanation given was a new focus, following
public consultation, on gang activity.

7
www.equalityhumanrights.com
z The Commission, however, identified elements present in Dorset ‘Next Steps’ – training,
and the challenging of localities/officers with more racially skewed patterns – that were
not undertaken in Lewisham, and recommended that this be remedied in the next borough
to implement Next Steps.
z Meanwhile, however, the Metropolitan Police introduced a force-wide programme
called StopIt which did include elements of training and scrutiny. Annual black: white
disproportionality fell from 4.0 to 3.7 from 2011/12 to 2012/13 and while the Asian: white
figure rose it stood at parity when re-calculated on the new census population data.
z Usage also fell from around half a million in 2009/10 to around a quarter of a million in
January–September 2012.
West Midlands
z West Midlands Police took concerted action to discourage use of stop and search as a
quantitative performance indicator, and in 2010/11 its usage fell to only 15,000, half the
already modest total in 2007/08.
z Its action on disproportionality was, however, limited, for example training was repeatedly
delayed, albeit on plausible grounds, and effort focused on justifying not challenging
patterns. Race disproportionality did not significantly change over the period.
ConclusionsOverall the Commission concluded that where firm action had been taken to reduce race
disproportionality, and/or overall usage of the power, it had succeeded, without prejudice to
falling crime levels. Key steps taken to reduce disproportionality appeared to be: targets for
reduction, and for reducing negative drug searches; training in ‘reasonable grounds’ for, and
proportionate use of, the power; steps to ensure intelligence-led practice rather than practice
based on ‘hunches’ or generalisations about groups; micro-monitoring to identify local or
individual racially skewed patterns and challenging them; and senior level commitment and
leadership.

8
Stop and think again
Chapter 1: Introduction
In March 2010 the Commission published Stop and think – A critical review of the use of
stop and search powers in England and Wales. While stressing the vital role of the police in
defending rights to liberty and security, the report said:
“The figures are stark: if you are a black person, you are at least six times as likely to be
stopped and searched by the police in England and Wales as a white person. If you are Asian,
you are around twice as likely to be stopped and searched as a white person.”1
The report summarised the context, most notably that stops and searches under section
1 of the Police and Criminal Evidence Act 1984 (‘PACE’) and similar legislation, requiring
‘reasonable grounds for suspicion’ by the officer, amounted to about a million each year,
and at the time, this greatly outnumbered those conducted under blanket authorisations
such as section 44 of the Terrorism Act. The report also examined debates around ‘race
disproportionality’ including various suggested explanations, for example that black people
are generally more involved in crime.
Stop and think set out to examine the source data over the previous five years in the
government’s annual report Statistics on Race and the Criminal Justice System. For each
police force this gives the number of stops and searches for four groups based on ethnic
appearance (including Asian, black and white). When combined with corresponding
population estimates matched to these groups, calculations of race disproportionality can be
made. For example, if a force annually conducts 72 stops and searches for every 1000 of the
black people resident in its area, and 12 for every 1000 of the white people resident in its area,
its black: white disproportionality can be expressed as 72/12 which is six times as many and
hence the disproportionality ratio is 6.0. Stop and think ranked forces according to how high
or low these ratios were, and looked at how consistent these patterns were over time, and how
forces compared over time with ‘families’ of other similar forces.
z Overall the report indicated that:‘Both black/white and Asian/white disproportionality
ratios have remained approximately constant over the last five years if changing population
composition is taken into account.’ 2. Also this was not just a recent phenomenon. ‘Since
1995, per head of population in England and Wales, recorded stops and searches of Asian
1 Stop and think (EHRC 2010), p.5.2 ibid p.46

9
www.equalityhumanrights.com
people have remained between 1.5 and 2.5 times the rate for white people, and for black
people always between 4 and 8 times the rate for white people.’ 3 The big race differences
have therefore been present over a long period.
z There was in each year, however, a very wide variation in these figures, with a considerable
number of forces with negative race disproportionality of less than 1.0 to those with ratios
much higher than the England and Wales figures. Although some forces moved up or
down the ‘table’ over time, there was a striking degree of continuity. Forces in the north of
England – Northumbria, Durham, Cumbria, Cleveland, North Yorkshire and Lancashire
– consistently had low black: white disproportionality ratios, as had Lincolnshire. But
smaller forces in the south such as Dorset and Hampshire, and some midlands forces,
often had the highest rates for this ratio.4 There was also some consistency over time in the
Asian: white disproportionality ratio, with, for example, West Midlands, Thames Valley,
West Mercia and South Yorkshire often ranking highly, and again some far northern forces
featuring amongst those with the lowest figures.5
z Accordingly there were wide ranges between forces placed in the same ‘force families’ by
the Commission, based on HM Inspectorate of Constabulary data on forces classed as
similar enough to be comparators for inspection purposes.6
z In some instances neighbouring forces had wide differences which persisted year after
year, for example – for the black: white ratio – Dorset and Devon and Cornwall, and
Norfolk and Lincolnshire.7
z In London some inner London boroughs such as Wandsworth and Lambeth had relatively
high black:white ratios, while others such as Newham and Southwark were low in this
respect. There was a similar contrast amongst outer London boroughs.8
z At the time of writing Cleveland, Staffordshire and the Metropolitan Police had taken
action to ensure best practice in stop and search and address any inappropriate element
contributing towards race differences, and at that time their race disproportionality figures
had significantly reduced.
3 ibid p.134 ibid Table A12, p.96
5 ibid Table A14, p.100 6 ibid Table A11, p.947 ibid Table A12, p.968 ibid Table A16, pp 104-105

10
Stop and think again
By far the greatest change was in the city of Stoke-on-Trent where they recorded black:
white disproportionality falling from 4.5 to 1.5 between 2003/04 and 2006/07.
This reduced Staffordshire Police’s overall figure from 4.4 to 2.9 in that period.
z The report re-calculated disproportionality ratios on the basis of 2007 population
estimates to compare with the 2001 census figures. It found that in some forces this
notably reduced one or both disproportionality ratios but in others it increased them and,
overall, disproportionality remained a major concern.
z The report concluded that various explanations for disproportionality based on
generalisations about how ethnic minority people act or where they live ‘provide no
justification for the extent and persistence of the problem.’ 9 In particular ‘Strong
differences between similar and/or neighbouring police areas indicate that the way a
particular police force uses its stop and search powers may be more significant than
the nature of the communities it serves.’ 10 The report noted that the belief that black
people are generally more likely to be involved in crime was also not supported by robust
evidence.11
The report said that ‘Following publication we will be contacting several forces who have
demonstrated the most significant and persistent disproportionalities and excesses, with a
view to taking action under the Race Equality Duty, if necessary.’ 12
Action following Stop and thinkFollowing the report the Commission identified five forces whose patterns suggested that
they should be a priority for further inquiry. The criteria for selecting these forces was based
on some or all of the following factors: the extent of race disproportionality, particularly
where this was relatively high regarding either black or Asian people; and/or ‘excess’ stops
and searches, ie the number of stops and searches of black or Asian people in excess of what
it would be if there were no disproportionality. This was a measure which gave weight to the
absolute numbers of ethnic minority people affected by disproportionality, rather than the
degree of disproportionality as such (which can in some forces be high on the basis of very
small numbers). Both ‘disproportionality’ and ‘excess’ figures were considered over time, so
that the direction and extent of any trend was taken into account as well as the current values.
9 ibid p.610 ibid p.611 ibid p.612 ibid p.7

11
www.equalityhumanrights.com
On this basis the Commission wrote to five forces with extensive and searching questions
about their policy and practice. The forces were Dorset, Leicestershire, the Metropolitan
Police, Thames Valley and West Midlands. All five replied in detail and with documentation
by the end of 2010.
The Commission concluded that none of the forces had sufficiently evidenced their claims
that disproportionality arose from demographic or behavioural factors, nor could they define
how much of their force’s disproportionality might stem from these factors. It noted however
that Dorset Police, and the Metropolitan Police in (initially) one London borough, had
responded to the National Police Improvement Agency’s (NPIA’s) general invitation to forces
to implement its ‘Next Steps’ programme for achieving best practice in stop and search.
Next StepsThe Commission had been consulted in 2009 by the National Policing Improvement Agency
(NPIA) when it was designing Next Steps, and all the Commission’s suggested amendments to
the draft plan had been accepted. Elements of that plan included steps to ensure:
z Complete and comprehensive recording of stops and searches by officers, to comply with
legislation and provide better quality data (countering any under-recording of stops and
searches of white people making race disproportionality appear greater than it actually was
– which is an explanation for high rates of disproportionality sometimes advanced).
z Intelligence-based practice, limiting stops and searches to suspects with firmly grounded
suspicion, rather than a ‘scatter gun’ approach based on an officer’s feeling or hunch (to
preclude, for example, racial stereotyping).
z The prohibition and elimination of formal, informal or assumed numerical targets for
stops and searches as a performance measure (which NPIA had some evidence to suggest
could be associated with race disproportionality, though causality was not clear).
z Clear understanding by all officers of what constitutes ‘reasonable grounds for suspicion’
(i.e. behaviour by, or intelligence about, the individual concerned, not for example
generalisations about the likelihood of members of his or her racial group to offend in
general, or to commit specific types of offence in particular).
12
Stop and think again
z Community support for use of the power (for example taking into account the public’s view
on priority offences, and gaining public confidence that the power was being used without
race or other bias).
The Commission had welcomed the fact that the plan stressed that race disproportionality was
a matter of serious concern, that it damaged relations with minority communities, and that
forces needed to be able to account for its use.
Another strength was the very closely defined responsibilities of different officers, from
constables up to the Chief Constable, and of specialist units. For example the plan specified
the inputs required from training departments such as ‘Training – Provide examples of
reasonable suspicion’, and ‘Training lead – Has identified any skills gaps present around the
use of stop and search and has developed packages to meet those needs’.
The Commission therefore decided to take no action with regard to Dorset Police and the
Metropolitan Police so as to test the impact of Next Steps on disproportionality without
influencing the results. It did ask however to be advised periodically of progress.
The remaining forcesWest Midlands Police ultimately detailed an extensive programme to examine the drivers
of disproportionality and to stop the quantity of an officer’s stops and searches being used
as a performance indicator (a step taken in Staffordshire, which may have helped to reduce
disproportionality). The Commission therefore decided to take no further action at that
point with regard to West Midlands Police, to allow its programme to run and be evaluated,
again without influencing the results with Commission input. But again it made clear that it
intended to monitor the force’s progress in implementing its plan.
The Commission initiated formal compliance action with regard to Thames Valley Police
and Leicestershire Constabulary, with a ‘letter before action’ in each case. These cited the
Commission’s belief that the forces’ racially unequal patterns had not been justified and so
constituted indirect racial discrimination which had to be addressed. Both forces proposed
instead a formal agreement under Section 23 of the Equality Act. In such an agreement the
Commission’s belief did not have to be conceded by the force, but the force would undertake
an agreed programme of action to make sure that its practice was free of discrimination.
After negotiation such agreements were reached with both forces in spring 2011, and
committed the forces to:

13
www.equalityhumanrights.com
1. Publish a written policy on stop and search which accorded with the current statutory code
governing use of the power, forbade quantitative targets for numbers of stops and searches,
and included a formal aim of reducing race disproportionality (to replace policies which were
outdated regarding statute, and/or had fallen into disuse).
2. Communicate this policy to all officers.
3. Set and work towards targets for lowered race disproportionality based on levels achieved
by comparable forces.
4. Designate an ACPO rank officer with responsibility for pursuing this.
5. Publish a detailed quarterly statistical report on use of the power, with analysis to identify
where and why race disproportionality was occurring.
6. Discuss with an independent advisory group (IAG) this quarterly report and consider their
feedback at subsequent senior management meetings.
7. Conduct an equality impact assessment on the use of stop and search powers as analysed in
the quarterly reports, each half year.
8. Deliver a training programme on use of the power within the current statutory code, and in
accordance with equality best practice.
In return the Commission agreed not to initiate formal legal action during the term of the
agreements, which was 18 months, so long as the terms were adhered to in that period. A
Commission officer was appointed to scrutinise delivery and advise the forces, and also to
liaise and check developments within a less formal framework with the other three. Progress
in the five forces is covered in turn in the remaining chapters of this report.

14
Stop and think again
Chapter 2: Thames Valley Police
IntroductionThe Chief Constable of Thames Valley Police and the Commission signed the ‘Section
23 agreement’ between their two bodies on 15 March 2011 (see Appendix 1). The terms
committed the force to a programme of action for 18 months, during which time the
Commission would take no formal compliance action so long as it assessed that the force
was delivering the agreed inputs.
The force had been concerned about agreeing to numerical targets for its black: white and
Asian: white disproportionality ratios, based on the lowest rates obtaining within its ‘family
of forces’ (see Chapter 1) due to the likely margin of error in the figures, and the fact that
the ‘family’ group were not similar enough to benefit from comparison. The Commission’s
approach is to use targets as a benchmark, but if they are not met the effort to change practice
to achieve them is equally important.
It was ultimately agreed that the force would work towards aims (the force’s preferred term)
to reduce disproportionality to 3.2 for the black: white ratio and 1.5 for the Asian: white figure,
based on the norms in comparable forces, and based on self-defined ethnicity.
The race disproportionality ratios were necessarily calculated on a different basis from the
figures in Stop and think (4.7 and 2.4) because (i) 2001 census figures were used as a base
since they were broken down to local level, which more recent population estimates were not,
and (ii) they were based on self-classification instead of officer perception, which became
national practice for data after those used in Stop and think.
First stepsOnce the agreement was in place the force set up the machinery for delivery, with a clear lead
from the Chief Constable. Initially:
z A lead Assistant Chief Constable (ACC) was designated, with a full-time Superintendent to
drive the project.
z The force had already produced and distributed a new written policy on stop and search
which clearly ruled out race as a factor in grounds for suspicion other than in a suspect
description, proscribed quantity of stops and searches as a performance measure, and
included an aim of reducing race disproportionality.

15
www.equalityhumanrights.com
z The first quarterly analytical report of stop and search, with breakdowns of race by
numerous variables including local policing areas, for ‘Q1’ (January–March 2011) was
published by the force on 26 May 2011. It provided a benchmark based on the period
immediately before the agreement was signed.
z Terms of reference were drafted for an independent advisory group (IAG) to meet
quarterly to hold the force to account. The group met for the first time on 2 June 2011.
z A ‘Gold Group’ chaired by the Chief Constable was set up to consider each quarterly
analytical report, together with feedback and questions on it from the IAG. Its first meeting
was also in June 2011.
z The force had designed a half day training module on stop and search before the
agreement was signed, whose aim was to reinforce practice that was lawful under both
PACE and the Equality Act. It was delivered between March and July 2011.
The Commission scrutinised the process via correspondence and visits and its role developed
to be advisory as much as supervisory.
DeliveryThe Commission rated the content, delivery and effectiveness of the training module very
highly.
z An effective element to the training was an opening video, where the Chief Constable set
the tone for the training, strongly rejecting any suggestion of discrimination by officers.
This may have helped counter any tendency by trainees to resent, or not wish to commit
to, the training.
z This was further facilitated by the use of a trainer who was both skilled in that role and
with long experience as an operational officer. The course was highly participative, and
one exercise involved trainees pressing yes or no on a keypad on whether a recorded
scenario gave the officers ‘reasonable grounds’ to conduct a search. In most cases the
trainees divided fairly evenly between ‘yes’ and ‘no’, showing that a proportion each time
were prone to conduct searches on insubstantial grounds where ‘hunch’ or generalisations
might creep in. This exercise engendered a positive approach to the rest of the course by
trainees, and clearly achieved the hardest training objective, to influence attitudes.

16
Stop and think again
z The Gold Group and the quarterly senior management meeting considered the quarterly
statistics, feedback from the IAG and reports from the ACC and Superintendent in
depth and at length, and made decisions on direction accordingly. For example, the
Superintendent was directed to determine the reasons for patterns in particular localities
via enquiries or supplementary data. There was a demonstrable determination at the top
to identify any element of disproportionality that did not ‘stand up’, and thereby to reduce
disproportionality.
z The core of the force’s work was visits by the appointed Superintendent to local policing
areas (LPAs) whose high rates of disproportionality was driving the force’s figure, to
challenge the commanders to justify or change this pattern. Commanders were also
encouraged to identify which neighbourhoods or even individuals within their LPA were
particularly contributing to its disproportionality, and to explore at this micro level
whether practice was out of line with comparators and if so to test its justifiability. While
the personal commitment, seniority and ability of the Superintendent were valuable
assets his input was reportedly welcomed rather than resisted by local commanders,
possibly because of the Chief Constable’s clear leadership. There is some indication from
the quarterly reports of high disproportionality in rural areas dropping quickly (based
on small numbers of stop searches) and that a very high figure in an LPA might often be
followed by a significant reduction in the following quarter. For example in the first three
quarters the figure for black people in Bracknell Forest was 3.3, 1.9 and 1.9, and in South
Oxfordshire 6.0, 2.4 and 1.7.
z When the Superintendent retired he was succeeded by a Chief Superintendent with overall
responsibility together with a Sergeant to undertake the crucial visits and contact at
‘ground level’; and it was encouraging that this continued to work effectively.
z The force recruited constructive members to the IAG, for example the chair of Wycombe
Race Equality Council who had a long record of engaging with the issue (and who was
elected chair), a senior local authority councillor from an ethnic minority group, and
prominent members of Jewish, Chinese, gay and other community groups. There were no
young members, and given that most people who are stopped and searched are adolescents
or young adults, efforts were made to address this, but without success. However, a parent
whose teenage children were frequently stopped and searched did join the group and
provided an element of direct experience to the discussions.

17
www.equalityhumanrights.com
z It became apparent at an early stage that the majority of stops and searches were on
suspicion of drug possession, that this category was more racially skewed and resulted in
a lower rate of arrests and detections than stops and searches on any other grounds, and
that this was more marked for black and particularly Asian people searched. Unproductive
drug searches were therefore a significant driver of race disproportionality. While searches
on these grounds were in no way prohibited, guidance to officers to concentrate activity on
force priority offences (ie violent and property crime) was therefore re-emphasised.
OutcomesThe first quarterly analytical report provided by Thames Valley Police for ‘Q1’ (the period
January–March 2011, ie immediately before the agreement) showed that the black: white,
and Asian: white disproportionality ratios based on self-defined ethnicity at 3.5 and 2.5
respectively. The force was therefore already closer than the report had suggested to the aims
of 3.2 and 1.5 agreed in its negotiations with the Commission, before starting to implement
the agreement.
By the end of 2011 (Q4, October–December 2011) disproportionality for the force overall had
fallen further to 3.2 for black: white (meeting the aim) and 2.2 for Asian: white, though falls in
Slough and a number of rural areas were partly offset by a rise to 6.4 and 6.7 in Wycombe, one
of the force’s most racially diverse areas.
By Q6 (April–June 2012) disproportionality overall stood at 3.2 and 1.9, ie still meeting the
aim for the black: white ratio and almost reaching the Asian: white aim. Wycombe’s figures
were down only a little – the commander cited the need to counter ‘gang related violence’ as
one of the drivers for stop and search activity amongst the black and Asian communities in
the area as the reason for this. The Commission recommended the force work to address the
continuing impact in Wycombe of unproductive drug searches on the race disproportionality
figures.
18
Stop and think again
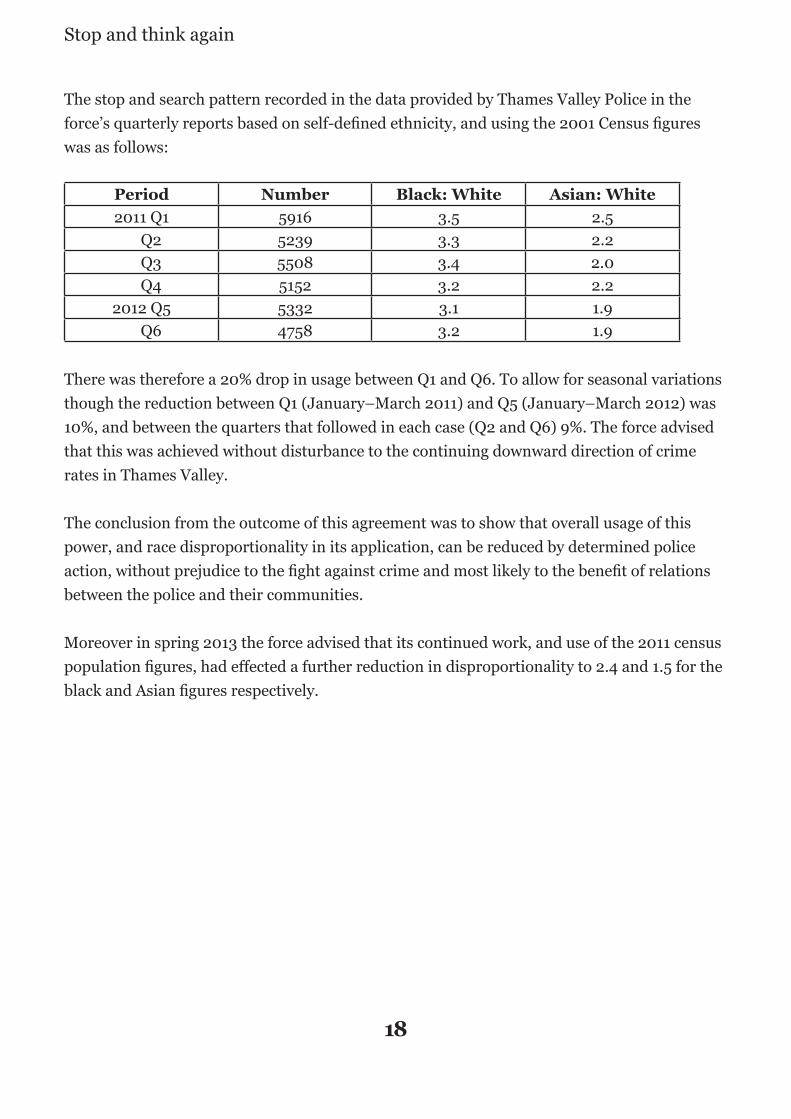
The stop and search pattern recorded in the data provided by Thames Valley Police in the
force’s quarterly reports based on self-defined ethnicity, and using the 2001 Census figures
was as follows:
Period Number Black: White Asian: White
2011 Q1 5916 3.5 2.5
Q2 5239 3.3 2.2
Q3 5508 3.4 2.0
Q4 5152 3.2 2.2
2012 Q5 5332 3.1 1.9
Q6 4758 3.2 1.9
There was therefore a 20% drop in usage between Q1 and Q6. To allow for seasonal variations
though the reduction between Q1 (January–March 2011) and Q5 (January–March 2012) was
10%, and between the quarters that followed in each case (Q2 and Q6) 9%. The force advised
that this was achieved without disturbance to the continuing downward direction of crime
rates in Thames Valley.
The conclusion from the outcome of this agreement was to show that overall usage of this
power, and race disproportionality in its application, can be reduced by determined police
action, without prejudice to the fight against crime and most likely to the benefit of relations
between the police and their communities.
Moreover in spring 2013 the force advised that its continued work, and use of the 2011 census
population figures, had effected a further reduction in disproportionality to 2.4 and 1.5 for the
black and Asian figures respectively.

19
www.equalityhumanrights.com
Chapter 3: Leicestershire Constabulary
IntroductionThe Chief Constable of Leicestershire Constabulary and the Commission signed the ‘Section
23 agreement’ between their two organisations on 15 April 2011 (see Appendix 2). As with
Thames Valley Police, the terms committed the force to a programme of action over 18
months including steps on a new written policy, senior management oversight, ethnic
monitoring/quarterly analysis, accountability to an IAG and officer training. Again the
Commission undertook not to initiate any formal compliance action so long as it assessed
that the force was delivering the agreed inputs, and the same officer as for Thames Valley
was tasked with monitoring this and advising the force.
Leicestershire Constabulary shared Thames Valley’s reservations about the fairness and
appropriateness of numerical targets for its black: white and Asian: white disproportionality
ratios, and the same arguments were exchanged in discussions between the force and the
Commission. Again, after negotiation and clarification of the Commission’s approach to
targets as something to aim for rather than rigid ‘pass marks’, figures of 3.1 and 1.0 were
agreed for black and Asian people respectively. This was based on the norms in comparable
forces, and on self-defined ethnicity.
The race disproportionality ratios were necessarily calculated on a different basis from the
figures in Stop and think (4.7 and 1.5) because (i) 2001 census figures were used as a base
since they broke down to local level which more recent population estimates did not, and (ii)
they were based on self-classification instead of officer perception, which became national
practice for data after those used in Stop and think.
First stepsLeicestershire moved quickly under a newly-appointed Chief Constable to set up the
machinery for delivery. Initially:
z A lead Assistant Chief Constable (ACC) was designated, who also chaired the ‘Gold Group’
of senior colleagues set up to consider each quarterly analytical report, together with
feedback on it and questions from the IAG, and to oversee the project.
z Day-to-day action was the full time responsibility of an Inspector on temporary promotion
to Chief Inspector.

20
Stop and think again
z Revision of the force’s stop and search policy began.
z The first quarterly analytical report of stop and search, with breakdowns of race by
numerous variables including local policing areas, for ‘Q1’ (January–March 2011) was
published by the force on 1 July 2011. As with Thames Valley it provided a benchmark
based on the period immediately before the agreement was signed.
z Terms of reference were drafted for an IAG which first met in July 2011.
z A thorough training needs analysis was initiated to promote the fair, appropriate, lawful
and non-discriminatory use of stop and search.
The Commission scrutinised the process in the same way as in Thames Valley, with
correspondence and visits, and its role developed to be advisory as much as supervisory.
Delivery z The training module was based on extensive needs analysis and the session observed by
the Commission was delivered very effectively by the Acting Chief Inspector co-ordinating
the whole project.
z The Acting Chief Inspector had a teaching qualification as well as much operational
experience which was clearly valuable. Trainees were challenged to feel the experience of
‘someone else’s hands in your pockets’ and so appreciate the dangers of using the power
without reasonable grounds or inconsistently between racial groups. It was stressed that
the quantity of stops and searches was not a performance measure. Another key learning
point was a comparison of trainees’ experience of themselves being ‘pulled over’ by police
officers while driving, the maximum for the group being six times except for the trainer
– who was of mixed race origin – who had experienced this 26 times, while holding the
police advanced driver’s qualification. Later one trainee referred back to the exchange and
queried whether race might have been a factor, sparking a thoughtful discussion. As in
Thames Valley, but by different means, the training visibly succeeded in the very difficult
task of facilitating an examination of attitudes.
z The Gold Group chaired by the ACC was rigorous in assessing statistical analyses, reports
and feedback and making decisions to direct the force’s actions to deliver the agreement.

21
www.equalityhumanrights.com
z Leicestershire came to the same conclusion as Thames Valley about the need to appoint
a full time middle-ranking officer to drive the process day-to-day. The officer worked
closely with local commanders to identify and examine the drivers of disproportionality
in their areas. Subsequently he obtained the ACC’s authorisation to examine the patterns
of ‘prolific users’. Fifty-six such officers were identified who together had conducted a
big proportion of the force’s stops and searches in the period October 2011 to April 2012.
While no ‘rogue officers’ (in the words of a senior officer) were identified, officers stopping
and searching significantly more ethnic minority people than comparable colleagues
were asked to account for this. Explanations had centred on particular or unusual
circumstances, but clearly officers would appreciate that this would not be convincing if
repeated month after month.
z A re-examination of the same 56 officers’ patterns in the next 3-month period (1 May–31
July 2012) revealed that overall usage was considerably reduced (16 did not use the power
at all) and race disproportionality was significantly lower. While stops and searches
conducted by this group of officers of white people had reduced by 46%, those of Asian
people had reduced by 70% and those of black people by 86%. Clearly the force needed to
be confident that these changes of practice were not to the detriment of victims of crime,
and that they were not just a transient phenomenon. To that end the patterns of officers
using the power most prolifically in the next period, May–July 2012, were being examined
as the agreement came to an end in October 2012.
z In May 2012, the Acting Chief Inspector was transferred to operational command duties
and succeeded by a colleague. It was concerning to change personnel three-quarters of the
way through the 18 month agreement but, in the event, a long changeover period, some
subsequent continued input from the original officer and a capable successor ensured that
there were no detectable adverse effects on the process. In particular, it was positive that
the examination of the patterns of ‘prolific users’ was sustained.
z The force recruited effective IAG members. It included the Chief Executive of the Leicester
and Leicestershire Race Equality Centre, a senior local authority councillor from an
ethnic minority background, a former senior office holder in the Metropolitan Black
Police Association, a member of the StopWatch campaigning group who was resident in
Leicester, and local community group representatives, one of whom took the chair. As
with Thames Valley, there was a genuine difficulty in recruiting any younger members. In
addition some members were unable to attend some/many meetings and it appeared that
a commitment on this might usefully be a criterion for appointment.

22
Stop and think again
However there was a core membership whose cohesion and confidence in holding the
force to account clearly increased markedly with experience.
z Leicestershire found that stops and searches on suspicion of possession of small
amounts of drugs for own use was a majority of the total, that this category was more
racially skewed than stops and searches overall, and that it was marked by a lower than
average detection rate. Thus unproductive drug searches were a major driver of race
disproportionality in this police area, as they were in Thames Valley, and the force’s co-
ordinating officer took this message to local commanders heading those areas with the
highest race differences.
OutcomesThe first quarterly analytical report provided by Leicestershire Constabulary (January–
March 2011, or Q1, ie just before the agreement) showed that the black: white and Asian:
white disproportionality ratios were 4.2 and 1.5 respectively. The targets agreed in the force’s
negotiations with the Commission, before starting to implement the agreement, were 3.1 and
1.0.
The force-wide stop and search pattern in the data provided by Leicestershire Constabulary
in the force’s quarterly reports, based on self-defined ethnicity and using the 2001 Census
figures, was as follows:
Period Number Black: White Asian: White
2011 Q1 4183 4.2 1.5
Q2 3187 4.8 1.7
Q3 2495 6.2 2.0
Q4 2343 4.4 1.9
2012 Q5 1757 4.7 2.2
Q6 1660 4.2 1.9
Hence, broadly speaking, race disproportionality rose in 2011 but fell back close to the original
levels in 2012. The rising level in 2011 led the Commission to suggest the engagement of
academics to interrogate the data more deeply to get to the bottom of the causes of the force’s
disproportionality rates. The force agreed to this and engaged a senior team from De Montfort
University, who have been working since late spring 2012 and will report in the first half of
2013.

23
www.equalityhumanrights.com
However, since the end of the project the force has advised that race disproportionality
has fallen further. For the period April to November 2012 they report a black:white
disproportionality figure of 3.9 and an Asian: white figure of 1.7. Moreover when re-calculated
on the basis of the newly available 2011 census population figures they stand lower still at 2.9
and 1.7 respectively.
The figures also show roughly a 50% drop in overall usage of the power, which the force
reports is without interruption to the long downward movement in crime figures in
Leicestershire, and with an increase in detection rates from stops searches. It is consistent
with the training which emphasised that the numbers of stops and searches is not a
performance indicator and that quality not quantity is important. This may have resulted
from a drop in unnecessary or unproductive searches and use of better intelligence to target
the power. It is an important change that stops and searches of black and Asian people have
halved, notwithstanding that the position relative to stops and searches of white people has
fallen only moderately.
Altogether, despite the lack of significant reduction in disproportionality over the engagement
period, the force’s delivery of all agreed inputs, its engagement of academics to diagnose the
pattern further, its commitment to continue the process, and its dramatic reduction in usage
without adverse effects, meant that the Commission was confident in concluding the period of
engagement on the due date. The reduction in disproportionality since then, which can now be
seen as moving downward throughout 2012, suggests that this confidence was not misplaced.

24
Stop and think again
Chapter 4: Dorset Police
IntroductionAccording to Ministry of Justice (MoJ) figures, Dorset Police had the highest black: white
disproportionality in stop and search in England and Wales in all but one year between
2003/04 and 2007/08, rising from 9.5 to 12.5 over that period. It was also in the top quartile
of forces for the Asian: white disproportionality ratio.
When the Stop and think report re-calculated these figures on the basis of 2007 population
estimates rather than 2001 census figures it halved the black: white figure but still left
Dorset very close to the highest figures, and higher than any other similar – i.e. small,
mostly rural forces. The Asian: white figure however fell close to parity (e.g. 1) for every year
from 2003/04 to 2007/08.
The Commission included Dorset among the five forces it wrote to in May 2010 (following
publication of Stop and think) with detailed enquiries on policy and practice. In November
2010 it advised the force it was not considering formal legal compliance action, despite
continued concerns about disproportionality and its degree of justifiability, as the force had
started to implement the Next Steps programme for securing best practice in stop and search.
The Commission therefore decided to assess what impact that programme might have on
race disproportionality without influencing the outcome. The Commission asked to be kept
updated on progress, though clearly scrutiny under such arrangements would not be as close
and detailed as for forces with which the Commission had a formal legal agreement.
DeliveryIn summer 2011 the force provided a detailed response to the Commission’s request for an
update on action taken. It forwarded a summary of a progress report by the NPIA Next Steps
team which confirmed in broad terms the force’s inputs as per the programme’s plan.
The summary also concluded that ‘a focus on disproportionality was unlikely to be productive
for Dorset’. It identified that ‘disproportionality in the use of Stop and Search was driven
primarily by the targeting of black drug dealers operating in Boscombe’ and ‘there was strong
evidence to show that drug dealers not resident in Dorset were targeting Dorset’. This implied
that it was these outsiders who were being stopped and searched and that their presence made
the black population bigger than the official figure, artificially inflating the disproportionality
figure. The Commission queried this, pointing to when its predecessor, the Commission

25
www.equalityhumanrights.com
for Racial Equality (CRE), had checked this assertion by Dorset Police some years earlier.
Then, the CRE had requested a breakdown of stops and searches of black people according
to address, and found that a large majority were of people who had local home addresses.
However, in the more recent case of 2011, the force replied after examining a large sample of
black people who had been stopped and searched. It advised that about half the sample had
given a non-local address and most of the other half had given a temporary address
(e.g. a night shelter) or a local address that proved to be false.
The force advised that at that time (summer 2011) the black: white disproportionality
remained at approximately 6.0. This and subsequent race disproportionality ratios advised
by the force were necessarily calculated on a different basis from the figures in Stop and think
(5.0 and 0.9) because (i) 2001 census figures were used as a base since they were broken down
to local level which more recent population estimates did not, and (ii) they were based on self-
classification instead of officer perception, which became national practice for data after those
used in Stop and think.
The force also advised that the absolute numbers remained very small, that the number of
individuals stopped and searched was smaller still (because of repeat searches of certain
suspects) and that arrest rates were well above the national average. The outcome of an action
named ‘Operation Volante’ had been to remove ‘some of our most prolific and dangerous
criminals’ but:
“Predictably, the vacuum has now been filled by other criminal groups (particularly one of
Somali origin). Consequently it would be no surprise were statistical disproportionality to rise
once again, which reinforces our view that to overly focus on disproportionality data is too
simplistic an approach.”
The Commission visited the force towards the end of 2011.
OutcomesUsing information from correspondence and the visit the Commission concluded that:
z The force showed very effective implementation of all the inputs set out in Next Steps, for
example:
- repeated reinforcement of the message about the need to eliminate quantitative targets
- use of the national ‘S-bar’ system whereby the photographs and details of suspects
identified from reliable intelligence are conveyed to officers at ‘parades’ (i.e. briefings

26
Stop and think again
when going on duty) to enable stop and search to be focused where it is justifiable
- refresher training on ‘reasonable grounds’ and the proper conduct and recording of
searches
- underpinning of these steps with the development of a software package called
Searchlight to identify localities, beats and individuals with racially skewed patterns,
which had been used to challenge and hold to account those who appeared to be ‘outliers’.
z The overall usage of the power had fallen by 20% since the beginning of the Next Steps
programme.
z From data provided by the force, based on self-defined ethnicity, according to the
Commission’s calculation in the first half of 2011, the black: white disproportionality ratio
was 3.6, ie a significant reduction. If those people that the force had identified as being
‘non-resident in Dorset’ were excluded the rate fell to 2.6. Since this factor appeared to
account for only a third of race disproportionality, not most or all of it as the force had
believed, the bigger part of the reduction in disproportionality seemed likely to have
resulted from the implementation of Next Steps.
z It appeared unlikely that a major factor in this reduction was the comparative reduction
in the number of black drug dealers from East Bournemouth/Boscombe since on the then
Chief Constable’s own account above, this had not been effective.
The variation over time annually in use of the power and of black: white disproportionality,
from data provided by the force, based on self-defined ethnicity, and using the 2001 Census
figures has been as follows:
Period Total Stops and Searches Black: White
2007/08 7814 5.0
2008/09 7048 5.5
2009/10 6612 4.4
2010/11 6847 3.9
2011/12 7017 4.3
Regarding overall usage, it can be seen that the first year of Next Steps (2011/12) saw a small
rise compared with the year before, but the figure was still 10% down from 2007/08.

27
www.equalityhumanrights.com
The black: white disproportionality figures for the two most recent years above were advised
by the force in autumn 2012, when it was confirmed also that the figure for Asian: white
disproportionality remained slightly below 1.
The upturn in the black: white figure in 2011/12 was attributed to the incursion of new gangs
into Boscombe (to succeed the earlier ones removed by police operations) which might
appear to suggest, however, that stop and search has provided a temporary rather than
permanent solution. About half the force’s total of stops and searches are on suspicion of
drug possession and the Commission has suggested the force might try to distinguish between
suspicion of ‘possession for own use’ and ‘possession with intent to supply’ – and whether
the former category has, as elsewhere, a low detection rate and an effect of inflating the
disproportionality.
It is noticeable that the upturn was in the period when Next Steps was no longer in its initial
implementation phase, though the force insists that the resultant improved practice has not
regressed. Nevertheless, the force’s contention that the rise in disproportionality is totally due
to a justified renewal of drug supply targeting needs to be tested, and the Commission has also
suggested reconsideration of a stop search centred strategy which does not appear to reduce
the offending. In that context it is notable that the force has succeeded in excluding some
convicted offenders from the area via ASBO conditions.
Overall, however, it is the case that the force rigorously implemented Next Steps, including
training and underpinned with Searchlight, and its black: white disproportionality is below
the level that consistently applied beforehand. Also, usage of the power, although recently
increased, is still below former levels. While cause and effect are not established, it remains
crucial that the force should continue carefully to manage the use of the power and strive to
eliminate any element of race disproportionality that it cannot evidentially justify.

28
Stop and think again
Chapter 5: The Metropolitan Police Service
IntroductionStop and think recorded that from 2003–08 the black: white figure for ‘London’ (the
Metropolitan Police Service (MPS) plus the very much smaller City of London force) was
between 4.4 and 4.8, with the Asian: white figure around 1.4. This was about the middle of the
range of all forces, and of other large metropolitan forces, and lower than the overall England
and Wales figure. However, the fact that the MPS has consistently conducted about half of the
roughly one million PACE and similar stops and searches in England and Wales, and has the
greatest concentration of ethnic minority people in its population, means that it carries out
the majority of all stops and searches of black and Asian people. Disproportionality figures
for England and Wales of around 6.0 and 2.0 reduce to circa 2.5 and 1.5 for black and Asian
people respectively if London is excluded.
The MPS also stood out with regard to a measure used in Stop and think called ‘excess stop
searches’. This measures the numerical impact of disproportionality by identifying the
number of stops and searches of black and Asian people in excess of what the number would
be if the pattern were proportionate. The figure for London each year is more than 100,000,
out of the figure for England and Wales of around 150,000.
In spite of these factors the MPS was cited as a good practice example in Stop and think
because of its ‘Operation Pennant’ system from 2006 of centrally challenging race
disproportionality. This appeared particularly to reduce the very high disproportionalities
(based on low numbers) in some outer boroughs, although it appeared not to impact on
the high disproportionalities in some inner boroughs (e.g. Wandsworth and Kensington &
Chelsea) compared with low levels in others (e.g. Newham and Southwark). From 2006 to
2008 the MPS-wide figures fell slightly but then flattened out, and the Commission felt it was
important to identify how Operation Pennant was continuing to be applied.
The Commission wrote to the MPS in November 2010 to advise that it was not considering
formal legal compliance action, despite concerns about disproportionality. As the force
had started to implement the Next Steps programme for securing best practice in stop and
search, in one borough, Lewisham, the Commission wanted to be able to assess what impact
if any that programme might have on race disproportionality without obscuring this effect by
inducing other changes. It asked to be kept updated on progress, which was then mainly done
through approximately quarterly meetings.

29
www.equalityhumanrights.com
Delivery and outcomes of Next StepsNext Steps was implemented as a pilot throughout the Lewisham command unit in the second
half of 2011. Reports shared with the Commission highlighted steps towards intelligence-led
practice via the ‘S-bar’ system, constant reinforcement of the policy ruling out quantitative
performance targets, and public consultation which had led to a re-focusing of stop and search
away from drug possession towards ‘gangs’.
Reports provided by MPS showed that there had been an increase in race disproportionality
in the initial months (it was argued that this was because identified gang members were
predominantly black) but there was a return to previous levels by the end of the year. The
MPS also provided some statistical analysis suggesting that the focus on young people
contributed to the disproportionality, but no quantification of this or consideration of its
justifiability. The MPS also provided a list of 194 individuals identified as gang members,
almost all of whom were black, but no indication of what proportion they formed of the circa
1100 stops and searches per month. There was also no clear account of what was achieved by
stopping and searching (presumably repeatedly) these same individuals, nor consideration
of whether being on a police list of gang members always amounts to ‘reasonable grounds for
suspicion’ for lawfully stopping and searching that person.
The Commission visited Lewisham in January 2012 to clarify exactly what had been included
in the implementation of Next Steps. In February a letter was sent to the MPS identifying the
components that appeared not to have featured in Lewisham, compared with Dorset (where
reductions in disproportionality did occur at the end of the initial implementation) viz the
Commission understood there had been no:
z refresher training of officers on ‘reasonable grounds’ and the proper use and conduct of
stops and searches, and training of sergeants and inspectors in quality control
z steps to ensure full and comprehensive recording
z safeguards to ensure that inclusion on the ‘S-bar’ database, ie as a suspect, must (as
statutorily required) be based on intelligence about current offending, not past offending
record.
z underpinning by a system such as Searchlight to identify the drivers of race
disproportionality to ensure that practice was either justified or amended.
30
Stop and think again
The Commission recommended that these actions should be included in the implementation
of Next Steps that was due to start in a second borough, Ealing, in March 2012.
All officers in Ealing subsequently underwent a training module on what constitutes
‘reasonable grounds’, and on the need to apply this fairly and consistently. Training broadly
on these lines also took place in Lewisham in 2012.
The new Superintendent leading on stop and search gave the Commission an unequivocal
assurance that suspects were never included on S-bar because of past record, but solely
because of intelligence on current activity.
The MPS also published monthly borough statistics, which showed a slight drop in overall
usage of the power and race disproportionality in Lewisham and Ealing in the first four
months of 2012. It seemed however that if this was a result of Next Steps it was a rather
delayed effect in Lewisham, and a very early outcome in Ealing where action started only in
March. In fact the pattern was common to a majority of boroughs, and it appeared more likely
that it was a consequence of another and force-wide programme, reported in the press in
January 2012, named ‘StopIt’.
StopItIn a press article in January 201213 the force’s new Commissioner reportedly expressed
concern at the fall in the arrest rate from stop and search (historically at around 12–13% in
most forces) to only 5%. He was also said to have referred to perceptions that stop and search
practices may have alienated some sections of the population, finding expression in the riots
of August 2011. Accordingly a new approach to stop and search within the MPS was made
public on 2 February, known unofficially as StopIt. StopIt largely concerned ‘Section 60’ stops
and searches,14 but provisions affecting ‘reasonable grounds’ stop searches included:
z management action to secure full and accurate recording;
z a shift to intelligence-based use of the power, with comprehensive use of the S-bar system
of identifying suspects to officers based on intelligence, to discourage arbitrary use of the
power (see Chapter 4 above);
13 London Evening Standard, 12 January 2012.14 Ie under the Public Order Act, requiring central authorisation for a specific geographical area and time, but not ‘ reasonable grounds’ by officers for each individual case.
31
www.equalityhumanrights.com
z training on ‘reasonable grounds’ and the proper use and conduct of stops and searches15;
z emphasis on searching where there are grounds to suspect possession of weapons, with an
aim of increasing these to 20% of the total;
z a target of reducing negative drug searches by 50%.
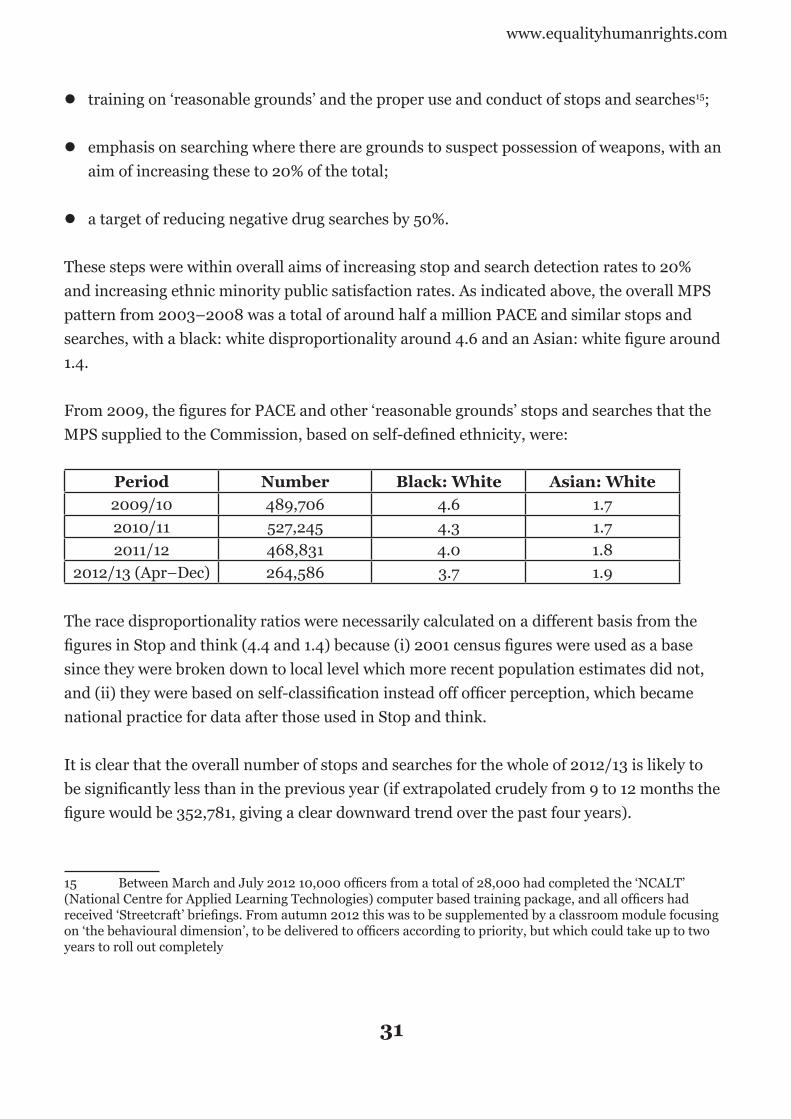
These steps were within overall aims of increasing stop and search detection rates to 20%
and increasing ethnic minority public satisfaction rates. As indicated above, the overall MPS
pattern from 2003–2008 was a total of around half a million PACE and similar stops and
searches, with a black: white disproportionality around 4.6 and an Asian: white figure around
1.4.
From 2009, the figures for PACE and other ‘reasonable grounds’ stops and searches that the
MPS supplied to the Commission, based on self-defined ethnicity, were:
Period Number Black: White Asian: White
2009/10 489,706 4.6 1.7
2010/11 527,245 4.3 1.7
2011/12 468,831 4.0 1.8
2012/13 (Apr–Dec) 264,586 3.7 1.9
The race disproportionality ratios were necessarily calculated on a different basis from the
figures in Stop and think (4.4 and 1.4) because (i) 2001 census figures were used as a base
since they were broken down to local level which more recent population estimates did not,
and (ii) they were based on self-classification instead off officer perception, which became
national practice for data after those used in Stop and think.
It is clear that the overall number of stops and searches for the whole of 2012/13 is likely to
be significantly less than in the previous year (if extrapolated crudely from 9 to 12 months the
figure would be 352,781, giving a clear downward trend over the past four years).
15 Between March and July 2012 10,000 officers from a total of 28,000 had completed the ‘NCALT’ (National Centre for Applied Learning Technologies) computer based training package, and all officers had received ‘Streetcraft’ briefings. From autumn 2012 this was to be supplemented by a classroom module focusing on ‘the behavioural dimension’, to be delivered to officers according to priority, but which could take up to two years to roll out completely

32
Stop and think again
A downward progression is also discernible in the black: white disproportionality figure;
and while this does not appear to be true of the Asian: white ratio, when this is recalculated
on the basis of 2011 census figures it is consistently around parity over the four years (the
corresponding black: white figure falls from 2.7 to 2.5 over the four years).
It is too early to judge the impact of StopIt on race disproportionality and overall usage of the
power, but the programme contains several elements that the Commission would commend,
and during the period of its operation the downward direction in both has continued.
It has been suggested that if a reduction in the use of stop and search is happening this may
only be a displacement into ‘stop and accounts’ i.e. where an officer asks someone to account
for their presence or movements but has any suspicions allayed so does not proceed to a
search. If this were the case, however, it would clearly still represent some movement forward
towards less intrusive policing, so long as the total of stops (i.e. stops and searches plus stop
and accounts) had not increased. It would suggest that some encounters which previously
would have been immediate searches, or which would have proceeded to a search, are now
being limited to verbal exchanges.
The MPS total of ‘stop and accounts’ was approximately 800,000 in 2009/10 and 2010/11,
falling to roughly 500,000 in 2011/12 and slightly less pro rata in 2012/13 (i.e. about 250,000
in the seven months). Within these annual totals the MPS’s published monthly totals show
variations up and down but an overall reduction from 56,636 in October 2011 to 35,902 in
October 2012. It appears therefore that in the MPS area, which has provided a very large
component of the England and Wales total, stop and accounts have fallen faster than stops
and searches. The degree of race disproportionality has also not significantly changed,
altogether suggesting no element of ‘displacement’.
The figures for stop and account raise another important issue, however. In the short
period when national figures were published it was notable that race disproportionality was
significantly lower for stop and account than for stop and search (e.g. about 2 for black: white
compared with about 6). One difference is that stop and accounts are conducted by PCSOs
(Police Community Support Officers) as well as sworn officers, whereas stops and searches
are conducted by the latter group only. One reason for this difference therefore could be that
the race disproportionality for officer-conducted stop and accounts is higher than for PCSO-
conducted ones. At the Commission’s request the MPS explored this, and confirmed that
there was a small but significant difference (2.0 for the black white ratio for sworn officers
compared with 1.7 for PCSOs).

33
www.equalityhumanrights.com
The Commission would therefore recommend further study to determine why practice differs
and what if any elements of PCSO practice leading to lower disproportionality would be
appropriate for sworn officers to follow.
Finally, another difference that emerges from the MPS’s transparency of data is a geographical
one. Consistently over time the boroughs with notably high black: white disproportionality
have included the inner south-west London boroughs of Kensington & Chelsea, Hammersmith
& Fulham and Wandsworth, and the adjoining outer south-west boroughs of Kingston and
Richmond. By contrast, consistently low ratios have applied to Newham and Southwark in
the inner east/south-east, and to a lesser extent to Newham’s westward neighbours Hackney,
Islington and Haringey and the outer boroughs beyond them. (The new census data do not
change this relative position: while reductions apply across London, the six boroughs with
black: white disproportionality that remains above 4 include these five listed above).
Operation Pennant has continued to operate and within that mechanism it appears that
Borough commanders often explain high disproportionality by local factors,
e.g. a concentration of colleges in Kingston attended by many black students from
outside that borough which – because of their age profile – therefore exaggerates the true
disproportionality. The Commission has suggested both a quantitative testing of such claims,
and a more holistic approach which asks why the south-west quadrant of London should
display the pattern that it does.
Further detailed examination of the patterns could find out what drives these differences and
the outcome can be built into StopIt to increase its effectiveness.

34
Stop and think again
Chapter 6: West Midlands Police
IntroductionStop and think recorded that West Midlands Police’s (WMP’s) race disproportionality figures
for black and for Asian people, according to Ministry of Justice reports, rose over four years to
stand at 6.0 and 2.8 respectively in 2007/08. Both figures were the highest amongst the five
large metropolitan forces and when re-calculated on the basis of recent population estimates
did not significantly reduce (as in some forces) but stood at 5.3 and 2.7 respectively, which
placed the force at third and first place respectively in England and Wales. The force also had
the highest number after London of ‘excess’ stops and searches for both groups.
The Commission included the force among the five that it wrote to in May 2010 with detailed
enquiries. On receiving replies from WMP the Commission wrote requesting clarification on a
number of points, and ultimately received clarifications which indicated that:
z The previous stop and search policy, which implied that race could be a factor in an
officer’s suspicions, was succeeded by one making no references to race.
z No examples of guidance to officers were provided by WMP and no equality impact
assessment provided beyond an initial screening document.
z The justification of disproportionality that ethnic minority people committed more crime
was conceded by WMP not to be true for Asian people (albeit that this did not apply to the
force’s data regarding black people).
z WMP justified disproportionate stops because ethnic minority people were also
disproportionately victims of crime, defending this by arguing that it illustrated the
pervasive nature of disproportionality. This did not explain why those more victimised
should be stopped and searched more.

35
www.equalityhumanrights.com
First stepsThe force also at the same time, and on its own initiative, reported to the Commission
the initial actions it had now undertaken within a programme to address the issue of race
disproportionality in stop and search. It:
z Provided an age analysis showing that two-thirds of those stopped and searched were aged
15–29, and said that this group had a higher ethnic minority proportion than the whole
population. Hence if age was factored in disproportionality would be lower.
z Provided a geographical analysis showing that two-thirds of all stops and searches were
conducted in Birmingham whose ethnic minority population was 33%, compared with 23%
for the WMP area as a whole. This focus was justified by the concentration of offending
in Birmingham, and the practice – known as ‘hotspotting’ – contributed to apparent
disproportionality. The force calculated the ‘Birmingham effect’ accounted for a third of
race disproportionality (though the Commission’s calculations from the data made it 5%
for black: white disproportionality and 30% for Asian: white).
z Undertook that training on the fair and proportionate use of stop and search would
be combined with technical training on the use of the ‘Airwave’ electronic hand-held
recording device when this was introduced, which was anticipated to be in a few months
(when trials in another force were complete).
z Advised that in the first 10 months of 2010/11 race disproportionality, based on self-
defined ethnicity, had fallen significantly to 3.3 for black people and 1.8 for Asian people,
compared with white people. The race disproportionality ratios were necessarily calculated
on a different basis from the figures in Stop and think (5.3 and 2.7) because (i) 2001
census figures were used as a base since they were broken down to local level which more
recent population estimates did not, and (ii) they were based on self-classification instead
off officer perception, which became national practice for data after those used in Stop
and think. However these figures excluded ‘non-geographically attributed’ stops and
searches (ie those conducted by force-wide specialist units) which they advised could only
practicably be included once Airwave was in operation.

36
Stop and think again
z Advised that overall use of the power had fallen from (approximately in each case)
31,000 in 2007/08 to 29,000 in 2008/09 to 24,000 in the first 10 months of 2009/10.
Hence fewer people of all racial groups were now subjected to the power. These totals
were notably very low, being similar to those in many shire forces with much smaller
populations. The levels may have been a result of a sustained message from the Chief
Constable that stop and search was not to be used as a quantitative performance indicator.
In the light of these positive indications, and subsequent assurances on further analysis,
training and policy development, the Commission confirmed that it would not proceed
with compliance action but would scrutinise the force’s progress. It also meant that the
Commission would be able to compare the effectiveness of different types of relationship
with forces for progressing the issues.
DeliverySoon after this, in summer 2011, the force wrote to the Commission to advise that, based on
self-defined ethnicity, race disproportionality for 2010/11 overall, had been 4.6 for black:
white and 2.5 for the Asian: white figure, somewhat higher than the figures for the first 10
months of 2010/11 previously advised.
However, at the end of the year further progress was queried and in spring 2012 the force
wrote to advise that:
z disproportionality for 2010/11, based on self-defined ethnicity, had in fact been 3.8 and 1.7
z overall usage in the same year had fallen still further to circa 15,000, though there was
concern that this might be an excessive fall because of rising crime levels
z a new stop and search policy would shortly be ready for publication
z training would be ‘early in the new performance year’ which the Commission understood
to mean imminently
z a community scrutiny panel had been trialled in Coventry and would be rolled out across
the force area.
WMP then followed this up with quarterly ethnic monitoring figures for 2011/12 which they
referred to as an improvement but which suggested that the annual total would be higher

37
www.equalityhumanrights.com
than the previous year. The Commission visited in order to explore the various conflicting
figures provided for 2010/11 to understand why different figures had been provided, and also
to examine the 2011/12 figures in detail together with the actual timetable for training and
publishing a new policy.
OutcomesUltimately, WMP has advised the Commission that its definitive figures for race
disproportionality, based on 2009 population estimates and self-defined ethnicity, were:
Period Black: White Asian: White
2010/11 4.4 2.7
2011/12 4.9 2.7
2012/13 4.4 2.5
WMP also reported:
z The concentration of two-thirds of all stops and searches in Birmingham had been reduced
to constitute about a half, which was more likely to be justifiable as being in line with
the proportion of the WMP area’s crime that takes place in the city. (It had not however
resulted in reduced race disproportionality across the force area, as might have been
expected from the ‘hotspotting’ explanation.)
z The Airwave recording system had an imminent start date for ‘roll out’ to successive
officers and their training would be tied to this and the whole programme could take up to
a year. No syllabus was, however, provided as requested.
z The new stop and search policy had been launched and was provided.
z The force’s new policy on ‘hotspotting’ was to focus operational activity on geographical
areas where indices of deprivation were highest instead of where recorded crime was
highest, ie a straightforward focus on poorer people.
z Annual usage of the power had fallen further still to 20,000 in the past year and the force’s
previous concerns were allayed by a return to falling crime levels.
z When the race disproportionality ratios for 2012/13 (see table above) were re-calculated by
the force on the basis of 2011 census population data they reduced from 4.4 and 2.5 to 3.0
and 1.9 respectively. As in other forces it is welcome that some of the disproportionality

38
Stop and think again
can now be attributed to population change, but it remains the case that levels of
disproportionality did not significantly change over the period 2010/11 to 2012/13.
ConclusionsThe Commission was concerned to see that the new stop and search policy reverted to the
formula (reflecting statutory ‘PACE Code’ guidance before 2009 but then changed) that race
and similar factors could not constitute ‘reasonable grounds for suspicion’ alone, implying
that they could count if there were also other grounds. The force subsequently assured the
Commission that this was changed to reflect the current PACE Code.
The Commission warned that the new criterion for hotspotting based on deprivation indices
could be even more indirectly discriminatory than that of recorded crime levels and should
be reviewed. The force replied that ‘The fact we are working on agreed areas with partner
agencies I would hope would counter the inequalities challenge’. While West Midlands Police
was not responsible for the delay in the introduction of Airwave, and the impact this had on
their training, their case suggests that where strong leadership was applied, on overall usage
results ensued, but where a strong proactive strategy has not been applied to address race
disproportionality significant change has not occurred.

39
www.equalityhumanrights.com
Chapter 7: Conclusions
z One of the Commission’s conclusions from this exercise is that the overall usage of stop
and search may be greatly reduced (for example halved) without slowing the general
downward direction in recorded crime.16
z In all five police forces during the course of the Commission’s study, this reduction
has followed firm action to prohibit the use of stop and search as a formal or informal
quantitative performance indicator.
z In all five police forces the rate of detections and arrests resulting from stops and
searches (the ‘hit rate’) has risen. This suggests that the marginal ones, based on the least
substantial grounds, have been the ones no longer undertaken, and the ones with firmer
grounds have been the ones to continue. In some police force areas, though not all, this
process appears to have resulted also in a reduction in race disproportionality.
z The evidence from the Metropolitan Police Service has been that reductions in stops and
searches have not been a ‘displacement’ into stops and accounts, since recorded numbers
of these have declined at the same time.
z Race disproportionality is not a ‘constant’, or a ‘given’, or something made inevitable by
the conduct or circumstances of ethnic minority people, but something that can be reduced
by police action without prejudice to policing or crime reduction.
z Key steps taken by forces (Dorset, Leicestershire, Thames Valley and the Metropolitan
Police) that reduced race disproportionality were variously:
- targets for reduction
- steps to ensure full and complete recording
- training in ‘reasonable grounds’ and lawful and proportionate use
- the elimination of quantitative performance measures in use of the power
- promoting ‘intelligence led’ use, and prohibiting practice based on ‘hunches’ or
generalisations about groups, in written and oral guidance (for example at ‘parades’ at the
start of duty shifts)
- reduction in the number of negative drug searches, via a target and/or guidance
16 https://www.gov.uk/government/publications/criminal-justice-statistics--2

40
Stop and think again
- micro-monitoring to identify those ‘outlier’ areas and individuals with skewed race
distributions which are driving overall disproportionality, to challenge them to account
for their patterns
- an external reference group of constructively critical members
- examination of patterns over time and hold the force to account
- a written policy which reflects the above principles and practice
- an ACPO rank officer with overall responsibility for the ongoing
programme and a middle-ranking officer to secure day to day delivery
- senior level commitment and leadership to underpin the programme.
z Next Steps served to deliver this agenda more effectively when it included or was
underpinned by more of these elements, eg training and ‘outlier scrutiny’, than when
it had fewer.
z Albeit on a limited sample of five forces, the degree of change appeared to be associated
with the degree of Commission oversight and involvement.
After some decades of debate about race differences in stop and search, and many attempts
to establish the causes one way or another, the Commission’s project provides a pragmatic
programme with positive measurable results which it commends to the police service. It will
continue to track progress in the forces whose action is covered in this report and to engage
with them and further forces if and as appropriate.

41
www.equalityhumanrights.com
Ap
pe
nd
ix 1
Agr
eem
ent
bet
wee
n T
ham
es V
alle
y P
olic
e an
d t
he
Equ
alit
y an
d H
um
an R
igh
ts C
omm
issi
on u
nd
er S
ecti
on 2
3, E
qual
ity
Act
20
10 Act
ion
s to
be
ta
ke
n b
y T
ha
me
s V
all
ey
Po
lice
1
To
spec
ify
in w
riti
ng
in a
pol
icy
stat
emen
t th
e cr
iter
ia t
hat
are
to
be u
sed
in a
ll c
ases
by
offi
cers
of
the
Th
ames
Val
ley
Pol
ice
For
ce in
exe
rcis
ing
S an
d S
pow
ers
that
con
form
s p
reci
sely
to
an u
p-t
o-d
ate
Pol
ice
and
Cri
min
al
Evi
den
ce A
ct 1
98
4 C
ode
of P
ract
ice
A.
Tim
esc
ale
: fr
om
co
mm
en
cem
en
t d
ate
of
ag
ree
me
nt.
2
To
incl
ud
e in
su
ch a
pol
icy
the
adop
tion
of
a sp
ecifi
c fo
rmal
aim
of
red
uci
ng
race
dis
pro
por
tion
alit
y in
th
e u
se o
f
stop
an
d s
earc
h.
Tim
esc
ale
: fr
om
co
mm
en
cem
en
t d
ate
of
ag
ree
me
nt.
3
To
set
and
aim
to
mee
t th
e fo
llow
ing
targ
et:
Th
e n
um
ber
of s
earc
hes
per
10
00
bla
ck p
eop
le f
or e
very
sea
rch
per
10
00
wh
ite
peo
ple
sh
ould
not
exc
eed
3.2
Th
e n
um
ber
of s
earc
hes
per
10
00
Asi
an p
eop
le f
or e
very
sea
rch
per
10
00
wh
ite
peo
ple
sh
ould
not
exc
eed
1.5
Th
ese
are
to b
e m
easu
red
by
self
-defi
ned
eth
nic
ity
usi
ng
stop
s an
d s
earc
hes
of
per
son
s u
nd
er t
he
S an
d S
pow
ers.
Th
e ca
lcu
lati
on w
ill e
xclu
de
thos
e w
ho
self
-defi
ne
thei
r et
hn
icit
y as
:
Wh
ite
and
Bla
ck C
arib
bean
Wh
ite
and
Bla
ck A
fric
an
Wh
ite
and
Asi
an
Th
e p
opu
lati
on d
ata
to b
e u
sed
is t
he
2011
Cen
sus
resu
lts,
or
if t
hos
e ar
e n
ot a
vail
able
th
e P
opu
lati
on E
stim
ates
by
Eth
nic
Gro
up
as
pu
blis
hed
by
the
Offi
ce f
or N
atio
nal
Sta
tist
ics.
Tim
esc
ale
: th
e t
arg
ets
wil
l re
late
to
th
e fi
na
l 12
mo
nth
pe
rio
d o
f th
is 1
8 m
on
th a
gre
em
en
t.

42
Stop and think again
4
To
des
ign
ate
an A
PC
O r
ank
offi
cer
to b
e re
spon
sibl
e fo
r th
e fo
rce
ach
ievi
ng
the
abov
e ob
ject
ive.
Tim
esc
ale
: fr
om
co
mm
en
cem
en
t d
ate
of
ag
ree
me
nt.
5
To
mon
itor
eve
ry t
hre
e m
onth
s th
e u
se o
f S
and
S p
ower
s w
ith
in t
he
area
of
Th
ames
Val
ley
and
to
anal
yse
the
pro
du
ct o
f th
at m
onit
orin
g by
:
• R
easo
ns
give
n f
or e
ach
su
ch u
se
• R
efer
ence
to
the
spec
ific
loca
tion
• T
he
tim
e of
day
• T
he
gen
der
an
d e
thn
icit
y of
th
e of
fice
r u
sin
g th
e p
ower
• T
he
gen
der
an
d e
thn
icit
y of
th
e p
erso
n w
ho
is s
top
ped
or
wh
ose
veh
icle
is s
top
ped
• W
hat
was
fou
nd
• W
het
her
an
y ar
rest
fol
low
ed a
s a
dir
ect
resu
lt o
f th
e u
se o
f S
and
S p
ower
, an
d (
if s
o) t
he
clas
s of
cri
min
al
acti
vity
to
wh
ich
th
e ar
rest
rel
ated
(e.
g. c
lass
A d
rugs
, bu
rgla
ry, o
ffen
ce a
gain
st t
he
per
son
)
• C
omp
aris
on w
ith
th
e ge
nd
er a
nd
eth
nic
ity
of t
he
per
son
s ar
rest
ed (
wit
hou
t u
se o
f su
ch p
ower
s) in
th
e sa
me
area
ove
r th
e sa
me
per
iod
, an
d
• Id
enti
fyin
g al
l an
d a
ny
dis
pro
por
tion
alit
y in
th
e u
se o
f S
and
S p
ower
s ov
er s
uch
a p
erio
d, a
nd
th
e ca
use
s of
such
ou
tcom
e.
Tim
esc
ale
: th
ree
mo
nth
s a
fte
r th
e c
om
me
nce
me
nt
of
the
ag
ree
me
nt
an
d t
he
n q
ua
rte
rly.
6
To
reco
rd c
entr
ally
all
com
pla
ints
(w
ith
in t
he
mea
nin
g of
Sec
tion
12
of t
he
Pol
ice
Ref
orm
Act
20
02)
abo
ut
the
use
of
S an
d S
pow
ers,
wh
eth
er m
ade
oral
ly o
r in
wri
tin
g or
by
elec
tron
ic m
ean
s an
d t
o fo
llow
up
su
ch c
omp
lain
ts
by id
enti
fyin
g w
het
her
su
ffici
ent
and
rea
son
able
gro
un
ds
exis
ted
for
th
e u
se o
f th
e p
ower
. An
y co
mp
lain
t w
her
e
raci
al d
iscr
imin
atio
n is
all
eged
, su
gges
ted
, or
app
aren
t on
a p
reli
min
ary
revi
ew c
ond
uct
ed b
y an
In
spec
tor,
wil
l
be f
orm
ally
inve
stig
ated
wit
h a
vie
w t
o id
enti
fyin
g w
het
her
rac
ial d
iscr
imin
atio
n w
as a
fac
tor.
Mon
itor
ing
wil
l be
un
der
take
n t
o id
enti
fy a
ny
sign
ifica
nt
pat
tern
s or
tre
nd
s.
Tim
esc
ale
: a
ll c
om
pla
ints
ma
de
on
or
aft
er
the
co
mm
en
cem
en
t o
f th
is a
gre
em
en
t.

43
www.equalityhumanrights.com
7
To
add
ress
an
y ca
se in
wh
ich
a p
erso
n o
r ve
hic
le h
as b
een
sto
pp
ed a
nd
sea
rch
ed w
her
e it
is n
ot e
nti
rely
cle
ar t
hat
the
stop
an
d s
earc
h w
as in
acc
ord
ance
wit
h t
he
S an
d S
pow
ers
and
th
e P
AC
E C
ode
A.
Tim
esc
ale
: fr
om
co
mm
en
cem
en
t d
ate
of
ag
ree
me
nt
an
d o
ng
oin
g o
n a
ca
se b
y ca
se b
asi
s a
s
req
uir
ed
; a
nd
qu
art
erl
y a
s p
art
of
dip
sa
mp
lin
g f
or
the
pu
rpo
se o
f ce
ntr
al
mo
nit
ori
ng
.
8
To
dis
cuss
wit
h a
rep
rese
nta
tive
gro
up
of
stak
ehol
der
s a
pu
blis
hed
rep
ort
of t
he
outc
ome
of t
he
mon
itor
ing
and
anal
ysis
ref
erre
d t
o at
Poi
nt
5 an
d t
o re
cord
th
eir
view
s on
th
e im
pac
t of
th
e u
se o
f S
and
S p
ower
s on
th
e lo
cal
com
mu
nit
y.
Tim
esc
ale
: re
po
rt t
o b
e p
ub
lish
ed
wit
hin
on
e m
on
th o
f th
e e
nd
of
ea
ch q
ua
rte
rly
pe
rio
d a
nd
th
e
dis
cuss
ion
to
ta
ke
pla
ce w
ith
in o
ne
mo
nth
of
pu
bli
cati
on
.
9
To
dis
cuss
th
e ou
tcom
e of
th
e m
onit
orin
g an
alys
is r
efer
red
to
at P
oin
t 5
and
con
sult
atio
n, r
efer
red
to
in P
oin
t 8
,
wit
hin
th
e A
CP
O c
omm
and
gro
up
in t
he
forc
e an
d w
ith
a n
omin
ated
offi
ce o
f th
e C
omm
issi
on.
Tim
esc
ale
: w
ith
in o
ne
mo
nth
of
the
co
ncl
usi
on
of
the
co
nsu
lta
tio
n r
efe
rre
d t
o a
t P
oin
t 8
.
10
To
un
der
take
an
equ
alit
y im
pac
t as
sess
men
t on
th
e u
se o
f S
and
S p
ower
s w
ith
in o
ne
mon
th o
f th
e p
ubl
icat
ion
of
each
alt
ern
ate
quar
terl
y re
por
t.
Tim
esc
ale
: th
e fi
rst
ass
ess
me
nt
to b
e c
arr
ied
ou
t w
ith
in o
ne
mo
nth
of
pu
bli
cati
on
of
the
se
con
d
qu
art
erl
y re
po
rt.
11
To
forb
id a
ll o
ffice
rs f
rom
ind
icat
ing
eith
er f
orm
ally
or
info
rmal
ly a
ny
quan
tita
tive
tar
get
for,
or
exp
ecta
tion
as
to,
the
nu
mbe
r of
use
s of
th
e S
and
S p
ower
s by
an
y ot
her
offi
cer
or o
ffice
rs in
an
y p
erio
d o
f ti
me;
to
incl
ud
e th
is in
the
For
ce P
olic
y an
d t
o co
mm
un
icat
e th
e in
stru
ctio
n f
orce
-wid
e.
Tim
esc
ale
: fr
om
co
mm
en
cem
en
t d
ate
of
ag
ree
me
nt.

44
Stop and think again
12
To
un
der
take
a t
rain
ing
pro
gram
me
for
rele
van
t of
fice
rs o
n t
he
pro
per
use
of
its
S an
d S
pow
ers
in a
ccor
dan
ce
wit
h P
AC
E C
ode
A a
nd
th
e im
pac
t on
goo
d r
ace
rela
tion
s an
d e
qual
ity
of o
pp
ortu
nit
y on
th
e ab
use
of
the
pow
er,
in a
ccor
dan
ce w
ith
all
rel
evan
t gu
idan
ce f
rom
AC
PO
an
d t
he
NP
IA, a
nd
wit
h r
efer
ence
to
the
Equ
alit
y an
d H
um
an
Rig
hts
Com
mis
sion
’s S
top
an
d t
hin
k re
por
t.
Tim
esc
ale
: th
e C
hie
f C
on
sta
ble
to
use
re
aso
na
ble
en
de
av
ou
rs t
o c
om
ple
te t
he
tra
inin
g w
ith
in f
ou
r
mo
nth
s o
f co
mm
en
cem
en
t.
Act
ion
s n
ot
to b
e t
ak
en
by
Th
am
es
Va
lle
y P
oli
ce
13
Usi
ng
pre
viou
s p
rove
n c
rim
inal
con
du
ct a
s a
fact
or in
det
erm
inin
g w
het
her
or
not
to
use
S a
nd
S p
ower
s.
14
Req
uir
ing
form
ally
or
info
rmal
ly a
ny
offi
cer
to c
onfo
rm t
o an
exp
ecta
tion
or
ind
ivid
ual
tar
get
as t
o th
e ov
eral
l
nu
mbe
r of
use
s of
S a
nd
S p
ower
s.
15
Per
mit
tin
g of
fice
rs in
an
y w
ay t
o u
se S
an
d S
pow
ers
mer
ely
to s
eek
to o
btai
n in
tell
igen
ce.
16
An
y u
se in
an
y co
nte
xt b
y an
y of
fice
r of
th
e n
um
ber
of o
ccas
ion
s on
wh
ich
an
oth
er o
ffice
r h
as u
sed
S a
nd
S p
ower
s
as a
n in
dic
ator
of
the
per
form
ance
of
that
offi
cer
for
pu
rpos
es s
uch
as
reco
mm
end
atio
ns
for
com
men
dat
ion
s,
ann
ual
per
form
ance
s re
view
or
sim
ilar
.
17
Th
e fa
bric
atio
n o
f an
y gr
oun
d f
or t
he
use
of
S an
d S
pow
ers.

45
www.equalityhumanrights.com
Ap
pe
nd
ix 2
Agr
eem
ent
betw
een
Lei
cest
ersh
ire
Con
stab
ula
ry a
nd
th
e E
qual
ity
and
Hu
man
Rig
hts
Com
mis
sion
, Ap
ril 2
011
, un
der
Se
ctio
n 2
3, E
qual
ity
Act
20
10
Act
ion
s to
be
ta
ke
n b
y L
eic
est
ers
hir
e C
on
sta
bu
lary
1
To
spec
ify
in w
riti
ng
in a
pol
icy
stat
emen
t th
e cr
iter
ia t
hat
are
to
be u
sed
in a
ll c
ases
by
all o
ffice
rs o
f L
eice
ster
shir
e
Con
stab
ula
ry in
exe
rcis
ing
S an
d S
pow
ers
that
con
form
pre
cise
ly t
o an
up
-to-
dat
e P
olic
e an
d C
rim
inal
Evi
den
ce
Act
19
84
Cod
e of
Pra
ctic
e A
.
2
To
incl
ud
e in
su
ch a
pol
icy
the
adop
tion
of
a sp
ecifi
c fo
rmal
aim
of
red
uci
ng
race
dis
pro
por
tion
atel
y in
th
e u
se o
f
stop
an
d s
earc
h.
3
To
set
and
wor
k to
war
ds
ach
ievi
ng
the
foll
owin
g ta
rget
s:
• T
he
nu
mbe
r of
sea
rch
es p
er 1
00
0 b
lack
peo
ple
for
eve
ry s
earc
h p
er 1
00
0 w
hit
e p
eop
le s
hou
ld n
ot e
xcee
d 3
.1
• T
he
nu
mbe
r of
sea
rch
es p
er 1
00
0 A
sian
peo
ple
for
eve
ry s
earc
h p
er 1
00
0 w
hit
e p
eop
le s
hou
ld n
ot e
xcee
d 1
.0
Th
ese
are
to b
e m
easu
red
by
self
-defi
ned
eth
nic
ity
usi
ng
stop
s an
d s
earc
hes
of
per
son
s u
nd
er s
top
an
d s
earc
h
pow
ers.
Th
e ca
lcu
lati
on w
ill e
xclu
de
thos
e w
ho
self
-defi
ne
thei
r et
hn
icit
y as
:
• W
hit
e an
d B
lack
Car
ibbe
an
• W
hit
e an
d B
lack
Afr
ican
• W
hit
e an
d A
sian
Th
e p
opu
lati
on d
ata
to b
e u
sed
is t
he
2011
Cen
sus,
or
if t
hes
e ar
e n
ot a
vail
able
th
e P
opu
lati
on E
stim
ates
by
Eth
nic
Gro
up
as
pu
blis
hed
by
the
Offi
ce f
or N
atio
nal
Sta
tist
ics.

46
Stop and think again
4
To
des
ign
ate
an A
CP
O r
ank
offi
cer
to b
e re
spon
sibl
e fo
r th
e fo
rce
seek
ing
to a
chie
ve t
he
targ
et a
gree
d o
r se
t in
acco
rdan
ce w
ith
poi
nt
3 ab
ove.
5
To
mon
itor
eve
ry t
hre
e m
onth
s th
e u
se o
f S
and
S p
ower
s w
ith
in t
he
area
of
Lei
cest
ersh
ire
Con
stab
ula
ry, s
ubj
ect
to
any
chan
ges
in le
gisl
atio
n d
esig
ned
to
red
uce
bu
reau
crac
y, a
nd
to
anal
yse
the
pro
du
ct o
f th
at m
onit
orin
g by
:
• R
easo
ns
give
n f
or e
ach
su
ch u
se
• R
efer
ence
to
the
spec
ific
loca
tion
• T
he
tim
e of
day
• T
he
gen
der
an
d e
thn
icit
y of
th
e of
fice
r u
sin
g th
e p
ower
• T
he
gen
der
an
d e
thn
icit
y of
th
e p
erso
n w
ho
is s
top
ped
or
wh
ose
veh
icle
is s
top
ped
• W
hat
was
fou
nd
• W
het
her
an
y ar
rest
fol
low
ed a
s a
dir
ect
resu
lt o
f th
e u
se o
f S
and
S p
ower
, an
d (
if s
o) t
he
clas
s of
• cr
imin
al a
ctiv
ity
• to
wh
ich
th
e ar
rest
rel
ated
• C
omp
aris
on w
ith
th
e ge
nd
er a
nd
eth
nic
ity
of t
he
per
son
s ar
rest
ed (
wit
hou
t u
se o
f su
ch p
ower
s) in
th
e sa
me
area
ove
r th
e sa
me
per
iod
, an
d
• Id
enti
fyin
g al
l an
d a
ny
dis
pro
por
tion
alit
y in
th
e u
se o
f th
e S
and
S p
ower
s ov
er s
uch
per
iod
, an
d t
akin
g re
ason
-
able
ste
ps
to id
enti
fy t
he
cau
ses
of s
uch
dis
pro
por
tion
ally
.
6
To
reco
rd c
entr
ally
all
com
pla
ints
(w
ith
in t
he
mea
nin
g of
Sec
tion
12
of t
he
Pol
ice
Ref
orm
Act
20
02)
abo
ut
the
use
of s
uch
S a
nd
S p
ower
s w
het
her
mad
e or
ally
or
in w
riti
ng
or b
y el
ectr
onic
mea
ns
and
to
foll
ow u
p o
n s
uch
com
-
pla
ints
by
iden
tify
ing
wh
eth
er s
uffi
cien
t an
d r
easo
nab
le g
rou
nd
s ex
iste
d f
or t
he
use
of
the
pow
er.
An
y co
mp
lain
t
wh
ere
raci
al d
iscr
imin
atio
n is
all
eged
, su
gges
ted
or
app
aren
t on
a p
reli
min
ary
revi
ew c
ond
uct
ed b
y an
In
spec
tor
wil
l be
form
ally
inve
stig
ated
wit
h a
vie
w t
o id
enti
fyin
g w
het
her
rac
ial d
iscr
imin
atio
n w
as a
fac
tor.

47
www.equalityhumanrights.com
7
To
add
ress
an
y ca
se in
wh
ich
a p
erso
n o
r ve
hic
le h
as b
een
sto
pp
ed a
nd
sea
rch
ed w
her
e it
is n
ot e
nti
rely
cle
ar t
hat
the
stop
an
d s
earc
h w
as in
acc
ord
ance
wit
h t
he
S an
d S
pow
ers
and
th
e P
AC
E C
ode
A.
8
To
dis
cuss
wit
h a
rep
rese
nta
tive
gro
up
of
stak
ehol
der
s a
pu
blis
hed
rep
ort
of t
he
outc
ome
of t
he
mon
itor
ing
and
anal
ysis
ref
erre
d t
o at
poi
nt
5 an
d t
o re
cord
th
eir
view
s on
th
e im
pac
t of
th
e u
se o
f S
and
S p
ower
s on
th
e lo
cal
com
mu
nit
y.
9
To
dis
cuss
th
e ou
tcom
e of
th
e m
onit
orin
g an
d a
nal
ysis
ref
erre
d t
o at
poi
nt
5 an
d t
he
con
sult
atio
n r
efer
red
to
at
poi
nt
8 w
ith
in t
he
AC
PO
com
man
d g
rou
p in
th
e fo
rce
and
wit
h a
nom
inat
ed o
ffice
r of
th
e C
omm
issi
on.
10
To
un
der
take
an
equ
alit
y im
pac
t as
sess
men
t on
th
e u
se o
f th
e S
and
S p
ower
s w
ith
in o
ne
mon
th o
f th
e p
ubl
icat
ion
of e
ach
alt
ern
ate
quar
terl
y re
por
t.
11T
o fo
rbid
all
offi
cers
fro
m in
dic
atin
g ei
ther
for
mal
ly o
r in
form
ally
an
y qu
anti
tati
ve t
arge
t fo
r, o
r ex
pec
tati
on a
s to
,
the
nu
mbe
r of
use
s of
th
e S
and
S p
ower
s by
an
y ot
her
offi
cer
or o
ffice
rs in
an
y p
erio
d o
f ti
me;
to
incl
ud
e th
is in
th
e
forc
e p
olic
y an
d t
o co
mm
un
icat
e th
e in
stru
ctio
n f
orce
-wid
e.
12
To
un
der
take
a t
rain
ing
pro
gram
me
for
rele
van
t of
fice
rs o
n t
he
pro
per
use
of
its
S an
d S
pow
ers
in a
ccor
dan
ce w
ith
PA
CE
Cod
e A
an
d t
he
imp
act
on g
ood
rac
e re
lati
ons
and
equ
alit
y of
op
por
tun
ity
on t
he
abu
se o
f th
e p
ower
, in
ac-
cord
ance
wit
h b
est
pra
ctic
e an
d g
uid
ance
fro
m A
CP
O, t
he
NP
IA a
nd
th
e H
ome
Offi
ce.
Th
e C
hie
f C
onst
able
an
d t
he
Com
mis
sion
wil
l use
rea
son
able
en
dea
vou
rs t
o ag
ree
the
con
ten
t of
th
e tr
ain
ing
wh
ich
sh
all b
e d
eter
min
ed b
y th
e
Ch
ief
Con
stab
le in
th
e ab
sen
ce o
f su
ch a
gree
men
t.
Tim
esc
ale
: tr
ain
ing
to
be
co
mp
lete
d b
y th
e e
nd
of
Se
pte
mb
er
20
11.

48
Stop and think again
Act
ion
s n
ot
to b
e t
ak
en
by
Le
ice
ste
rsh
ire
Co
nst
ab
ula
ry
13U
sin
g p
revi
ous
pro
ven
cri
min
al c
ond
uct
alo
ne
as a
fac
tor
in d
eter
min
ing
wh
eth
er o
r n
ot t
o u
se S
an
d S
pow
ers.
14R
equ
irin
g fo
rmal
ly o
r in
form
ally
an
y of
fice
r to
con
form
to
an e
xpec
tati
on o
r in
div
idu
al t
arge
t as
to
the
over
all
nu
mbe
r of
use
s of
S a
nd
S p
ower
s.
15P
erm
itti
ng
offi
cers
in a
ny
way
to
use
S a
nd
S p
ower
s m
erel
y to
see
k to
obt
ain
inte
llig
ence
.
16
An
y u
se in
an
y co
nte
xt b
y an
y of
fice
r of
th
e n
um
ber
of o
ccas
ion
s on
wh
ich
an
oth
er o
ffice
r h
as u
sed
S a
nd
S p
ower
s
as a
n in
dic
ator
of
the
per
form
ance
of
that
offi
cer
for
pu
rpos
es s
uch
as
reco
mm
end
atio
ns
for
com
men
dat
ion
s, a
n-
nu
al p
erfo
rman
ce r
evie
w o
r si
mil
ar.
17T
he
fabr
icat
ion
of
any
grou
nd
for
th
e u
se o
f S
and
S p
ower
s.

www.equalityhumanrights.com
Contacts
www.equalityhumanrights.com
The Commission’s publications are available to download on our website: www.equalityhumanrights.com. If you would like to discuss the option of accessing a publication in an alternative format please contact: [email protected].
Equality Advisory and Support Service (EASS)
The Equality Advisory Support Service has replaced the Equality and Human Rights Commission Helpline. It gives free advice, information and guidance to individuals on equality, discrimination and human rights issues.
Telephone: 0808 800 0082Textphone: 0808 800 0084Opening hours:09:00 to 20:00 Monday to Friday 10:00 to 14:00 Saturday
Website: www.equalityadvisoryservice.comPost: FREEPOST Equality Advisory Support Service FPN4431

Stop and think again
©Equality and Human Rights CommissionMay 2013ISBN: 978 1 84206 489 4
www.equalityhumanrights.com