Embed Size (px)
Citation preview
1
Stoke-on-Trent
Census 2001 and Access to Services Focus on Rural Areas
Stoke-on-Trent is in the West Midlands Government Office Region

- 2 -
Map of the Government Office Region showing Authority boundaries and shaded by Output Area according to the urban / rural definition.

3
Population In Stoke-on-Trent 0.4% of people live in rural areas,compared with 15.7% in the Government Office Region.Within the rural areas all people live in less sparse areas
Male Female Total Male Female TotalUrban 116,736 122,946 239,682 2,165,396 2,274,096 4,439,492Rural 422 532 954 409,715 418,101 827,816
Less Sparse 422 532 954 383,437 391,125 774,562Town 80 150 230 144,810 152,545 297,355Village 342 382 724 152,407 153,903 306,310Dispersed - - - 86,220 84,677 170,897
Sparse - - - 26,278 26,976 53,254Town - - - 7,477 8,038 15,515Village - - - 6,918 7,297 14,215Dispersed - - - 11,883 11,641 23,524
Total 117,158 123,478 240,636 2,575,111 2,692,197 5,267,308Percentage rural 0.4 0.4 0.4 15.9 15.5 15.7
Stoke-on-Trent West Midlands
Source table from the Census: UV03 Gender Proportion of the population of the Authority living in rural towns, villages and dispersed areas compared with the Government Office Region and England.
0 20 40 60 80 100
Percentage
Town
Village
Dispersed
Rur
al ty
pe
Stoke-on-Trent West Midlands England
Source table from the Census: UV03 Gender
4
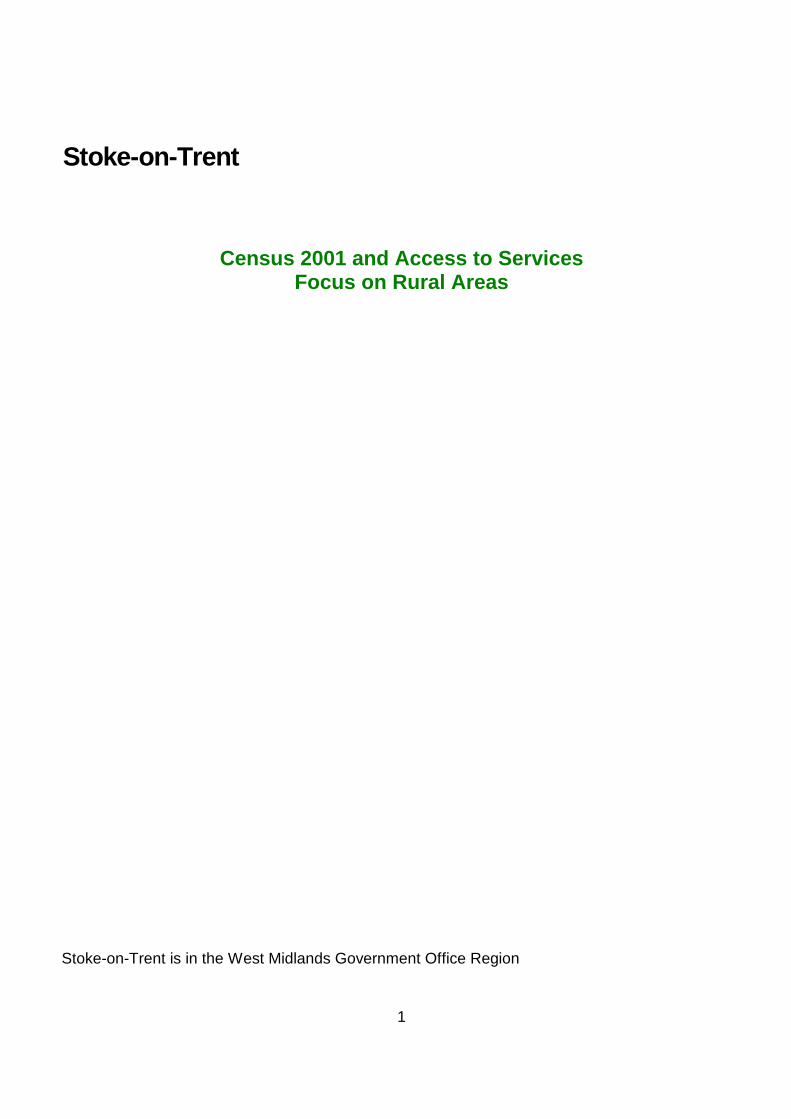
Age In Stoke-on-Trent 0% of the population live in rural areas and areunder 10 years old. 0.1% of the Authority's population live in rural areas and areunder 19 years of age. 0.1% are aged 70 or over and live in rural areas. Total population within the Authority, broken down by age.
Total
Less sparse Sparse Less
sparse Sparse Less sparse Sparse
Under 10 28,474 28,383 91 - - 91 - - - 0.310 to 19 32,502 32,426 76 16 - 60 - - - 0.220 to 29 32,489 32,397 92 3 - 89 - - - 0.330 to 39 36,131 36,020 111 6 - 105 - - - 0.340 to 49 30,506 30,409 97 18 - 79 - - - 0.350 to 59 29,700 29,575 125 12 - 113 - - - 0.460 to 69 22,012 21,885 127 47 - 80 - - - 0.670 to 79 18,889 18,742 147 80 - 67 - - - 0.880 to 89 8,307 8,217 90 54 - 36 - - - 1.190 and over 1,276 1,270 6 3 - 3 - - - 0.5
240,286 239,324 962 239 - 723 - - - 0.4
% Rural
Totals
Urban RuralAge
Rural breakdownTowns Villages Dispersed
Source table from the Census: UV04 Age Age of the population in urban/rural parts of the Authority and totals for the Government Office Region.
0500
10001500200025003000350040004500
Under1
10 20 30 40 50 60 70 80 90 100andover
Age
Num
ber o
f peo
ple
in th
e A
utho
rity
0100002000030000400005000060000700008000090000
Num
ber o
f peo
ple
in th
e G
OR
Rural Stoke-on-Trent Urban Stoke-on-Trent West Midlands
Source table from the Census: UV04 Age
5
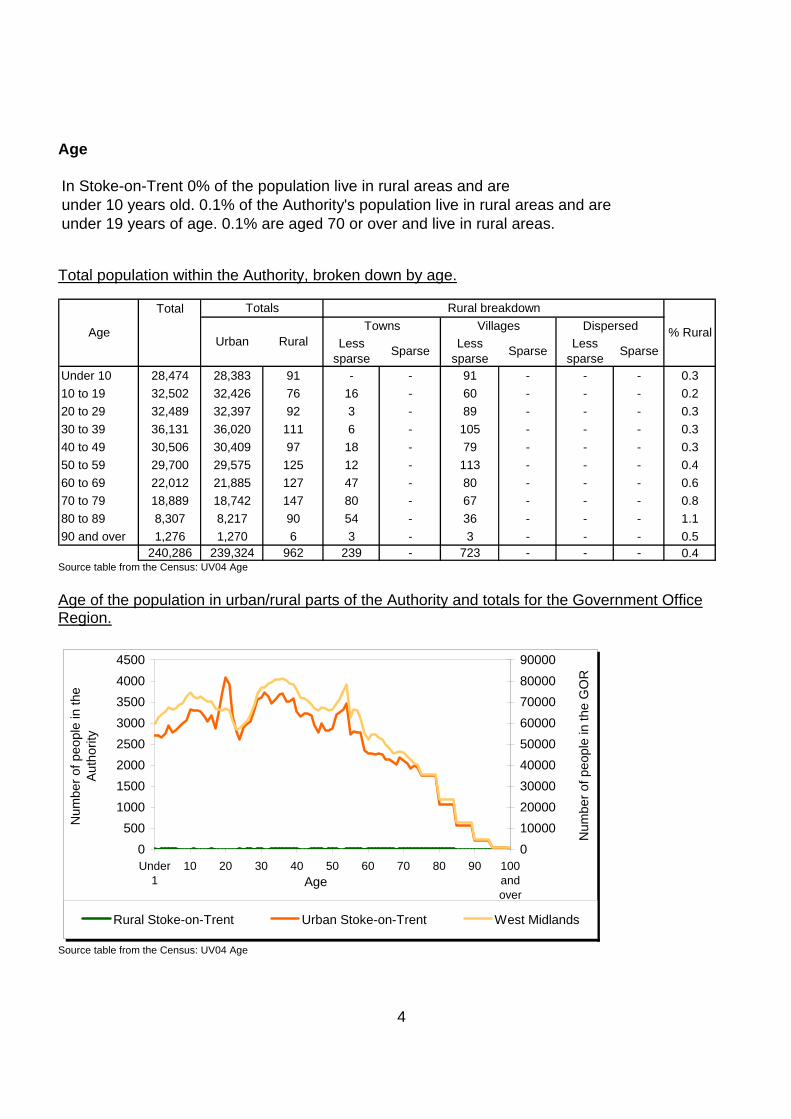
Proportion of children under 5 split by the urban rural definition, for the Authority and the Government Office Region Authority: Government Office Region:Stoke-on-Trent West MidlandsNumber of under 5's: 13,900 Number of under 5's: 319,200
Urban
Less Sparse Rural Town
Less Sparse Rural Village
Less Sparse Rural Dispersed
Sparse Rural Town
Sparse Rural Village
Sparse Rural Dispersed
Source table from the Census: UV04 Age
6
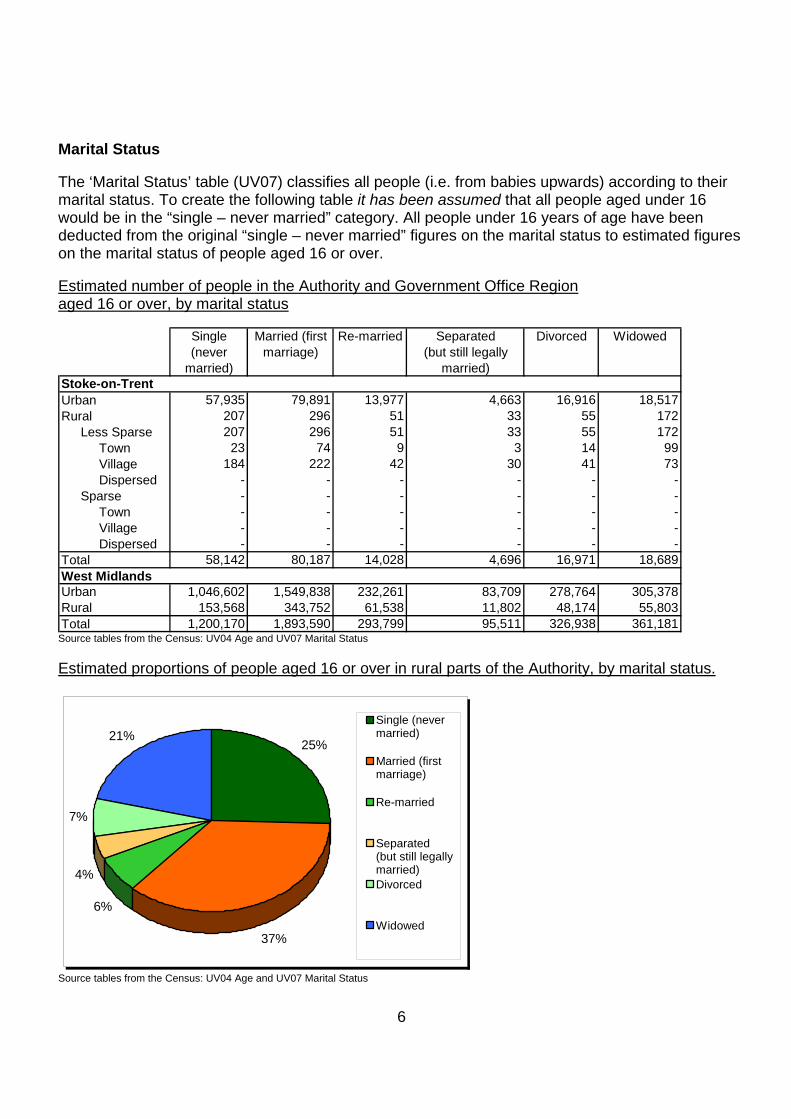
Marital Status The ‘Marital Status’ table (UV07) classifies all people (i.e. from babies upwards) according to their marital status. To create the following table it has been assumed that all people aged under 16 would be in the “single – never married” category. All people under 16 years of age have been deducted from the original “single – never married” figures on the marital status to estimated figures on the marital status of people aged 16 or over. Estimated number of people in the Authority and Government Office Region aged 16 or over, by marital status
Single (never
married)
Married (first marriage)
Re-married Separated (but still legally
married)
Divorced Widowed
Urban 57,935 79,891 13,977 4,663 16,916 18,517Rural 207 296 51 33 55 172
Less Sparse 207 296 51 33 55 172Town 23 74 9 3 14 99Village 184 222 42 30 41 73Dispersed - - - - - -
Sparse - - - - - -Town - - - - - -Village - - - - - -Dispersed - - - - - -
Total 58,142 80,187 14,028 4,696 16,971 18,689West MidlandsUrban 1,046,602 1,549,838 232,261 83,709 278,764 305,378Rural 153,568 343,752 61,538 11,802 48,174 55,803Total 1,200,170 1,893,590 293,799 95,511 326,938 361,181
Stoke-on-Trent
Source tables from the Census: UV04 Age and UV07 Marital Status Estimated proportions of people aged 16 or over in rural parts of the Authority, by marital status.
25%
37%
6%
4%
7%
21%Single (nevermarried)
Married (firstmarriage)
Re-married
Separated (but still legallymarried)Divorced
Widowed
Source tables from the Census: UV04 Age and UV07 Marital Status

7
Household composition In Stoke-on-Trent 0.5% of households are inrural areas. 47.6% of rural households are single person households.9.4% of rural households are lone parent family households. Number of households, by composition of the household
Urban % ruralTotal Total
Town Village Dispersed Town Village DispersedTotal number of households 102,685 466 161 305 - - - - 0.5One person household 32,293 222 118 104 - - - - 0.7
pensioner 15,738 169 110 59 - - - - 1.1other 16,555 53 8 45 - - - - 0.3
All pensioner family 8,482 56 28 28 - - - - 0.7Married couple family 35,906 106 9 97 - - - - 0.3
no children 12,920 51 6 45 - - - - 0.4with one dependent child 6,905 12 - 12 - - - - 0.2with two or more dependent children 9,400 22 3 19 - - - - 0.2all children non-dependent 6,681 21 - 21 - - - - 0.3
Cohabiting couple family 8,900 22 - 22 - - - - 0.2no children 4,385 9 - 9 - - - - 0.2with one dependent child 2,317 6 - 6 - - - - 0.3two or more dependent children 1,859 7 - 7 - - - - 0.4all children non-dependent 339 - - - - - - - -
Lone parent family 11,396 44 6 38 - - - - 0.4with one dependent child 4,360 12 3 9 - - - - 0.3with two or more dependant children 3,520 20 3 17 - - - - 0.6all children non-dependent 3,516 12 - 12 - - - - 0.3
Other households 5,708 16 - 16 - - - - 0.3with one dependent child 1,057 3 - 3 - - - - 0.3with two or more dependent children 999 - - - - - - - -all student 866 - - - - - - - -all pensioner 368 3 - 3 - - - - 0.8other 2,418 10 - 10 - - - - 0.4
RuralLess sparse Sparse
Source table from the Census: UV65 Household Composition (households) A dependent child is a person in a household aged 0 to 15 (whether or not in a family) or a person aged 16 to 18 who is a full-time student in a family with parent(s).

8
Percentage of households by composition of household for the Authority and the Government Office Region.
0%
10%
20%
30%
40%
50%
60%
Urban Rural Urban Rural
Stoke-on-Trent West Midlands
Pro
porti
on o
f tot
al n
umbe
r of h
ouse
hold
s
one person all pensioner familymarried couple family cohabiting couple family householdlone parent family other households
Source table from the Census: UV65 Household Composition (households) Classification of household deprivation The classification of household deprivation on the Census is independent of the English Indices of Multiple Deprivation published by the Office of the Deputy Prime Minister. Four dimensions from the Census returns have been identified as giving an indication of household deprivation. Households are considered deprived if one or more of the following definitions applies to that household: Employment – any member of the household aged 16-74 who is not a full-time student is classified as either unemployed or permanently sick. Education – no member of the household aged 16 to pensionable age has at least 5 GCSE’s (grade A to C) or equivalent AND no member of the household aged 16 to 18 is in full-time education. Health and disability – any member of the household has general health ‘not good’ in the year before the census or has a limiting long term illness. Housing – The household’s accommodation is either overcrowded, or is in a shared dwelling, or does not have sole use of bath/shower and toilet, or has no central heating.

9
Classification of household deprivation (number of households)
Not deprived on any
dimension
Deprived on 1
dimension
Deprived on 2
dimensions
Deprived on 3
dimensions
Deprived on all 4
dimensions
Not deprived on any
dimension
Deprived on 1 or more
dimensions
Urban 22,737 33,486 30,732 14,323 1,422 485,054 1,333,560Rural 62 105 227 78 7 116,277 218,629
Less Sparse 62 105 227 78 7 109,776 202,379Town 4 31 112 19 - 41,368 83,070Village 58 74 115 59 7 43,926 77,863Dispersed - - - - - 24,482 41,446
Sparse - - - - - 6,501 16,250Town - - - - - 1,680 5,260Village - - - - - 1,724 4,419Dispersed - - - - - 3,097 6,571
Stoke-on-Trent West Midlands
Source table from the Census: UV67 Classification of household deprivation Comparison of household deprivation in urban and rural parts of the Authority
0%
10%
20%
30%
40%
50%
60%
70%
80%
90%
100%
Pro
porti
on o
f hou
seho
lds
Urban Stoke-on-Trent
Rural Stoke-on-Trent
West Midlands
Deprived on all 4dimensions
Deprived on 3dimensions
Deprived on 2dimensions
Deprived on 1dimension
Not deprived onany dimension
Source table from the Census: UV67 Classification of household deprivation Health and provision of unpaid care There were two measure of ‘health’ on the Census. In one measure respondents were asked to rate their general level of health over the last twelve months as ‘good’, ‘fairly good’ or ‘not good’. The other measure was to ask respondents whether they (in their opinion) had a limiting long-term
10
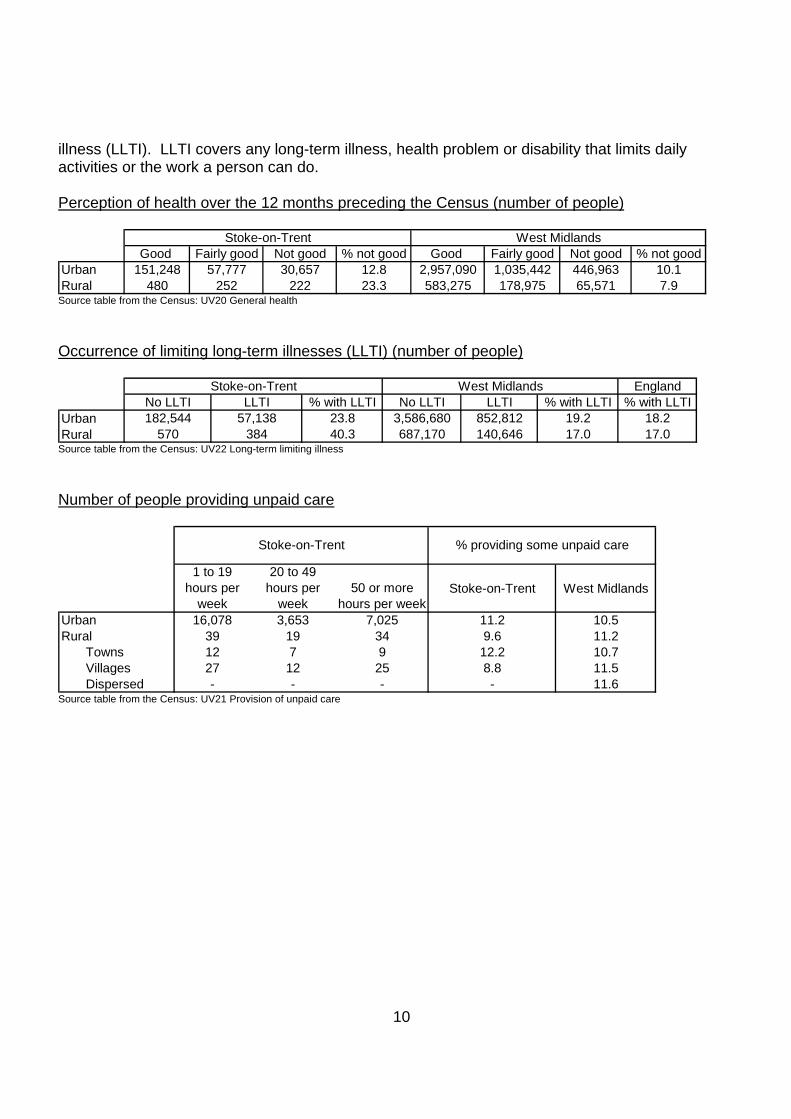
illness (LLTI). LLTI covers any long-term illness, health problem or disability that limits daily activities or the work a person can do. Perception of health over the 12 months preceding the Census (number of people)
Good Fairly good Not good % not good Good Fairly good Not good % not goodUrban 151,248 57,777 30,657 12.8 2,957,090 1,035,442 446,963 10.1Rural 480 252 222 23.3 583,275 178,975 65,571 7.9
Stoke-on-Trent West Midlands
Source table from the Census: UV20 General health Occurrence of limiting long-term illnesses (LLTI) (number of people)
EnglandNo LLTI LLTI % with LLTI No LLTI LLTI % with LLTI % with LLTI
Urban 182,544 57,138 23.8 3,586,680 852,812 19.2 18.2Rural 570 384 40.3 687,170 140,646 17.0 17.0
Stoke-on-Trent West Midlands
Source table from the Census: UV22 Long-term limiting illness Number of people providing unpaid care
1 to 19 hours per
week
20 to 49 hours per
week50 or more
hours per weekStoke-on-Trent West Midlands
Urban 16,078 3,653 7,025 11.2 10.5Rural 39 19 34 9.6 11.2
Towns 12 7 9 12.2 10.7Villages 27 12 25 8.8 11.5Dispersed - - - - 11.6
Stoke-on-Trent % providing some unpaid care
Source table from the Census: UV21 Provision of unpaid care

11
Qualifications In Stoke-on-Trent 42.9% of the people aged 16 to 74 have noacademic, vocational or professional qualifications, compared with 34% in the Region as awhole. 0.5% of the people with no such qualifications are in rural parts of the Authority. Number of people aged 16 to 74 by qualification level
None Level 1 Level 2 Level 3 Level 4/5 Other Authority GORUrban 74,355 27,936 29,386 12,432 17,145 12,357 42.8 35.3Rural 360 81 76 14 53 58 56.1 26.9
Less Sparse 360 81 76 14 53 58 56.1 26.8Town 81 12 8 3 8 12 65.3 28.7Village 279 69 68 11 45 46 53.9 25.5Dispersed - - - - - - - 25.9
Sparse - - - - - - - -Town - - - - - - - -Village - - - - - - - -Dispersed - - - - - - - -
Total 74,715 28,017 29,462 12,446 17,198 12,415 42.9 34.0Percentage rural 0.5 0.3 0.3 0.1 0.3 0.5
Percentage with no qualifications
Number of people aged 16-74 within the authority that responded to the questions on qualifcation levels. (please see the footnotes)
Source table from the Census: UV24 Qualifications Footnotes None: No academic, vocational or professional qualifications Level 1: 1+ ‘O’ levels/CSE/GCSE (any grade), NVQ level 1, Foundation GNVQ Level 2: 5+ ‘O’ levels, 5+ CSEs (grade 1), 5+ GCSEs (grade A to C), School Certificate, 1+ ‘A’ levels/AS levels, NVQ level 2, Intermediate GNVQ Level 3: 2+ ‘A’ levels, 4+ AS levels, Higher School Certificate, NVQ level 3, Advanced GNVQ Level 4/5: First degree, Higher degree, NVQ levels 4-5, HND, HNC, Qualified Teacher Status, Qualified Medical Doctor, Qualified Dentist, Qualified Nurse, Midwife, Health Visitor Other: Other qualifications or level unknown e.g. City and Guilds, RSA/OCR, BTEC/Edexcel, other professional qualifications.

12
Percentage of people aged 16 to 74 with each level of qualification in the Authority and the rural part of the Government Office Region.
0
10
20
30
40
50
60
Noqualifications
Level 1 Level 2 Level 3 Level 4/5 Otherqualifications /level unknown
Per
cent
age
of p
eopl
e
Urban Stoke-on-Trent Rural Stoke-on-Trent Rural West Midlands
Source table from the Census: UV24 Qualifications

13
National Statistics Socio-Economic Classification (NS-SeC) In this table all people aged 16 to 74 are classified according to their type of occupation using the National Statistics Socio-Economic Classification. Further details of this classification system are available from the National Statistics web site at: http://www.statistics.gov.uk/methods_quality/ns_sec/default.asp Number of people in the Authority aged 16 to 74 by NS-SeC classification
UrbanTotal Total Towns Villages Dispersed Urban Rural
Higher managerial and professional occupations 6,545 15 3 12 - 207,982 61,115Lower managerial and professional occupations 20,396 51 4 47 - 511,238 121,823Intermediate occupations 12,504 38 - 38 - 280,647 49,224Small employers and own account workers 8,755 35 - 35 - 174,333 71,108Lower supervisory and technical occupations 15,043 32 - 32 - 250,547 40,626Semi-routine occupations 24,645 62 - 62 - 435,853 62,479Routine occupations 28,778 95 15 80 - 354,034 47,453Never worked and long-term unemployed 7,703 82 6 76 - 157,173 11,413Not Classified 49,352 228 94 134 - 801,993 142,700
RuralStoke-on-Trent
West Midlands
Source table from the Census: UV31 National Statistics Socio-economic classification Percentage of people in the Authority aged 16 to 74 by NS-SeC classification
0%
20%
40%
60%
80%
100%
Urban Rural Urban Rural
Stoke-on-Trent West Midlands
Per
cent
age
of p
eopl
e ag
ed 1
6 to
74
Not Classified
Never worked and long-term unemployed
Routine occupations
Semi-routine occupations
Lower supervisory andtechnical occupations
Small employers and ownaccount workers
Intermediate occupations
Lower managerial andprofessional occupations
Higher managerial andprofessional occupations
Source table from the Census: UV31 National Statistics Socio-economic classification

14
Economic activity and average number of hours worked In rural Stoke-on-Trent 53% of people aged 16 to 74 are economicallyinactive. 43.6% of those people are retired, 4.4% are students and 14.3% arelooking after the home or family.
In comparison 38.7% of people aged 16 to 74 are economically inactive in urban Stoke-on-Trent and 31.3% are economically inactive in ruralparts of the Government Office Region. Number of people aged 16 to 74 by economic activity
UrbanTotal Total Towns Villlages Dispersed Urban Rural
Economically active 106,419 303 26 277 - 2,074,360 417,784Employee 85,825 238 22 216 - 1,667,107 308,529
Part-time 18,079 41 3 38 - 375,589 76,199Full-time 67,746 197 19 178 - 1,291,518 232,330
Self-employed with employees 3,357 15 - 15 - 72,407 33,474Part-time 516 - - - - 9,993 4,885Full-time 2,841 15 - 15 - 62,414 28,589
Self-employed without employees 5,559 16 - 16 - 122,975 50,991Part-time 1,292 6 - 6 - 32,150 14,756Full-time 4,267 10 - 10 - 90,825 36,235
Unemployed 6,929 24 - 24 - 130,102 12,698Full-time Students 4,749 10 4 6 - 81,769 12,092
Economically inactive 67,273 342 98 244 - 1,098,936 189,936Retired 24,150 149 68 81 - 430,116 95,297Student 8,885 15 4 11 - 152,939 20,621Looking after home/family 10,928 49 4 45 - 211,043 36,046Permanently sick/disabled 16,573 104 18 86 - 192,071 23,441Other 6,737 25 4 21 - 112,767 14,531
% economically active 61.3 47.0 21.0 53.2 - 65.4 68.7% economically inactive 38.7 53.0 79.0 46.8 - 34.6 31.3
Stoke-on-Trent West MidlandsRural
Source table from the Census: UV28 Economic activity For the Census part-time working is defined as working 30 hours a week or less. Full-time is defined as working 31 or more hours a week.

15
Percentage of people aged 16 to 74 by economic activity
0% 20% 40% 60% 80% 100%
Urban Stoke-on-Trent
Rural Stoke-on-Trent
Rural West Midlands
Economically active: Employee
Economically active: Self-employed
Economically active: Unemployed
Economically active: Other
Economically inactive: Retired
Economically inactive: Other
Source table from the Census: UV28 Economic activity Number of people aged 16 to 74 in employment by number of hours worked per week
1 to 2 hours
3 to 5 hours
6 to 15 hours
16 to 30 hours
31 to 37 hours
38 to 48 hours
49 to 59 hours
60 hours and over
Part-time Full-time
Stoke-on-TrentUrban 99 763 6,277 15,821 18,049 45,673 7,440 4,371 23.3 76.7Rural - - 9 37 52 128 23 21 17.0 83.0
Less Sparse - - 9 37 52 128 23 21 17.0 83.0Town - - 3 - 4 12 3 - 13.6 86.4Village - - 6 37 48 116 20 21 17.3 82.7Dispersed - - - - - - - - - -
Sparse - - - - - - - - - -Town - - - - - - - - - -Village - - - - - - - - - -Dispersed - - - - - - - - - -
Total 99 763 6,286 15,858 18,101 45,801 7,463 4,392 23.3 76.7Percentage rural 0.0 0.0 0.1 0.2 0.3 0.3 0.3 0.5West MidlandsUrban 2,792 16,572 134,099 318,967 394,960 795,478 171,845 95,765 24.5 75.5Rural 870 4,643 31,583 67,658 58,446 152,577 49,375 38,739 25.9 74.1Total 3,662 21,215 165,682 386,625 453,406 948,055 221,220 134,504 24.7 75.3
Part-time Full-time Percent
Source table from the Census: UV41 Hours worked
16
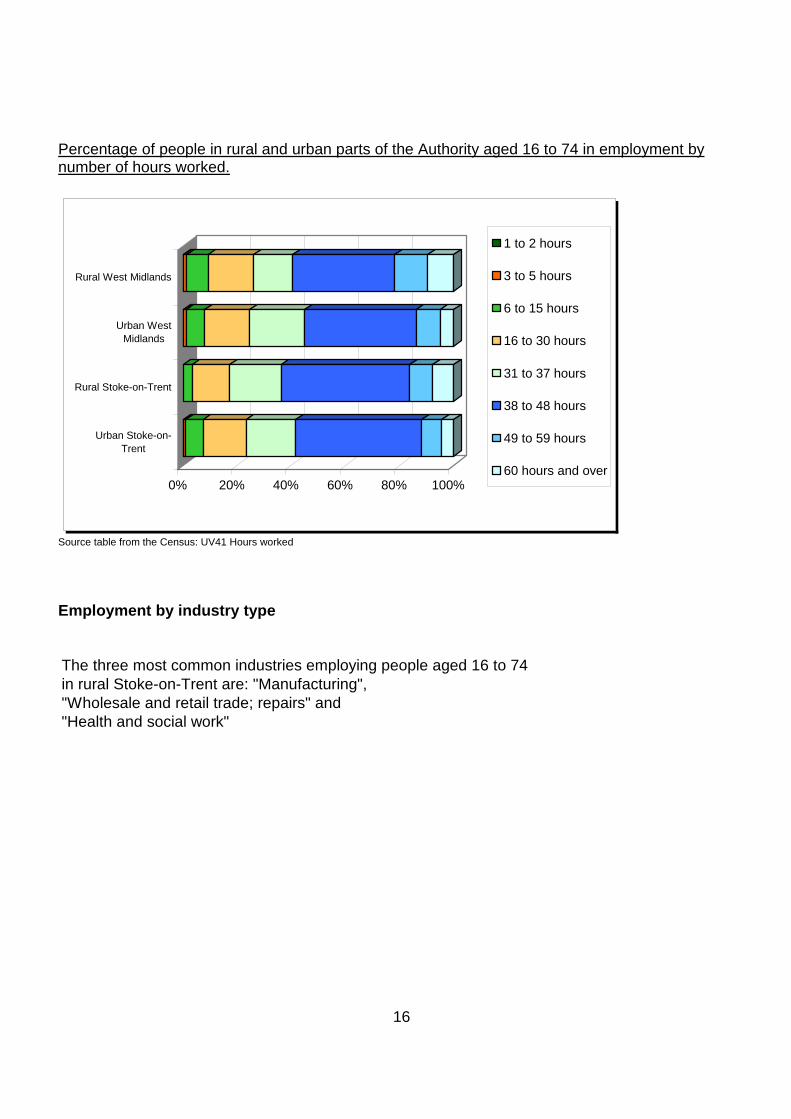
Percentage of people in rural and urban parts of the Authority aged 16 to 74 in employment by number of hours worked.
0% 20% 40% 60% 80% 100%
Urban Stoke-on-Trent
Rural Stoke-on-Trent
Urban WestMidlands
Rural West Midlands
1 to 2 hours
3 to 5 hours
6 to 15 hours
16 to 30 hours
31 to 37 hours
38 to 48 hours
49 to 59 hours
60 hours and over
Source table from the Census: UV41 Hours worked Employment by industry type The three most common industries employing people aged 16 to 74in rural Stoke-on-Trent are: "Manufacturing","Wholesale and retail trade; repairs" and "Health and social work"
17
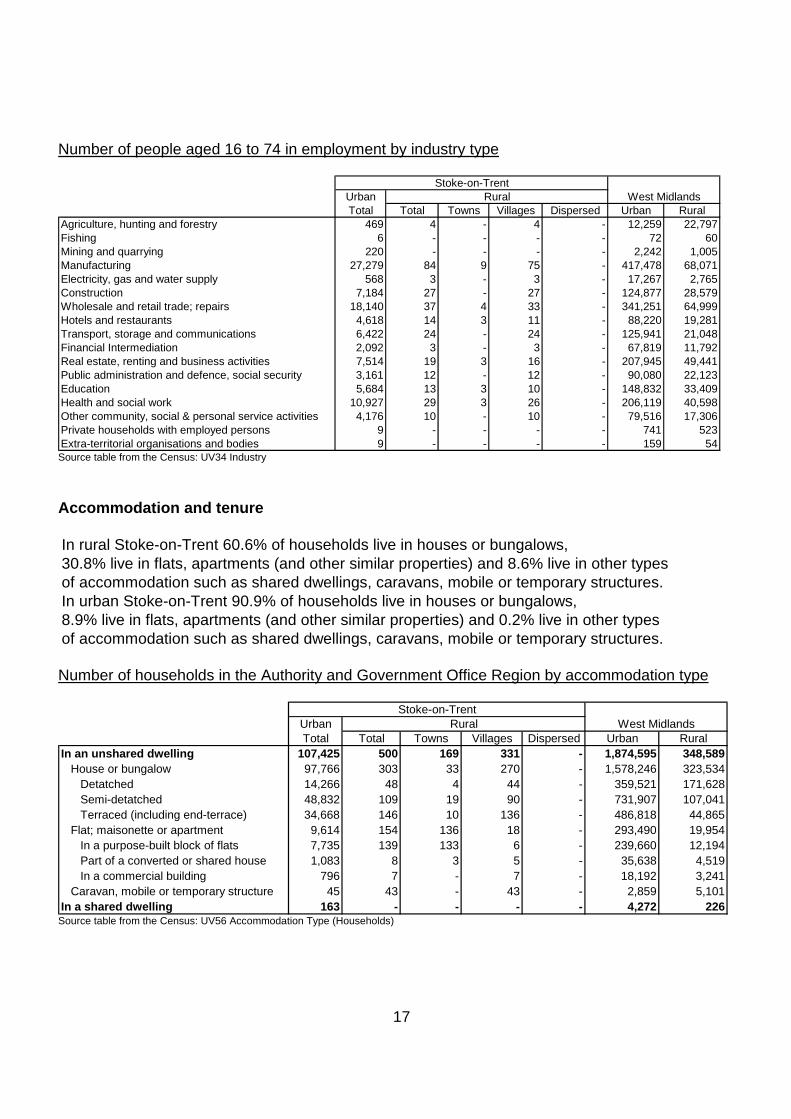
Number of people aged 16 to 74 in employment by industry type
UrbanTotal Total Towns Villages Dispersed Urban Rural
Agriculture, hunting and forestry 469 4 - 4 - 12,259 22,797Fishing 6 - - - - 72 60Mining and quarrying 220 - - - - 2,242 1,005Manufacturing 27,279 84 9 75 - 417,478 68,071Electricity, gas and water supply 568 3 - 3 - 17,267 2,765Construction 7,184 27 - 27 - 124,877 28,579Wholesale and retail trade; repairs 18,140 37 4 33 - 341,251 64,999Hotels and restaurants 4,618 14 3 11 - 88,220 19,281Transport, storage and communications 6,422 24 - 24 - 125,941 21,048Financial Intermediation 2,092 3 - 3 - 67,819 11,792Real estate, renting and business activities 7,514 19 3 16 - 207,945 49,441Public administration and defence, social security 3,161 12 - 12 - 90,080 22,123Education 5,684 13 3 10 - 148,832 33,409Health and social work 10,927 29 3 26 - 206,119 40,598Other community, social & personal service activities 4,176 10 - 10 - 79,516 17,306Private households with employed persons 9 - - - - 741 523Extra-territorial organisations and bodies 9 - - - - 159 54
RuralStoke-on-Trent
West Midlands
Source table from the Census: UV34 Industry Accommodation and tenure In rural Stoke-on-Trent 60.6% of households live in houses or bungalows, 30.8% live in flats, apartments (and other similar properties) and 8.6% live in other typesof accommodation such as shared dwellings, caravans, mobile or temporary structures.In urban Stoke-on-Trent 90.9% of households live in houses or bungalows, 8.9% live in flats, apartments (and other similar properties) and 0.2% live in other typesof accommodation such as shared dwellings, caravans, mobile or temporary structures. Number of households in the Authority and Government Office Region by accommodation type
UrbanTotal Total Towns Villages Dispersed Urban Rural
In an unshared dwelling 107,425 500 169 331 - 1,874,595 348,589 House or bungalow 97,766 303 33 270 - 1,578,246 323,534 Detatched 14,266 48 4 44 - 359,521 171,628 Semi-detatched 48,832 109 19 90 - 731,907 107,041 Terraced (including end-terrace) 34,668 146 10 136 - 486,818 44,865 Flat; maisonette or apartment 9,614 154 136 18 - 293,490 19,954 In a purpose-built block of flats 7,735 139 133 6 - 239,660 12,194 Part of a converted or shared house 1,083 8 3 5 - 35,638 4,519 In a commercial building 796 7 - 7 - 18,192 3,241 Caravan, mobile or temporary structure 45 43 - 43 - 2,859 5,101In a shared dwelling 163 - - - - 4,272 226
RuralStoke-on-Trent
West Midlands
Source table from the Census: UV56 Accommodation Type (Households)

18
Percentage of households in the Authority and the Government Office Region by type of accommodation.
0
10
20
30
40
50
Det
ache
d
Sem
i-de
tach
ed
Terra
ced
In p
urpo
sebu
ilt b
lock
s
Par
t of
conv
erte
dho
use/
buili
ng
Inco
mm
erci
albu
ildin
gs
Car
avan
s et
c.
Sha
red
dwel
lings
House/bungalow Flats, apartments etc: Other
Per
cent
Urban Stoke-on-Trent Rural Stoke-on-Trent West Midlands GOR
Source table from the Census: UV56 Accommodation Type (Households) In rural Stoke-on-Trent 45.7% of housholds live in ownedaccommodation, 42% live in social rented accommodation and 8.9% live in privaterented accomodation.In urban Stoke-on-Trent 65.3% of housholds live in ownedaccommodation, 24.3% live in social rented accommodation and 7.5% live in privaterented accomodation. Number of households in the Authority and Government Office Region by tenure
UrbanTotal Total Towns Villages Dispersed Urban Rural
Owned 67,061 220 21 199 - 1,238,000 260,119Owns outright 29,389 108 12 96 - 523,695 127,710Owns with a mortgage or loan 36,522 112 9 103 - 701,645 130,539Shared ownership 1,150 - - - - 12,660 1,870
Social rented 24,977 202 134 68 - 407,125 36,595Rented from Council (Local Authority) 20,009 63 7 56 - 291,317 15,854Other social rented 4,968 139 127 12 - 115,808 20,741
Private rented 7,658 43 7 36 - 127,659 29,428Private landlord or letting agency 6,854 37 4 33 - 112,431 24,660Employer of a household member 61 - - - - 2,432 1,569Relative or friend of a household member 605 - - - - 8,657 1,958Other 138 6 3 3 - 4,139 1,241
Living rent free 2,974 16 5 11 - 46,044 8,787
RuralStoke-on-Trent West Midlands
Source table from the Census: UV63 Tenure (Households)

19
Percentage of households by tenure
0% 20% 40% 60% 80% 100%
Percent
Urban Stoke-on-Trent
Rural Stoke-on-Trent
West Midlands GOR
Owned Social rented Private rented Living rent free
Source table from the Census: UV63 Tenure (Households) Car ownership 44.6% of households in rural Stoke-on-Trent do not have a car or vanavailable for private use. In urban parts of the Constituency it is 34.6%. Number of households by car/van availability to the household and the total number of cars*
Authority GOR
No car or van
1 car or van
2 cars or vans
3 cars or vans
4 or more cars or vans
No car or van
1 or more cars or vans
Urban 35,504 46,409 17,262 2,816 733 536,289 1,282,381 92,682 1,889,949Rural 214 189 58 19 - 40,163 294,636 362 516,204
Less Sparse 214 189 58 19 - 37,070 275,007 362 483,659Town 117 41 3 5 - 20,659 103,861 62 168,522Village 97 148 55 14 - 11,909 109,743 300 196,912Dispersed - - - - - 4,502 61,403 - 118,225
Sparse - - - - - 3,093 19,629 - 32,545Town - - - - - 1,767 5,178 - 7,405Village - - - - - 703 5,427 - 9,034Dispersed - - - - - 623 9,024 - 16,106
Total 35,718 46,598 17,320 2,835 733 576,452 1,577,017 93,044 2,406,153Percentage rural 0.6 0.4 0.3 0.7 - 7.0 18.7 0.4 21.5
Stoke-on-Trent West Midlands
Total number of cars or vans
Source table from the Census: UV62 Cars or Vans *(includes any company car or van if it is available for private use)

20
Access to Service The following tables give figures on the distance from rural households to ten types of services:
1. Cash machines / ATMs 2. Banks 3. GPs 4. Jobcentres 5. Libraries 6. Petrol stations 7. Post offices 8. Supermarkets 9. Primary Schools 10. Secondary Schools

21
Distance to Cash Machines / ATMs and Banks Cash Machines / ATMs <2km 2-4km 4-6km 6-8km 8-10km 10-12km 12-14km 14-16km >16km TotalNumber of rural households in the Authority within X km of a cash machine / ATMLess Sparse 483 - - - - - - - - 483 Town 168 - - - - - - - - 168 Village 315 - - - - - - - - 315 Dispersed - - - - - - - - - -Sparse - - - - - - - - - - Town - - - - - - - - - - Village - - - - - - - - - - Dispersed - - - - - - - - - -Rural Total 483 - - - - - - - - 483% of rural households in the Authority 100.0 - - - - - - - - 100.0 in the Government Office Region 56.6 24.1 13.0 4.7 0.9 0.4 0.1 0.2 0.1 100.0
Banks <2km 2-4km 4-6km 6-8km 8-10km 10-12km 12-14km 14-16km >16km TotalNumber of rural households in the Authority within X km of a bankLess Sparse 71 412 - - - - - - - 483 Town - 168 - - - - - - - 168 Village 71 244 - - - - - - - 315 Dispersed - - - - - - - - - -Sparse - - - - - - - - - - Town - - - - - - - - - - Village - - - - - - - - - - Dispersed - - - - - - - - - -Rural Total 71 412 - - - - - - - 483% of rural households in the Authority 14.7 85.3 - - - - - - - 100.0 in the Government Office Region 28.2 24.9 23.0 14.9 5.8 1.8 0.8 0.4 0.4 100.0
Source: Countryside Agency

22
Distance to GPs and Jobcentres GPs <2km 2-4km 4-6km 6-8km 8-10km 10-12km 12-14km 14-16km >16km TotalNumber of rural households in the Authority within X km of a GPLess Sparse 239 244 - - - - - - - 483 Town 168 - - - - - - - - 168 Village 71 244 - - - - - - - 315 Dispersed - - - - - - - - - -Sparse - - - - - - - - - - Town - - - - - - - - - - Village - - - - - - - - - - Dispersed - - - - - - - - - -Rural Total 239 244 - - - - - - - 483% of rural households in the Authority 49.5 50.5 - - - - - - - 100.0 in the Government Office Region 44.7 28.6 18.9 6.1 1.4 0.3 0.1 - - 100.0
Jobcentres <2km 2-4km 4-6km 6-8km 8-10km 10-12km 12-14km 14-16km >16km TotalNumber of rural households in the Authority within X km of a jobcentreLess Sparse 51 301 131 - - - - - - 483 Town - 168 - - - - - - - 168 Village 51 133 131 - - - - - - 315 Dispersed - - - - - - - - - -Sparse - - - - - - - - - - Town - - - - - - - - - - Village - - - - - - - - - - Dispersed - - - - - - - - - -Rural Total 51 301 131 - - - - - - 483% of rural households in the Authority 10.6 62.3 27.1 - - - - - - 100.0 in the Government Office Region 5.7 12.1 25.5 20.7 14.3 11.1 4.5 2.7 3.4 100.0
Source: Countryside Agency
23
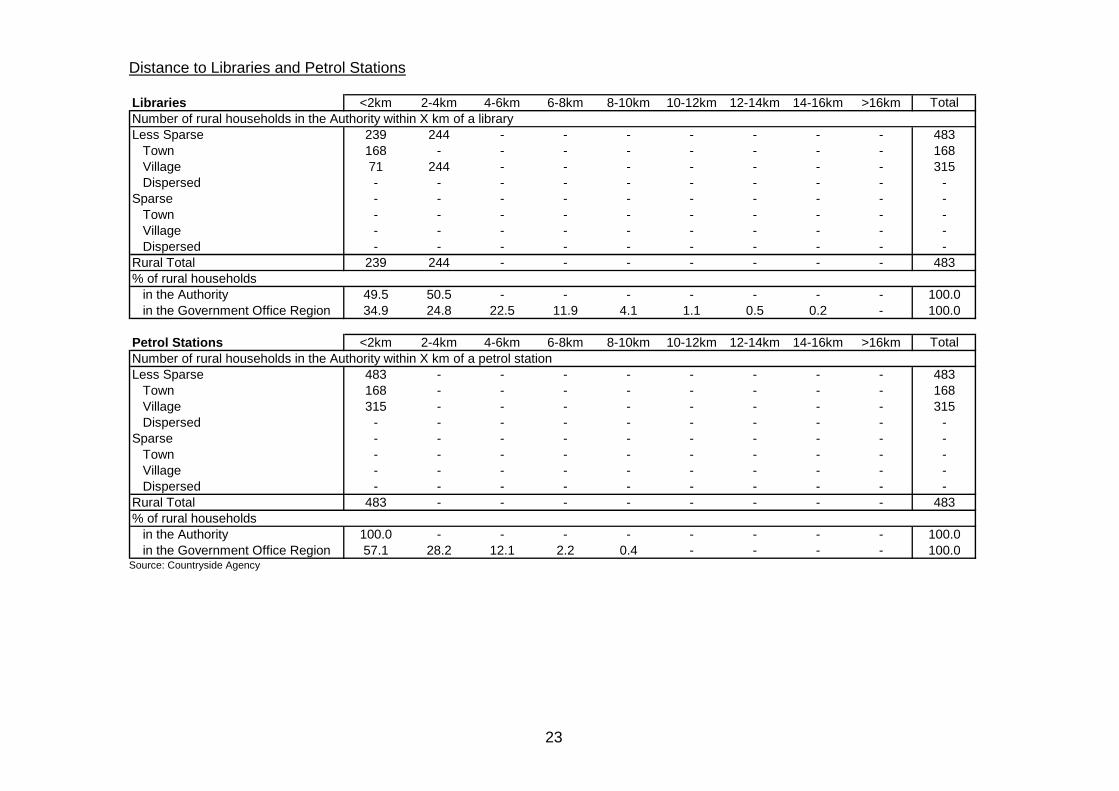
Distance to Libraries and Petrol Stations Libraries <2km 2-4km 4-6km 6-8km 8-10km 10-12km 12-14km 14-16km >16km TotalNumber of rural households in the Authority within X km of a libraryLess Sparse 239 244 - - - - - - - 483 Town 168 - - - - - - - - 168 Village 71 244 - - - - - - - 315 Dispersed - - - - - - - - - -Sparse - - - - - - - - - - Town - - - - - - - - - - Village - - - - - - - - - - Dispersed - - - - - - - - - -Rural Total 239 244 - - - - - - - 483% of rural households in the Authority 49.5 50.5 - - - - - - - 100.0 in the Government Office Region 34.9 24.8 22.5 11.9 4.1 1.1 0.5 0.2 - 100.0
Petrol Stations <2km 2-4km 4-6km 6-8km 8-10km 10-12km 12-14km 14-16km >16km TotalNumber of rural households in the Authority within X km of a petrol stationLess Sparse 483 - - - - - - - - 483 Town 168 - - - - - - - - 168 Village 315 - - - - - - - - 315 Dispersed - - - - - - - - - -Sparse - - - - - - - - - - Town - - - - - - - - - - Village - - - - - - - - - - Dispersed - - - - - - - - - -Rural Total 483 - - - - - - - - 483% of rural households in the Authority 100.0 - - - - - - - - 100.0 in the Government Office Region 57.1 28.2 12.1 2.2 0.4 - - - - 100.0
Source: Countryside Agency
24
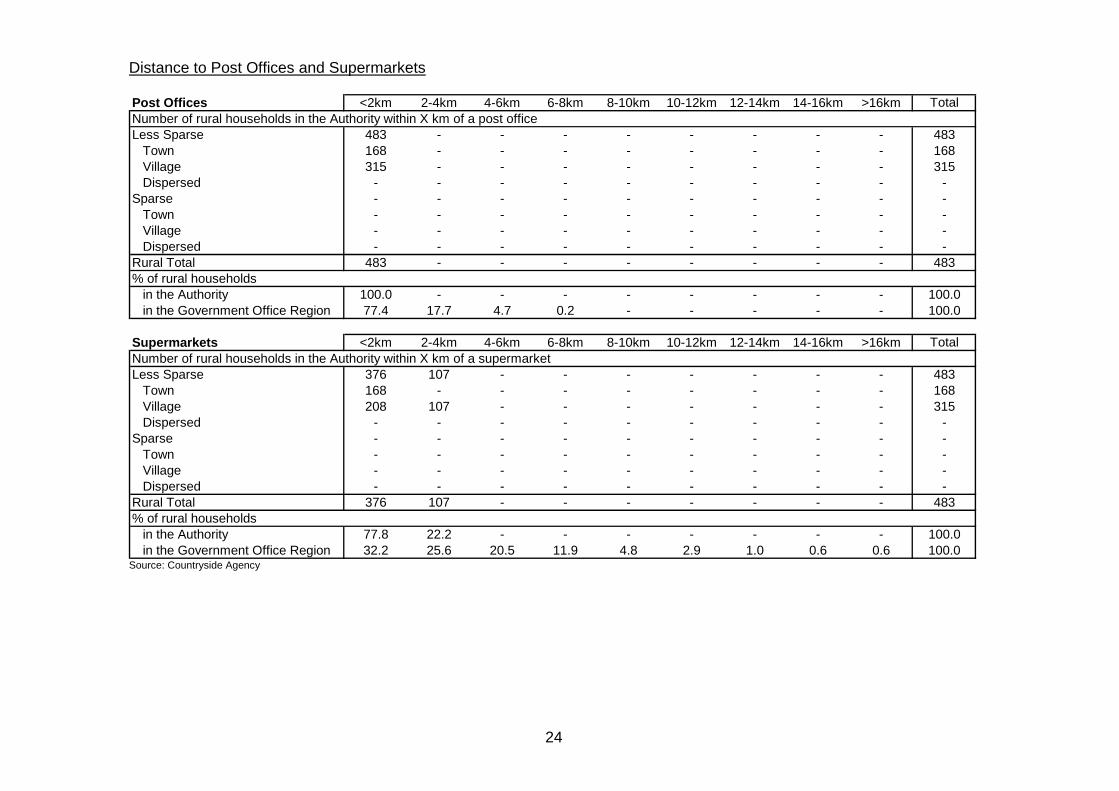
Distance to Post Offices and Supermarkets Post Offices <2km 2-4km 4-6km 6-8km 8-10km 10-12km 12-14km 14-16km >16km TotalNumber of rural households in the Authority within X km of a post officeLess Sparse 483 - - - - - - - - 483 Town 168 - - - - - - - - 168 Village 315 - - - - - - - - 315 Dispersed - - - - - - - - - -Sparse - - - - - - - - - - Town - - - - - - - - - - Village - - - - - - - - - - Dispersed - - - - - - - - - -Rural Total 483 - - - - - - - - 483% of rural households in the Authority 100.0 - - - - - - - - 100.0 in the Government Office Region 77.4 17.7 4.7 0.2 - - - - - 100.0
Supermarkets <2km 2-4km 4-6km 6-8km 8-10km 10-12km 12-14km 14-16km >16km TotalNumber of rural households in the Authority within X km of a supermarketLess Sparse 376 107 - - - - - - - 483 Town 168 - - - - - - - - 168 Village 208 107 - - - - - - - 315 Dispersed - - - - - - - - - -Sparse - - - - - - - - - - Town - - - - - - - - - - Village - - - - - - - - - - Dispersed - - - - - - - - - -Rural Total 376 107 - - - - - - - 483% of rural households in the Authority 77.8 22.2 - - - - - - - 100.0 in the Government Office Region 32.2 25.6 20.5 11.9 4.8 2.9 1.0 0.6 0.6 100.0
Source: Countryside Agency
25
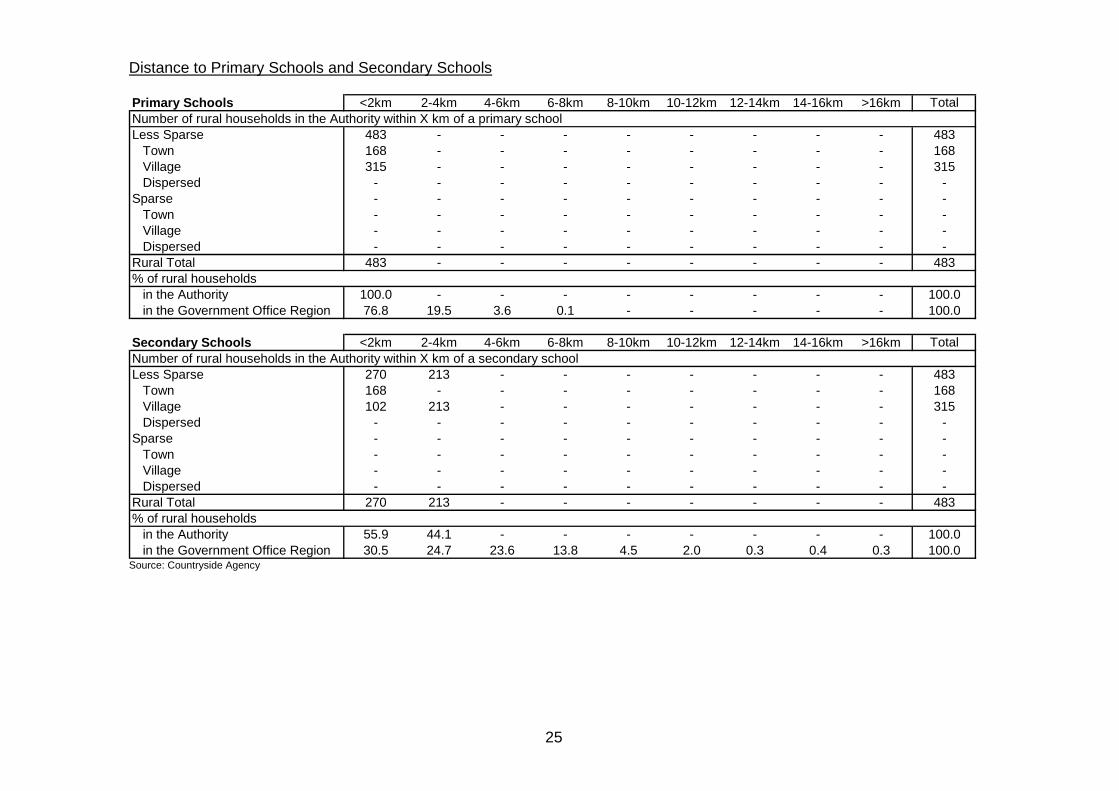
Distance to Primary Schools and Secondary Schools Primary Schools <2km 2-4km 4-6km 6-8km 8-10km 10-12km 12-14km 14-16km >16km TotalNumber of rural households in the Authority within X km of a primary schoolLess Sparse 483 - - - - - - - - 483 Town 168 - - - - - - - - 168 Village 315 - - - - - - - - 315 Dispersed - - - - - - - - - -Sparse - - - - - - - - - - Town - - - - - - - - - - Village - - - - - - - - - - Dispersed - - - - - - - - - -Rural Total 483 - - - - - - - - 483% of rural households in the Authority 100.0 - - - - - - - - 100.0 in the Government Office Region 76.8 19.5 3.6 0.1 - - - - - 100.0
Secondary Schools <2km 2-4km 4-6km 6-8km 8-10km 10-12km 12-14km 14-16km >16km TotalNumber of rural households in the Authority within X km of a secondary schoolLess Sparse 270 213 - - - - - - - 483 Town 168 - - - - - - - - 168 Village 102 213 - - - - - - - 315 Dispersed - - - - - - - - - -Sparse - - - - - - - - - - Town - - - - - - - - - - Village - - - - - - - - - - Dispersed - - - - - - - - - -Rural Total 270 213 - - - - - - - 483% of rural households in the Authority 55.9 44.1 - - - - - - - 100.0 in the Government Office Region 30.5 24.7 23.6 13.8 4.5 2.0 0.3 0.4 0.3 100.0
Source: Countryside Agency
26
Further information: All the information in this document, except the tables on “Access to Services”, has been calculated from the 2001 Census Univariate Tables for Census Output Areas published by the Office of National Statistics (http://www.statistics.gov.uk). Further information about the Census is available at: http://www.statistics.gov.uk/census2001/default.asp There are slight differences (e.g. in total population) between tables because of imputation for non-response and disclosure issues when using Output Area data. Overall the 2001 Census achieved a 98% response rate. For further information on the quality of data at Local Authority level please see: http://www.statistics.gov.uk/census2001/la.asp Each Output Area in England and Wales has been classified using the harmonised urban / rural definition published by the ONS on 2nd August 2004 in Bulletin 2004/14 (http://www.statistics.gov.uk/geography/bulletins/bulletin2004_14.asp). The Output Area urban/rural data was then aggregated to provide the urban / rural totals for the Local Authority, Government Office Regions and England. More information about the urban / rural definition is available at: http://www.statistics.gov.uk/geography/nrudp.asp The “Access to Services” information comes from the Countryside Agency. Defra’s website also has further information about rural affairs: http://www.defra.gov.uk/rural/default.htm Produced by: Defra, Rural Statistics Unit Email: [email protected] October 2004