Embed Size (px)
Citation preview
MARINE ECOLOGY PROGRESS SERIES Mar. Ecol. Prog. Ser.
Published October 8
Stoichiometric variations of NI P, C and O2 during a Gymnodinium catenatum red tide and their
interpretation
F. Fraga, F. F. Perez, F. G. Figueiras, A. F. Rios
Instituto de Investigaciones Marifias, CSIC, Eduardo Cabello 6, E-36208 Vigo, Spain
ABSTRACT The chemical parameters 'NO', 'PO' and 'CO' are constants that remain invariable during photosynthesis or remineralization of organic matter. Nevertheless, exceptionally, during a red tide these parameters are no longer constant. Their vertical variation during a Gymnodinium catenatum red tide in the Ria de Vigo, Spain, in October 1986 is described. Stoichiometric equations are obtained for biomass synthesis in the superficial water layer and in the nutricline which are adjusted to the experimental data. From these chemical parameters a new parameter 'NCO' is calculated which remains constant in both normal phytoplankton populations and dinoflagellates endowed with vertical migration and differential synthesis of cellular compounds. With this parameter, the oxygen loss to the atmosphere during the red tide was estimated and a good fit was found with that calculated from the diffusion. This permits the calculation of net accumulated production. From the same parameters, the vertical transport of nutrients produced by the migration of the dinoflagellates is quantified. A good agreement with the spatial distribution of total nitrogen (organic and inorganic) is obtained, if the carbohydrate consumption in respiration is taken into account.
INTRODUCTION
The 'NO', 'PO' and 'CO' parameters proposed by Broecker (1974) are chemical constants characteristic of each type of water. These are independent of the variation of nutrient salts by photosynthesis or organic matter mineralisahon and also of the gain or loss of particulate organic matter by sedimentation or trans- port from one water layer to another, as long as biochemical transformations follow Redfield stoichiometry. If an alkalinity correction is introduced ('CAO'; Rios et al. 1989), these parameters are still independent of the precipitation or dissolution of the calcium carbonate. Although these parameters were initially proposed for ocean water where No3 is the dominant form of dissolved inorganic nitrogen (DIN), Rios et al. (1989) have introduced a correction for less oxidized forms than nitrate, such as nitrite and ammonia. This means that these parameters are useful in coastal waters where these ions can reach high concentrations.
However, in a red tide produced by dinoflagellates with d e l vertical migration, Figueiras & Fraga (1990) showed that these parameters do not remain constant.
In general, during a red tide of vertically migrating dinoflagellates, the surface water is stripped of nutrients. As a consequence, during the day the dino- flagellates can only accumulate reserve substances and oxygen production is not accompanied by DIN consumption. At night, the dinoflagellates migrate to deeper layers until they find nutrients, taking in nitrate (Eppley et al. 1968, Cullen et al. 1985) and phosphate (Watanabe e t al. 1988) for proteins and nucleic acid synthesis, using chemical energy stored a s carbohydrates. Consequently there is a utilization of nutrient salts which is not compensated by oxygen production.
These anomalies in Broecker's parameters are always produced when the synthesis or utilization of organic matter does not fulfil Redfield's ratio. This is what happens in red tides with vertically migrating species which use carbohydrates to store energy during the day.
A new 'NCO' (Nitrate-CO2-Oxygen) parameter is proposed here which fulfils all the conditions of Broec- ker's parameters and also remains invariable in spite of the vertical nutrient transport produced by dinoflagel- late migration.
O Inter-Research 1992
124 Mar. Ecol. Prog. Ser 87: 123-134, 1992
Table 1. Llst of some terms and equalit~es used in the text. All parameters in inverted commas are expressed in 0 2 ~tmol kg-' The experimental data used in this paper are expressed in ~ ~ r n o l kg-'
RC = -A02/AC:
RN = -A02/AN: I Ratios of the stolchiometric equation ( E q 6)
RP = -A02/AP:
0 2 r o r r :
J O2 after the oxidation of all NO2- and NH4- and NH4- to No3-
02,,,, = 0, - 0.5 NO2- + 2 NH4'
Ni, = NO3 + NO2 + NH4: Dissolved inorganic nitrogen (DIN)
'NO' = 0 2 c o r r + N l n - R ~ 'PO' = OZcorr + PO4 RP
'CO' = O,,,,, + CO2-RC
'CAO': 'CO' corrected for alkalinity changes from CaC03 precipitation
R = -A'CAO'/A'NO' = A'CAO'IA'PO' = (Rc-l) 'NCO': 'NO' corrected for uncoupled N vs C assimilation 'NCO' = 'NO' + ('CAO' - 'NO')/Rc
'PCO': 'PO' corrected for uncoupled P vs C assimilation
'PCO' = 'PO' + ('CAO' - 'PO')/Rc &'NCO' or A'TCO': Medsurement of the O2 interchange with the atmosphere
A'NCO' + A 0 2 or A'PCO' + AO,: Net production expressed in pm01 of oxygen A'NO' - A'NCO': Excess carbohydrates synthesized in one water body and used in another
This new parameter facilitates the calculation of the chemico-biological changes produced in the sea during the red tide. This parameter, like Broecker's, varies with the oxygen interchange between the sea and the atmosphere. Anomalies in it a re , therefore, a quantita- tive measure of the loss of gaseous oxygen to the atmo- sphere, with a n error of ca 7 O/O.
Quantitative knowledge of the oxygen loss permits the calculation of real oxygen production from the oxygen increase found in the water and also the calcula- tion of net production accumulated during the red tide.
In addition, a s will be seen later, the ('NCO'-'NO') anomaly can be used as a quantitative measure of
transport of carbohydrates synthesized in the surface layer during the day and used in the nutricline during the night. These carbohydrates are used in the synthesis of proteins from nitrate and respirabon (Cullen 1985). Consequently, there is a downward transport of carbon in the form of carbohydrates and an equivalent upward transport of nitrogen as cellular proteins. The difference between the transport of calculated nitrogen and the real transportation deduced from distribution of total N permits the calculation of the proportion of carbohyd- rates used up in the synthesis of the proteins and nucleic acids and that used in the respiration and mechanical work necessary for vertical migration.
,-. Ria de Vigo
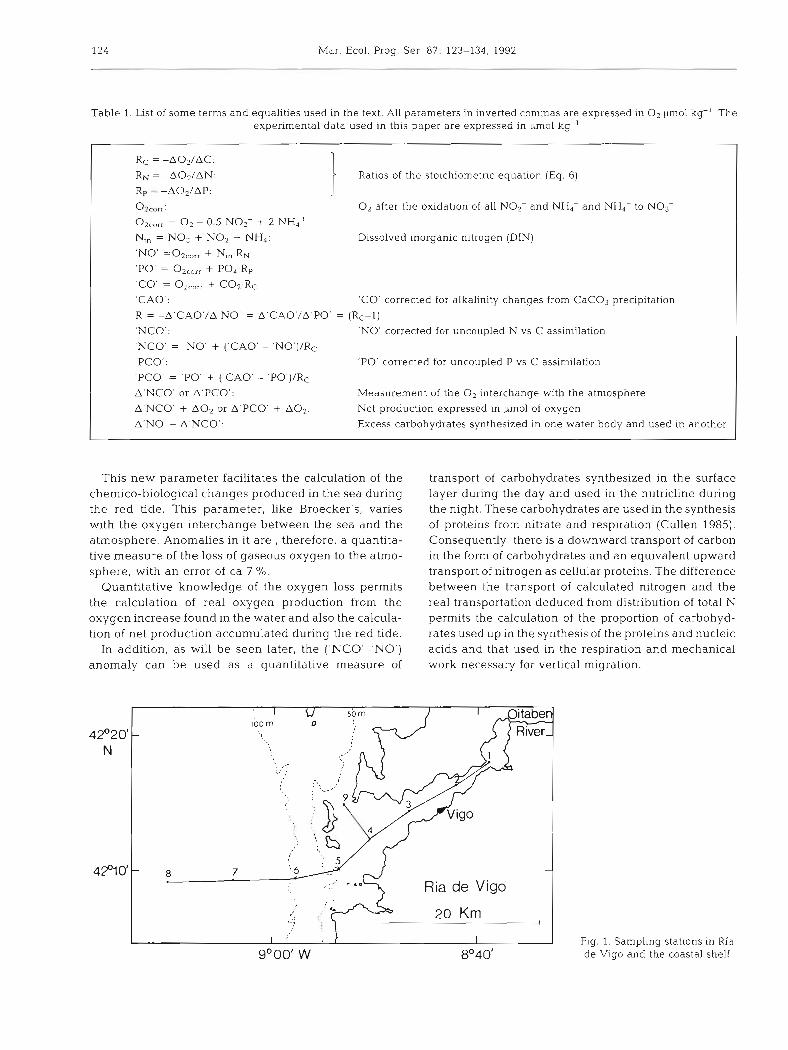
Fig. 1. Sampling statlons in Ria de Vigo and the coastal shelf
Fraga et al.: Chemical parameters during a red tide 125
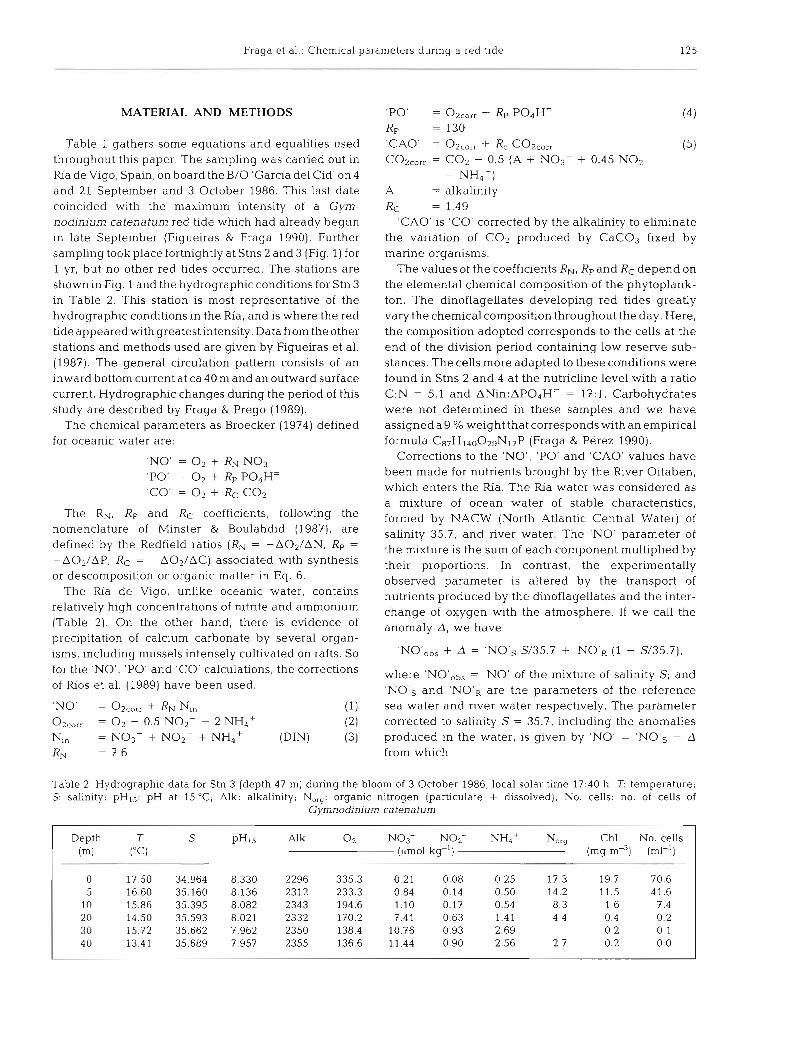
MATERIAL AND METHODS
Table 1 gathers some equations and equalities used throughout this paper. The sampling was carried out in Ria de Vigo, Spain, on board the B/O 'Garcia del Cid' on 4 and 21 September and 3 October 1986. This last date coincided with the maximum intensity of a Gym- nodinium catenatum red tide which had already begun in late September (Figueiras & Fraga 1990). Further sampling took place fortnightly at Stns 2 and 3 (Fig. 1) for 1 yr, but no other red tides occurred. The stations are shown in Fig. 1 and the hydrographic conditions for Stn 3 in Table 2. This station is most representative of the hydrographic conditions in the Ria, and is where the red tide appeared with greatestintensity. Data from the other stations and methods used are given by Figueiras et al. (1987). The general circulation pattern consists of an inward bottom current at ca 40 m and an outward surface current. Hydrographic changes during the period of this study are described by Fraga & Prego (1989).
The chemical parameters as Broecker (1974) defined for oceanic water are:
'NO' 0 2 + RN NOs- 'PO' = O2 + RP P04H= 'CO' = 0 2 + RC CO2
The RN, RP and RC coefficients, following the nomenclature of Minster & Boulahdid (1987), are defined by the Redfield ratios (RN = -A02/AN, RP =
-A02/AP, RC = -A02/AC) associated with synthesis or descomposition or organic matter in Eq. 6.
The Ria de Vigo, unlike oceanic water, contains relatively high concentrations of nitrite and ammonium (Table 2). On the other hand, there is evidence of precipitation of calcium carbonate by several organ- isms, including mussels intensely cultivated on rafts. So for the 'NO', 'PO' and 'CO' calculations, the corrections of Rios et al. (1989) have been used.
'NO' = OzCorr + RN N,, (1) OzCorr = O2 - 0.5 NO2- - 2 NH4+ (2)
Nin = NO3- + NO2- + NH4+ (DIN) (3) RN = 7.6
'PO' = Ozcorr + RP PO4HZ RP = 130 'CAO' = 0 2 c o r r + Rc CO2corr CO2,,,, = CO2 - 0.5 (A + NO3- + 0.45 NO2-
- NH4+) A = alkalinity
RC = 1.49 'CAO' is 'CO' corrected by the alkalinity to eliminate
the variation of CO2 produced by CaC03 fixed by marine organisms.
The values of the coefficients RN, RP and RC depend on the elemental chemical composition of the phytoplank- ton. The dinoflagellates developing red tides greatly vary the chemical composition throughout the day. Here, the composition adopted corresponds to the cells at the end of the division period containing low reserve sub- stances. The cells more adapted to these conditions were found in Stns 2 and 4 at the nutricline level with a ratio C:N = 5.1 and ANin:AP04H' = 17: l . Carbohydrates were not determined in these samples and we have assigneda 9 % weight that correspondswith an empirical formula C87H140029N17P (Fraga & Perez 1990).
Corrections to the 'NO', 'PO' and 'CAO' values have been made for nutrients brought by the River Oitaben, which enters the Ria. The Ria water was considered as a mixture of ocean water of stable characteristics, formed by NACW (North Atlantic Central Water) of salinity 35.7, and river water. The 'NO' parameter of the mixture is the sum of each component multiplied by their proportions. In contrast, the experimentally observed parameter is altered by the transport of nutrients produced by the dinoflagellates and the inter- change of oxygen with the atmosphere. If we call the anomaly A, we have
'NO'ob, + A = 'NO', ,935.7 + 'NO'R (1 - S/35.7),
where 'NO'ob, = 'NO' of the mixture of salinity S; and 'NO's and 'NO'R are the parameters of the reference sea water and river water respectively. The parameter corrected to salinity S = 35.7, including the anomalies produced in the water, is given by 'NO' = 'NO's - A from which
Table 2. Hydrographic data for Stn 3 (depth 47 m) during the bloom of 3 October 1986, local solar time 17:40 h. T: temperature; S: salinity; pHl5. pH at 15 "C; Alk: alkalinity; N,,,: organic nitrogen (particulate + dissolved); No. cells: no. of cells of
Gymnodinium catenatum
Depth T S P H ~ S Alk O2 NOs- NOz- NH,+ No,, Chl No. cells (m) ("C) (vmol kg-') (mg mJ) (ml-l)
0 17.50 34.964 8.330 2296 335.3 0.21 0.08 0.25 17.3 19.7 70.6 5 16.60 35.160 8.136 2312 233.3 0.84 0.14 0.50 14.2 11.5 41.6
10 15.86 35.395 8.082 2343 194.6 1.10 0.17 0.54 8.3 1.6 7.4 20 14.50 35.593 8.021 2332 170.2 7.41 0.63 1.41 4.4 0.4 0.2 30 15.72 35.662 7.962 2350 138.4 10.76 0.93 2.69 0.2 0.1 40 13.41 35.689 7.957 2355 136.6 11.44 0.90 2.56 2.7 0.2 0.0
126 Mar Ecol. Prog Ser 87: 123-134, 1992
'NO' = 'NO',bs + ( 'NO's - 'NO'R) (1 - 5/35.?), 200 'NO' 300
The river water parameters were calculated from 0
samples taken a t the river mouth. The values obtained m
for 'NO'R, 'PO'R and 'CAO'R were 422, 554 and 322 b~mol kg-' respectively; their variability was very small on this date. For the reference sea water (S = 35.7 and 10
T = 13.0 "C) 'NO'S, 'PO's and 'CAO's were 261, 280 and 1650 respectively.
The 'NO' and 'PO' corrections are small and only affect Stns 1 and 2. The 'CAO' correction is somewhat 20
larger due to the difference between the sea and river water, and affects the surface water of the whole Ria.
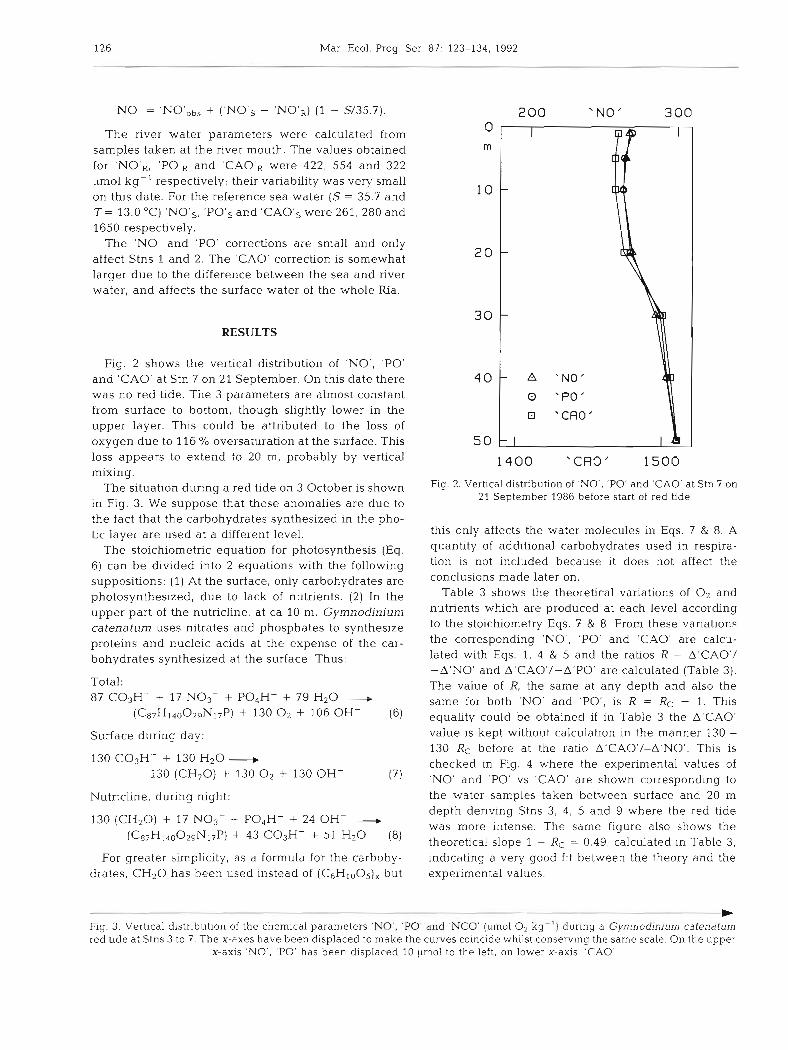
30 RESULTS
Fig. 2 shows the vertical distribution of 'NO', 'PO' and 'CAO' at Stn 7 on 21 September. On this date there was no red tide. The 3 parameters are almost constant from surface to bottom, though slightly lower in the upper layer. This could be attributed to the loss of oxygen due to 116 % oversaturation at the surface. This loss appears to extend to 20 m, probably by vertical mixing.
The situation during a red tide on 3 October is shown in Fig. 3. We suppose that these anomalies are due to the fact that the carbohydrates synthesized in the pho- tic layer are used at a different level.
The stoichiometric equation for photosynthesis (Eq. 6) can b e divided into 2 equations with the following suppositions: (1) At the surface, only carbohydrates are photosynthesized, due to lack of nutrients. (2) In the upper part of the nutricline, at ca 10 m, Gyrnnodinium catenatum uses nitrates and phosphates to synthesize proteins and nucleic acids at the expense of the car- bohydrates synthesized at the surface. Thus:
Total: 87 C03H- + 17 NO3- + P04H' + 79 H 2 0
(C87H140029N17P) + 130 O2 + 106 OH- ( 6 )
Surface during day:
130 C03H- + 130 H 2 0 + 130 (CH20) + 130 0, + 130 OH- (?)
Nutricline, during night:
130 (CH20) + 17 NO3- -I P04H' + 24 OH- - (C87H140029N17P) + 43 C03H- + 51 H20 (8)
For greater simplicity, as a formula for the carbohy- drates, C H 2 0 has been used instead of (C6H1005)x but
1400 'CFIO' 1500
Fig. 2. Vertical distribution of 'NO', 'PO' and 'CAO' a t Stn 7 on 21 September 1986 before start of red bde
this only affects the water molecules in Eqs. 7 & 8. A quantity of additional carbohydrates used in respira- tion is not included because it does not affect the conclusions made later on.
Table 3 shows the theoretical variations of O2 and nutrients which are produced at each level according to the stoichiometry Eqs. 7 & 8. From these variations the corresponding 'NO', 'PO' and 'CAO' are calcu- lated with Eqs. 1, 4 & 5 and the ratios R = A'CAO'I -A'NO' and A'CAO'/-A'PO' are calculated (Table 3). The value of R, the same at any depth and also the same for both 'NO' and 'PO', is R = RC - 1. This equality could be obtained if in Table 3 the A'CAO' value is kept without calculation in the manner 130 - 130 RC before at the ratio A'CAO'/-A'NO'. This is checked in Fig. 4 where the experimental values of 'NO' and 'PO' vs 'CAO' are shown corresponding to the water samples taken between surface and 20 m depth deriving Stns 3, 4 , 5 and 9 where the red tide was more intense. The same figure also shows the theoretical slope 1 - RC = 0.49, calculated in Table 3, indicating a very good fit between the theory and the experimental values.
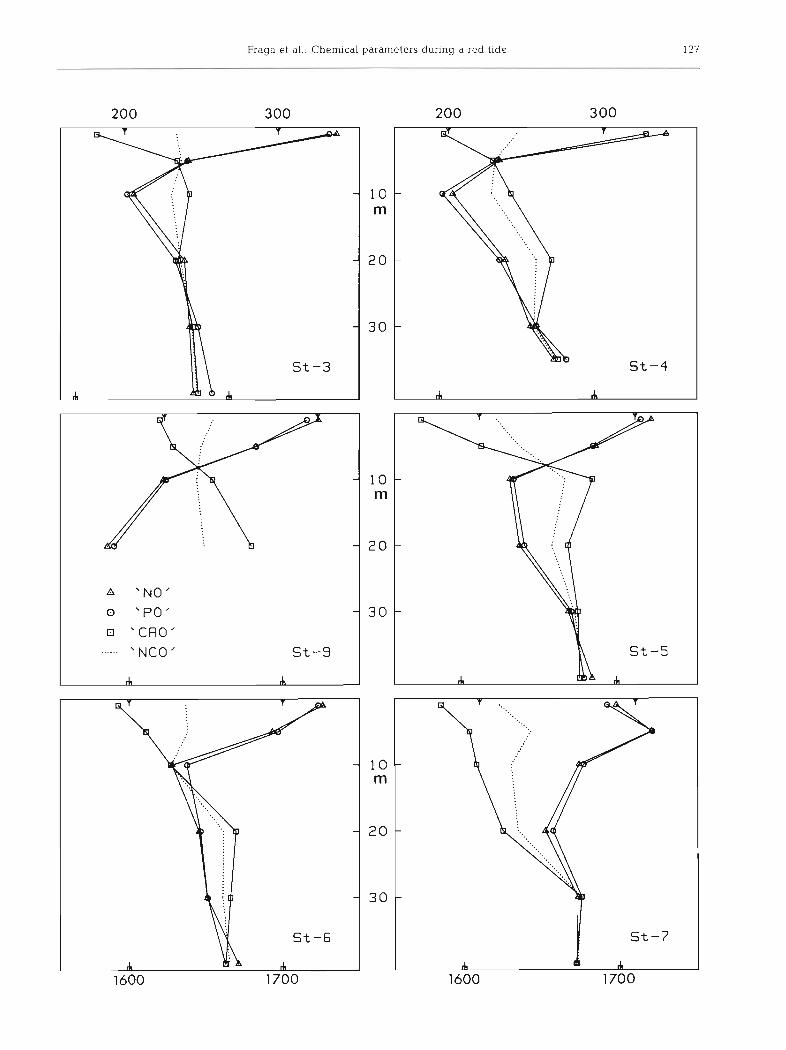
Fig. 3. Vert~cal distribution of the chemical parameters 'NO', 'PO' and 'NCO' (pm01 O2 kg-') during a Gymnodinium catenatum red tide at Stns 3 to 7. The X-axes have been displaced to make the curves coincide whilst conserving the same scale On the upper
x-axis 'NO ' , 'PO' has been displaced 10 umol to the left, on lower X-axls, 'CAO'
128 Mar. Ecol. Prog. Ser. 87: 123-134, 1992
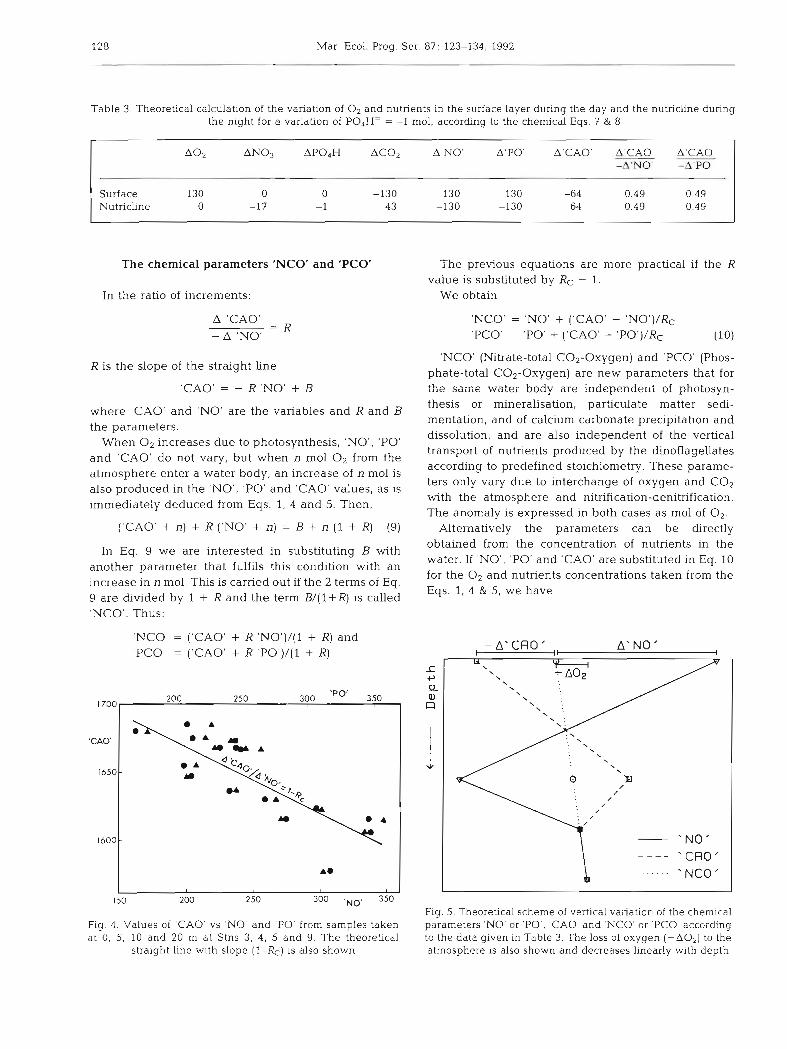
Table 3. Theoretical calculation of the variation of 0 2 and nutrients in the surface layer during the day and the nutricline during the night for a variation of P04H= = -1 mol, according to the chemical Eqs. 7 & 8
A02 AN03 AP04H AC02 A'NO' A'PO' A'CAO' A'CAO' A'CAO' -A'NO' -A'PO'
Surface 130 0 0 -130 130 130 -64 0.49 Nutricline 0 -17 - 1 4 3 -130 -130 64 0.49 0.49 0 4 9 1
The chemical parameters 'NCO' and 'PCO' The previous equabons are more practical if the R value is substituted by RC - 1.
In the ratio of increments: We obtain
A 'CAO' = R
- A 'NO'
R is the slope of the straight line
'CAO' = - R 'NO' + 3 where 'CAO' and 'NO' are the variables and R and B the parameters.
When O2 increases due to photosynthesis, 'NO', 'PO' and 'CAO' do not vary, but when n m01 O2 from the atmosphere enter a water body, an increase of n m01 is also produced in the 'NO', 'PO' and 'CAO' values, as is immediately deduced from Eqs. 1, 4 and 5. Then,
( 'CAO' + n) + R ( 'NO' + n) = B + n (1 + R) (9 )
In Eq. 9 we are interested in substituting B with another parameter that fulfils this condition with an increase in n mol. This is carried out if the 2 terms of Eq. 9 are divided by 1 + R and the term BI(1 +R) is called 'NCO'. Thus:
'NCO' = ('CAO' + R 'N0 ' ) / (1 + R) and 'PCO' = ('CAO' + R 'P0 ' ) / (1 + R)
Fig. 4. Values of 'CAO' vs 'NO' and 'PO' from samples taken at 0, 5, 10 and 20 m at Stns 3. 4, 5 and 9. The theoretical
straight line with slope (l-RC) is also shown
'NCO' = 'NO' + ('CAO' - 'NO')/Rc 'PCO' = 'PO' + ('CAO' - 'PO')/Rc (10)
'NCO' (Nitrate-total CO2-Oxygen) and 'PCO' (Phos- phate-total CO2-Oxygen) are new parameters that for the same water body are independent of photosyn- thesis or mineralisation, particulate matter sedi- mentation, and of calcium carbonate precipitation and dissolution, and are also independent of the vertical transport of nutrients produced by the dinoflagellates according to predefined stoichiometry. These parame- ters only vary due to interchange of oxygen and CO2 with the atmosphere and nitrification-denitrification. The anomaly is expressed in both cases as m01 of 02.
Alternatively the parameters can be directly obtained from the concentration of nutrients in the water. If 'NO', 'PO' and 'CAO' are substituted in Eq. 10 for the O2 and nutrients concentrations taken from the Eqs, 1, 4 & 5, we have
- A ' C f l O ' ,, A 'NO' I
- - - - 'CRO' ...... 'NCO'
Flg 5. Theoretical scheme of vertical variation of the chemical parameters 'NO' or 'PO', 'CAO' and 'NCO' or 'PC0 according to the data given in Table 3. The loss of oxygen (-A02) to the atmosphere is also shown and decreases linearly with depth

Fraga et al.. Chemical parameters during a red tide 129
Table 4. Loss of O2 in the Ria de Vigo during the red tide, calculated from interchange with the atmosphere and the 'PCO' anomaly. 020/0: O2 saturation of the surface water; t : time (d) spent by the surface water in moving from the previous station (at Stn 9, it is assumed that water comes directly from Stn 3 without passing through Stn 4); 0,: loss of oxygen (mmol m-2), during the time t ; bt: total time (d) spent by surface water in moving from Stn 2 to each station; Loss 0 2 : loss of O2 (mmol mW2) during the whole course from Stn 2, taking into account the local conditions encountered on each date in the same body of water; Anomaly
'PCO'. loss of oxygen determined by the integration of 0 to 20 m of the 'PCO' anomaly; A: Loss O2 -Anomaly 'PCO'
Stn 4 Sep 21 Sep 3 Oct bt Loss Anomaly 021:, t OP 021:-, t 0 P 02% t OP O2 'PCO' A
2 107 0 0 97 0 0 84 0 0 0 0 0 0 3 121 3.3 74 118 1.0 12 142 3.3 68 3.3 68 77 9 4 123 3.8 136 122 1.8 57 143 3.8 255 7.1 323 376 53 5 93 3.8 49 110 2.8 70 131 3.8 223 10.9 292 360 68 6 106 - 110 4.8 77 136 5.4 291 15.7 430 390 - 4 0 7 111 - 116 7.2 152 121 8.6 394 22.9 610 625 15 8 109 - 108 - - 118 10.3 320 32.9 808 829 21 9 103 - 113 - - 126 5.7 310 9.0 322 360 38
'NCO' = Ozcorr + + N,, R,(1 - l / R c ) 'PCO' = Ozcorr + CO2,,,, + PO, Rp(l - l / R c ) (11)
Fig. 5 shows the theoretical variations of the chemi- cal parameters using the data in Table 3. Oxygen loss to the atmosphere is also included. The maximum 'NO' and 'CAO' differences are produced at the sur- face and in the upper part of the nutricline where the nutrients NO3- and P04H' begin to be limiting.
The line of points shows the vertical distribution of 'NCO' or 'PCO' for Eq. 10. It is assumed that the loss of oxygen decreases linearly with depth. This makes all the parameters tend towards lower values, and the 'NCO' deviation is the loss of 0, to the atmosphere.
Fig. 3 shows the variations of these parameters in the Ria during the red tide. They correspond quite well with the theoretical scheme in Fig. 5, and it seems reasonable to suppose that the growth of Cymnodinium catenatum takes place in accordance with Eqs. 7 & 8.
Stn 3 best fits the theoretical model. Here upwel-
ling, although weak at this time, was more marked than at the other stations, and diffusion had less impact on the general scheme. The top of the nut- rient layer is at ca 10 m, a depth easily reached by Gymnodinium catenatum which can migrate a t speeds greater than 1.2 m h-'. Fraga et al. (1989) measured the swimming speed of G. catenatum from the Ria de Vigo at 1.5 m h-' at 23°C for 8 cell chains, and higher values for longer chains. The average temperature of the Ria during this red tide was only 16°C but the G. catenatum chains contained between 8 and 16 cells.
'NO'-'CAO' differences were found at increasing depth, towards the month of the Ria. These must be attributed to vertical mixing of bottom water into the nutricline affected by dinoflagellate activity, rather than to the direct activity of dinoflagellates a t these depths. On the shelf, the nutricline deepens from ca 15 m at Stn 7 to 25 m at Stn 8. Consequently, the cells can no longer take in nutrients and the popula- tion is diminished.
Stn 8 7 6 5 4 3 2
Fig. 6. Vertical distribution of the oxygen loss in pm01 kg-' in Ria de Vigo during the red tide calculated with the anomaly of 'PCO' taking as a reference the water of Stn 6 between 30 and
40 m ('PCO' = 1200)
130 Mar Ecol. Prog. Ser. 87: 123-134, 1992
Loss of oxyxgen to the atmosphere To verify the values obtained, oxygen loss has also been calculated from the velocity of the air-water lnter-
Oxygen production was intense during the red tide change due to oversaturation, from wind speed and (Table 4) and caused over 142 % saturation with conse- from the time it remains at the surface. quent loss of oxygen to the atmosphere, and a decline Oxygen flow per unit area is given by Kester (1975) in 'NCO' and 'PCO' values. These can also vary with the entry of CO2 from the atmosphere but the CO2 flux d02 /d t = e (p - P)/K
rate is negligible when compared with that of oxygen, taking into account that the variations of free CO2 are only 0.6 % of the total CO2 variations. As a result, the 'NCO' or 'PCO' anomalies allow us to calculate oxygen loss. Using phosphate we have
where p and P = partial O2 pressures in sea water and air respectively; K = constant of Henry's law for 02; and e = diffusion rate which depends mainly on wind speed at the water surface.
Kester (1975) cites a value for the constant of e = 0.8 - A 0 2 = 'PCO' - 'PCOfs X 1 0 - ~ cm S-' for winds between 0 and 3 m S - ' . These
were the values for this area during the month. where 'PCO' is calculated from Eq. 10 or 11 for each
On the other hand, (p - P)/K is the oversaturation of sample, and 'PCO's is the reference parameter 'PCO's
oxygen. If this e value is expressed in m d-l , we have = 280 + (1650 - 280)/1.49.
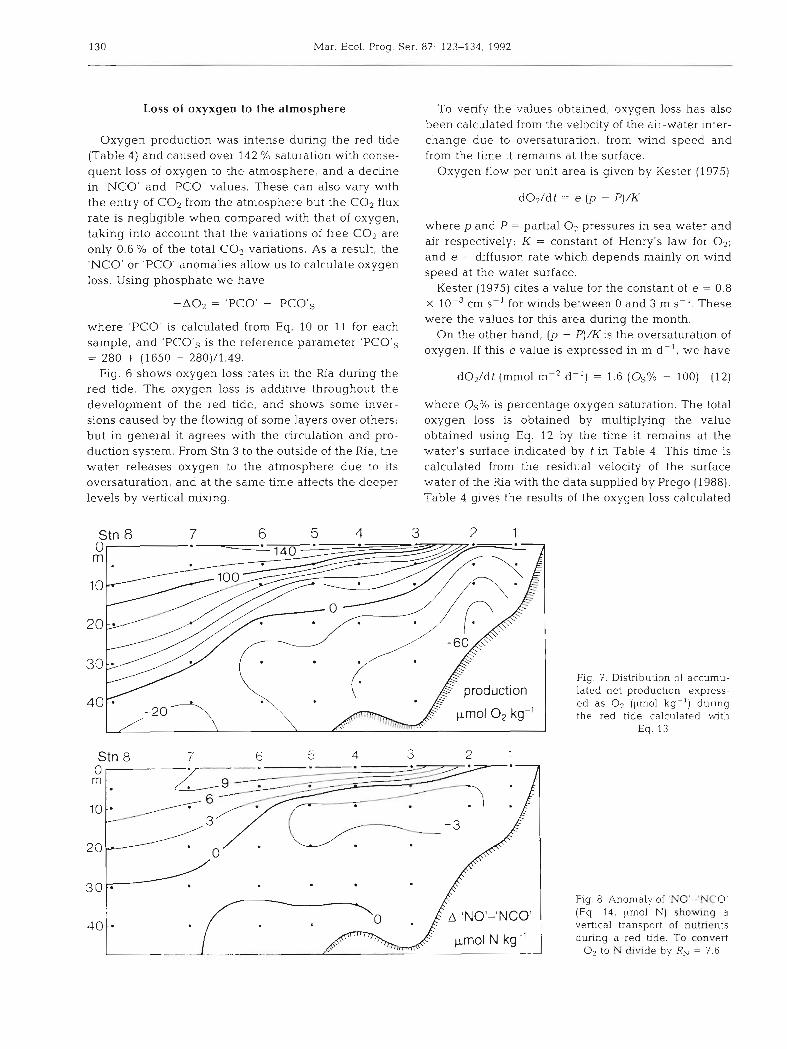
Fig. 6 shows oxygen loss rates in the Ria during the red tide. The oxygcn loss is additive throughout the development of the red tide, and shows some inver- sions caused by the flowing of some layers over others; but in general it agrees with the circulation and pro- duction system. From Stn 3 to the outside of the Ria, the water releases oxygen to the atmosphere due to its oversaturation, and at the same time affects the deeper levels by vertical mixing.
where OS% is percentage oxygen saturation. The total oxygen loss is obtained by multiplying the value obtained using Eq. 12 by the time it remains at the water's surface indicated by t in Table 4 . This time is calculated from the residual velocity of the surface water of the Ria with the data supplied by Prego (1988). Table 4 gives the results of the oxygen loss calculated
Stn 8 7 6 5 4 3 2 1
Stn 8 7 6 5 4 3 2 1
Fig. 7. Distribution of accumu- lated net production, express- ed as O2 (pm01 kg-') during the red tide calculated with
Eq. 13
Fig. 8. Anomaly of 'NO'-'NCO' (Eq. 14 , umol N) showng a vertical transport of nutrients during a red t~de. To convert
O2 to N divide by RN = 7.6
Fraga et a1 . Chemical parameters d u r ~ n g a red tide 131
from the speed of interchange with the atmosphere and that calculated from the 'PCO' anomaly. The results obtained by different methods are similar.
Net production
Net production is sometimes measured by oxygen production (Minas et al. 1986), but as has been indi- cated, the oxygen loss makes this method unsuitable in red tides. Furthermore, neither carbon dioxide nor phosphate and nitrate can be used because their uptake mechanisms vary with depth.
The accunlulated net production is given by the oxygen increase 02-Ozs plus its loss to the atmosphere 'PCO',-'PCO'
where 02S = oxygen content of the reference water at the moment of its entry into the Ria before reaching the photosynthetic zone. Its values were 'PCO', = 1200 and OZS = 169 pm01 kg-'. The 'PCO' and O2 values are the variables which correspond to each sample.
Fig. 7 shows the net production distribution which is very similar to the dissolved oxygen distribution (Fraga & Prego 1989). The maximum production accumulated is found in the surface water at Stn 5, which reaches 151 pm01 kg-' expressed as O2 which, divided by RC, gives 101 ,pm01 kg-' expressed as car- bon. If the time lapse of 9 d between Stns 2 and 5 is taken into account, according to the data in Table 4, the net production was 141 pg C I-' d-'. If there were no oxygen loss to the atmosphere, the O2 concen- tration at Stn 5 would be 373 ymol kg-' with a satura- tion of 158 %,, In an earlier red tide, in July 1984, a greater saturation of 161 % was found (Mourino et al. 1985). In Fig. 7, 2 mineralisation zones are found, at Stn 2 at 20 m and at Stn 7 at 50 m. Both coincide with high nitrite concentrations.
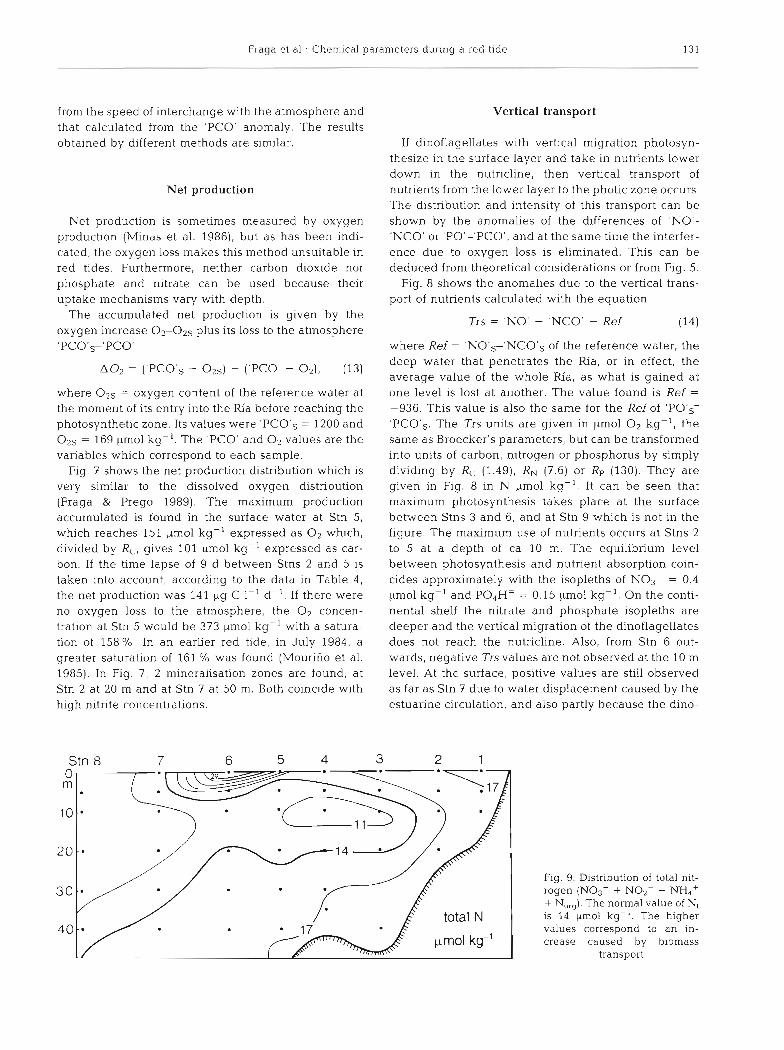
Vertical transport
If dinoflagellates with vertical migration photosyn- thesize in the surface layer and take in nutrients lower down in the nutricline, then vertical transport of nutrients from the lower layer to the photic zone occurs. The distribution and intensity of this transport can be shown by the anomalies of the differences of 'NO'- 'NCO' or 'PO'-'PCO', and at the same time the interfer- ence due to oxygen loss is eliminated. This can be deduced from theoretical considerations or from Fig. 5.
Fig. 8 shows the anomalies due to the vertical trans- port of nutrients calculated with the equation
Trs = 'NO' - 'NCO' - Ref (14)
where Ref = 'NO's-'NCO's of the reference water, the deep water that penetrates the Ria, or in effect, the average value of the whole Ria, as what is gained at one level is lost at another. The value found is Ref =
-936. This value is also the same for the Ref of 'PO's- 'PCO's. The Trs units are given in pm01 O2 kg-', the same as Broecker's parameters, but can be transformed into units of carbon, nitrogen or phosphorus by simply dividing by RC (1.49), RN (7.6) or RP (130). They are given in Fig. 8 in N ,pm01 kg-'. It can be seen that maximum photosynthesis takes place at the surface between Stns 3 and 6, and at Stn 9 which is not in the figure. The maximum use of nutrients occurs at Stns 2 to 5 at a depth of ca 10 m. The equilibrium level between photosynthesis and nutrient absorption coin- cides approximately with the isopleths of NO3- = 0.4 pm01 kg-' and P04H= = 0.15 pm01 kg-'. On the conti- nental shelf the nitrate and phosphate isopleths are deeper and the vertical migration of the dinoflagellates does not reach the nutricline. Also, from Stn 6 out- wards, negative Trs values are not observed at the 10 m level. At the surface, positive values are still observed as far as Stn 7 due to water displacement caused by the estuarine circulation, and also partly because the dino-
Stn 8 7 6 5 4 3 2 1
total N 1 40 , ,
pmol kg-'
Fig. 9. Distribution of total nit- rogen (NO3- + NOz- + NH,+ + N,,,). The normal value of N, is 14 pm01 kg-'. The higher values correspond to an in- crease caused by biomass
transport
132 Mar. Ecol. Prog. Ser. 87: 123-134, 1992
flagellates can still continue synthesizing carbohydrate reserves.
Respiration and energy consumption in the die1 vertical migration
The Trs value is really a transport of carbon in the form of carbohydrates, from the level where they were synthesized to the level where they are used. If all the carbohydrate is used in the synthesis of proteins and nucleic acids from nitrates and phosphates, the upward vertical transport of nitrogen and phosphorus coincides with the Trs value. However at the nutricline level, some of these carbohydrates are used for respiration, implying that vertical nitrate transport is depleted by that amount.
To compare the real and calculated values of nitro- gen transport, Fig. 9 shows total nitrogen (N,) values in the whole Ria. This is the sum of Ni, (NO3- + NO2- + NH4+) and No,, (organic nitrogen).
The average total nitrogen value is 14 pm01 kg-', indicated in Fig. 9 by a thicker line. Thus, there is a genuine transport of nitrogen from 10 m at Stns 2 to 5 to the surface at Stns 3 to 6. The high N, values found in the surface water cannot be attributed to river inputs since at Stn 1, which is that most affected by the river (S = 33.8), the N, value of 16.2 pm01 kg-' is lower than at Stns 2 and 3 with N, of 17.6 and 17.9 ymol kg-' respectively, and S of 34.7 and 35.0.
The distribution of particulate nitrogen (N,) and therefore that of N, depends on the time of sampling. This is due to the vertical migration. The samples were taken during the day, so that all the dinoflagellates were in the photic layer (see Table 2) . Therefore the nitrogen from the nutricline is at this time at the surface in biomass form.
The red tide appeared with greater intensity at Stns 3, 4, 5, 6 and 9. A calculation was made for these stations of the average difference between the levels at 0 and 10 m. For total nitrogen (Fig. 9) it is AN = 8.97 wmol kg-' and the calculated transport (Fig. 8) is AN =
13.84 pm01 kg-'. According to this, 65 % of the car- bohydrates are used for the synthesis of proteins and nucleic acids and 35 % are used in respiration.
A difficulty in the interpretation of the results is due to sedimentation of particulate matter. At Stns 7 and 8 the nitrate concentration at 20 m was lower than 1 pm01 kg-' and the dinoflagellates were unable to reach the nutricline. The population was lower and marked sedimentation of particulate matter occurred. This can be detected in Fig. 9 by the low N, content in the whole water column. The sedimented material is carned towards the coast between depths of 60 to 90 m. Part of this material is found in the deep water in the interior of
the Ria, as can be seen in Fig. 9 by an above average N, value. However it is also possible that part comes from the drect sedimentahon of the particulate matter pro- duced in the Ria. If there is particulate matter sedimen- tation from the surface to the lower levels the transport calculation will be diminished and the quantity used in respiration would be overestimated.
The anomalies due to sedimentation of particulate organic nitrogen do not appear in Fig. 8 because both 'NO' and 'NCO' are independent of sedimentation.
DISCUSSION
Two hypotheses can be posed, a and b, about the ways in which nitrate and phosphate are taken up by dino- flagellates in the nutricline during the night, and used:
(a) Nitrate and phosphate are assimilated to form organic compounds during the night at the same depth, with the aid of carbohydrates synthesized during the day. This has been shown by Cullen (1985) for Heterocapsa niei. The global chemical reaction is that indicated in Eqs. 7 and 8. This hypothesis is the one that has been used throughout this study.
The other possibility is: (b) Nitrate and phosphate taken in during the night
are transported to the surface where they are used to synthesize proteins and phosphorus compounds during the day.
With both mechanisms, the vertical distributions of 'NO' and 'PO' are identical while the 'CAO' distribu- tion in Hypothesis a shown in Table 3 coincides with the distribution in Fig. 5, with a ratio R = -A'CAO'/ A'NO' of 0.49. However with Hypothesis b, 'CAO' must remain unchanged because if nitrate is not reduced in the deep layer, there is no CO2 production, and the vertical distribution of 'CAO' must be a straight line coincident with that shown by points in Fig. 5. There will only be an increment due to respiration. Even taking the maximum value of 35 % for respiration, the R value would be 0.13, decreasing considerably for lower respiration values. The R value found during the Gymnodinium catenatum red tide in the Ria de Vigo was 0.5, which fits Hypothesis a but not b. However, phosphorylation of the nucleosides could be carried out either in the nutricline or in the photic layer without any variation in the R value. Watanabe et al. (1988) found that in Heterosigma akasiwo, phosphorylation takes place in the photic layer. In Chattonella antigua nitrate absorption is synchronized with phosphate uptake (Watanabe et al. 1989) and the same appears to occur in G. catenatum because inorganic nitrogen and phosphate in the Ria de Vigo are both taken in at the same depth. This is deduced from the strong correla- tion between these nutrients:
Fraga et al.. Chemical parameters during a red t~de 133
Hypothesis b does not fit the observations of this Gymnodinium catenatum red tide.
Differences in results according to phytoplankton chemical composition
The values of the constants RN, RP and RC used for the chemical parameter calculation present some prob- lems. Their values depend on the chemical con~position of phytoplankton. For non-migrating species with an average composition of C129H234070N17P, RN, RP and RC are 10.3, 175 and 1.36 respectively, whilst for Gym- nodiniurn catenatum and probably other species with die1 vertical migration, the average composition at the moment of cellular division is C87H140029N17P and RN, RP and RC are 7.6, 130 and 1.49 respectively.
In many cases, migratory and non-migratory species coexist and the results will depend on the group of values used. However in the calculation of the 'NCO' and 'PCO' parameters, the differences are partly compensated.
The oxygen loss to the atmosphere and the net pro- duction were calculated using coefficients given for normal phytoplankton (non-migrant) taking water of 50 m at Stn 6 as reference. The maximum oxygen loss deviations are obtained for the surface samples and reach 3.2 pm01 kg-' which means an excess of 7 O/O
above the value calculated with the coefficients given for red tide conditions.
For the net produchon, the maximum deviation of results, according to the chemical composition adopted, was also in the surface samples with 3.2 pm01 O2 kg-' but its relative value is only 3 O/O above the true value.
For the vertical nutrient transport, the differences are greater. However for small depth intervals like the transport from the nutricline to the surface, this is practically the same when calculated with both groups of constants.
Capability of carbohydrate storage
The transport of carbohydrates from the photosynthe- tic layer to the nutricline is another matter. According to the stoichiometric equations (Eqs. 7 & 8) and taking 1 m01 of P04H' as reference, 130 m01 C as carbohydrates are necessary for the cell to be able to duplicate itself. This can be represented in the reduced equation
When they begin their descent, the cells must have a very high C:N ratio, but in this red tide in the Ria de Vigo the values found at dusk at the surface did not exceed C:N = 8 and in the nutricline the value was approximately C:N = 5.1.
This limitation seems to be common to other species. Yamochi & Abe (1984) found for Heterosign~a akashiwo, cultivated in a natural medium, that at the bottom with adequate nutrients, C:N = 6.6 m01 and at the surface with only 1.2 km01 1-' of inorganic nitrogen, C:N = 9.0.
Heaney & Eppley (1981), in cultures of Gonyaulax polyedra in a medium with adequate nutrients, gave
. C:N = 6.4 and with nutrients exhausted C:N = 8.9. Cullen & Horrigan (1981), in cultures of Gym-
nodinium splendens with 8 pm01 1-' of NO3-, found C:N = 5.02 and with nutrients exhausted, even after 4 d, the C:N ratio did not exceed 8.07.
As an exception the C:N ratio in Cachonina niei can vary between 7 and 14 (Strickland et al. 1969).
Thus it appears that some species, in spite of having sufficient light, have a limited carbohydrate storage capacity and so for their cellular division they need 2 journeys of ascent and descent, according to the scheme
NO3- C123 H198041 N24 P1.41 76(CH20)
(C:N = 8.3) PO4 H'
2 C87 H140 0 2 9 N17 P + 25 C02 C : N = 5.1
The need to make 2 journeys also agrees with the consumption of carbohydrates in respiration, as previ- ously indicated.
CONCLUSIONS
During the red tide, 'NO' and 'PO' do not remain constant and show a strong increase in the surface water and a descent in the upper part of the nutricline at ca 10 m. 'CAO' does not remain constant either, and its variations are opposite to those of 'NO' and 'PO' but less marked, 2.0 times smaller.
From the classical parameters, a new parameter 'NCO' (Nitrate-CO2-Oxygen) and its counterpart 'PCO' (Phosphate-CO2-Oxygen) which do not vary even in red tide explosions in which vertical transport of nutrients is produced by the dinoflagellates. These
134 Mar Ecol. Prog. Ser. 87: 123-134, 1992
parameters, like the classical ones, vary with the oxy- gen loss to the atmosphere. This permits the calculation of this loss, and is also useful in the calculation of the net production balance accumulated during the red tide phenomenon.
'NO' varies due to the vertical transport of carbohy- drates by the dinoflagellates, whilst 'NCO' does not vary. Thus 'NO'- 'NCO' anomalies measure the car- bohydrates synthesized in the photic zone and used in the nutricline at night to assimilate nitrate and phos- phate, which are later transported to the photosynthetic layer a s organic matter during diel vertical migration.
The 'NO'-'NCO' or 'PO'-'PCO' values are indepen- dent of sedimentation of the particulate organic matter and of the oxygen loss.
Acknowledgements. Thanks are due to R. Prego for the nitrate, nitrite and organic nitrogen analyses; to Dr R. Mar- galef for his valuable suggestions; to R. Penin for the prepa- ration of the figures and to T. Rellan for the compilation of the manuscript. We would like also to thank the revlewer J. Cullen for his suggestions that have contributed to improve this paper. This work was financed by Grant PR84-0068 of the Comision Intenninisterial de Ciencia y Tecnologia (CICYT).
LITERATURE CITED
Broecker, W. S. (1974). 'NO', a conservahve water-mass tracer. Earth Planet. Sci. Lett. 23: 100-107
Cullen, J. J. (1985). Diel vertical migration by dinoflagellates: roles or carbohydrate metabolism and behavioral flexibil- ity. In: Ranlun, M. A. (ed.) Migration: mechanisms and adaptative significance. Univ. Texas Mar. Sci. Inst. suppl. 27: 135-152
Cullen, J . J . , Honigan, S. G (1981). Effects of nitrate on the diurnal vertical migration, carbon to nitrogen ratio, and the photosynthetic capacity of the dinoflagellate Gym- nodinium splendens. Mar. Biol. 62: 81-89
Cullen, J. J., Zhu, M., Davis, R. F., Pierson, D. C. (1985). Vertical migration, carbohydrate synthesis, and nocturnal nitrate uptake during growth Heterocapsa niei in a laboratory water column. In: Anderson, D. M.. White, A. W., Baden, D. G. (eds.) Toxic dinoflagellates. Elsevier Sci. Publ., New York, p. 185-194
Eppley, R. LV. , Holm-Hansen, O., Strickland, J. D H. (1968). Some observations on the vertical migration of dinoflagel- lates. J. Phycol. 4. 333-340
Figueiras, F. G., Fraga, F. (1990). Vertical nutrient transport during proliferation of Gymnodinium catenatum Graham in Ria de Vigo, Northwest Spain. In: Graneli. E. et al. (eds.)
This article was submitted to the editor
Toxlc marine phytoplankton. Elsevier, New York, p. 144-148
Figueiras, F. G., Prego, R., Perez, F. F. , Rios, A. F., Fraga, F. (1587). Campana 'Galicia IX' %as. Datos Informativos Inst. Inv. Marinas 21, Vigo
Fraga. F., Prego, R. (1989). Cond~ciones hidrograficas previas a la purga de mar Cuadernos Area Ciencias mar., Semin. Estud. Galegos 4 : 21-44
Fraga, F., Perez, F. F. (1990). Transformaciones entre composi- cion quimica del fitoplancton, composicion elementaly relacion de Redfield. Scient. mar 54: 69-76
Fraga, S , Gallager, S. M., Anderson, D. M. (1989). Chain- forming dinoflagellates: an adaptation to red tides. In: Okaichi, T., Anderson, D M., Nemoto, T. (eds.) Red tides: biology, environmental science and toxicology. Elsevier Sci. Publ., New York, p. 281-284
Heaney, S. I., Eppley, R. W. (1981). Light, temperature and nitrogen as interacting factors affecting diel vertical migra- tions of dinoflagellates in culture. J. Plankton Res. 3: 331-344
Kester, D. R. (1975). Dissolved gases other than COz. In. Riley, J. P., Skirrow, G. (eds.) Chemical oceanography, 2nd edn., Vol. 1. Academic Press, London, p. 497-556
Minas, H. J., Minas, M, , Packard, T. T (1986). Productivity in upwelling areas deduced from hydrographic and chemlcal fields. Limnol. Oceanogr. 31: 1182-1206
Minster, J. F., Boulahdid, M. (1987). Redfield ratios along isopycnal surface - a complementary study. Deep Sea Res. 34: 1981-2003
Mourifio, C., Perez, F. F., Rios, A. F., Manriquez, M., Estrada, M., Marrase, C., Prego, R., Fraga, F. (1985). Campana 'Galicia VIII'. Datos basicos. Datos informativos Inst. Invest pesq. 13: 1-108
Prego, R. (1988). Intercambio de sales nutrientes entre cuerpos de agua oceanicos, seguido por metodos quimicos. Tesis Doctoral. Universidad de Santiago de Compostela
Nos, A. F., Fraga, F., Perez, F. F. (1989). Estimation of coeffi- cients for the calculation of 'NO', 'PO' and 'CO', starting from the elemental composition of natural phytoplankton. Scient. mar. 53: 779-784
Strickland, J . D. H., Holm-Hansen, O., Eppley, R. W., Linn, R. J . (1969) The use of a deep tank in plankton ecology. I. Studies of the growth and composihon of phytoplankton crops at low nutrient levels. L~mnol Oceanogr. 14: 23-34
Watanabe, M., Kohata, K., Kunugl, M. (1988). Phosphate accumulation and metabolism by Heterosigma akashiwo (Raphidophyceae) during diel vertical migration in a stratified microcosm. J. Phycol. 24: 22-28
Watanabe, M., Kohata, K., Kunugi, M. (1989). Nitrogen and phosphate accumulation by Chattonella antigua during diel vertical migration in a stratified microcosm. In- Graneli, E. (ed.) Toxic marine phytoplankton. Elsevier, New York, p. 244-248
Yamochi. S., Abe, T. (1984). Mechanisms to initiate a Heterosigma akashiwo red tide in Osaka Bay. 11. Diel vertical migration. Mar Biol. 83: 255-261
Manuscript first received: January 27, 1992 Revised version accepted: August 14, 1992


![[XLS]lbacon/acct400/templates/Chap003.xls · Web viewGiven P03-34 P03-34 Given P03-32 P03-32 Given P03-30 P03-30 Given P03-27 P03-27 Given P03-26 P03-26 Given P03-25 P03-25 Given](https://img.pdfslide.us/doc/110x75/5ae12dc87f8b9a6e5c8e6532/xls-lbaconacct400templateschap003xlsweb-viewgiven-p03-34-p03-34-given-p03-32.jpg)


![Application of Six Detection Methods for Analysis of ......Atlantic coasts of Latin America (LA) for many years [9 14]. In Argentina, Gymnodinium catenatum was initially recorded in](https://img.pdfslide.us/doc/110x75/613b4da3f8f21c0c8268ec85/application-of-six-detection-methods-for-analysis-of-atlantic-coasts-of.jpg)