Embed Size (px)
Citation preview

Stockman CSE803 Fall 2009 1
Pattern Recognition Concepts Chapter 4: Shapiro and Stockman How should objects be represented? Algorithms for recognition/matching * nearest neighbors * decision tree * decision functions * artificial neural networks How should learning/training be done?

Stockman CSE803 Fall 2009 2
Feature Vector Representation
X=[x1, x2, … , xn], each xj a real number
Xj may be object measurement
Xj may be count of object parts
Example: object rep. [#holes, Area, moments, ]

Stockman CSE803 Fall 2009 3
Possible features for char rec.

Stockman CSE803 Fall 2009 4
Some Terminology
Classes: set of m known classes of objects (a) might have known description for each (b) might have set of samples for each Reject Class: a generic class for objects not in any of the designated known classes Classifier: Assigns object to a class based on features

Stockman CSE803 Fall 2009 5
Classification paradigms

Stockman CSE803 Fall 2009 6
Discriminant functions
Functions f(x, K) perform some computation on feature vector x
Knowledge K from training or programming is used
Final stage determines class

Stockman CSE803 Fall 2009 7
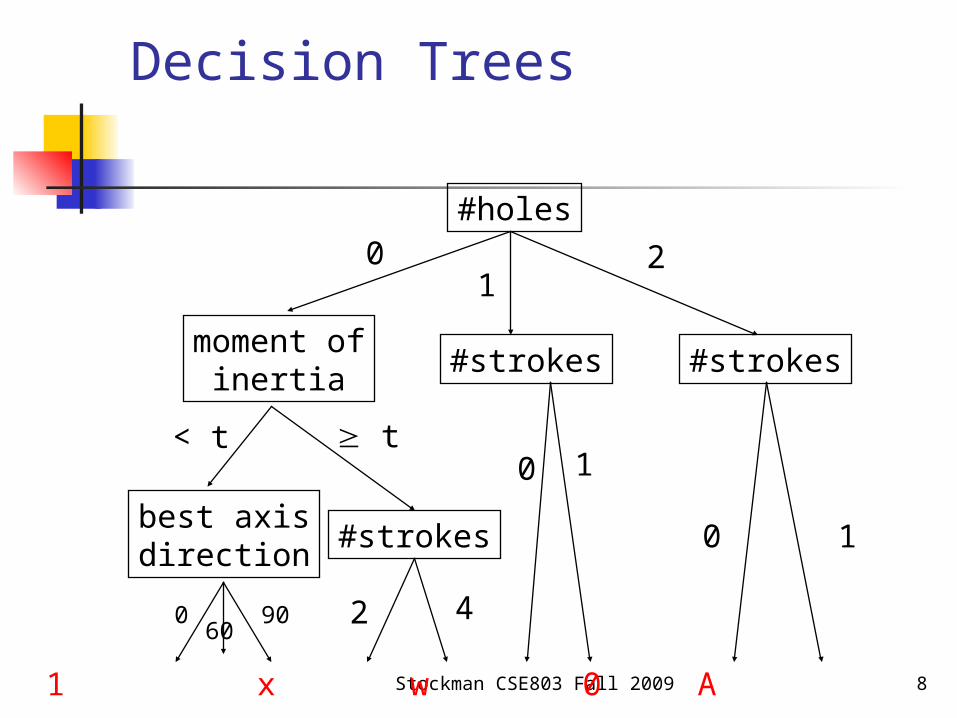
Decision-Tree Classifier Uses subsets of
features in seq. Feature
extraction may be interleaved with classification decisions
Can be easy to design and efficient in execution
Stockman CSE803 Fall 2009 8
Decision Trees
#holes
moment ofinertia
#strokes #strokes
best axisdirection
#strokes
- / 1 x w 0 A 8 B
01
2
< t t
2 4
0 1
060
90
0 1

Stockman CSE803 Fall 2009 9
Classification using nearest class mean
Compute the Euclidean distance between feature vector X and the mean of each class.
Choose closest class, if close enough (reject otherwise)
Low error rate at left

Stockman CSE803 Fall 2009 10
Nearest mean might yield poor results with complex structure
Class 2 has two modes
If modes are detected, two subclass mean vectors can be used

Stockman CSE803 Fall 2009 11
Scaling coordinates by std dev

Stockman CSE803 Fall 2009 12
Another problem for nearest mean classification If unscaled, object
X is equidistant from each class mean
With scaling X closer to left distribution
Coordinate axes not natural for this data
1D discrimination possible with PCA

Stockman CSE803 Fall 2009 13
Receiver Operating Curve ROC
Plots correct detection rate versus false alarm rate
Generally, false alarms go up with attempts to detect higher percentages of known objects

Stockman CSE803 Fall 2009 14
Confusion matrix shows empirical performance

Stockman CSE803 Fall 2009 15
Bayesian decision-making

Stockman CSE803 Fall 2009 16
Normal distribution 0 mean and unit
std deviation Table enables us
to fit histograms and represent them simply
New observation of variable x can then be translated into probability

Stockman CSE803 Fall 2009 17
Parametric Models can be used

Stockman CSE803 Fall 2009 18
Cherry with bruise Intensities at about 750 nanometers
wavelength Some overlap caused by cherry surface
turning away