Embed Size (px)
Citation preview

================================================================================ FORM 10-K/A SECURITIES AND EXCHANGE COMMISSION WASHINGTON, D.C. 20549 ================================================================================ (MARK ONE) [X] ANNUAL REPORT PURSUANT TO SECTION 13 OR 15(d) OF THE SECURITIES EXCHANGE ACT OF 1934 FOR THE YEAR ENDED DECEMBER 31, 2002 OR [ ] TRANSITION REPORT PURSUANT TO SECTION 13 OR 15(d) OF THE SECURITIES EXCHANGE ACT OF 1934 Commission file number 1-12317 NATIONAL-OILWELL, INC. (Exact name of registrant as specified in its charter) DELAWARE 76-0475815 --------------------------------- ------------------- (State or other jurisdiction (IRS Employer of incorporation or organization) Identification No.) 10000 RICHMOND AVENUE HOUSTON, TEXAS 77042-4200 ---------------------------------------- (Address of principal executive offices) (713) 346-7500 ----------------------------------------------------- (Registrant's telephone number, including area code) Securities registered pursuant to Section 12(b) of the Act: COMMON STOCK, PAR VALUE $.01 NEW YORK STOCK EXCHANGE ---------------------------- ------------------------------ (Title of Class) (Exchange on which registered) Securities registered pursuant to Section 12(g) of the Act: NONE Indicate by check mark whether the registrant (1) has filed all reports required to be filed by Section 13 or 15(d) of the Securities Exchange Act of 1934 during the preceding 12 months (or for such shorter period that the registrant was required to file such reports), and (2) has been subject to such filing requirements for the past 90 days. YES [X] NO [ ] Indicate by check mark if disclosure of delinquent filers pursuant to Item 405 of Regulation S-K is not contained herein, and will not be contained, to the best of registrant's knowledge, in definitive proxy or information statements incorporated by reference in Part III of this Form 10-K or any amendment to this Form 10-K. [X] Indicate by check mark whether the registrant is an accelerated filer (as defined in Rule 12b-2 of the Act). Yes [X] No [ ] As of March 3, 2003, 84,224,527 common shares were outstanding. Based upon the closing price of these shares on the New York Stock Exchange and, excluding solely for purposes of this calculation 4,140,609 shares beneficially owned by directors and executive officers, the aggregate market value of the common shares of National-Oilwell, Inc. held by non-affiliates was approximately $1.8 billion. DOCUMENTS INCORPORATED BY REFERENCE Portions of the Proxy Statement in connection with the 2003 Annual Meeting of Stockholders are incorporated in Part III of this report.

ITEM 1. BUSINESS GENERAL National Oilwell designs, manufactures and sells comprehensive systems, components, and products used in oil and gas drilling and production, as well as distributes products and provides services to the exploration and production segment of the oil and gas industry. Our Products and Technology segment designs and manufactures complete land drilling and workover rigs, as well as drilling related systems on offshore rigs. Technology has increased the desirability of one vendor assuming responsibility for the entire suite of components used in the drilling process, as mechanical and hydraulic components are replaced by or augmented with integrated computerized systems. In addition to traditional components such as drawworks (the hoisting winch used to raise and lower drill pipe), mud pumps (used to circulate drilling fluids), top drives (used to turn drill pipe) derricks, cranes, jacking and mooring systems (used to raise, lower and anchor offshore jackup drilling rigs), and other structural components, we provide automated pipehandling, control and electrical power systems. We have also developed new technology for drawworks and mud pumps applicable to the highly demanding offshore markets. Non-capital products produced by our Products and Technology segment include drilling motors and specialized downhole tools that are sold or rented, spare parts and service on the large installed base of our equipment, expendable parts for mud pumps and other equipment, and smaller downhole, progressive cavity and transfer pumps. Our Distribution Services segment provides maintenance, repair and operating supplies and spare parts to drill site and production locations throughout North America and to offshore contractors worldwide. Increasingly, this business also is expanding to locations outside North America, including the Middle East, Southeast Asia, and South America. Using our information technology platforms and processes, we can provide complete procurement, inventory management, and logistics services to our customers. BUSINESS STRATEGY National Oilwell's business strategy is to enhance its market positions and operating performance in the upstream oil and gas business by: Leveraging our Capital Equipment Installed Base We believe our market position and comprehensive product offering present substantial opportunities to capture a significant portion of expenditures for the construction of new drilling rigs and equipment as well as the upgrade and refurbishment of existing drilling rigs and equipment. Over the next few years, the advanced age of the existing fleet of drilling rigs, coupled with drilling activity involving greater depths and extended reach, is expected to generate demand for new equipment. National Oilwell's automation and control systems offer the potential to improve the performance of new and existing drilling rigs. The large installed base of our equipment also provides recurring demand for spare parts and expendable products necessary for proper and efficient operation. Expanding our Non-Capital Products Business Our non-capital equipment revenues continue to represent over half of our products and technology business. We rent and sell high-performance drilling motors and downhole tools and in the manufacture of certain expendable products and spare parts needed in the drilling and production process. We believe additional expansion in the non-capital upstream oil and gas industry would be beneficial to our business and our customers. 1
Furthering our Information Technology and Process Improvement Strategy National Oilwell has developed an integrated information technology and process improvement strategy to enhance procurement, inventory management and logistics activities. As a result of the need to improve industry efficiency, oil and gas companies and drilling contractors are frequently seeking alliances with suppliers, manufacturers and service providers to achieve cost and capital improvements. We believe we are well positioned to provide these services as a result of our: - large and geographically diverse network of distribution service centers in major oil and gas producing areas; - strong relationship with a large community of industry suppliers; - knowledge of customers procurement processes, suppliers capabilities and products performance; and - information systems that offer customers and suppliers enhanced capabilities. In addition, the integration of our distribution expertise, extensive network and growing base of customer alliances provides an increased opportunity for cost-effective marketing of our manufactured parts and equipment. Continuing our Acquisitions Strategy We believe the oilfield service and equipment industry will continue to experience consolidation as businesses seek to align themselves with other market participants in order to gain access to broader markets and integrated product offerings. From 1997 through January 2003, National Oilwell has made a total of thirty-two acquisitions and plans to continue to participate in this trend. While none of our individual acquisitions have materially affected the development of our current business or the results of our operations, the aggregate effect has positively impacted our ability to provide complete drilling equipment systems to our customers. 2
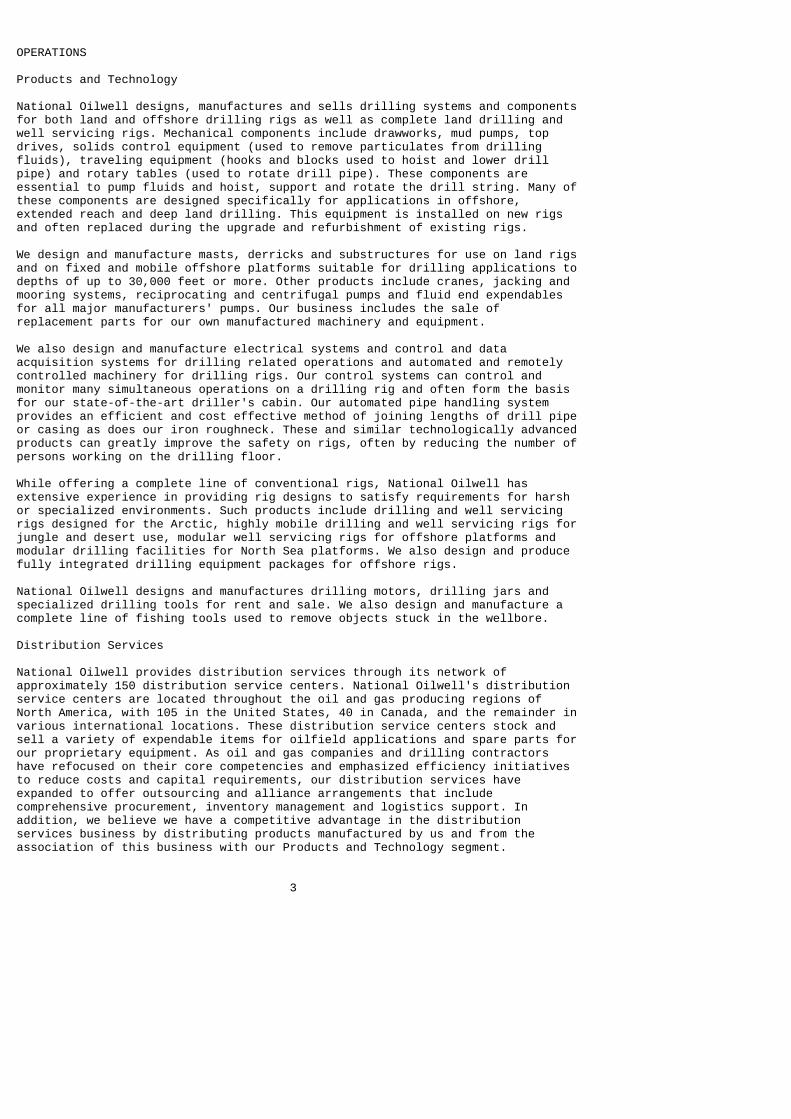
OPERATIONS Products and Technology National Oilwell designs, manufactures and sells drilling systems and components for both land and offshore drilling rigs as well as complete land drilling and well servicing rigs. Mechanical components include drawworks, mud pumps, top drives, solids control equipment (used to remove particulates from drilling fluids), traveling equipment (hooks and blocks used to hoist and lower drill pipe) and rotary tables (used to rotate drill pipe). These components are essential to pump fluids and hoist, support and rotate the drill string. Many of these components are designed specifically for applications in offshore, extended reach and deep land drilling. This equipment is installed on new rigs and often replaced during the upgrade and refurbishment of existing rigs. We design and manufacture masts, derricks and substructures for use on land rigs and on fixed and mobile offshore platforms suitable for drilling applications to depths of up to 30,000 feet or more. Other products include cranes, jacking and mooring systems, reciprocating and centrifugal pumps and fluid end expendables for all major manufacturers' pumps. Our business includes the sale of replacement parts for our own manufactured machinery and equipment. We also design and manufacture electrical systems and control and data acquisition systems for drilling related operations and automated and remotely controlled machinery for drilling rigs. Our control systems can control and monitor many simultaneous operations on a drilling rig and often form the basis for our state-of-the-art driller's cabin. Our automated pipe handling system provides an efficient and cost effective method of joining lengths of drill pipe or casing as does our iron roughneck. These and similar technologically advanced products can greatly improve the safety on rigs, often by reducing the number of persons working on the drilling floor. While offering a complete line of conventional rigs, National Oilwell has extensive experience in providing rig designs to satisfy requirements for harsh or specialized environments. Such products include drilling and well servicing rigs designed for the Arctic, highly mobile drilling and well servicing rigs for jungle and desert use, modular well servicing rigs for offshore platforms and modular drilling facilities for North Sea platforms. We also design and produce fully integrated drilling equipment packages for offshore rigs. National Oilwell designs and manufactures drilling motors, drilling jars and specialized drilling tools for rent and sale. We also design and manufacture a complete line of fishing tools used to remove objects stuck in the wellbore. Distribution Services National Oilwell provides distribution services through its network of approximately 150 distribution service centers. National Oilwell's distribution service centers are located throughout the oil and gas producing regions of North America, with 105 in the United States, 40 in Canada, and the remainder in various international locations. These distribution service centers stock and sell a variety of expendable items for oilfield applications and spare parts for our proprietary equipment. As oil and gas companies and drilling contractors have refocused on their core competencies and emphasized efficiency initiatives to reduce costs and capital requirements, our distribution services have expanded to offer outsourcing and alliance arrangements that include comprehensive procurement, inventory management and logistics support. In addition, we believe we have a competitive advantage in the distribution services business by distributing products manufactured by us and from the association of this business with our Products and Technology segment. 3
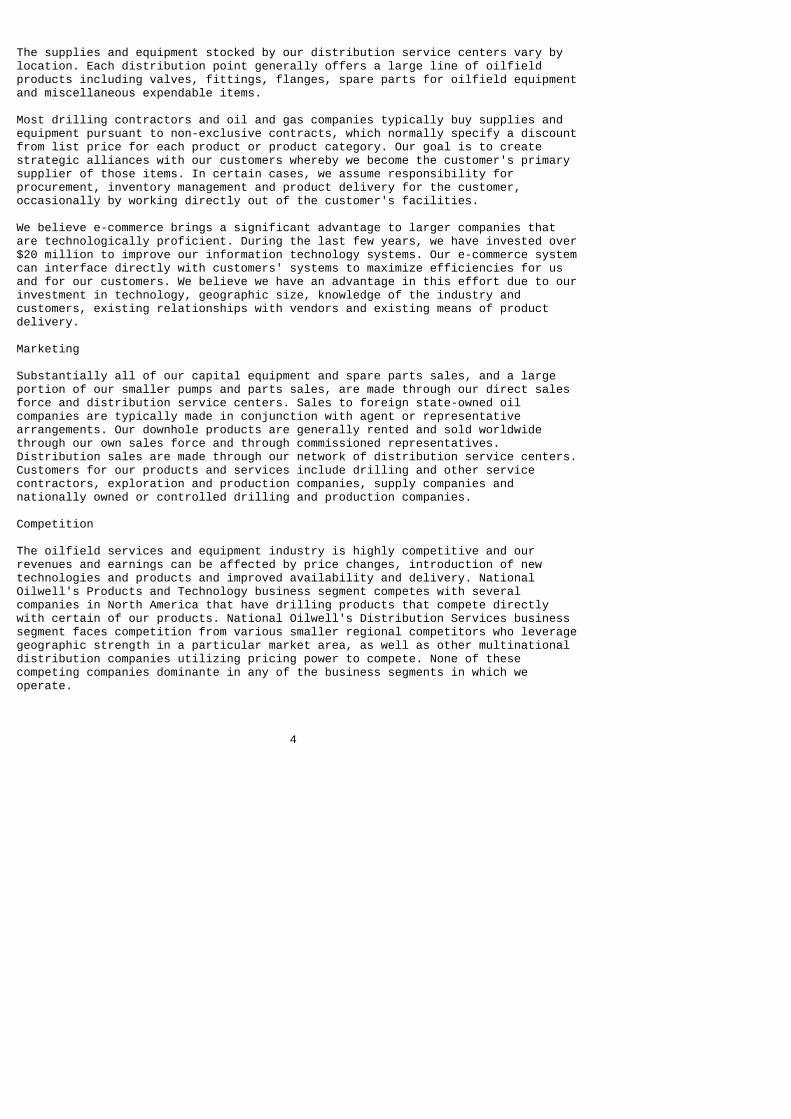
The supplies and equipment stocked by our distribution service centers vary by location. Each distribution point generally offers a large line of oilfield products including valves, fittings, flanges, spare parts for oilfield equipment and miscellaneous expendable items. Most drilling contractors and oil and gas companies typically buy supplies and equipment pursuant to non-exclusive contracts, which normally specify a discount from list price for each product or product category. Our goal is to create strategic alliances with our customers whereby we become the customer's primary supplier of those items. In certain cases, we assume responsibility for procurement, inventory management and product delivery for the customer, occasionally by working directly out of the customer's facilities. We believe e-commerce brings a significant advantage to larger companies that are technologically proficient. During the last few years, we have invested over $20 million to improve our information technology systems. Our e-commerce system can interface directly with customers' systems to maximize efficiencies for us and for our customers. We believe we have an advantage in this effort due to our investment in technology, geographic size, knowledge of the industry and customers, existing relationships with vendors and existing means of product delivery. Marketing Substantially all of our capital equipment and spare parts sales, and a large portion of our smaller pumps and parts sales, are made through our direct sales force and distribution service centers. Sales to foreign state-owned oil companies are typically made in conjunction with agent or representative arrangements. Our downhole products are generally rented and sold worldwide through our own sales force and through commissioned representatives. Distribution sales are made through our network of distribution service centers. Customers for our products and services include drilling and other service contractors, exploration and production companies, supply companies and nationally owned or controlled drilling and production companies. Competition The oilfield services and equipment industry is highly competitive and our revenues and earnings can be affected by price changes, introduction of new technologies and products and improved availability and delivery. National Oilwell's Products and Technology business segment competes with several companies in North America that have drilling products that compete directly with certain of our products. National Oilwell's Distribution Services business segment faces competition from various smaller regional competitors who leverage geographic strength in a particular market area, as well as other multinational distribution companies utilizing pricing power to compete. None of these competing companies dominante in any of the business segments in which we operate. 4

Manufacturing and Backlog National Oilwell has manufacturing facilities located in the United States, Canada, Norway and China. The manufacture of parts or purchase of components is sometimes outsourced to qualified subcontractors. The manufacturing operations require a variety of components, parts and raw materials which we purchase from multiple commercial sources. We have not experienced and do not expect any significant delays in obtaining deliveries of materials. Sales of products are made on the basis of written orders and oral commitments. Our backlog for equipment at recent year-ends has been: December 31, 2002 $364 million (includes $170 million from the Hydralift ASA acquisition) December 31, 2001 385 million December 31, 2000 282 million Distribution Suppliers National Oilwell obtains products sold by its Distribution Services business from a number of suppliers, including our own Products and Technology segment. No single supplier of products is significant to our operations. We have not experienced and do not expect a shortage of products that we sell. Engineering National Oilwell maintains a staff of engineers and technicians to: - design and test new products, components and systems for use in drilling and pumping applications; - enhance the capabilities of existing products; and - assist our sales organization and customers with special projects. Our product engineering efforts focus on developing technology to improve the economics and safety of drilling and production processes, and to emphasize technology and complete drilling solutions. Patents and Trademarks National Oilwell owns or has a license to use a number of patents covering a variety of products. Although in the aggregate these patents are of importance, we do not consider any single patent to be of a critical or essential nature. In general, our business has historically relied upon technological capabilities, quality products and application of expertise rather than patented technology. Employees As of December 31, 2002, we had a total of 6,900 employees, 4,300 of whom were salaried and 2,600 of whom were paid on an hourly basis. Of this workforce, 1,300 employees are employed in Canada, 850 in Norway and 675 in other locations outside the United States. Available Information Regarding our SEC Filings Our corporate offices are located at 10000 Richmond Avenue, Houston, Texas 77042-4200. Our phone number at that location is (713) 346-7500 and our Internet address is www.natoil.com. Information we make public about our company, including all SEC required filings, is available to you, free of charge, at our Internet address. 5

RISK FACTORS You should carefully consider the risks described below, in addition to other information contained or incorporated by reference herein. Realization of any of the following risks could have a material adverse effect on our business, financial condition, cash flows and results of operations. Demand for Our Products is Dependent Upon the Price of Oil and Gas and the Willingness to Explore and Produce Oil and Gas. National Oilwell is dependent upon the oil and gas industry and its willingness to explore for and produce oil and gas. The industry's willingness to explore and produce depends upon the prevailing view of future product prices. Many factors affect the supply and demand for oil and gas and therefore influence product prices, including: o level of production from known reserves; o cost of producing oil and gas; o level of drilling activity; o worldwide economic activity; o national government political requirements; o development of alternate energy sources; and o environmental regulations. If there is a significant reduction in demand for drilling services, in cash flows of drilling contractors or production companies or in drilling or well servicing rig utilization rates, then demand for our products will decline. The Price of Oil and Gas Affect Companies' Decisions to Explore and Produce Oil and Gas, and as a Result Affect Demand for Our Products. Oil and gas prices have been volatile since 1990, ranging from $10 - $40 per barrel. Over the last three years, oil prices have generally ranged within $20 - $30 per barrel. Spot gas prices have also been volatile since 1990, ranging from less than $1.00 per mmbtu to above $10.00. Gas prices were moderate in 1998 and 1999, generally ranging from $1.80 to $2.50 per mmbtu. Gas prices in 2000 generally ranged from $4.00 - $8.00 per mmbtu. In the second quarter of 2001, gas prices came under pressure, generally ranging between $2.20 to $3.00 per mmbtu through the first quarter of 2002. Gas prices have generally ranged between $3.00 - $5.00 per mmbtu since that time. Expectations for future oil and gas prices cause many shifts in the strategies and expenditure levels of oil and gas companies and drilling contractors, particularly with respect to decisions to purchase major capital equipment of the type we manufacture. Industry activity and our revenues have not responded to the higher commodity prices that have existed since the second quarter of 2002, presumably due to concerns that these prices will not continue in the current range. We cannot predict future oil and gas prices or the effect prices will have on exploration and production levels. Competition in our Industry Could Ultimately Lead to Lower Revenues and Earnings. The oilfield products and services industry is highly competitive. The following competitive actions can each affect our revenues and earnings: o price changes; o new product and technology introductions; and o improvements in availability and delivery. 6

National Oilwell's Products and Technology business segment competes with several companies in North America that have drilling products that compete directly with certain of our products. National Oilwell's Distribution Services business segment faces competition from various smaller regional competitors who leverage geographic strength in a particular market area, as well as other multinational distribution companies utilizing pricing power to compete. None of these competing companies dominate any of the business segments in which we operate. Because Some of Our Products are Used in Potentially Hazardous Activities, We Face Potential Product Liability and Warranty Claims. Customers use some of our products in potentially hazardous drilling, completion and production applications that can cause: o injury or loss of life; o damage to property, equipment or the environment; and o suspension of operations. National Oilwell may be named as a defendant in product liability or other lawsuits asserting potentially large claims if an accident occurs at a location where our equipment and services have been used. We are currently party to various legal and administrative proceedings. We cannot predict the outcome of these proceedings, nor can we guarantee any negative outcomes will not be significant to us. The Location of Some of our Customers in Foreign Markets that may have Unstable Economies or Governments may have a Negative Impact on Our Revenues and Operating Results. Some of our revenues depend upon customers in the Middle East, Africa, Southeast Asia, South America and other international markets. These revenues are subject to risks of instability of foreign economies and governments. Laws and regulations limiting exports to particular countries can affect our sales, and sometimes export laws and regulations of one jurisdiction contradict those of another. National-Oilwell Sells Products and Services Outside the United States. Changes in Foreign Currency Exchange Rates Could Have a Negative Impact on our Revenues and Operating Results. National Oilwell is exposed to the risks of changes in exchange rates between the U.S. dollar and foreign currencies. Our Norwegian companies enter into foreign exchange forward contracts, primarily between the Norwegian kroner and the US dollar, to hedge cash flows on certain significant contracts. Our decisions regarding the need for hedging foreign currencies in Norway and other countries can adversely affect our operating results. Our Growth May Cause Difficulties Integrating Operations that We Acquire. National Oilwell has acquired 32 companies since April 1997, including nine in 2001 and four in 2002. In addition, we acquired two other companies in January 2003. We do not know whether suitable acquisition candidates will be available on reasonable terms or if we will have access to adequate funds to complete any desired acquisition. In addition, we may not be able to successfully integrate the operations of the acquired companies. Combining organizations could interrupt the activities of some or all of our businesses and have a negative impact on operations. Our Indebtedness Could Limit The Ability to Borrow Additional Funds and/or Make Us Vulnerable to General Adverse Economic and Industry Conditions. In 1998, National Oilwell issued $150 million of 6?% unsecured senior notes due July 1, 2005. In 2001, we issued an additional $150 million of 6 1/2% unsecured senior notes due March 15, 2011. In 2002, we issued $200 million of 5.65% unsecured senior notes due November 15, 2012. We also have a $175 million revolving line of credit and approximately $223 million in facilities, of which $91 million was available at December 31, 2002, under various borrowing arrangements of our wholly-owned foreign subsidiaries. Our leverage requires us to use some of our cash flow from operations for payment of interest on our debt. Our leverage may also make it more difficult to obtain additional financing in the future. Further, our leverage could make us more vulnerable to economic downturns and competitive pressures. 7

Item 2. Properties National Oilwell owned or leased approximately 235 facilities worldwide as of December 31, 2002, including the following principal manufacturing and administrative facilities: APPROXIMATEBUILDINGSPACE
LOCATION(SQUARE FOOT)DESCRIPTIONSTATUS - -------- --------------- ----------- ------Pampa, Texas
548,000Manufactures
drillingmachinery andequipment
OwnedHouston,
Texas 540,000Manufactures
downholetools andmobile rigs
OwnedHouston,
Texas 260,000Manufactures
drillingmachinery andequipmentLeased
Carquefou,France213,000
Manufacturesoffshore and
marinehandlingequipment
OwnedSugarland,
Texas 190,000Manufactures
brakingsystems andgenerators
Owned GalenaPark, Texas
188,000Manufactures
drillingcomponentsand rigsOwned
Houston,Texas 178,000Manufactureselectrical
power systemsOwned
Edmonton,Alberta,Canada162,000
Manufacturesdownhole
tools OwnedKristiansand,
Norway157,000
Manufacturesdrilling and

offshoreequipment
Owned Tulsa,Oklahoma140,000
Manufacturespumps andexpendableparts OwnedMcAlester,Oklahoma117,000
Manufacturespumps andexpendableparts OwnedHouston,
Texas 115,000Administrative
officesLeased
Stavanger,Norway 87,000Manufactures
drillingcomponentsand systems
LeasedCalgary,Alberta,
Canada 76,000Manufacturescoiled tubingunits andwireline
trucks OwnedMolde, Norway
68,000Manufactures
marinehandlingequipment
Owned MarbleFalls, Texas
65,000Manufactures
drillingexpendableparts OwnedStavanger,
Norway 62,000Manufactures
drillingcomponentsand systemsOwned Nisku,
Alberta,Canada 59,000Manufactures
drillingmachinery andequipment
OwnedEdmonton,Alberta,
Canada 57,000Manufactures
drillingmachinery andequipment
Owned We own or lease 65 satellite repair and manufacturing facilities that refurbish and manufacture new equipment and parts and approximately 150 distribution service centers worldwide. We believe the capacity of our facilities is adequate to meet demand currently anticipated for 2003. ITEM 3. LEGAL PROCEEDINGS National Oilwell has various claims, lawsuits and administrative proceedings

that are pending or threatened, all arising in the ordinary course of business, with respect to commercial, product liability and employee matters. Although no assurance can be given with respect to the outcome of these or any other pending legal and administrative proceedings and the effect such outcomes may have, we believe any ultimate liability resulting from the outcome of such proceedings will not have a material adverse effect on our consolidated financial statements. 8

ITEM 4. SUBMISSION OF MATTERS TO A VOTE OF SECURITY HOLDERS No matters were submitted to a vote of security holders during the quarter ended December 31, 2002. PART II ITEM 5. MARKET FOR REGISTRANT'S COMMON EQUITY AND RELATED STOCKHOLDER MATTERS Market Information National Oilwell common stock is listed on the New York Stock Exchange (ticker symbol: NOI). The following table sets forth the stock price range during the past three years: 200220012000 --------------------------- -------------------------------------------------------
QuarterHighLowHighLowHighLow ---------------------- ---------- ----------- ---------- ----------- ---------
-First$
26.25$
16.43$
40.50$
33.65$
31.38$
14.25Second28.8120.9139.5526.8032.8922.94Third21.2915.1925.7412.91

37.5027.25Fourth23.3117.6920.8613.8539.1928.25 As of March 3, 2003, there were 537 holders of record of National Oilwell common stock. Many stockholders choose to own shares through brokerage accounts and other intermediaries rather than as holders of record so the actual number is unknown but significantly higher. National Oilwell has never paid cash dividends, and none are anticipated during 2003. Securities Authorized for Issuance Under Equity Compensation Plans The following table sets forth information as of our fiscal year ended December 31, 2002, with respect to compensation plans under which our common stock may be issued: NUMBER OFSECURITIESWEIGHTED-AVERAGE
NUMBER OFSECURITIES
TO BEISSUED UPONEXERCISEPRICE OFREMAININGAVAILABLE
FOREXERCISE OFOUTSTANDINGOPTIONS,FUTUREISSUANCEUNDER
OUTSTANDINGOPTIONS,WARRANTSAND RIGHTSEQUITY
COMPENSATIONWARRANTSAND RIGHTS
PLANS(EXCLUDINGSECURITIESREFLECTEDIN COLUMN(A)) PlanCategory
(A) (B) (C)(1) ------------- --------- ------ ----------------------- Equitycompensation3,790,496$21.99
4,219,162plans
approved bysecurityholdersEquity
compensation0 0 0 plans
notapproved bysecurity
holders --------- ------ --------

- Total3,790,496$21.99
4,219,162===============
========= (1) Shares could be issued other than upon the exercise of stock options, warrants or rights; however, none are anticipated during 2003. On February 14, 2003, we issued 977,500 stock options at an exercise price of $20.14. 9

ITEM 6. SELECTED FINANCIAL DATA Data for periods prior to 2000 shown below is restated to combine IRI International and Dupre' results pursuant to pooling-of-interests accounting. YEAR ENDED
DECEMBER 31,------------------------------------------------------------------------- 2002 20012000 1999
1998 ------------ ------------ ------------ ------------ ------------
(INTHOUSANDS OF
U.S.DOLLARS,EXCEPT PER
SHAREAMOUNTS)Operating
Data:Revenues $1,521,946 $1,747,455 $1,149,920 $839,648 $1,449,248Operatingincome (1)134,323189,277
48,456 1,325139,815Income(loss)
before taxes112,465168,01727,037(14,859)
125,021 Netincome
(loss) (2)73,069104,06313,136(9,385)
81,336 Netincome
(loss) pershare
Basic(2)0.90 1.290.17 (0.13)
1.19Diluted(2)0.89 1.270.16 (0.13)1.19 OTHER
DATA:Depreciation
andamortization
25,04838,87335,03425,54120,518Capital
expenditures24,80527,35824,56117,54739,246BALANCE
SHEET DATA:Workingcapital768,852631,257480,321452,015529,937
Total assets1,968,6621,471,6961,278,8941,005,7151,091,028Long-termdebt, lesscurrent
maturities594,637300,000222,477196,053222,209
Stockholders'equity933,364867,540767,206596,375603,568
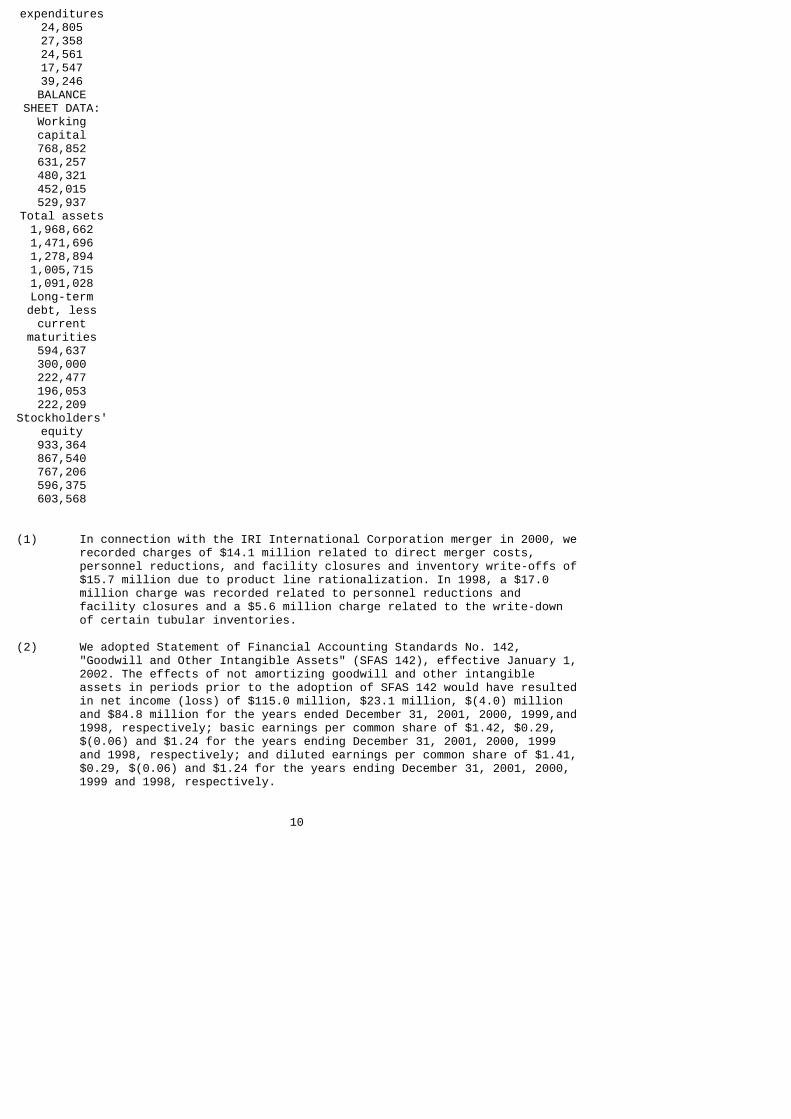
(1) In connection with the IRI International Corporation merger in 2000, we recorded charges of $14.1 million related to direct merger costs, personnel reductions, and facility closures and inventory write-offs of $15.7 million due to product line rationalization. In 1998, a $17.0 million charge was recorded related to personnel reductions and facility closures and a $5.6 million charge related to the write-down of certain tubular inventories. (2) We adopted Statement of Financial Accounting Standards No. 142, "Goodwill and Other Intangible Assets" (SFAS 142), effective January 1, 2002. The effects of not amortizing goodwill and other intangible assets in periods prior to the adoption of SFAS 142 would have resulted in net income (loss) of $115.0 million, $23.1 million, $(4.0) million and $84.8 million for the years ended December 31, 2001, 2000, 1999,and 1998, respectively; basic earnings per common share of $1.42, $0.29, $(0.06) and $1.24 for the years ending December 31, 2001, 2000, 1999 and 1998, respectively; and diluted earnings per common share of $1.41, $0.29, $(0.06) and $1.24 for the years ending December 31, 2001, 2000, 1999 and 1998, respectively. 10

ITEM 7. MANAGEMENT'S DISCUSSION AND ANALYSIS OF FINANCIAL CONDITION AND RESULTS OF OPERATIONS INTRODUCTION National Oilwell is a worldwide leader in the design, manufacture and sale of drilling systems, drilling equipment and downhole products as well as the distribution to the oil and gas industry of maintenance, repair and operating products. Our revenues and operating results are directly related to the level of worldwide oil and gas drilling and production activities and the profitability and cash flow of oil and gas companies and drilling contractors, which in turn are affected by current and anticipated prices of oil and gas. Oil and gas prices have been and are likely to continue to be volatile. See "Risk Factors". We conduct our operations through the following segments: Products and Technology Our Products and Technology segment is a global leader in the design and manufacture of complete land drilling and workover rigs, and for drilling related systems on offshore rigs. Technology has increased the desirability of one vendor assuming responsibility for the entire suite of components used in the drilling process, as mechanical and hydraulic components are replaced by or augmented with integrated computerized systems. In addition to traditional components such as drawworks, mud pumps, top drives, derricks, cranes, jacking and mooring systems, and other structural components, we provide automated pipehandling, control and electrical power systems. We have also developed new technology for drawworks and mud pumps applicable to the highly demanding offshore markets. Distribution Services Our Distribution Services segment provides maintenance, repair and operating supplies and spare parts from our network of distribution service centers to drill site and production locations throughout North America and to offshore contractors worldwide. Increasingly, this business also is expanding to locations outside North America, including the Middle East, Southeast Asia, and South America. Using our information technology platforms and processes, we can provide complete procurement, inventory management, and logistics services to our customers. Products are purchased from numerous manufacturers and vendors, including our Products and Technology segment. RESULTS OF OPERATIONS Operating results by segment, which have been restated to reflect a business combination accounted for under the pooling-of-interests method during 2000, are as follows (in millions): YEAR ENDEDDECEMBER
31, --------------------------------------2002 20012000 ---------- ---------- ------
----Revenues:Products
andTechnology$ 917.3 $1,120.9 $
683.5DistributionServices
686.2 707.8521.3
Eliminations(81.5)(81.3)
(54.8) ---------- ---------- ----
------

Total $1,522.0 $1,747.4 $1,150.0
==============================OperatingIncome:Products
andTechnology$ 127.0 $171.0 $61.0
DistributionServices18.1 28.5
12.9Corporate(10.8)(10.2)
(11.3) ---------- ---------- ----
------134.3 189.3
62.6Special
Charge -- -- 14.1 ---------- ---------- ----
------Total $134.3 $189.3 $48.5
============================== 11
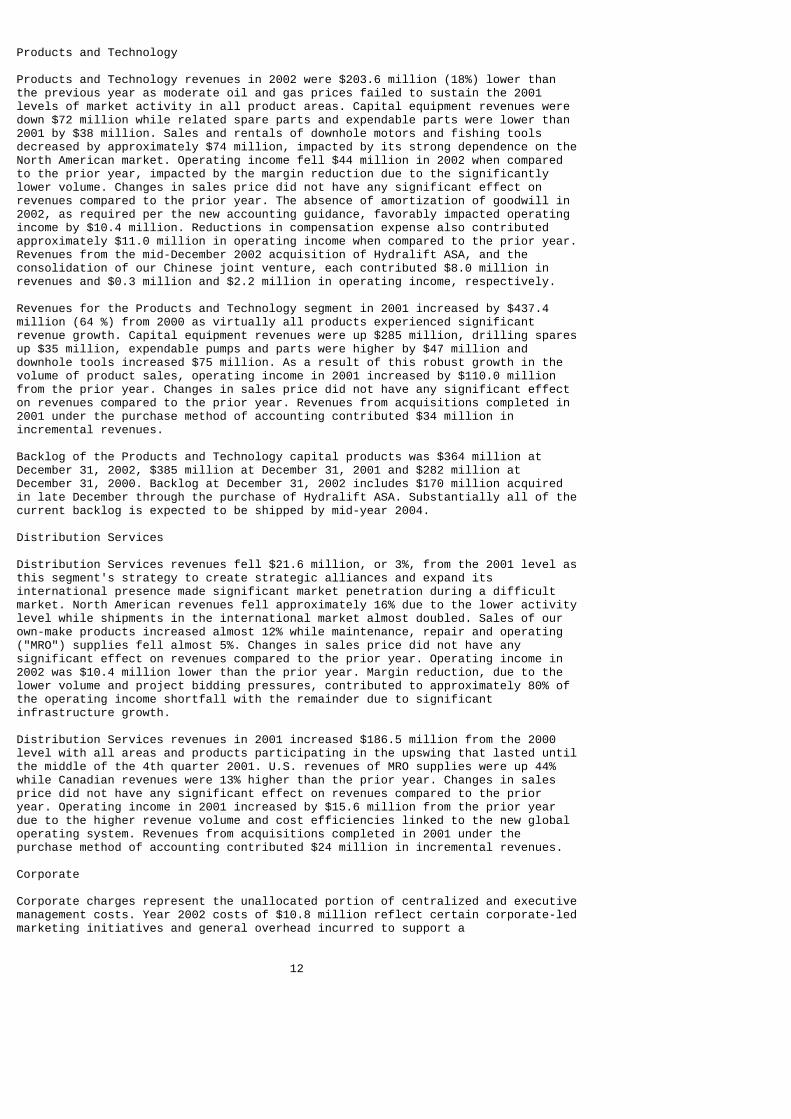
Products and Technology Products and Technology revenues in 2002 were $203.6 million (18%) lower than the previous year as moderate oil and gas prices failed to sustain the 2001 levels of market activity in all product areas. Capital equipment revenues were down $72 million while related spare parts and expendable parts were lower than 2001 by $38 million. Sales and rentals of downhole motors and fishing tools decreased by approximately $74 million, impacted by its strong dependence on the North American market. Operating income fell $44 million in 2002 when compared to the prior year, impacted by the margin reduction due to the significantly lower volume. Changes in sales price did not have any significant effect on revenues compared to the prior year. The absence of amortization of goodwill in 2002, as required per the new accounting guidance, favorably impacted operating income by $10.4 million. Reductions in compensation expense also contributed approximately $11.0 million in operating income when compared to the prior year. Revenues from the mid-December 2002 acquisition of Hydralift ASA, and the consolidation of our Chinese joint venture, each contributed $8.0 million in revenues and $0.3 million and $2.2 million in operating income, respectively. Revenues for the Products and Technology segment in 2001 increased by $437.4 million (64 %) from 2000 as virtually all products experienced significant revenue growth. Capital equipment revenues were up $285 million, drilling spares up $35 million, expendable pumps and parts were higher by $47 million and downhole tools increased $75 million. As a result of this robust growth in the volume of product sales, operating income in 2001 increased by $110.0 million from the prior year. Changes in sales price did not have any significant effect on revenues compared to the prior year. Revenues from acquisitions completed in 2001 under the purchase method of accounting contributed $34 million in incremental revenues. Backlog of the Products and Technology capital products was $364 million at December 31, 2002, $385 million at December 31, 2001 and $282 million at December 31, 2000. Backlog at December 31, 2002 includes $170 million acquired in late December through the purchase of Hydralift ASA. Substantially all of the current backlog is expected to be shipped by mid-year 2004. Distribution Services Distribution Services revenues fell $21.6 million, or 3%, from the 2001 level as this segment's strategy to create strategic alliances and expand its international presence made significant market penetration during a difficult market. North American revenues fell approximately 16% due to the lower activity level while shipments in the international market almost doubled. Sales of our own-make products increased almost 12% while maintenance, repair and operating ("MRO") supplies fell almost 5%. Changes in sales price did not have any significant effect on revenues compared to the prior year. Operating income in 2002 was $10.4 million lower than the prior year. Margin reduction, due to the lower volume and project bidding pressures, contributed to approximately 80% of the operating income shortfall with the remainder due to significant infrastructure growth. Distribution Services revenues in 2001 increased $186.5 million from the 2000 level with all areas and products participating in the upswing that lasted until the middle of the 4th quarter 2001. U.S. revenues of MRO supplies were up 44% while Canadian revenues were 13% higher than the prior year. Changes in sales price did not have any significant effect on revenues compared to the prior year. Operating income in 2001 increased by $15.6 million from the prior year due to the higher revenue volume and cost efficiencies linked to the new global operating system. Revenues from acquisitions completed in 2001 under the purchase method of accounting contributed $24 million in incremental revenues. Corporate Corporate charges represent the unallocated portion of centralized and executive management costs. Year 2002 costs of $10.8 million reflect certain corporate-led marketing initiatives and general overhead incurred to support a 12

larger company. Year 2001 costs of $10.2 million represents a 10% reduction from the prior year as various e-strategy and e-commerce initiatives became operational. Year 2003 corporate charges are expected to approximate $12 million due to recent acquisitions. Special Charge During 2000, we recorded a special charge, net of a $0.4 million credit from previous special charges, of $14.1 million ($11.0 million after tax, or $0.14 per share) related to the merger with IRI International. Components of the charge were (in millions): Direct transaction costs $ 6.6 Severance 6.4 Facility closures 1.5 -------- 14.5 Prior year reversal (0.4) -------- $ 14.1 ======== The cash and non-cash elements of the charge approximated $13 million and $1.1 million, respectively. All direct cash outlays have been spent. Facility closure costs consisted of lease cancellation costs and impairment of a closed manufacturing facility that is classified with "Property held for sale" on our balance sheet. All of this charge is applicable to the Products and Technology business segment. Interest Expense Interest expense in 2002 totaled $24.1 million, an increase of $1.3 million from the prior year. All of this increase is a direct result of our mid-November 2002 sale of $200 million of 5.65% unsecured senior notes. Our average borrowing cost during 2002 of 6.4% remained the same as 2001. We expect our interest expense in 2003 to increase by at least $10 million as a result of our higher senior debt level. Despite continual borrowing rate declines during 2001, interest expense increased approximately $5.5 million over 2000 due to our higher debt level to support the working capital associated with the robust business climate. In March 2001, we sold $150 million of 6 1/2% unsecured senior notes which increased our total senior debt to $300 million. Year 2001 average monthly debt, including the senior notes, was $334 million or $118 million (54%) greater than the 2000 level. Income Taxes National Oilwell is subject to U.S. federal, state and foreign taxes and recorded a combined tax rate of 35% in 2002, 38% in 2001 and 51% in 2000. The 2000 effective tax rate was impacted by certain transaction costs associated with the IRI merger and the inclusion of pre-merger IRI capital losses due to pooling-of-interests accounting that may not be deductible. Excluding the impact of merger-related costs and capital losses, our combined effective tax rate for 2000 was 36%. We expect our tax rate in 2003 to approximate 34%. We have net operating loss carryforwards in the United States that could reduce future tax expense by up to $4.2 million. They expire at various dates through 2017. Additional loss carryforwards in Europe could reduce future tax expense by $10.3 million and reduce goodwill $9.4 million if realized in the future. Due to the uncertainty of future utilization of these loss carryforwards, $2.8 million of the potential benefits in the U.S. and $9.6 million in Europe have been fully reserved. LIQUIDITY AND CAPITAL RESOURCES At December 31, 2002, National Oilwell had working capital of $768.9 million, an increase of $137.6 million from December 31, 2001. The addition of Hydralift ASA and consolidation of the Chinese joint venture accounted for $123.3 million of this increase, including $78 million of the increase in cash. After considering the Halco acquisition in January 2002 and the change in current deferred taxes, the rest of the company reduced our need for 13

working capital during 2002. Due to a new revolving three-year credit facility put in place during July 2002, all of our debt is of a long-term nature. Total capital expenditures were $24.8 million during 2002, $27.4 million in 2001 and $24.6 million in 2000. Additions and enhancements to the downhole rental tool fleet and information management and inventory control systems represent the majority of these capital expenditures. Capital expenditures are expected to approximate $35 million in 2003, which should also approximate depreciation expense in that year, with continued emphasis on rental tools and information technology. We believe we have sufficient existing manufacturing capacity to meet currently anticipated demand through 2003 for our products and services. In November 2002, we sold $200 million of 5.65 % unsecured senior notes due November 15, 2012. Proceeds were used to acquire Hydralift ASA. Interest is payable on May 15 and November 15 of each year. In March 2001, we sold $150 million of 6.50 % unsecured senior notes due March 15, 2011, with interest payable on March 15 and September 15 of each year. In June 1998, we sold $150 million of 6.875 % unsecured senior notes due July 1, 2005, with interest payments due annually on January 1 and July 1. On July 30, 2002, we replaced the existing credit facility with a new three-year unsecured $175 million revolving credit facility. This facility is available for acquisitions and general corporate purposes and provides up to $50 million for letters of credit, of which $22.0 million were outstanding at December 31, 2002. Interest is based upon prime or Libor plus 0.5% subject to a ratings based grid. In securing this new credit facility, we incurred approximately $0.9 million in fees which will be amortized to expense over the term of the facility. The senior notes contain reporting covenants and the credit facility contains financial covenants and ratios regarding maximum debt to capital and minimum interest coverage. We were in compliance with all covenants governing these facilities at December 31, 2002. We also have additional credit facilities totaling $223 million that are used primarily for acquisitions, general corporate purposes and letters of credit. Recently acquired Hydralift ASA represents $152 million of these facilities. These multi-currency Hydralift committed facilities are secured by a guarantee, contain financial covenants and expire in 2006. Borrowings against these additional credit facilities totaled $93 million at December 31, 2002 and an additional $39 million had been used for letters of credit and guarantees. We believe cash generated from operations and amounts available under our credit facilities and from other sources of debt will be sufficient to fund operations, working capital needs, capital expenditure requirements and financing obligations. We also believe any significant increase in capital expenditures caused by any need to increase manufacturing capacity can be funded from operations or through debt financing. We have not entered into any transactions, arrangements, or relationships with unconsolidated entities or other persons which would materially affect liquidity, or the availability of or requirements for capital resources. A summary of our outstanding contractual obligations and other commercial commitments at December 31, 2002 is as follows (in thousands): 14
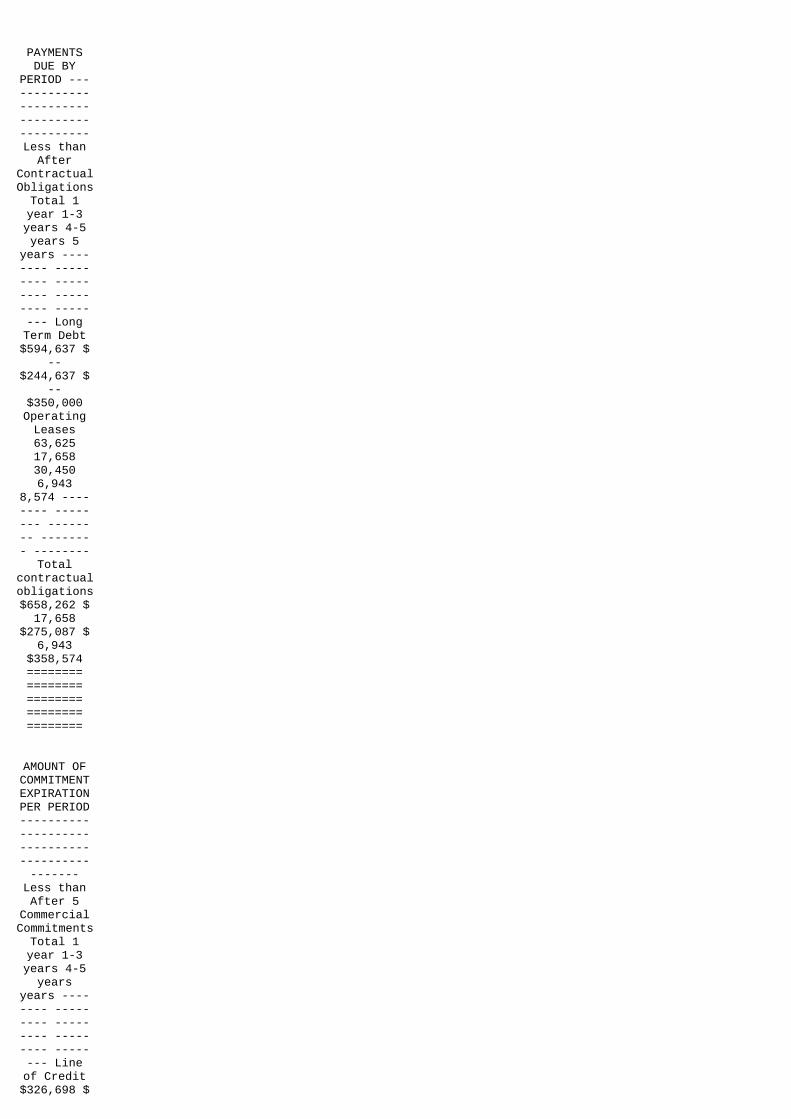
PAYMENTSDUE BY
PERIOD -------------------------------------------Less than
AfterContractualObligationsTotal 1year 1-3years 4-5years 5
years -------- --------- --------- --------- -------- LongTerm Debt$594,637 $
--$244,637 $
--$350,000OperatingLeases63,62517,65830,4506,943
8,574 -------- -------- -------- -------- --------
Totalcontractualobligations$658,262 $17,658
$275,087 $6,943
$358,574========================================
AMOUNT OFCOMMITMENTEXPIRATIONPER PERIOD-----------------------------------------------
Less thanAfter 5
CommercialCommitmentsTotal 1year 1-3years 4-5years
years -------- --------- --------- --------- -------- Lineof Credit$326,698 $

--$326,698 $-- $ --Standby
Letters ofCredit61,43241,635
19,797 ---- -------- ---------------- -------- --------Total
commercialcommitments$388,130 $41,635
$346,495 $-- $ --========================================
We intend to pursue additional acquisition candidates, but the timing, size or success of any acquisition effort and the related potential capital commitments cannot be predicted. We expect to fund future cash acquisitions primarily with cash flow from operations and borrowings, including the unborrowed portion of the credit facility or new debt issuances, but may also issue additional equity either directly or in connection with acquisitions. There can be no assurance that acquisition funds will be available at terms acceptable to us. Inflation has not had a significant impact on National Oilwell's operating results or financial condition in recent years. MARKET RISK DISCLOSURE We are exposed to changes in foreign currency exchange rates and interest rates. Additional information concerning each of these matters follows: Foreign Currency Exchange Rates We have operations in foreign countries, including Canada, Norway and the United Kingdom, as well as operations in Latin America, China and other European countries. The net assets and liabilities of these operations are exposed to changes in foreign currency exchange rates, although such fluctuations generally do not affect income since their functional currency is the local currency. For operations where our functional currency is not the local currency, such as Singapore and Venezuela, the net asset or liability position is insignificant and, therefore, changes in foreign currency exchange rates are not expected to have a material impact on earnings. Some of our revenues in foreign countries are denominated in US dollars, and therefore, changes in foreign currency exchange rates impact our earnings to the extent that costs associated with those US dollar revenues are denominated in the local currency. In order to mitigate that risk, we may utilize foreign currency forward contracts to better match the currency of our revenues and associated costs. We do not use foreign currency forward contracts for trading or speculative purposes. The counterparties to these contracts are major financial institutions, which minimizes counterparty credit risk. The impact of foreign currency exchange rates has not materially affected our results of operations in any of the last three years. We do not believe that a hypothetical 10% movement in these foreign currencies would have a material impact on our earnings. 15

Interest Rate Risk Our long term borrowings consist of $150 million in 6.875% senior notes, $150 million in 6.5% senior notes and $200 million in 5.65% senior notes. We also have borrowings under our other facilities totaling $94.6 million at December 31, 2002. A portion of the borrowings are denominated in multiple currencies which could expose us to market risk with exchange rate movements. These instruments carry interest at a pre-agreed upon percentage point spread from either the prime interest rate, LIBOR or NIBOR. Under our credit facilities, we may, at our option, fix the interest rate for certain borrowings based on a spread over LIBOR or NIBOR for 30 days to 6 months. Based upon our December 31, 2002 borrowings under our variable rate facilities of $94.6 million, an immediate change of one percent in the interest rate would cause a change in annual interest expense of approximately $0.9 million. Our objective in maintaining a portion of our debt in variable rate borrowings is the flexibility obtained regarding early repayment without penalties and lower overall cost as compared with fixed-rate borrowings. CRITICAL ACCOUNTING POLICIES AND ESTIMATES The preparation of our financial statements requires us to make certain estimates and assumptions that affect the amounts reported in the financial statements and accompanying notes. Our estimation process generally relates to potential bad debts, obsolete and slow moving inventory, value of intangible assets, and deferred income tax accounting. Note 1 to the consolidated financial statements contains the accounting policies governing each of these matters. Our estimates are based on historical experience and on our future expectations that we believe to be reasonable under the circumstances. The combination of these factors result in the amounts shown as carrying values of assets and liabilities in the financial statements and accompanying notes. Actual results could differ from our current estimates and those differences may be material. We believe the following accounting policies are the most critical in the preparation of our consolidated financial statements: We maintain an allowance for doubtful accounts for accounts receivables by providing for specifically identified accounts where collectibility is doubtful and a general allowance based on the aging of the receivables compared to past experience and current trends. A majority of our revenues come from drilling contractors, independent oil companies, international oil companies and government-owned or government-controlled oil companies, and we have receivables, some denominated in local currency, in many foreign countries. If, due to changes in worldwide oil and gas drilling activity or changes in economic conditions in certain foreign countries, our customers were unable to repay these receivables, additional allowances would be required. Allowances for inventory obsolescence are determined based on our historical usage of inventory on-hand as well as our future expectations related to our substantial installed base and the development of new products. The amount reserved is the recorded cost of the inventory minus its estimated realizable value. Changes in worldwide oil and gas drilling activity and the development of new technologies associated with the drilling industry could require additional allowances to reduce the value of inventory to the lower of its cost or net realizable value. We account for our defined benefit pension plans in accordance with Statement of Financial Accounting Standards No. 87, Employers' Accounting for Pensions (FAS 87), which requires that amounts recognized in the financial statements be determined on an actuarial basis. Significant elements in determining our pension income or expense in accordance with FAS 87 is the discount rate assumption and the expected return on plan assets. The discount rate used approximates the weighted average rate of return on high-quality fixed income investments whose maturities match the expected payouts. The expected return on plan assets is based upon the geometric mean of historical returns of a number of different equities, including stocks, bonds and U.S. treasury bills. The assumed long-term rate of return on assets is applied to a calculated value of plan assets, which results in an estimated return on plan assets that is included in current year pension income or expense. The difference between this expected return and the actual return on plan assets is deferred and amortized against future pension income or expense. A substantial portion of our pension amounts relate to its defined benefit plans in the United States and the United Kingdom. During 2000, 2001 and 2002, we assumed that the expected long-term rate of return on plan assets for these plans would be between 6.3% and 8.0%. Prior to 2001, our actual cumulative long-term rate of return on the pension 16

assets of these plans was in excess of these amounts; however, these plans' assets have recently earned substantially less than the assumed rates of return. The impact of our pension plans on our 2002 results of operations, cash flow and liquidity has been immaterial but recent actual returns of the plan assets may effect future contributions to the plans and our earnings. The amount of unrecognized losses on pension assets is $31.8 million. For 2003, we have lowered the assumed rates of return to between 6.0% and 7.0%, depending on the plan. As a result of this and other factors, we believe there will be an increase in pension expense of approximately $0.5-$1.0 million for 2003. Business acquisitions are accounted for using the purchase method of accounting. The cost of the acquired company is allocated to identifiable tangible and intangible assets based on estimated fair value, with the excess allocated to goodwill. On at least an annual basis, we assess whether goodwill is impaired. Our annual impairment tests are performed at the beginning of the 4th quarter of each year. If we determine that goodwill is impaired, we measure that impairment based on the amount by which the book value of goodwill exceeds its implied fair value. The implied fair value of goodwill is determined by deducting the fair value of a reporting unit's identifiable assets and liabilities from the fair value of that reporting unit as a whole. Additional impairment assessments may be performed on an interim basis if we encounter events or changes in circumstances that would indicate that, more likely than not, the carrying amount of goodwill has been impaired. The fair value of the reporting units is determined based on internal management estimates that considers multiple valuation techniques. Our net deferred tax assets and liabilities are recorded at the amount that is more likely than not to be realized or paid. Should we determine that we would not be able to realize all or part of the net deferred tax asset in the future, an adjustment to the deferred tax assets would be charged to income in the period of such determination. SUBSEQUENT EVENTS On January 2, 2003, we acquired LSI, a Houston, Texas based distributor of specialty electrical products, for approximately $13 million. This transaction generated approximately $6 million in goodwill and is complementary to our distribution services business. On January 16, 2003, we acquired the Mono pumping products business from Halliburton Energy Services for approximately $89 million, consisting of $22.7 million in cash and 3.2 million shares of our common stock. This transaction, which consisted of purchasing all the outstanding stock of Monoflo, Inc. in the United States and Mono Group in the United Kingdom, generated approximately $46 million in goodwill and will add to the non-capital product lines within our Products and Technology segment. RECENTLY ISSUED ACCOUNTING STANDARDS The Financial Accounting Standards Board issued Statement on Financial Accounting Standards (SFAS) No. 143, "Accounting for Asset Retirement Obligations", which sets forth the accounting and reporting to be followed for obligations associated with the retirement of tangible long-lived assets and the associated asset retirement costs and SFAS No. 146, "Accounting for Costs Associated with Exit or Disposal Activities", addresses disposal activities and termination costs in exiting an activity. These pronouncements are generally effective January 1, 2003. The Company believes the adoption of these new accounting pronouncements will not have a significant impact on its results of operations or financial position. FORWARD-LOOKING STATEMENTS Some of the information in this document contains, or has incorporated by reference, forward-looking statements. Statements that are not historical facts, including statements about our beliefs and expectations, are forward-looking statements. Forward-looking statements typically are identified by use of terms such as "may," "will," "expect," "anticipate," "estimate," and similar words, although some forward-looking statements are expressed differently. You should be aware that our actual results could differ materially from results anticipated in the forward-looking statements due to a number of factors, including but not limited to changes in oil and gas prices, customer demand for our products and worldwide economic activity. You should also consider carefully the statements under "Risk 17

Factors" which address additional factors that could cause our actual results to differ from those set forth in the forward-looking statements. Given these uncertainties, current or prospective investors are cautioned not to place undue reliance on any such forward-looking statements. We undertake no obligation to update any such factors or forward-looking statements to reflect future events or developments. ITEM 7A. QUANTITATIVE AND QUALITATIVE DISCLOSURES ABOUT MARKET RISK Incorporated by reference to Item 7 above, "Market Risk Disclosure." ITEM 8. FINANCIAL STATEMENT AND SUPPLEMENTARY DATA Attached hereto and a part of this report are financial statements and supplementary data listed in Item 15. ITEM 9. CHANGES IN AND DISAGREEMENTS WITH ACCOUNTANTS ON ACCOUNTING AND FINANCIAL DISCLOSURE None. 18

PART III ITEM 10. DIRECTORS AND EXECUTIVE OFFICERS OF THE REGISTRANT Incorporated by reference to the definitive Proxy Statement for the 2003 Annual Meeting of Stockholders. ITEM 11. EXECUTIVE COMPENSATION Incorporated by reference to the definitive Proxy Statement for the 2003 Annual Meeting of Stockholders. ITEM 12. SECURITY OWNERSHIP OF CERTAIN BENEFICIAL OWNERS AND MANAGEMENT Incorporated by reference to the definitive Proxy Statement for the 2003 Annual Meeting of Stockholders. ITEM 13. CERTAIN RELATIONSHIPS AND RELATED TRANSACTIONS Incorporated by reference to the definitive Proxy Statement for the 2003 Annual Meeting of Stockholders ITEM 14. CONTROLS AND PROCEDURES (a) Evaluation of disclosure controls and procedures Our chief executive officer and chief financial officer, based on their evaluation of our disclosure controls and procedures (as defined in Exchange Act Rule 13a-14(c)) as of a date within 90 days prior to the filing of this annual report on Form 10-K, have concluded that our disclosure controls and procedures are adequate and effective for the information required to be disclosed by us in the reports we file or submit under the Securities Exchange Act of 1934, as amended (the "Exchange Act"), and that this information is recorded, processed, summarized and reported within the time periods specified in the Securities and Exchange Commission's rules and forms. (b) Changes in internal control There were no significant changes in our internal controls or in other factors that could significantly affect our internal controls subsequent to the date of their evaluation described above. 19

PART IV ITEM 15. EXHIBITS, FINANCIAL STATEMENT SCHEDULES AND REPORTS ON FORM 10-K a) Financial Statements and Exhibits 1. Financial Statements The following financial statements are presented in response to Part II, Item 8:
Page(s) in This Report -----------Consolidated Balance
Sheets......................................24Consolidated Statements of
Operations............................25Consolidated Statements of Cash
Flows............................26Consolidated Statements of Stockholders'
Equity..................27 Notes toConsolidated Financial
Statements.......................28 2.Financial Statement Schedules Schedule II -
Valuation and QualifyingAccounts...................49
All schedules, other than Schedule II, are omitted because they are not applicable, not required or the information is included in the financial statements or notes thereto. 3. Exhibits 2.1 Combination Agreement between National-Oilwell, Inc. and Hydralift ASA regarding the transaction announced October 11, 2002 (Exhibit 2.1) (5). Previously filed with Registrant's form 10K. 3.1 Amended and Restated Certificate of Incorporation of National-Oilwell, Inc. (Exhibit 3.1) (1). Previously filed with Registrant's form 10K. 3.2 By-laws of National-Oilwell, Inc. Previously filed with Registrant's form 10K. 10.1 Employment Agreement dated as of January 1, 2002 between Merrill A. Miller, Jr. and National Oilwell, with a similar agreement with Steven W. Krablin (Exhibit 10.1) (2). Previously filed with Registrant's form 10K. 10.2 Employment Agreement dated as of January 1, 2002 between Dwight W. Rettig and National Oilwell, with similar agreements with Robert L. Bloom, Kevin Neveu, Mark A. Reese and Robert R. Workman (Exhibit 10.2) (2). Previously filed with Registrant's form 10K. 10.3 Employment Agreement dated as of June 28, 2000 between Gary W. Stratulate and IRI International, Inc., which has now merged into National Oilwell (Exhibit 10.3) (2). Previously filed with Registrant's form 10K. 10.4 Amended and Restated Stock Award and Long-Term Incentive Plan (Exhibit 10.1) (3)*. Previously filed with Registrant's form 10K. 10.5 Loan Agreement dated July 30, 2002 (Exhibit 10.2) (3). Previously filed with Registrant's form 10K. 20

10.6 Employment Agreement dated as of March 1, 2000 between Jon Gjedebo and a National Oilwell subsidiary (Exhibit 10.8) (4). Previously filed with Registrant's form 10K. 10.7 Non-competition Agreement dated as of June 28, 2000 between Hushang Ansary and National Oilwell (Exhibit 10.9) (4). Previously filed with Registrant's form 10K. 21.1 Subsidiaries of the Company. Previously filed with Registrant's form 10K. 23.1 Consent of Ernst & Young LLP 24.1 Power of Attorney (included on signature page hereto). Previously filed with Registrant's form 10K. 99.1 Certification pursuant to Section 906 of the Sarbanes-Oxley Act of 2002. Previously filed with Registrant's form 10K. 99.2 Certification pursuant to Section 906 of the Sarbanes-Oxley Act of 2002. Previously filed with Registrant's form 10K. b) Reports on Form 8-K A report on Form 8 - K was filed on October 16, 2002 regarding a press release announcing the signing of a Combination Agreement to acquire Hydralift ASA for NOK 55, approximately U.S. $7.33, per share. A report on Form 8 - K was filed on November 14, 2002 which contained the Combination Agreement of the previously announced transaction with Hydralift ASA. A report on Form 8 - K was filed on February 12, 2003 regarding a press release announcing our financial results for the fourth quarter and full year ended December 31,2002. * Compensatory plan or arrangement for management or others (1) Filed as an Exhibit to our Quarterly Report on Form 10-Q filed on August 11, 2000. (2) Filed as an Exhibit to our Annual Report on Form 10-K filed on March 28, 2002. (3) Filed as an Exhibit to our Quarterly Report on Form 10-Q filed on November 12, 2002. (4) Filed as an Exhibit to our Annual Report on Form 10-K filed on March 1, 2001. (5) Filed as an Exhibit to our Current Report on Form 8-K filed on November 14, 2002. 21
SIGNATURES Pursuant to the requirements of Section 13 or 15 (d) of the Securities Exchange Act of 1934, the registrant has duly caused this report to be signed on its behalf by the undersigned, thereunto duly authorized. NATIONAL-OILWELL, INC. DATE: APRIL 11, 2003 BY: /s/ STEVEN W. KRABLIN -------------------------- ------------------------------- STEVEN W. KRABLIN VICE PRESIDENT AND CHIEF FINANCIAL OFFICER CERTIFICATIONS I, Steven W. Krablin, certify that: 1. I have reviewed this annual report on Form 10-K/A of National Oilwell, Inc.; 2. Based on my knowledge, this annual report does not contain any untrue statement of a material fact or omit to state a material fact necessary to make the statements made, in light of the circumstances under which such statements were made, not misleading with respect to the period covered by this annual report; 3. Based on my knowledge, the financial statements, and other financial information included in this annual report, fairly present in all material respects the financial condition, results of operations and cash flows of the registrant as of, and for, the periods presented in this annual report; DATE: APRIL 11, 2003 BY: /s/ STEVEN W. KRABLIN -------------------------- ------------------------------- STEVEN W. KRABLIN VICE PRESIDENT AND CHIEF FINANCIAL OFFICER 22
REPORT OF INDEPENDENT AUDITORS The Board of Directors and Shareholders National-Oilwell, Inc. We have audited the accompanying consolidated balance sheets of National-Oilwell, Inc., as of December 31, 2002 and 2001, and the related consolidated statements of income, stockholders' equity, and cash flows for each of the three years in the period ended December 31, 2002. These financial statements are the responsibility of the Company's management. Our responsibility is to express an opinion on these financial statements based on our audits. We conducted our audits in accordance with auditing standards generally accepted in the United States. Those standards require that we plan and perform the audit to obtain reasonable assurance about whether the financial statements are free of material misstatement. An audit includes examining, on a test basis, evidence supporting the amounts and disclosures in the financial statements. An audit also includes assessing the accounting principles used and significant estimates made by management, as well as evaluating the overall financial statement presentation. We believe that our audits provide a reasonable basis for our opinion. In our opinion, the financial statements referred to above present fairly, in all material respects, the consolidated financial position of National-Oilwell, Inc., at December 31, 2002 and 2001, and the consolidated results of its operations and its cash flows for each of the three years in the period ended December 31, 2002, in conformity with accounting principles generally accepted in the United States. As discussed in Note 1 to the consolidated financial statements, in 2002 the Company changed its method of accounting for goodwill and other intangible assets. /s/ ERNST & YOUNG LLP Houston, Texas February 18, 2003 23

NATIONAL-OILWELL, INC. CONSOLIDATED BALANCE SHEETS (IN THOUSANDS, EXCEPT SHARE DATA) December 31,December 31,2002 2001 ------------ ------------
ASSETSCurrent
assets: Cashand cash
equivalents$ 118,338 $
43,220Receivables,net 428,116
382,153Inventories
470,088455,934Costs inexcess ofbillings53,805 --Deferred
income taxes26,78316,825
Prepaid andothercurrentassets17,938
10,434 ----------- ----------- Total
currentassets
1,115,068908,566
Property,plant andequipment,net 208,420
168,951Deferred
income taxes36,86416,663
Goodwill,net 581,576
352,094Propertyheld forsale 7,389
12,144 Otherassets19,345
13,278 ----------- ----------- $
1,968,662 $1,471,696======================LIABILITIES
ANDSTOCKHOLDERS'
EQUITYCurrent
liabilities:Current
portion oflong-termdebt --10,213Accounts

payable168,548161,277Customer
prepayments9,533 9,843
Accruedcompensation5,087 23,661Billings inexcess of
costs 61,738-- Otheraccrued
liabilities101,310
72,315 ----------- ----------- Total
currentliabilities
346,216277,309
Long-termdebt 594,637
300,000Deferred
income taxes54,612
20,380 Otherliabilities30,229 6,467----------------------
Totalliabilities1,025,694604,156
Commitmentsand
contingenciesMinorityinterest9,604 --
Stockholders'equity:
Common stock- par value
$.01;81,014,713
and80,902,882shares
issued andoutstandingat December31, 2002 andDecember 31,2001 810 809Additionalpaid-incapital594,849592,507
Accumulatedother
comprehensiveloss
(44,461)(34,873)Retainedearnings382,166
309,097 ----------- ----
-------933,364
867,540 ----------- ----------- $1,968,662 $

1,471,696====================== The accompanying notes are an integral part of these statements. 24

NATIONAL-OILWELL, INC. CONSOLIDATED STATEMENTS OF OPERATIONS (IN THOUSANDS, EXCEPT PER SHARE DATA) Year Ended
December 31,--------------------------------------------- 20022001 2000 ----------- ----------- -----
------Revenues $1,521,946 $1,747,455 $1,149,920Cost of
revenues:Cost of
products andservices sold1,160,0821,319,621884,774Mergerrelated
inventorywrite-offs ---- 15,684 ----------- ----------- ----------- Gross
profit361,864427,834249,462Selling,
general, andadministrative
227,541238,557186,924Special
charge -- --14,082 ----------- ----------- ----------- Operating
income134,323189,27748,456
Interest andfinancial
costs(27,279)(24,929)(19,069)Interest
income 2,6381,775 2,908Other income(expense),net 3,656
1,894 (5,258)----------- ----------- -----------
Income beforeincome taxesand minority
interest113,338168,01727,037
Provision forincome taxes

39,396 63,95413,901 ----------- ----------- ----------- Incomebeforeminorityinterest73,942104,06313,136Minority
interest inincome of
consolidatedsubsidiaries(873) -- --Net income $
73,069 $104,063 $13,136
=================================Net incomeper share:Basic $ 0.90$ 1.29 $ 0.17=================================Diluted $
0.89 $ 1.27 $0.16
=================================Weightedaverageshares
outstanding:Basic 80,97480,813 79,325=================================
Diluted81,709 81,733
80,760=================================
The accompanying notes are an integral part of these statements. 25

NATIONAL-OILWELL, INC. CONSOLIDATED STATEMENTS OF CASH FLOWS (IN THOUSANDS)
Year EndedDecember 31, ---------------------------------------2002 2001 2000 --------- --------- --------- Cash flowfrom operatingactivities: Netincome $ 73,069 $104,063 $ 13,136Adjustments toreconcile net
income to net cashprovided (used) by
operatingactivities:
Depreciation andamortization25,048 38,873
35,034 Provisionfor losses on
receivables 3,6063,897 1,589Provision for
deferred incometaxes 11,446 7,847(5,881) Gain onsale of assets(4,551) (2,878)(3,522) Foreign
currencytransaction (gain)
loss 307 573(1,397) Taxbenefit fromexercise of
nonqualified stockoptions 328 2,348
4,901 Specialcharge -- --14,082 Merger
related inventorywrite-offs -- --15,684 Changes in
assets andliabilities, netof acquisitions:
Marketablesecurities -- --14,686 Receivables58,953 (74,700)
(65,619)Inventories 25,189(71,906) (27,219)
Income taxesreceivable -- --12,888 Prepaid and
other currentassets (2,960)2,411 (4,802)
Accounts payable(32,031) (23,357)
47,345 Otherassets/liabilities,
net (54,363)(22,547) (24,292)--------- --------- --------- Netcash provided(used) byoperating
activities 104,041(35,376) 26,613 --------- ---------

--------- Cashflow frominvestingactivities:Purchases of
property, plantand equipment
(24,805) (27,358)(24,561) Proceeds
from sale ofassets 12,5347,927 8,227Businesses
acquired andinvestments injoint ventures,
net of cash(213,052) (38,517)(48,208) ------------------ --------- Net cash used by
investingactivities
(225,323) (57,948)(64,542) ------------------ --------- Cash flow from
financingactivities:
Borrowings againstlines of credit303,220 294,084273,376 Paymentsagainst lines ofcredit (311,018)
(354,310)(254,202) Netproceeds from
issuance of long-term debt 199,070
146,631 --Proceeds fromstock optionsexercised 2,343
9,286 14,247 Other1,363 -- (662) --------- --------- --------- Net cash
provided byfinancing
activities 194,97895,691 32,759 --------- --------- --------- Effect of
exchange ratelosses on cash1,422 (1,606)
(462) --------- --------- ---------
Increase(decrease) in cashand equivalents
75,118 761 (5,632)Cash and cashequivalents,
beginning of year43,220 42,459
48,091 --------- --------- ---------
Cash and cashequivalents, endof year $ 118,338$ 43,220 $ 42,459
===========================
Supplementaldisclosures of
cash flowinformation: Cashpayments during

the period for:Interest $ 21,579$ 20,772 $ 16,807
Income taxes45,615 26,775
7,333 The accompanying notes are an integral part of these statements. 26

NATIONAL-OILWELL, INC. CONSOLIDATED STATEMENTS OF STOCKHOLDERS' EQUITY (IN THOUSANDS, EXCEPT SHARE DATA) ACCUMULATEDADDITIONALOTHER COMMON
PAID-INCOMPREHENSIVE
RETAINEDSTOCK
CAPITAL LOSSEARNINGS
TOTAL --------- ---------- ------------- --------- ---------Balance at
December 31,1999 $ 717 $415,701 $(11,923) $191,880 $
596,375 --------- --------- --------- ------------------Net income13,136
13,136 Othercomprehensive
incomeCurrency
translationadjustments(10,684)(10,684)Marketablesecuritiesvaluationadjustment
749 749 ---------
Comprehensiveincome 3,201Stock issued
foracquisition79 153,948154,027Stockoptions
exercised 98,580 8,589Tax benefitof optionsexercised4,901 4,901Other 95 18113 --------- ------------------ --------- ----
-----Balance at
December 31,2000 $ 805 $583,225 $(21,858) $205,034 $
767,206 --------- --------- --------- ------------------Net income104,063

104,063Other
comprehensiveincomeCurrency
translationadjustments(11,569)(11,569)Marketablesecuritiesvaluationadjustment(1,446)
(1,446) ---------
Comprehensiveincome
91,048 Stockoptions
exercised 46,934 6,938Tax benefitof optionsexercised2,348 2,348--------- --------- --------- --------- --------- Balance atDecember 31,2001 $ 809 $592,507 $(34,873) $309,097 $867,540
=============================================Net income73,069
73,069 Othercomprehensive
incomeCurrency
translationadjustments2,474 2,474Interestrate
contract 886886 Minimumliability of
definedbenefitplans
(12,948)(12,948) ---
------Comprehensive
income63,481 Stock
optionsexercised 12,014 2,015Tax benefitof optionsexercised
328 328 --------- --------- --------- ------------------Balance at
December 31,2002 $ 810 $594,849 $(44,461) $

382,166 $933,364
=============================================
The accompanying notes are an integral part of these statements. 27

NATIONAL-OILWELL, INC. NOTES TO CONSOLIDATED FINANCIAL STATEMENTS 1. ORGANIZATION AND BASIS OF PRESENTATION NATURE OF BUSINESS We are a worldwide leader in the design, manufacture and sale of comprehensive systems, components, and products used in oil and gas drilling and production, as well as in distributing products and providing supply chain integration services to the upstream oil and gas industry. Our revenues and operating results are directly related to the level of worldwide oil and gas drilling and production activities and the profitability and cash flow of oil and gas companies and drilling contractors, which in turn are affected by current and anticipated prices of oil and gas. Oil and gas prices have been and are likely to continue to be volatile. SUMMARY OF SIGNIFICANT ACCOUNTING POLICIES Basis of Consolidation The accompanying consolidated financial statements include the accounts of National-Oilwell, Inc. and its majority-owned subsidiaries. All significant intercompany transactions and balances have been eliminated in consolidation. Investments that are not wholly-owned, but where we exercise control, are fully consolidated with the equity held by minority owners reflected as minority interest in the accompanying balance sheet and their portion of net income (loss) is included in other income (expense) in the accompanying statement of operations. Investments in unconsolidated affiliates, over which we exercise significant influence, but not control, are accounted for by the equity method. Investments in which we exercise no control or significant influence would be accounted for under the cost method. Fair Value of Financial Instruments The carrying amounts of financial instruments including cash and cash equivalents, receivables, and payables approximated fair value because of the relatively short maturity of these instruments. Cash equivalents include only those investments having a maturity date of three months or less at the time of purchase. The carrying values of other financial instruments approximate their respective fair values. Derivative Financial Instruments We record all derivative financial instruments at their fair value in our consolidated balance sheet. All derivative financial instruments we hold are designated as cash flow hedges and are highly effective in offsetting movements in the underlying risks. Accordingly, gains and losses from changes in the fair value of derivative financial instruments are deferred and recognized in earnings as the underlying transactions occur. Because our derivative financial instruments are so closely related to the underlying transactions, hedge ineffectiveness is insignificant. We use foreign currency forward contracts to mitigate our exposure to changes in foreign currency exchange rates on firm sale commitments to better match the local currency cost components of our fixed US dollar contracts. Such arrangements typically have terms between three months and one year, depending upon the customer's purchase order. We also use, from time to time, interest rate contracts to mitigate our exposure to changes in interest rates on anticipated long-term debt issuances. These contracts are typically short term in nature. We do not use derivative financial instruments for trading or speculative purposes. 28

Inventories Inventories consist of oilfield products, manufactured equipment, manufactured specialized drilling products and downhole motors and spare parts for manufactured equipment and drilling products. Inventories are stated at the lower of cost or market using the first-in, first-out or average cost methods. Allowances for excess and obsolete inventories are determined based on our historical usage of inventory on-hand as well as our future expectations related to our substantial installed base and the development of new products. The amount reserved, which totaled $49.4 million and $49.1 million at December 31, 2002 and 2001, respectively, is the recorded cost of the inventory minus its estimated realizable value. Provisions for excess and obsolete inventories have been immaterial in recent years. Property, Plant and Equipment Property, plant and equipment are recorded at cost. Expenditures for major improvements that extend the lives of property and equipment are capitalized while minor replacements, maintenance and repairs are charged to operations as incurred. Disposals are removed at cost less accumulated depreciation with any resulting gain or loss reflected in operations. Depreciation is provided using the straight-line method or declining balance method over the estimated useful lives of individual items. Depreciation expense was $25.0 million, $27.1 million and $24.7 million for the years ending December 31, 2002, 2001 and 2000. Long-lived Assets Effective January 1, 2002, we adopted SFAS 144, "Accounting for the Impairment or Disposal of Long-Lived Assets". SFAS 144 superceded SFAS 121, "Accounting for the Impairment of Long-Lived Assets and for Long-Lived Assets to be Disposed Of". The adoption of SFAS 144 had no effect on our results of operations. We record impairment losses on long-lived assets used in operations when events and circumstances indicate that the assets might be impaired and the undiscounted cash flows estimated to be generated by those assets are less than the carrying amount of those assets. The net carrying value of assets not recoverable is reduced to fair value if lower than carrying value. In determining the fair market value of the assets, we consider market trends and recent transactions involving sales of similar assets, or when not available, discounted cash flow analysis. Impairments of our equity investments would be recognized when declines in market values below carrying amounts were considered other than temporary. Assets Held for Sale In the course of integrating acquisitions and streamlining operations, we have closed certain manufacturing facilities. Facilities where we have a formal plan to sell the facility are classified as held for sale. We expect these facilities to be sold within the next 1 to 3 years. When we designate an asset as held for sale, we record its carrying value at the lower of its current carrying amount or the estimated fair value less costs to sell and stop recording depreciation expense. Intangible Assets Deferred financing costs are amortized on a straight-line basis over the life of the related debt security. Beginning in 2002, we adopted FAS 142 "Accounting for Goodwill and Other Intangible Assets" and accordingly stopped amortizing goodwill that arose from acquisitions before June 30, 2001. We also performed an impairment test as of the beginning of 2002 that indicated no impairment of goodwill or other intangibles. The effect of not amortizing goodwill and other intangibles in periods prior to adoption follows (in thousands): 29

YEAR ENDEDDECEMBER 31,2002 2001
2000 -------- -------- -
-------Reported net
income $73,069
$104,063 $13,136 Add
back:Goodwill
amortization,net of tax -
- 10,9599,930 -------- ----------------
Adjusted netincome $73,069
$115,022 $23,066
Adjusted netincome pershare: Basic$ 0.90 $
1.42 $ 0.29Diluted $0.89 $ 1.41
$ 0.29Weightedaverageshares
outstanding:Basic 80,974
80,81379,325Diluted81,70981,73380,760
On at least an annual basis, we assess whether goodwill is impaired. Our annual impairment tests are performed at the beginning of the 4th quarter of each year. Our annual impairment test indicated no impairment. If we determine that goodwill is impaired, we measure that impairment based on the amount by which the book value of goodwill exceeds its implied fair value. The implied fair value of goodwill is determined by deducting the fair value of a reporting unit's identifiable assets and liabilities from the fair value of that reporting unit as a whole. Additional impairment assessments may be performed on an interim basis if we encounter events or changes in circumstances that would indicate that, more likely than not, the carrying amount of goodwill has been impaired. Fair value of the reporting units is determined based on internal management estimates. Foreign Currency The functional currency for our Canadian, United Kingdom, Norwegian, German, Netherlands and Australian operations is the local currency. The cumulative effects of translating the balance sheet accounts from the functional currency into the U.S. dollar at current exchange rates are included in accumulated other comprehensive income. Revenues and expenses are translated at average exchange rates in effect during the period. The U.S. dollar is used as the functional currency for the Singapore and Venezuelan operations. Accordingly, financial statements of these foreign subsidiaries are remeasured to U.S. dollars for consolidation purposes using current rates of exchange for monetary assets and liabilities and historical rates of exchange for nonmonetary assets and related elements of expense. Revenue and other expense elements are remeasured at rates that approximate the rates in effect on the transaction dates. For all operations, gains or losses from remeasuring foreign currency transactions into the functional currency are included in income. Foreign currency transactions losses/(gains) were $0.3 million, $0.6 million and $(1.4) million for the years ending December 31, 2002, December 31, 2001 and December 31, 2000, respectively. Revenue Recognition

Our products and services are generally sold based upon purchase orders or contracts with the customer that include fixed or determinable prices and that do not include right of return or other similar provisions or other significant post delivery obligations. We record revenue at the time the manufacturing process is complete, the customer has been provided with all proper inspection and other required documentation, title and risk of loss has passed to the customer and when collectibility is reasonably assured. We also recognize revenue on bill-and-hold transactions where the product has been completed and is ready to be shipped, however at the customer's request, we store the product on the customers' behalf for a brief period of time, typically less than one year. Customer advances or deposits are deferred and recognized as revenue when we 30

have completed all of our performance obligations related to the sale. We also recognize revenue as services are performed and as rental charges are incurred. The amounts billed for shipping and handling costs are included in revenue and related costs are included in costs of sales. Revenues for the construction of large rig packages are reported on the percentage of completion method of accounting. Revenues and gross profit are recognized as work is performed based upon the relationship between actual costs incurred and total expected costs at completion. All known or anticipated losses on contracts are provided for immediately in earnings. Income Taxes The liability method is used to account for income taxes. Deferred tax assets and liabilities are determined based on differences between financial reporting and tax bases of assets and liabilities and are measured using the enacted tax rates and laws that will be in effect when the differences are expected to reverse. Valuation allowances are established when necessary to reduce deferred tax assets to amounts which are more likely than not to be realized. Concentration of Credit Risk We grant credit to our customers, which operate primarily in the oil and gas industry. We perform periodic credit evaluations of our customers' financial condition and generally do not require collateral, but may require letters of credit for certain international sales. We maintain an allowance for doubtful accounts for accounts receivables by providing for specifically identified accounts where collectibility is doubtful and an additional allowance based on the aging of the receivables compared to past experience and current trends. Accounts receivable are net of allowances for doubtful accounts of approximately $12.6 million and $9.1 million at December 31, 2002 and December 31, 2001, respectively. Stock-Based Compensation We use the intrinsic value method in accounting for our stock-based employee compensation plans. Environmental Liabilities When environmental assessments or remediations are probable and the costs can be reasonably estimated, remediation liabilities are recorded on an undiscounted basis and are adjusted as further information develops or circumstances change. Use of Estimates The preparation of financial statements in conformity with accounting principles generally accepted in the United States requires management to make estimates and assumptions that affect reported and contingent amounts of assets and liabilities as of the date of the financial statements and reported amounts of revenues and expenses during the reporting period. Actual results could differ from those estimates. Recently Issued Accounting Standards The Financial Accounting Standards Board issued Statement on Financial Accounting Standards (SFAS) No. 143, "Accounting for Asset Retirement Obligations", which sets forth the accounting and reporting to be followed for obligations associated with the retirement of tangible long-lived assets and the associated asset retirement costs and SFAS No. 146, "Accounting for Costs Associated with Exit or Disposal Activities", addresses disposal activities and termination costs in exiting an activity. These pronouncements are generally effective January 1, 2003. The Company believes the adoption of these new accounting pronouncements will not have a significant impact on its results of operations or financial position. 31

Net Income Per Share The following table sets forth the computation of weighted average basic and diluted shares outstanding (in thousands): YEAR ENDEDDECEMBER31, ---------------------------- 2002
2001 2000------ ------ ------Denominatorfor basicearningsper share- weightedaverage80,97480,81379,325
Effect ofdilutive
securities:Employeestockoptions735 920
1,435 ------ ------------
Denominatorfor
dilutedearningsper share- adjustedweightedaverage
shares andassumed
conversions81,70981,73380,760==================
2. ACQUISITIONS Year 2002 On December 18, 2002, we completed a cash tender offer for 92% of the common shares of Hydralift ASA, a Norwegian based company specializing in the offshore drilling equipment industry. By December 31, 2002, we had substantially completed the acquisition of the remaining shares for a total purchase price, including the assumption of debt, of approximately $300 million. The results of Hydralift's operations have been included in our income statement since the acquisition date. As a result of this acquisition, we strengthened our position in the offshore drilling market and gained access to new product lines that complement our existing product offerings. The combination of our product offerings will open new markets to us, particularly within the FPSO (floating production storage and offloading) market. 32
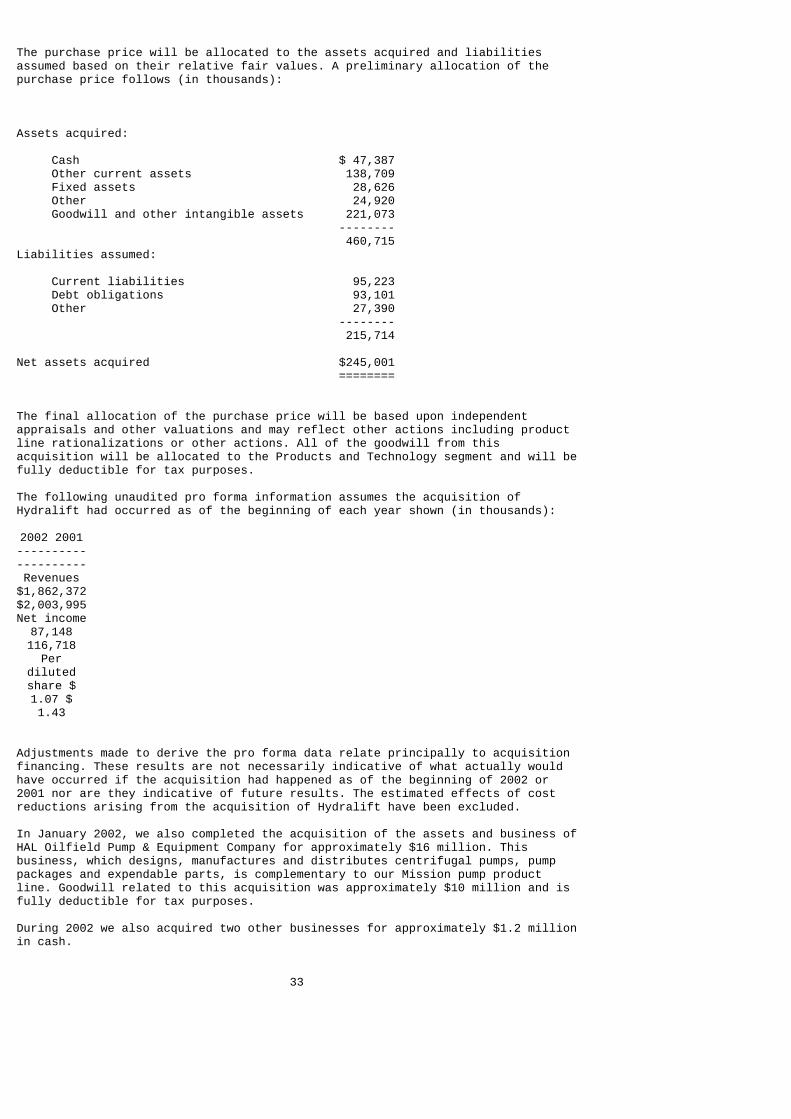
The purchase price will be allocated to the assets acquired and liabilities assumed based on their relative fair values. A preliminary allocation of the purchase price follows (in thousands): Assets acquired: Cash $ 47,387 Other current assets 138,709 Fixed assets 28,626 Other 24,920 Goodwill and other intangible assets 221,073 -------- 460,715 Liabilities assumed: Current liabilities 95,223 Debt obligations 93,101 Other 27,390 -------- 215,714 Net assets acquired $245,001 ======== The final allocation of the purchase price will be based upon independent appraisals and other valuations and may reflect other actions including product line rationalizations or other actions. All of the goodwill from this acquisition will be allocated to the Products and Technology segment and will be fully deductible for tax purposes. The following unaudited pro forma information assumes the acquisition of Hydralift had occurred as of the beginning of each year shown (in thousands): 2002 2001--------------------Revenues$1,862,372$2,003,995Net income87,148116,718Per
dilutedshare $1.07 $1.43
Adjustments made to derive the pro forma data relate principally to acquisition financing. These results are not necessarily indicative of what actually would have occurred if the acquisition had happened as of the beginning of 2002 or 2001 nor are they indicative of future results. The estimated effects of cost reductions arising from the acquisition of Hydralift have been excluded. In January 2002, we also completed the acquisition of the assets and business of HAL Oilfield Pump & Equipment Company for approximately $16 million. This business, which designs, manufactures and distributes centrifugal pumps, pump packages and expendable parts, is complementary to our Mission pump product line. Goodwill related to this acquisition was approximately $10 million and is fully deductible for tax purposes. During 2002 we also acquired two other businesses for approximately $1.2 million in cash. 33

Year 2001 In 2001, we acquired nine companies for an aggregate of $51 million in cash. Individual purchase prices ranged from $0.6 million to $16.5 million. Each of these acquisitions enhanced or expanded our market position within each of our segments. Five of these acquisitions related to our Products and Technology segment, including Integrated Power Systems, Maritime Hydraulics (Canada) Ltd., Tech Power Controls Company, Houston Scientific International, Inc. and Rigquip UK business and related assets. The remaining acquisitions, including Demij (a Netherlands distribution company), Rye Supply Company, Inc., Texas Oil Works Supply, Inc. and Well-Serv, Inc. related to our Distribution segment. Aggregate goodwill relating to these acquisitions was $30 million and approximately half of this amount is deductible for tax purposes. Year 2000 In February 2000, the merger with Hitec ASA was completed for approximately $158 million as we issued 7.9 million shares of common stock. This transaction was accounted for as a purchase effective February 1, 2000 and generated goodwill of approximately $150 million. In June 2000, IRI International Corporation was merged with the Company and accounted for as a pooling-of-interests. We issued 13.5 million shares of common stock valued at approximately $447 million. During 2000 we also acquired four other businesses for approximately $48 million in cash. The purchase method of accounting was used to account for these acquisitions and generated approximately $9 million in goodwill. Subsequent Events On January 2, 2003, we acquired LSI, a Houston, Texas based distributor of specialty electrical products, for approximately $13 million. This transaction generated approximately $6 million in goodwill and is complementary to our distribution services business. On January 16, 2003 we acquired the Mono pumping products business from Halliburton Energy Services for approximately $89 million, consisting of $22.7 million in cash and 3.2 million shares of our common stock. This transaction, which consisted of purchasing all the outstanding stock of Monoflo, Inc. in the United States and Mono Group in the United Kingdom, generated approximately $46 million in goodwill. 3. INVENTORIES Inventories consist of (in thousands): DECEMBER
31,DECEMBER31, 20022001 ------------ ------------Raw
materialsand
supplies$ 60,699$ 39,272Work inprocess109,924101,376Finishedgoodsand
purchasedproducts299,465315,286----------------Total
$470,088$455,934================

34

4. PROPERTY, PLANT AND EQUIPMENT Property, plant and equipment consists of (in thousands): ESTIMATEDDECEMBER
31,DECEMBER31, USEFULLIVES 20022001 ------------ ------------ ------------Land and
improvements2-20 Years$ 11,927 $
9,557Buildings
andimprovements5-31 Years74,61053,268
Machineryand
equipment5-12 Years111,65289,268Computerand officeequipment3-10 Years92,79473,322Rental
equipment1-7 Years77,328
63,971 --------- -----
----368,311289,386Less
accumulateddepreciation(159,891)(120,435) --------- --------- $208,420 $168,951
==================
5. LONG-TERM DEBT Long-term debt consists of (in thousands): DECEMBER
31,DECEMBER31, 20022001 ------------ ------------Credit
facilities$ 94,637 $10,2136.875%seniornotes150,000

150,0006.50%seniornotes150,000150,0005.65%seniornotes
200,000 ---------- --------594,637310,213Less
currentportion --10,213 -------- ----
----$594,637$300,000================ In November 2002, we sold $200 million of 5.65 % unsecured senior notes due November 15, 2012. Proceeds were used to acquire Hydralift ASA. Interest is payable on May 15 and November 15 of each year. In March 2001, we sold $150 million of 6.50 % unsecured senior notes due March 15, 2011, with interest payable on March 15 and September 15 of each year. In June 1998, we sold $150 million of 6.875 % unsecured senior notes due July 1, 2005, with interest payments due annually on January 1 and July 1. On July 30, 2002, we replaced the existing credit facility with a new three-year unsecured $175 million revolving credit facility. This facility is available for acquisitions and general corporate purposes and provides up to $50 million for letters of credit, of which $22.0 million were outstanding at December 31, 2002. Interest is based upon prime or Libor plus 0.5% subject to a ratings based grid. In securing this new credit facility, we incurred approximately $0.9 million in fees which will be amortized to expense over the term of the facility. The senior notes contain reporting covenants and the credit facility contains financial covenants and ratios regarding maximum debt to capital and minimum interest coverage. We were in compliance with all covenants governing these facilities at December 31, 2002. We also have additional credit facilities totaling $223 million that are used primarily for acquisitions, general corporate purposes and letters of credit. Recently acquired Hydralift ASA 35
represents $152 million of these facilities. These multi-currency Hydralift committed facilities are secured by a guarantee, contain financial covenants and expire in 2006. These instruments carry interest at a pre-agreed upon percentage point spread from either the prime interest rate or NIBOR. Borrowings against these additional credit facilities totaled $93 million at December 31, 2002 and an additional $39 million had been used for letters of credit and guarantees. 6. PENSION PLANS National Oilwell and its consolidated subsidiaries have pension plans covering substantially all of its employees. Defined-contribution pension plans cover most of the U.S. and Canadian employees and are based on years of service, a percentage of current earnings and matching of employee contributions. For the years ended December 31, 2002, 2001 and 2000, pension expense for defined-contribution plans was $9.1 million, $6.0 million and $4.2 million, and all funding is current. Certain retired or terminated employees of predecessor or acquired companies also participate in defined benefit plans in the United States which have been retained by National Oilwell subsidiaries but which no longer accrue benefits. Active employees are ineligible to participate in any of these defined benefit plans. Our subsidiaries in the United Kingdom have a defined benefit pension plan whose participants are primarily retired and terminated employees who are no longer accruing benefits. In addition, approximately 160 U.S. retirees and spouses participate in defined benefit health care plans of predecessor or acquired companies that provide postretirement medical and life insurance benefits. Pension assets are principally invested in a fixed income bond fund, equity securities, United Kingdom government securities and cash deposits. 36

The change in benefit obligation, plan assets and the funded status of the defined pension plans in the United States and the United Kingdom, and defined postretirement plans in the United States, follows:
Pensionbenefits
Postretirementbenefits ---------------------- ----------------------- At yearend 2002 20012002 2001 -------------- -------- -------- ----------------- (inthousands)Benefit
obligation atbeginning ofyear $ 49,605$ 46,511 $
7,416 $ 3,107Service cost274 173 40 21Interest cost3,336 3,457
552 506Actuarial(gain) loss10,973 1,2721,094 4,079Benefits paid
(2,996)(2,186) (645)(503) Retireecontributions161 99 32 --Other 3,357279 -- 206 -------- -------- -------- -
-------BENEFIT
OBLIGATION ATEND OF YEAR $
64,710 $49,605 $
8,489 $ 7,416-------- -------- ---------------- Fairvalue of planassets at
beginning ofyear $ 51,211$ 60,062 $ --$ -- Actual
return(9,335)
(7,715) -- --Benefits paid
(2,996)(2,186) (645)
(503)Contributions1,621 450 645503 Other
4,174 600 ---- -------- -------- -------- --------FAIR VALUE OFPLAN ASSETSAT END OF
YEAR $ 44,675
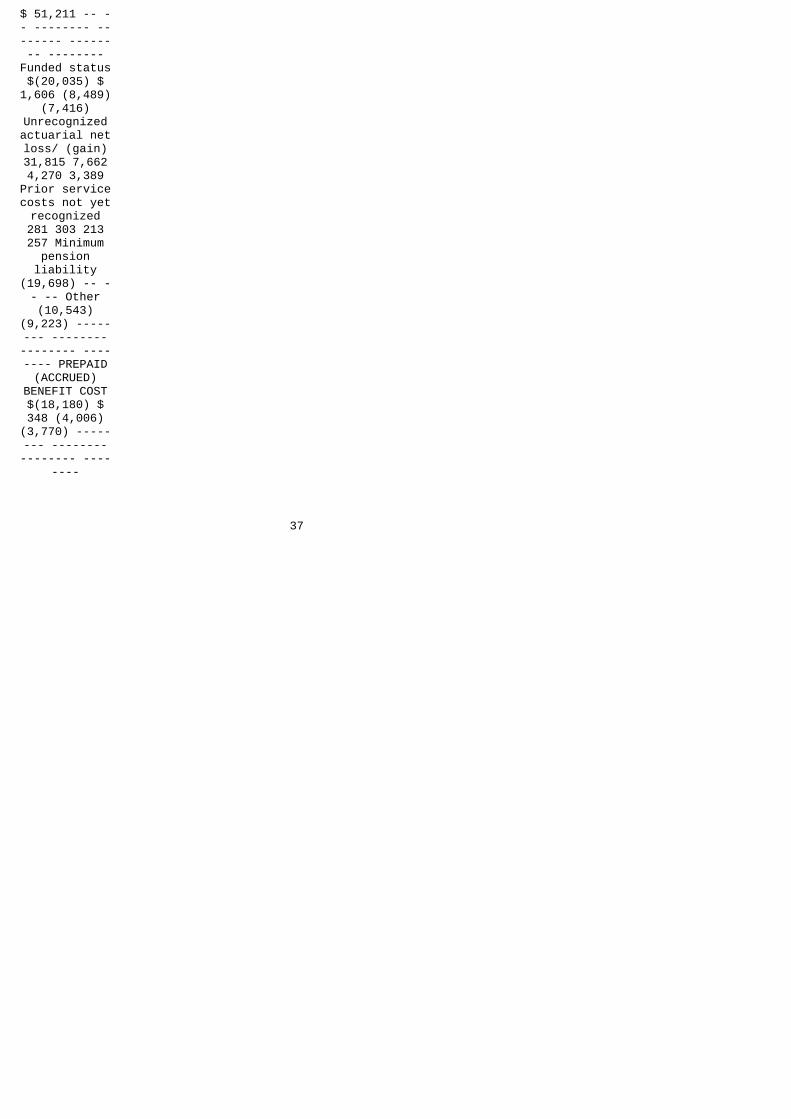
$ 51,211 -- -- -------- -------- -------- --------Funded status$(20,035) $1,606 (8,489)
(7,416)Unrecognizedactuarial netloss/ (gain)31,815 7,6624,270 3,389Prior servicecosts not yetrecognized281 303 213257 Minimum
pensionliability
(19,698) -- -- -- Other(10,543)
(9,223) -------- ---------------- -------- PREPAID(ACCRUED)
BENEFIT COST$(18,180) $348 (4,006)(3,770) -------- ---------------- ----
---- 37
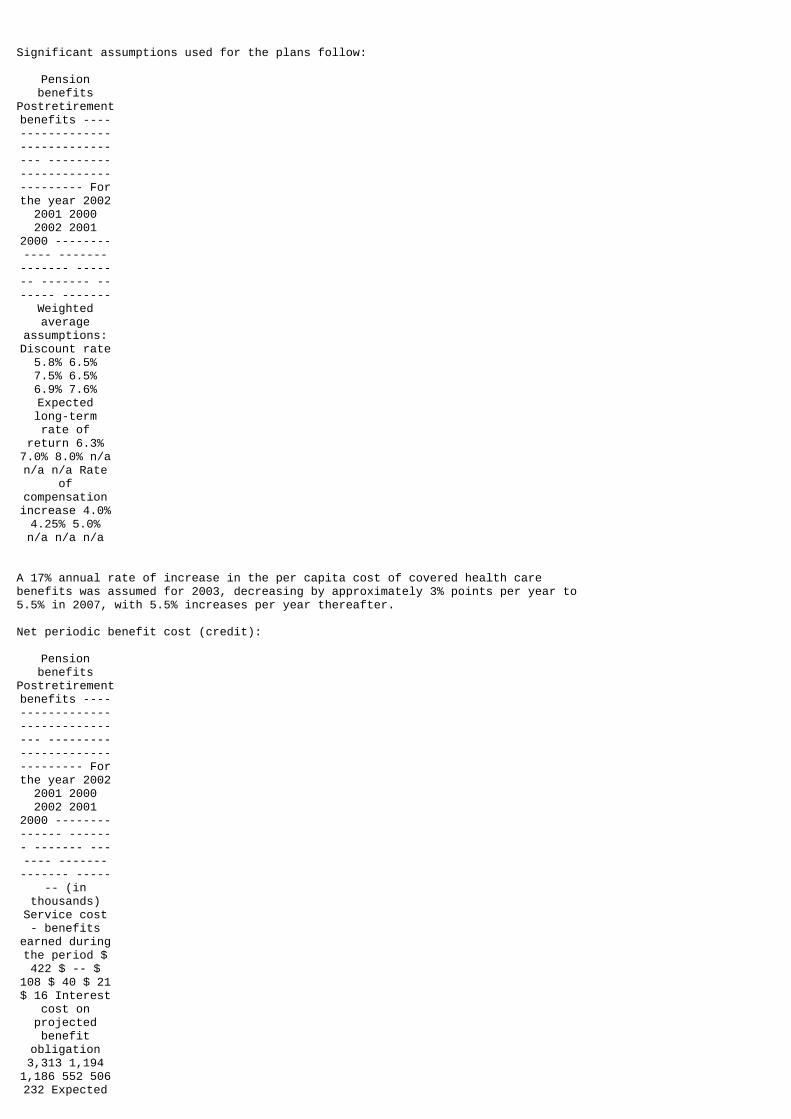
Significant assumptions used for the plans follow:
Pensionbenefits
Postretirementbenefits --------------------------------- ------------------------------- Forthe year 20022001 20002002 2001
2000 ------------ -------------- ------- ------- ------- -------
Weightedaverage
assumptions:Discount rate5.8% 6.5%7.5% 6.5%6.9% 7.6%Expectedlong-termrate of
return 6.3%7.0% 8.0% n/an/a n/a Rate
ofcompensationincrease 4.0%4.25% 5.0%n/a n/a n/a
A 17% annual rate of increase in the per capita cost of covered health care benefits was assumed for 2003, decreasing by approximately 3% points per year to 5.5% in 2007, with 5.5% increases per year thereafter. Net periodic benefit cost (credit):
Pensionbenefits
Postretirementbenefits --------------------------------- ------------------------------- Forthe year 20022001 20002002 2001
2000 -------------- ------- ------- ------- -------------- -----
-- (inthousands)
Service cost- benefits
earned duringthe period $422 $ -- $
108 $ 40 $ 21$ 16 Interest
cost onprojectedbenefit
obligation3,313 1,1941,186 552 506232 Expected

return onplan assets
(3,886)(1,183)
(1,280) -- ---- Net
amortizationand deferral74 46 (8) 257178 (13) ------- ------- ------- ------- ------- ---
---- NETPERIODIC
BENEFIT COST(CREDIT) $
(77) $ 57 $ 6$ 849 $ 705 $235 =======
===================================
Assumed health care cost trend rates have a significant effect on the amounts reported for the postretirement benefits. A one percentage point change in assumed health care cost trend rates would have the following effects:
1% PointIncrease 1%
PointDecrease ------------------------------
---- (inthousands)Effect ontotal of
service andinterest costcomponents in2002 $ 47 $(40) Effect
onpostretirement
benefitobligation atyear-end 2002$ 770 $ (655) In addition, our subsidiaries in Norway have defined benefit pension plans. The pension plan assets are invested primarily in equity securities, overseas bonds, real estate and cash deposits. At December 31, 2002, the plan assets at fair market value and the projected benefit obligation were approximately $12.0 million. 38

7. ACCUMULATED OTHER COMPREHENSIVE INCOME / (LOSS) The components of other comprehensive loss are as follows (in thousands): CumulativeCumulativeChange inCurrencyMarketableMinimum
TranslationInterestSecuritiesPension
LiabilityAdjustment
RateContractValuationAdj. TOTAL----------------- ------------------------ -------------- --------
Balance atDecember31, 1999 $
-- $(12,639) $-- $ 716$(11,923)Currentperiodactivity(10,684)1,136(9,548)
Tax effect(387)
(387) --------- --------- --------- -------- -----
---Balance atDecember31, 2000 -- (23,323)-- 1,465(21,858)Currentperiodactivity(11,569)(2,191)(13,760)Tax effect745 745 --------- --------- --------- -------- ---
-----Balance atDecember31, 2001 -- (34,892)
-- 19(34,873) --------- --------- --------- -------- --------

Currentperiodactivity(19,698)2,4741,363
(15,861)Tax effect
6,750(477)
6,273 --------- --------- --------- -------- -----
---Balance atDecember31, 2002 $(12,948) $(32,418) $886 $ 19$(44,461)===========================================
8. COMMITMENTS AND CONTINGENCIES We lease land, buildings, storage facilities, vehicles, data processing equipment and software under operating leases expiring in various years through 2012. Rent expense for the years ended December 31, 2002, 2001 and 2000 was $21.2 million, $19.0 million and $12.6 million. Our minimum rental commitments for operating leases at December 31, 2002 were as follows: 2003 - $17.7 million; 2004 - $13.8 million; 2005 - $9.9 million; 2006 - $6.8 million; 2007 - $5.8 million and subsequent to 2007 - $9.7 million. We are involved in various claims, regulatory agency audits and pending or threatened legal actions involving a variety of matters. The total liability on these matters at December 31, 2002 cannot be determined; however, in our opinion, any ultimate liability, to the extent not otherwise provided for, should not materially affect our financial position, liquidity or results of operations. Our business is affected both directly and indirectly by governmental laws and regulations relating to the oilfield service industry in general, as well as by environmental and safety regulations that specifically apply to our business. Although we have not incurred material costs in connection with our compliance with such laws, there can be no assurance that other developments, such as stricter environmental laws, regulations and enforcement policies thereunder could not result in additional, presently unquantifiable costs or liabilities to us. 39

9. COMMON STOCK National Oilwell has authorized 150 million shares of $.01 par value common stock. We also have authorized 10 million shares of $.01 par value preferred stock, none of which is issued or outstanding. Under the terms of National Oilwell's Stock Award and Long-Term Incentive Plan, as amended, 8.4 million shares of common stock are authorized for the grant of options to officers, key employees, non-employee directors and other persons. Options granted under our stock option plan generally vest over a three-year period starting one year from the date of grant and expire five or ten years from the date of grant. The purchase price of options granted may not be less than the market price of National Oilwell common stock on the date of grant. At December 31, 2002, approximately 4.2 million shares were available for future grants. We also have inactive stock option plans that were acquired in connection with the acquisitions of Dreco Energy Services, Ltd. in 1997, and of Hitec ASA and IRI International Corporation in 2000. We converted the outstanding stock options under these plans to options to acquire our common stock and no further options are being issued under these plans. Stock option information summarized below includes amounts for the National Oilwell Stock Award and Long-Term Incentive Plan and stock plans of acquired companies. Options outstanding at December 31, 2002 under the stock option plans have exercise prices between $5.62 and $40.50 per share, and expire at various dates from February 19, 2003 to August 15, 2012. The following summarizes options activity: YEARS ENDEDDECEMBER
31, ------------------------------------------------------------------------------------------------ 2002 20012000 ----------------------------- ----------------------------- -----------------------
------AVERAGEAVERAGEAVERAGE
NUMBER OFEXERCISENUMBER OFEXERCISENUMBER OFEXERCISESHARESPRICESHARESPRICESHARES
PRICE ---------- ---------- ---------- ---------- ---------- -----
-----Sharesunder
option at3,094,160 $
22.952,792,585 $

16.502,041,204 $
14.59beginningof yearGranted977,50018.53911,62640.50758,96123.56Optionsfrom
acquisitions-- -- -- --1,006,342
10.52Cancelled(133,465)
28.54(218,086)
25.47(86,425)14.10
Exercised(147,699)
13.52(391,965)
16.39(927,497)11.80 ---------- ---------- ---------- ---------- ---------- -----
-----Sharesunder
option at3,790,496 $
21.993,094,160 $
22.952,792,585 $16.50 endof year
Exercisableat end of
year2,119,692 $
18.711,474,833 $
15.681,097,327 $
13.73============================================================ 40

The following summarizes information about stock options outstanding as of December 31, 2002: OPTIONS
OUTSTANDINGOPTIONS
EXERCISABLE---------------------------------------------------------WEIGHTED-AVG. RANGE
OFREMAININGWEIGHTED-
AVG.WEIGHTED-
AVG.EXERCISEPRICE
CONTRACTUALLIFESHARESEXERCISEPRICESHARESEXERCISEPRICE ------------------------------ --------- -------------- --------- -------------- $5.62 to$10.522.98
1,131,451$ 10.21
1,131,451$ 10.21
$11.45 to$21.708.57
1,049,42518.21111,92515.56
$22.56 to$40.506.55
1,609,62032.73876,316
30.10 -------------------- --------- --
-----Totals6.04
3,790,496$ 21.99
2,119,692$ 18.71====
================
================
The weighted average fair value of options granted during 2002, 2001 and 2000

was approximately $8.95, $22.04, and $15.70 per share, respectively, as determined using the Black-Scholes option-pricing model. Assuming that we had accounted for our stock-based compensation using the alternative fair value method of accounting under FAS No. 123 and amortized the fair value to expense over the option's vesting period, our net income and net income per share would have been (in thousands, except per share data): YEARENDED
DECEMBER31, -------------------------------------------------20022001
2000 ----------- ----------------------Net
income:As
reported$
73,069$
104,063$
13,136Pro
forma $63,926
$94,227$ 5,584Basicnet
incomeper
share:As
reported$ 0.90$ 1.29$ 0.17Proforma0.791.170.07
Dilutednet
incomeper
share:As
reported$ 0.89$ 1.27$ 0.16Proforma0.781.150.07
These pro forma results may not be indicative of future effects. The assumptions used in the Black-Scholes option-pricing model were: ASSUMPTIONS2002 20012000 -----

------ ------------------------- -------------
Risk-freeinterestrate 2.4%6.3% 4.7%Expecteddividend -- -- --Expectedoptionlife
(years) 55 4
Expectedvolatility54% 55%94%
The Company evaluates annually the grant of options to eligible participants and in February 2003, 977,500 options to purchase shares of common stock were granted at an exercise price of $20.14, the fair value of the common stock at the date of grant. 41

10. INCOME TAXES The domestic and foreign components of income before income taxes were as follows (in thousands): DECEMBER
31,DECEMBER
31,DECEMBER31, 20022001
2000 ------------ ------------ ---------
---Domestic$ 45,716$101,700$(10,555)Foreign66,74966,31737,592 ------------------------$112,465$168,017$ 27,037======================== The components of the provision (benefit) for income taxes consisted of (in thousands): DECEMBER
31,DECEMBER
31,DECEMBER31, 20022001
2000 ------------ ------------ ---------
---Current:Federal$ 11,315$ 32,222$ 5,401State909 581123
Foreign15,72623,30414,258 ------------------------27,95056,10719,782 ------------------------Deferred:Federal4,8884,925

(6,757)State1,144391(507)Foreign5,4142,531
1,383 -------- ----------------11,4467,847(5,881)------------------------$ 39,396$ 63,954$ 13,901======================== 42

The difference between the effective tax rate reflected in the provision for income taxes and the U.S. federal statutory rate was as follows (in thousands): DECEMBER 31,DECEMBER 31,DECEMBER 31,2002 2001
2000 ------------ ------------ -----
-------Federal
income taxat statutory
rate $39,363 $58,806 $9,462Foreign
income taxrate
differential(2,990)1,405 781
State incometax, net of
federalbenefit 556299 336 Taxbenefit offoreign
sales income(1,580)(1,575)(1,492)
Nondeductibleexpenses
1,053 2,4234,626Foreign
dividendsnet of FTCs
1,176(1,967)
(1,046) Netoperating
losscarryforwards
-- 2,9481,744 Changein deferred
taxvaluationallowance400 1,223(606) Prioryear taxes1,126 -- --Other 292
392 96 -------- ---------------- $39,396 $63,954 $13,901========================
Significant components of National Oilwell's deferred tax assets and liabilities were as follows (in thousands): DECEMBER 31,DECEMBER 31,2002 2001 ------------ -

-----------Deferred tax
assets:Allowances
andoperatingliabilities$ 29,047 $9,408 Netoperating
losscarryforwards
23,89116,107
Foreign taxcredit
carryforwards15,08213,580
Capital losscarryforward3,527 3,527Other 22,01220,378 -------- --------
Totaldeferred tax
assets93,55963,000
Valuationallowance
for deferredtax assets(29,912)
(29,512) -------- -------- 63,647
33,488 -------- --------Deferred taxliabilities:
Tax overbook
depreciation14,16810,366
Operatingand otherassets
31,688 --Other 8,75610,014 -------- --------
Totaldeferred taxliabilities
54,61220,380 -------- --------Net deferredtax assets $
9,035 $13,108================
In the United States, the Company has $12.0 million of net operating loss carryforwards as of December 31, 2002, which expire at various dates through 2017. These operating losses were acquired primarily in the combination with Dreco Energy Services, Ltd. and are associated with Dreco's US subsidiary. As a result of share exchanges occurring since the date of the combination resulting in a more than 50% aggregate change in the beneficial ownership of Dreco, the availability of these loss carryforwards to reduce future United States federal taxable income may have become subject to various limitations under Section 382 of the Internal Revenue Code of 1986, as amended. In addition, these net operating losses can only be used to offset separate company taxable income of Dreco's US subsidiary. Since the ultimate realization of these net operating losses is uncertain, the related potential benefit of $4.2 million has been recorded with a $2.8 million valuation allowance. Future income tax expense will

be reduced if the Company ultimately realizes the benefit of these net operating losses. 43

Also in the United States, the Company has $9.1 million of capital loss carryforwards as of December 31, 2002, which expire at various dates through 2005. The related potential benefit of $3.5 million has been recorded with a valuation allowance of $3.5 million. These capital losses are not available to reduce future operating income but are expected to be realized as deductions against future capital gains. The Company has $ 15.1 million of excess foreign tax credits as of December 31, 2002, which expire at various dates through 2006. These credits have been allotted a valuation allowance of $ 14.1 million and would be realized as a reduction of future income tax expense. Outside the United States, the company has $67.5 million of net operating loss carryforwards as of December 31, 2002. Of this amount, $65.3 million will expire at various dates through 2012 and $2.2 million is available indefinitely. The related potential benefit available of $19.7 million has been recorded with a valuation allowance of $9.6 million. If the Company ultimately realizes the benefit of these net operating losses, $9.4 million would reduce goodwill and other intangible assets and $10.3 million would reduce income tax expense. The deferred tax valuation allowance increased $0.4 million for the period ending December 31, 2002 and $1.2 million for the period ending December 31, 2001. These increases resulted primarily from the recognition of additional excess foreign tax credits that may not be realized in the future. National-Oilwell's deferred tax assets are expected to be realized principally through future earnings. Undistributed earnings of the Company's foreign subsidiaries amounted to $193.4 million and $149.2 million at December 31, 2002 and December 31, 2001, respectively. Those earnings are considered to be permanently reinvested and no provision for U.S. federal and state income taxes has been made. Distribution of these earnings in the form of dividends or otherwise could result in either U.S. federal taxes (subject to an adjustment for foreign tax credits) and withholding taxes payable in various foreign countries. Determination of the amount of unrecognized deferred U.S. income tax liability is not practical; however, unrecognized foreign tax credit carryforwards would be available to reduce some portion of the U.S. liability. Withholding taxes of approximately $23.4 million would be payable upon remittance of all previously unremitted earnings at December 31, 2002. 11. SPECIAL CHARGE During 2000, we recorded a special charge, net of a $0.4 million credit from previous special charges, of $14.1 million ($11.0 million after tax, or $0.14 per share) related to the merger with IRI International. Components of the charge were (in millions): Direct transaction costs $ 6.6 Severance 6.4 Facility closures 1.5 ----- 14.5 Prior year reversal (0.4) ----- $14.1 ----- The cash and non-cash elements of the charge approximated $13 million and $1.1 million, respectively. All direct cash outlays have been spent. Facility closure costs consisted of lease cancellation costs and impairment of a closed manufacturing facility that is classified with "Property held for sale" on our balance sheet. All of this charge is applicable to the Products and Technology business segment. 44

12. BUSINESS SEGMENTS AND GEOGRAPHIC AREAS National Oilwell's operations consist of two segments: Products and Technology and Distribution Services. The Products and Technology segment designs and manufactures a variety of oilfield equipment for use in oil and gas drilling, completion and production activities. The Distribution Services segment distributes an extensive line of oilfield supplies and equipment. Intersegment sales and transfers are accounted for at commercial prices and are eliminated in consolidation. The accounting policies of the reportable segments are the same as those described in the summary of significant accounting policies of the Company. The Company evaluates performance of each reportable segment based upon its operating income, excluding non-recurring items. No single customer accounted for 10% or more of consolidated revenues during the three years ended December 31, 2002. 45

Summarized financial information is as follows (in thousands): Business Segments PRODUCTS
ANDDISTRIBUTIONCORPORATE/TECHNOLOGYSERVICES
ELIMINATIONSTOTAL ------------ ------------ ----------------------DECEMBER31, 2002Revenuesfrom:
Unaffiliatedcustomers $837,750 $684,196 $ -
-$1,521,946Intersegment
sales79,5001,978
(81,478) ------------------------------------------
Totalrevenues917,250686,174(81,478)1,521,946Operatingincome(loss)127,01118,083(10,771)134,323Capital
expenditures19,849
3,612 1,34424,805
Depreciationand
amortization19,340
4,883 82525,048Goodwill560,23516,4574,884581,576
Identifiableassets
1,640,171266,66361,828
1,968,662DECEMBER31, 2001Revenuesfrom:
Unaffiliatedcustomers$1,041,614$ 705,817 $

24$1,747,455Intersegment
sales79,3052,001
(81,306) ------------------------------------------
Totalrevenues1,120,919707,818(81,282)1,747,455Operatingincome(loss)171,01328,473(10,209)189,277Capital
expenditures22,170
4,066 1,12227,358
Depreciationand
amortization31,882
6,428 56338,873Goodwill332,12115,0894,884352,094
Identifiableassets
1,178,118260,21233,366
1,471,696DECEMBER31, 2000Revenuesfrom:
Unaffiliatedcustomers $629,967 $519,911 $
42$1,149,920Intersegment
sales53,5001,362
(54,862) ------------------------------------------
Totalrevenues683,467521,273(54,820)1,149,920Operatingincome(loss)
60,992(2)12,884
(25,420)(1)48,456(1)(2) Capitalexpenditures
14,960

7,387 2,21424,561
Depreciationand
amortization28,712
5,985 33735,034Goodwill313,46810,8435,029329,340
Identifiableassets
1,001,391223,97353,530
1,278,894 (1) Includes a special charge of $14,082 for 2000 related to the merger with IRI. (2) Includes $15,684 of inventory write-offs related to the merger with IRI. 46

Geographic Areas:
UNITEDUNITEDSTATESCANADANORWAYKINGDOMOTHER
ELIMINATIONSTOTAL ---------- ---------- ---------- ---------- ---------- ------------ ---
-------DECEMBER31, 2002Revenuesfrom:
Unaffiliatedcustomers$1,054,956$ 254,361 $86,169 $44,733 $
81,727 $ --$1,521,946Interarea
sales108,19159,37018,561
7,393 1,199(194,714) -- ---------- ---------- ---------- ---------- ---------- ---------- ---------
- Totalrevenues1,163,147313,731104,73052,12682,926
(194,714)1,521,946Long-livedassets618,501423,029787,50548,525
91,102 --1,968,662DECEMBER31, 2001Revenuesfrom:
Unaffiliatedcustomers$1,280,598$ 337,447 $38,171 $42,978 $
48,261 $ --$1,747,455Interarea
sales129,52545,89011,591

7,421 445(194,872) -- ---------- ---------- ---------- ---------- ---------- ---------- ---------
- Totalrevenues1,410,123383,33749,76250,39948,706
(194,872)1,747,455Long-livedassets768,160379,976223,74749,750
50,063 --1,471,696DECEMBER31, 2000Revenuesfrom:
Unaffiliatedcustomers $799,415 $239,940 $31,961 $48,050 $
30,554 $ --$1,149,920Interarea
sales43,52128,302
3,786 4,796737
(81,142) ------------------------------------------------------------------------
Totalrevenues842,936268,24235,74752,84631,291(81,142)1,149,920Long-livedassets646,210338,319216,86644,633
32,866 --1,278,894
13. QUARTERLY FINANCIAL DATA (UNAUDITED) Summarized quarterly results were as follows (in thousands, except per share data):
1STQUARTER2ND
QUARTER3RD

QUARTER4TH
QUARTERTOTAL ----------- ---------------------- ----------- ---------- YEAR
ENDEDDECEMBER31, 2002Revenues $388,986 $372,390 $366,929 $393,641
$1,521,946GrossProfit93,04587,40488,53392,882
361,864(1)Incomebeforetaxes33,10226,50127,74325,119112,465
Net income21,18516,96117,75617,167
73,069 Netincome per
basicshare 0.260.21 0.220.21 0.90Net income
perdiluted
share 0.260.21 0.220.21 0.89YEAR ENDEDDECEMBER31, 2001Revenues $360,272 $434,628 $486,812 $465,743
$1,747,455GrossProfit91,173103,494119,905113,262
427,834(1)Incomebeforetaxes34,64040,80547,36945,203168,017
Net income21,47825,29928,93828,348104,063

Net incomeper basicshare 0.270.31 0.360.35 1.29Net income
perdiluted
share 0.260.31 0.360.35 1.27 47
REPORT OF INDEPENDENT AUDITORS The Board of Directors and Shareholders National-Oilwell, Inc. We have audited the consolidated financial statements of National-Oilwell, Inc. as of December 31, 2002 and 2001, and for each of the three years in the period ended December 31, 2002, and have issued our report thereon dated February 18, 2003 (included elsewhere in this Form 10-K/A). Our audits also included the financial statement schedule listed in the index as item 15a of this Form 10-K/A. This schedule is the responsibility of the Company's management. Our responsibility is to express an opinion based on our audits. In our opinion, the financial statement schedule referred to above, when considered in relation to the basic financial statements taken as a whole, presents fairly in all material respects the information set forth therein. /s/ ERNST & YOUNG LLP Houston, Texas February 18, 2003 48

SCHEDULE II NATIONAL-OILWELL, INC. VALUATION AND QUALIFYING ACCOUNTS YEARS ENDED DECEMBER 31, 2002, 2001 AND 2000 ADDITIONS
(DEDUCTIONS)BALANCE
CHARGED TOCHARGEBALANCE
BEGINNINGCOSTS ANDOFFS ANDEND OF OF
YEAREXPENSESOTHER YEAR--------- -------------------- ------- (INTHOUSANDS)Allowance
fordoubtfulaccounts:2002 $9,094 $3,606 $(124)$12,576
2001 5,8853,897 (688)9,094 20008,986 1,589
(4,690)5,885
Allowancefor excess
andobsoleteinventoryreserves:
2002$49,084 $1,672 $(1,364)$49,392
2001 53,283807 (5,006)49,084 2000
39,35516,814(2,886)53,283
Valuationallowance
fordeferred
tax assets:2002
$29,512 $400 $ --$29,912
2001 28,2891,223 --
29,512 200019,228
(606) 9,66728,289
49

EXHIBIT INDEX EXHIBITNUMBER
DESCRIPTION- ------------------ 23.1
Consent ofErnst &
Young LLP

EXHIBIT 23.1 CONSENT OF INDEPENDENT AUDITORS We consent to the incorporation by reference in the following Registration Statements of National-Oilwell, Inc. and in the related Prospectuses of our reports dated February 18, 2003, with respect to the consolidated financial statements and schedule of National-Oilwell, Inc. included in this Annual Report (Form 10-K) for the year ended December 31, 2002. Form Description S-8 Stock Award and Long Term Incentive Plan, Value Appreciation and Incentive Plan A and Value Appreciation and Incentive Plan B (No. 333-15859) S-8 National-Oilwell Retirement and Thrift Plan (No. 333-36359) S-8 Post Effective Amendment No. 3 to the Registration Statement on Form S-4 filed on Form S-8 pertaining to the Dreco Energy Services Ltd. Amended and Restated 1989 Employee Incentive Stock Option Plan, as amended, and Employment and Compensation Arrangements Pursuant to Private Stock Option Agreements (No. 333-21191) S-8 Post Effective Amendment No. 1 on Form S-8 to Registration Statement on Form S-4 pertaining to the IRI International Corporation Equity Incentive Plan (No. 333-36644) S-3 Registration Statement on Form S-3 pertaining to the issuance of 3,200,000 shares to Halliburton Energy Services, Inc. (No. 333-102665) /s/ ERNST & YOUNG LLP Houston, Texas April 10, 2003