Embed Size (px)
Citation preview
The International Journal of Business and Finance Research ♦ Volume 5 ♦ Number 1 ♦ 2011
STOCK REPURCHASE ANNOUNCEMENTS AND STOCK PRICES EVIDENCE FROM TAIWAN
Li-Hua, Lin, Transworld Institute of Technology, Taiwan Szu-Hsien Lin, National Chung Cheng University, Taiwan
Ya-Chiu Angela Liu, National Chung Cheng University, Taiwan
ABSTRACT This paper uses an event study methodology to examine the stock price behavior surrounding announcements of stock repurchases made by Taiwan firms from 2000 to 2008. Our analysis shows that stock prices go up in response to stock repurchase announcements. We also find the announcement effects between various industries to be significantly different; the announcement effect is greatest in the financial industry and least in the electronics industry. Finally, firms which fully executed stock repurchases were confirmed to have experienced a relatively large stock price decline in the pre-announcement period compared with those which executed less than 10% stock repurchases; however, there is no significant difference in their announcement effects. JEL: G14 KEYWORDS: Stock repurchases, event study, abnormal return, cumulative abnormal return INTRODUCTION
n June 30, 2000, the Taiwan Legislative Yuan promulgated amendments in the provisions of the Securities Exchange Act. Following the formal implementation of these amendments on August 9 of the same year, the treasury stock system officially allowed firms to repurchase their shares in
the open market. Nevertheless, companies were limited to the following objectives: (1) transferring shares to employees; (2) repurchasing shares for the exercise of stock options and convertible bonds; and (3) protecting corporate credit and the interest of stockholders (Taiwan Securities Act 28-2). The data from the Market Observation Post System of the Taiwan Stock Exchange show that the number of listed companies that issued at least a repurchase announcement from August 9, 2000 to October 31, 2008 is 459, about 60.47% of the total number of listed firms. The Taiwan stock market has been shaken several times. After 2000, Taiwan went through two political administrations and several global economic downturns, most notably the subprime crisis emanating from the US and developing into the global financial tsunami of 2008. Every time stock prices plummet, many companies announce programs to buy back their own shares. In view of all these, our study aims to examine the effects of stock repurchase announcements by listed companies on their respective stock prices, and to find out whether there is an “announcement effect”. If so, this study further examines the issues of whether the announcement effect varies across industries and of whether the extent to which the repurchase is executed really matters. While previous studies employ shorter periods (i.e., from half a year to 5 years), this paper uses a total of 8 years of data (August 2000 to October 2008) under the assumption that a longer period will help confirm the hypotheses tested. Based on the concept that standardized abnormal returns and cumulative returns may reduce the effects of disturbance events on stock returns, this study adopts the Market Model Hypothesis and the OLS method of event study to estimate the standardized abnormal return (SAR) and the standardized cumulative abnormal return (SCAR) of the sample. Both the standardized cross-sectional t-test and nonparametric sign test are used to test the hypotheses.
O
1
LH. Lin et al IJBFR ♦ Vol. 5 ♦ No. 1 ♦ 2011
The remainder of the paper is organized as follows. The next section discusses the literature review and hypotheses. The third section describes the data and methodology used in the analysis. The fourth section presents and analyzes empirical results, and the final section concludes the paper. LITERATURE REVIEW AND HYPOTHESES In many countries, an open market stock repurchase has become one of the popular ways for firms to distribute cash flows to their shareholders. For example, in 1994 firms in the USA announced more than $65 billion stock repurchases (Ikenberry et al., 1995, 182). Moreover, stock repurchases hit a record of $176 billion in 1996 (Otchere and Ross, 2002, 512). Firms buy back their own shares for various reasons, such as signaling, agency costs involving the problem of free cash flows, capital market allocation, tax-motivated substitution of repurchases for dividends, desired capital adjustments (Grullon and Ikenberry, 2000; Baker, et al., 2003), concentration of ownership, and profitability per share (Hsu, 2000, 508). Repurchasing shares of the firm’s stock may signal that current stock prices are below the stock’s intrinsic value. It may also signal to investors that managers are confident about the company’s earnings prospect. In the literature, signaling is the most widely studied theory behind share repurchases. Comment and Jarrell (1991) compare three forms of common stock buybacks in the U.S. markets, i.e., Dutch auction, fixed-price self-tender offers, and open-market share repurchases, and find that each of their announcements is associated on average with significant and positive excess stock returns. Meanwhile, the announcement stock returns are attributed to recent firm-specific returns but not to recent general market performance, providing broad support for the signaling theory. In other words, share buybacks increase stock prices because they are credible managerial signals that the offering firm’s stock is undervalued. Ikenberry et al. (1995) examine firm performance following open market share repurchase announcements during the period 1980–1990. They find that the average market reaction, measured from two days before through two days following the announcement, is 3.54%. As the percentage of shares announced for repurchase increases, the market reaction increases, and as firm size increases, announcement returns decline substantially. The average abnormal four-year buy and hold return measured after the initial announcement is 12.1%. For value stocks, companies are more likely to repurchase shares because of their being undervalued; the average abnormal return is 45.3%. Liu and Ziebart (1997) also report that stock price climbs in response to open-market repurchase announcement. The results above are echoed by research conducted by Lie (2005), Hatakeda and Isagawa (2004), and Zhang (2002), which confirm that stock repurchase announcements yield a positive effect on stock prices. Chen (2003) also discovers that stock repurchase announcement is useful in stabilizing a company’s share price. Moreover, staggering abnormal returns can also take place three trading days after the announcement is made. This study therefore presents the first hypothesis as follows: Hypothesis 1: Stock repurchase announcements cause a significantly positive response from the market. The announcement effects may vary across industries. Chen (2003) observes that the impact is stronger on the financial industry than on conventional industry, and the announcement effect on the electronics industry is the weakest and is of no significance. The cumulative abnormal return (CAR) for the electronics industry is not significant because of stock repurchase announcement during the estimation period. The effect on the financial industry is stronger than that on conventional industry, while the overall period influenced by repurchase announcement in the financial industry is shorter than that in conventional industry. During the event period (0, 4), the cumulative abnormal return of the financial industry is 6.42%, higher than the conventional industry’s 4.66%. However, while the event period extends to (0, 9), the cumulative abnormal return of the financial industry (6.53%) is lower than that of the conventional industry (7.03%). Chi et al. (2007) also find that companies from industries other than
2
The International Journal of Business and Finance Research ♦ Volume 5 ♦ Number 1 ♦ 2011
electronics have a considerably higher average CAR than companies of the electronics industry before and after the declaration of a stock repurchase. This study therefore establishes the second hypothesis as follows: Hypothesis 2: Stock price reactions differ across industries after the declaration of a stock repurchase. The announcement effect on the financial industry is expected to be the greatest, while the effect on the electronics industry is expected to be the least. The stock price reaction may also differ depending on the frequency of a stock repurchase program. Chan (2003) reports that when a stock repurchase program is first announced, stockholders obtain a significantly positive average abnormal return during the announcement window (day -2 to day +2). While the frequency of stock repurchase program increases, the information signaling effect of the announcement decreases gradually, but not significantly. When the stock repurchase program is executed up to five times, the abnormal return on the announcement window becomes statistically insignificant. Whether firms actually execute share buyback programs after the announcement may also influence stock prices. Hatakeda and Isagawa (2004) find that a firm in their study’s execution group will experience a larger stock price decline before its announcement and a larger price increase over the post-announcement period than a firm in the non-execution group. The difference in the stock price behavior for the post-announcement period between the two groups reveals that investors may gradually recognize the firm’s decision following the announcement, though they may not immediately recognize what decision a firm has made. Their findings support the undervaluation/investment hypothesis. A firm that experiences a large stock price decline before the announcement will be more likely to buy back its shares. If a firm views the market price as temporarily undervalued, the manager who is optimistic about the firm’s earning prospect will consider the low stock price as an excellent investment opportunity (a positive net present value). In addition, the more undervalued the stock price is, the more willing the firm is to buy back its shares. Lie (2005) compare firms that merely announced a repurchase program without repurchasing shares during the announcement quarter, and firms that repurchased shares more than 1% of the total asset value during the announcement quarter. The result shows that the actual repurchases, rather than the announcements of the repurchase programs, are more likely to indicate performance improvement. Based on the statements above, this study proposes the third hypothesis as follows: Hypothesis 3: Firms’ actual repurchase of shares following an announcement may affect open market stock prices; the larger the ratio of shares actually repurchased, the stronger the announcement repurchasing effect. DATA AND RESEARCH METHOD The data gathered in this study consist of listed companies that issued repurchase announcements from August 9, 2000, the effective date of the formal implementation by the Treasury Stock System, to October 31, 2008. As stated above, the effect of the repurchase announcement may differ according to the number of times the announcement is made. In this case, only those who issued a repurchase announcement for the first time were considered in this research; all the rest were eliminated from the sample. Thus, the data were initially composed of 459 firms. The Ordinary Least Squares (OLS) of the event study method was applied to the data collected from the Taiwan Daily News in order to select an estimation market model. After eliminating firms with insufficient data, the sample was trimmed down to 413 firms. Table 1 shows the yearly distribution of different industries and actual repurchase
3
LH. Lin et al IJBFR ♦ Vol. 5 ♦ No. 1 ♦ 2011
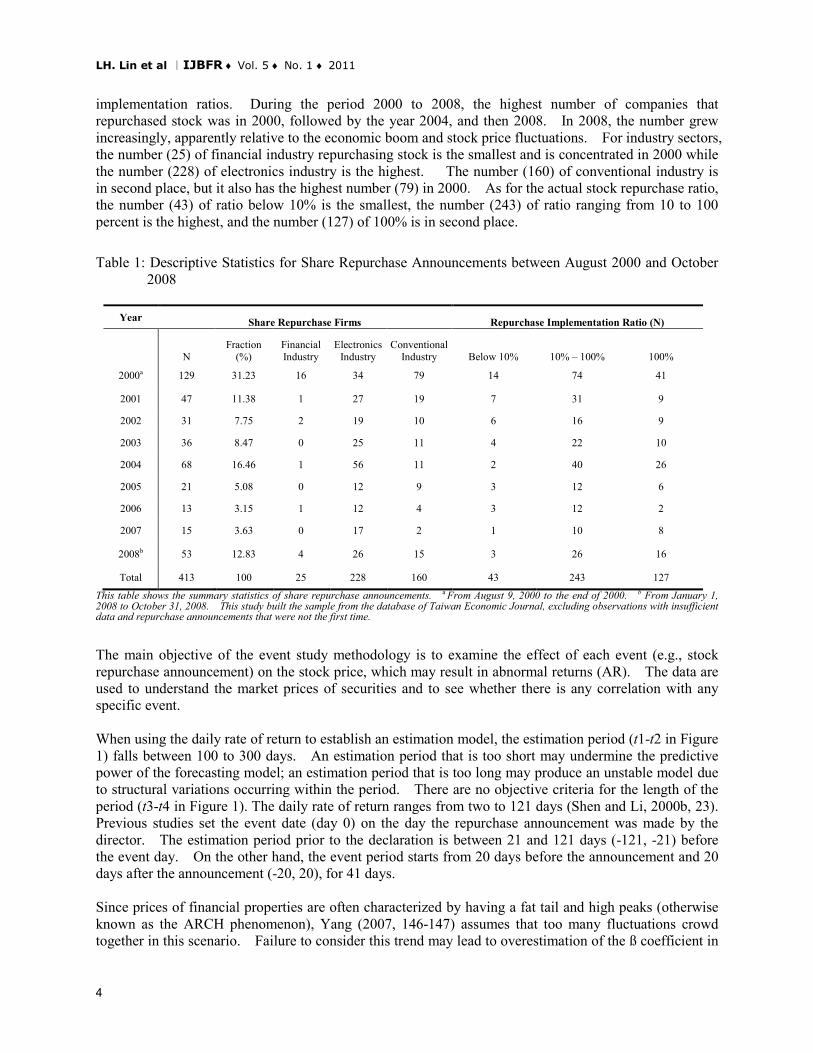
implementation ratios. During the period 2000 to 2008, the highest number of companies that repurchased stock was in 2000, followed by the year 2004, and then 2008. In 2008, the number grew increasingly, apparently relative to the economic boom and stock price fluctuations. For industry sectors, the number (25) of financial industry repurchasing stock is the smallest and is concentrated in 2000 while the number (228) of electronics industry is the highest. The number (160) of conventional industry is in second place, but it also has the highest number (79) in 2000. As for the actual stock repurchase ratio, the number (43) of ratio below 10% is the smallest, the number (243) of ratio ranging from 10 to 100 percent is the highest, and the number (127) of 100% is in second place. Table 1: Descriptive Statistics for Share Repurchase Announcements between August 2000 and October
2008
Year Share Repurchase Firms Repurchase Implementation Ratio (N)
N Fraction
(%) Financial Industry
Electronics Industry
Conventional Industry Below 10% 10% – 100% 100%
2000a 129 31.23 16 34 79 14 74 41
2001 47 11.38 1 27 19 7 31 9
2002 31 7.75 2 19 10 6 16 9
2003 36 8.47 0 25 11 4 22 10
2004 68 16.46 1 56 11 2 40 26
2005 21 5.08 0 12 9 3 12 6
2006 13 3.15 1 12 4 3 12 2
2007 15 3.63 0 17 2 1 10 8
2008b 53 12.83 4 26 15 3 26 16
Total 413 100 25 228 160 43 243 127
This table shows the summary statistics of share repurchase announcements. a From August 9, 2000 to the end of 2000. b From January 1, 2008 to October 31, 2008. This study built the sample from the database of Taiwan Economic Journal, excluding observations with insufficient data and repurchase announcements that were not the first time.
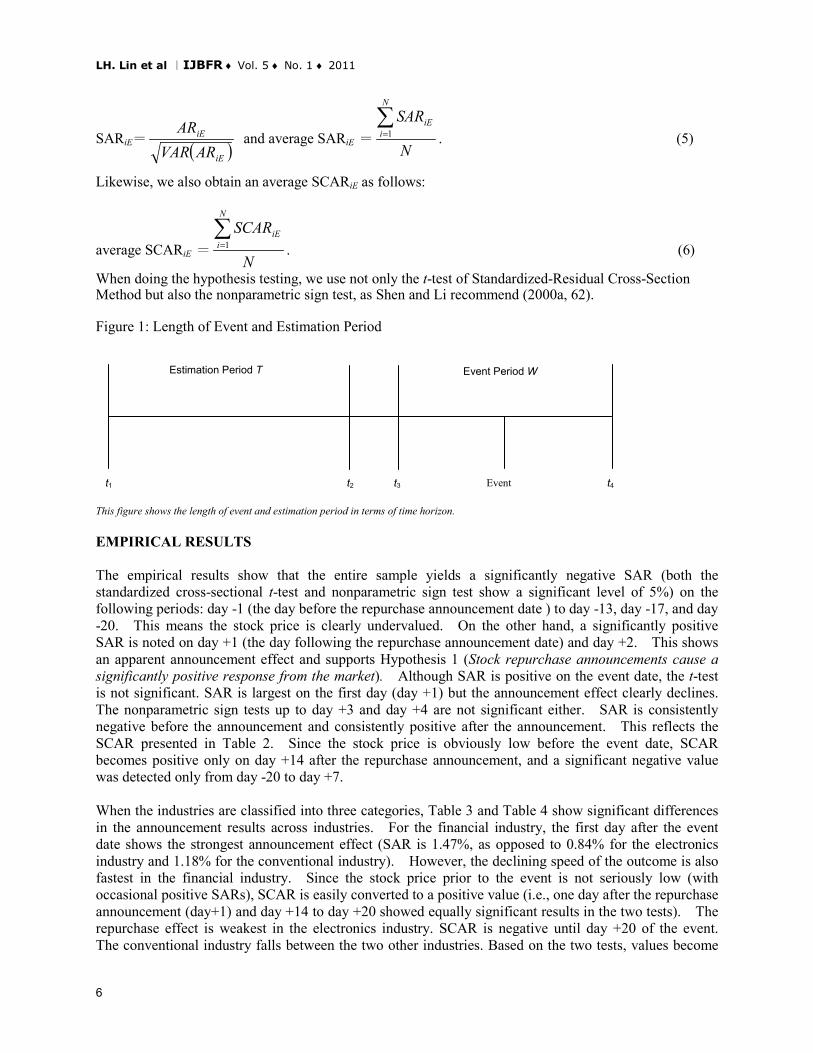
The main objective of the event study methodology is to examine the effect of each event (e.g., stock repurchase announcement) on the stock price, which may result in abnormal returns (AR). The data are used to understand the market prices of securities and to see whether there is any correlation with any specific event. When using the daily rate of return to establish an estimation model, the estimation period (t1-t2 in Figure 1) falls between 100 to 300 days. An estimation period that is too short may undermine the predictive power of the forecasting model; an estimation period that is too long may produce an unstable model due to structural variations occurring within the period. There are no objective criteria for the length of the period (t3-t4 in Figure 1). The daily rate of return ranges from two to 121 days (Shen and Li, 2000b, 23). Previous studies set the event date (day 0) on the day the repurchase announcement was made by the director. The estimation period prior to the declaration is between 21 and 121 days (-121, -21) before the event day. On the other hand, the event period starts from 20 days before the announcement and 20 days after the announcement (-20, 20), for 41 days. Since prices of financial properties are often characterized by having a fat tail and high peaks (otherwise known as the ARCH phenomenon), Yang (2007, 146-147) assumes that too many fluctuations crowd together in this scenario. Failure to consider this trend may lead to overestimation of the ß coefficient in
4
The International Journal of Business and Finance Research ♦ Volume 5 ♦ Number 1 ♦ 2011
the estimation period of the market model. Meanwhile, ß variance of the event period may vary over time, and the phenomenon that stock prices soars for 3 consecutive days after the event may be a kind of “clustering effect” in the ARCH. GARCH (1, 1) is usually used to correct this problem (Chen and Lee, 2000a, 119). However, the event periods in this research are widely distributed over 8 years. There is an enormous difference among the event dates of the companies. The observed values of the stock prices are not likely to be simultaneously affected by the same external factors, and the abnormal return of the stock prices of each company is more independent. Besides, the OLS method is used to calculate the residual of the samples. The result undergoes a D-W autocorrelation and ARCH tests, and reveals that most results are not at all significant. In other words, the autocorrelation issue in the data is not particularly serious and does not warrant an ARCH model. If the abnormal returns and cumulative returns of the firms are standardized and averaged out, it may reduce the effects of disturbance events on stock returns. The distribution of abnormal rate of return is then converted to standardized normal distribution and conforms to the conditions of identical distribution. Besides, this article uses the GARCH (1, 1) approach to estimate the sample. Out of 413 firms in the sample, 114 firms (27.6%) resulted in an extremely large AR (actual rate of return on the event date minus the projected rate of return) and CAR values. This produced serious damage on the average abnormal return. This study therefore adopts the Market Model Hypothesis and the OLS method of event study to estimate the standardized abnormal return (SAR) and the standardized cumulative abnormal return (SCAR) of the sample. The model is illustrated as follows:
,itmtiiit RR εβα ++= (1) where Rit is the return rate of sample stock on day t, Rmt is the return rate of market investment combination on day t, αi and βi are regressive coefficients, and itε is day t’s error term, i.e.,
),0(~ 2σε Nit . The expected daily return rate ( )itRE ˆ of the individual stock is calculated as follows:
( ) mtiiit RRE βα ˆˆˆ += (2)
The difference between ( )iERE ˆ and the real daily return rate iER is the abnormal return rate iEAR in the following:
( )ititit RERAR ˆ−= , t = -20,…, +20. (3) Adding up the daily abnormal return rates in the event period (t3, t4), we can obtain the accumulated abnormal return rate CARi of the individual firm as follows:
CARi=∑=
4
3
t
ttitAR (4)
because itAR =the return of research event + the return of disturbance event. To remove the impact of these disturbance events, Shen and Li (2000b, 8) recommend a procedure of standardizing and then averaging (average SARiE) all the firms’ abnormal returns in the event period. The procedure may reduce the effects of disturbance events on stock returns.
5
LH. Lin et al IJBFR ♦ Vol. 5 ♦ No. 1 ♦ 2011
SARiE= ( )iE
iE
ARVARAR
and average SARiE = N
SARN
iiE∑
=1 . (5)
Likewise, we also obtain an average SCARiE as follows:
average SCARiE = N
SCARN
iiE∑
=1 . (6)
When doing the hypothesis testing, we use not only the t-test of Standardized-Residual Cross-Section Method but also the nonparametric sign test, as Shen and Li recommend (2000a, 62). Figure 1: Length of Event and Estimation Period
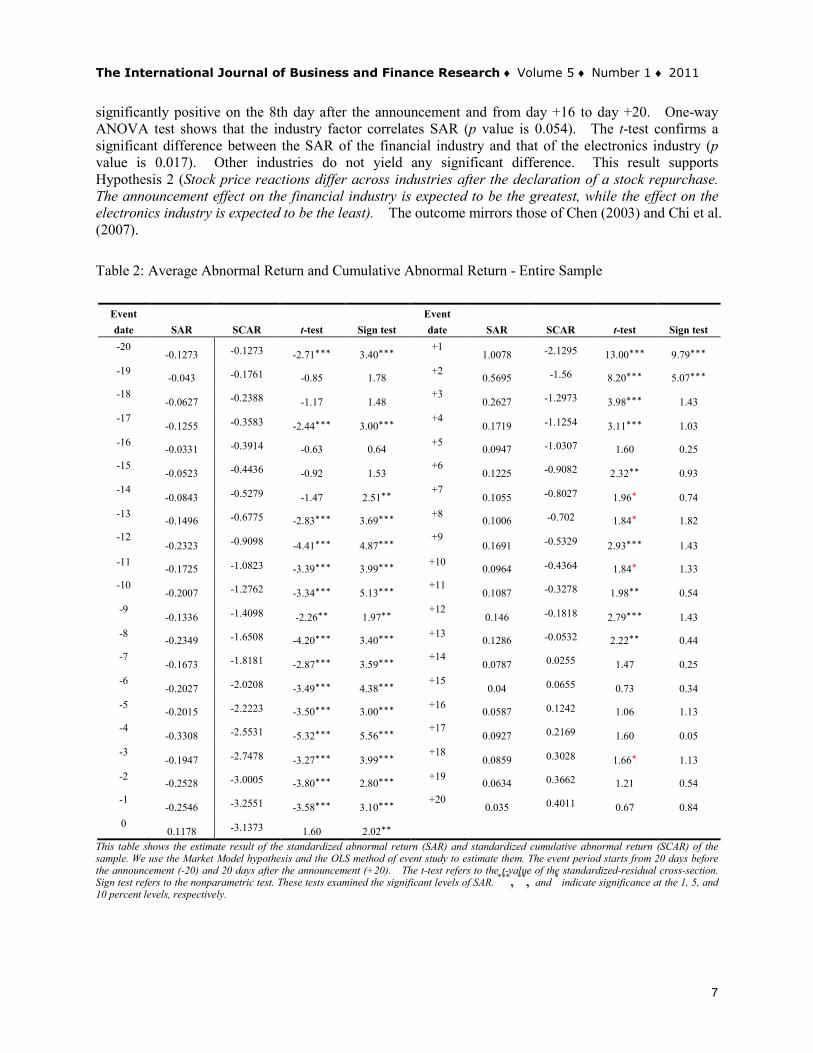
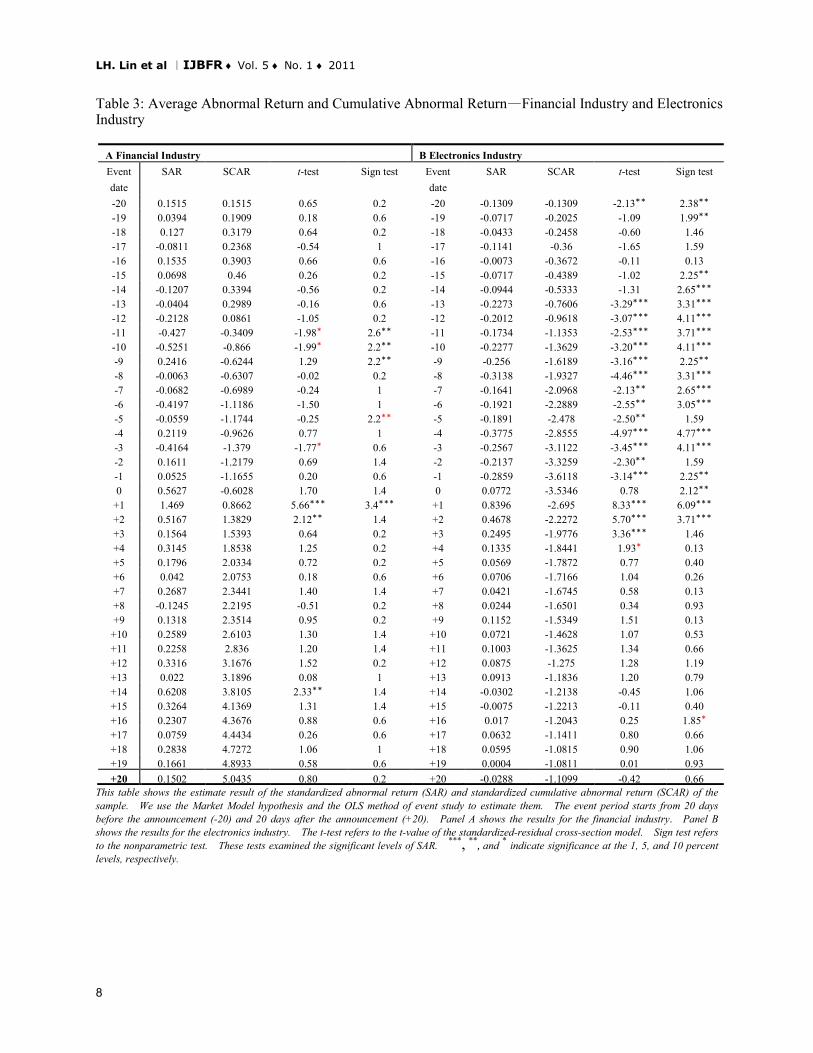
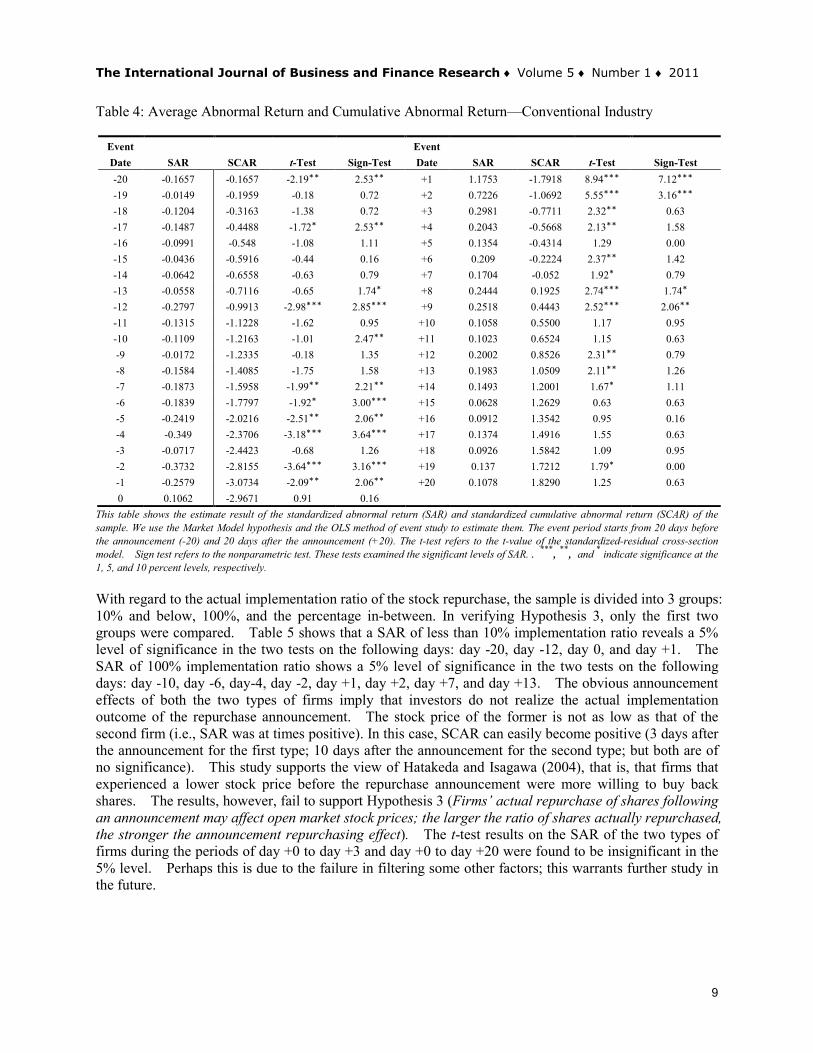
This figure shows the length of event and estimation period in terms of time horizon. EMPIRICAL RESULTS The empirical results show that the entire sample yields a significantly negative SAR (both the standardized cross-sectional t-test and nonparametric sign test show a significant level of 5%) on the following periods: day -1 (the day before the repurchase announcement date ) to day -13, day -17, and day -20. This means the stock price is clearly undervalued. On the other hand, a significantly positive SAR is noted on day +1 (the day following the repurchase announcement date) and day +2. This shows an apparent announcement effect and supports Hypothesis 1 (Stock repurchase announcements cause a significantly positive response from the market). Although SAR is positive on the event date, the t-test is not significant. SAR is largest on the first day (day +1) but the announcement effect clearly declines. The nonparametric sign tests up to day +3 and day +4 are not significant either. SAR is consistently negative before the announcement and consistently positive after the announcement. This reflects the SCAR presented in Table 2. Since the stock price is obviously low before the event date, SCAR becomes positive only on day +14 after the repurchase announcement, and a significant negative value was detected only from day -20 to day +7. When the industries are classified into three categories, Table 3 and Table 4 show significant differences in the announcement results across industries. For the financial industry, the first day after the event date shows the strongest announcement effect (SAR is 1.47%, as opposed to 0.84% for the electronics industry and 1.18% for the conventional industry). However, the declining speed of the outcome is also fastest in the financial industry. Since the stock price prior to the event is not seriously low (with occasional positive SARs), SCAR is easily converted to a positive value (i.e., one day after the repurchase announcement (day+1) and day +14 to day +20 showed equally significant results in the two tests). The repurchase effect is weakest in the electronics industry. SCAR is negative until day +20 of the event. The conventional industry falls between the two other industries. Based on the two tests, values become
Estimation Period T Event Period W
t1 t2 t3 t4 Event
6
The International Journal of Business and Finance Research ♦ Volume 5 ♦ Number 1 ♦ 2011
significantly positive on the 8th day after the announcement and from day +16 to day +20. One-way ANOVA test shows that the industry factor correlates SAR (p value is 0.054). The t-test confirms a significant difference between the SAR of the financial industry and that of the electronics industry (p value is 0.017). Other industries do not yield any significant difference. This result supports Hypothesis 2 (Stock price reactions differ across industries after the declaration of a stock repurchase. The announcement effect on the financial industry is expected to be the greatest, while the effect on the electronics industry is expected to be the least). The outcome mirrors those of Chen (2003) and Chi et al. (2007). Table 2: Average Abnormal Return and Cumulative Abnormal Return - Entire Sample
Event date SAR SCAR t-test Sign test
Event date SAR SCAR t-test Sign test
-20 -0.1273 -0.1273 -2.71*** 3.40***
+1 1.0078 -2.1295 13.00*** 9.79***
-19 -0.043 -0.1761 -0.85 1.78
+2 0.5695 -1.56 8.20*** 5.07***
-18 -0.0627 -0.2388 -1.17 1.48
+3 0.2627 -1.2973 3.98*** 1.43
-17 -0.1255 -0.3583 -2.44*** 3.00***
+4 0.1719 -1.1254 3.11*** 1.03
-16 -0.0331 -0.3914 -0.63 0.64
+5 0.0947 -1.0307 1.60 0.25
-15 -0.0523 -0.4436 -0.92 1.53
+6 0.1225 -0.9082 2.32** 0.93
-14 -0.0843 -0.5279 -1.47 2.51**
+7 0.1055 -0.8027 1.96* 0.74
-13 -0.1496 -0.6775 -2.83*** 3.69***
+8 0.1006 -0.702 1.84* 1.82
-12 -0.2323 -0.9098 -4.41*** 4.87***
+9 0.1691 -0.5329 2.93*** 1.43
-11 -0.1725 -1.0823 -3.39*** 3.99***
+10 0.0964 -0.4364 1.84* 1.33
-10 -0.2007 -1.2762 -3.34*** 5.13***
+11 0.1087 -0.3278 1.98** 0.54
-9 -0.1336 -1.4098 -2.26** 1.97**
+12 0.146 -0.1818 2.79*** 1.43
-8 -0.2349 -1.6508 -4.20*** 3.40***
+13 0.1286 -0.0532 2.22** 0.44
-7 -0.1673 -1.8181 -2.87*** 3.59***
+14 0.0787 0.0255 1.47 0.25
-6 -0.2027 -2.0208 -3.49*** 4.38***
+15 0.04 0.0655 0.73 0.34
-5 -0.2015 -2.2223 -3.50*** 3.00***
+16 0.0587 0.1242 1.06 1.13
-4 -0.3308 -2.5531 -5.32*** 5.56***
+17 0.0927 0.2169 1.60 0.05
-3 -0.1947 -2.7478 -3.27*** 3.99***
+18 0.0859 0.3028 1.66* 1.13
-2 -0.2528 -3.0005 -3.80*** 2.80***
+19 0.0634 0.3662 1.21 0.54
-1 -0.2546 -3.2551 -3.58*** 3.10***
+20 0.035 0.4011 0.67 0.84
0 0.1178 -3.1373 1.60 2.02**
This table shows the estimate result of the standardized abnormal return (SAR) and standardized cumulative abnormal return (SCAR) of the sample. We use the Market Model hypothesis and the OLS method of event study to estimate them. The event period starts from 20 days before the announcement (-20) and 20 days after the announcement (+20). The t-test refers to the t-value of the standardized-residual cross-section. Sign test refers to the nonparametric test. These tests examined the significant levels of SAR. ***, **, and
* indicate significance at the 1, 5, and 10 percent levels, respectively.
7
LH. Lin et al IJBFR ♦ Vol. 5 ♦ No. 1 ♦ 2011
Table 3: Average Abnormal Return and Cumulative Abnormal Return—Financial Industry and Electronics Industry
A Financial Industry B Electronics Industry Event date
SAR SCAR t-test Sign test Event date
SAR SCAR t-test Sign test
-20 0.1515 0.1515 0.65 0.2 -20 -0.1309 -0.1309 -2.13** 2.38** -19 0.0394 0.1909 0.18 0.6 -19 -0.0717 -0.2025 -1.09 1.99** -18 0.127 0.3179 0.64 0.2 -18 -0.0433 -0.2458 -0.60 1.46 -17 -0.0811 0.2368 -0.54 1 -17 -0.1141 -0.36 -1.65 1.59 -16 0.1535 0.3903 0.66 0.6 -16 -0.0073 -0.3672 -0.11 0.13 -15 0.0698 0.46 0.26 0.2 -15 -0.0717 -0.4389 -1.02 2.25** -14 -0.1207 0.3394 -0.56 0.2 -14 -0.0944 -0.5333 -1.31 2.65*** -13 -0.0404 0.2989 -0.16 0.6 -13 -0.2273 -0.7606 -3.29*** 3.31*** -12 -0.2128 0.0861 -1.05 0.2 -12 -0.2012 -0.9618 -3.07*** 4.11*** -11 -0.427 -0.3409 -1.98* 2.6** -11 -0.1734 -1.1353 -2.53*** 3.71*** -10 -0.5251 -0.866 -1.99* 2.2** -10 -0.2277 -1.3629 -3.20*** 4.11*** -9 0.2416 -0.6244 1.29 2.2** -9 -0.256 -1.6189 -3.16*** 2.25** -8 -0.0063 -0.6307 -0.02 0.2 -8 -0.3138 -1.9327 -4.46*** 3.31*** -7 -0.0682 -0.6989 -0.24 1 -7 -0.1641 -2.0968 -2.13** 2.65*** -6 -0.4197 -1.1186 -1.50 1 -6 -0.1921 -2.2889 -2.55** 3.05*** -5 -0.0559 -1.1744 -0.25 2.2** -5 -0.1891 -2.478 -2.50** 1.59 -4 0.2119 -0.9626 0.77 1 -4 -0.3775 -2.8555 -4.97*** 4.77*** -3 -0.4164 -1.379 -1.77* 0.6 -3 -0.2567 -3.1122 -3.45*** 4.11*** -2 0.1611 -1.2179 0.69 1.4 -2 -0.2137 -3.3259 -2.30** 1.59 -1 0.0525 -1.1655 0.20 0.6 -1 -0.2859 -3.6118 -3.14*** 2.25** 0 0.5627 -0.6028 1.70 1.4 0 0.0772 -3.5346 0.78 2.12**
+1 1.469 0.8662 5.66*** 3.4*** +1 0.8396 -2.695 8.33*** 6.09*** +2 0.5167 1.3829 2.12** 1.4 +2 0.4678 -2.2272 5.70*** 3.71*** +3 0.1564 1.5393 0.64 0.2 +3 0.2495 -1.9776 3.36*** 1.46 +4 0.3145 1.8538 1.25 0.2 +4 0.1335 -1.8441 1.93* 0.13 +5 0.1796 2.0334 0.72 0.2 +5 0.0569 -1.7872 0.77 0.40 +6 0.042 2.0753 0.18 0.6 +6 0.0706 -1.7166 1.04 0.26 +7 0.2687 2.3441 1.40 1.4 +7 0.0421 -1.6745 0.58 0.13 +8 -0.1245 2.2195 -0.51 0.2 +8 0.0244 -1.6501 0.34 0.93 +9 0.1318 2.3514 0.95 0.2 +9 0.1152 -1.5349 1.51 0.13
+10 0.2589 2.6103 1.30 1.4 +10 0.0721 -1.4628 1.07 0.53 +11 0.2258 2.836 1.20 1.4 +11 0.1003 -1.3625 1.34 0.66 +12 0.3316 3.1676 1.52 0.2 +12 0.0875 -1.275 1.28 1.19 +13 0.022 3.1896 0.08 1 +13 0.0913 -1.1836 1.20 0.79 +14 0.6208 3.8105 2.33** 1.4 +14 -0.0302 -1.2138 -0.45 1.06 +15 0.3264 4.1369 1.31 1.4 +15 -0.0075 -1.2213 -0.11 0.40 +16 0.2307 4.3676 0.88 0.6 +16 0.017 -1.2043 0.25 1.85* +17 0.0759 4.4434 0.26 0.6 +17 0.0632 -1.1411 0.80 0.66 +18 0.2838 4.7272 1.06 1 +18 0.0595 -1.0815 0.90 1.06 +19 0.1661 4.8933 0.58 0.6 +19 0.0004 -1.0811 0.01 0.93 +20 0.1502 5.0435 0.80 0.2 +20 -0.0288 -1.1099 -0.42 0.66
This table shows the estimate result of the standardized abnormal return (SAR) and standardized cumulative abnormal return (SCAR) of the sample. We use the Market Model hypothesis and the OLS method of event study to estimate them. The event period starts from 20 days before the announcement (-20) and 20 days after the announcement (+20). Panel A shows the results for the financial industry. Panel B shows the results for the electronics industry. The t-test refers to the t-value of the standardized-residual cross-section model. Sign test refers to the nonparametric test. These tests examined the significant levels of SAR. ***, **, and
* indicate significance at the 1, 5, and 10 percent levels, respectively.
8
The International Journal of Business and Finance Research ♦ Volume 5 ♦ Number 1 ♦ 2011
Table 4: Average Abnormal Return and Cumulative Abnormal Return—Conventional Industry
Event Date SAR SCAR t-Test Sign-Test
Event Date SAR SCAR t-Test Sign-Test
-20 -0.1657 -0.1657 -2.19** 2.53** +1 1.1753 -1.7918 8.94*** 7.12*** -19 -0.0149 -0.1959 -0.18 0.72 +2 0.7226 -1.0692 5.55*** 3.16*** -18 -0.1204 -0.3163 -1.38 0.72 +3 0.2981 -0.7711 2.32** 0.63 -17 -0.1487 -0.4488 -1.72* 2.53** +4 0.2043 -0.5668 2.13** 1.58 -16 -0.0991 -0.548 -1.08 1.11 +5 0.1354 -0.4314 1.29 0.00 -15 -0.0436 -0.5916 -0.44 0.16 +6 0.209 -0.2224 2.37** 1.42 -14 -0.0642 -0.6558 -0.63 0.79 +7 0.1704 -0.052 1.92* 0.79 -13 -0.0558 -0.7116 -0.65 1.74* +8 0.2444 0.1925 2.74*** 1.74* -12 -0.2797 -0.9913 -2.98*** 2.85*** +9 0.2518 0.4443 2.52*** 2.06** -11 -0.1315 -1.1228 -1.62 0.95 +10 0.1058 0.5500 1.17 0.95 -10 -0.1109 -1.2163 -1.01 2.47** +11 0.1023 0.6524 1.15 0.63 -9 -0.0172 -1.2335 -0.18 1.35 +12 0.2002 0.8526 2.31** 0.79 -8 -0.1584 -1.4085 -1.75 1.58 +13 0.1983 1.0509 2.11** 1.26 -7 -0.1873 -1.5958 -1.99** 2.21** +14 0.1493 1.2001 1.67* 1.11 -6 -0.1839 -1.7797 -1.92* 3.00*** +15 0.0628 1.2629 0.63 0.63 -5 -0.2419 -2.0216 -2.51** 2.06** +16 0.0912 1.3542 0.95 0.16 -4 -0.349 -2.3706 -3.18*** 3.64*** +17 0.1374 1.4916 1.55 0.63 -3 -0.0717 -2.4423 -0.68 1.26 +18 0.0926 1.5842 1.09 0.95 -2 -0.3732 -2.8155 -3.64*** 3.16*** +19 0.137 1.7212 1.79* 0.00 -1 -0.2579 -3.0734 -2.09** 2.06** +20 0.1078 1.8290 1.25 0.63 0 0.1062 -2.9671 0.91 0.16
This table shows the estimate result of the standardized abnormal return (SAR) and standardized cumulative abnormal return (SCAR) of the sample. We use the Market Model hypothesis and the OLS method of event study to estimate them. The event period starts from 20 days before the announcement (-20) and 20 days after the announcement (+20). The t-test refers to the t-value of the standardized-residual cross-section model. Sign test refers to the nonparametric test. These tests examined the significant levels of SAR. . ***, **, and
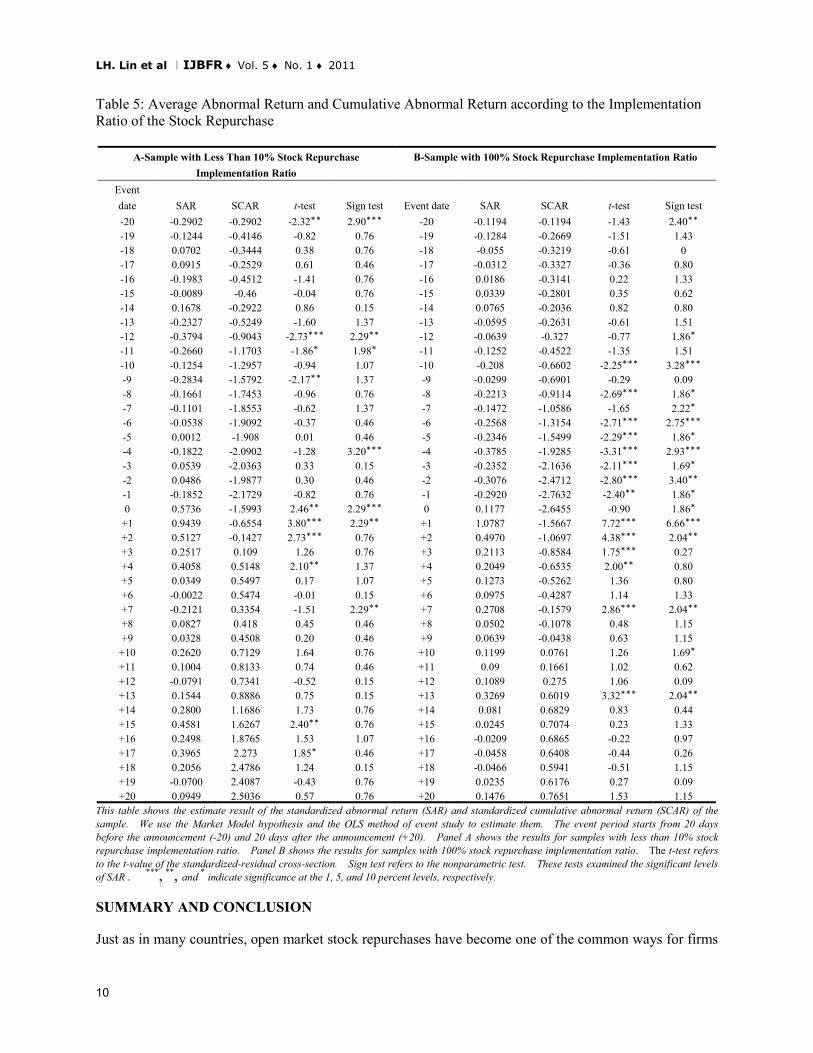
* indicate significance at the 1, 5, and 10 percent levels, respectively. With regard to the actual implementation ratio of the stock repurchase, the sample is divided into 3 groups: 10% and below, 100%, and the percentage in-between. In verifying Hypothesis 3, only the first two groups were compared. Table 5 shows that a SAR of less than 10% implementation ratio reveals a 5% level of significance in the two tests on the following days: day -20, day -12, day 0, and day +1. The SAR of 100% implementation ratio shows a 5% level of significance in the two tests on the following days: day -10, day -6, day-4, day -2, day +1, day +2, day +7, and day +13. The obvious announcement effects of both the two types of firms imply that investors do not realize the actual implementation outcome of the repurchase announcement. The stock price of the former is not as low as that of the second firm (i.e., SAR was at times positive). In this case, SCAR can easily become positive (3 days after the announcement for the first type; 10 days after the announcement for the second type; but both are of no significance). This study supports the view of Hatakeda and Isagawa (2004), that is, that firms that experienced a lower stock price before the repurchase announcement were more willing to buy back shares. The results, however, fail to support Hypothesis 3 (Firms’ actual repurchase of shares following an announcement may affect open market stock prices; the larger the ratio of shares actually repurchased, the stronger the announcement repurchasing effect). The t-test results on the SAR of the two types of firms during the periods of day +0 to day +3 and day +0 to day +20 were found to be insignificant in the 5% level. Perhaps this is due to the failure in filtering some other factors; this warrants further study in the future.
9
LH. Lin et al IJBFR ♦ Vol. 5 ♦ No. 1 ♦ 2011
Table 5: Average Abnormal Return and Cumulative Abnormal Return according to the Implementation Ratio of the Stock Repurchase
A-Sample with Less Than 10% Stock Repurchase Implementation Ratio
B-Sample with 100% Stock Repurchase Implementation Ratio
Event date SAR SCAR t-test Sign test Event date SAR SCAR t-test Sign test -20 -0.2902 -0.2902 -2.32** 2.90*** -20 -0.1194 -0.1194 -1.43 2.40** -19 -0.1244 -0.4146 -0.82 0.76 -19 -0.1284 -0.2669 -1.51 1.43 -18 0.0702 -0.3444 0.38 0.76 -18 -0.055 -0.3219 -0.61 0 -17 0.0915 -0.2529 0.61 0.46 -17 -0.0312 -0.3327 -0.36 0.80 -16 -0.1983 -0.4512 -1.41 0.76 -16 0.0186 -0.3141 0.22 1.33 -15 -0.0089 -0.46 -0.04 0.76 -15 0.0339 -0.2801 0.35 0.62 -14 0.1678 -0.2922 0.86 0.15 -14 0.0765 -0.2036 0.82 0.80 -13 -0.2327 -0.5249 -1.60 1.37 -13 -0.0595 -0.2631 -0.61 1.51 -12 -0.3794 -0.9043 -2.73*** 2.29** -12 -0.0639 -0.327 -0.77 1.86* -11 -0.2660 -1.1703 -1.86* 1.98* -11 -0.1252 -0.4522 -1.35 1.51 -10 -0.1254 -1.2957 -0.94 1.07 -10 -0.208 -0.6602 -2.25*** 3.28*** -9 -0.2834 -1.5792 -2.17** 1.37 -9 -0.0299 -0.6901 -0.29 0.09 -8 -0.1661 -1.7453 -0.96 0.76 -8 -0.2213 -0.9114 -2.69*** 1.86* -7 -0.1101 -1.8553 -0.62 1.37 -7 -0.1472 -1.0586 -1.65 2.22* -6 -0.0538 -1.9092 -0.37 0.46 -6 -0.2568 -1.3154 -2.71*** 2.75*** -5 0.0012 -1.908 0.01 0.46 -5 -0.2346 -1.5499 -2.29*** 1.86* -4 -0.1822 -2.0902 -1.28 3.20*** -4 -0.3785 -1.9285 -3.31*** 2.93*** -3 0.0539 -2.0363 0.33 0.15 -3 -0.2352 -2.1636 -2.11*** 1.69* -2 0.0486 -1.9877 0.30 0.46 -2 -0.3076 -2.4712 -2.80*** 3.40** -1 -0.1852 -2.1729 -0.82 0.76 -1 -0.2920 -2.7632 -2.40** 1.86* 0 0.5736 -1.5993 2.46** 2.29*** 0 0.1177 -2.6455 -0.90 1.86*
+1 0.9439 -0.6554 3.80*** 2.29** +1 1.0787 -1.5667 7.72*** 6.66*** +2 0.5127 -0.1427 2.73*** 0.76 +2 0.4970 -1.0697 4.38*** 2.04** +3 0.2517 0.109 1.26 0.76 +3 0.2113 -0.8584 1.75*** 0.27 +4 0.4058 0.5148 2.10** 1.37 +4 0.2049 -0.6535 2.00** 0.80 +5 0.0349 0.5497 0.17 1.07 +5 0.1273 -0.5262 1.36 0.80 +6 -0.0022 0.5474 -0.01 0.15 +6 0.0975 -0.4287 1.14 1.33 +7 -0.2121 0.3354 -1.51 2.29** +7 0.2708 -0.1579 2.86*** 2.04** +8 0.0827 0.418 0.45 0.46 +8 0.0502 -0.1078 0.48 1.15 +9 0.0328 0.4508 0.20 0.46 +9 0.0639 -0.0438 0.63 1.15
+10 0.2620 0.7129 1.64 0.76 +10 0.1199 0.0761 1.26 1.69* +11 0.1004 0.8133 0.74 0.46 +11 0.09 0.1661 1.02 0.62 +12 -0.0791 0.7341 -0.52 0.15 +12 0.1089 0.275 1.06 0.09 +13 0.1544 0.8886 0.75 0.15 +13 0.3269 0.6019 3.32*** 2.04** +14 0.2800 1.1686 1.73 0.76 +14 0.081 0.6829 0.83 0.44 +15 0.4581 1.6267 2.40** 0.76 +15 0.0245 0.7074 0.23 1.33 +16 0.2498 1.8765 1.53 1.07 +16 -0.0209 0.6865 -0.22 0.97 +17 0.3965 2.273 1.85* 0.46 +17 -0.0458 0.6408 -0.44 0.26 +18 0.2056 2.4786 1.24 0.15 +18 -0.0466 0.5941 -0.51 1.15 +19 -0.0700 2.4087 -0.43 0.76 +19 0.0235 0.6176 0.27 0.09 +20 0.0949 2.5036 0.57 0.76 +20 0.1476 0.7651 1.53 1.15
This table shows the estimate result of the standardized abnormal return (SAR) and standardized cumulative abnormal return (SCAR) of the sample. We use the Market Model hypothesis and the OLS method of event study to estimate them. The event period starts from 20 days before the announcement (-20) and 20 days after the announcement (+20). Panel A shows the results for samples with less than 10% stock repurchase implementation ratio. Panel B shows the results for samples with 100% stock repurchase implementation ratio. The t-test refers to the t-value of the standardized-residual cross-section. Sign test refers to the nonparametric test. These tests examined the significant levels of SAR . ***, **, and
* indicate significance at the 1, 5, and 10 percent levels, respectively. SUMMARY AND CONCLUSION Just as in many countries, open market stock repurchases have become one of the common ways for firms
10
The International Journal of Business and Finance Research ♦ Volume 5 ♦ Number 1 ♦ 2011
to pay out cash flows to their shareholders; the same situation is found in Taiwan recently. Every time stock prices plummet, a great many companies announce programs to buy back their own shares. In view of this fact, this paper aims to examine the effects of stock repurchase announcements made by listed companies on their respective stock prices, and to ascertain whether there really is an “announcement effect”. In addition, the focal point of this study also includes the questions on whether the announcement effect varies across industries and whether it depends upon the actual execution of repurchase. Our study obtained the data from the Market Observation Post System of the Taiwan Stock Exchange. Listed companies that issued a repurchase announcement for the first time from August 9, 2000 to October 31, 2008 were included in the sample, with a final count of 413 firms. We adopted the Market Model hypothesis and the OLS method of event study to estimate the standard abnormal return (SAR) of the sample and standard cumulative abnormal return (SCAR). The database of Taiwan Economic Journal (TEJ) was used to estimate the effects of stock repurchase on stock price. The result of the study supports our first hypothesis that stock repurchase announcements cause a significantly positive response from the market and our second hypothesis that the effects of repurchase announcement vary across the industries. The effect on the financial industry is the greatest, while the effect on the electronics industry is the least. We found that firms that experienced a larger decline in stock price prior to repurchase announcement were more willing to buy back their stocks. However, the result failed to support our third hypothesis that the larger the ratio of shares actually repurchased, the stronger the announcement repurchasing effect. It is possible that some other factors were not filtered and ultimately affected the results. For example, the various reasons for share repurchase programs may lead to different empirical results. Besides, this study does not examine the issue of whether the firms that repurchase 100% of their shares have better longtime operating performance than those firms that repurchase their shares below 10%, which is an interesting issue and is worth looking into by future researchers. REFERENCES Baker, H. K., Powell, G.E. and Veit, E.T. (2003), Why companies use open-Market repurchases: a managerial perspective, The Quarterly Review of Economics and Finance, 43, 483-504. Chan, C. H. (2003), A study of signaling effects on stock sequential repurchase in Taiwan. Western Decision Science Institute 32nd Annual Meeting, Island of Kauai, Hawaii, U.S.A, 1-11. Chen, D. (2003), The announcement effect of stock repurchase on share prices: an empirical analysis on the Taiwan Stock Exchange. Commerce& Management Quarterly, 4 (4), 377-400. Chi, D. Wu, S. and Tsai, Z-R. (2007), A study on the stock repurchase announcements and the repurchase purposes of listed corporations in Taiwan. Business Review, 12 (1), 109 -138. Comment, R., and Jarrell, G. (1991), The relative signaling power of Dutch auction and fixed price tender offers and open market share repurchases. Journal of Finance, 46 (4), 1243-1271. Grullon, G., and Ikenberry, D.L. (2000), What do we know about stock repurchase? Journal of Applied Corporate Finance, 13, 31-51. Hatakeda, T., and Isagawa, N.(2004), Stock price behavior surrounding stock repurchase announcements: evidence from Japan, Pacific Basin Finance Journal, 12(3), 271-290. Hsu C. (2000), Investment: theories and applications, Third edition, Xin Lu Publishing, Taipei City.
11
LH. Lin et al IJBFR ♦ Vol. 5 ♦ No. 1 ♦ 2011
Ikenberry, D., Lakonishok, J., and Vermaelen, T. (1995), Market underreaction to open market share repurchases. Journal of Financial Economics, 39, 181-208. Lie, E.(2005), Operating performance following open market share repurchase announcements. Journal of Accounting and Economics, 39, 411-436. Liu, C.S., and Ziebart, D. (1997), Stock returns and open market stock repurchase announcements. Financial Review, 32, 709-728. Lie, E. (2000), Excess funds and agency problems: an empirical study of incremental cash disbursements. Review of Financial Studies, 13, 219-248. Otchere, I., and Ross, M. (2002), Do share buy back announcements convey firm-specific or industry-wide information: a test of the undervaluation hypothesis. International Review of Financial Analysis, 11, 511-531. Shen, C. and Li, C. (2000a), Event study method: essential empirical studies on finance and accounting. Hwa Tai Publishing, Taipei City. Shen, C. and Li, C. (2000b), Event study and ß-module–user’s manual. Taiwan Economic Journal Co., Taipei City. Yang Y. (2007), Time sequence analysis–economic and financial applications. Shuang Ye Book Gallery Ltd. Co., Taipei City. Zhang, H. (2005), Share price performance following share repurchase. Journal of Banking & Finance, 29, 1887-1901. ACKNOWLEDGEMENT We are indebted to two anonymous referees for sowing the seeds for this research in many valued feedbacks and insightful comments. We also appreciate Professor Mercedes Jalbert (the editor) for numerous helpful suggestions. BIOGRAPHY Mrs. Li-Hua Lin is a lecturer of Department of Information Management, Transworld Institute of Technology, Taiwan. She can be contacted at: 1221, Jen-Nang Rd., Chia-Tong Li, Douliou, Yunlin, Taiwan R.O.C. Email: [email protected] Mr. Szu-Hsien Lin is a lecturer of Department of Finance, Transworld Institute of Technology, Taiwan, and Ph.D Student of Department of Business Administration at National Chung Cheng University, Taiwan. He can be contacted at: 1221, Jen-Nang Rd., Chia-Tong Li, Douliou, Yunlin, Taiwan R.O.C. Email: [email protected] Dr. Ya-Chiu Angela Liu is a Professor of Department of Business administration, National Chung Cheng University, Taiwan. She can be contacted at: 168 University Road, MinHsiung, ChiaYi, Taiwan R.O.C. Email: [email protected]
12