Embed Size (px)
Citation preview
8/8/2019 Stock Market Valuation Made Easy
http://slidepdf.com/reader/full/stock-market-valuation-made-easy 1/8
On December 31, 1964 the Dow closed at 874.2. Seventeen Years later on December 31, 1981 the
Dow closed at 875. Over that time period the GDP of the US grew by 370%, the sales of the
Fortune 500 more than sextupled, and the Dow inched up a mere fraction of a point.
How is it possible that the economy could expand by such a large degree when the Dow grew by
only one tenth of a percent? This is the question that Warren Buffett posed in a 1999
interview in Fortune magazine on the nature of the current market. The simple answer is that the
value of the economy grew but the price investors were willing to pay for a share of the future of
that economy did not. So the actual question is what caused investors to have such a low
valuation of the economy despite its huge growth. It is important to remember the simple, often
forgotten, idea behind investment which Buffett defines as, ³laying out money today to receive
more money tomorrow.´ In effect the value of an investment is the expected return and a decline
in investor valuation signals a decline in expected returns. Thus, the answer to the question putforth by Buffet can be found by looking at the value of expected returns.
The career of Wade Dokken began at a historic low valuation in the market, and everyone whose
career had an early 1980¶s beginning has experienced an unprecedented market run. We formed
WealthVest Marketing to market guaranteed annuities, index annuities, and income annuities²
because we believe that we may be in another period²not unlike the 1964-1982 period---and a
period unknown to almost all current financial service professionals. So, this is a story of stock
market valuation²and over-valuation.
Every asset has some level of uncertainty attached to its future value. This uncertainty is
quantified by risk which effectively lowers the future value of an asset. Investors need to comparethis risk between multiple assets and, as a result, for any meaningful comparisons to be made
there has to be some kind of standard of risk to be compared to. This comes in the form of what is
called the risk free rate which is derived from the interest rates on long termgovernment bonds,
an asset with effectively no risk. This is the baseline value to which all investments are ultimately
compared to. Even minor changes in these interest rates can have huge effects on market
valuation. Buffett underlines the far reaching nature of these rates by saying, ³In economics,
interest rates act as gravity behaves in the physical world. At all times, in all markets, in all parts
8/8/2019 Stock Market Valuation Made Easy
http://slidepdf.com/reader/full/stock-market-valuation-made-easy 2/8
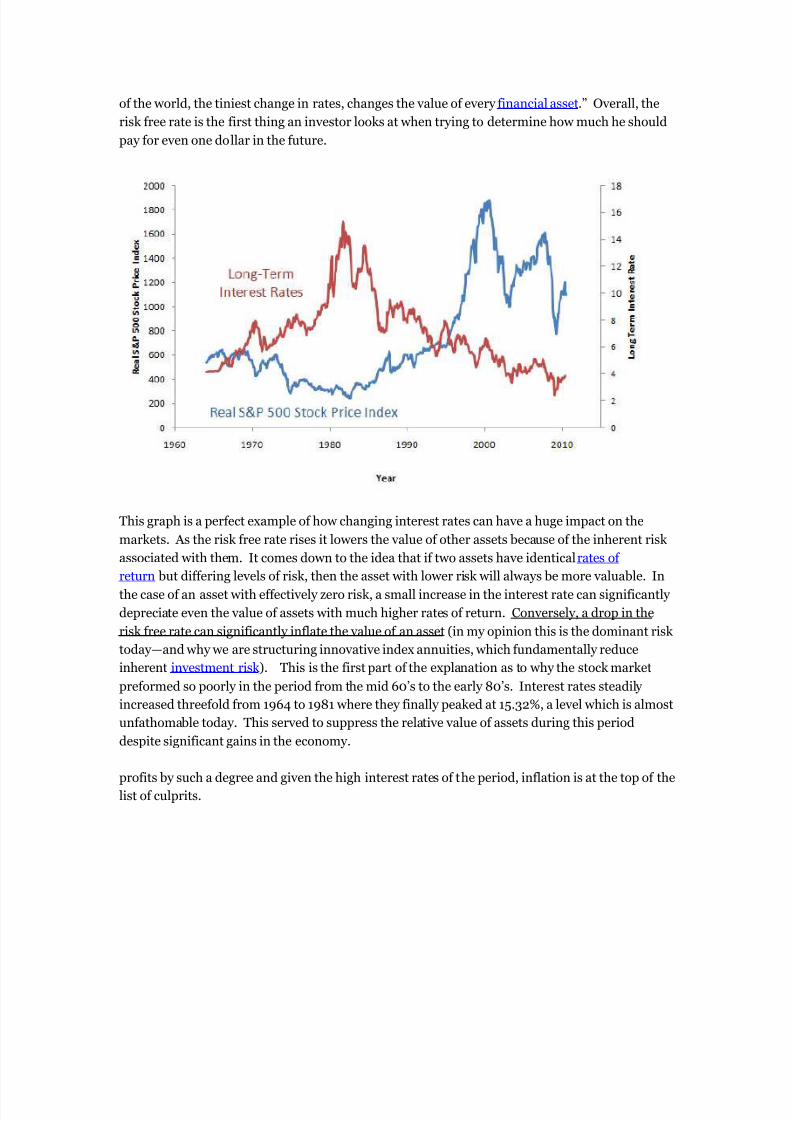
of the world, the tiniest change in rates, changes the value of every financial asset.´ Overall, the
risk free rate is the first thing an investor looks at when trying to determine how much he should
pay for even one dollar in the future.
This graph is a perfect example of how changing interest rates can have a huge impact on the
markets. As the risk free rate rises it lowers the value of other assets because of the inherent risk
associated with them. It comes down to the idea that if two assets have identical rates of
return but differing levels of risk, then the asset with lower risk will always be more valuable. In
the case of an asset with effectively zero risk, a small increase in the interest rate can significantly
depreciate even the value of assets with much higher rates of return. Conversely, a drop in the
risk free rate can significantly inflate the value of an asset (in my opinion this is the dominant risk
today²and why we are structuring innovative index annuities, which fundamentally reduce
inherent investment risk ). This is the first part of the explanation as to why the stock market
preformed so poorly in the period from the mid 60¶s to the early 80¶s. Interest rates steadily
increased threefold from 1964 to 1981 where they finally peaked at 15.32%, a level which is almost
unfathomable today. This served to suppress the relative value of assets during this period
despite significant gains in the economy.
profits by such a degree and given the high interest rates of the period, inflation is at the top of the
list of culprits.
8/8/2019 Stock Market Valuation Made Easy
http://slidepdf.com/reader/full/stock-market-valuation-made-easy 3/8
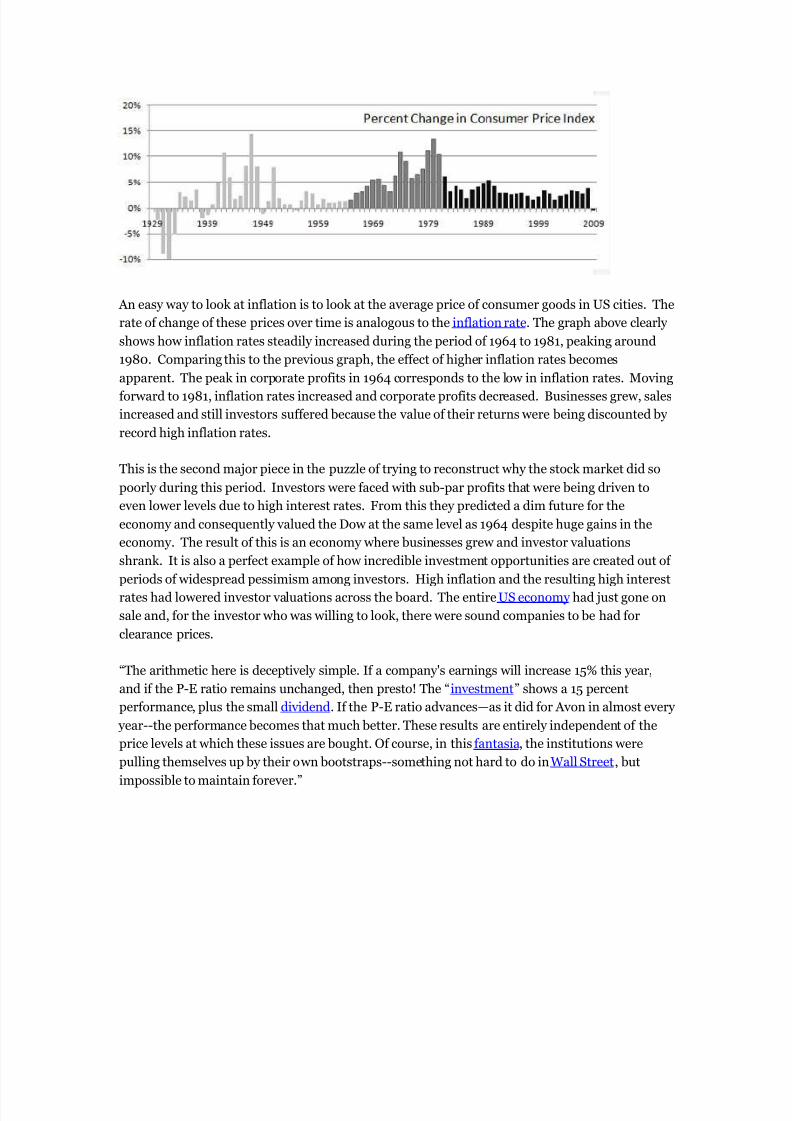
An easy way to look at inflation is to look at the average price of consumer goods in US cities. The
rate of change of these prices over time is analogous to the inflation rate. The graph above clearly
shows how inflation rates steadily increased during the period of 1964 to 1981, peaking around
1980. Comparing this to the previous graph, the effect of higher inflation rates becomes
apparent. The peak in corporate profits in 1964 corresponds to the low in inflation rates. Moving
forward to 1981, inflation rates increased and corporate profits decreased. Businesses grew, salesincreased and still investors suffered because the value of their returns were being discounted by
record high inflation rates.
This is the second major piece in the puzzle of trying to reconstruct why the stock market did so
poorly during this period. Investors were faced with sub-par profits that were being driven to
even lower levels due to high interest rates. From this they predicted a dim future for the
economy and consequently valued the Dow at the same level as 1964 despite huge gains in the
economy. The result of this is an economy where businesses grew and investor valuations
shrank. It is also a perfect example of how incredible investment opportunities are created out of
periods of widespread pessimism among investors. High inflation and the resulting high interest
rates had lowered investor valuations across the board. The entire US economy had just gone on
sale and, for the investor who was willing to look, there were sound companies to be had for
clearance prices.
³The arithmetic here is deceptively simple. If a company's earnings will increase 15% this year,
and if the P-E ratio remains unchanged, then presto! The ³investment´ shows a 15 percent
performance, plus the small dividend. If the P-E ratio advances²as it did for Avon in almost every
year--the performance becomes that much better. These results are entirely independent of the
price levels at which these issues are bought. Of course, in this fantasia, the institutions were
pulling themselves up by their own bootstraps--something not hard to do in Wall Street, but
impossible to maintain forever.´
8/8/2019 Stock Market Valuation Made Easy
http://slidepdf.com/reader/full/stock-market-valuation-made-easy 4/8
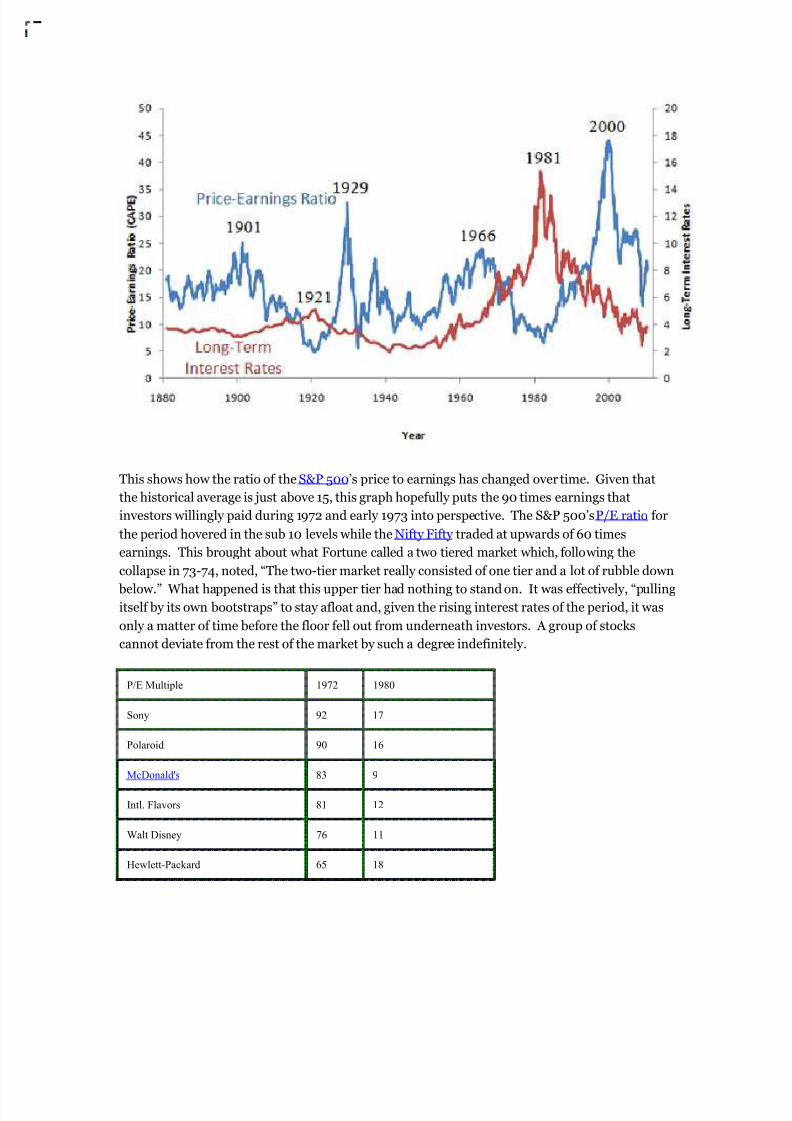
This shows how the ratio of the S&P 500¶s price to earnings has changed over time. Given that
the historical average is just above 15, this graph hopefully puts the 90 times earnings that
investors willingly paid during 1972 and early 1973 into perspective. The S&P 500¶s P/E ratio for
the period hovered in the sub 10 levels while the Nifty Fifty traded at upwards of 60 times
earnings. This brought about what Fortune called a two tiered market which, following the
collapse in 73-74, noted, ³The two-tier market really consisted of one tier and a lot of rubble down
below.´ What happened is that this upper tier had nothing to stand on. It was effectively, ³pullingitself by its own bootstraps´ to stay afloat and, given the rising interest rates of the period, it was
only a matter of time before the floor fell out from underneath investors. A group of stocks
cannot deviate from the rest of the market by such a degree indefinitely.
P/E Multiple 1972 1980
Sony 92 17
Polaroid 90 16
McDonald's 83 9
Intl. Flavors 81 12
Walt Disney 76 11
Hewlett-Packard 65 18
8/8/2019 Stock Market Valuation Made Easy
http://slidepdf.com/reader/full/stock-market-valuation-made-easy 5/8
This illustrates how P/E Ratios can actually serve to be a double edged sword. By nature, the
ratio attempts to incorporate some notion of risk into its value because the price takes into
account a company¶s future prospects for earnings. Consequently, the ratio is more accurately a
measure of what investopedia.com calls ³market optimism´ with regards to a company¶s future
earnings. Companies with comparatively high P/E ratios are seen by the market to have high
potential for growth in future earnings and are valued higher. Conversely, companies with low P/E ratios are seen to have low potential for growth earnings and are valued lower. However, as
seen by 1973, the market doesn¶t always judge companies with complete accuracy. This ties in
well with a favorite saying of Ben Graham, ³You are neither right nor wrong because people agree
with you.´ Just because the market is optimistic about a company¶s growth prospects does not
mean that it will grow and during periods of widespread optimism it¶s easy for investors to make
impulsive judgments about companies. A high P/E ratio could signify a company that is about to
have record earnings but it could also just a company that has been driven up by speculator
interest. The moral of the story is that P/E ratios are only a small part of the picture. It is much
important is to identify why a P/E ratio is low or high and how it compares to the industry and
market P/E ratios.
By late 1974 very little of the stock market was left in the ³upper tier´ and the vast majority,
including a number of perfectly good companies, were in the rubble below. When asked later
about this period Warren Buffet replied, ³1974 in terms of buying opportunities²that was the best
period I have seen.´ Market prices had crashed but businesses were still growing. In the words of
Fortune, ³If one focused on companies rather than on stocks, a good case can be made that there
are excellent values around.́ This comes right back to what Graham was talking about with sub-
asset stocks and is also a reminder to investors that not only are they paying for a share of the
future earnings of a business but they are also paying for a share of the business itself. The ability
to buy at or below the cost of a business¶ assets is a unique opportunity for investors to acquire a
firm for less than it cost to build it in the first place. From there all investors need to do is look at
which firms are most likely to succeed and reap the rewards when economic conditions improve.
8/8/2019 Stock Market Valuation Made Easy
http://slidepdf.com/reader/full/stock-market-valuation-made-easy 6/8
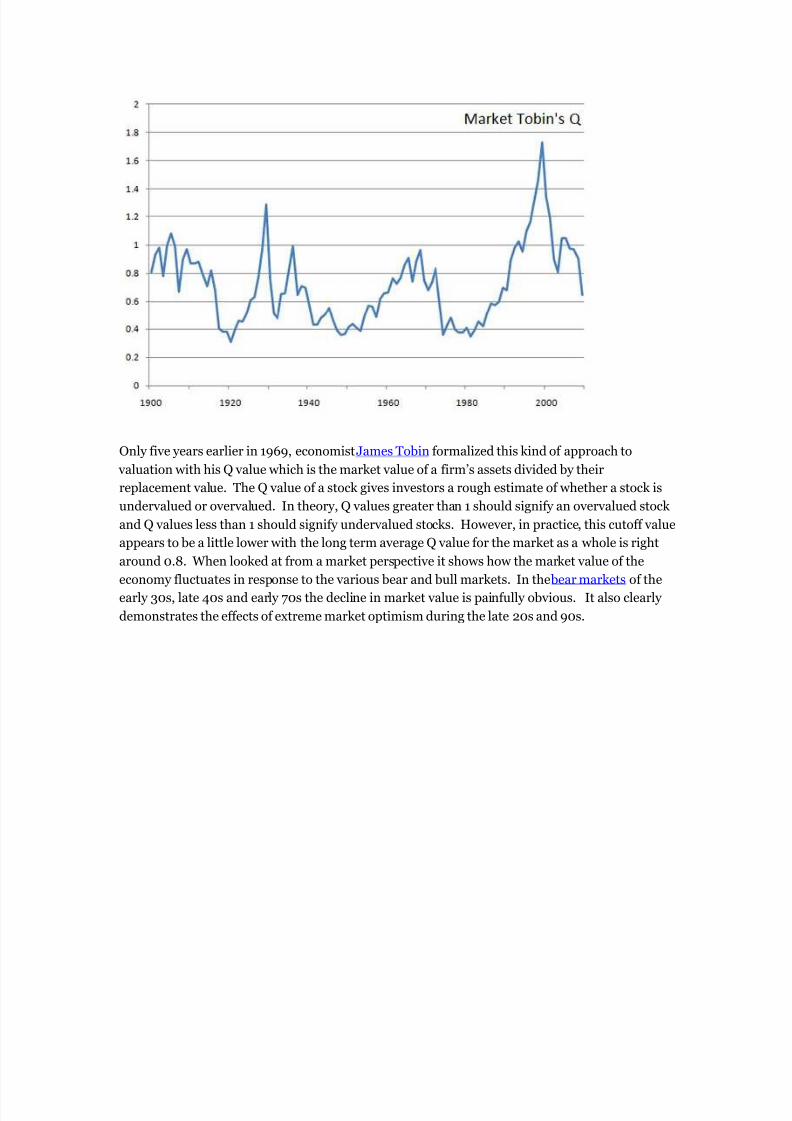
Only five years earlier in 1969, economist James Tobin formalized this kind of approach to
valuation with his Q value which is the market value of a firm¶s assets divided by their
replacement value. The Q value of a stock gives investors a rough estimate of whether a stock is
undervalued or overvalued. In theory, Q values greater than 1 should signify an overvalued stock
and Q values less than 1 should signify undervalued stocks. However, in practice, this cutoff value
appears to be a little lower with the long term average Q value for the market as a whole is right
around 0.8. When looked at from a market perspective it shows how the market value of the
economy fluctuates in response to the various bear and bull markets. In the bear markets of the
early 30s, late 40s and early 70s the decline in market value is painfully obvious. It also clearly
demonstrates the effects of extreme market optimism during the late 20s and 90s.
8/8/2019 Stock Market Valuation Made Easy
http://slidepdf.com/reader/full/stock-market-valuation-made-easy 7/8
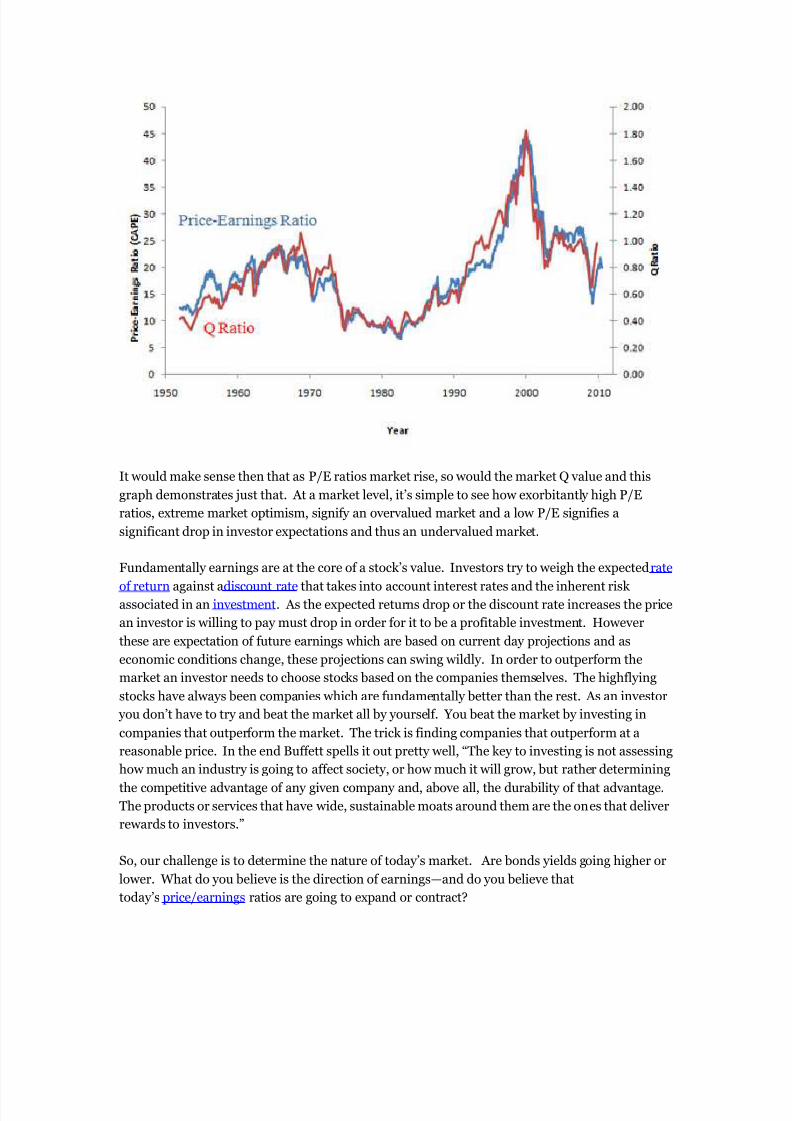
It would make sense then that as P/E ratios market rise, so would the market Q value and this
graph demonstrates just that. At a market level, it¶s simple to see how exorbitantly high P/E
ratios, extreme market optimism, signify an overvalued market and a low P/E signifies a
significant drop in investor expectations and thus an undervalued market.
Fundamentally earnings are at the core of a stock¶s value. Investors try to weigh the expected rate
of return against adiscount rate that takes into account interest rates and the inherent risk associated in an investment. As the expected returns drop or the discount rate increases the price
an investor is willing to pay must drop in order for it to be a profitable investment. However
these are expectation of future earnings which are based on current day projections and as
economic conditions change, these projections can swing wildly. In order to outperform the
market an investor needs to choose stocks based on the companies themselves. The highflying
stocks have always been companies which are fundamentally better than the rest. As an investor
you don¶t have to try and beat the market all by yourself. You beat the market by investing in
companies that outperform the market. The trick is finding companies that outperform at a
reasonable price. In the end Buffett spells it out pretty well, ³The key to investing is not assessing
how much an industry is going to affect society, or how much it will grow, but rather determining
the competitive advantage of any given company and, above all, the durability of that advantage.The products or services that have wide, sustainable moats around them are the ones that deliver
rewards to investors.´
So, our challenge is to determine the nature of today¶s market. Are bonds yields going higher or
lower. What do you believe is the direction of earnings²and do you believe that
today¶s price/earnings ratios are going to expand or contract?
8/8/2019 Stock Market Valuation Made Easy
http://slidepdf.com/reader/full/stock-market-valuation-made-easy 8/8
I believe the short term risk of lower interest rates are high, and my gut is that this establishes a
floor on equity valuations. However, Richard Berner, Morgan Stanley¶s Chief Economist,
and Goldman Sach¶s Chief economist, JanHatzius, are in significant disagreement the most
significant threat to our investment and economic future.
This is why we believe that fixed index annuities, considered by many to be a new asset class,represent a terrific opportunity. Investors can participate in interest ratecredits which are
related to stock market performance, so when the market increases, the fixed interest credits to
the annuity increase. However, and for many this is the key point, if the market tumbles, the
owner of a fixed index annuity contract has a guarantee of principal. There can be no decline in
the investor¶s principal account.
The markets have suffered substantially over the past decade²achieving little nominal returns
and achieving significant real return losses. The market is significantly more reasonably priced
than it was in 2000, and depending upon earnings and interests, it could expand or contract from
here. If this level of market participation is appropriate, then there are numerous
options. However, if your key goal is short term accumulation with both principal risk and thepotential for credited interest rates above todays¶ CD rates, then you should look at fixed index
annuities.