Embed Size (px)
Citation preview
Stock Market Repurchases: The Undervaluation and Negative Outlook Theories
Tammy Tieu Senior Honor Thesis
Spring 2011
Economics Department University of California, Berkeley
Thesis Advisor: Professor Adam Szeidl 1
Abstract: This paper examines open market stock repurchase programs between 2005 and 2010 in the United States. It explores two theories: the undervaluation theory which suggests a positive response due to a firms knowledge about its value and the negative outlook theory, which suggests that a firm’s decision on what to do with excess cash is indicative of its future prospects particularly during a recession. Companies and the corresponding market reaction to a stock repurchase program are analyzed using sample averages and cross-sectional data like market capitalization and the program’s stated purpose.
1 Acknowledgements: I would like to thank Prof. Adam Szeidl for all his support and guidance throughout the research and writing of this paper and for helping me solidify the model and main argument. I would also like to thank my family for their constant encouragement and help in VBA coding for data generation. Finally I wanted to thank all those who took the time to hear my topic and provide valuable comments.
2
1. Introduction
From 2005 to 2010, the United States experienced a recession during which the GDP
growth rate decreased tremendously, falling to -1.7% in 20092. It forced companies to make
decisions appropriate to the macroeconomic climate. During this same period, the United States
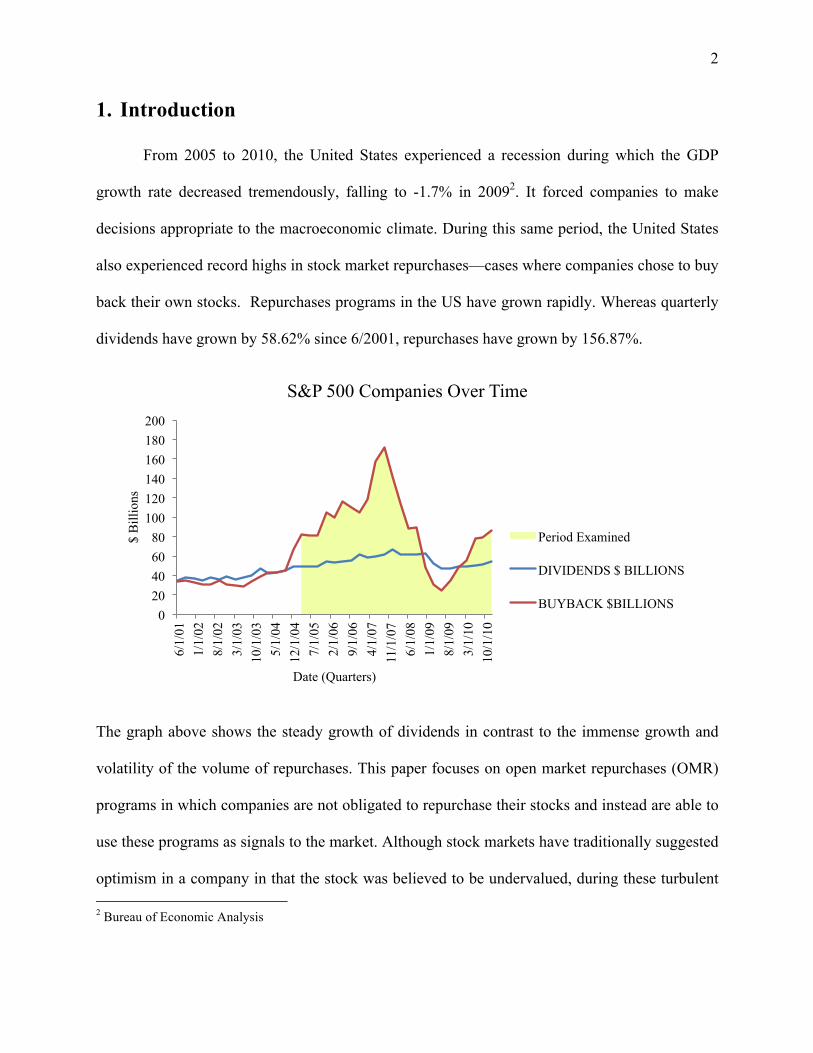
also experienced record highs in stock market repurchases—cases where companies chose to buy
back their own stocks. Repurchases programs in the US have grown rapidly. Whereas quarterly
dividends have grown by 58.62% since 6/2001, repurchases have grown by 156.87%.
The graph above shows the steady growth of dividends in contrast to the immense growth and
volatility of the volume of repurchases. This paper focuses on open market repurchases (OMR)
programs in which companies are not obligated to repurchase their stocks and instead are able to
use these programs as signals to the market. Although stock markets have traditionally suggested
optimism in a company in that the stock was believed to be undervalued, during these turbulent 2 Bureau of Economic Analysis
0 20 40 60 80
100 120 140 160 180 200
6/1/
01
1/1/
02
8/1/
02
3/1/
03
10/1
/03
5/1/
04
12/1
/04
7/1/
05
2/1/
06
9/1/
06
4/1/
07
11/1
/07
6/1/
08
1/1/
09
8/1/
09
3/1/
10
10/1
/10
$ B
illio
ns
Date (Quarters)
S&P 500 Companies Over Time
Period Examined
DIVIDENDS $ BILLIONS
BUYBACK $BILLIONS
3
times could they signal something else? There are two theories in market responses: the
traditional theory is that OMR purchases are positive signals because companies buy back their
stocks knowing insider information and the new theory suggests the macroeconomic situation
and the corresponding financial decision to repurchase stocks reflect negative signals.
1.1. Two Theories
Stock market repurchase programs, sometimes referred to as share buybacks, are nothing
new among companies in the United States. The two most common repurchase programs are
OMRs in which a company repurchases stocks at the market price and tender offers in which
companies repurchase stocks at a specific price determined at announcement. Companies often
choose to repurchase stocks to use excess cash in order to obtain shares for employee benefits,
preventing takeover, and the most common reason, to signal stock mispricing.
The first theory is the market will react positively to an OMR announcement. Since
companies have inside information on performance and potential growth prospects, they can
make a much more educated decision about the future of a company and its valuation than
current investors. As a result, companies repurchase their shares when they believe the shares are
selling below their true value. This paper will observe market reaction to these announcements.
Essentially, if there is a jump in prices, the market on average accepts the mispricing signal and
buys the stock, raising the price. Owners are optimistic about the company and the market
responds positively. This will be referred to as the undervaluation theory.
The second theory is based on the current market situation. What is unique about this
situation is that the market is recovering from a major global recession and how companies
4
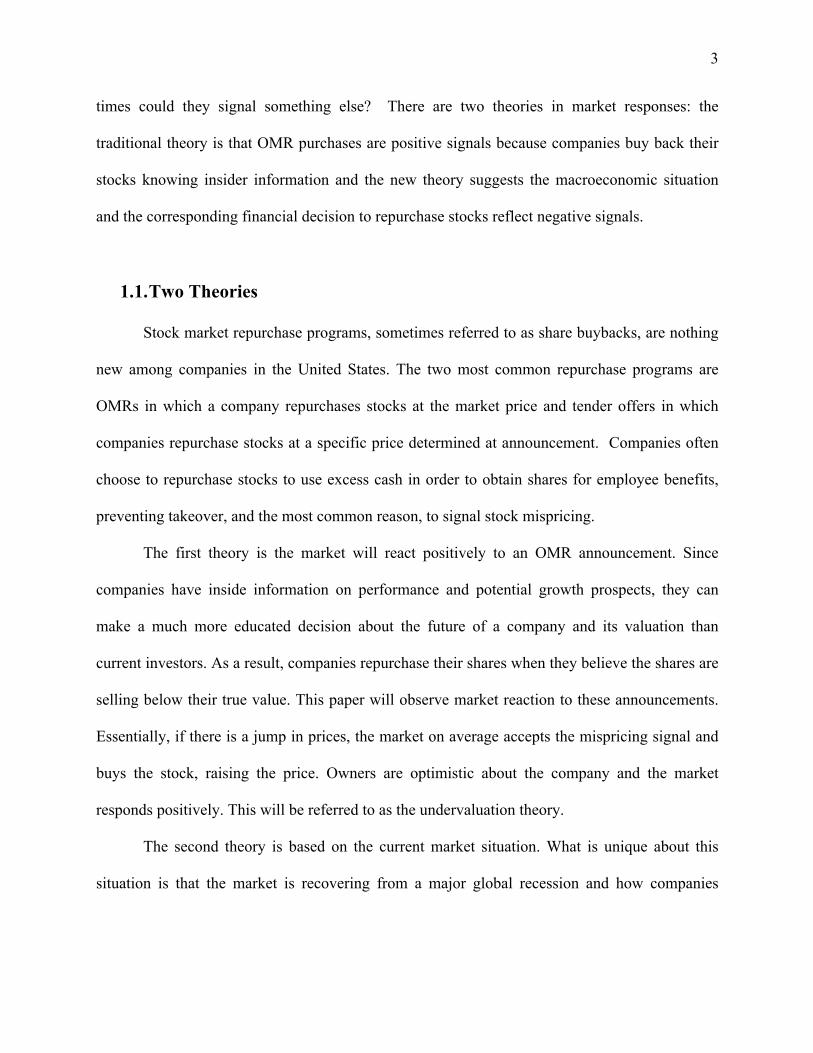
choose to use their excess cash is indicative of their future prospects. The US GDP has fallen
tremendously with a negative growth rate in 2009 for the first time in more than half a century.
In order for companies to expand and grow, certain steps need to be taken to support the
company rather than simply distribute cash. Companies generally have three options when there
is excess cash: (1) Capital Expenditures (including Research & Development), (2) Cash
Dividends, and (3) Stock Repurchases. In many ways a company's decision to repurchase stocks
rather than invest in the company itself can be seen as a negative signal. By repurchasing stocks,
a company puts the cash back in shareholders' pockets, which suggests that the company would
receive a lower rate of return when investing back into the company itself (Capital
Expenditures). Ultimately, this is a negative outlook theory and it suggests that following a
stock repurchase announcement, the market should be indifferent or react negatively.
.
1.2. Literature Review
There have been numerous papers examining the effect of stock market repurchases on a
company's stock price and the incentives companies have to repurchase their stocks. Vermaelen
-2
3
8
13
18
1940 1950 1960 1970 1980 1990 2000 2010 2020
% C
hang
e in
GD
P
Year
GDP percent change based on current dollars
5
(1980) was one of the first to uncover the positive signaling effect these announcements had on
stock price. Papers have also observed the pattern where stock prices decrease prior to an
announcement and increase after an announcement which further supports the idea that
companies use repurchase announcements as a signal to counteract a decreasing stock price (See
Lakonishok and Vermaelen (1990), Comment and Jarrell (1991) and Jagannathan and Stephens
(2003)).
This paper hopes to add to the wealth of information regarding stock market repurchases
by examining a period in which repurchases have hit record highs and in the light of a financial
crisis. There exists the potential for a weakened market response to repurchase announcements or
response entirely different from the traditional undervaluation theory. In addition, this paper also
will examine other factors that can affect the perceived success (an increase in price following
the announcement) of a repurchase program.
1.3. Summary of Findings
In general, the results supported the undervalued theory and stocks saw an increase in price
following stock repurchases. This was made apparent in a graph with an average of all excess log
returns. However, upon cross-sectional comparisons, it was revealed that different market caps
and stated purposes were related to different market responses to repurchase announcements. For
example, by comparing big and small (in terms of market cap) firms, it can be seen that of firms
that have OMR programs, big ones tend to perform better than small ones. Furthermore,
companies that claimed to be ‘undervalued’ despite seeing a slight jump did not see much of a
price increase afterwards.
6
2. Data
The data required for this analysis would be the announcement dates for companies that
repurchased stocks and their corresponding stock prices for a 62-day period3. The repurchase
information was obtained through SDC Platinum, a financial transactions database with a variety
of information including stock market repurchases. The specific data examined were OMR
programs in the United States initially authorized and completed4 between 2005 and 2010 with
market cap and percentage of shares repurchased information available. I focused on OMRs
because of the fact that companies are not required to repurchase a specific amount. Furthermore,
repurchases are set at the market price rather than a preset price at authorization. Ultimately,
changes in market price would change the repurchase price for the company and may affect
repurchase patterns.
After the constraints were applied, the variables examined were ticker symbol, initial
authorization date, stated purpose5, initial market cap, percentage of stocks initially authorized,
and percentage of stocks repurchased. The ticker symbol is unique to a company and therefore
excellent for identifying a company when searching for stock prices. The initial authorization
date was used as the announcement date. Companies can extend their authorizations or increase
the number of stocks authorized. However, since the initial announcement was already made it
could negatively affect the average market reaction; the response could be weaker. It would be
more accurate to just focus on the first announcement. Furthermore, initial authorization date 3 31 days before the announcement, the announcement day, and 30 days after the announcement 4 Completed also includes transactions that were expired, suspended or terminated. Essentially, the program has
ended. 5 Purposes included Acquisitions (ACQ), Employee Benefit Plans (EBP), Stock Option Plan (STP), General
(GEN), Offset Dilution Effect (DIL), Enhance Shareholder Value (ESV), and Undervalued (UV)
7
will be used interchangeably with announcement date. Once the company is authorized to
repurchase stocks, it becomes public information that the firm plans to do so. The initial market
cap at announcement rather than the current market cap was used so we could interpret the same
market cap that the market saw upon announcement.
Actual stock prices and market prices were obtained using Yahoo finance, a public online
resource for stock prices. The actual stock prices were searched using the provided ticker
symbol from the SDC Platinum database and the S&P 500 index6. S&P 500 was chosen as a
market index because it contains 500 of the most actively traded stocks and is fairly
representative of the market. The adjusted closing price was used in all calculations. The
adjusted closing price7 is a value unique to Yahoo finance that adjusts for cash dividends, stock
dividends and stock splits. When dividends or stock splits occur they can affect the closing price
of a stock. For example, after a stock split the price typically drops by half since there are now
twice as many stocks with all other factors held equal. This sharp drop in price though can
negatively affect calculations on changes in price so the adjusted price would be more accurate
when observing changes in price over time.
Companies not found on Yahoo finance or prices that were not available on Yahoo
finance for the desired time period were removed from the data set. When companies were not
found on Yahoo Finance, it suggested that they were no longer publicly traded or even in
business. There were also cases in which the data was not available for the desired time period of
31 days before the announcement date and 30 days after. After removing these companies, the
6 The ticker symbol was for S&P 50 index used was SNP: ^GSPC. 7 For a 2 for 1 split, the pre-split data is multiplied by 0.5. For cash dividend, all previous closing prices are
multiplied by (1 – cash dividend/closing price) See for examples: http://help.yahoo.com/l/us/yahoo/finance/quotes/quote-12.html.
8
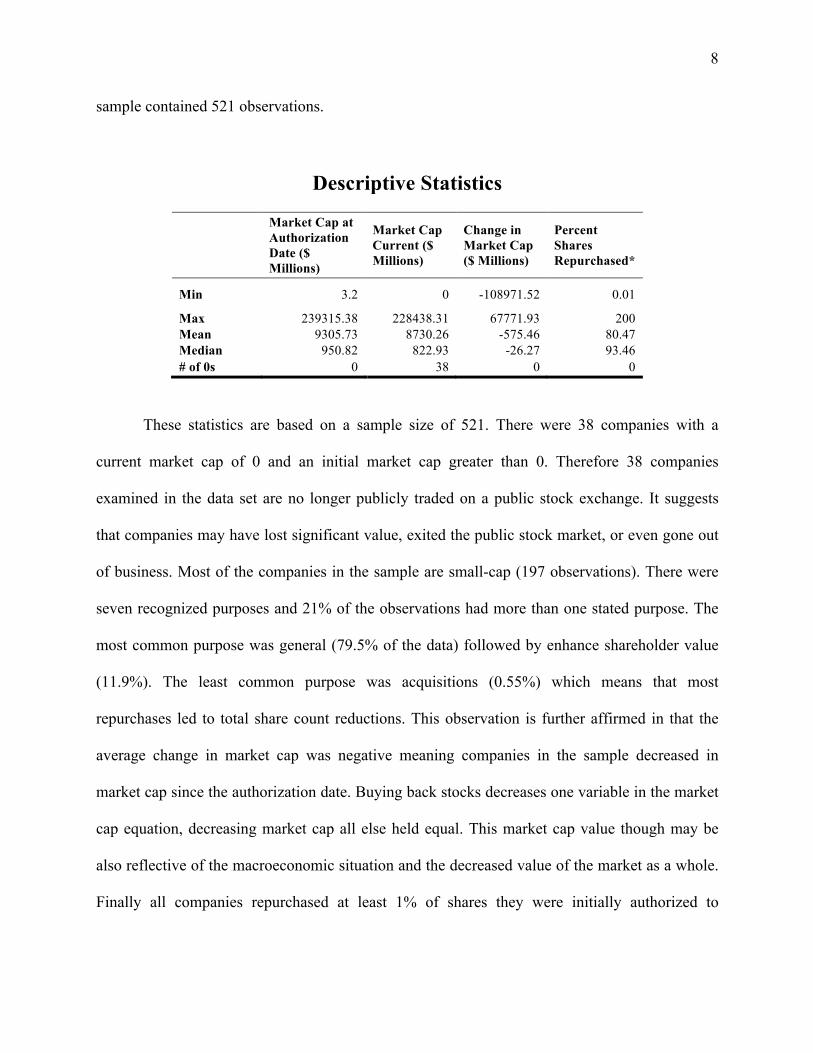
sample contained 521 observations.
Descriptive Statistics
Market Cap at Authorization Date ($ Millions)
Market Cap Current ($ Millions)
Change in Market Cap ($ Millions)
Percent Shares Repurchased*
Min 3.2 0 -108971.52 0.01
Max 239315.38 228438.31 67771.93 200 Mean 9305.73 8730.26 -575.46 80.47 Median 950.82 822.93 -26.27 93.46 # of 0s 0 38 0 0
These statistics are based on a sample size of 521. There were 38 companies with a
current market cap of 0 and an initial market cap greater than 0. Therefore 38 companies
examined in the data set are no longer publicly traded on a public stock exchange. It suggests
that companies may have lost significant value, exited the public stock market, or even gone out
of business. Most of the companies in the sample are small-cap (197 observations). There were
seven recognized purposes and 21% of the observations had more than one stated purpose. The
most common purpose was general (79.5% of the data) followed by enhance shareholder value
(11.9%). The least common purpose was acquisitions (0.55%) which means that most
repurchases led to total share count reductions. This observation is further affirmed in that the
average change in market cap was negative meaning companies in the sample decreased in
market cap since the authorization date. Buying back stocks decreases one variable in the market
cap equation, decreasing market cap all else held equal. This market cap value though may be
also reflective of the macroeconomic situation and the decreased value of the market as a whole.
Finally all companies repurchased at least 1% of shares they were initially authorized to
9
purchase, but since the mean is less than the median, it suggests the data is skewed left and
people tend to purchase a smaller percentage of stocks.
3. Methodology
3.1. Hypothesis
Overall, this paper seeks to examine the two theories previously described: undervaluation
and negative outlook theories and see which of the two has a stronger effect for the OMR
repurchases during this period. Past papers traditionally support the undervaluation theory. The
hypothesis is that stock repurchases have a positive signaling effect—returns relative to the
market will increase upon announcement of the stock market repurchase despite the turbulent
period of 2005-2010. Specific firm qualities like market cap or stock repurchase program
qualities like stated purpose can serve as indicators for the market response following the
announcement of a stock repurchase. This analysis can be achieved through cross-sectional
comparisons and may reveal that certain types are more susceptible to the negative outlook
theory.
3.2. Formula
The objective was to compare returns over a period of time centered around the
authorization date and see if there was a visible change in returns surrounding the announcement
date. A time period was chosen and returns over that period were calculated. According to our
hypothesis, if announcements do have a positive effect than the resulting return following the
announcement should be greater than the day before the announcement. The formula is
10
xt = rt – rmt
xt = Excess log returns at time t
+/- T = Total time frame, T = 30 for this study
t = Time, where t = 0 is the announcement date
P-T-1 = Price at time -T-1, P-31 when T = 30 for this study
Pt = Price at time t
Rt = Rate of return at time t, where 1 + Rt = Pt / P-T-1
rt = Log rate of return at time t, where rt = log(1 + Rt)
Essentially this formula finds the log rate of return for the specific security and for the
market (all variables with the superscript m) and subtracts the return for the market from the
specific security to find the excess returns. By accounting for changes in the market price, it is
easier to observe price changes that are firm specific. Since only certain firms have OMR
programs it is important to see how this announcement affects the firm aside from general
market fluctuations. This formula assumes that the beta for all firms equals one in that all else
held equal a stock should change proportionally with the market index8. The log rate of return
was used instead of the rate of return to make it easier to compare changes using percentages
rather than dollar amounts. Since the companies in the sample are of various market caps, the
corresponding stock prices vary greatly. Since log uses percentages the calculated values can be
compared across companies of multiple market caps.
Using the list generated by SDC Platinum, I obtained the specific stock and S&P 500
index prices from Yahoo Finance with the given ticker symbol for t=-31, -30, -39, …, 28, 29, 30
(a 62-day period) with t=0 as the authorization date. Time is measured in days and excludes all 8 Capital Asset Pricing Model: E(r) = rf + β(E(rm) - rf) where (E(rm) – rf) = Risk Premium
11
weekends and stock-market holidays. I then used the prices to calculate log returns for each
date. The difference between the log returns of the S&P 500 and the specific stock on that day
represent the excess log returns. The average of xt for multiple stocks was plotted on a graph
against time. Averaging large sample sizes reduced noise. Microsoft Excel was the primary
program used to calculate the returns and organize the data.
4. Results
4.1. Average of All Companies
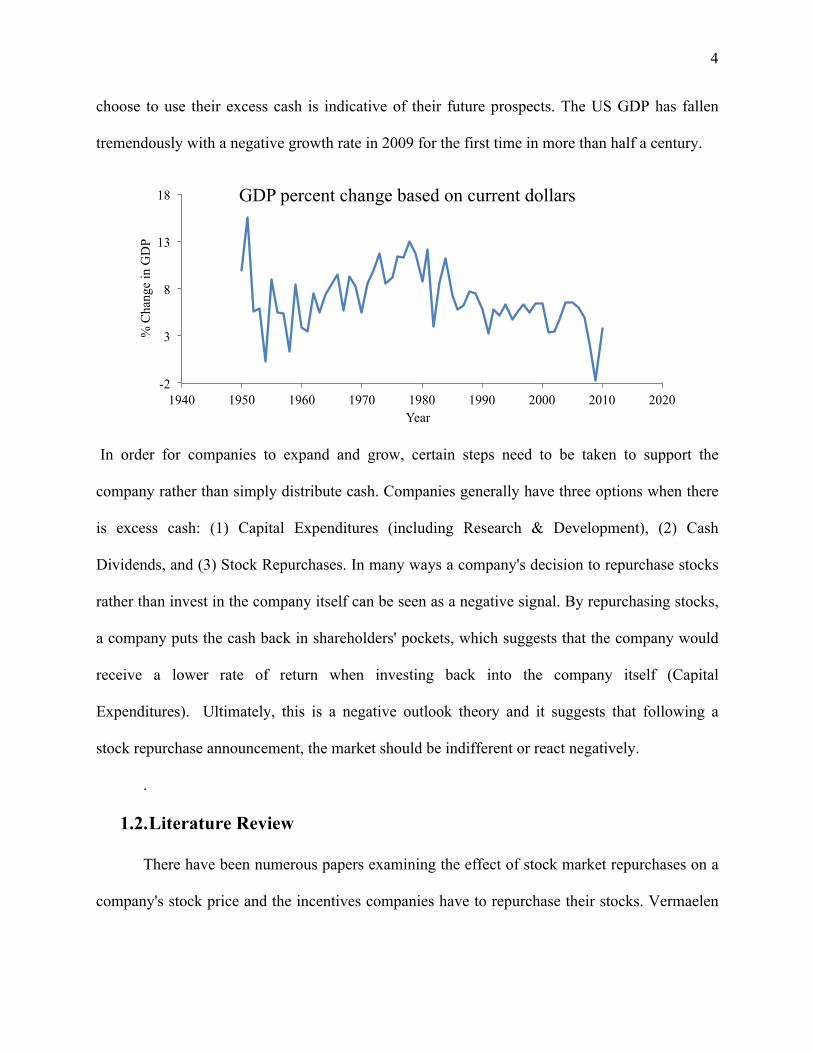
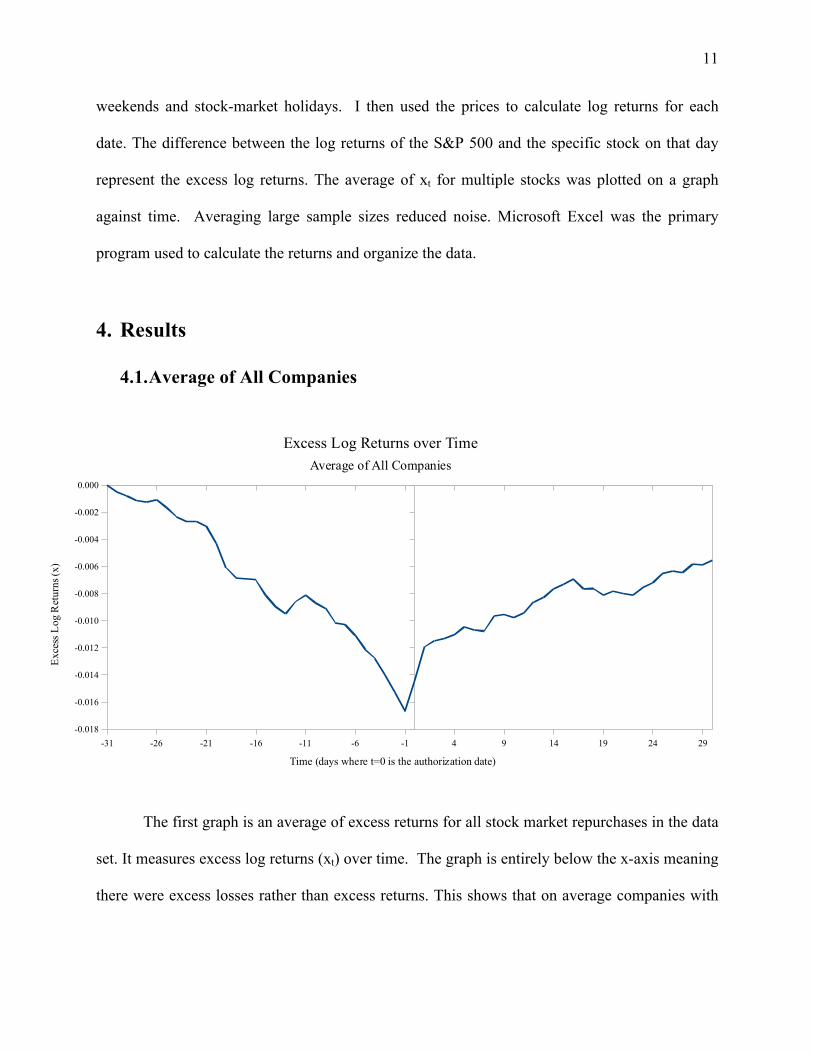
The first graph is an average of excess returns for all stock market repurchases in the data
set. It measures excess log returns (xt) over time. The graph is entirely below the x-axis meaning
there were excess losses rather than excess returns. This shows that on average companies with
-31 -26 -21 -16 -11 -6 -1 4 9 14 19 24 29-0.018
-0.016
-0.014
-0.012
-0.010
-0.008
-0.006
-0.004
-0.002
0.000
Excess Log Returns over TimeAverage of All Companies
Time (days where t=0 is the authorization date)
Exce
ss L
og R
etur
ns (x
)
12
stock market repurchase programs experienced negative excess log returns. The V-shape though
shows a distinct change in slope for excess log returns against time, suggesting that even though
companies experienced negative log excess returns, log excess returns did increase at some point
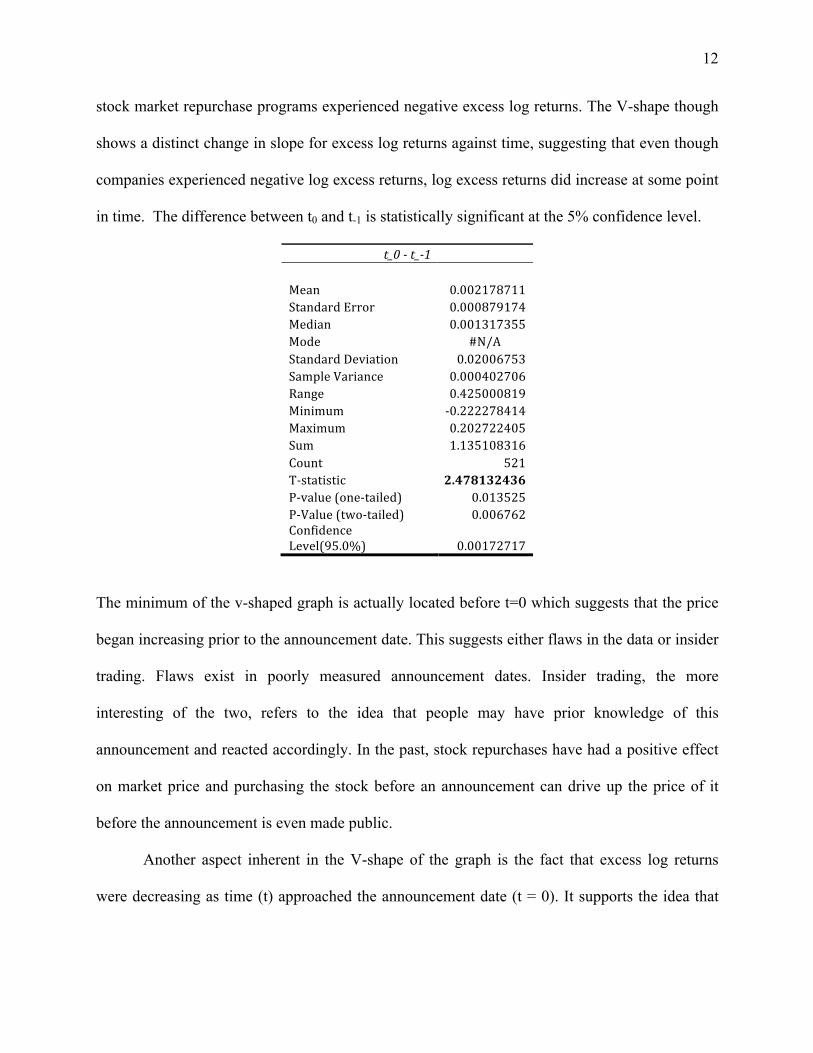
in time. The difference between t0 and t-1 is statistically significant at the 5% confidence level.
t_0 ‐ t_‐1
Mean 0.002178711 Standard Error 0.000879174 Median 0.001317355 Mode #N/A Standard Deviation 0.02006753 Sample Variance 0.000402706 Range 0.425000819 Minimum ‐0.222278414 Maximum 0.202722405 Sum 1.135108316 Count 521 T‐statistic 2.478132436 P‐value (one‐tailed) 0.013525 P‐Value (two‐tailed) 0.006762 Confidence Level(95.0%) 0.00172717
The minimum of the v-shaped graph is actually located before t=0 which suggests that the price
began increasing prior to the announcement date. This suggests either flaws in the data or insider
trading. Flaws exist in poorly measured announcement dates. Insider trading, the more
interesting of the two, refers to the idea that people may have prior knowledge of this
announcement and reacted accordingly. In the past, stock repurchases have had a positive effect
on market price and purchasing the stock before an announcement can drive up the price of it
before the announcement is even made public.
Another aspect inherent in the V-shape of the graph is the fact that excess log returns
were decreasing as time (t) approached the announcement date (t = 0). It supports the idea that
13
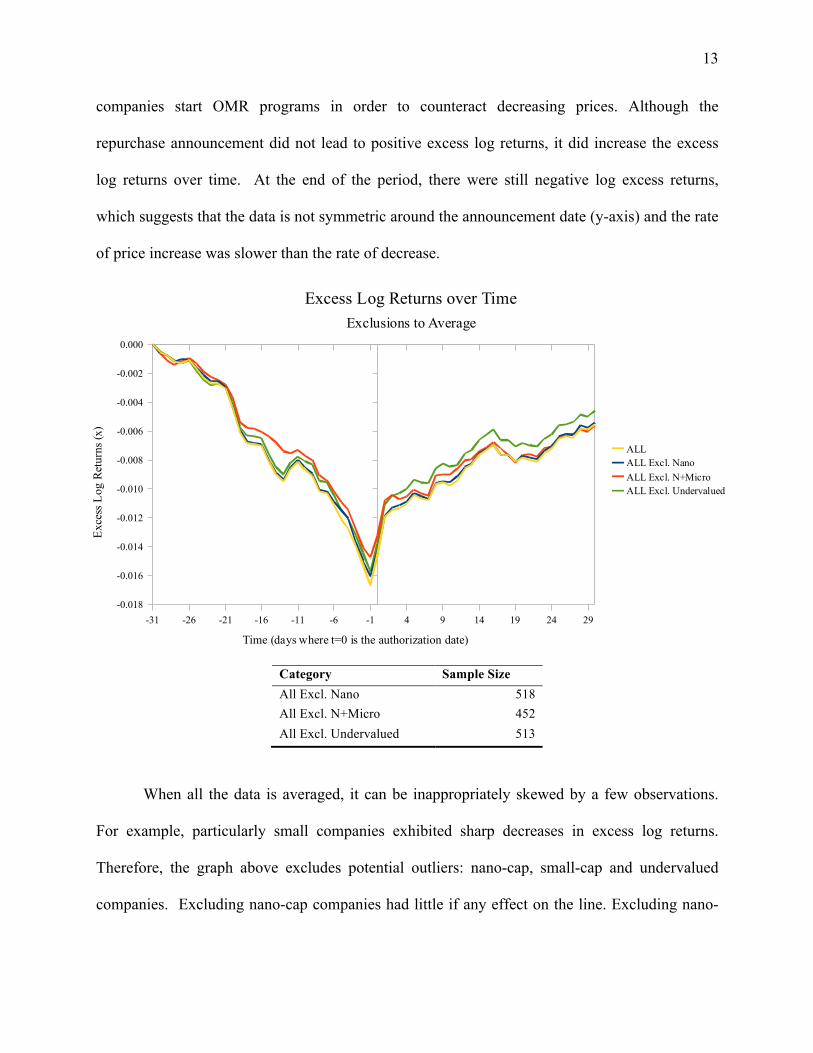
companies start OMR programs in order to counteract decreasing prices. Although the
repurchase announcement did not lead to positive excess log returns, it did increase the excess
log returns over time. At the end of the period, there were still negative log excess returns,
which suggests that the data is not symmetric around the announcement date (y-axis) and the rate
of price increase was slower than the rate of decrease.
Category Sample Size All Excl. Nano 518 All Excl. N+Micro 452 All Excl. Undervalued 513
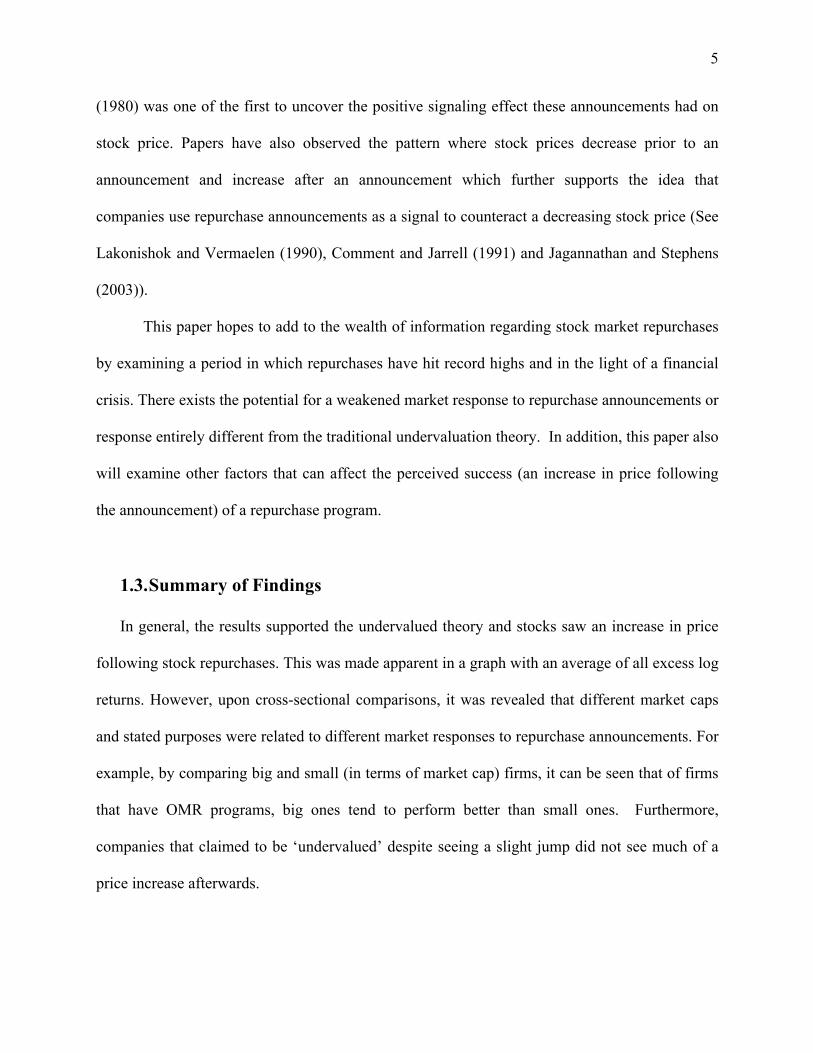
When all the data is averaged, it can be inappropriately skewed by a few observations.
For example, particularly small companies exhibited sharp decreases in excess log returns.
Therefore, the graph above excludes potential outliers: nano-cap, small-cap and undervalued
companies. Excluding nano-cap companies had little if any effect on the line. Excluding nano-
-31 -26 -21 -16 -11 -6 -1 4 9 14 19 24 29-0.018
-0.016
-0.014
-0.012
-0.010
-0.008
-0.006
-0.004
-0.002
0.000
Excess Log Returns over TimeExclusions to Average
ALLALL Excl. NanoALL Excl. N+MicroALL Excl. Undervalued
Time (days where t=0 is the authorization date)
Exce
ss L
og R
etur
ns (x
)
14
cap and micro-cap companies to get a larger set of exclusions while removing more volatile
companies. At points, this changed the line but there is relatively the same effect. Excluding
undervalued companies moved the graph up slightly since they tend to perform poorly relative to
the market as the name suggests. As can be seen by the above graph, the exclusions had little
effect on the overall shape and position of the graph.
Ultimately, these two graphs support the undervaluation theory in that repurchases led to
an increase in excess log returns following an announcement.
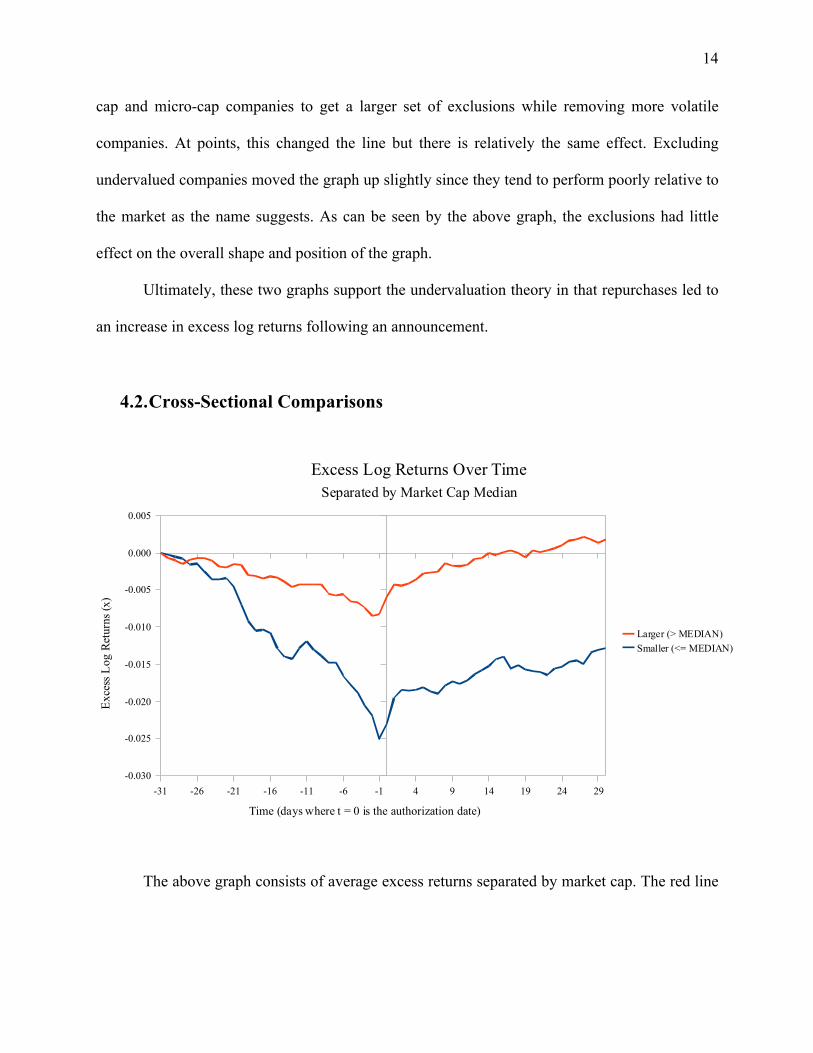
4.2. Cross-Sectional Comparisons
The above graph consists of average excess returns separated by market cap. The red line
-31 -26 -21 -16 -11 -6 -1 4 9 14 19 24 29-0.030
-0.025
-0.020
-0.015
-0.010
-0.005
0.000
0.005
Excess Log Returns Over TimeSeparated by Market Cap Median
Larger (> MEDIAN)Smaller (<= MEDIAN)
Time (days where t = 0 is the authorization date)
Exce
ss L
og R
etur
ns (x
)
15
represents companies greater than the median ($950.82 million) while the blue line represents
less than or equal to the median. By comparing the average of companies with a market cap
above the median and below the median, it created roughly equal sample sizes and graphs with
minimal noise while still comparing two classes of market cap. Both graphs have a V-shape
pattern—excess log returns decrease roughly before the announcement and increase after the
announcement. Larger companies saw greater excess returns on average in the long run than
smaller companies. At the end of the period, larger companies actually had positive excess
returns in contrast to the negative excess returns of smaller companies. This graph supports the
misevaluation theory.
-31 -26 -21 -16 -11 -6 -1 4 9 14 19 24 29-0.030
-0.025
-0.020
-0.015
-0.010
-0.005
0.000
0.005
0.010
0.015
Excess Log ReturnsSeparated by Market Cap
MICROSMALLMIDMEGA
Time (days)
Exce
ss L
og R
etur
ns
16
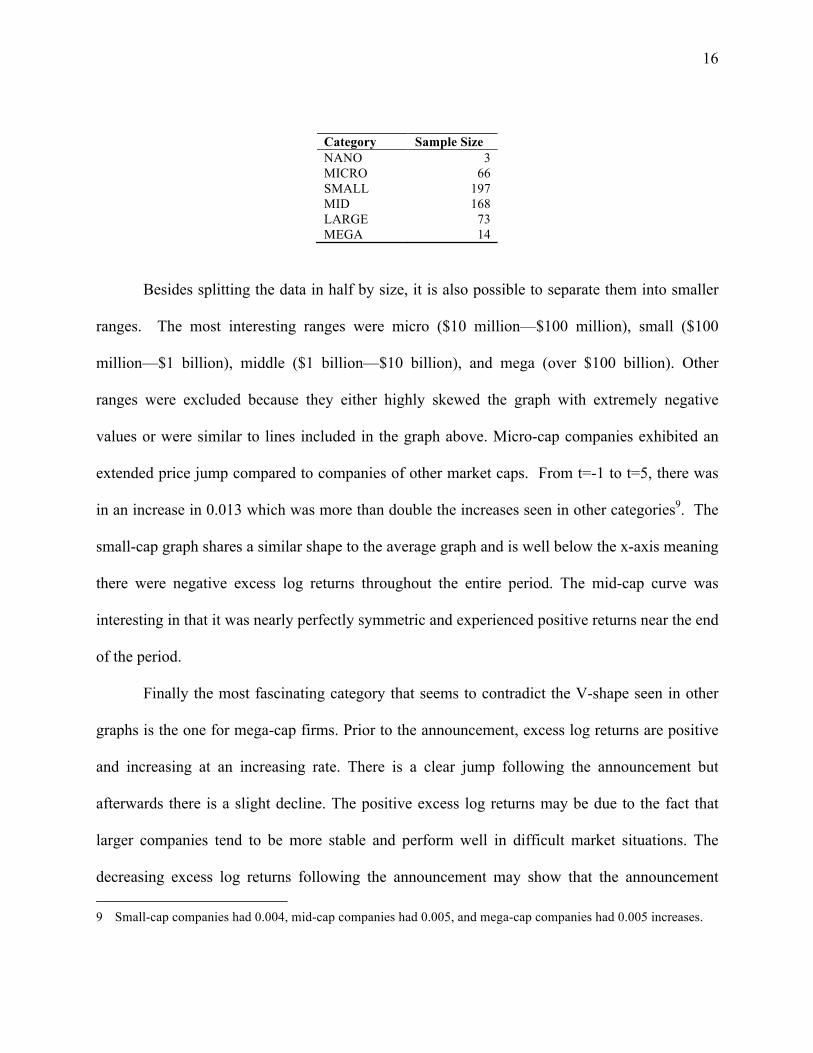
Category Sample Size NANO 3 MICRO 66 SMALL 197 MID 168 LARGE 73 MEGA 14
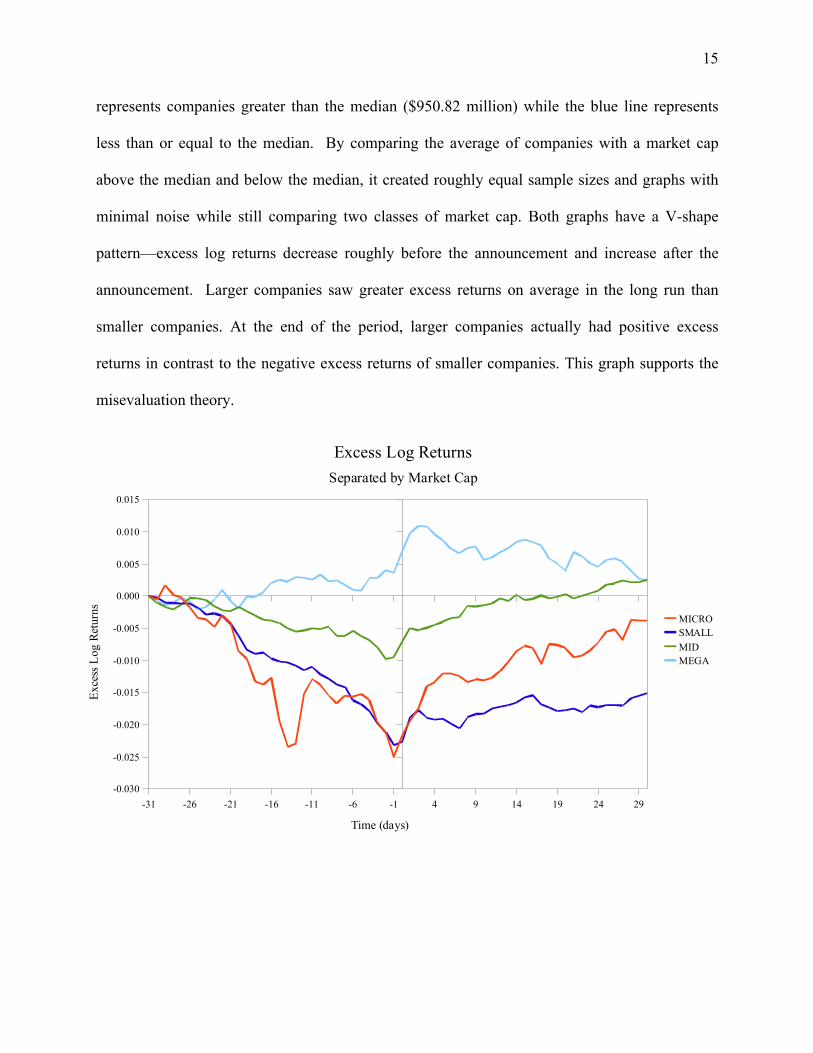
Besides splitting the data in half by size, it is also possible to separate them into smaller
ranges. The most interesting ranges were micro ($10 million—$100 million), small ($100
million—$1 billion), middle ($1 billion—$10 billion), and mega (over $100 billion). Other
ranges were excluded because they either highly skewed the graph with extremely negative
values or were similar to lines included in the graph above. Micro-cap companies exhibited an
extended price jump compared to companies of other market caps. From t=-1 to t=5, there was
in an increase in 0.013 which was more than double the increases seen in other categories9. The
small-cap graph shares a similar shape to the average graph and is well below the x-axis meaning
there were negative excess log returns throughout the entire period. The mid-cap curve was
interesting in that it was nearly perfectly symmetric and experienced positive returns near the end
of the period.
Finally the most fascinating category that seems to contradict the V-shape seen in other
graphs is the one for mega-cap firms. Prior to the announcement, excess log returns are positive
and increasing at an increasing rate. There is a clear jump following the announcement but
afterwards there is a slight decline. The positive excess log returns may be due to the fact that
larger companies tend to be more stable and perform well in difficult market situations. The
decreasing excess log returns following the announcement may show that the announcement 9 Small-cap companies had 0.004, mid-cap companies had 0.005, and mega-cap companies had 0.005 increases.
17
effects for mega-cap companies are short-lived in comparison to smaller companies. Perhaps
companies that are already experiencing positive excess log returns do not reap the same benefits
from an OMR program. Furthermore, it seems larger companies (mega-cap and large-cap which
includes $10 billion+) see increases in excess log returns from t=-2 to t=-1 which suggests an
increase in price prior to the announcement and essentially insider trading. It makes sense that
this occurs on average in larger companies since the public watches these companies much more
closely10.
Overall, the results generally follow the undervaluation theory. However, the fact that
mega-cap companies reflect the negative outlook theory shows that separation by market cap is
significant. The mega-cap companies actually had a decrease in excess log returns through the 30
days following the stock repurchase announcement. Perhaps since these companies have such
high market caps, the public doubts that this is a case of undervaluation and that it is instead
another sign like a company’s negative outlook on the future. Also since these large companies
are often perceived as the movers and shakers of the market, their decisions are sometimes seen
as representative of the market condition.
10 Large-cap companies had 0.0003 and mega-cap companies had 0.0004 increases.
18
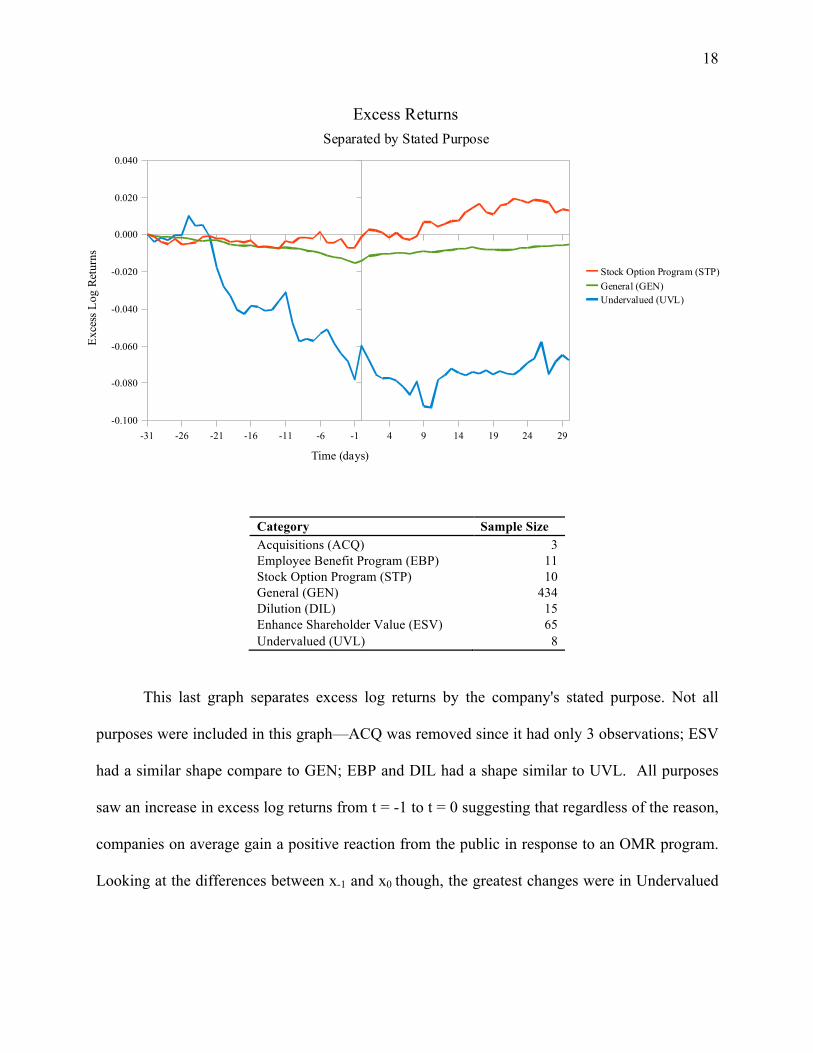
Category Sample Size Acquisitions (ACQ) 3 Employee Benefit Program (EBP) 11 Stock Option Program (STP) 10 General (GEN) 434 Dilution (DIL) 15 Enhance Shareholder Value (ESV) 65 Undervalued (UVL) 8
This last graph separates excess log returns by the company's stated purpose. Not all
purposes were included in this graph—ACQ was removed since it had only 3 observations; ESV
had a similar shape compare to GEN; EBP and DIL had a shape similar to UVL. All purposes
saw an increase in excess log returns from t = -1 to t = 0 suggesting that regardless of the reason,
companies on average gain a positive reaction from the public in response to an OMR program.
Looking at the differences between x-1 and x0 though, the greatest changes were in Undervalued
-31 -26 -21 -16 -11 -6 -1 4 9 14 19 24 29-0.100
-0.080
-0.060
-0.040
-0.020
0.000
0.020
0.040
Excess ReturnsSeparated by Stated Purpose
Stock Option Program (STP)General (GEN)Undervalued (UVL)
Time (days)
Exce
ss L
og R
etur
ns
19
(0.0183) and Stock Option Plan (0.0059) while the smallest change was in General (0.0014).
OMR programs that stated general as the purpose probably had a smaller effect since it does not
indicate the direction of a company and may actually show more pessimism than optimism in
outlook of the market and the company itself. This pessimism may have had a downward effect
on the market reaction to the announcement. On the other hand, OMR programs that state
undervalued often suggest positive private information about the company and that the public
should value it the security higher. Also when a company invests in stock option plans it shows
potential for growth and employee support which is also optimistic.
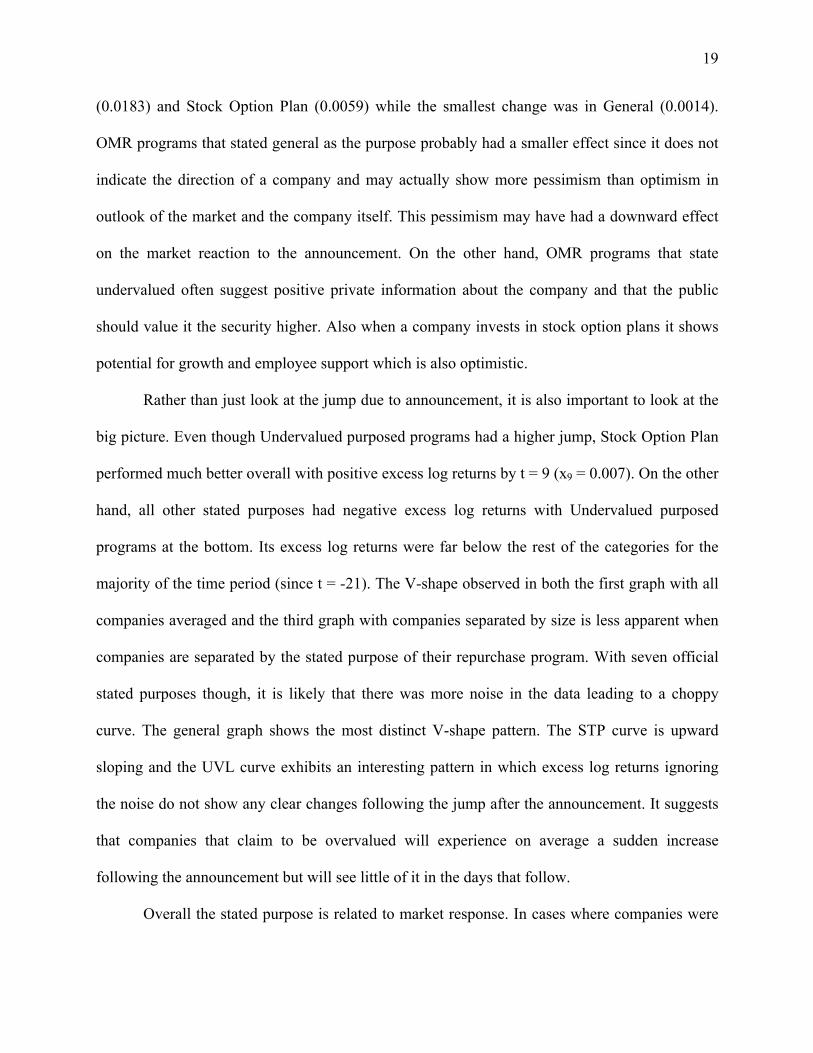
Rather than just look at the jump due to announcement, it is also important to look at the
big picture. Even though Undervalued purposed programs had a higher jump, Stock Option Plan
performed much better overall with positive excess log returns by t = 9 (x9 = 0.007). On the other
hand, all other stated purposes had negative excess log returns with Undervalued purposed
programs at the bottom. Its excess log returns were far below the rest of the categories for the
majority of the time period (since t = -21). The V-shape observed in both the first graph with all
companies averaged and the third graph with companies separated by size is less apparent when
companies are separated by the stated purpose of their repurchase program. With seven official
stated purposes though, it is likely that there was more noise in the data leading to a choppy
curve. The general graph shows the most distinct V-shape pattern. The STP curve is upward
sloping and the UVL curve exhibits an interesting pattern in which excess log returns ignoring
the noise do not show any clear changes following the jump after the announcement. It suggests
that companies that claim to be overvalued will experience on average a sudden increase
following the announcement but will see little of it in the days that follow.
Overall the stated purpose is related to market response. In cases where companies were
20
simply creating stock options, which in many ways is seen as a general company procedure, the
market responded positively following the undervaluation theory. However in cases where
companies did claim to be undervalued, the market responded a few days after the
announcement. This is interesting because the undervaluation theory fails in the light of a
company actually publicizing such a view. Despite the brief price jump, the excess log returns
actually decreased after the jump. In many ways companies that claim to be undervalued are
actually recognizing a decrease in value of their company and instead of building upon the
company’s capital, choose to spend their cash through repurchase programs. This supports the
negative outlook theory where the public responds accordingly to a pessimistic sign.
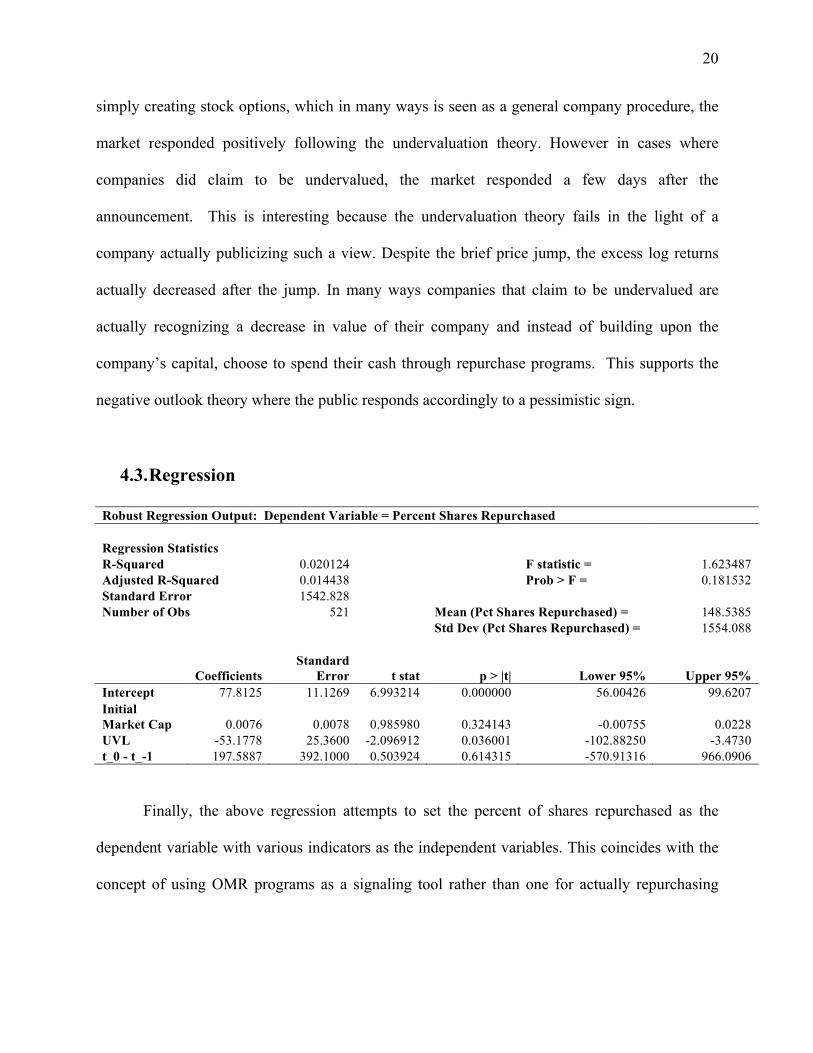
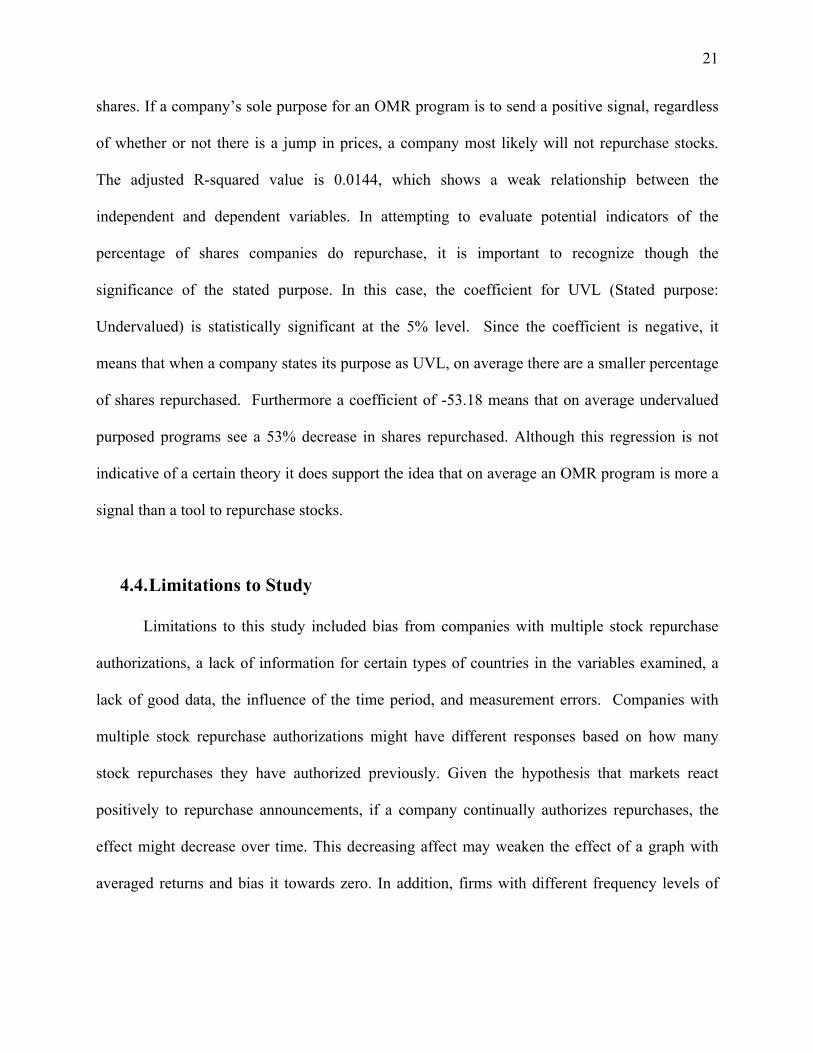
4.3. Regression
Robust Regression Output: Dependent Variable = Percent Shares Repurchased
Regression Statistics R-Squared 0.020124
F statistic = 1.623487
Adjusted R-Squared 0.014438
Prob > F = 0.181532 Standard Error 1542.828
Number of Obs 521
Mean (Pct Shares Repurchased) = 148.5385
Std Dev (Pct Shares Repurchased) = 1554.088
Coefficients
Standard Error t stat p > |t| Lower 95% Upper 95%
Intercept 77.8125 11.1269 6.993214 0.000000 56.00426 99.6207 Initial Market Cap 0.0076 0.0078 0.985980 0.324143 -0.00755 0.0228 UVL -53.1778 25.3600 -2.096912 0.036001 -102.88250 -3.4730 t_0 - t_-1 197.5887 392.1000 0.503924 0.614315 -570.91316 966.0906
Finally, the above regression attempts to set the percent of shares repurchased as the
dependent variable with various indicators as the independent variables. This coincides with the
concept of using OMR programs as a signaling tool rather than one for actually repurchasing
21
shares. If a company’s sole purpose for an OMR program is to send a positive signal, regardless
of whether or not there is a jump in prices, a company most likely will not repurchase stocks.
The adjusted R-squared value is 0.0144, which shows a weak relationship between the
independent and dependent variables. In attempting to evaluate potential indicators of the
percentage of shares companies do repurchase, it is important to recognize though the
significance of the stated purpose. In this case, the coefficient for UVL (Stated purpose:
Undervalued) is statistically significant at the 5% level. Since the coefficient is negative, it
means that when a company states its purpose as UVL, on average there are a smaller percentage
of shares repurchased. Furthermore a coefficient of -53.18 means that on average undervalued
purposed programs see a 53% decrease in shares repurchased. Although this regression is not
indicative of a certain theory it does support the idea that on average an OMR program is more a
signal than a tool to repurchase stocks.
4.4. Limitations to Study
Limitations to this study included bias from companies with multiple stock repurchase
authorizations, a lack of information for certain types of countries in the variables examined, a
lack of good data, the influence of the time period, and measurement errors. Companies with
multiple stock repurchase authorizations might have different responses based on how many
stock repurchases they have authorized previously. Given the hypothesis that markets react
positively to repurchase announcements, if a company continually authorizes repurchases, the
effect might decrease over time. This decreasing affect may weaken the effect of a graph with
averaged returns and bias it towards zero. In addition, firms with different frequency levels of
22
repurchases have different market reactions, as suggested by Jagannathan and Stephens (2001).
Even though sample size was greater than 500, most companies had middle or small as
their market cap and General as their motive. It limits our study cross-sectional comparisons
depend on an accurate representation of each type of firm. The graphs with smaller sample sizes
are much noisier and therefore slight changes in graphs are likely due to noise than a market
reaction. Furthermore, past studies used well over 1000 stock repurchases cases in order to have
an extensive analysis (See Chan, Ikenberry and Lee (2004)).
Lack of information is due to the use of Yahoo Finance an informative but entirely free
service that would most likely not contain as much information as a paid service. Some
companies did not show up on Yahoo Finance and were probably removed over time as Yahoo
found it no longer relevant. Yahoo Finance’s target audience is not academia but rather the
general public who is more interested in checking current prices and glancing at a few graphs.
The recessionary time period meant that companies were not going to perform well and
that weaker companies were more susceptible to sharp price changes for reasons other than a
stock repurchase authorization. Response may have been weakened simply because people have
become more risk averse following the financial crisis. Although macroeconomic effects should
have been accounted for in the formula and methodology, there may have been macroeconomic
shocks to specific industries. In many ways, the patterns observed in this study may be unique to
the time period and would face external validity issues if one expected to observe these patterns
in other time periods. In whole, this study may not be relevant for stock repurchases during other
time periods.
Finally, measurement accuracy depends on the quality of the databases. Particularly, the
observation of insider trading is contingent upon the accuracy of authorization dates and if they
23
truly can be used interchangeably with the concept of announcement dates. Although a
repurchase may have been authorized a certain date, it may not have been properly publicized
making the authorization date different from the announcement date effect. The use of a database
may be advanced but studies in the past that scanned the Wall Street Journal may have been
more accurate ensuring that these announcements were well publicized (See Vermaelen 1981).
Another source of measurement error would be the stated purpose. The title of the variable itself
implies the opportunity to manipulate public perceptions of the repurchase program. Companies
may choose to state a purpose different from their true purpose in order to portray a certain
image. For example, the data shows that companies that claim to be undervalued do not perform
as well as companies that choose other stated purposes. Also, the option of 'General' is a very
vague statement that does not actually explain a company’s purpose.
5. Conclusion
The previous graphs confirmed the undervaluation theory that immediately after a stock
repurchase announcement, companies experience on average an increase in excess log returns
portraying OMR programs as a positive signal. The opposing theory though, negative outlook,
was still represented in the data. Specific instances like mega-cap companies that are unlikely to
face undervaluation or companies that directly claim to be undervalued saw decreasing excess
log returns. Also, a major implication of the stock repurchase and macroeconomic environment,
the potential negative signal, was that the excess log returns in general were negative and prior to
the announcement, nearly all types of companies experienced decreasing excess log returns. .
Cross-company comparisons revealed statistical relationships between OMR programs and
24
market cap & stated purpose. Companies that stated their purpose as Undervalued saw little
increase following the price jump and eventual decrease from an announcement. This suggests
that announcements had a smaller positive effect on companies that publicly claimed to be
undervalued. Mega-cap companies actually saw slight decreases in excess log returns in the
same situation. And in contrast, to the general V-shape graph, mega-cap companies actually
announced repurchases when their excess log returns were increasing. Finally, this study
revealed the possibility of insider trading prior to stock repurchase announcements confirming
the idea that larger companies are on average face more insider trading.
5.1. Further Research
Further research could be conducted in this field by increasing the size of this study and
accounting for different variables that might affect public reaction to stock repurchase programs.
Increasing the size of the study would decrease the noise seen in the graphs. Relaxing further
constraints in searching for stock repurchases in the SDC platinum database would also allow for
a more thorough study of potential indicators of positive or negative response to repurchase
programs. Expanding the observed time period would be interesting in that the market reaction to
programs may have changed from past decades. For example, Vermaelen (1981) studied the
years between 1970 and 1978 and his graph showed constant excess returns following the
announcement date. The transfer of information in this decade is much faster than in past
decades due to technological innovations like the World Wide Web.
Other variables that can be examined include country, industry, and type of repurchase.
There have been studies on Japan and Canada in which companies are subject to different laws
25
on stock repurchase programs and publicity which could lead to a different market reaction. Just
as different industries have different rates of growth, they also might have different perceptions
by the public in regards to stock market repurchases. For example, industries like technology
tend to be seen optimistically with the potential for rapid growth. This makes it more likely that
a repurchase program is a positive signal. “Types of repurchases” refers to the fact that open
market repurchase programs are just one of many options a company has. Besides OMR, another
popular program is a tender offer program in which companies offer to repurchase shares at a set
price rather than the market price. These would all be interesting variables to examine because of
the potential for them to affect the magnitude and direction of market reaction by guaranteeing
actual stock repurchases.
Besides looking at other variables, further research can be conducted by essentially
changing the methodology of the study. This study observed a 62-day period, which revolved
around the announcement date. The v-shaped results suggest that if the prices continue to
increase at a steady rate, they may return to the same level as t= - 31 or have positive log excess
returns. A 60-day period is relatively small so a larger time period might expose a more
prominent pattern. For example, following the 30 days after a repurchase, excess returns may
also flatten out and remain constant. It would also be interesting to examine excess log returns
over the period of the authorized repurchase period as stated by the firm. Do excess returns
change as it draws closer to the end of a repurchase period?
Finally the last section of the results examined a regression looking at indicators of
percentage of stocks repurchased for OMR programs. There was only one variable that was
statistically significant therefore further research can be conducted to look at other possible
independent variables that would be statistically related to percentage of stocks repurchased.
26
5.2. Final Thoughts
Stock repurchase programs have grown extensively during the period between 2005 and
2010. Rather than serve simply as a tool to signal undervaluation, it reflects a pessimistic
macroeconomic situation of a period in which more companies are choosing to repurchase stocks
rather than invest in capital. Repurchases today still on average generate a positive jump in
excess log returns following the announcement date but when companies of different market
caps and stated purposes are evaluated closely, the extent of a positive market reaction varies
during the 30 days that follow. Furthermore, the pessimistic outlook theory is made most
apparent in mega-cap companies that are likely not undervalued and companies that claim to be
undervalued which draws suspicion.
This paper is unique in that it brings attention to two conflicting theories, particularly the
potential downward effect on repurchase announcements and examines the relationship between
two potential indicators and market response. Following 2010, stock market repurchases are
slowing down as can be seen by the downward sloping graph initially presented but there is a
wealth of data—different repurchase programs and many other potential indicators for that
period—yet to be examined.
27
References
Chan, Konan and David Ikenberry and Inmoo Lee. “Economic Sources of Gain in Stock
Repurchases.” Journal of Financial and Quantitative Analysis, 39 (2004), 17.
Jagannathan, Murali and Clifford Stephens. 2001. Motives for Multiple Open-Market
Repurchase Programs. Working Paper. Bringhamton University and University of
Missouri.
Silverblatt, Howard. “S&P 500 Stock Buybacks Retreat 66% in Fourth Quarter; Off 42% in
2008.” Standard & Poor’s Press Release June 18 2008.
Vermaelen, Theo. 1981. “Common stock repurchases and market signalling: An empirical
study.” Journal of Financial Economics, Elsevier, vol. 9(2), pages 139-183, June.