Embed Size (px)
Citation preview

Policy Resear_h
WORKING PAPERS
Financial Policy and Systems
Country Economics DepartmentThe World BankFebruary 1993
WPS 1084
Stock Market Developmentand Financial Deepeningin Developing Countries
Some Correlation Patterns
Dong Heand
Robert Pardy
Correlation analysis of cross-sectional data from 32 countriesfor 1984-90 shows a significant relationship between stockmarket development and financial depth. But time-series datafor 1978-90 show significant correlations only for Asian econo-mies.
PolicyResch Working Papers disseiinate the rmdings of work in progress and encougedie echangeof ideas arnongBani gtaff andall othern inwssted in developnme issues Thesepapers. distributodby theResek'chAdviswry Staff,carrythenarmes oftheauthors.reflectorly th eirviews, d should b a used and dted accordinsly The fuidings, itm crnentaions, and concusions an theauthors.own Theysholdnot be suributed to the World Bar&l, its Board of Diewtors, its management. or any of its memsber countries.
Pub
lic D
iscl
osur
e A
utho
rized
Pub
lic D
iscl
osur
e A
utho
rized
Pub
lic D
iscl
osur
e A
utho
rized
Pub
lic D
iscl
osur
e A
utho
rized
Pub
lic D
iscl
osur
e A
utho
rized
Pub
lic D
iscl
osur
e A
utho
rized
Pub
lic D
iscl
osur
e A
utho
rized
Pub
lic D
iscl
osur
e A
utho
rized

Policy Research
Financial Policy and Systems
WPS 1084
This paper-a product of the Financial Policy and Systems Division, Country Economics Department-is part of a larger effort in the department to promote the development of sound securities markets. Copiesof this paper are available free from the World Bank, 1818 H Street NW, Washington, DC 20433. Pleasecontact Priscilla Infante, room N9-005, extension 37665 (February 1993, 39 pages).
Programs to develop securities markets are now Asian countries, but not for other countries in thea common feature of World Bank financial sample. Also, the correlations of the Asian datasector loans. Stock market development in are strongest after the mid-1980s.particular is receiving considerable attention,especially the legal and institutional underpin- He and Pardy test a "threshold hypothesis"nings required for successfil stock market that a certain level of financial depth may bedevelopment. necessary to allow stock market development to
take off. They find that available data do notThe financial underpinnings needed have support the hypothesis.
received less study.The results suggest that financial depth is a
He and Pardy contribute to such a study by significant factor in stock market development inexploring the relationship between the degrees of most developing countries, but that country-financial depth and stock market development in specific factors (such as industrial policy andan economy. structure, foreign investment controls, and stock
market regulatory and operational infrastructure)Using a simple indicator of stock market have an equally strong influence on stock market
development and several indicators of l;.-ancial growth.depth, and using cross-sectional data from 32developing countries ror 1984-90, they find a Case studies of economies in which stockstrong correlation between the two factors. market development has been successful would
help elucidate the interplay between theseTime-series data from 19 of these countries factors.
(for 1978-90) show similar correlations for most
The Policy Research Working Paper Series disseminates the findings of work under way in the Bank. An objective of the seriesis to get these findings out quickly, even if presentations are less than fully polished. The findings, interpretations, andconclusions in these papers do not necessarily represent official Bank policy.
Produced by the Policy Research Dissemination Center

Country Economnics DepartnentThe World Bank
STOCK MARKET DEVELOPMENT AND FINANCIAL DEEPENINGIN DEVELOPING COUNTRIES:
SOME CORRELATION PATTERNS
Dong He and Robert Pardy

Table of Contents
1. Introduction ........................................ I
H. Data Sources and Compilation ........................... 2
HI. Cross-Country Correlations . ............ ................ 4
A. Correlations inthe Period 1984-1990 .... ................ 4
B. Correlations in the Period 1978-1990 .................... 5
IV. Time-Series Correlations .......... ............................. 6
V. Some Tentative Explanations for the Observed Patterns .......... 8
VI. Concluding Remarks ................................ . 12
References ................................... ......... 15
Appendix: Country List ................................... 16
Tables and Figures ....................................... 17

I. Introduction
This paper is an empirical study of the relationship between the development of stock
markets and the process of financial deepening. Specifically, it explores the correlation
pattern between measures of stock market development and the development of the financial
system in general.'
Fostering stock market development has become an important element in the World
Bank's financial sector operations. Structural adjustment loans now often contain conditions
related to capital market development, and the Bank provides technical assistance to many
member countries on the legal, regulatory and on other aspects of the institutional framework
for the development of stock markets. Also, governments in many developing countries have
adopted policies designed to promote stock market development.
But there may be a limit to the effectiveness of such policies when the financial depth
of an economy is limited and industrial development is primitive (Cho, 1992). The
development of the market requires well established industrial firms, sufficient savings and
developed financial intermediaries, as well as well established legal, accounting, monitoring,
and enforcement infrastructures.
The present paper seeks to explore the question of whether the degree of financial
depth is a constraining factor in the development of stock markets. Its basic finding is that
there is a significantly positive correlation between the level of stock market development
and financial depth in a cross section of countries. Time series analysis shows that the
1 Andrew Sheng originally suggested this topic and he, Yoon Je Cho andRoss Levine provided helpful comments on earlier drafts of the paper. Theresearch was undertaken by Dong He while a summer intern in CECFP under theguidance of Robert Pardy.
1

correlations are strong in the A.an economies but weak in other economies. We suggest that
individual case studies should be helpful for us to understand the time path of the
development of the stock markets in these economies. NWe also suggest some refinements to
the measurement of stock market development. The paper is divided into six sections.
Section II describes the data and variables used in the study, Section III reports the results of
cross-sectional analysis and Section IV reports the results of time-series analysis. Section V
offers some explanations for the observed patterns and Section VI provides some concluding
remarks.
II. Data sources and compilation
The data sample includes 32 developing economies which are l:sted in the appendix.
The sample is confined to the markets which are covered by the IFC Emerging Markets Data
Base (EMDB), which includes 20 markets in the IFC's Composite Index and another 12
markets not in the IFC's Composite Index.
"Stock market development" and "financial depth" are multi-faceted concepts and
there are a number of indicators which can be used to measure them. In this study, the ratio
of market capitalization to GDP (MCY) is used as a measure of the degree of development of
the stock market. Annual figures of market capitalization (as at end of year) are available in
the EMDB from 1977 for the 20 markets in the IFC's Composite Index, and from 1982 for
the other 12 markets not in the IFC's Composite Index. We use three indicators as base
measures of the depth of the financial system. The data for the variables were retrieved from
IFS data base.2 The three variables are:
M1Y: The ratio of MI to GDP. MI is the sum of currency held outside of banks and
demand deposits other than those of the central govemment (IFS line 34).
2The data for Taiwan are obtained from Statistical Yearbook of theRepublic of China 1991, Directorate-General of Budget, Accounting andStatistics, Executive Yuan, Republic of China.
2

-QMY: The ratio of Quasi-Money Liabilities of the monetary authorities and deposit
money banks to GDP. Quasi-Money Liabilities comprise time, savings, and foreign
currency deposits of resident sectors other than central government (IFS line 35).
DCPY: The ratio of Claims on the Private Sector by the Central Bank and Deposit
Money Banks (domestic credit to the private sector) to GDP (IFS line 32d).
M1Y is commonly used as a measure of monetary depth, and QMY is used here as a
measure of non-monetary financial depth. It would be more appropriate to include the quasi-
liquid liabilities of both banks and non-banking financial institutions (NBFIs) in order to
measure the overall financial depth of the economy. However, since data on the quasi-liquid
liabilities of NBFIs are not readily available for most of the economies under study, only
quasi-money is used. In addition, the ratio of claims on the private sector by the financial
system to GD)P is used both as a proxy for the size of bank assets and as an indicator of asset
distribution since it excludes financial credit to the government and publicly owned
enterprises (King and Levine, 1992). DCPY also measures the financing demands of the
private sector.
We include the variable GNP per capita (GNPCAP) as an indicator of the general
level of economic development. Relationships between this variable and other variables are
discussed.
Also following King and Levine (1992), the problem of deflating stocks (Market
Capitalization, MI, Quasi-Money, and DCP) - measured at the end of the period - by GDP
flow - measured over the period - is mitigated by using the arithmetic average of this year's
end-of-period and last year's end-of-period stock values. Thus, MCY in 1980 is the average
of MC in 1979 and 1980, divided by GDP in 1980.
3
III. Cross-Country Correlations between Period Averages of the Indicators of Financial
Depth and Stock Market Development
This section preserts correlations and graphs to highlight the relationship between
indicators of financial depth and stock market development. There are two sample periods
under consideration. One is from 1978 to 1990, and the sample for this period includes 20
economies which are constituents of the IFC's Composite Index. The other is from 1984 to
1990, and the sample for this period includes all 32 economies in the EMBD. Arithmetic
averages are taken for all the five variables over these two periods respectively.
A. Correlations in the period 1984-1990
The levels of financial depth, GNP per capita and stock market development vary
widely among the sample countries. But the level of stock market development has a much
larger variation among the countries than the variations in financial depth. Table 1 presents
the relevant uni-variate statistics3. This suggests that stock market development is affected to
a greater degree by country specific factors than are measures of financial depth.
In the richer developing economies (as defined by GNP per capita), financial depth
and the degree of stock market development are typically higher. Figures 1 and 2 show the
distribution of MCY and QMY across the countries. In the figures, the countries are
arranged in an ascending order from left to right according to the levels of GNP per capita.
It is clear that there is a rising trend in the two variables. In this period, on average
Malaysia, Kuwait, Taiwan, Jordan, Korea and Chile are the economies which have larger
stock markets.
Countries with more developed stock markets (in terms of MCY) also have more
financial depth as defined by the ratio of QMY to GDP or the ratio of MI to GDP. But the
3All tables and graphs are placed at the end of the paper.
4

development of the stock market appears to be more associated with non-monetary financial
depth than with monetary depth. Table 2 shows that the Pearson Correlation Coefficient is
significantly positive at 0.1% level foi 2MY, DCPY and GNPCAP, but not for M1Y (The
Coefficient is significantly positive at 3% for M1Y). This is consistent with the supposition
that the development of the stock market is accompanied by financial deepening. It is also
worth noting that the correlation is the strongest between MCY and DCPY, which means that
countries with more developed stock markets have financial systems that issue more credit to
the private sector as a share of GDP than countries with less well developed stock markets.
This implies that there may be a complementary rather than substitution relationship between
stock market development and
financial intermediary growth. That is, a more developed st3ck market would allow firms to
increase borrowing from financial intermediaries.
B. Correlations in the period 1978-1990
The same exercise as in the last sub-section is applied to the period 1978 to 1990, but
to a smaller sample size (19), based on data from the IFC's Composite Index4.
This second data se. confirms the two patterns previously identified: the variations in
the level of the stock market development across the countries are much larger than the
variations in the level of financial depth across the countries; and the correlation of MCY
with DCPY is the strongest among all the variables. These results are shown in Tables 3 and
4.
On the whole, the correlations in the period of 1978-1990 are weaker than those in
the period 1984-1990. The weaker correlations for the longer period may reflect the fact that
4 The data series is much shorter for Zimbabwe and is excluded from ouranalysis even though it is included in the Composite Index.
5

in the late 1970s and the early 1980s the pattern of nlovement of th6 stock market is very
different from that in the late 1980s.
Broadly speaking, there was a general upturn in the late 1980s in the size of the stock
markets in the economies uader study. Figures 3 to 6 show the movement of MCY over time
in these 19 economies grouped according to geographical areas. It can be seen from these
figures that the pattern of movement of Market Capitalization as a proportion of GDP varied
widely amon; ;t the 19 economies. In East Asian countries, the ratio remained rath - stable
before the mid 1980s, but there were a sharp rise in Taiwan and Korea, and a moderate
upturn in the Philippines from 1985. In South and South East Asia, the pattern of the
movement of MCY in Malaysia was distinctively different from others. It had a higher
starting point and it showed a discernible cyclical pattern. But the mid-1980s saw an uptum
of the sizes of the stock markets in all five economies in this group. The pictures in the other
two groups were more complicated.
The ratios had a much larger variation, especially in Latin America. But we can still see a
general rise in the sizes of the markets since the mid-1980s in nearly all the economies in
these two groups.
When the 1978-1990 period is divided into three sub-periods, the correlations in the
period 1986-1990 are much more significant than in the two previous periods. This is evident
from Table 5. We thus have to answer the question why there was a general upturn in the
size of these markets after the mid-1980s and the correlations with the indicators of financial
depth are more significant. Section V will provide some tentative explanations.
IV. Time-Series Correlations between the Indicators of the Development of the Stock Market
and Financial Deepening
This section analyses the correlations between MCY and other variables over time in
different economies. Since for the economies which are not included in the IFC's Composite
6

Index the data series available are too short, these economies are not dealt with in the
following analysis and only IFC's Index economies are included.5 The 19 economies are
grouped according to geographical areas and Tables 6 to 9 present the results of correlation
analysis, while Figures 7 to 10 show the distribution of MCY, M1Y, QMY and DCPY over
time in Korea, Malaysia, Chile and Greece, selected each from one group. For reference,
Figures 11 and 12 show the distribution of the four variables in the United States and Japan
from the early 1950s.
On the whole, the correlations in the Asian economies (except Pakistan and
Philippines) are much stronger than in the other economies. In fact, the contrast between the
Asian economies and the other economies is very dramatic. While the correlations are
significant for most of the variables in Korea, Taiwan, India, Indonesia, Malaysia and
Thailand, the correlations are not significant for most of the variables in other economies.
MIY remained relatively stable over time in most of the economies, while the
patterns of movement of the other three variables are more heterogeneous. In most of the
Asian economies (except in Pakistan and Philippines), there was an upward trend in MCY,
QMY and DCPY, and they were highly correlated. (In Indonesia, the stock market remained
very small until 1989, although a slight upward trend in MCY can be observed). On the
other hand, the upturn in MCY around 1986 was generally much more dramatic than the
increase in the indicators of financial deptn. In other economies, there was no consistent
pattern of movement in these variables. In Brazil, Chile, Colombia, Greece, Jordan, and
Philippines, while financial C:pth as measured by QMY has been increasing, there was no
apparent trend in MCY, and there was no consistent pattern in the movement of DCPY
either. For example, in Chile, the stock market declined continually in the early 1980s and
the direction was reversed in 1985, and the direction of the movement of domestic credit to
the private sector was exactly opposite.
5 Zimbabwe is aot included since the time series available is too shortfor statistical analysis.
7

The patterns of movement of the variables are very different over time in USA and
Japan as well. In Japan, there was an upward trend in all four variables, although MCY had
a much more dramatic increase in the 1980s. In the USA, there were an apparent u.pward
trend in QMY and DCPY, and a downward trend in M1Y. There was an upward trend in
MCY, but it was noticeably more volatile.
V. Some Tentative Explanations for the Observed Patterns
Two principal correlation patterns need explaining. First, while it is true that after
1986, in the economies which had higher income levels and higher financial depth, the stock
markets were typically larger or more developed, it was hardly true before 1986. This is
evident from the cross-country correlations between the indicator of the size of the stock
market (MCY) and the indicators of financial depth and GNP per capita, which are positively
significant more for the period 1986-1990 than for the two previous periods. Second, over
time the correlations are not significant except for the Asian economies. While we observe
that in most of the Asian economies there was an upward trend in all the variables, in the
other economies the patterns of movement of the variables were more heterogeneous and
there was no consistent pattem among them. These two points are discussed in turn below.
Explanations for the First Correlation Pattern
One possible explanation for this correlation pattern is that the mid-1980s was a
turning point for the economies which had a higher subsequent growth of the size of the
stock market. One such turning point could be that there was a threshold leve! of income or a
threshold level of financial depth reached in the mid-1980s abovw which the development of
the stock market took off. If this was the case, before the mid-1980s, the stock market would
remain small and inactive even though the levels of income and financial depth had been
rising. We would thus observe a poor correlation between stock market development and
financial deepening across countries. Around the mid-1980s, when the thresholds of
economic development and financial deepening were reached and the stock markets began to
8

take off, countries which had higher levels of economic development and financial deepeningwould generally have larger stock markets and we would observe a higher correlation
between the variables.
If the threshold hypothesis were true, one might expect to observe about the same
levels of financial depth and income in the economies where the stock markets had a general
upturn in the mid-1980s. In reality, as measured in 1985, the levels of income and financial
depth varied widely across the countries. This is evident from Figures 14 and 15 which show
the levels of QMY and DCPY in 1985 and the level of GNP per capita in 1985 respectively.
The patterns emerging from these figures do not seem to support the threshold hypothesis.
However, several difficulties make the threshold hypothesis almost untestable. One is
that it is difficult to determine whether the upturn in the size of the market around the mid-1980s was actually a take-off. In order to identify the take-off points, to determine whether
there exist threshold levels of income and financial depth and to identify what the threshold
levels are, it is necessary to have a long enough time series. The time series we have are
apparently too short for such an exercise. As a further test, it would be revealing to compare
the levels of economic development and financial deepening in the developed economies at
the time when there were a broad upturn in the size of their stock markets. But even for the
developed economies, the test is difficult to conduct because of lack of data. Figure 13 shows
the movement of MCY in the United States from 19296. In 1929, the United States had a
MCY of more than 60% and GNP per capita in 1982 constant prices was already US$5834.
It is thus necessary to trace back much earlier, probably back to the end of last century when
the major developed economies had a rise of the stock market. But data are very difficult to
obtain for that early period.
6 The figures of market capitalization before 1983 were those of the NewYork Stock Exchange, while the figures after 1983 were those of all UnitedStates.
9

A second difficulty lies in the measurement of the levels of income and financial
depth. What are usually available are the notional levels of income and financial depth. But it
may be more appropriate to use the figures of levels of income and financial depth in the city
where the stock market is located, since the financial centres where the stock markets are
usually located tend to have much higher levels of income and better financial infrastructure
than the national average. For example, when analyzing the causal factors behind the
development of the stock imiarket in India, it may be more appropriate to examine the
economic situation in Bombay rather than in India as a whole.
A third difficulty, which is more fundamental, is that reaching the threshold levels
may only be a necessary but not a sufficient condition for the rise of the stock market. This
would imply that although some economies might have reached the threshold levels a long
time back the stock market could have remained dormant for various other reasons, and on
the other hand, the market could take off in response to other factors long after the threshold
levels had been reached. Thus there is no reason why we should expect to observe about the
same levels of financial depth and income in the economies where the stock market had a
general upturn in the mid-1980s.
An alternative to the threshold hypothesis would be one which emphasizes institutional
changes occurring in the mid-1980s. One such institutional change was a net increase of
international capital flow into those Asian economies in which we observe the take-off of
stock markets and more general financial deepening. This capital inflow first took the form
of direct foreign investment. After the Plaza Accord of 1985, the price competitiveness of
the NIEs (Korea, Taiwan, Hong Kong and Singapore) was very much strengthened, since
their exchange rates in effect depreciated substantially against the Japanese yen and major
European currencies. As a result, Japanese export-oriented industries began transferring
manufacturing facilities to NIEs by direct investment. The volume of direct investment from
Japan to NIEs increased nearly by five-fold during the period 1985-1988 (Watanabe, 1991).
And since 1987, there has been a net increase of direct investment from these NIEs to the
economies which belong to ASEAN (Indonesia, Malaysia, Philippines and Thailand), in
10

response to the relative decline of'competitiveness in the NIEs. In 1988, the volume of direct
investment from NIEs to ASEAN exceeded that from Japan to ASEAN (Watanabe, 1991). A
consequence of these net capital inflows appears to be stimulation of the equity markets. The
sharp rise of the stock markets in Korea and Taiwan was around 1986, while the big boom
of the markets in Indonesia, Malaysia, Philippines and Thailand began in about 1988,
coinciding in each case with the upturn in foreign investment.
Another channel of capital inflow is through portfolio investment in the form of
country funds. For example, in 1984, the first country fund, the Korea Fund, Inc., was listed
on the New York Stock Exchange, with an initial value of $60 million. Since then, many
local, regional, and global funds have been launched in international markets. Favorable
treatment with regard to taxation and foreign exchange control was implemented in some of
the countries and consequently these funds became very popular among international
investors. Since it is more likely that these investors would invest in the equity markets of
those economies which had better financial infrastructures, and conversely, the development
of the equity markets would tend to increase the demand for other financial services, the
development of the financial markets in general and equity markets in particular would tend
to go hand in hand in these countries.
Explanations for the Second Correlation Pattern
The lack of correlations between MCY and indicators of financial depth in most of
the non-Asian economies over time may be due to two reasons. One is the effect of inflation.
Table 10 shows the period averages of annual rates of inflation in the 20 economies under
study. It is clear that the rates of inflation were much higher in Latin American economies.
High inflation tends to introduce distortions and instability into our variables, since these
variables are calculated by taking the averages of year-end values of stock variables and then
dividing by a flow variable. In addition, high inflation could have opposite effects on MCY
and QMY. While domestic equity investments can be more attractive in an environment of
high inflation, quasi-money assets (which are generally fixed interest instruments) are likely
11

to be less attractive.7 The power of correlation analysis could be reduced as a result of these
distortions.
The other reason for the lack of correlation could be that the time period under
consideration is relatively too short. Since share prices can be very volatile in a short time-
span, market capitalization can also be very volatile. Thus the relationship between financial
deepening and stock market development is unlikely to be stable in the short term. This
would suggest that it is necessary to use a longer time period for the data series in order forthe short-term fluctuations to be canceled out. However, Figu.e 13 shows that MCY in the
United States had very large cyclical movements over a period of more than 60 years. The
correlations between MCY and the indicators of financial depth in USA were unlikely to be
high even for this 60 year data series8. It is thus difficult to form a conclusive view.
VI. Concluding Remarks
Results from correlation analysis on cross-sectional data for the period 1978-1990
show that there is a significantly positive correlation between the indicator of stock market
development, Market Capitalization as a proportion of GDP, and indicators of financial
depth. Breakdown of the time period shows that the correlations are strongest during the late
1980s, which may be explained by the fact that there was a substantial increase in foreign
investment in that period into the equity markets of those economies which had better
developed financial infrastructure.
7Although this argument is plausible in theory, it is not supported byall country experiences. Careful examination of the figures depicting themovements of financial variables over time reveals that the directions ofmovements of these variables were sometimes opposite to what this argumentwould predict. This could be the result of other mechanisms which offset theeffects of inflation but we have identified no consistent pattern.
8It can be seen from Figure 12 that the correlations in the period 1951-1991 were very poor in the United States.
12

However, results from correlation analysis on time-series data show that apart from
the Asian economies, the colTelations are not significant. Hyper-inflation in the Latin
American economies may have reduced the power of correlation analysis because of the
distortions it introduced into the variables we constructed. Also the time series available are
for a relatively short period and stock price volatility may have distorted the findings.
The results of cross-sectional and time-series analysis can be reconciled in that there
might be bounds of variation of MCY. Although over time MCY fluctuated widely and there
was poor correlation with the indicators of financial depth, these variations were bounded to
a certain extent so that the means of MCY in that period of time still reflected the relative
size of the market. Thus cross-sectionally, we can still observe high correlations between
MCY and other indicators of financial depth. That is to say, in the economies which had
better developed financial system, although the stock market fluctuated widely thus making
the correlations over time poor, the means of MCY in these economies were still higher
because the stock markets were larger and better developed.
A threshold hypothesis of stock market development proves to be difficult to test due
to several factors. It is thus difficult to tell at one particular time whether one economy has
fulfilled the necessary conditions for the development of its stock market. All we can say is
that when an economy is well equipped with financial infrastructure it may have a better
chance of attracting new capital into its equity market.
This paper has established some stylized facts concerning the relationship between the
development of the stock market and the process of financial deepening. It would be helpful
for future research in identifying the conditions for the development of the stock market if a
wider range of data was considered. Firstly, detailed case studies would be useful for
identifying country-specific factors which may affect the course of development of the stock
market. For example, examination of the general financial conditions should be supplemented
by considering the role of industrial structure, foreign investment and stock market
regulatory policies. Secondly, indicators of the development of the stock market such as
13

market capitalization should be supplemented by others such as turnover ratio, market
concentration ratio, as well as primary market data such as the volume of initial public
offerings and rights issues. In addition, the overall significance of the stock market could be
indicated by the share of the output and profits contributed by companies listed on the stock
exchanges in those of the whole economy.
14

References
Cho, Yoon Je, "Capital market development: conceptual issues and policy options",
background paper prepared for Internal Training Course on Promoting Capital Market in
LDCs, April 1992, CECFP.
Dailami, Mansoor and Atkin, Michael, "Stock Markets in Developing Countries: Key Issues
and a Research Agenda", World Bank Working Papers, October 1990, WPS 515.
Goldsmith, Raymond W., Financial Structure and Development, New Haven and London:
Yale University Press, 1969.
King, Robert G, and Levine, Ross, "Financial Indicators and Growth in a Cross Section of
Countries", World Bank Working Papers, January 1992, WPS 819.
Pardy, Robert, "Institutional Reform In Emerging Securities Markets", World Bank Working
Papers, May 1992, WVPS 907.
Watanabe, Kenichiro, "Financial reform in Asian economies and its implications", mimeo.
The Bank of Japan, January 1991.
15

Appendix 1
Country List
ARG Argentina MYS Malaysia
BGD Bangladesh MEX Mexico
BRA Brazil MAR Morocco
CHL Chile NGA Nigeria
COL Colombia PAK Pakistan
CRI Costa Rica PER Peru
CIV Cote d'Ivoire PHL Philippines
EGY Egypt PRT Portugal
GDC Greece LKA Sri Lanka
IND India OAN Taiwan, China
IDN Indonesia THA Thailand
JAM Jamaica TTO Trinidad/Tob.
JOR Jordan TUR Turkey
KEN Kenya URY Uruguay
KOR Korea VEN Venezuela
KWT Kuwait ZWE Zimbabwe
16

Table 1 Uni-variate Statistics
for Variables Averaged over the Period 1984-1990
Variables N Mean Std Dev Coe. of Variation Minimum Maximum
MCY 32 0.137 0.175 1.277 0.004 0.680M1Y 32 0.159 0.106 0.667 0.049 0.472QMY 32 0.269 0.188 0.699 0.044 0.752DCPY 32 0.306 0.201 0.657 0.063 0.924GNPCAP 32 2055 2746 1.336 168 15177
Table 2 Correlation Analysis for the period 1984-1990
Pearson Correlation Coefficients / Prob > I R I under Ho: RhO=0 / N=32
MCY
M1Y 0.3970.0245
QMY 0.7040.0001
DCPY 0.8390.0001
GNPCAP 0.5520.0010
17

Table 3 Uni-variate Statisticsfor Variables Averaged over the Period 1978-1990
Variables N Mean Std Dev Coe. of Variation Minimum Maximum
MCY 19 0.134 0.160 1.194 0.006 0.565MIY 19 0.161 0.109 0.677 0.060 0.466QMY 19 0.244 0.164 0.672 0.031 0.584DCPY 19 0.305 0.162 0.531 0.110 0.617GNPCAP 19 1821 1206 0.662 298 4266
Table 4 Correlation Analysis for the Period 1978-1990
Pearson Correlatio Coefficients / Prob > I R I under H0: Rho=0 / N= 19
MCYMIY 0.513
0.0246
QMY 0.6300.0039
DCPY 0.7740.0001
GNPCAP 0.2420.3183
18

Table 5 Correlation Patterns in Three Sub-periods
Pearson Correlation Coefficients / Prob > I R I under H0: RhO=O / Number ofobservations
1978-1980 1981-1985 1986-1990MCY MCY MCY
M1Y 0.322 0.482 0.5930.2072 0.0366 0.0095
17 19 18
QMY 0.358 0.399 0.7480.1580 0.0904 0.0004
17 19 18
DCPY 0.464 0.542 0.8860.0603 0.0166 0.0001
17 19 18
GNPCAP 0.192 0.099 0.4670.4757 0.6971 0.0509
17 18 19
19

Table 6 Correlation Analysis for the Economies in East Asia 1978-1990
Pearson Correlation Coefficients / Prob > R I under Ho: Rh0=0 / Number ofObservations
Korea Philippines TaiwanMCY MCY MCY
M1Y -0.228 0.448 0.8980.4145 0.0943 0.0001
15 15 14
QMY 0.727 0.353 0.7870.0022 0.1963 0.0008
15 15 14
DCPY 0.62873 -0.479 0.9310.0121 0.0710 0.0001
15 15 14
GNPCAP 0.886 0.380 0.9120.0001 0.1625 0.0001
14 15 14
20

Table 7 Correlation Analysis for the Economies in South Asia 1978-1990
Pearson Correlation Coefficients / Prob > I R I under HE,: Rh0=0 / Number ofObservations
India Indonesia Malaysia Pakistan ThailandMCY MCY MCY MCY MCY
M1Y 0.238 0.629 0.708 0.641 -0.2440.4563 0.0213 0.0068 0.0101 0.4005
12 13 13 15 14
QMY 0.696 0.739 0.599 -0.617 0.6830.0119 0.0039 0.0306 0.0142 0.0069
12 13 13 15 14
DCPY 0.657 0.813 0.731 0.351 0.7670.0202 0.0007 0.0045 0.1997 0.0006
12 13 13 15 14
GNPCAP 0.800 0.212 0.930 0.528 0.8870.0018 0.4860 0.0001 0.0433 0.0001
12 13 13 15 14
21

Table 8 Correlation Analysis for the Economies in Latin America 1978-1990
Pearson Correlation Coefficients / Prob > I R I under H0: Rh0=0 / Number ofObservations
Argentina Brazil Chile Colombia Mexico VenezuelaMCY MCY MCY MCY MCY MCY
M1Y -0.318 0.585 -0.096 0.707 -0.003 -0.6040.3136 0.0982 0.7557 0.0222 0.9916 0.0376
12 9 13 10 12 12
QMY -0.603 -0.420 0.205 -0.833 -0.529 0.3750.0378 0.2599 0.5008 0.0028 0.0769 0.2295
12 9 13 10 12 12
DCPY 0.233 0.767 -0.500 -0.875 0.412 -0.6480.4659 0.0160 0.0818 0.0009 0.1837 0.0226
12 9 13 10 12 12
GNPCAP 0.074 -0.257 0.387 -0.539 -0.364 -0.6370.8181 0.4458 0.1909 0.0703 0.2453 0.0258
12 11 13 12 12 12
22

Table 9 Correlation Analysis for the Economies in Europe/Mideast/Africa 1978-1990
Pearson Correlation Coefficients / Prob > I R I under HO: Rh0 =0 / Number ofObservations
Greece Jordan Nigeria Portugal TurkeyMCY MCY MCY MCY MCY
M1Y 0.700 0.388 0.109 -0.504 -0.6270.0053 0.2126 0.7220 0.0789 0.0291
14 12 13 13 12
QMY -0.284 0.123 0.425 -0.245 0.4850.3247 0.7042 0.1474 0.4199 0.1102
14 12 13 13 12
DCPY -0.264 0.238 0Q222 -0.744 0.0020.3615 0.4564 0.4655 0.0035 0.9960
14 12 13 13 12
GNPCAP 0.126 -0.962 0.066 0.896 0.6290.6664 0.0021 0.8312 0.0001 0.0283
14 6 13 13 12
23

Table 10 Annual Rate of Inflation
(period averages, %)
Country 1979-1980 1981-1985 1986-1989
Latin AmericaArgentina 145.26 382.39 1191.63Brazil 58.06 153.86 1056.40Chile 36.21 21.49 19.42Colombia 23.01 22.39 25.05Mexico 20.67 62.38 75.78Venezuela 13.67 11.12 38.84Averages for the area 49.48 108.94 401.19
East AsiaKorea 20.47 7.34 5.45Philippines 14.36 21.36 7.93Taiwan 11.51 4.09 2.21Averages for the area 15.45 10.93 5.20
South AsiaIndia 6.71 9.35 8.41Indonesia 14.13 9.74 7.40Malaysia 5.06 4.69 1.80Paldstan 8.78 7.20 6.78Thailand 12.51 4.99 3.89Averages for the area 9.44 7.19 5.66
Europe/Mideast/AfricaGreece 18.82 20.67 17.41Jordan 10.76 5.4 9.66Nigeria 14.46 19.75 25.87Portugal 20.98 23.30 11.33Turkey 71.38 38.43 54.48Zimbabwe 9.74 15.11 12.89Averages for the area 24.36 20.44 21.94
24

Figure 1 MCY across CountriesAverages for the period 1984-1990
0.7-
+
0.6-
++
0.5
0.41
03 0.3-
0.2-
0.1+ + + +
+++ + + + + + + +
+ + + +I I I I I I I I II I I I I I I I I I I I I I I I
BGD KEN LKA IDN ZWE CIV THA JAM COL CHL JOR MEX ARG VEN GRC OANIND PAK NGA PHL EGY MAR PER TUR CRI BRA URY MYS PRT KOR TTO KWT
country

Figure 2 QMY across CountriesAverages for the period 1984-1990
0.8-
+
0.71
0.6- +
0.5- + +
a + 04_ + +a
0.3- ++++ ~~~~~~~~~~~~
+ +
0.2- + ++ + +
0.1 +++
BGD KEN LKA IDN ZWE CIV THA JAM COL CHL JOR MEX ARG VEN GRC OANIND PAK NGA PHL EGY MAR PER l1UR CRI BRA URY MYS PRT KOR TTO KWT
country

Figure 3 East AsiaThe Movement of MCY over time
1.4
1.2
0.8-
0.6-
0.4
0 .2 - ............ .......
.... ~~~~~~~~~~~~~~~~.....
NG~~~~0 1 / I
1977 1978 1979 1980 1981 1982 1983 1984 1985 1986 1987 1988 1989 1990 1991
year
- Korea Philippines Taiwan l

Figure 4 South AsiaThe Movement of MCY over time
0.8
0.64
6.2~~~~~~~~~~~~~~~~~~~~~~~~~~~~~~~~~~~~~~~~~~~~~~~~~~~~~~~~~~~~~~~~~~~~~~~~~~~~~~~~~~~~~~~~~~~~~~~~~~~~~~~~~~~~~~~~~~~~~~~~~~~~~~~~~~~~~~~~~~~~~~~~~~~~~~~~~~~~~~~~~~~~~~~~~~~~~~
04-
1977 1978 1979 1980 t981 1982 1983 1984 1985 1986 1987 1988 1989 1990
year
-8-- India + Indonesia *K Malaysia
-H-- Pakistan -X- Thailand

Figure 5 Latin AmericaThe Movement of MCY over time
0.7
0.6
0.5
o.4I
0.3
0.
0.1C
_1 W- -------w--~~~- - -~-'----.__-' -,-_ -5* --y >e '''''''' ,----------- ~ ~ ---
O-|| _|I{tI I I Il I I I1977 1978 1979 1980 1981 1982 1983 1984 1985 1986 1987 1988 1989 1990 1991
year
Argentina - Brazil - Chile
------- Colombia ------- Mexico Venezuela
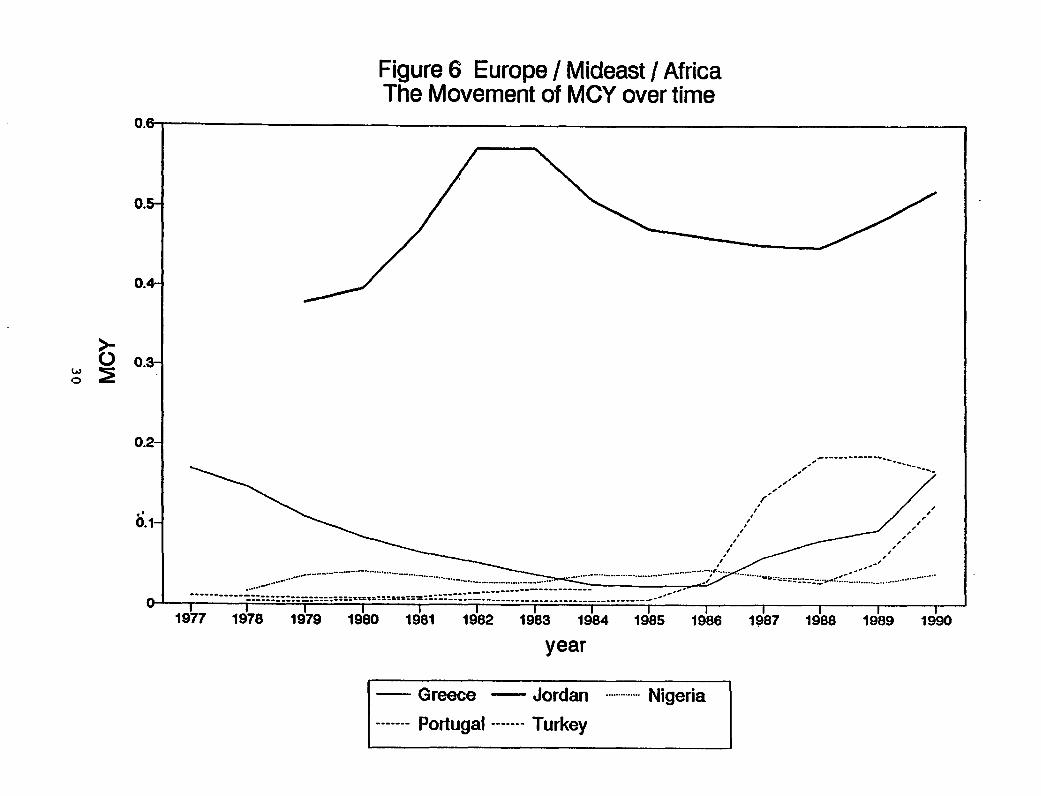
Figure 6 Europe / Mideast I AfricaThe Movement of MCY over time
0.6-
0.5
0.4
8 0.3-
0.2-
0.1-
…-----c. . ---
1977 1978 1979 1980 1981 1982 1983 1984 1985 1986 1987 1988 1989 1990
year
Greece -Jordan .- Nigeria
- Portugal------ Turkey

Figure 7 KoreaMOY, MlY, QMY and DCPY overtime
0.8-
0.5
0~.4
0.4 ........- MY M...............
0.2 ..... ..............
0.1-
1976 1977 1978 1979 1980 1981 1982 1983 1984 1985 1986 1987 1988 1989 1990 1991
year
j-MCY -M1 Ql ....... MY ---- DCPY

Figure 8 MalaysiaMCY, M1Y, QMY and DCPY over time
0.9
0.8-
07
0.61:
~0.5
0.4B~~~~~~~~~~~~~~~~~~~~~~~~~~~~~~~~~~~~~~........ .. ..'.....
0.3-
0.2-
0.1* I1976 1977 1978 1979 1980 1981 1982 1983 1984 1985 1986 1987 1988 1989 1990
year
| MCY -M1Y . QMY --- DCPY

Figure 9 ChileMCY, M1Y, QMY and DCPY overtime
| MCYM1Y -QMY-------DCPY
0.7-
0.7 . -- - … -
0. I
0.4
0.2-
0-1979 1980 1981 1982 1983 1984 1985 1986 1987 1988 1989 1990 1991
year
j MCY - M1Y Q....... MY ---- DCPY

Figure 10 GreeceMCY, M1Y, QMY and DCPY overtime
0.5.
0.45.
g H ,- . _ , E~~~~~~~~~~~~~~~~~~~~~~~~~~~~~~~~~~~~~~~~~~~~~~~~~~~~~~~~~~~~~~.... ...
0.4.
> 0.3-
0 ......-
0- ,. -
1 0.25 1
MCY -----------~0.2-
0o.15
0.1-
*0.05
1976 1977 1978 1979 1980 1981 1982 1983 1984 1985 1986 1987 1988 1989 1990
year
MCY M1Y ..... QMY ----DCPYI

Figure 11 JapanMCY, M1Y, QMY and DCPY overtime
1.4
1.2
EL
@>0.6
1-952 1954 1956 1958 1960 1962 1964 1966 1968 1970 1972 1974 1976 1978 1980 1982 1984 1986 1988
1953 1955 1957 1959 1961 1963 1965 1967 1969 1971 1973 1975 1977 1979 1981 1983 1985 1987 1989
year
| 0. --MCY - --- -Q..MY -^--…- DCPY

Figure 12 USAMCY, M1 Y, QMY and DCPY over time
0.9-
0.7-~~~~~~~~~~~~~~~~~~~~~~~~~~~~~~~~~~~~~~~~~~~~~~~~~~~~~~~~~~~~~~~~~~~~~~~~~~~~~~~~~I
0.6-~~~~~~~~~~~~~~~~~~~~~~~~~~~~~~~~~~~~~~~~~~~~~~~~~~~~~~~~~~~~~~~~~~~~~~~~~'.
0.8
> a i 4: - . . : !~~~~~~~~~~~~~~~~~~~~~~~~~~~~~~~~~~~~~~~~~~~~~~~~~~~~~.... .
04 ..... . .... .. ... ....
0.7-
o0.2
0.1 . ...............................
o
1951 1953 1955 1957 1959 1961 1963 1965 1967 1969 1971 1973 1975 1977 1979 1981 19831952 1954 1956 1958 1960 1962 1964 1966 1968 1970 1972 1974 1976 1978 1980 1982 1984
year
MCY -M1y QMY ---- DCPY

Figure 13 USAThe Movement of MCY from 1929 to 1991
0.8-~
0.6~~~~~~~~~~~~~~~~~
..
............
..
.... ... .....................
0 .68
. . . , ...................... . . . . .............. . . ,. ........ ............ ................. ___. .. . . .. .....
.... . ............................. ...... ..... ............
........................................ ... ..
00 .5 . .....
.......... ................-.....................................
0.4- .*
-..-.-.'/ 'B
111
W
;' ;>
0.3-
.......................................
..
..........................
..... ........
.........1929 1935
1941 1947
1953 1959
1965 1971
1977 1983
1989
1932 1938
1944 1950
1956 1962
196 1974
1980 1986
year

Figure 14 GNP per capita in 1985in US$ at 1987 constant prices
5000--
4500-
4000-
3500-
*-3000-oc~j2500-
0L0LZ 2000-
100-
100-
50
AR CHL GRC 'IND' 'KOR MYS' AN PHL 'THAI VENBRA COL IDN JOR MEX NGA PAK PRT TUR ZWE
country

Figure 15QMY and DCPY in 1985
0.7-
0.6-
0.5-
0.4-
~0.3-
0.2-
0.1-
ARO CL GR IDN KOR' MYS 'OAN' PHL' THA' VNBRA CHL IND JOR MEX NGA PAK PRT TUR ZWE
country
QMY LZ] DCPY

Policy Research Working Paper Series
ContactTitle Author Date for paper
WPS1 072 Costs of Alternative Treatments for Brooke R. Johnson January 1993 0. NadoraIncomplete Abordlon Janie Benson 31091
Janet BradleyAurora Rabago OrdofhezCatia ZambranoLeonard OkokoLeticia Vazquez ChavezPaulina QuirozKhama Rogo
WPS1 073 Fiscal Aspects of Developing Peter J. Montiel January 1993 R. VoCountry Debt Problems and Debt-Service 31047Reduction Operations: A ConceptualFramework
WPS1074 How Moving to World Prices Affects David G. Tarr January 1993 N. Artisthe Terms of Trade in 15 Countries 38010of the Former Soviet Union
WPS1 075 Many Paths to Skilled Employment: Adrian Ziderman January 1993 PHREEA Reverse Tracer Study of Eight Robin Horn 33680Occupations in Colombia
WPS1 076 A Presumptive Pigouvian Tax on Gunnar S. Eskeland January 1993 C. JonesGasoline: Analysis of An Air Pollution 37699Control Program for Mexico City
WPS1 077 Risk Management Prospects for Panos Varangis January 1993 D. GustafsonEgyptian Cotton Elton Thigpen 33714
Takamasa Akiyama
WPS1 078 The Evolution of Welfare and Poverty Christiaan Grootaert January 1993 E. VitanovUnder Structural Change and Economic 38400Recession in Cote d'lvoire, 1985-88
WPS1 079 How Useful Are Integrated Household Christiaan Grootaert January 1993 E. VitanovSurvey Data for Policy-Oriented 38400Analyses of Poverty? Lessons fromthe C6te d'lvoire Living Standards Survey
WPS1080 A New Regional Price Index for C6te Christiaan Grootaert January 1993 E. Vitanovd'lvoire Using Data from the Ravi Kanbur 38400Intemational Comparisons Project
WPS1081 Correcting for Sampling Bias in the Lionel Demery January 1993 E. VitanovMeasurement of Welfare and Chrstiaan Grootaert 38400Poverty: The Case of the Cote d'lvoireUving Standards Survey

Pollcy Research Working Paper Series
ContactTitle Author Date for paper
WPS1 082 What Do Governments Buy? The Shantayanan Devarajan February 1993 C. JonesComposition of Public Spending and Vinaya Swaroop 37699Economic Performance Heng-fu Zou
WPS1083 Finance and Growth: Schumpeter Robert G. King February 1993 D. EvansMight Be Right Ross Levine 38526
WPS1084 Stock Market Development and Dong He February 1993 P. InfanteFinancial Deepening in Developing Robert Pardy 37665Countries: Some Correlation Patterns