Embed Size (px)
Citation preview
1
Stirling Community Planning Partnership
Single Outcome Agreement
2013 – 2023
Final approved working version
September 2013

2
3
Contents:
1. Introduction....................................................................................5
2. How We Want To Work..................................................................6
3. Planning our Outcomes ................................................................7
4. An Understanding of Stirling........................................................9
5. Our Outcomes..............................................................................14
6. Prioritising Prevention and Intervention ...................................15
7. Engaging and Empowering Communities.................................17
8. Contributing to Scotland.............................................................19
9. Monitoring our Performance ......................................................22
10. Conclusion ...................................................................................24
Appendices ..........................................................................................25

5
1. Introduction
1.1. This Single Outcome Agreement represents the strategic framework for the collective reform of public services in Stirling. It prioritises the main changes that need to be made in Stirling’s communities over the next ten years, and commits community-planning partners to harnessing collaborative effort, in partnership with our communities, to delivering the step change required.
1.2. The National Statement of Ambition for Community Planning stated that effective community planning arrangements must be at the core of public service reform. It also maintained that community planning and Single Outcome Agreements will provide the foundation for effective partnership working within which wider reform initiatives, such as the integration of health and adult social care, and the establishment of single police and fire services will happen.
1.3. Scottish Government and the Convention of Scottish Local Authorities (COSLA) expect Community Planning Partnerships, through their Single Outcome Agreements, to mobilise public sector assets, activities and resources, together with those of third and private sectors, to deliver a shared, binding ‘plan for place’.
1.4. This Single Outcome Agreement is based on an understanding of the needs and aspirations of Stirling communities. It will be implemented through a series of annual action plans for each of our priority prevention and intervention areas, that will be developed alongside our communities and will show how all partners, including communities themselves, can contribute to progress.
1.5. This Single Outcome Agreement is binding upon those community planning partners who have signed below.
Stirling Council NHS Forth Valley
Scottish Fire and Rescue Service: Stirling and Clackmannanshire Division
Police Scotland: Forth Valley Division
Stirlingshire Voluntary Enterprise Forth Valley College
Scottish Government TACTRAN
Loch Lomond and the Trossachs National Park
Scottish Environmental Protection Agency
Scottish Natural Heritage University of Stirling
Skills Development Scotland Jobcentre Plus
Scottish Enterprise Historic Scotland
6
2. How We Want To Work
2.1. Stirling Community Planning Partnership will be an inclusive, equitable and accountable Partnership that leads change to deliver improved outcomes for Stirling’s communities, particularly those where inequalities are most evident.
2.2 We are committed to essential change to improve wellbeing, and to enabling the capacity of communities, families and individuals to deliver change in their own communities, working alongside effective and efficient public services when required.
2.3 We will gather evidence and analyse data, experience and trends regularly to more fully understand the needs of our communities, and the changing public sector landscape in which services are delivered
2.4 We will establish outcomes and measure performance with a deliberate focus on preventative actions and early intervention to tackle the root causes of poverty and negative outcomes
2.5 We will build engagement and ownership by working more closely with local communities and all key partners, including the voluntary sector, to generate capacity, commitment and resilience
2.6 We will establish governance and accountability that improves collaboration amongst partners, and provides transparency, challenge and accountability to achieve positive outcomes and effective use of resources
7
3. Planning our Outcomes 3.1. This Single Outcome Agreement has been prepared through a Partnership initiative
entitled Outcomes for Stirling.
3.2. Stirling Community Planning Partnership endorsed the key messages and principles embodied in the Christie Commission.
3.3. These principles were applied to the Outcomes for Stirling activity and will continue to frame the development of this Single Outcome Agreement.
3.4. Outcomes for Stirling has been a comprehensive process that supported the Community Planning Partnership in developing its Single Outcome Agreement to:
3.4.1. Engage and involve all stakeholders
3.4.2. Understand our local area and the communities within it
3.4.3. Establish priorities based on this understanding
3.4.4. Target delivery to the most positive outcomes
3.5. The methodology of Outcomes for Stirling is detailed at Appendix A. In summary, the key stages of the process to date are:
3.5.1. Evidence Gathering
3.5.2. Analysis and Prioritisation of evidence:
3.5.3. Prioritised Outcomes and targeted actions:
3.5.4. Communication and Engagement
3.5.5. Governance and Infrastructure
3.6. The delivery of Outcomes for Stirling is guided by three critical elements:
Engagement and Ownership
3.7. The Partnership sought to involve all stakeholder groups in all stages of development of Outcomes for Stirling. Limited engagement in the first Single Outcome Agreement (SOA) process has always been a barrier against full understanding, ownership and joint commitment.
Evidence and analysis
3.8. Knowledge of our area is central to identifying priorities and outcomes. Outcomes for Stirling gathered data in a much more structured way than that of our first SOA. Experience and learning from this suggested that sole consideration of the Community Planning Partnership area as a whole is not the most effective model. Rather, more consideration of communities of geography or of need is required to provide the basis for effective action.
3.9. Outcomes for Stirling combined a non-geographic approach that gathered data at transitional life stages from early years to 85+, alongside a more traditional examination of data collected in a geographical context.
3.10. The geographic focus considered both a datazone perspective using nationally available data, and also household types using the ACORN segmentation tool. This two-tiered approach to physical communities enables need to be identified across the Council area, including rural Stirling, whilst still showing where multiple deprivation and vulnerability remains concentrated in specific urban communities.
3.11. Key to the Outcomes for Stirling evidence gathering work was combining this hard data with the softer, experiential knowledge of partners and from local communities. An added advantage of bringing partners and communities together to share and
8
validate this experiential information, was the building of ongoing relationships and engagement in the Outcomes for Stirling process.
Outcomes
3.12. Outcomes for Stirling was predicated on identifying priority outcomes, and understanding how these outcomes could be progressed in particular communities and at particular life stages. The need for targeting, and a decisive shift towards prevention was integral to the identification of outcomes and the planning of interventions. Outcomes for Stirling identified outcomes within Stirling, and the need to target particular outcomes for particular communities within Stirling.
3.13. The work also reinforced the depth of assets available in our communities and highlighted the need for this Single Outcome Agreement to enable communities to build both their physical and knowledge based assets in progress towards outcomes. It highlighted the opportunity to reinforce an assets based approach to implementing this Single Outcome Agreement. At its simplest, this approach is one that enables individuals and communities to take control of managing positive changes to their circumstances by working together to plan, design and deliver the interventions required.
Conclusion
3.14. Outcomes for Stirling has been an inclusive and comprehensive process that has supported the partnership production of this Single Outcome Agreement.
3.15. Outcomes for Stirling has amassed hard evidence and performance data, and softer data gathered through local and area community planning. This has been debated, analysed and prioritised by a wide range of stakeholders, and sense checked against National priorities.
3.16. Summary conclusions reflect the diversity of Stirling; its inequalities, its mix of urban and rural communities; its rich heritage, environment and high level of community involvement and ambition.
3.17. Conclusions also reflect the challenging context in which this Single Outcome Agreement will be implemented, encompassing public service reform, financial hardship, welfare reform, and economic uncertainty and changing demographics.
3.18. Outcomes for Stirling suggests that the Community Planing Partnership needs to improve outcomes:
3.18.1. Across Stirling’s communities and
3.18.2. To support people at different lifestages: pre-birth and early years, school age, youth transitions, working age, retired and 85+
To do this, partners need to prioritise:
3.18.3. Early intervention and prevention
3.18.4. More effective partnership working around a smaller number of key outcomes, supported by workforce development
3.18.5. Targeting to where there is greatest need and potential positive impact
3.18.6. Community and third sector involvement and capacity building
9
4. An Understanding of Stirling
4.1. The Stirling Council area is home to around 90,000 people, 65% of which are in the City of Stirling and its neighbouring settlements and 35% in the rural area.
4.2. On many measures, the area shows great diversity, mirroring Scotland as a whole. When considered as a single area, the statistics are generally very positive relative to Scotland as a whole. Parts of Stirling, Dunblane, Bridge of Allan and much of the rural area are some of the most affluent and successful communities in the country with high incomes, good health and excellent quality of life. In relatively close proximity, there are communities of concentrated deprivation where worklessness is very significant and health statistics are some of the poorest in the country.
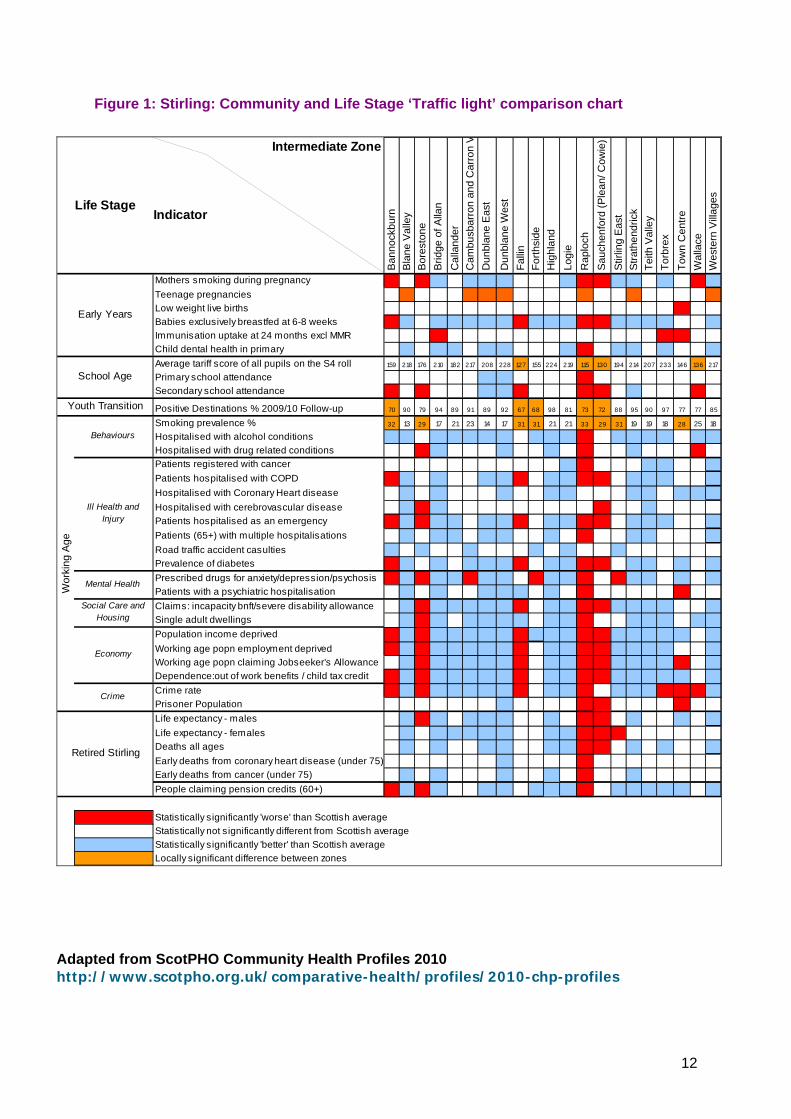
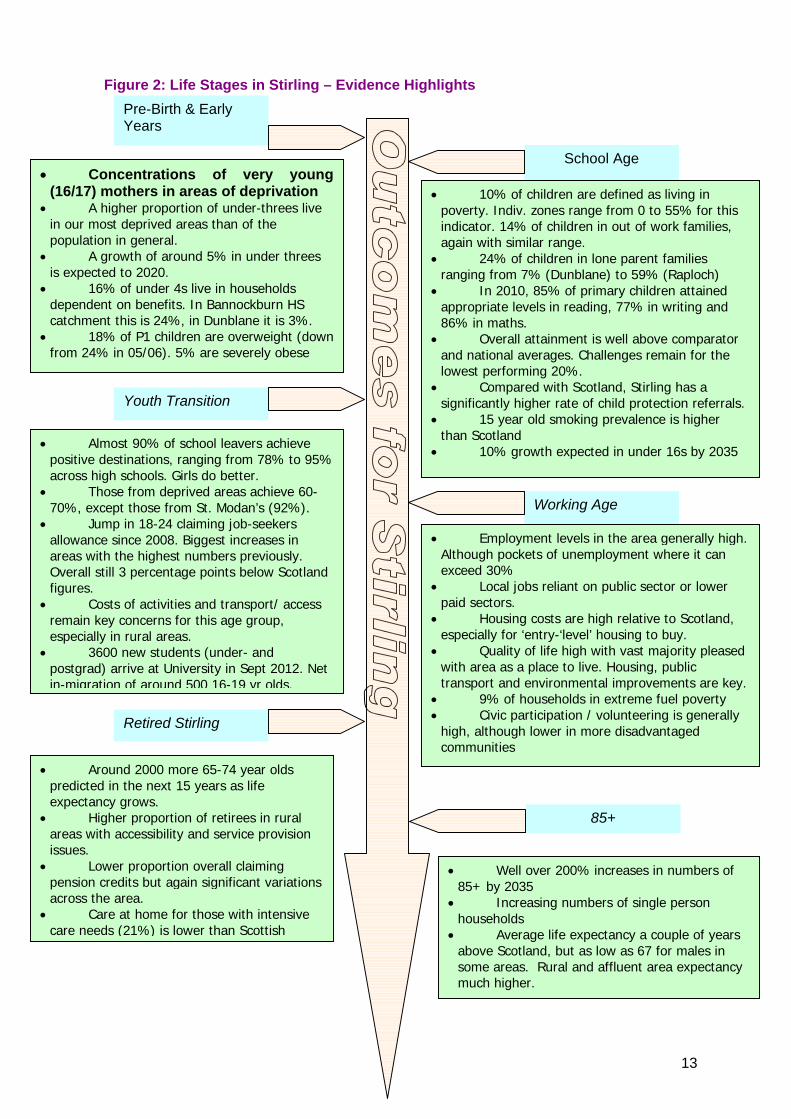
4.3. Figure 1 describes the diversity that exists across the different parts of the Stirling Council area, looking at a range of indicators through different life stages on health, economy, education, crime etc. The blue areas indicate where an area is much better than the Scottish average, and red where an area is significantly poorer than the Scotland average. There are few areas marked white (at or around the Scottish average) highlighting the polarised nature of the area. The long lines of red indicate that persistence of poor outcomes throughout many life stages in certain areas is also significant. These are considered in more detail in Figure 2.
4.4. The age structure of the Stirling urban area matches that of Scotland, although the number of students boosts the 16-24 age group. The population is projected to grow steadily through both increased migration and people living longer. As across Scotland, the numbers of older people (especially those 85+) is expected to increase considerably over the next 20 years. The rural area has lower proportions of young adults (16-24) and working age and around 24% of the population are of pensionable age, compared to 17% for the Council area as a whole.
4.5. In many parts of the area, in the communities of generally middle or higher incomes that dominate in numbers, population health is generally very good, and better than the Scottish average. 79% report good or very good health, compared to 75% for Scotland. However, in more deprived areas of the City and eastern villages, levels of heart disease, cancer, stroke, emergency admissions and other conditions are much higher. Health in the rural area is generally better than the Stirling and Scotland averages. Where deprivation and older populations are more prevalent rurally, there are greater incidences and early deaths from coronary heart disease and cancer.
4.6. Unemployment levels have risen in recent times, reflecting wider economic conditions, however levels are consistently better than Scotland across the area. Again there are significant variations between communities; in some areas male unemployment can be as high as 30-40% whereas in others it barely registers. Youth (16-24) unemployment is a couple of percentage points higher than the overall figure and in more deprived areas, youth unemployment can be at significantly high levels.
4.7. Stirling is resident to a high proportion of higher managers and professionals, although many work outwith the area in Glasgow or Edinburgh. Jobs in the area are mainly in the service sector, especially distribution, hotels and restaurants, and in public services. Both residents and Stirling-based jobs have higher than average wages compared to Scotland.
4.8. Rural Stirling has generally lower unemployment and income deprivation than the wider Council area. Around 900 people there are classed as employment deprived, within the 5700 for the Council as a whole. In the rural area, there is a polarisation of employment from out-commuting managers and professionals through to lower-paid workers in hospitality and retail. There is much more self-employment and potential entrepreneurship in the rural area, especially further north. There is less reliance on
10
retail and public sector employment within the rural area, but still significant employment of residents in these areas. Most of the northern part of Stirling’s rural area lies within the most deprived 5% nationally for accessibility. This is calculated using drive times and public transport travel times to facilities such as GPs, shops, post offices and schools.
4.9. Education levels in Stirling schools are generally very good – pupils achieve above the national average in levels of attainment in national examinations at S5 – S6. There is a recognised need to raise attainment and achievement of, and opportunities for, the lowest achieving 20% of children and young people. In general, secondary school results (measured as average tariff scores) for rural pupils outperform the Stirling and Scotland average.
4.10. Around 85% of high school leavers move to positive destinations (employment, training, education etc.) but this varies from 79% for Bannockburn High to 95% at Dunblane. The proportion of school-leavers not in positive destinations (employment, education, training) is lower in the rural area (9%) than the wider Council area (16%), and the number of 16-24 year olds on income related benefits is also lower.
4.11. Low level crime and anti-social behaviour are the major concerns relating to community safety in the Stirling area. The total number of crimes per head of population is lower than the Scottish average. The town centre is the focus for higher levels of anti-social behaviour linked to the night-time economy.
4.12. In a survey of residents, urban dwellers were much more satisfied with Stirling as a place to live (84%) than those in rural areas (68%). According to Stirling residents, the top 5 issues that are most important in making somewhere a good place to live are crime levels, health services, affordable decent housing, job prospects and education provision. These were not all necessarily high on their priorities for improvement however, which included housing, public transport and environmental improvements.
4.13. A review of individual community plans prepared across the area indicated that local priorities centred on community facilities and involvement, road safety and environmental improvements in urban areas. In rural areas, local access and paths, access to services and tourism development were also important.
4.14. Latest estimates indicate that per capita carbon emissions (across commercial, domestic and road transport sectors) was 8.8 tonnes per year in Stirling (the 3rd highest of 32 councils), compared to 6.8 tonnes for Scotland as a whole.
4.15. There are significant variations within Stirling, in household structure, incomes, economic activities, and housing. The ACORN classification describes households based on their lifestyle, behaviour and attitudes, irrespective of where they are located, and helps understand needs beyond the traditionally ‘deprived’ communities.
4.16. The categorisation reinforces Stirling’s polarised nature; 51% of households are in the top 2 (of 5) categories: ‘wealthy achievers’ & ‘urban prosperity’. 30% are classed as ‘modest means’ or ‘hard-pressed’.
4.17. Recent changes in numbers (2007 –2011) indicate a move from modest means to hard-pressed and increase in the number of wealthy achievers – these are signs of increasing polarisation. Around one in seven of Stirling’s most deprived households (termed ‘struggling families’ and ‘burdened singles’) are in rural areas. At the other end of the scale, two-thirds of rural households are in the most affluent categories.
4.18. The most recent update to the Scottish Index of Multiple Deprivation (SIMD) in 2012 indicated that most of Stirling’s most deprived areas have experienced a consolidation and deepening of deprivation since 2009, further increasing polarisation of the area. It

11
indicates that Stirling’s deprived areas have been less resilient to wider economic changes than other parts of Scotland.
12
Figure 1: Stirling: Community and Life Stage ‘Traffic light’ comparison chart
Intermediate Zone
Indicator
Mothers smoking during pregnancy R R B B B B B R R B B B R BTeenage pregnancies Low weight live births R Babies exclusively breastfed at 6-8 weeks R B B B B B B R B B B R R B B B B BImmunisation uptake at 24 months excl MMR R R R Child dental health in primary B B B B B B R B B B BAverage tariff score of all pupils on the S4 roll 159 218 176 210 182 217 208 228 127 155 224 219 115 130 194 214 207 233 146 136 217
Primary school attendance B B R Secondary school attendance R R B B R R R B R
Positive Destinations % 2009/10 Follow-up 70 90 79 94 89 91 89 92 67 68 98 81 73 72 88 95 90 97 77 77 85
Smoking prevalence % 32 13 29 17 21 23 14 17 31 31 21 21 33 29 31 19 19 18 28 25 18
Hospitalised with alcohol conditions B B B B B B B B B B R B B B B B BHospitalised with drug related conditions R B B B R B R Patients registered with cancer B R B B BPatients hospitalised with COPD R B B B B R B B R R B B B BHospitalised with Coronary Heart disease B B B B B B B B B B
Hospitalised with cerebrovascular disease B R B R B Patients hospitalised as an emergency R B R B B B B R B B R R B B B BPatients (65+) with multiple hospitalisations B B B B B B R B B BRoad traffic accident casulties B B B B B B Prevalence of diabetes R B B B B B R B B R R B B B BPrescribed drugs for anxiety/depression/psychosis R B R B B R B B R B B R R B B B BPatients with a psychiatric hospitalisation B B B B B B R R Claims: incapacity bnft/severe disability allowance B R B B B B B R B B R R B B B B BSingle adult dwellings B R B B B B B B B R B B B B BPopulation income deprived R B R B B B B B R B B B R R B B B B B B
Working age popn employment deprived R B R B B B B B R B B R R B B B B BWorking age popn claiming Jobseeker's Allowance B R B B B B B R B B R R B B B B R BDependence:out of work benefits / child tax credit R B R B B B B B R B B R R B B B B B BCrime rate R B R B B B B B R B B R B B B R R R BPrisoner Population B R R R Life expectancy - males B R B B B B B R R B B BLife expectancy - females B B B B B B B B R R R Deaths all ages B B B B B B R R B B BEarly deaths from coronary heart disease (under 75) B R Early deaths from cancer (under 75) B B B B R B
People claiming pension credits (60+) R B R B B B B B B R B B B B B B
Statistically significantly 'worse' than Scottish average
Statistically not significantly different from Scottish average
Statistically significantly 'better' than Scottish average
Locally significant difference between zones
Dun
blan
e E
ast
Ban
nock
burn
Bla
ne V
alle
y
Retired Stirling
Bor
esto
ne
Life Stage
Crime
Social Care and Housing
Wor
king
Age
School Age
Mental Health
Economy
Behaviours
Wal
lace
Ill Health and Injury
Tei
th V
alle
y
Youth Transition
Logi
e
Rap
loch
Sau
chen
ford
(P
lean
/ Cow
ie)
Dun
blan
e W
est
Cal
land
er
Ca
mb
usb
arr
on
an
d C
arr
on
V
Wes
tern
Vill
ages
Early Years
To
rbre
x
Tow
n C
entr
e
Fal
lin
For
thsi
de
Hig
hlan
d
Brid
ge o
f Alla
n
Stir
ling
Eas
t
Str
athe
ndric
k
Adapted from ScotPHO Community Health Profiles 2010 http://www.scotpho.org.uk/comparative-health/profiles/2010-chp-profiles
13
Pre-Birth & Early Years
School Age
Youth Transition
Working Age
Retired Stirling
85+
Concentrations of very young(16/17) mothers in areas of deprivation
A higher proportion of under-threes live in our most deprived areas than of the population in general.
A growth of around 5% in under threes is expected to 2020.
16% of under 4s live in households dependent on benefits. In Bannockburn HS catchment this is 24%, in Dunblane it is 3%.
18% of P1 children are overweight (downfrom 24% in 05/06). 5% are severely obese
10% of children are defined as living in poverty. Indiv. zones range from 0 to 55% for this indicator. 14% of children in out of work families, again with similar range.
24% of children in lone parent families ranging from 7% (Dunblane) to 59% (Raploch)
In 2010, 85% of primary children attained appropriate levels in reading, 77% in writing and 86% in maths.
Overall attainment is well above comparator and national averages. Challenges remain for the lowest performing 20%.
Compared with Scotland, Stirling has a significantly higher rate of child protection referrals.
15 year old smoking prevalence is higher than Scotland
10% growth expected in under 16s by 2035 Almost 90% of school leavers achieve positive destinations, ranging from 78% to 95% across high schools. Girls do better.
Those from deprived areas achieve 60-70%, except those from St. Modan’s (92%).
Jump in 18-24 claiming job-seekers allowance since 2008. Biggest increases in areas with the highest numbers previously. Overall still 3 percentage points below Scotland figures.
Costs of activities and transport/ access remain key concerns for this age group, especially in rural areas.
3600 new students (under- and postgrad) arrive at University in Sept 2012. Net in-migration of around 500 16-19 yr olds.
Employment levels in the area generally high. Although pockets of unemployment where it can exceed 30%
Local jobs reliant on public sector or lower paid sectors.
Housing costs are high relative to Scotland, especially for ‘entry-‘level’ housing to buy.
Quality of life high with vast majority pleased with area as a place to live. Housing, public transport and environmental improvements are key.
9% of households in extreme fuel poverty Civic participation / volunteering is generally
high, although lower in more disadvantaged communities
Around 2000 more 65-74 year olds predicted in the next 15 years as life expectancy grows.
Higher proportion of retirees in rural areas with accessibility and service provision issues.
Lower proportion overall claiming pension credits but again significant variations across the area.
Care at home for those with intensive care needs (21%) is lower than Scottish
Well over 200% increases in numbers of 85+ by 2035
Increasing numbers of single person households
Average life expectancy a couple of years above Scotland, but as low as 67 for males in some areas. Rural and affluent area expectancy much higher.
Figure 2: Life Stages in Stirling – Evidence Highlights
14
5. Our Outcomes
5.1. We have developed seven outcomes based on evidence we gathered and the views on priorities from communities and partners.
5.1.1. Improved outcomes in children’s early years - What this means is that there is improved access to early learning that helps all children’s healthy development, in which parents are engaged, and there is early identification of need and extra support for children and families who need it; children are ready for school
5.1.2. Improved support for disadvantaged and vulnerable families and individuals - What this means is that services are focussed on and tailored to the needs of disadvantaged and vulnerable individuals and families; we increase attainment and achievement for the lowest achieving children and young people; there is increased financial inclusion and capability; a reduction in risk to children from harm and neglect and from the effects of substance misuse and domestic violence
5.1.3. Communities are well served, better connected and safe - What this means is that essential services are available locally; older people are supported within their communities and receive appropriate care; local transport and broadband support the wider economy and access to services; vulnerable people are less isolated; communities are supported to make best use of their assets and skills, are resilient to climate change and are involved in the planning and delivery of services. Neighbourhoods experience less antisocial behaviour particularly from the impact of alcohol misuse.
5.1.4. Improved supply of social and affordable housing - What this means is that there that is a supply of affordable housing to buy and rent; there is a good mix of housing types in communities; older people and people with disabilities can access appropriate housing; people are supported through welfare reform changes; there is less risk of homelessness.
5.1.5. Reduced risk factors that lead to health and other inequalities - What this means is improved diet and levels of physical activity; there are higher levels of wellbeing; increased financial inclusion and capability and ability to access employment; a reduction in the effects of substance misuse, and; communities make the best use of public and open space
5.1.6. Improved opportunities for learning, training and work - What this means is that individuals with barriers are supported into and remain in work; there are increased opportunities for vocational learning; all young people are confident and able to move from school into work, volunteering or further/ higher education, and; childcare that is flexible, affordable and supports parents to enter and sustain employment.
5.1.7. A diverse economy that delivers good quality local jobs What this means is there is increased higher value and range of employment that is resilient to economic change.
5.2 All our outcomes will be progressed with a clear understanding that the inequality which exists within Stirling must be addressed. Reducing the polarity of wealth and opportunity in our area is a key challenge for community planning partners, particularly now in times of both recession and welfare reform.
15
6. Prioritising Prevention and Intervention
6.1. The seven outcomes provide the context for the initial areas of service delivery that partners will examine for their effectiveness and efficiency, and are committed to delivering differently to meet outcomes.
6.2. Prevention and early intervention tend to be used interchangeably. Prevention can occur at a number of different stages. The intention however, is almost always to refer to a focus on tackling causal factors, root problems, rather than solely dealing with the consequences.
6.3. There is common agreement that ‘prevention is better than cure’ both for the individual and communities concerned and in the longer term for public finances: prevention is usually more cost effective. However as yet there is no ‘big shift’ towards prevention in public services. Community planning partners will still have to deal with the failure to prevent social fragmentation, ill health, criminality, for at least the period of this Single Outcome Agreement.
6.4. Therefore the adaptive challenge for all partners is in examining and changing how we plan and deliver services to enable a gradual and measurable shift towards prevention whilst still supporting the harder end of delivery where prevention has unfortunately come too late.
6.5. So far within Outcomes for Stirling, the Community Planning Partnership has identified a number of intervention areas as potential priorities for preventative measures. The CPP will further refine these according to the following ‘tests’:
6.5.1. Is there a need for a preventative approach?
6.5.2. How good is the evidence base to determine the effectiveness of preventative measures?
6.5.3. Can preventative measures be targeted effectively?
6.5.4. Are there opportunities for creating and releasing cost savings?
6.5.5. Is it possible to identify a preventative spend target?
6.5.6. Have risks been identified and mitigated as far as possible?
6.5.7. Can leadership commitment be secured amongst all key partners?
6.6. Prevention planning will underpin each action plan developed to implement the Single Outcome Agreement priorities. Following the application of the prevention ‘tests’ above, each action plan will identify a prevention spend target- firstly by understanding current spend on identified priority areas, and building an understanding of potential preventative impact, and then finally agreeing amongst partners a realistic shift target.
6.7. This Single Outcome Agreement will increasingly move towards a more person centred approach to service provision. This will mean supporting people to make choices and to be included in the design and delivering of services that they need. Services will change for the better when those individuals who rely on them shape them.
6.8. Good accessible information is essential for effective involvement, as is quality capacity building support if required. Equally important is the culture of community planning partner organisations themselves. Partners need to be able to build and maintain trust and empower their own workforce to work differently, and respond more flexibly to need.
16
6.9. Services will be delivered in the most appropriate and efficient way that meets outcomes. This potentially means a wider range of delivery organisations, particularly in the community and voluntary sectors, but also in the private sector supporting business growth.
6.10. The 2012 iteration of the Scottish Index of Multiple Deprivation showed that more of Stirling’s population has fallen into relative poverty, and that deprivation continues to be concentrated in certain geographical communities.
6.11. Whilst this may seem to favour a geographical approach to implementation, work has shown that people living in more deprived communities tend to have poorer experiences throughout their life stages. Moreover, understanding and intervening in an earlier life stage has the potential to improve outcomes and prevent further harm.
6.12. Key services tend increasingly to be responding on a life stage basis. It may be therefore that an approach to implementing activity towards our key outcomes that is planned and resourced around life stages would in fact target activity towards our most vulnerable geographical communities, whilst at the same time not allowing needs in all our communities to go unrecognised. Our evidence is pointing to definite areas where a more targeted approach to regeneration is undoubtedly required and we will work with our communities to improve social, economic and health outcomes.
6.13. Section 7 details the Partnership’s actions to improve the way we engage and involve our communities. The purpose of these improvements is not simply to support more effective engagement of communities in the planning and monitoring of services. More ambitiously, it is to enable communities to deliver more services themselves, creating more resilient and sustainable neighbourhoods.
6.14. Where appropriate, we will support quality capacity building activity to ensure that all communities are equally able to take more control over the services that are delivered locally. However we are also committed to building the capacity of our workforce to better engage communities, and change the way they work to support increased interventions from community and voluntary sector partners.
6.15. We have identified priority prevention and intervention areas that will help deliver our outcomes. The areas do not stand alone. They are inter-connected and will all make a difference to all our outcomes.
6.16. The main areas to be further examined, costed and re-designed as part of our Single Outcome Agreement action planning are:
6.16.1. Early years, including early learning
6.16.2. Support for vulnerable individuals and families including early intervention to prevent neglect and harm
6.16.3. Appropriate community support, care and housing for older people
6.16.4. Alcohol misuse, particularly in relation to antisocial behaviour and offending
6.16.5. Business growth, enterprise, investment and connectivity
6.16.6. Employability, tackling barriers to employment and increasing skills
6.17. Outcomes for Stirling identified areas that will enable and embed the prevention and intervention activity. These are:
6.17.1. Accessibility of facilities and services
6.17.2. Maintaining the quality of the environment and adapting to climate change
6.17.3. Tackling inequalities in health, income and housing
17
7. Engaging and Empowering Communities
7.1. Stirling’s commitment to community engagement is long standing and well evidenced. However the challenge of reform means that partners must look to improve both the ways they engage, and the co-ordination of that engagement. We will encourage all partners to demonstrate a shared commitment to community engagement and empowerment.
7.2. In addition to engaging communities, we will also seek to enable communities to take more control over their own outcomes, through encouraging more direct involvement not just in the planning of services, but in the actual delivery of locally based interventions where appropriate.
7.3. Currently, the Community Planning Partnership organises its corporate community engagement around Stirling Council’s Area Community Planning Forums, NHS Forth Valley’s Public Participation Forum, and Police Scotland Forth Valley division’s Police and Communities Together model.
7.4. The CPP also supports strategic engagement within ‘community of interest’ forums. These are non-geographic. There are currently 5 groups: Stirling Older People’s Reference Group, Stirling Multi-Cultural Partnership, Stirling Youth Partnership, Stirling Business Panel and Stirling Access Panel.
7.5. There is in addition a large number of local community organisations active throughout the Council area, including Community Councils, Parent Councils, environmental organisations, learning organisations, local community planning groups, family support groups, specific service user groups. Stirlingshire Voluntary Enterprise offers a degree of support and co-ordination to this activity, often in partnership with the Communities Team within the local authority.
7.6. This SOA requires a more co-ordinated, challenging and influential engagement and empowerment approach. The first task in delivering such a revised approach will be to review current structures and processes. This review will be done in partnership with communities and will judge current approaches and will include:
7.6.1. Partners’ engagement processes including the different channels and forums for engagement
7.6.2. Partners of engagement activities
7.6.3. Communities role in shaping and assessing service delivery performance
7.6.4. Capacity within organisations and communities
7.6.5. Ensuring that the action planning work to implement the SOA has ongoing meaningful involvement of communities and service users, with particular emphasis on reducing inequalities
7.6.6. Supporting Stirlingshire Voluntary Enterprise in its pivotal role of engaging community, voluntary and social enterprise organisations in the CPP, and in building the capacity of the sector to be more strongly represented
7.6.7. Revisiting the Stirling and National Standards for Community Engagement, with a view to establishing an appropriately challenging yet achievable revised set of Stirling Standards
7.6.8. Ensuring that the corporate culture and organisational development of all partner organisations prioritises and resources co-ordinated community engagement and empowerment, as essential to implementation of this Single Outcome Agreement
18
7.6.9. Examining partners ability to respond to change, particularly where different service providers may be appropriate, including building a more collaborative approach to the commissioning of services, especially to ascertain how community organisations and social enterprises can more easily take on aspects of service delivery
19
8. Contributing to Scotland
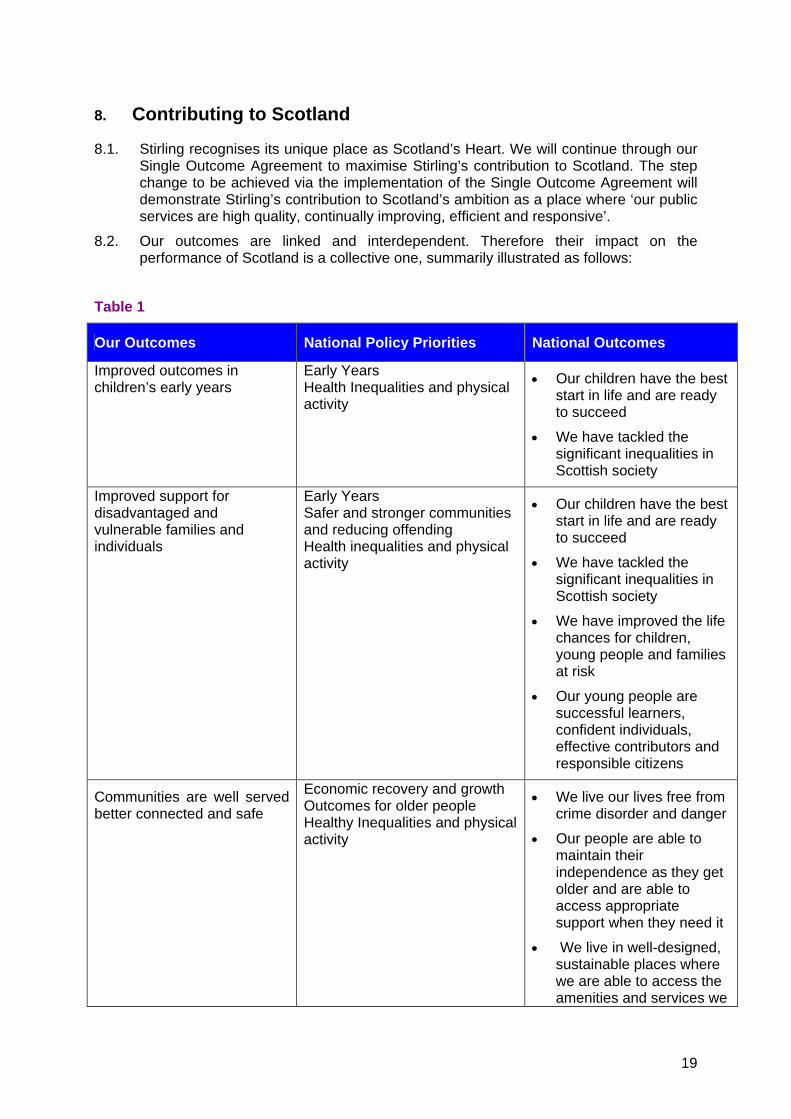
8.1. Stirling recognises its unique place as Scotland’s Heart. We will continue through our Single Outcome Agreement to maximise Stirling’s contribution to Scotland. The step change to be achieved via the implementation of the Single Outcome Agreement will demonstrate Stirling’s contribution to Scotland’s ambition as a place where ‘our public services are high quality, continually improving, efficient and responsive’.
8.2. Our outcomes are linked and interdependent. Therefore their impact on the performance of Scotland is a collective one, summarily illustrated as follows:
Table 1
Our Outcomes National Policy Priorities National Outcomes
Improved outcomes in children’s early years
Early Years Health Inequalities and physical activity
Our children have the best start in life and are ready to succeed
We have tackled the significant inequalities in Scottish society
Improved support for disadvantaged and vulnerable families and individuals
Early Years Safer and stronger communities and reducing offending Health inequalities and physical activity
Our children have the best start in life and are ready to succeed
We have tackled the significant inequalities in Scottish society
We have improved the life chances for children, young people and families at risk
Our young people are successful learners, confident individuals, effective contributors and responsible citizens
Communities are well served better connected and safe
Economic recovery and growth Outcomes for older people Healthy Inequalities and physical activity
We live our lives free from crime disorder and danger
Our people are able to maintain their independence as they get older and are able to access appropriate support when they need it
We live in well-designed, sustainable places where we are able to access the amenities and services we
20
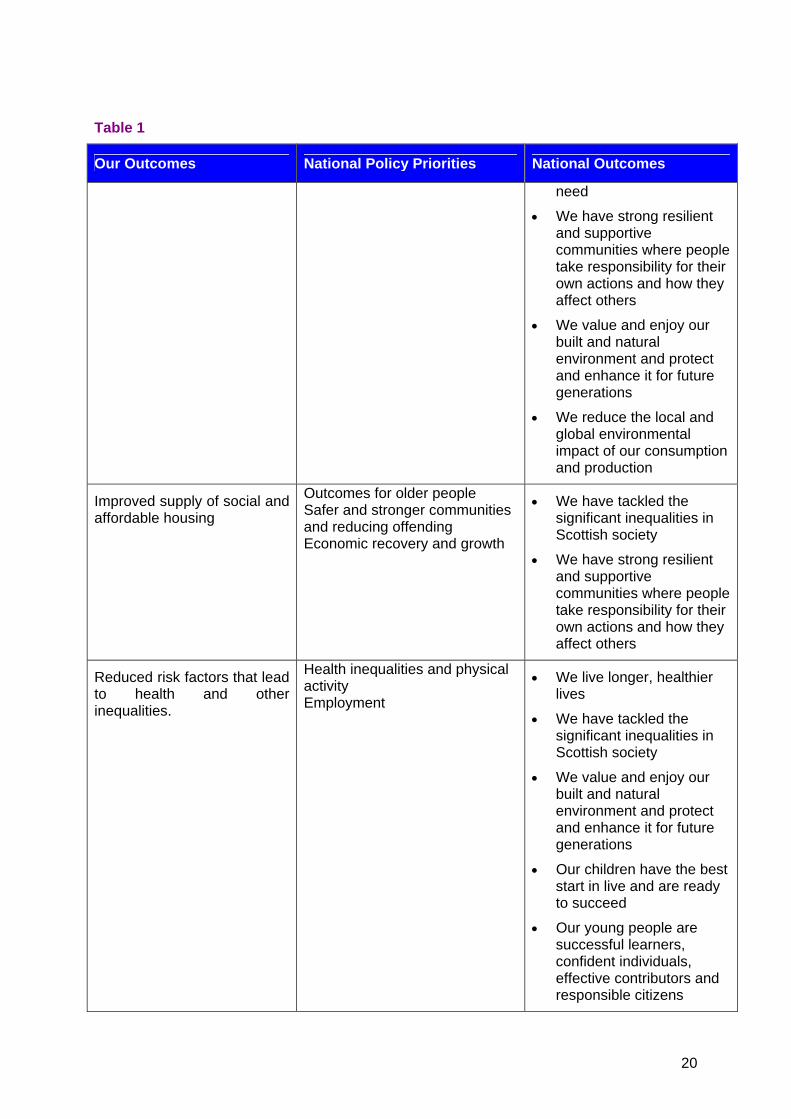
Table 1
Our Outcomes National Policy Priorities National Outcomes
need
We have strong resilient and supportive communities where people take responsibility for their own actions and how they affect others
We value and enjoy our built and natural environment and protect and enhance it for future generations
We reduce the local and global environmental impact of our consumption and production
Improved supply of social and affordable housing
Outcomes for older people Safer and stronger communities and reducing offending Economic recovery and growth
We have tackled the significant inequalities in Scottish society
We have strong resilient and supportive communities where people take responsibility for their own actions and how they affect others
Reduced risk factors that lead to health and other inequalities.
Health inequalities and physical activity Employment
We live longer, healthier lives
We have tackled the significant inequalities in Scottish society
We value and enjoy our built and natural environment and protect and enhance it for future generations
Our children have the best start in live and are ready to succeed
Our young people are successful learners, confident individuals, effective contributors and responsible citizens
21
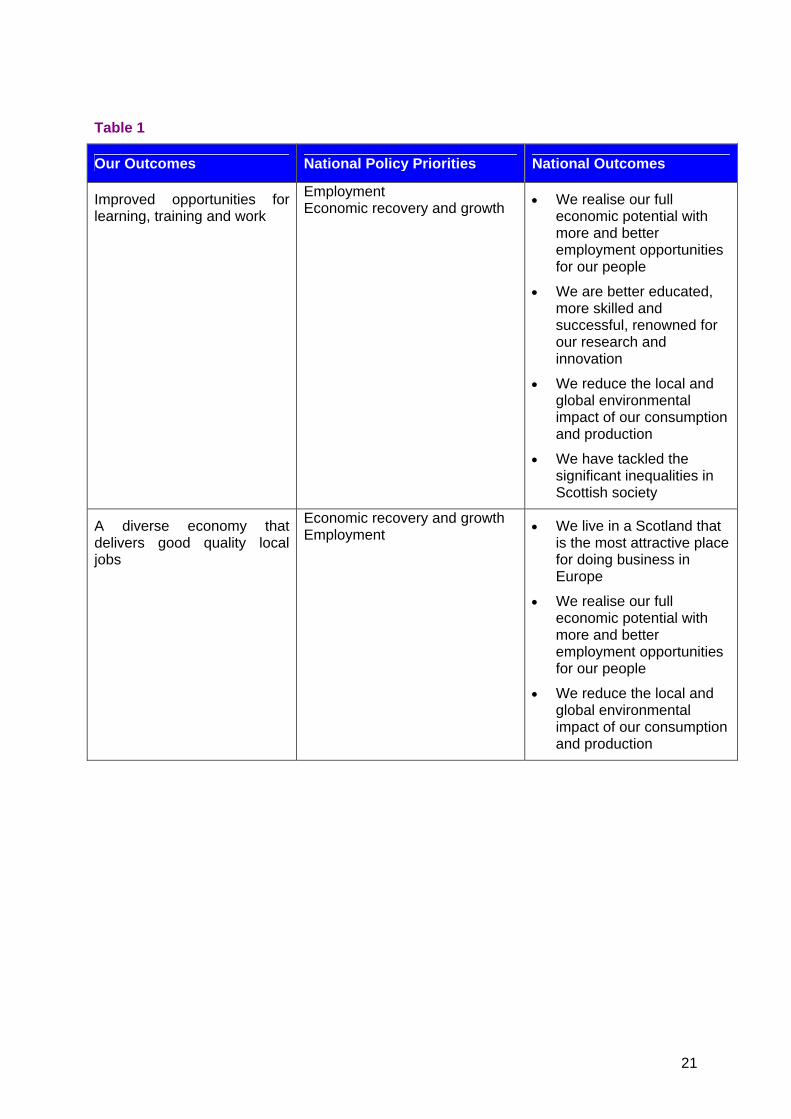
Table 1
Our Outcomes National Policy Priorities National Outcomes
Improved opportunities for learning, training and work
Employment Economic recovery and growth
We realise our full economic potential with more and better employment opportunities for our people
We are better educated, more skilled and successful, renowned for our research and innovation
We reduce the local and global environmental impact of our consumption and production
We have tackled the significant inequalities in Scottish society
A diverse economy that delivers good quality local jobs
Economic recovery and growth Employment
We live in a Scotland that is the most attractive place for doing business in Europe
We realise our full economic potential with more and better employment opportunities for our people
We reduce the local and global environmental impact of our consumption and production
22
9. Monitoring our Performance
9.1. We will implement our Single Outcome Agreement through a series of action plans progressing the partnership priorities identified in Section 5 Page 14.
9.2. These plans will be developed using change management techniques that have proven successful for planning Partnership activity in the past. This Single Outcome Agreement identifies the difference we want to see in our evidenced strategic priorities over the next ten years. We are clear that to simply deliver the same activity will not deliver that difference. Therefore we need to to fully understand what partners are currently doing, and what we need to do differently to achieve the step change required.
9.3. Action plans will be monitored against progress milestones and target timescales, with local indicators identified from across the Partnership. We will also encourage communities to assess their own indicators of progress for inclusion in the plans.
9.4. These action plans will be monitored using the COVALENT system, which is accessible to community planning partners and which provides a very visual summary of progress, adaptable for use in community as well as strategic governance settings.
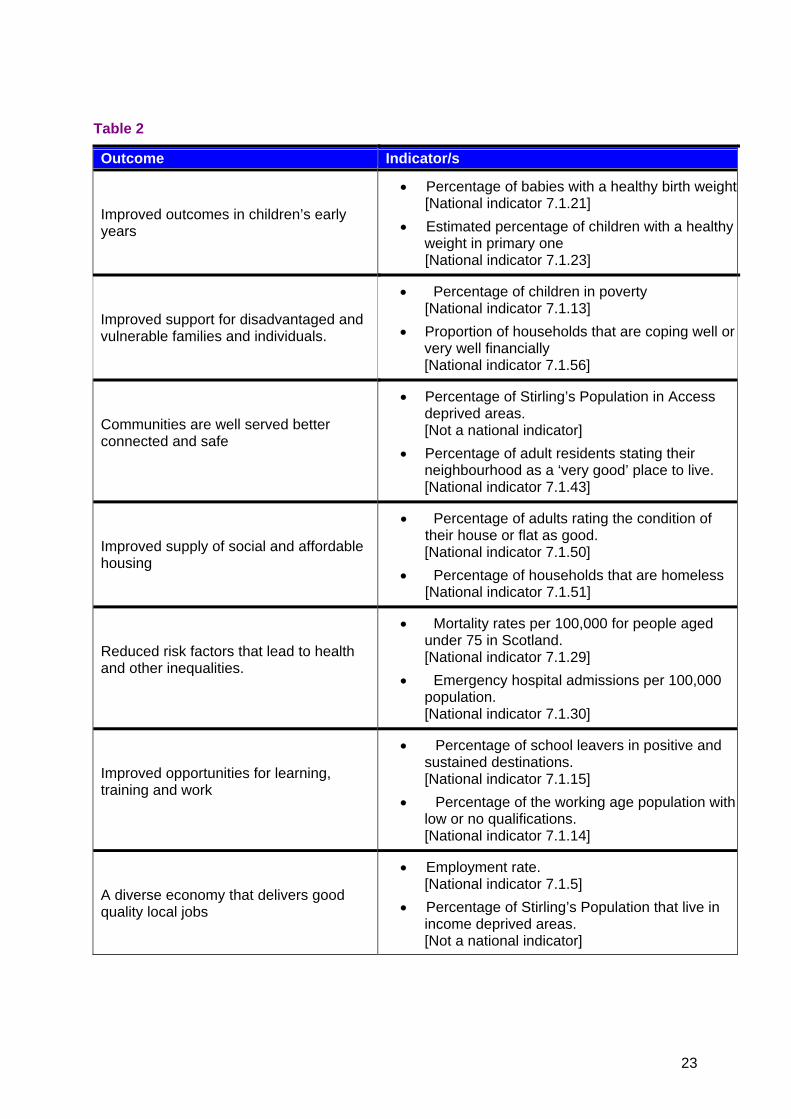
9.5. Monitoring the ten year performance of the outcomes within the Single Outcome Agreement at the most strategic level, will be done using a small number of relevant indicators as follows:
23
Table 2
Outcome Indicator/s
Improved outcomes in children’s early years
Percentage of babies with a healthy birth weight[National indicator 7.1.21]
Estimated percentage of children with a healthy weight in primary one [National indicator 7.1.23]
Improved support for disadvantaged and vulnerable families and individuals.
Percentage of children in poverty [National indicator 7.1.13]
Proportion of households that are coping well or very well financially [National indicator 7.1.56]
Communities are well served better connected and safe
Percentage of Stirling’s Population in Access deprived areas. [Not a national indicator]
Percentage of adult residents stating their neighbourhood as a ‘very good’ place to live. [National indicator 7.1.43]
Improved supply of social and affordable housing
Percentage of adults rating the condition of their house or flat as good. [National indicator 7.1.50]
Percentage of households that are homeless [National indicator 7.1.51]
Reduced risk factors that lead to health and other inequalities.
Mortality rates per 100,000 for people aged under 75 in Scotland. [National indicator 7.1.29]
Emergency hospital admissions per 100,000 population. [National indicator 7.1.30]
Improved opportunities for learning, training and work
Percentage of school leavers in positive and sustained destinations. [National indicator 7.1.15]
Percentage of the working age population with low or no qualifications. [National indicator 7.1.14]
A diverse economy that delivers good quality local jobs
Employment rate. [National indicator 7.1.5]
Percentage of Stirling’s Population that live in income deprived areas. [Not a national indicator]
24
10. Conclusion
10.1 The Leaders of the main community planning partner organisations in Stirling endorse the Outcomes for Stirling work, and are committed to realising the transformational change required through the implementation of the Single Outcome Agreement. Leaders are confident that the Single Outcome Agreement represents a robust ‘stepping off point’ for the targeted reform of our services to maximum impact.
10.2 Leaders are also clear that Outcomes for Stirling has generated an ownership and engagement in community planning that leaves the Community Planning Partnership best placed to work with all partners, including communities, voluntary and private sectors, to deliver effective change.
25
Appendices
A - Outcomes for Stirling Methodology - Attached
B - Community Activities Identified in Local Community Planning -- available separately
C – ACORN Stirling Council Area -- available separately
26
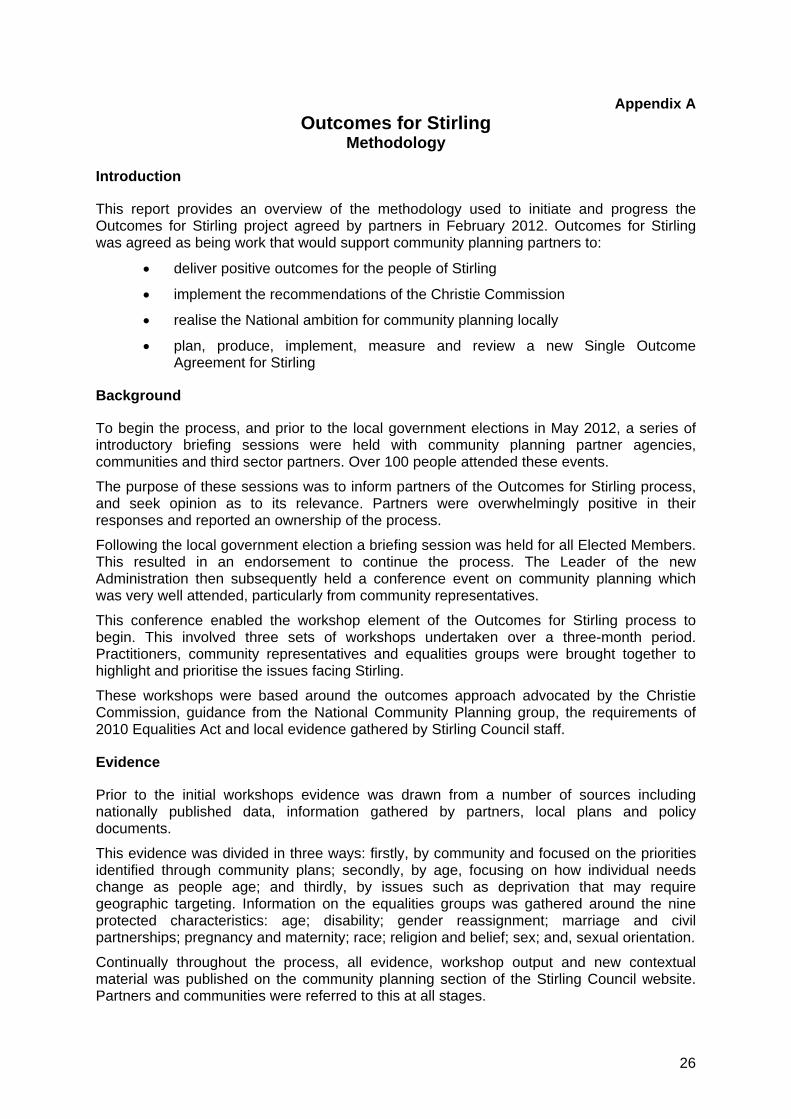
Appendix A
Outcomes for Stirling Methodology
Introduction
This report provides an overview of the methodology used to initiate and progress the Outcomes for Stirling project agreed by partners in February 2012. Outcomes for Stirling was agreed as being work that would support community planning partners to:
deliver positive outcomes for the people of Stirling
implement the recommendations of the Christie Commission
realise the National ambition for community planning locally
plan, produce, implement, measure and review a new Single Outcome Agreement for Stirling
Background
To begin the process, and prior to the local government elections in May 2012, a series of introductory briefing sessions were held with community planning partner agencies, communities and third sector partners. Over 100 people attended these events.
The purpose of these sessions was to inform partners of the Outcomes for Stirling process, and seek opinion as to its relevance. Partners were overwhelmingly positive in their responses and reported an ownership of the process.
Following the local government election a briefing session was held for all Elected Members. This resulted in an endorsement to continue the process. The Leader of the new Administration then subsequently held a conference event on community planning which was very well attended, particularly from community representatives.
This conference enabled the workshop element of the Outcomes for Stirling process to begin. This involved three sets of workshops undertaken over a three-month period. Practitioners, community representatives and equalities groups were brought together to highlight and prioritise the issues facing Stirling.
These workshops were based around the outcomes approach advocated by the Christie Commission, guidance from the National Community Planning group, the requirements of 2010 Equalities Act and local evidence gathered by Stirling Council staff.
Evidence
Prior to the initial workshops evidence was drawn from a number of sources including nationally published data, information gathered by partners, local plans and policy documents.
This evidence was divided in three ways: firstly, by community and focused on the priorities identified through community plans; secondly, by age, focusing on how individual needs change as people age; and thirdly, by issues such as deprivation that may require geographic targeting. Information on the equalities groups was gathered around the nine protected characteristics: age; disability; gender reassignment; marriage and civil partnerships; pregnancy and maternity; race; religion and belief; sex; and, sexual orientation.
Continually throughout the process, all evidence, workshop output and new contextual material was published on the community planning section of the Stirling Council website. Partners and communities were referred to this at all stages.
27
Partner Workshops
The first set of workshops was divided between community representatives and staff from partner organisations. In the partner sessions, evidence gathered was displayed for attendees to consider and compare with their own experiences.
Blank sheets titled by life stage, urban, rural and “what’s missing” were also displayed. Participants were asked to individually consider priorities, write them on post-it notes and place these on the appropriately headed blank sheet. Each workshop then split into discussion groups where participants consider the long-list of priorities from the individual exercise and agree a short-list of strategic priorities to feed back to everyone attending.
Community Workshops
A two-stage approach was taken for consultation with community organisations. The first stage involved a survey where members of community organisations were asked to identify the three most important issues for their community. The survey was designed to highlight distinct issues in urban and rural areas, as well as differences between parts of those areas.
The survey results were used in subsequent workshops alongside an analysis of the issues previously identified in local community plans to inform the second stage of the consultation. Participants were introduced to the information, which had been gathered both from statistical evidence and local community plans. They were then asked to group the issues emerging from the survey and name the theme that best described that group of issues. Finally, participants were asked to score their top three themes.
Following the first set of workshops, the highlighted priorities were categorised in line with the Scottish Government’s national community planning priorities:
Economic Growth and Recovery
Employment
Early Years
Outcomes for Older People
Health Inequalities (Stirling focus on wider inequalities)
Safer Communities and Offending (Stirling focus on resilient / sustainable communities)
Where possible the original wording identified from the first round of workshops was maintained, and where issues did not fit neatly into one heading they were placed in two or more categories.
Equalities Workshops
It was agreed to progress work on determining equalities outcomes required for the Equalities Scheme, within the Outcomes for Stirling process, and to include output in the final SOA.
The first equalities workshop adopted a similar process to that used for the workshop with partner organisations with local and national information for each of the statutory protected characteristics displayed along with a series of blank sheets of paper titled for each individual protected characteristic.
Participants were asked to identify issues facing equality groups locally, list these on post -it notes and place them on the relevant protected characteristic group sheet. The issues identified were prioritised on the basis of their frequency and participants were asked to consider the top three issues for two protected characteristics.
28
Discussion in smaller randomly composed groups then focussed on identifying three improvement actions for each issue. 28 people representing local equality groups attended this workshop.
The second equalities workshop was held jointly with Clackmannanshire Council, NHS Forth Valley and Central Scotland Regional Equality Council as part of the “ Public sector Duty Together Project “ and further developed the findings of the initial exercise outlined above.
Participants were asked to select the five most important issues from a list of “emerging priorities”, based on analysis of the issues identified in the first workshop. Discussion continued on the top three issues identified, examining improvements required, action needed to achieve these and potential participants. As these sessions were undertaken twice during the event, participants had the opportunity to comment on the emerging issued identified by both Councils and the NHS.
Prioritisation Workshops
The most recent set of workshops involved bringing community representatives and practitioners into a mixed setting. An update on national guidance was given, outlining what was expected to be in the Single Outcome Agreement, and feedback from the September workshops was delivered linked to that guidance.
A tool was developed prior to the workshop for groups to prioritise issues under each of the national outcome headings. Groups were assigned one or two of the national priorities and asked to score the Stirling issues raised in previous workshops. Participants were first asked to individually score each issue in five categories before coming to a consensus. The scoring categories were:
How important is this in Stirling
How much can we do about this in Stirling
Would preventative approaches help
How much will partners need to work together on this
Should we do things differently?
Where groups felt they were able to score the issues, workshop facilitators used a variety of methods to establish a consensus. Where groups found scoring difficult or were unable to reach consensus the discussion was recorded so useful information could still be gathered.
Attendance Summary
Introductory partner briefings and third sector workshop c.100
Leader’s conference 35
Partner workshops 121
Community workshops 41
Equalities workshops 28 + 31
Prioritisation workshops 92
Feedback
Feedback from the work has been positive. All partners have expressed a growing understanding of the process and its context. Importantly, organisational partners have gained an initial ownership of the process of change, and are anticipating that the Single
29
Outcome Agreement and community planning will have more of an impact on their work in the future than possibly it has to date.
Communities and third sector partners have welcomed the more inclusive methodology adopted with this SOA, and whilst recognising the challenges of an evidence based approach, particularly with regard to prioritisation and targeting, understand the need.