Embed Size (px)
Citation preview

Stimulation of soil respiration by elevated CO2 isenhanced under nitrogen limitation in a decade-longgrassland studyQun Gaoa,1, Gangsheng Wangb,c,d,1, Kai Xueb,c,d,e, Yunfeng Yanga,2, Jianping Xieb,c,d,f, Hao Yub,c,d,g,h
, Shijie Baib,c,d,i,Feifei Liub,c,d,j, Zhili Heb,c,d,k, Daliang Ningb,c,d
, Sarah E. Hobbiel, Peter B. Reichm,n, and Jizhong Zhoua,b,c,d,o,2
aState Key Joint Laboratory of Environment Simulation and Pollution Control, School of Environment, Tsinghua University, 100084 Beijing, China; bInstitutefor Environmental Genomics, University of Oklahoma, Norman, OK 73019; cDepartment of Microbiology and Plant Biology, University of Oklahoma,Norman, OK 73019; dSchool of Civil Engineering and Environmental Sciences, University of Oklahoma, Norman, OK 73019; eCollege of Resources andEnvironment, University of Chinese Academy of Sciences, 100190 Beijing, China; fSchool of Minerals Processing and Bioengineering, Central SouthUniversity, 410083 Changsha, Hunan, China; gCollege of Environmental Science and Engineering, Liaoning Technical University, 123000 Fuxin, Liaoning,China; hKey Laboratory of Environmental Biotechnology, Research Center for Eco-Environmental Sciences, Chinese Academy of Sciences, 100085 Beijing,China; iDeep Sea Science Division, Institute of Deep Sea Science and Engineering, Chinese Academy of Sciences, 572000 Sanya, Hainan, China; jGuangdongProvincial Key Laboratory of Microbial Culture Collection and Application, Guangdong Institute of Microbiology, Guangdong Academy of Sciences, 510070Guangzhou, Guangdong, China; kEnvironmental Microbiomics Research Center, School of Environmental Science and Engineering, Sun Yat-Sen University,510006 Guangzhou, Guangdong, China; lDepartment of Ecology, Evolution and Behavior, University of Minnesota, St Paul, MN 55108; mDepartment ofForest Resources, University of Minnesota, St Paul, MN 55108; nHawkesbury Institute for the Environment, Western Sydney University, Penrith, NSW 2753,Australia; and oEarth and Environmental Sciences, Lawrence Berkeley National Laboratory, Berkeley, CA 94720
Edited by David M. Karl, University of Hawaii at Manoa, Honolulu, HI, and approved October 27, 2020 (received for review February 17, 2020)
Whether and how CO2 and nitrogen (N) availability interact toinfluence carbon (C) cycling processes such as soil respiration re-mains a question of considerable uncertainty in projecting futureC–climate feedbacks, which are strongly influenced by multipleglobal change drivers, including elevated atmospheric CO2 concen-trations (eCO2) and increased N deposition. However, because de-cades of research on the responses of ecosystems to eCO2 and Nenrichment have been done largely independently, their interac-tive effects on soil respiratory CO2 efflux remain unresolved. Here,we show that in a multifactor free-air CO2 enrichment experiment,BioCON (Biodiversity, CO2, and N deposition) in Minnesota, thepositive response of soil respiration to eCO2 gradually strength-ened at ambient (low) N supply but not enriched (high) N supplyfor the 12-y experimental period from 1998 to 2009. In contrast toearlier years, eCO2 stimulated soil respiration twice as much at lowthan at high N supply from 2006 to 2009. In parallel, microbial Cdegradation genes were significantly boosted by eCO2 at low butnot high N supply. Incorporating those functional genes into acoupled C–N ecosystem model reduced model parameter uncer-tainty and improved the projections of the effects of differentCO2 and N levels on soil respiration. If our observed results gen-eralize to other ecosystems, they imply widely positive effects ofeCO2 on soil respiration even in infertile systems.
elevated CO2 | nitrogen deposition | soil respiration | metagenomics |Earth ecosystem model
Elevation of atmospheric CO2 concentrations, owing to fossilfuel combustion and land-use changes, represents one of the
greatest scientific and political concerns of the 21st century (1).Carbon (C) movement into the atmosphere annually from soils(i.e., soil CO2 efflux or soil respiration) is much larger than annualC emissions from fossil fuel combustion (2), and thus even smallchanges in soil respiration could have significant impacts on thepace of change in atmospheric CO2. Numerous studies havedemonstrated that elevated CO2 (eCO2) has a direct stimulatoryeffect on rates of plant photosynthesis (3), and an indirect positiveeffect on soil respiration, which typically includes autotrophicrespiration from plant roots and heterotrophic respiration frommicrobial decomposition of litter and soil organic matter (SOM).The eCO2 stimulatory effect on soil respiration is commonly at-tributed to the following three mutually nonexclusive mechanismsfrom the actions of plants and microorganisms (4–7): enhancedroot respiration associated with greater belowground plant bio-mass, enhanced microbial decomposition of fresh C due to greater
supply of foliar and root-derived labile soil C, and increased mi-crobial priming of old SOM fueled by this increased supply oflabile soil C (4, 5). The stimulation of soil respiration by eCO2 (7,8) has the potential to greatly accelerate the future rate of increasein atmospheric CO2 concentrations unless matched by an off-setting increase in net C uptake.Human activities have also increased nitrogen (N) deposition
to natural ecosystems (9). N enrichment is a growing concernbecause it disturbs N-cycle processes in many ecosystems (9).Various studies have suggested that N addition can either increase(10, 11) or reduce (12–15) soil CO2 efflux, while other studies havesuggested that N addition does not influence soil CO2 efflux (16,17), depending on ecosystem type and season of the year.
Significance
The magnitude of CO2 efflux from soils (resulting from auto-trophic and heterotrophic respiration) is one of the largestuncertainties in projecting future carbon–climate feedbacks.Despite research over several decades, the magnitude, direc-tion, and duration of such feedbacks and their underlying mi-crobial mechanisms are poorly understood, especially in thecontext of potentially interacting global environmentalchanges. In a decade-long experiment examining the interac-tive effects of CO2 and N enrichment, N limitation strength-ened the stimulatory effects of elevated CO2 on soilrespiration, primarily via N mining during the decomposition ofmore recalcitrant organic compounds. This study also providesa strategy for integrating genomics information into ecosystemand Earth system models to improve carbon-cycle predictions.
Author contributions: Y.Y., S.E.H., P.B.R., and J.Z. designed research; Q.G., K.X., Y.Y., J.X.,H.Y., S.B., F.L., Z.H., S.E.H., P.B.R., and J.Z. performed research; G.W. contributed newreagents/analytic tools; Q.G., G.W., and D.N. analyzed data; and Q.G., G.W., Y.Y., S.E.H.,P.B.R., and J.Z. wrote the paper.
The authors declare no competing interest.
This article is a PNAS Direct Submission.
Published under the PNAS license.1Q.G. and G.W. contributed equally to this work.2To whom correspondence may be addressed. Email: [email protected] or [email protected].
This article contains supporting information online at https://www.pnas.org/lookup/suppl/doi:10.1073/pnas.2002780117/-/DCSupplemental.
First published December 14, 2020.
www.pnas.org/cgi/doi/10.1073/pnas.2002780117 PNAS | December 29, 2020 | vol. 117 | no. 52 | 33317–33324
ECOLO
GY
Dow
nloa
ded
by g
uest
on
Dec
embe
r 12
, 202
1

The stimulation of soil respiration by eCO2 also could bestrongly influenced by variability in ambient soil N availabilityand the rate of atmospheric N deposition (18). However, studiesthat have explored the interactive effects of eCO2 and N on soilrespiration are extremely scarce. For instance, an open-top studyof young subtropical tree seedlings in contrasting eCO2 and Ntreatments in transplanted soil found that response to eCO2 wasenhanced by high levels of N addition (10 g·m−2·y−1) in theearliest 2 y but unaffected by the same N supply in thesubsequent year (19, 20). A free-air enrichment study in peren-nial grasslands also found no interaction between eCO2 and Naddition treatments over the first 2 y of the study (21). Given thatmany questions about such potential interactions remain unre-solved (22), here we report on 12 y of results in that samegrassland study, assessing whether interactions develop and, if so,what underlying mechanisms might drive them.It is well known that N availability alters many aspects of
ecosystems (12, 23, 24) and thus could hypothetically influenceresponses of soil respiration to eCO2. Three potentially off-settingand interrelated mechanisms have been proposed. First, N limi-tation could affect belowground productivity and thus root respi-ration. For example, if N limitation constrains plant canopydevelopment and the stimulatory effect of eCO2 on photosyn-thesis, and thus limits total productivity belowground, root respi-ration will decline (24). On the other hand, the same N limitationconstraint on canopy development combined with stimulatory ef-fects of eCO2 on photosynthesis could increase plant investmentof C in nutrient-absorbing systems (25, 26), favoring C allocationto roots at the expense of aboveground biomass. Such a shift inallocation could increase root respiration (27). Second, changes inroot detrital production and exudation of labile C into soils caninfluence substrate supply that fuels soil microbial activity andheterotrophic respiration. Third, the supply of labile C into soilscan influence decomposition of SOM through the priming effect,which would also influence soil heterotrophic respiration (28).Under N limitation, greater photosynthesis caused by eCO2 couldstimulate mining of N from SOM, and thus soil heterotrophicrespiration, through enhanced priming mechanisms (29).Although various studies indicate that N availability plays crit-
ical roles in mediating soil respiration (10–17, 23, 30, 31), diver-gent results are observed: positive (10, 11, 23), neutral (16, 17, 30),or negative (12–15, 30, 31). Thus, the impacts of N availability onthe magnitude and duration of the eCO2 enhancement of soilrespiration and its underlying mechanisms remain elusive, partic-ularly under field settings. In addition, recent modeling effortsdemonstrated the importance of understanding microbial C de-composition for more confidently extrapolating soil C cyclingprocesses (32, 33). However, to date, it remains uncertain whetherand how microbial processes influence the responses of terrestrialecosystems to eCO2 and N deposition and how best to incorporateinformation regarding microbial responses to eCO2 and N intoclimate-C models for better simulation and prediction (32, 34, 35).Herein, we report results from a well-replicated long-term
(12 y at the time of sampling) CO2 × N experiment, BioCON(Biodiversity, CO2, and N deposition) (24), to elucidate the in-teractive effects of eCO2 and N enrichment on soil respirationand their underlying mechanisms. From 1998 to 2009, we mea-sured soil CO2 efflux and other biogeochemical processes on 296plots containing different numbers (1, 4, 9, or 16 species) andcombinations (C3 and C4 grasses, forbs, and legumes) of pe-rennial plant species at ambient CO2 (aCO2) or eCO2 (+180ppm) with either ambient N supply (aN) or enriched N supply(eN, i.e., +4 g N·m−2·y−1). Hereafter, we refer to these fourtreatment combinations as aCO2-aN, eCO2-aN, aCO2-eN, andeCO2-eN. The contrasting high versus low levels of N supply inthis study was a rough proxy for a part of the worldwide range ofN supply rates in soils as well as for times or places with lowversus high N deposition (24). Thus, we posit that the results are
relevant to understanding the potentially different responses toeCO2 of both low versus high N fertility soils and contexts withlow versus high N deposition. In 2009, we also assessed responsesof microbial community functional gene structure to eCO2 and Nenrichment to gain insights into microbial regulation of soilrespiration. In addition, we incorporated microbial functionaltrait information into ecosystem models to explore means ofbetter prediction of C cycling. Our overarching hypothesis is thatN limitation would accelerate the stimulatory effects of eCO2 onsoil respiration, primarily via microbial N mining mechanisms.We further explored the possibility that microbial functional traitinformation would greatly help to constrain the uncertainty ofmodel parameters and hence significantly improve confidence inmodel simulations and predictions.
Results and DiscussionN Modulation of the Stimulatory Effect of eCO2 on Soil Respiration.Soil CO2 efflux was measured ca. biweekly during the growingseason (May to August) from 1998 to 2009. Overall, significantly(P < 0.01) higher soil respiration was observed at eCO2 thanaCO2 at both low and high N supply (Fig. 1A), indicating thateCO2 stimulated soil respiration, consistent with previous re-ports (6, 7). Along with significant main effects of CO2, N, andplant species diversity as individual treatments, there were sig-nificant CO2 × N (P = 0.03; Table 1) and CO2 × N × year (P =0.05) interactive effects on soil respiration, indicating that thestimulatory effect of eCO2 on soil respiration was modulated byN supply and that this interaction varied with time. Although theeffect of eCO2 varied with plant diversity (P = 0.01 for the CO2 ×plant diversity interaction; Table 1), the CO2 × N interaction wasindependent of plant diversity (P = 0.83 for the three-way in-teraction of CO2 × N × plant diversity; Table 1).To better identify the timing of the shift in the responses of
soil respiration to eCO2 at contrasting N supplies, four com-monly used change-point tests—Pettitt’s test, Buishand rangetest, Buishand U test, and standard normal homogeneity test (SIAppendix, Table S1)—were used. Our results indicated that 2005was the breakpoint when the N influence on the stimulatoryeffects of eCO2 on soil respiration significantly changed (SIAppendix, Table S1). Therefore, we have divided the whole ex-perimental period into two phases: phase I from 1998 to 2005and phase II from 2006 to 2009 (see Materials and Methods fordetails). Using this breakpoint, the CO2 × N interactive effectson soil respiration significantly differed between these two pha-ses, as indicated by a significant three-way interaction, CO2 ×N × phase, on soil respiration (P = 0.02; SI Appendix, Table S2).In phase I, eCO2 significantly (P < 0.01) stimulated mean soilrespiration regardless of N level (+22% vs. +24% at low andhigh N, respectively, Fig. 1B; P = 0.07 for the CO2 × N inter-action, SI Appendix, Table S3). In contrast, the CO2 × N inter-action became significant (P < 0.01; SI Appendix, Table S3) inphase II, and eCO2 stimulated mean soil respiration by 40% atlow N supply but by only 19% at high N supply (Fig. 1C). Theseresults indicate that long-term N limitation strengthened thestimulatory effects of eCO2 on soil respiration as the experimentproceeded.Conceptually, the changing interactive effects of N and eCO2
on soil respiration between phase I and phase II were most likelydue to soil processes, plant characteristics, and microbial com-munity structure (21, 34, 36–40). Similar to soil respiration, sig-nificant (P < 0.01) CO2 × N × phase interactions were observedfor soil net N mineralization rate and aboveground plant Nconcentration, but not for other soil and plant variables (SIAppendix, Table S2), indicating that there were temporal shifts inCO2 × N effects on those two variables. By examining the CO2 ×N effect per year from 1998 to 2009, we found that the CO2 × Neffect on soil respiration was significantly correlated with that onsoil net N mineralization rate (P = 0.05), aboveground plant N
33318 | www.pnas.org/cgi/doi/10.1073/pnas.2002780117 Gao et al.
Dow
nloa
ded
by g
uest
on
Dec
embe
r 12
, 202
1

concentration (P = 0.04), and aboveground plant C/N ratio (P =0.03) (SI Appendix, Table S4). Further analysis revealed thateCO2 had no effect on net N mineralization rate at both Nsupplies in phase I but significantly increased the mineralizationrate at high, but not low N supply, in phase II (SI Appendix, Fig.S1 A and B). In addition, aboveground plant N concentrationwas 8% lower at low than high N supply in phase I but was 20%lower in phase II (SI Appendix, Fig. S1 C and D). These datasuggest that soil and plant N availability became more limited atlow than high N supply as the time proceeded. The progressive Nlimitation could lead to less C allocation by plants to grow butmore labile C inputs by eCO2 at low N supply (41), stimulatingSOM decomposition and soil respiration. Collectively, the morepositive soil respiration response to eCO2 at lower than higher Nsupply in phase II is probably related, at least in part, to the N-mediated phase shift of soil and plant N dynamics in response toeCO2. Similarly, microbes play important roles in regulating theinteractive effects of CO2 and N on soil respiration, as discussed inthe following section.
Roles of Microbial Processes. The stimulation of soil respiration byeCO2 might be caused by changes in heterotrophic microbialprocesses and/or root-associated autotrophic processes (26).However, partitioning soil respiration into autotrophic and het-erotrophic respiration is generally difficult (42). Thus, we usedroot biomass as a proxy to determine whether autotrophic respi-ration was a major component of our observed soil efflux interac-tion over time, given certain assumptions and caveats (43, 44). Rootrespiration is driven by a number of factors, including current soiltemperature, prior soil temperature (which could drive acclima-tion), tissue N concentration, and soil water (45–48), as well as rootbiomass (43). Several of these factors (e.g., soil temperature, soilmoisture, and root N concentration) showed no significant differ-ence between eCO2 and aCO2 plots at both low and high N supply(SI Appendix, Table S5). Hence, although translating root biomassinto absolute values of simulated soil respiration is challenging,assuming that root biomass is a reliable measure of relative dif-ferences in autotrophic respiration seems sound.To evaluate whether root biomass mirrored the shifting N
effect on eCO2 stimulation of soil respiration, we examined itsresponses to CO2 and N. In phase I, eCO2 stimulated root bio-mass to similar extents at low (11%) and high N (14%) supply(SI Appendix, Fig. S1E), which might partially account for theparallel responses of soil respiration to eCO2 at low and high Nsupply (Fig. 1B). In contrast, live root biomass was stimulatedmore by eCO2 at high N (22%) than low N (14%) supply inphase II (SI Appendix, Fig. S1F), whereas soil respiration wasstimulated less by eCO2 at high N (19%) than at low N (40%)supply (Fig. 1C). Thus, live root biomass and associated auto-trophic respiration responses likely were not the main drivers of
the shifting responses of soil respiration to CO2 and N treat-ments, as mentioned above (SI Appendix, Table S4).To examine the potential importance of different microbial
processes in explaining the phase shift in CO2 × N interactiveeffects on soil respiration, we analyzed the composition andabundance of microbial functional genes for soil samples col-lected in 2009 using GeoChip (49). GeoChip is a genericmicroarray targeting hundreds of functional gene categoriesimportant to biogeochemical, ecological, and bioremediationprocesses. As predicted, the functional community structure wassignificantly shifted by CO2, N, and plant diversity treatments (SIAppendix, Table S6). All functional gene categories involved in Cdegradation and N cycling showed significant (P ≤ 0.05) ormarginally significant (P ≤ 0.10) correlations across plots withmean soil CO2 efflux in phase II (SI Appendix, Table S7), butnone of them did so in phase I (P > 0.10). Thus, microbialcommunities could play an important role in mediating the phaseshift of N-induced differences in the soil respiration responseto eCO2.Directly relevant to questions of CO2 × N interactive effects
on soil CO2 efflux in phase II, many microbial genes involved inC degradation and N cycling were significantly stimulated orsuppressed by eCO2, but in different ways at low than at high Nsupply (Fig. 2). In general, at low N supply, most genes related toC degradation and N cycling were stimulated by eCO2 (Fig. 2A),whereas at high N supply most were slightly suppressed (Fig. 2B).Among those genes, antagonistic CO2 × N effects, whereby the
B
low N high N
Soi
l CO
2 effl
ux (μ
mol
m-2 s
-1)
0.0
2.5
5.0
7.5
10.0 aCO2eCO2
22% ** 24% **
1998-2005
0.0
2.5
5.0
7.5
10.0A
low N high N
27% ** 22% **
aCO2eCO2
1998-2009
Soi
l CO
2 effl
ux (μ
mol
m-2 s
-1)
low N high N
Soi
l CO
2 effl
ux (μ
mol
m-2 s
-1)C
0.0
2.5
5.0
7.5
10.0 aCO2eCO2
2006-2009
40% ** 19% **
Fig. 1. Observed responses of soil CO2 efflux to eCO2 at different N supply levels. (A) Soil CO2 efflux from 1998 to 2009. (B) Soil CO2 efflux from 1998 to 2005(phase I). (C) Soil CO2 efflux from 2006 to 2009 (phase II). Each bar shows the annual mean plus SE of 74 plots. Percent changes of soil CO2 efflux in eCO2 plotsrelative to aCO2 plots are labeled above the bars. P values of the permutation t test are labeled **P < 0.01.
Table 1. The main and interactive effects of CO2, N, and plantdiversity (PD) on soil CO2 efflux measured from 1998 to 2009based on repeated-measures mixed model across 296 plots
F P
CO2 763.33 <0.01N 59.56 <0.01PD 692.89 <0.01Year 410.76 <0.01CO2 × N 4.63 0.03CO2 × PD 13.99 0.01N × PD 2.34 0.12CO2 × year 9.02 0.01N × year 15.69 0.01PD × year 4.32 0.03CO2 × N × PD 0.04 0.83CO2 × N × year 3.73 0.05CO2 × PD × year 3.02 0.08N × PD × year 0.16 0.69CO2 × N × PD × year 0.51 0.47
Significant (P < 0.05) effects are bolded.
Gao et al. PNAS | December 29, 2020 | vol. 117 | no. 52 | 33319
ECOLO
GY
Dow
nloa
ded
by g
uest
on
Dec
embe
r 12
, 202
1
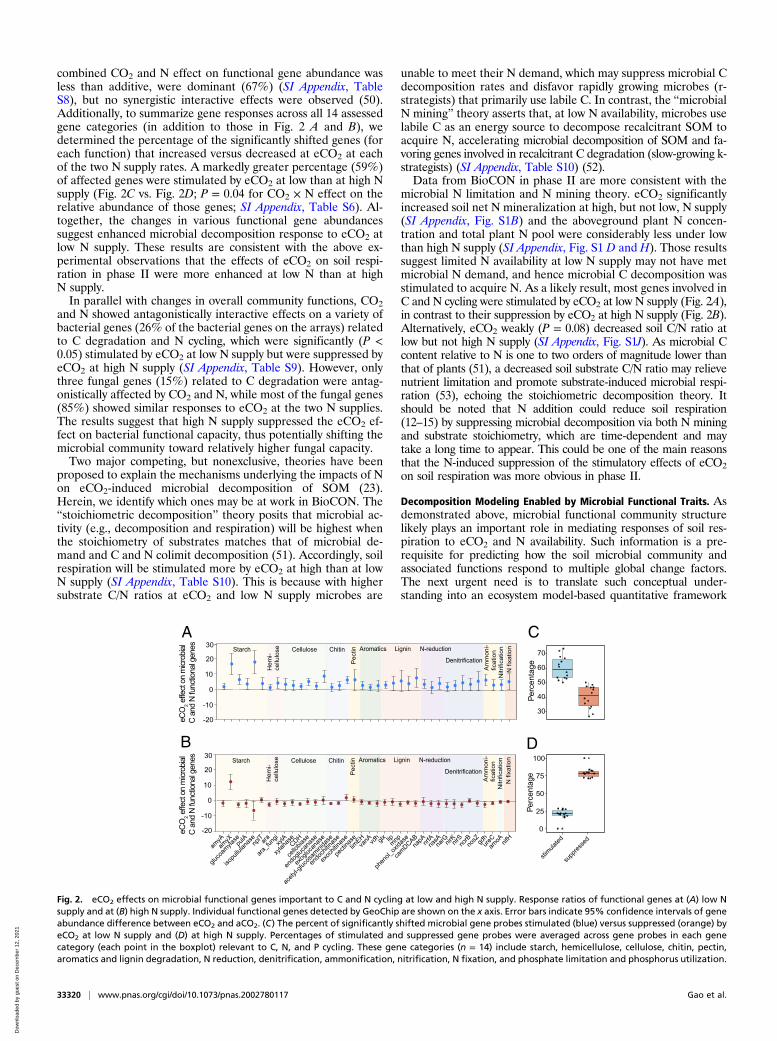
combined CO2 and N effect on functional gene abundance wasless than additive, were dominant (67%) (SI Appendix, TableS8), but no synergistic interactive effects were observed (50).Additionally, to summarize gene responses across all 14 assessedgene categories (in addition to those in Fig. 2 A and B), wedetermined the percentage of the significantly shifted genes (foreach function) that increased versus decreased at eCO2 at eachof the two N supply rates. A markedly greater percentage (59%)of affected genes were stimulated by eCO2 at low than at high Nsupply (Fig. 2C vs. Fig. 2D; P = 0.04 for CO2 × N effect on therelative abundance of those genes; SI Appendix, Table S6). Al-together, the changes in various functional gene abundancessuggest enhanced microbial decomposition response to eCO2 atlow N supply. These results are consistent with the above ex-perimental observations that the effects of eCO2 on soil respi-ration in phase II were more enhanced at low N than at highN supply.In parallel with changes in overall community functions, CO2
and N showed antagonistically interactive effects on a variety ofbacterial genes (26% of the bacterial genes on the arrays) relatedto C degradation and N cycling, which were significantly (P <0.05) stimulated by eCO2 at low N supply but were suppressed byeCO2 at high N supply (SI Appendix, Table S9). However, onlythree fungal genes (15%) related to C degradation were antag-onistically affected by CO2 and N, while most of the fungal genes(85%) showed similar responses to eCO2 at the two N supplies.The results suggest that high N supply suppressed the eCO2 ef-fect on bacterial functional capacity, thus potentially shifting themicrobial community toward relatively higher fungal capacity.Two major competing, but nonexclusive, theories have been
proposed to explain the mechanisms underlying the impacts of Non eCO2-induced microbial decomposition of SOM (23).Herein, we identify which ones may be at work in BioCON. The“stoichiometric decomposition” theory posits that microbial ac-tivity (e.g., decomposition and respiration) will be highest whenthe stoichiometry of substrates matches that of microbial de-mand and C and N colimit decomposition (51). Accordingly, soilrespiration will be stimulated more by eCO2 at high than at lowN supply (SI Appendix, Table S10). This is because with highersubstrate C/N ratios at eCO2 and low N supply microbes are
unable to meet their N demand, which may suppress microbial Cdecomposition rates and disfavor rapidly growing microbes (r-strategists) that primarily use labile C. In contrast, the “microbialN mining” theory asserts that, at low N availability, microbes uselabile C as an energy source to decompose recalcitrant SOM toacquire N, accelerating microbial decomposition of SOM and fa-voring genes involved in recalcitrant C degradation (slow-growing k-strategists) (SI Appendix, Table S10) (52).Data from BioCON in phase II are more consistent with the
microbial N limitation and N mining theory. eCO2 significantlyincreased soil net N mineralization at high, but not low, N supply(SI Appendix, Fig. S1B) and the aboveground plant N concen-tration and total plant N pool were considerably less under lowthan high N supply (SI Appendix, Fig. S1 D and H). Those resultssuggest limited N availability at low N supply may not have metmicrobial N demand, and hence microbial C decomposition wasstimulated to acquire N. As a likely result, most genes involved inC and N cycling were stimulated by eCO2 at low N supply (Fig. 2A),in contrast to their suppression by eCO2 at high N supply (Fig. 2B).Alternatively, eCO2 weakly (P = 0.08) decreased soil C/N ratio atlow but not high N supply (SI Appendix, Fig. S1J). As microbial Ccontent relative to N is one to two orders of magnitude lower thanthat of plants (51), a decreased soil substrate C/N ratio may relievenutrient limitation and promote substrate-induced microbial respi-ration (53), echoing the stoichiometric decomposition theory. Itshould be noted that N addition could reduce soil respiration(12–15) by suppressing microbial decomposition via both N miningand substrate stoichiometry, which are time-dependent and maytake a long time to appear. This could be one of the main reasonsthat the N-induced suppression of the stimulatory effects of eCO2on soil respiration was more obvious in phase II.
Decomposition Modeling Enabled by Microbial Functional Traits. Asdemonstrated above, microbial functional community structurelikely plays an important role in mediating responses of soil res-piration to eCO2 and N availability. Such information is a pre-requisite for predicting how the soil microbial community andassociated functions respond to multiple global change factors.The next urgent need is to translate such conceptual under-standing into an ecosystem model-based quantitative framework
A
B
C
D
Fig. 2. eCO2 effects on microbial functional genes important to C and N cycling at low and high N supply. Response ratios of functional genes at (A) low Nsupply and at (B) high N supply. Individual functional genes detected by GeoChip are shown on the x axis. Error bars indicate 95% confidence intervals of geneabundance difference between eCO2 and aCO2. (C) The percent of significantly shifted microbial gene probes stimulated (blue) versus suppressed (orange) byeCO2 at low N supply and (D) at high N supply. Percentages of stimulated and suppressed gene probes were averaged across gene probes in each genecategory (each point in the boxplot) relevant to C, N, and P cycling. These gene categories (n = 14) include starch, hemicellulose, cellulose, chitin, pectin,aromatics and lignin degradation, N reduction, denitrification, ammonification, nitrification, N fixation, and phosphate limitation and phosphorus utilization.
33320 | www.pnas.org/cgi/doi/10.1073/pnas.2002780117 Gao et al.
Dow
nloa
ded
by g
uest
on
Dec
embe
r 12
, 202
1

because process-based microbial-explicit ecosystem models canprovide mechanistic insights, integration, and scenario testing notavailable from or possible with experiments (54). In this regard,microbial-explicit ecosystem models will enable us to mechanisti-cally simulate large-scale experiments that would be too costly toestablish in reality and predict their future dynamics. However, agrand challenge in ecology is how to integrate microbial functionaltraits into ecosystem models to improve their performance andpredictive ability (55).To address the above challenge, we incorporated the Geo-
Chip-detected microbial functional genes into the C–N coupledmicrobial-enzyme decomposition (MEND) model (SI Appendix,Fig. S2A and Tables S11–S15). We used tMEND to denote theMEND model parameterized with traditional observations suchas soil CO2 efflux and mineral N concentrations. For compari-son, gMEND refers to the MEND model calibrated with addi-tional GeoChip-based microbial functional gene abundance data(Fig. 3A and SI Appendix, Fig. S3A). We compared the results ofthese two microbial models (tMEND, gMEND) plus a thirdmodel, the nonmicrobial C-only terrestrial ecosystem (TECO)model (SI Appendix, Fig. S2B). In addition to the best fit betweenobserved and simulated soil CO2 efflux and mineral N (NH4
+
and NO3–) concentrations, we constrained the model by
achieving the highest goodness of fit between MEND-modeledrelative changes in enzyme concentrations and GeoChip-de-tected relative changes in oxidative and hydrolytic gene abun-dances in response to eCO2 (SI Appendix, Table S11).The eCO2-induced changes in hydrolytic and oxidative genes
observed by GeoChip were consistent with changes simulated bygMEND but not tMEND (Fig. 3A). Also, the parameter un-certainty (i.e., coefficient of variation) of gMEND was consid-erably reduced compared to both tMEND (by 35%) and thenonmicrobial C-only TECO model (by 86%; Fig. 3B). As a re-sult, the gMEND model was able to simulate the observed soilCO2 efflux at aCO2-aN relatively well (R2 = 0.61; Fig. 3C). Inaddition, the gMEND model that had been calibrated only withthe data at aCO2-aN was further validated against independentdatasets from the other three CO2 and N treatments. The per-formance was almost as good as model calibration for ambient
conditions (5% less variance explained on average) (R2 = 0.53 to0.59; Fig. 3D). In contrast, the TECO model explained consid-erably less variation in observed soil respiration at the otherthree treatment combinations (R2 = 0.35 to 0.44; Fig. 3D) than atambient conditions (explaining about 16% less of the variance).These differences suggest that gMEND better adjusts for CO2and N effects than TECO. Finally, gMEND-simulated ammo-nium and nitrate concentrations also agreed fairly well with theobservations (SI Appendix, Fig. S3B). Altogether, the above re-sults suggested that the gMENDmodel can capture the dynamicsof soil CO2 efflux reasonably well, comparable to or better thanseveral previously field modeling studies (56, 57).We further estimated eCO2-induced soil C loss via hetero-
trophic respiration. Our simulations showed that eCO2 wouldcause 38% and 20% more heterotrophic respiration at low andhigh N supply (Fig. 3E), respectively, and that enriched N wouldlead to 18% and 2% more heterotrophic respiration at aCO2 andeCO2 (Fig. 3E), respectively. We then asked what the implica-tions might be if such results were general for grasslands globally.Applying our results to the world’s grasslands based on the In-ternational Geosphere-Biosphere Program classification schemeand the estimated annual soil respiration from grasslands be-tween 2001 and 2009 (58), eCO2 (+180 ppm) alone would in-crease heterotrophic respiration by 1.6 ± 0.1 Pg C·y−1 whereasenriched N (+4 g N·m−2·y−1) alone would increase heterotrophicrespiration by 0.8 ± 0.2 Pg C·y−1. However, combined eCO2 andenriched N would increase heterotrophic respiration by 1.7 ± 0.2Pg C·y−1 across global grasslands, 29% less than the additiveeffects of eCO2 and enriched N alone. Thus, interactions notedherein could be significant globally.Although our modeling results via calibration (Fig. 3 A–C) and
validation (Fig. 3D) indicated that the gMEND could encapsu-late the dynamics of soil CO2 efflux fairly well, about 40% of thevariation was not captured, likely for two primary reasons. First,various experimental measurements such as gross primary pro-ductivity, soil CO2 efflux, temperature, moisture, and microbialtraits were highly variable and some were uncertain, which couldcontribute to the discrepancy between model simulations andexperimental observations. Second, the MEND model used in
CBA
D E
Fig. 3. Model simulations. (A) Comparison of eCO2-induced percent changes of hydrolytic and oxidative enzymes observed by GeoChip to the simulatedeffects by gMEND and traditional MEND without gene information (tMEND) at low N supply. The GeoChip data were obtained from the samples from 2009.(B) Parameter uncertainty quantified by the coefficient of variation (CV) for the nonmicrobial C-only TECO, tMEND, and gMEND models; the bars show meanCV of 10 calibrated parameters represented by dots. (C) Model calibration with the soil respiration (Rs, 1998 to 2009) at aCO2-aN. (D) Model validations wereperformed using Rs at eCO2-aN, aCO2-eN, and eCO2-eN for gMEND and TECO. (E) Percent changes of gMEND-simulated heterotrophic respiration (Rh) be-tween different CO2 and N levels. The error bars represent SEs. P values of the permutation t test are labeled as **P < 0.01.
Gao et al. PNAS | December 29, 2020 | vol. 117 | no. 52 | 33321
ECOLO
GY
Dow
nloa
ded
by g
uest
on
Dec
embe
r 12
, 202
1

this study does not consider the differential roles of diverse mi-crobial communities (e.g., bacteria and saprotrophic and my-corrhizal fungi) in regulating C–N cycling in response to eCO2and enriched N supply owing to our poor understanding of theseprocesses (8). Incorporating additional biological processes andtheir interactions into the MEND model may improve themodeling of soil CO2 efflux and its response to environmentalchange (8). Nevertheless, this study demonstrates the feasibilityof integrating massive omics information into ecosystem modelsfor better predictions of the soil C response to eCO2 andenriched N.
ConclusionsWe found that the positive effect of eCO2 on soil respiration atlow N supply was greater in years 9 to 12 than in years 1 to 8 of along-term experiment and that changes in microbial functionaltraits, such as functional genes involved in C and N cyclingprocesses, as well as temporal shifts in soil and plant N avail-ability, likely underlie this dynamic. These findings would, ifgeneral, have important implications for predicting the responsesof ecosystems to future environmental changes. For example,considering that N limitation is widespread in natural ecosys-tems, considerable stimulation of soil respiration in response torising CO2 concentration might occur. Pervasive N depositiondue to anthropogenic activities could offset, at least partially, thestimulation of soil respiration by elevated atmospheric CO2, andthus could weaken the positive feedback between the terrestrialC cycle and climate change. Our study also shows that whethermicrobially mediated feedback to rising CO2 concentrations andclimate change is positive or negative depends on microbialfunctional groups and whether their associated functions arestimulated by eCO2, suggesting the necessity of integrating mi-crobial functional traits into climate-C models for better pre-diction (34, 55). As expected, incorporating those functionalgenes into a coupled C–N ecosystem model substantially reducedmodel parameter uncertainty and improved the prediction of soilrespiration in response to eCO2 and enriched N supply. Al-though further model development, calibration, and validationof a microbially enabled model will require rigorous bench-marking with observations, this study serves as a step forward tomechanistically assimilate microbial functional traits intoclimate-C cycle modeling.
Materials and MethodsExperimental Design and Sampling. The BioCON experiment contains 296main plots with a fully factorial 2 × 2 × 4 combinations of three treatments:CO2 (ambient vs. +180 ppm), N deposition (ambient vs. +4 g N·m−2·y−1), andplant diversity (1, 4, 9, or 16 species) (59). Plots were established with di-versity treatments in 1997. The CO2 and N treatments began in 1998. The296 plots are evenly distributed among six rings with split-plot arrangementof CO2 and N treatments. CO2 treatment is the whole-plot factor. The sub-plot N and plant diversity treatments were randomly distributed and repli-cated in individual plots among the six rings. Although ambient CO2
concentration has increased during the experimental period, resulting ininconstant ambient CO2 concentrations over time, a free-air CO2 enrichmentsystem is used to provide a constant elevation of CO2 by an average of 180ppm above ambient in three elevated CO2 (eCO2) rings. The other threeambient CO2 rings (aCO2) were treated identically but without additionalCO2. Half of the plots in each ring received N amendments of 4 g N·m−2·y−1
applied as NH4NO3 on three dates each year. As a consequence, there werein total four CO2 and N treatments among 296 plots: aCO2 and low N (aCO2-aN), eCO2 and low N (eCO2-aN), aCO2 and high N (aCO2-eN), and eCO2 andhigh N (eCO2-eN), with each treatment having 74 plots (biological repli-cates). For each of the four CO2 and N treatments, there were 32 plotsplanted with 1 species, 15 plots planted with 4 species, 15 plots planted with9 species, and 12 plots planted with 16 species (59).
Plant and Soil Variables. Each year (1998 to 2009) in every plot, above- andbelowground (0- to 20-cm depth) plant biomass were mainly measured inAugust (59). Soil net N mineralization rates were measured in situ each year
in each plot for a ca. 1-mo period using a semiopen core in July (24). Net Nmineralization is the net transformation of N from organic to inorganicforms and is considered to represent the availability of N to plants. Plant Nconcentration (percent aboveground plant and root) and plant C/N ratio(aboveground plant and root) were measured in August from 2001 to 2009.Soil C/N ratio was measured in years 2002 and 2007.
Soil CO2 efflux in each plot was measured for 11 to 36 times per year usinga LI-COR 6400-09 soil CO2 efflux chamber from 1998 to 2009. Measurementsmade during peaking growing seasons (from May to August) were used inthis study, as those data best reflect growing season ecosystem functioning.Within each of those months, soil CO2 efflux was measured two to five timesin each plot. In the short term, soil CO2 efflux measured using chambertechniques may deviate from the instantaneous soil respiration due tochanging CO2 stored in the soil pore space (60). However, in the medium tolong term, soil CO2 efflux corresponds to soil respiration as all CO2 producedin the soil must be emitted from the soil. Thus, in this study, we use “soil CO2
efflux” and “soil respiration” in an exchangeable way.
GeoChip Experiments and Raw Data Processing. Soil samples for microbialcommunity analysis were collected from the 296 plots in August 2009. Mi-crobial genomic DNA was extracted from 5 g of well-mixed soil for eachsample by combining freeze-grinding and sodium dodecyl sulphate for celllysis and purified by agarose gel electrophoresis, followed by phenol–chloroform–butanol extraction as previously described (61). The functionalgene array GeoChip 4.0 was used for DNA microarray hybridization. As de-scribed previously (62), the DNA samples were labeled with fluorescent dyeCy-3 dUTP and hybridized with the slides with GeoChip 4.0M in a rotator/incubator at 67 °C plus 10% formamide and rotated at 20 rpm for 24 h. Afterhybridization, GeoChip was scanned at 100% laser power and 100% pho-tomultiplier tubes gain with a NimbleGen MS 200 Microarray Scanner (RocheNimbleGen). Scanned images were gridded by NimbleScan software (Roche)to obtain the signal intensity for each probe. Raw data obtained fromNimbleScan was submitted to the Microarray Data Manager at http://ieg.ou.edu/microarray/ and analyzed by the data analysis pipeline (49). We re-moved spots with the signal-to-noise ratio below 2, considered aspoor quality.
Model Simulation and Prediction. Details for modeling methods are providedin SI Appendix, Supplementary Information Text. Briefly, we used a non-microbial C-only TECO model and a C–N coupled MEND model to simulatedaily soil CO2 efflux for four CO2 and N treatments from 1998 to 2009. InTECO model, we used a group of first-order ordinary differential equationsto describe the C turnover among fast, slow, and passive SOM pools (SIAppendix, Fig. S2B). We set prior ranges of C turnover rates based on aprevious study (63), which were modified by soil temperature (T) andmoisture (W) during the simulations. In comparison, The C–N coupled MENDmodel describes both C and N transformation processes in the followingpools: oxidative and hydrolytic particulate organic matter (POMO andPOMH), mineral-associated organic matter (MOM), active MOM (QOM),dissolved organic matter (DOM), active and dormant microbial biomass (MBA
and MBD), three enzyme functional groups, and mineral N (NH4+ and NO3
–)(SI Appendix, Fig. S2A). The two POM pools are decomposed by oxidative orhydrolytic enzymes, while the MOM is decomposed by both. Model statevariables, governing equations, component fluxes, and parameters areshown in SI Appendix, Tables S12–S15.
The modified shuffled complex evolution algorithm was used to calibratemodel parameters for both TECO and MEND models under the aCO2-aNtreatment (SI Appendix, Supplementary Information Text). We then vali-dated the model using the same set of model parameters calibrated foraCO2-aN to simulate soil CO2 efflux under the other three treatments. Mi-crobial gene abundances were used as objective functions to calibrate modelparameters only for the gMEND model (57). The coefficient of determina-tion (R2) was used to estimate the model performance between simulatedand observed soil CO2 efflux (64). Additional observational variables (NH4
+
and NO3– concentrations and response ratios of oxidative and hydrolytic
enzymes) for MEND model calibration and validation are shown in SI Ap-pendix, Table S11. Parameter uncertainty of TECO model was quantified byprobabilistic inversion (Markov chain Monte Carlo) algorithm while that ofMEND model was quantified by the critical objective function index method.
Statistical Analyses. Since microbial community structure was determinedwith all 296 soil samples collected in 2009, this study focused on the soil CO2
efflux from the beginning of the BioCON experiment until 2009. To identifythe year in which interaction between CO2 and N emerged, we calculatedthe response ratio (RR) of soil CO2 efflux differences between eCO2 and
33322 | www.pnas.org/cgi/doi/10.1073/pnas.2002780117 Gao et al.
Dow
nloa
ded
by g
uest
on
Dec
embe
r 12
, 202
1

aCO2 at low or high N supply in every month of the growing season. The Ninfluence was then calculated as RR at high N supply minus RR at low Nsupply, representing the CO2 × N interaction. The annual mean value of theN influence was calculated for each year. Four commonly used change-pointtests, including Buishand range test, Buishand U test, standard normal ho-mogeneity test, and Pettitt’s test, were performed on the annual meanvalues of the N influence. Because no soils were collected for microbialanalysis in phase I, most of the statistics-based mechanistic analyses werefocused on phase II.
For each year from 1998 to 2009, data points of soil CO2 efflux (micro-moles per mole2 per second) that were higher than mean plus 1.96 SDs orlower than mean minus 1.96 SDs of all data points in a plot were regarded asoutliers and removed before the analysis (65). By doing this, we reduced thewithin-plot variation in soil CO2 efflux measurements to enhance the sta-tistic power. We used the same approach to identifying and excludingoutliers for other soil and plant variables, including soil net N mineralizationrate (milligrams per kilogram per day), soil temperature (degrees Celsius),soil moisture, soil pH, soil C/N ratio, plant N concentration (percent), plantC/N ratio, plant biomass (grams per meter2) and plant N pool (grams permeter2). Net N mineralization data in 2008 were contaminated and thuswere not included in the analysis (41). The significance of CO2 × N effectsand CO2 × N × phase effects on soil CO2 efflux, soil, and plant variables wastested using repeated-measures mixed models following the previousmethod (66). The CO2 × N effects (N influence on the eCO2 effect) on each ofthe soil and plant variables and on soil CO2 efflux were calculated per yearfrom 1998 to 2009, then relationships between CO2 × N effects on soil/plantvariables and on soil CO2 efflux were examined using Pearson correlation.
The eCO2 effects on soil and plant variables as well as microbial functionalgenes at low and high N supply were calculated based on Eqs. 1 and 2:
eCO2effectatlowNsupply = 100% × eCaN − aCaN
aCaN[1]
eCO2effectathighNsupply = 100% × eCeN − aCeN
aCeN, [2]
where eCeN, eCaN, aCeN, and aCaN represent mean of soil CO2 efflux, soilvariables, plant variables, or the relative abundance of microbial functionalgenes in eCO2-eN, eCO2-aN, aCO2-eN, and aCO2-aN plots, respectively. Per-mutation t test was conducted to examine the significance of the eCO2 effecton plant and soil properties at both low and high N supply (67). At the low orhigh N supply, the significance of eCO2 effect on the abundance of eachfunctional gene (total abundance of all probes of this gene; SI Appendix, TableS8) was examined by response ratio with 95% confidence intervals of geneabundance differences between eCO2 and aCO2 plots. We also examined the
eCO2 effect on the abundance of each gene probe by response ratio. Of allsignificantly changed probes of an individual gene, we calculated the per-centages of stimulated and suppressed probes by eCO2. Then, we calculatedthe averaged percentages of stimulated and suppressed probes across genes indifferent gene categories for C cycling, including starch, hemicellulose, cellu-lose, chitin, pectin, aromatics and lignin degradation, gene categories for Ncycling, including assimilatory/dissimilatory N reduction, denitrification, am-monification, nitrification, and N fixation as well as gene categories forphosphorus (P) cycling, including P fixation and P utilization.
To determine the direction (additive, synergistic, or antagonistic) of in-teractive effects of CO2 and N on functional genes, we compared the ob-served effects (OEs, i.e., combined eCO2 and enriched N effects) and theexpected effects (EEs), that is, additive effects of eCO2 alone and enriched Nalone (50). For each functional gene, OE was calculated as follows:
100% × eCeN−aCaNaCaN
. EE was calculated as follows: 100% × eCaN−aCaNaCaN
+
100% × aCeN−aCaNaCaN
. The interactive effects are additive when OE is not dif-
ferent from EE. Interactive effects are synergistic if OE is significantly higherthan EE or antagonistic if OE is significantly lower than EE. The significanceof the interactive CO2 and N effect on each functional gene was tested bythe permutational multivariate analysis of variance (Adonis) using theabundance matrix of this microbial functional gene.
Data Availability. Genomic microarray data have been deposited in GeneExpression Omnibus (accession no. GSE98512).
ACKNOWLEDGMENTS. The data analysis by Q.G. was supported by theNational Science Foundation of China (41825016), the Second Tibetan PlateauScientific Expedition and Research program (2019QZKK0503), and the specialfund of the State Key Joint Laboratory of Environment Simulation andPollution Control (19L01ESPC). The BioCON experiment was funded by theUS Department of Agriculture (USDA) (Project 2007-35319-18305) throughNSF-USDA Microbial Observatories Program, Long-Term Ecological Research(LTER) grants DEB-0620652, DEB-1234162, and DEB-1831944, Long-TermResearch in Environmental Biology (LTREB) grants DEB-1242531 and DEB-1753859, Biological Integration Institutes grant NSF-DBI-2021898, EcosystemSciences grant DEB-1120064, and Biocomplexity grant DEB-0322057 and by USDepartment of Energy Programs for Ecosystem Research grant DE-FG02-96ER62291 and the University of Minnesota to P.B.R. and/or S.E.H. Theexperimental measurements with GeoChip were supported by the USDA(Project 2007-35319-18305) through the NSF-USDA Microbial ObservatoriesProgram, and the modeling work was supported by the US Department ofEnergy, Office of Science, Genomic Science Program under Awards DE-SC0004601, DE-SC0010715, DE-SC0014079, DE-SC0016247, and DE-SC0020163and by the Office of the Vice President for Research at the University ofOklahoma, all to J.Z.
1. A. Arneth et al., Terrestrial biogeochemical feedbacks in the climate system. Nat.
Geosci. 3, 525–532 (2010).2. C. Oertel, J. Matschullat, K. Zurba, F. Zimmermann, S. Erasmi, Greenhouse gas emis-
sions from soils—A review. Geochemistry 76, 327–352 (2016).3. T. D. Lee, S. H. Barrott, P. B. Reich, Photosynthetic responses of 13 grassland species
across 11 years of free-air CO2 enrichment is modest, consistent and independent of N
supply. Glob. Change Biol. 17, 2893–2904 (2011).4. R. Matamala, H. Schlesinger William, Effects of elevated atmospheric CO2 on fine root
production and activity in an intact temperate forest ecosystem. Glob. Change Biol. 6,
967–979 (2001).5. A. E. Carol, P. B. Reich, J. J. Trost, S. E. Hobbie, Elevated CO2 stimulates grassland soil
respiration by increasing carbon inputs rather than by enhancing soil moisture. Glob.
Change Biol. 17, 3546–3563 (2011).6. S. Liu et al., Climatic role of terrestrial ecosystem under elevated CO2 : A bottom-up
greenhouse gases budget. Ecol. Lett. 21, 1108–1118 (2018).7. J. Heath et al., Rising atmospheric CO2 reduces sequestration of root-derived soil
carbon. Science 309, 1711–1713 (2005).8. M. A. Bradford et al., Managing uncertainty in soil carbon feedbacks to climate
change. Nat. Clim. Chang. 6, 751–758 (2016).9. Y. Li et al., Increasing importance of deposition of reduced nitrogen in the United
States. Proc. Natl. Acad. Sci. U.S.A. 113, 5874–5879 (2016).10. L. Zhou et al., Different responses of soil respiration and its components to nitrogen
addition among biomes: A meta-analysis. Glob. Change Biol. 20, 2332–2343 (2014).11. Z. Chen et al., Extreme rainfall and snowfall alter responses of soil respiration to ni-
trogen fertilization: A 3-year field experiment. Glob. Change Biol. 23, 3403–3417
(2017).12. I. A. Janssens et al., Reduction of forest soil respiration in response to nitrogen de-
position. Nat. Geosci. 3, 315–322 (2010).13. P. Olsson, S. Linder, R. Giesler, P. Högberg, Fertilization of boreal forest reduces both
autotrophic and heterotrophic soil respiration. Glob. Change Biol. 11, 1745–1753
(2005).
14. D. Ward, K. Kirkman, N. Hagenah, Z. Tsvuura, Soil respiration declines with increasing
nitrogen fertilization and is not related to productivity in long-term grassland ex-
periments. Soil Biol. Biochem. 115, 415–422 (2017).15. Z. Sun et al., The effect of nitrogen addition on soil respiration from a nitrogen-
limited forest soil. Agric. For. Meteorol. 197, 103–110 (2014).16. Q. Peng et al., Effects of nitrogen fertilization on soil respiration in temperate
grassland in Inner Mongolia, China. Environ. Earth Sci. 62, 1163–1171 (2011).17. Y. Qi et al., Differential responses of short-term soil respiration dynamics to the ex-
perimental addition of nitrogen and water in the temperate semi-arid steppe of Inner
Mongolia, China. J. Environ. Sci. (China) 26, 834–845 (2014).18. T. F. Stocker, D. Qin, G.-K. Plattner, M. M. B. Tignor, IPCC, 2013: Climate Change 2013:
The Physical Science Basis. Contribution of Working Group I to the Fifth Assessment
Report of the Intergovernmental Panel on Climate (Cambridge University Press,
Cambridge, UK, 2013), p. 1535.19. Q. Deng et al., Responses of soil respiration to elevated carbon dioxide and nitrogen
addition in young subtropical forest ecosystems in China. Biogeosciences 7, 315–328
(2010).20. Q. Deng et al., Seasonal responses of soil respiration to elevated CO2 and N addition
in young subtropical forest ecosystems in southern China. Ecol. Eng. 61, 65–73 (2013).21. M. Craine Joseph, A. Wedin David, B. Reich Peter, The response of soil CO2 flux to
changes in atmospheric CO2, nitrogen supply and plant diversity. Glob. Change Biol.
7, 947–953 (2001).22. J. M. Melillo et al., Soil warming, carbon-nitrogen interactions, and forest carbon
budgets. Proc. Natl. Acad. Sci. U.S.A. 108, 9508–9512 (2011).23. R. Chen et al., Soil C and N availability determine the priming effect: microbial N
mining and stoichiometric decomposition theories. Glob. Change Biol. 20, 2356–2367
(2014).24. P. B. Reich et al., Nitrogen limitation constrains sustainability of ecosystem response
to CO2. Nature 440, 922–925 (2006).25. S. Fontaine et al., Stability of organic carbon in deep soil layers controlled by fresh
carbon supply. Nature 450, 277–280 (2007).
Gao et al. PNAS | December 29, 2020 | vol. 117 | no. 52 | 33323
ECOLO
GY
Dow
nloa
ded
by g
uest
on
Dec
embe
r 12
, 202
1

26. E. C. Adair, P. B. Reich, S. E. Hobbie, J. M. Knops, Interactive effects of time, CO2, N,and diversity on total belowground carbon allocation and ecosystem carbon storagein a grassland community. Ecosystems 12, 1037–1052 (2009).
27. C. M. Litton, J. W. Raich, M. G. Ryan, Carbon allocation in forest ecosystems. Glob.Change Biol. 13, 2089–2109 (2007).
28. W. Cheng et al., Synthesis and modeling perspectives of rhizosphere priming. NewPhytol. 201, 31–44 (2014).
29. F. A. Dijkstra, Y. Carrillo, E. Pendall, J. A. Morgan, Rhizosphere priming: A nutrientperspective. Front. Microbiol. 4, 216 (2013).
30. M. Carreiro, R. Sinsabaugh, D. Repert, D. Parkhurst, Microbial enzyme shifts explainlitter decay responses to simulated nitrogen deposition. Ecology 81, 2359–2365(2000).
31. B. Wild et al., Input of easily available organic C and N stimulates microbial decom-position of soil organic matter in arctic permafrost soil. Soil Biol. Biochem. 75,143–151 (2014).
32. R. Cavicchioli et al., Scientists’ warning to humanity: Microorganisms and climatechange. Nat. Rev. Microbiol. 17, 569–586 (2019).
33. T. Crowther et al., The global soil community and its influence on biogeochemistry.Science 365, eaav0550 (2019).
34. J. Zhou et al., Microbial mediation of carbon-cycle feedbacks to climate warming. Nat.Clim. Chang. 2, 106–110 (2011).
35. X. Guo et al., Gene-informed decomposition model predicts lower soil carbon loss dueto persistent microbial adaptation to warming. Nat. Commun. 11, 4897 (2020).
36. F. A. Dijkstra, S. E. Hobbie, P. B. Reich, J. M. H. Knops, Divergent effects of elevatedCO2, N fertilization, and plant diversity on soil C and N dynamics in a grassland fieldexperiment. Plant Soil 272, 41–52 (2005).
37. P. B. Reich et al., Do species and functional groups differ in acquisition and use of C, Nand water under varying atmospheric CO2 and N availability regimes? A field testwith 16 grassland species. New Phytol. 150, 435–448 (2001).
38. D. R. Zak, W. E. Holmes, A. C. Finzi, R. J. Norby, W. H. Schlesinger, Soil nitrogen cyclingunder elevated CO2: A synthesis of forest face experiments. Ecol. Appl. 13, 1508–1514(2003).
39. J. M. Melillo et al., Long-term pattern and magnitude of soil carbon feedback to theclimate system in a warming world. Science 358, 101–105 (2017).
40. J. M. Melillo et al., Soil warming and carbon-cycle feedbacks to the climate system.Science 298, 2173–2176 (2002).
41. P. B. Reich, S. E. Hobbie, Decade-long soil nitrogen constraint on the CO2 fertilizationof plant biomass. Nat. Clim. Chang. 3, 278–282 (2013).
42. X. Zhou et al., Concurrent and lagged impacts of an anomalously warm year on au-totrophic and heterotrophic components of soil respiration: A deconvolution analysis.New Phytol. 187, 184–198 (2010).
43. X. Wang, B. Zhu, Y. Wang, X. Zheng, Field measures of the contribution of rootrespiration to soil respiration in an alder and cypress mixed plantation by twomethods: Trenching method and root biomass regression method. Eur. J. For. Res.127, 285–291 (2008).
44. Y. Kuzyakov, A. A. Larionova, Root and rhizomicrobial respiration: A review of ap-proaches to estimate respiration by autotrophic and heterotrophic organisms in soil.J. Plant Nutr. Soil Sci. 168, 503–520 (2005).
45. O. K. Atkin, D. Bruhn, V. M. Hurry, M. G. Tjoelker, The hot and the cold: Unravellingthe variable response of plant respiration to temperature. Funct. Plant Biol. 32,87–105 (2005).
46. P. B. Reich, M. B. Walters, M. G. Tjoelker, D. Vanderklein, C. Buschena, Photosynthesis
and respiration rates depend on leaf and root morphology and nitrogen concen-
tration in nine boreal tree species differing in relative growth rate. Funct. Ecol. 12,
395–405 (1998).47. J. M. Craine, D. A. Wedin, F. S. Chapin, P. B. Reich, Relationship between the structure
of root systems and resource use for 11 North American grassland plants. Plant Ecol.
165, 85–100 (2003).48. J. C. Carey et al., Temperature response of soil respiration largely unaltered with
experimental warming. Proc. Natl. Acad. Sci. U.S.A. 113, 13797–13802 (2016).49. Q. Tu et al., GeoChip 4: A functional gene-array-based high-throughput environ-
mental technology for microbial community analysis. Mol. Ecol. Resour. 14, 914–928
(2014).50. K. Xue et al., Annual removal of aboveground plant biomass alters soil microbial
responses to warming. mBio 7, e00976 (2016).51. D. O. Hessen, G. I. Ågren, T. R. Anderson, J. J. Elser, P. C. de Ruiter, Carbon seques-
tration in ecosystems: The role of stoichiometry. Ecology 85, 1179–1192 (2004).52. S. Fontaine, A. Mariotti, L. Abbadie, The priming effect of organic matter: A question
of microbial competition? Soil Biol. Biochem. 35, 837–843 (2003).53. A. S. Mamilov, O. M. Dilly, Soil microbial eco-physiology as affected by short-term
variations in environmental conditions. Soil Biol. Biochem. 34, 1283–1290 (2002).54. K. J. Locey et al., Dormancy dampens the microbial distance-decay relationship.
Philos. Trans. R. Soc. Lond. B Biol. Sci. 375, 20190243 (2020).55. K. Xue et al., Tundra soil carbon is vulnerable to rapid microbial decomposition under
climate warming. Nat. Clim. Chang. 6, 595–600 (2016).56. E. A. Davidson, S. Samanta, S. S. Caramori, K. Savage, The dual Arrhenius and
Michaelis–Menten kinetics model for decomposition of soil organic matter at hourly
to seasonal time scales. Glob. Change Biol. 18, 371–384 (2012).57. G. Wang et al., Soil moisture drives microbial controls on carbon decomposition in
two subtropical forests. Soil Biol. Biochem. 130, 185–194 (2019).58. J. Scurlock, D. Hall, The global carbon sink: A grassland perspective. Glob. Change
Biol. 4, 229–233 (1998).59. P. B. Reich et al., Plant diversity enhances ecosystem responses to elevated CO2 and
nitrogen deposition. Nature 410, 809–812 (2001).60. M. Maier, H. Schack-Kirchner, E. E. Hildebrand, D. Schindler, Soil CO2 efflux vs. soil
respiration: Implications for flux models. Agric. For. Meteorol. 151, 1723–1730 (2011).61. J. Zhou, M. A. Bruns, J. M. Tiedje, DNA recovery from soils of diverse composition.
Appl. Environ. Microbiol. 62, 316–322 (1996).62. Y. Yang et al., Responses of the functional structure of soil microbial community to
livestock grazing in the Tibetan alpine grassland. Glob. Change Biol. 19, 637–648
(2013).63. E. Weng, Y. Luo, Relative information contributions of model vs. data to short- and
long-term forecasts of forest carbon dynamics. Ecol. Appl. 21, 1490–1505 (2011).64. R. Xu, Measuring explained variation in linear mixed effects models. Stat. Med. 22,
3527–3541 (2003).65. J. M. Bland, D. G. Altman, Measurement error. BMJ 312, 1654 (1996).66. E. Moser, A. Saxton, S. Pezeshki, Repeated measures analysis of variance: Application
to tree research. Can. J. For. Res. 20, 524–535 (1990).67. G. Alberti, perm.t.test: R function for permutation-based t-test. https://rdrr.io/cran/
GmAMisc/man/perm.t.test.html (2016).
33324 | www.pnas.org/cgi/doi/10.1073/pnas.2002780117 Gao et al.
Dow
nloa
ded
by g
uest
on
Dec
embe
r 12
, 202
1