Embed Size (px)
Citation preview

RESEARCH Open Access
Stimulation induces gradual increases inthe thickness and curvature of postsynapticdensity of hippocampal CA1 neurons inslice culturesJung-Hwa Tao-Cheng
Abstract
Activity can induce structural changes in glutamatergic excitatory synapses, including increase in thicknessand curvature of the postsynaptic density (PSD); these structural changes can only be documented byelectron microscopy. Here in organotypic hippocampal slice cultures where experimental conditions can beeasily manipulated, increases in thickness and curvature of PSDs were noticeable within 30 s of stimulationand progressed with time up to 3 min. These structural changes were reversible upon returning the samplesto control medium for 5–10 min. Thus, the postsynaptic density is a very dynamic structure that undergoesrapid reorganization of its components upon stimulation, and recovery upon cessation of stimulation. Thegradual increase in thickness of PSD could result from a gradual translocation of some PSD proteins to thePSD, and the increase in curvature of the PSD is likely led by postsynaptic elements.
Keywords: Electron microscopy, PSD thickness, PSD curvature, Hippocampal slice cultures
IntroductionThe postsynaptic density (PSD) appears as dark ma-terial ~ 30 nm thick under the postsynaptic membranein glutamatergic excitatory synapses of mammaliancentral nervous system by electron microscopy (EM).This easily-recognizable structural feature is illustratedin a classic atlas of neurocytology on various regionsof exquisitely perfusion-fixed brains [1]. Subsequentcontributions from immunogold labeling of variousPSD proteins demonstrate that there is a second dee-per layer of the PSD which is not always visible underbasal conditions without special staining [2, 3]. Thus,the PSD can be subdivided into two layers: (1) thePSD core, a layer close to the postsynaptic membranethat is relatively stable either under basal or stimu-lated conditions, and (2) the PSD “pallium”, a deeperlayer that is contiguous with the PD core, but extend-ing further into the cytoplasm. It is this deeper layer
of the PSD that becomes darker upon stimulation [3],and gives the appearance of PSD thickening.Numerous EM studies on animal brains have shown
PSDs of various thickness and curvature under differ-ent experimental conditions. However, much of thisvariability could be introduced by perfusion-fixationitself, which if carried out with a few minutes delaywill cause hypoxia-induced excitatory stimulation, andresult in increases of thickness and curvature of PSD[4]. Neuronal cell cultures offer a model systemwhere the experimental conditions can be preciselycontrolled. Stimulation-induced thickening of PSD hasbeen reported in dissociated hippocampal neuronalcultures [5–7], and in organotypic slice cultures ofthe hippocampus [8, 9]. However, these studies onlycompared PSDs under control basal conditions vs.those under intense excitatory stimulation.The present study set out to further investigate the
time course of structural changes of PSD in hippo-campal organotypic slice cultures which maintain thein vivo stratifications of the hippocampus. Thepresent study measured the thickness and curvature
© The Author(s). 2019 Open Access This article is distributed under the terms of the Creative Commons Attribution 4.0International License (http://creativecommons.org/licenses/by/4.0/), which permits unrestricted use, distribution, andreproduction in any medium, provided you give appropriate credit to the original author(s) and the source, provide a link tothe Creative Commons license, and indicate if changes were made. The Creative Commons Public Domain Dedication waiver(http://creativecommons.org/publicdomain/zero/1.0/) applies to the data made available in this article, unless otherwise stated.
Correspondence: [email protected] Electron Microscopy Facility, National Institute of NeurologicalDisorders and Stroke, National Institutes of Health, Bethesda, MD 20892, USA
Tao-Cheng Molecular Brain (2019) 12:44 https://doi.org/10.1186/s13041-019-0468-x

of the PSD upon depolarization and NMDA treat-ment as early as 30 s in order to capture early events.The time course and degree of the increases duringstimulation and recovery upon secession of stimula-tion were documented.
MethodsPreparation, treatment and fixation of rat organotypichippocampal slice culturesAll samples were from a previously published report[8] and reexamined here for changes in thickness andcurvature of the PSD. Briefly, the hippocampus wasremoved from postnatal 6–8 day old rats and cut at250 μm thickness with a tissue chopper. Slices wereplaced on cell culture inserts in six-well culturedishes and incubated 10–14 days in vitro before use.Culture dishes were placed on a floating platform ina water bath at 37 °C. Control incubation mediumwas HEPES-based Kreb’s Ringer at pH 7.4. High K+
medium was at 90 mM KCl, with osmolarity compen-sated by reducing the concentration of NaCl.N-methyl-D-aspartic acid (NMDA) medium incorpo-rated 50 μM NMDA into the control medium. HighK+ treatment was for 0.5, 1, 2, or 3 min, and NMDAtreatment was for 0.5, 1, 2, or 5 min. To examine re-covery after depolarization, high K+ medium was re-moved and the samples were washed three to fourtimes in normal incubation medium for a total of 1,5, and 10 min. Experimental controls were processedin parallel, including all the medium changes andwashing steps. Slice cultures were fixed with 2% glu-taraldehyde and 2% paraformaldehyde, or 4% glutaral-dehyde in 0.1 N cacodylate buffer at pH 7.4 for 1–3 hat room temperature and then stored at 4 °C.
Preparation, treatment and fixation of rat dissociatedhippocampal neuronal culturesAll samples were from previously published reports[10] and used here to examine effects of different os-mium treatment on the appearance of PSD thickness.Briefly, cell cultures were prepared from embryonic20 day-old rat fetuses by papain dissociation, and thenplated on glial feeder cultures, and experiments werecarried out with three week-old cultures. Culturedishes were placed on a floating platform in a waterbath maintained at 37 °C. Cell cultures were washedwith control medium and treated for 2 min with ei-ther control or high K+ media, and then fixed imme-diately with 4% glutaraldehyde, or 2% glutaraldehydeand 2% paraformaldehyde in 0.1 N cacodylate bufferat pH 7.4 for 1–3 h at room temperature and thenstored at 4 °C.
Electron microscopyAll fixed slice cultures and most fixed dissociated cul-tures were washed in buffer and treated with 1% os-mium tetroxide in 0.1 N cacodylate buffer at pH 7.4for 1 h on ice. Some fixed dissociated cells sampleswere treated with “reduced osmium” (1% osmium tet-roxide + 1% potassium ferrocyanide in cacodylate buf-fer at pH 7.4 on ice for 1 h) instead. Some additionalsamples were first treated with 1% tannic acid on icefor 1 h, followed by either 1% osmium tetroxide or“reduced osmium” for 1 h on ice. Samples were thenwashed and en bloc stained with 0.25–1% uranyl acet-ate in 0.1 N acetate buffer at pH 5.0 overnight at 4 °C,dehydrated with a series of graded ethanol, and finallyembedded in epoxy resins. Thin sections were coun-terstained with uranyl acetate and lead citrate. Imageswere photographed with a bottom-mounted digitalCCD camera (AMT XR-100, Danvers, MA, USA).
MorphometryThickness and curvature of postsynaptic densitySampling of synapses from hippocampal slice cultureswas restricted to stratum radiatum of the CA1 regionimmediately next to the clustered pyramidal neuronalsomas, extending ~ 100 μm deep. This region coveredapproximately 5–7 grid openings in a 400-meshhoneycomb-patterned grid, and the entire area wasphotographed at 15,000x magnification. Every cross-sectioned excitatory synaptic profile with clearly delin-eated postsynaptic membrane was enlarged to150,000x for measurement. On average, ~ 40 synapticprofiles were measured per sample (range, 27–51 syn-aptic profiles, Additional file 1). Methods for measur-ing thickness and curvature of PSDs were the sameas described before [4]. Briefly, the average thicknessof PSD was derived by marking the borders of thedark material underneath the postsynaptic membrane(Fig. 1, a, b) to measure the area of the PSD, andthen divided by the length of the postsynaptic mem-brane. Area and length were measured with ImageJ(National Institutes of Health, Bethesda, MD, USA).The index of curvature of PSD was calculated as stated
in the figure legend of Fig. 1. Consistent with the desig-nation used by Dyson and Jones [11], a negative valuemeans that a presynaptic terminal arches into the PSD(Fig. 1c, also called a “smile” or “concave” curvature),and a positive value means that a PSD arches into thepresynaptic terminal (Fig. 1d, also called a “frown” or“convex” curvature).
Statistical analysisComparisons between two groups were tested by Stu-dent’s t test. Comparisons among three groups or morewere tested by one-way ANOVA with Tukey’s post-test.
Tao-Cheng Molecular Brain (2019) 12:44 Page 2 of 10

Data were presented as mean ± standard error of themean (SEM).
ResultsStimulation increased the thickness and curvature of thepostsynaptic densityIn control samples under basal conditions, the PSD ap-peared as a thin layer of dark material approximately30–40 nm from the postsynaptic membrane (Fig. 1a).The deeper layer of the PSD (more than 40 nm from thepostsynaptic membrane) was often less distinguishable,at least in staining intensity, from the adjacent cytoplasm(Fig. 1a, 2a, 3a). Most PSDs had a negative index valueon the curvature, i. e., the presynaptic terminal archedinto the postsynaptic dendrite (Fig. 1c, 2a, 3a). Uponstimulation, both the thickness and curvature of thePSD showed an increase within 30 s of depolarizationwith high K+ (Fig. 2) or NMDA treatment (Fig. 3), andthese increases progressed with time.
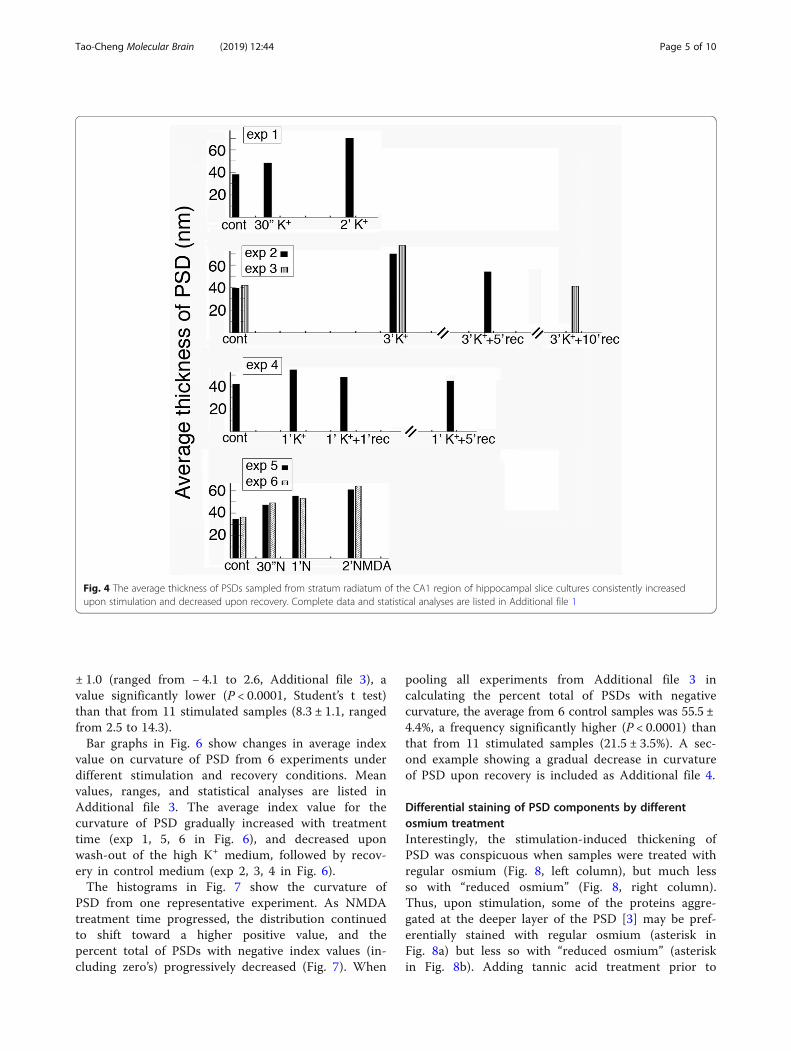
The thickness of PSD gradually increased with treatmenttime and this increase was reversibleThe average thickness of PSD from 6 control sampleswas 38.8 ± 1.2 nm (range 20–61, Additional file 1), avalue significantly lower (P < 0.0001, Student’s t test)than that from 11 stimulated samples (59.1 ± 3.1 nm,range 30–116). Bar graphs in Fig. 4 show changes in
average thickness of PSD from 6 experiments under dif-ferent stimulation and recovery conditions. Mean values,sample sizes, ranges, and statistical analyses are listed inAdditional file 1. The thickness of PSD gradually in-creased with treatment time as shown in experiment 1,5, 6 in Fig. 4, and decreased upon wash-out of the highK+ medium, followed by recovery in control medium(exp 2, 3, 4 in Fig. 4). As expected, recovery was fasterin exp. 4 with 1 min of depolarization than in exp. 2 & 3with 3min of depolarization.The histograms in Fig. 5 show the thickness of PSD
from one representative experiment. There was aprogressive and significant increase in the thicknessof PSD as the NMDA treatment time increased.Another figure of histograms showing a gradual de-crease in thickness of PSD upon recovery is includedas Additional file 2.
The curvature of PSD gradually increased with treatmenttime and this increase was reversibleAn index value of zero in the curvature of PSD meansthe PSD is flat, arching neither up or down. A negativevalue means the presynaptic terminal arches into thepostsynaptic element (Fig. 1c), and a positive valuemeans the postsynaptic element arches into the pre-synaptic terminal (Fig. 1d). The average index valuesfor curvature of PSD from 6 control samples was − 1.2
Fig. 1 Methods of measurements of the average thickness of PSD (a, b) and the index value of curvature of PSD (c, d). Sample on left wastreated with control media, and sample on right was treated with 50 μM of NMDA for 5 min. (a, b) –The area of the PSD was demarcated by thepostsynaptic membrane and the border of the visible dark materials that were distinct from the rest of the cytoplasm. The area enclosed bythese outlines was then divided by the length of the postsynaptic membrane to yield the “average thickness of the PSD”. (c, d) –The index forthe curvature of the PSD was calculated by first drawing a line between the two ends of the postsynaptic membrane (the horizontal lineindicated by x), and then a second line (the vertical line indicated by y) from the highest point of the arch of the postsynaptic membrane to thefirst line. The value of “y” divided by “x” times 100 is the index value for the curvature of the PSD. A negative value indicates that the presynapticterminal arches into the postsynaptic spine (c), and a positive value indicates the reverse (d). Scale bar = 0.1 μm
Tao-Cheng Molecular Brain (2019) 12:44 Page 3 of 10

Fig. 3 Synaptic profiles sampled from stratum radiatum of the CA1 region of the hippocampal slice cultures under control conditions (a) andupon 30 s (b), 1 min (c), and 2 min (d) of NMDA treatment (50 μM). PSDs (arrows) showed progressive increases in thickness from a to d. Typically,under control conditions (a), the curvature of PSDs was negative, but gradually increased into positive values (with the postsynaptic elementarching into the presynaptic terminal) upon NMDA treatment (b, c, d). Scale bar = 0.5 μm
Fig. 2 Synaptic profiles sampled from stratum radiatum of the CA1 region of hippocampal slice cultures under control conditions (a) and upon30 s (b) and 2min (inset in b) of depolarization with high K+ (90 mM). PSDs (arrows) showed a slight increase in thickness in b over a, and a moreconspicuous thickness in inset in b over a. The curvature of the PSDs was in different directions in a vs. b. The presynaptic terminals arched intothe postsynaptic elements slightly in a, while the reverse occurred in b. Double arrows in b points to double-membraned invaginations in thepresynaptic terminals termed “spinules”, an activity-induced structure only seen in stimulated samples [9]. Scale bar = 0.5 μm
Tao-Cheng Molecular Brain (2019) 12:44 Page 4 of 10
± 1.0 (ranged from − 4.1 to 2.6, Additional file 3), avalue significantly lower (P < 0.0001, Student’s t test)than that from 11 stimulated samples (8.3 ± 1.1, rangedfrom 2.5 to 14.3).Bar graphs in Fig. 6 show changes in average index
value on curvature of PSD from 6 experiments underdifferent stimulation and recovery conditions. Meanvalues, ranges, and statistical analyses are listed inAdditional file 3. The average index value for thecurvature of PSD gradually increased with treatmenttime (exp 1, 5, 6 in Fig. 6), and decreased uponwash-out of the high K+ medium, followed by recov-ery in control medium (exp 2, 3, 4 in Fig. 6).The histograms in Fig. 7 show the curvature of
PSD from one representative experiment. As NMDAtreatment time progressed, the distribution continuedto shift toward a higher positive value, and thepercent total of PSDs with negative index values (in-cluding zero’s) progressively decreased (Fig. 7). When
pooling all experiments from Additional file 3 incalculating the percent total of PSDs with negativecurvature, the average from 6 control samples was 55.5 ±4.4%, a frequency significantly higher (P < 0.0001) thanthat from 11 stimulated samples (21.5 ± 3.5%). A sec-ond example showing a gradual decrease in curvatureof PSD upon recovery is included as Additional file 4.
Differential staining of PSD components by differentosmium treatmentInterestingly, the stimulation-induced thickening ofPSD was conspicuous when samples were treated withregular osmium (Fig. 8, left column), but much lessso with “reduced osmium” (Fig. 8, right column).Thus, upon stimulation, some of the proteins aggre-gated at the deeper layer of the PSD [3] may be pref-erentially stained with regular osmium (asterisk inFig. 8a) but less so with “reduced osmium” (asteriskin Fig. 8b). Adding tannic acid treatment prior to
Fig. 4 The average thickness of PSDs sampled from stratum radiatum of the CA1 region of hippocampal slice cultures consistently increasedupon stimulation and decreased upon recovery. Complete data and statistical analyses are listed in Additional file 1
Tao-Cheng Molecular Brain (2019) 12:44 Page 5 of 10

osmium treatment slightly increased the density ofthe PSD core (the dark layer of material within 30 nmof the postsynaptic density in Fig. 8d), but did notenhance the deeper layer of the PSD by much (aster-isk in Fig. 8d).
DiscussionThe present study documented stimulation-induced in-creases in thickness and curvature of the PSD in theCA1 region of the hippocampus in slice cultures. Thiseasily controllable experimental system offered the op-portunity to capture initial structural changes as early as
30 s after stimulation, and to monitor the gradual in-creases as stimulation continues.The PSD can be subdivided into two layers, a core
that is ~ 30 nm thick proximal to the postsynapticmembrane, and a deeper layer (the pallium) extendingfurther into the cytoplasm [3]. Notably, under controlconditions, the deeper layer of PSD does not appearelectron dense (Additional File 5a), although Homerand Shank are clearly present at this layer(Additional File 5b, c). Interestingly, upon stimulation,there is an increase in darkness of this deeper layerwith “regular osmium” treatment but not with “re-duced osmium” treatment. This technical issue should
Fig. 5 Histograms of thickness of PSD from exp. 5 in Additional file 1. Experimental conditions and average thickness of PSD are listed on theupper right corner of each panel. Both the range and mean values of average thickness of PSD gradually increased with NMDA treatment time.Statistical analyses are listed in footnotes of Additional file 1
Tao-Cheng Molecular Brain (2019) 12:44 Page 6 of 10

be taken into consideration when comparing data on“thickness of PSD” among different reports wheresamples may be treated with different osmiumcompositions.The stimulation-induced increase in darkness of the
deeper layer of the PSD can be attributed to add-itional proteins that translocate from the cytoplasm tothe PSD [3]. These proteins include CaMKII, Shank,IRSp53, and CYLD. The most likely major contributorfor the increased staining of this layer is CaMKII be-cause of its great abundance at the PSD [12, 13] andits substantial increase (~ 3 fold) under excitatoryconditions [6, 7], whereas Shank and IRSp53 increaseonly ~ 1.5 fold over controls [14–16]. CYLD, althoughgreatly increased at the PSD upon stimulation [17],
has an overall low abundance compared to theseother PSD proteins [13].Other candidates that could contribute to the in-
creased electron density in this deeper layer include Syn-GAP and AIDA, two abundant proteins that move outof the PSD core upon stimulation, with a concomitantincrease in the deeper layer of the PSD [18, 19]. In con-trast, some proteins that are consistently located withinthe PSD core before or after stimulation cannot contrib-ute to the increase in darkness of the deeper layer of thePSD. These proteins include PSD-95 [18], GKAP [15]and densin [20]. Other proteins like Homer [21] can alsobe ruled out because their concentrations in the deeperlayer of the PSD do not change before or afterstimulation.
Fig. 6 The curvature of PSD sampled from stratum radiatum of the CA1 region of hippocampal slice cultures consistently increased uponstimulation and decreased upon recovery. Complete data and statistical analyses are listed in Additional file 3
Tao-Cheng Molecular Brain (2019) 12:44 Page 7 of 10

The apparent gradual increase in PSD thicknesswith treatment time suggests that additional mole-cules may build up from close to the PSD core intothe deeper layer of the PSD. For example, uponstimulation, CaMKII could initially translocate to nearthe PSD core to bind to NR2B [22] and/or densin[20], two proteins known to be highly concentrated atthe PSD core. As stimulation progresses, additionalCaMKII molecules can bind to those already translo-cated to the PSD core and continue to pile intothicker layers. Indeed, it is known that CaMKII mole-cules can self-aggregate [23, 24]. Alternatively, theadditional CaMKII at the PSD brought on by stimula-tion might distribute evenly in the deeper layer of thePSD and bind to other scaffold proteins like Shank[25] that already exist in this layer. In this latter sce-nario, although CaMKII is not adding from PSD coreoutwards, other PSD proteins could still be added tothe PSD in this fashion to account for the gradual in-crease in PSD thickness.
Change in curvature of the PSD under differentconditions has been extensively studied [26–28],mostly in perfusion-fixed brains. There have beencontradicting results as to whether neuronal activityincreases or decreases the curvature of PSD. Thiscontradiction could be due to sampling from differentregions of the brain, different experimental protocolsand/or morphometry methods, or simply due to theissue of perfusion-fixation itself that could have in-duced intense synaptic activity [4]. One way to bypassthis potential complication caused by perfusion fix-ation is to immersion fix neuronal cultures whosesynapses can be kept under basal conditions with cer-tainty. The present study demonstrated that stimula-tion increases the curvature of PSD in hippocampalslice cultures, consistent with the finding from anearlier report in dissociated cortical neuronal culturesupon depolarization with high K+ [5].What is the mechanism that caused the curvature
of PSD to change? One immediate response to
Fig. 7 Histograms of index values of curvature of PSD from exp. 5 in Additional file 3. Experimental conditions and average index values are listedon the upper right corner of each panel. A vertical line divides the data points with negative values (including zeros), and the percent totals leftof this line are listed on the upper left corner of each panel. Statistical analyses are listed in footnotes of Additional file 3
Tao-Cheng Molecular Brain (2019) 12:44 Page 8 of 10

depolarization by high K+ or electrical stimulation isa massive release of synaptic vesicles from the pre-synaptic terminal [5, 29, 30]. The addition of mem-branes from fusion of these vesicles would increasethe total area of presynaptic membrane [5, 30]. Thisincrease could force the presynaptic terminal to wraparound the PSD and bend the PSD to arch into thepresynaptic terminal yielding in a positive value inthe curvature [26]. Alternatively, a postsynaptic mech-anism might be involved. For example, upon stimula-tion, a change in actin configuration or interactionwith PSD proteins [3, 26, 31] could exert a pull to-ward the core of the spine and result in a curvaturechange in the PSD. The present data support a post-synaptic mechanism, since NMDA treatment does notinduce synaptic vesicle release, and yet it still in-creases the curvature of the PSD.
Additional files
Additional file 1: Average (mean ± SEM in nm) thickness of PSD fromexcitatory synapses in stratum radiatum of the CA1 region ofhippocampal slice cultures. (PDF 54 kb)
Additional file 2: Histograms of thickness of PSD. (PDF 2264 kb)
Additional file 3: Average (mean ± SEM) index of curvature of PSD fromexcitatory synapses in stratum radiatum of the CA1 region ofhippocampal slice cultures. (PDF 53 kb)
Additional file 4: Histograms of index values of curvature of PSD.(PDF 2633 kb)
Additional file 5: Synaptic profiles from control samples under basalconditions. (PDF 1438 kb)
AcknowledgementsI thank Rita Azzam, Virginia Crocker and Sandra Lara for expert EM technicalsupport, Christine A. Winters for hippocampal organotypic and dissociatedcultures, Dr. Ayse Dosemeci for helpful discussions and critical reading of themanuscript, and the reviewers for helpful comments.
FundingSupported by National Institute of Neurological Disorders and Stroke (NINDS)intramural funds.
Availability of data and materialsThe datasets generated and/or analyzed during the current study areavailable from the corresponding author on reasonable request.
Authors’ contributionsThis is a solo author manuscript. The author read and approved the finalmanuscript.
Ethics approvalThe animal protocol was approved by the National Institute of NeurologicalDisorders and Stroke Animal Use and Care Committee (Animal protocolNumber: ASP1159) and conforms to NIH guidelines.
Consent for publicationNot applicable.
Competing interestsThe author declares that she has no competing interests.
Fig. 8 Four NMDA-treated (50 μM, 2 min) samples of dissociated hippocampal neuronal cultures were post-fixed differently as indicated. Sampleswere from sister cultures treated in parallel. The deeper layer of the PSD (marked by asterisks*) stained more prominently with regular osmiumtetroxide (1% OsO4; a, c) than with “reduced osmium” (1% OsO4 and 1% potassium ferrocyanide; b, d). This preferential staining by regularosmium persisted with or without 1% tannic acid treatment. Scale bar = 0.1 μm
Tao-Cheng Molecular Brain (2019) 12:44 Page 9 of 10

Publisher’s NoteSpringer Nature remains neutral with regard to jurisdictional claims inpublished maps and institutional affiliations.
Received: 8 February 2019 Accepted: 25 April 2019
References1. Peters A, Palay SL, Webster HD. The fine structure of the nervous system.
New York: Oxford University Press; 1991.2. Valtschanoff JG, Weinberg RJ. Laminar organization of the NMDA receptor
complex within the postsynaptic density. J Neurosci. 2001;21:1 211–1217.3. Dosemeci A, Winberg R, Reese TS, Tao-Cheng J-H. The postsynaptic density:
there is more than meets the eye. Front Synaptic Neurosci. 2016;8:23.4. Tao-Cheng J-H, Gallant PE, Brightman MW, Dosemeci A, Reese TS. Effects of
delayed perfusion fixation on postsynaptic density and CaMKII clustering indifferent regions of the mouse brain. J Comp Neurol. 2007;501:731–40.
5. Janka Z, Jones DG. A morphometric study of cultured rat cerebral synapsesexposed to different cationic media. Brain Res. 1982;241:215–25.
6. Dosemeci A, Tao-Cheng J-H, Vinade L, Winters CA, Pozzo-Miller L, Reese TS.Glutamate-induced transient modification of the postsynaptic density.PNAS. 2001;98:10428–32.
7. Dosemeci A, Vinade L, Winters C, Reese TS, Tao-Cheng JH. Inhibition ofphosphatase activity prolongs NMDA-induced modification of thepostsynaptic density. J Neurocytology. 2002;31:605–12.
8. Tao-Cheng J-H, Dosemeci A, Gallant PE, Miller S, Galbraith JA, Winters CA,Azzam R, Reese TS. Rapid turnover of spinules at synaptic terminals.Neuroscience. 2009;160:42–50.
9. Fukunaga Y, Nakajima E, Hatano E, Itoh S, Kashino Y, Miyazawa A. Activationof NMDA receptors thickens the postsynaptic density via proteolysis.Neurosci Res. 2015;101:6–14.
10. Tao-Cheng JH. Stimulation-induced structural changes at the nucleus,endoplasmic reticulum and mitochondria of hippocampal neurons. MolBrain. 2018;11:44.
11. Dyson SE, Jones DG. Quantitation of terminal parameters and their inter-relationships in maturing central synapses: a perspective for experimentalstudies. Brain Res. 1980;183:43–59.
12. Sheng M, Hoogenraad CC. The postsynaptic architecture of excitatorysynapses: a more quantitative view. Annu Rev Biochem. 2007;76:823–47.
13. Lowenthal MS, Markey SP, Dosemeci A. Quantitative mass spectrometrymeasurements reveal stoichiometry of principal postsynaptic densityproteins. J Proteome Res. 2015;14:2528–38.
14. Tao-Cheng JH, Dosemeci A, Gallant PE, Smith C, Reese T. Activity inducedchanges in the distribution of shanks at hippocampal synapses.Neuroscience. 2010;168:11–7.
15. Tao-Cheng JH, Yang Y, Reese TS, Dosemeci A. Differential distribution ofshank and GKAP at the postsynaptic density. PLoS One. 2015;10:e0118750.
16. Dosemeci A, Burch A, Loo H, Toy D, Tao-Cheng JH. IRSp53 accumulates atthe postsynaptic density under excitatory conditions. PLoS One. 2017;12:e0190250.
17. Dosemeci A, Thein S, Yang Y, Reese TS, Tao-Cheng JH. CYLD, adeubiquitinase specific for lysine63-linked polyubiquitins, accumulates atthe postsynaptic density in an activity-dependent manner. Biochem BiophysRes Commun. 2013;430:245–9.
18. Yang Y, Tao-Cheng JH, Reese TS, Dosemeci A. SynGAP moves out of thecore of the postsynaptic density upon depolarization. Neuroscience.201(192):132–9.
19. Dosemeci A, Toy D, Reese TS, Tao-Cheng JH. AIDA-1 moves out of thepostsynaptic density core under excitatory conditions. PLoS One. 2015;10:e0137216.
20. Dosemeci A, Tao-Cheng JH, Loo H, Reese TS. Distribution of densin inneurons. PLoS One. 2018;13:e0205859.
21. Tao-Cheng JH, Thein S, Yang Y, Reese TS, Gallant PE. Homer is concentratedat the postsynaptic density and does not redistribute after acute synapticstimulation. Neuroscience. 2014;266:80–90.
22. Bayer KU, De Koninck P, Leonard AS, Hell JW, Schulman H. Interaction withthe NMDA receptor locks CaMKII in an active conformation. Nature. 2001;411:801–5.
23. Hudmon A, Aronowski J, Kolb SJ, Waxham MN. Inactivation and self-association of Ca2+/calmodulin-dependent protein kinase II duringautophosphorylation. J Biol Chem. 1996;271:8800–8.
24. Dosemeci A, Reese TS, Petersen J, Tao-Cheng JH. A novel particulate formof ca(2+)/calmodulin-dependent proteinkinase II in neurons. J Neurosci.2000;20:3076–84.
25. Perfitt TL, Marks CR, Wang X, Nakagawa T, D. A. Jacobson DA, Colbran RJ..Physiological effects of a direct interaction between postsynaptic proteinsShank3 and CaMKII. Program No. 462.03. 2018 Neuroscience MeetingPlanner. San Diego, CA: Society for Neuroscience, 2018. Online.
26. Markus EJ, Petit TL. Synaptic structural plasticity: role of synaptic shape.Synapse. 1989;3:1–11.
27. Medvedev NI, Popov VI, Dallérac G, Davies HA, Laroche S, Kraev IV,Rodriguez Arellano JJ, Doyère V, Stewart MG. Alterations in synapticcurvature in the dentate gyrus following induction of long-termpotentiation, long-term depression, and treatment with the N-methyl-D-aspartate receptor antagonist CPP. Neuroscience. 2010;171:390–7.
28. Santuy A, Rodríguez JR, DeFelipe J, Merchán-Pérez A. Study of the size andshape of synapses in the juvenile rat somatosensory cortex with 3Delectron microscopy. eNeuro. 2018;5:0377–17.2017.
29. Tao-Cheng JH. Activity-related redistribution of presynaptic proteins at theactive zone. Neuroscience. 2006;141:1217–24.
30. Heuser JE, Reese TS. Evidence for recycling of synaptic vesicle membraneduring transmitter release at the frog neuromuscular junction. J Cell Biol.1973;57:315–44.
31. Cohen RS, Chung SK, Pfaff DW. Immunocytochemical localization of actin indendritic spines of the cerebral cortex using colloidal gold as a probe. CellMol Neurobiol. 1985;5:271–84.
Tao-Cheng Molecular Brain (2019) 12:44 Page 10 of 10