Embed Size (px)
Citation preview
Allemani, C; Weir, HK; Carreira, H; Harewood, R; Spika, D; Wang,XS; Bannon, F; Ahn, JV; Johnson, CJ; Bonaventure, A; Marcos-Gragera, R; Stiller, C; Azevedo e Silva, G; Chen, WQ; Ogunbiyi, OJ;Rachet, B; Soeberg, MJ; You, H; Matsuda, T; Bielska-Lasota, M;Storm, H; Tucker, TC; Coleman, MP; CONCORD Working Group,; , COLLABORATORS; Bouzbid, S; Hamdi-Chrif, M; Zaidi, Z; Bah,E; Swaminathan, R; Nortje, SH; Stefan, CD; El Mistiri, MM; Bayo,S; Malle, B; Manraj, SS; Sewpaul-Sungkur, R; Fabowale, A; Ogun-biyi, OJ; Bradshaw, D; Somdyala, NI; Abdel-Rahman, M; Jaidane, L;Mokni, M; Kumcher, I; Moreno, F; Gonzlez, MS; Laura, E; Pugh, FV;Torrent, ME; Carballo Quintero, B; Fita, R; Garcilazo, D; Giacciani,PL; Diumenjo, MC; Laspada, WD; Green, MA; Lanza, MF; Ibaez,SG; Lima, CA; Lobo, E; Daniel, C; Scandiuzzi, C; De Souza, PC; DelPino, K; Laporte, C; Curado, MP; de Oliveira, JC; Veneziano, CL;Veneziano, DB; Alexandre, TS; Verdugo, AS; Koifman, S; Azevedoe Silva, G; Galaz, JC; Moya, JA; Herrmann, DA; Jofre, AM; Uribe,CJ; Bravo, LE; Lopez Guarnizo, G; Jurado, DM; Yepes, MC; Galn,YH; Torres, P; Martnez-Reyes, F; Jaramillo, L; Quinto, R; Cueva,P; Ypez, J; Torres-Cintrn, CR; Tortolero-Luna, G; Alonso, R; Bar-rios, E; Russell, C; Shack, L; Coldman, AJ; Woods, RR; Noonan,G; Turner, D; Kumar, E; Zhang, B; McCrate, FR; Ryan, S; Han-nah, H; Dewar, RA; MacIntyre, M; Lalany, A; Ruta, M; Marrett,L; Nishri, DE; Vriends, KA; Bertrand, C; Louchini, R; Robb, KI;Stuart-Panko, H; Demers, S; Wright, S; George, J; Shen, X; Brock-house, JT; O’Brien, DK; Almon, L; Young, JL; Bates, J; Rycroft, R;Mueller, L; Phillips, C; Ryan, H; Walrath, J; Schwartz, A; Vigneau,F; MacKinnon, JA; Wohler, B; Bayakly, R; Ward, KC; Davidson-Allen, K; Glaser, S; West, D; Green, MD; Hernandez, BY; Johnson,CJ; Lynch, CF; McKeen, KM; Huang, B; Tucker, TC; Deapen, D;Liu, L; Hsieh, MC; Wu, XC; Stern, K; Gershman, ST; Knowlton,RC; Copeland, G; Spivak, G; Rogers, DB; Lemons, D; Williamson,LL; Hood, M; Jerry, H; Hosain, GM; Rees, JR; Pawlish, KS; Stroup,A; Key, C; Wiggins, C; Kahn, AR; Schymura, MJ; Leung, G; Rao,C; Giljahn, L; Warther, B; Pate, A; Patil, M; Shipley, DK; Esterly,M; Otto, RD; Fulton, JP; Rousseau, DL; Janes, TA; Schwartz, SM;Bolick, SW; Hurley, DM; Tenney, RA; Whiteside, MA; Hakenew-erth, A; Williams, MA; Herget, K; Sweeney, C; Martin, J; Wang,S; Harrelson, MG; Keitheri Cheteri, MB; Hudson, AG; Borchers, R;Stephenson, L; Espinoza, JR; Weir, HK; Edwards, BK; Wang, N;Yang, L; Chen, JS; Song, GH; Gu, XP; Zhang, P; Ge, HM; Zhao,DL; Zhang, JH; Zhu, FD; Tang, JG; Shen, Y; Wang, J; Li, QL; Yang,SP; Dong, JM; Li, WW; Cheng, LP; Chen, JG; Huang, QH; Huang,SQ; Guo, GP; Wei, K; Chen, WQ; Zeng, H; Demetriou, AW; Pavlou,
P; Mang, WK; Ngan, KC; Swaminathan, R; Kataki, AC; Krishna-treya, M; Jayalekshmi, PA; Sebastian, P; Sapkota, SD; Verma, Y;Nandakumar, A; Suzanna, E; Keinan-Boker, L; Silverman, BG; Ito,H; Hattori, M; Sugiyama, H; Utada, M; Katayama, K; Natsui, S;Matsuda, T; Nishino, Y; Koike, T; Ioka, A; Nakata, K; Kosa, K; Oki,I; Shibata, A; Nimri, O; Ab Manan, A; Bhoo Pathy, N; Ochir, C;Tuvshingerel, S; Al Khater, AM; El Mistiri, MM; Al-Eid, H; Jung,KW; Won, YJ; Park, S; Chiang, CJ; Lai, MS; Suwanrungruang, K;Wiangnon, S; Daoprasert, K; Pongnikorn, D; Geater, SL; Sriplung, H;Eser, S; Yakut, CI; Hackl, M; Zielonke, N; Mhlbck, H; Oberaigner,W; Pieros, M; Zborovskaya, AA; Henau, K; Van Eycken, L; Dim-itrova, N; Valerianova, Z; ekerija, M; Znaor, A; Zvolsk, M; Engholm,G; Storm, H; Aareleid, T; Mgi, M; Malila, N; Sepp, K; Velten, M;Cornet, E; Troussard, X; Bouvier, AM; Faivre, J; Guizard, AV; Bou-vier, V; Launoy, G; Arveux, P; Maynadi, M; Mounier, M; Woronoff,AS; Daoulas, M; Clavel, J; Le Guyader-Peyrou, S; Monnereau, A;Trtarre, B; Colonna, M; Delacour-Billon, S; Molini, F; Bara, S; Degr,D; Ganry, O; Laptre-Ledoux, B; Grosclaude, P; Lutz, JM; Belot, A;Estve, J; Forman, D; Sassi, F; Stabenow, R; Eberle, A; Nennecke, A;Kieschke, J; Sirri, E; Kajueter, H; Emrich, K; Zeissig, SR; Holleczek,B; Eisemann, N; Katalinic, A; Brenner, H; Asquez, RA; Kumar, V;lafsdttir, EJ; Tryggvadttir, L; Comber, H; Walsh, PM; Sundseth, H;Dal Cappello, T; Mazzoleni, G; Giacomin, A; Castaing, M; Sciacca,S; Sutera, A; Corti, M; Gola, G; Ferretti, S; Serraino, D; Zucchetto,A; Lillini, R; Vercelli, M; Busco, S; Pannozzo, F; Vitarelli, S; Ricci, P;Pascucci, V; Autelitano, M; Cirilli, C; Federico, M; Fusco, M; Vitale,MF; Usala, M; Cusimano, R; Vitale, F; Michiara, M; Sgargi, P; Sac-erdote, C; Tumino, R; Mangone, L; Falcini, F; Cremone, L; Budroni,M; Cesaraccio, R; Madeddu, A; Tisano, F; Maspero, S; Tessandori,R; Candela, G; Scuderi, T; Piffer, S; Rosso, S; Zanetti, R; Caldarella,A; Crocetti, E; La Rosa, F; Stracci, F; Contiero, P; Tagliabue, G;Zambon, P; Baili, P; Berrino, F; Gatta, G; Sant, M; Capocaccia, R;De Angelis, R; Verdecchia, A; Liepina, E; Maurina, A; Smailyte, G;Agius, D; Calleja, N; Siesling, S; Laronningen, S; Mller, B; Dyzmann-Sroka, A; Trojanowski, M; Gd, S; Myk, R; Gdalska-Lampart, M;Radziszewska, AU; Didkowska, J; Wojciechowska, U; Baszczyk, J;Kpska, K; Bielska-Lasota, M; Forjaz, G; Rego, RA; Bastos, J; An-tunes, L; Bento, MJ; da Costa Miranda, AM; Mayer-da-Silva, A;Coza, D; Todescu, AI; Krasilnikov, A; Valkov, M; Adamcik, J; SafaeiDiba, C; Primic akelj, M; agar, T; Stare, J; Almar, E; Mateos, A;Argelles, MV; Quirs, JR; Bidaurrazaga, J; Larraaga, N; Daz Garca,JM; Marcos, AI; Marcos-Gragera, R; Vilardell Gil, ML; Molina, E;Snchez, MJ; Ramos Montserrat, M; Chirlaque, MD; Navarro, C; Ar-danaz, E; Felipe Garcia, S; Peris-Bonet, R; Galceran, J; Khan, S;Lambe, M; Camey, B; Bouchardy, C; Usel, M; Ess, SM; Hermann,C; Levi, FG; Maspoli-Conconi, M; Kuehni, CE; Mitter, VR; Bor-doni, A; Spitale, A; Chiolero, A; Konzelmann, I; Dehler, SI; Laue,RI; Meechan, D; Poole, J; Greenberg, D; Rashbass, J; Davies, E;Linklater, K; Morris, E; Moran, T; Bannon, F; Gavin, A; Black, RJ;Brewster, DH; Roche, M; McPhail, S; Verne, J; Murphy, M; Stiller,
2
C; Huws, DW; White, C; Lawrence, G; Brook, C; Wilkinson, J; Fi-nan, P; Ahn, JV; Allemani, C; Bonaventure, A; Carreira, H; Cole-man, MP; Harewood, R; Rachet, B; Sanz, N; Spika, D; Wang, XS;Stephens, R; Butler, J; Peake, M; Chalker, E; Newman, L; Baker, D;Soeberg, MJ; Scott, C; Stokes, BC; Venn, A; Farrugia, H; Giles, GG;Threlfall, T; Currow, D; You, H; Lewis, C; Miles, SA (2015) Globalsurveillance of cancer survival 1995-2009: analysis of individual datafor 25 676 887 patients from 279 population-based registries in 67countries (CONCORD-2). Lancet, 385 (9972). pp. 977-1010. ISSN0140-6736 DOI: https://doi.org/10.1016/S0140-6736(14)62038-9
Downloaded from: http://researchonline.lshtm.ac.uk/2026657/
DOI: 10.1016/S0140-6736(14)62038-9
Usage Guidelines
Please refer to usage guidelines at http://researchonline.lshtm.ac.uk/policies.html or alterna-tively contact [email protected].
Available under license: http://creativecommons.org/licenses/by/2.5/
3
Articles
www.thelancet.com Vol 385 March 14, 2015 977
Global surveillance of cancer survival 1995–2009: analysis of individual data for 25 676 887 patients from 279 population-based registries in 67 countries (CONCORD-2)Claudia Allemani, Hannah K Weir, Helena Carreira, Rhea Harewood, Devon Spika, Xiao-Si Wang, Finian Bannon, Jane V Ahn, Christopher J Johnson, Audrey Bonaventure, Rafael Marcos-Gragera, Charles Stiller, Gulnar Azevedo e Silva, Wan-Qing Chen, Olufemi J Ogunbiyi, Bernard Rachet, Matthew J Soeberg, Hui You, Tomohiro Matsuda, Magdalena Bielska-Lasota, Hans Storm, Thomas C Tucker, Michel P Coleman, and the CONCORD Working Group*
SummaryBackground Worldwide data for cancer survival are scarce. We aimed to initiate worldwide surveillance of cancer survival by central analysis of population-based registry data, as a metric of the eff ectiveness of health systems, and to inform global policy on cancer control.
Methods Individual tumour records were submitted by 279 population-based cancer registries in 67 countries for 25·7 million adults (age 15–99 years) and 75 000 children (age 0–14 years) diagnosed with cancer during 1995–2009 and followed up to Dec 31, 2009, or later. We looked at cancers of the stomach, colon, rectum, liver, lung, breast (women), cervix, ovary, and prostate in adults, and adult and childhood leukaemia. Standardised quality control procedures were applied; errors were corrected by the registry concerned. We estimated 5-year net survival, adjusted for background mortality in every country or region by age (single year), sex, and calendar year, and by race or ethnic origin in some countries. Estimates were age-standardised with the International Cancer Survival Standard weights.
Findings 5-year survival from colon, rectal, and breast cancers has increased steadily in most developed countries. For patients diagnosed during 2005–09, survival for colon and rectal cancer reached 60% or more in 22 countries around the world; for breast cancer, 5-year survival rose to 85% or higher in 17 countries worldwide. Liver and lung cancer remain lethal in all nations: for both cancers, 5-year survival is below 20% everywhere in Europe, in the range 15–19% in North America, and as low as 7–9% in Mongolia and Thailand. Striking rises in 5-year survival from prostate cancer have occurred in many countries: survival rose by 10–20% between 1995–99 and 2005–09 in 22 countries in South America, Asia, and Europe, but survival still varies widely around the world, from less than 60% in Bulgaria and Thailand to 95% or more in Brazil, Puerto Rico, and the USA. For cervical cancer, national estimates of 5-year survival range from less than 50% to more than 70%; regional variations are much wider, and improvements between 1995–99 and 2005–09 have generally been slight. For women diagnosed with ovarian cancer in 2005–09, 5-year survival was 40% or higher only in Ecuador, the USA, and 17 countries in Asia and Europe. 5-year survival for stomach cancer in 2005–09 was high (54–58%) in Japan and South Korea, compared with less than 40% in other countries. By contrast, 5-year survival from adult leukaemia in Japan and South Korea (18–23%) is lower than in most other countries. 5-year survival from childhood acute lymphoblastic leukaemia is less than 60% in several countries, but as high as 90% in Canada and four European countries, which suggests major defi ciencies in the management of a largely curable disease.
Interpretation International comparison of survival trends reveals very wide diff erences that are likely to be attributable to diff erences in access to early diagnosis and optimum treatment. Continuous worldwide surveillance of cancer survival should become an indispensable source of information for cancer patients and researchers and a stimulus for politicians to improve health policy and health-care systems.
Funding Canadian Partnership Against Cancer (Toronto, Canada), Cancer Focus Northern Ireland (Belfast, UK), Cancer Institute New South Wales (Sydney, Australia), Cancer Research UK (London, UK), Centers for Disease Control and Prevention (Atlanta, GA, USA), Swiss Re (London, UK), Swiss Cancer Research foundation (Bern, Switzerland), Swiss Cancer League (Bern, Switzerland), and University of Kentucky (Lexington, KY, USA).
Copyright ©Allemani et al. Open Access article distributed under the terms of CC BY.
IntroductionThe global burden of cancer is growing, particularly in countries of low and middle income. The need to implement eff ective strategies of primary prevention is
urgent.1,2 Prevention is crucial but long term. If WHO’s global target of a 25% reduction in deaths from cancer and other non-communicable diseases in people aged 30–69 years is to be achieved by 2025 (referred to as
Lancet 2015; 385: 977–1010
Published OnlineNovember 26, 2014http://dx.doi.org/10.1016/S0140-6736(14)62038-9
See Comment page 926
This online publication has been corrected. The corrected version fi rst appeared at thelancet.com on Dec 8, 2014
See Online/Commenthttp://dx.doi.org/10.1016/S0140-6736(14)62251-0
*Members listed at end of report
Cancer Research UK Cancer Survival Group, Department of Non-Communicable Disease Epidemiology, London School of Hygiene & Tropical Medicine, London, UK (C Allemani PhD, H Carreira MPH, R Harewood MSc, D Spika MSc, X-S Wang PhD, J V Ahn MSc, A Bonaventure MD, B Rachet FFPH, Prof M P Coleman FFPH); Division of Cancer Prevention and Control, Centers for Disease Control and Prevention, Atlanta, GA, USA (H K Weir PhD); Northern Ireland Cancer Registry, Centre for Public Health, Queen’s University Belfast, Belfast, UK (F Bannon PhD); Cancer Data Registry of Idaho, Boise, ID, USA (C J Johnson MPH); Unitat d’Epidemiologia i Registre de Càncer de Girona, Departament de Salut, Institut d’Investigació Biomèdica de Girona, Girona, Spain (R Marcos-Gragera PhD); South East Knowledge and Intelligence Team, Public Health England, Oxford, UK (C Stiller MSc); Department of Epidemiology, Universidade do Estado do Rio de Janeiro, Rio de Janeiro, RJ, Brazil (Prof G Azevedo e Silva MD); National Offi ce for Cancer Prevention and Control and National Central Cancer Registry, National Cancer
Articles
978 www.thelancet.com Vol 385 March 14, 2015
25 × 25),3 we will need not only more eff ective prevention (to reduce incidence) but also more eff ective health systems (to improve survival).4
In the fi rst international comparison of cancer survival, a transatlantic study of patients diagnosed during 1945–54, survival for 12 cancers in three US states was typically higher than in six European countries.5 In 2008, a global comparison of population-based cancer survival (CONCORD) showed very wide variations in survival from cancers of the breast (women), colon, rectum, and prostate.6 That analysis included 1·9 million adults (age 15–99 years) diagnosed with cancer during 1990–94 and followed up until 1999 from 31 countries (16 with 100% population coverage) on fi ve continents.
Three large international comparisons of cancer survival have been published since 2008. The European cancer registry study on survival (EUROCARE)-5 provided survival estimates for all cancers for patients diagnosed during 2000–07 in 29 countries in Europe.7 In SurvCan (cancer survival in Africa, Asia, the Caribbean, and Central America), relative survival estimates were reported for patients diagnosed during 1990–2001 in 12 low-income and middle-income countries.8 The International Cancer Benchmarking Partnership published survival estimates for four common cancers for patients diagnosed during 1995–2007 in six high-income countries.9 These three studies diff er with respect to geographic and population coverage, calendar period, and analytical methods and do not enable worldwide comparison of cancer survival.
Surveillance of cancer survival is seen as important by national and international agencies, cancer patient advocacy groups, departments of health, politicians, and research agencies. Cancer survival research is being used to formulate cancer control strategies,9 to prioritise cancer control measures,10 and to assess both the eff ectiveness11,12 and cost-eff ectiveness13 of those strategies.
We designed CONCORD-2 to initiate long-term worldwide surveillance of cancer survival on the broadest possible basis. Our aim is to analyse progress toward the overarching goal in the Union for International Cancer Control’s World Cancer Declaration 2013: “there will be major reductions in premature deaths from cancer and improvements in quality of life and cancer survival”.14
MethodsCancer registriesWe identifi ed population-based cancer registries that were operational in 2009 and had either published reports on survival or were known to follow up registered cancer patients to establish their vital status. Many registries had met quality criteria for inclusion in either the quinquennial compendium Cancer Incidence in Five Continents,15,16 published by the International Association of Cancer Registries (IACR) and the International Agency for Research on Cancer (IARC), or similar compendia; other registries were established more recently.
We invited all these registries to contribute data for patients diagnosed during all or part of the 15-year period 1995–2009, including data on their vital status at least 5 years after diagnosis, or at Dec 31, 2009, or a later year. Of 395 registries invited, 306 (77%) agreed to participate: of these, 24 (8%) did not submit data, either because of resource constraints (n=4), legal constraints (1) or reversal of the original decision (3), or because they could not provide complete follow-up data (6) or did not respond to further communication (10). We excluded three registries because they provided data that did not adhere to the protocol and could not be rectifi ed, leaving 279 participating registries (71% of those invited).
Among the cancers suggested by participating registries, the ten we prioritised for study (referred to as index sites) accounted collectively for almost two-thirds of the estimated global cancer burden in 2008, both in developed and developing countries.4 They comprised cancers of the stomach, colon, rectum, liver, lung, breast (women), cervix, ovary, and prostate in adults (age 15–99 years), and leukaemia in adults, and precursor-cell acute lympho-blastic leukaemia in children (age 0–14 years).
Ethics approvalWe obtained approval for CONCORD-2 from the Ethics and Confi dentiality Committee of the UK’s statutory National Information Governance Board (now the Health Research Authority; ECC 3-04(i)/2011) and the National Health Service (NHS) research ethics service (southeast; 11/LO/0331). We obtained separate statutory or ethics approval (or both) in more than 40 other jurisdictions to secure the release of data. Registries in all other jurisdictions obtained their own ethics approval locally.
We applied strict security constraints to the transmission of data fi les. We gave every registry a set of unique numeric codes for the name of every fi le; these codes have no meaning outside the CONCORD-2 study. All data fi elds were numeric or coded. We developed a fi le transmission utility deploying 256-bit advanced encryption security, with random, strong, one-time passwords that were generated automatically at the point of data transmission but sent separately, thus eliminating the need for email or telephone exchanges to confi rm passwords. We also provided free access to a similar commercial utility (HyperSend; Covisint, Detroit, MI, USA) that complies with US federal law on the secure transmission of sensitive health data.
ProtocolWe fi nalised the protocol (in which we defi ned the data structure, fi le transmission procedures, and statistical analyses) after a 2-day meeting in Cork, Ireland, in September, 2012, with 90 members of the CONCORD Working Group from 48 countries (the protocol was revised by October, 2012). English poses a communication barrier in many countries; therefore, native speakers
Center, Beijing, China (W-Q Chen PhD); Ibadan Cancer Registry, University City College
Hospital, Ibadan, Nigeria (Prof O J Ogunbiyi FWACP);
New South Wales Central Cancer Registry, Australian Technology
Park (M J Soeberg PhD), and Cancer Institute NSW
(H You MAppStats), Sydney, NSW, Australia;
Population-Based Cancer Registry Section, Division of
Surveillance, Center for Cancer Control and Information Services, National Cancer
Center, Tokyo, Japan (T Matsuda PhD); Department
of Health Promotion and Postgraduate Education,
National Institute of Public Health and National Institute
of Hygiene, Warsaw, Poland (Prof M Bielska-Lasota MD);
Cancer Prevention and Documentation, Danish Cancer Society, Copenhagen, Denmark
(H Storm MD); and Kentucky Cancer Registry, University of Kentucky, Lexington, KY, USA
(Prof T C Tucker PhD)
Correspondence to:Prof M P Coleman, Cancer
Research UK Cancer Survival Group, Department of
Non-Communicable Disease Epidemiology, London School of
Hygiene & Tropical Medicine, London WC1E 7HT, UK
For the protocol see http://www.lshtm.ac.uk/eph/ncde/
cancersurvival/research/concord/protocol/index.html
Articles
www.thelancet.com Vol 385 March 14, 2015 979
translated the protocol into Chinese (Mandarin), Portuguese, and Spanish, and other native speakers did back-translation to check the translation against the English original. We made the protocol available in all four languages. We held protocol workshops in Argentina (for Spanish-speaking South American researchers), Brazil, China, India, Japan, Puerto Rico, Russia, and the USA (for North America), which we followed up with conference calls and online seminars. We responded to telephone or email queries in Chinese, English, French, Italian, Portuguese, and Spanish.
We defi ned countries, states, and world regions by their UN names and codes (as of 2007).17 Only Cuba and Puerto Rico provided data from the Caribbean and Central America so we grouped them with South America as America (Central and South). We wrote this Article and prepared the maps without prejudice to the status, boundaries, or name of any country, territory, or region. We have shortened some names for convenience (eg, Korea for South Korea), which does not have any political signifi cance. We created world maps and 27 regional maps in ArcGIS version 10, using digital boundaries (shapefi les) of countries and subnational regions from the Database of Global Administrative Areas (GADM 2.0).18 We obtained national populations for 2009 from the UN Population Database17 or national authorities (Canada, Portugal, and the UK) and subnational populations from the relevant registries.
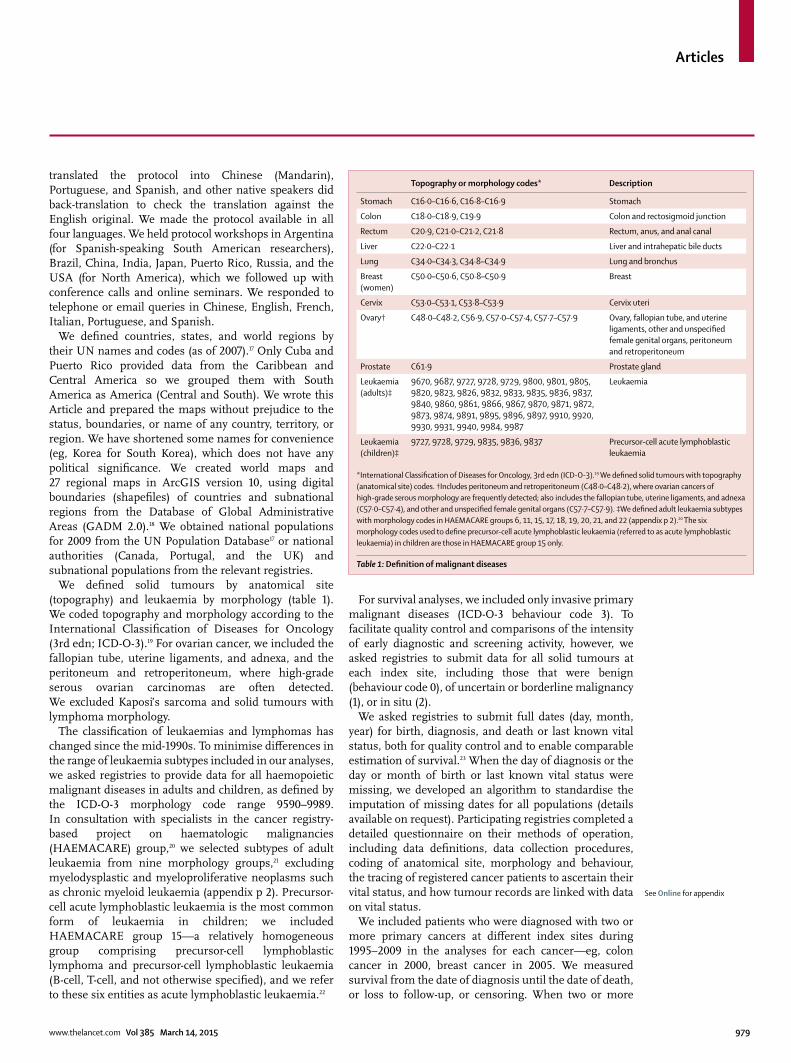
We defi ned solid tumours by anatomical site (topography) and leukaemia by morphology (table 1). We coded topography and morphology according to the International Classifi cation of Diseases for Oncology (3rd edn; ICD-O-3).19 For ovarian cancer, we included the fallopian tube, uterine ligaments, and adnexa, and the peritoneum and retroperitoneum, where high-grade serous ovarian carcinomas are often detected. We excluded Kaposi’s sarcoma and solid tumours with lymphoma morphology.
The classifi cation of leukaemias and lymphomas has changed since the mid-1990s. To minimise diff erences in the range of leukaemia subtypes included in our analyses, we asked registries to provide data for all haemopoietic malignant diseases in adults and children, as defi ned by the ICD-O-3 morphology code range 9590–9989. In consultation with specialists in the cancer registry-based project on haematologic malignancies (HAEMACARE) group,20 we selected subtypes of adult leukaemia from nine morphology groups,21 excluding myelodysplastic and myeloproliferative neoplasms such as chronic myeloid leukaemia (appendix p 2). Precursor-cell acute lymphoblastic leukaemia is the most common form of leukaemia in children; we included HAEMACARE group 15—a relatively homogeneous group comprising precursor-cell lymphoblastic lymphoma and precursor-cell lymphoblastic leukaemia (B-cell, T-cell, and not otherwise specifi ed), and we refer to these six entities as acute lymphoblastic leukaemia.22
For survival analyses, we included only invasive primary malignant diseases (ICD-O-3 behaviour code 3). To facilitate quality control and comparisons of the intensity of early diagnostic and screening activity, however, we asked registries to submit data for all solid tumours at each index site, including those that were benign (behaviour code 0), of uncertain or borderline malignancy (1), or in situ (2).
We asked registries to submit full dates (day, month, year) for birth, diagnosis, and death or last known vital status, both for quality control and to enable comparable estimation of survival.23 When the day of diagnosis or the day or month of birth or last known vital status were missing, we developed an algorithm to standardise the imputation of missing dates for all populations (details available on request). Participating registries completed a detailed question naire on their methods of operation, including data defi nitions, data collection procedures, coding of anatomical site, morphology and behaviour, the tracing of registered cancer patients to ascertain their vital status, and how tumour records are linked with data on vital status.
We included patients who were diagnosed with two or more primary cancers at diff erent index sites during 1995–2009 in the analyses for each cancer—eg, colon cancer in 2000, breast cancer in 2005. We measured survival from the date of diagnosis until the date of death, or loss to follow-up, or censoring. When two or more
See Online for appendix
Topography or morphology codes* Description
Stomach C16·0–C16·6, C16·8–C16·9 Stomach
Colon C18·0–C18·9, C19·9 Colon and rectosigmoid junction
Rectum C20·9, C21·0–C21·2, C21·8 Rectum, anus, and anal canal
Liver C22·0–C22·1 Liver and intrahepatic bile ducts
Lung C34·0–C34·3, C34·8–C34·9 Lung and bronchus
Breast (women)
C50·0–C50·6, C50·8–C50·9 Breast
Cervix C53·0–C53·1, C53·8–C53·9 Cervix uteri
Ovary† C48·0–C48·2, C56·9, C57·0–C57·4, C57·7–C57·9 Ovary, fallopian tube, and uterine ligaments, other and unspecifi ed female genital organs, peritoneum and retroperitoneum
Prostate C61·9 Prostate gland
Leukaemia (adults)‡
9670, 9687, 9727, 9728, 9729, 9800, 9801, 9805, 9820, 9823, 9826, 9832, 9833, 9835, 9836, 9837, 9840, 9860, 9861, 9866, 9867, 9870, 9871, 9872, 9873, 9874, 9891, 9895, 9896, 9897, 9910, 9920, 9930, 9931, 9940, 9984, 9987
Leukaemia
Leukaemia (children)‡
9727, 9728, 9729, 9835, 9836, 9837 Precursor-cell acute lymphoblastic leukaemia
*International Classifi cation of Diseases for Oncology, 3rd edn (ICD-O-3).19 We defi ned solid tumours with topography (anatomical site) codes. †Includes peritoneum and retroperitoneum (C48·0–C48·2), where ovarian cancers of high-grade serous morphology are frequently detected; also includes the fallopian tube, uterine ligaments, and adnexa (C57·0–C57·4), and other and unspecifi ed female genital organs (C57·7–C57·9). ‡We defi ned adult leukaemia subtypes with morphology codes in HAEMACARE groups 6, 11, 15, 17, 18, 19, 20, 21, and 22 (appendix p 2).20 The six morphology codes used to defi ne precursor-cell acute lymphoblastic leukaemia (referred to as acute lymphoblastic leukaemia) in children are those in HAEMACARE group 15 only.
Table 1: Defi nition of malignant diseases
Articles
980 www.thelancet.com Vol 385 March 14, 2015
primary malignant diseases occurred at the same index site during 1995–2009, we included the fi rst cancer only. We retained the most complete record for patients with synchronous primary cancers in the same organ.
North American registries defi ne multiple primary cancers under the rules of the Surveillance, Epidemiology and End Results (SEER) programme,24 whereas registries in the European Network of Cancer Registries (ENCR) and elsewhere generally use the rules of the IACR,25 which are more conservative. The North American Association of Central Cancer Registries (NAACCR) prepared a program to enable all North American registries to recode their entire incidence databases to the IACR multiple primary rules, before their datasets for 1995–2009 were extracted for CONCORD-2.
Quality controlThe quality and completeness of cancer registration data can aff ect both incidence and survival estimates and, thus, the reliability of international comparisons.26 We developed a suite of quality control programs,27 extending the checks used in the fi rst CONCORD study,6 cross-checked with those used in the EUROCARE study,28 IARC/IACR tools for cancer registries,29 and WHO’s classifi cation of tumours.22,30–32 We applied these checks systematically in three phases and sent registries a detailed report on how to revise and resubmit their data, if needed, after every phase.
First, we sent registries a protocol adherence report that showed, for every cancer, the proportion of tumour records that were coded in compliance with the protocol. Second, we checked the data in every tumour record for logical coherence against 20 sets of criteria, including eligibility (eg, age, tumour behaviour), defi nite errors (eg, sex-site errors and invalid dates or date sequence), and possible errors including a wide range of inconsistencies between age, tumour site, and morphology.27 We sent registries exclusion reports that showed, for every index cancer and calendar period, the number of tumour records in each category of defi nite or possible error, the number of tumours registered from a death certifi cate only or detected at autopsy, and the number of patients whose data could be included in survival analyses. When we identifi ed errors in classifi cation, coding, or pathological assignment, we asked registries to correct and resubmit their data. Finally, we analysed: the proportion of tumour records with morphological verifi cation or non-specifi c morphology; distributions of the day and month of birth, diagnosis, and last known vital status; and proportions of patients who died within 30 days, were reported as lost to follow-up, or were censored within 5 years of diagnosis.
Follow-up for vital statusCancer registries use various methods to ascertain the vital status (alive, dead, emigrated, lost to follow-up) of registered cancer patients. In countries with limited
administrative infrastructure, so-called active follow-up can be used to establish vital status via direct contact with the patient, the family, or a local authority (eg, a village headman), or by home visit. Many registries in both high-income and low-income countries also seek information from the hospital or the treating clinician in hospital or primary care.
Most registries link their database with a regional or national index of deaths, using identifi ers such as name, sex, date of birth, and identity number. Tumour records that match to a death record are updated with the date of death. Many registries also use other offi cial databases (eg, hospital and primary care databases, social insurance, health insurance, drivers’ licences, and electoral registers) to establish the date on which a patient was last known or believed to have been alive, to have migrated within the country, or to have emigrated to another country. Cancer registrations are updated with the vital status and the date of last known vital status. These methods are typically summarised as passive follow-up.
Some registries receive information on the vital status of all registered patients on an almost continuous basis, or at least every month or every 3 months. Other registries seek to trace the vital status of patients registered in a particular calendar year only, 1 year or even 5 years after the end of that year: this approach can increase the proportion of patients lost to follow-up. It also means that 5-year survival estimates for more recently diagnosed patients cannot be obtained, even with the period approach.
We asked all 279 participating registries how they ascertained the vital status of registered cancer patients. Of 243 registries that responded to the question, 147 (60%) stated that they used only passive follow-up, 92 (38%) that they used both passive and active follow-up, and four (2%) only active follow-up.
Statistical analysisMost registries submitted data for patients diagnosed from 1995 to 2009, with follow-up to 2009 or later; some registries only began operation after 1995 or provided data for less than 15 years. We were able to estimate 5-year survival using the cohort approach for patients diagnosed in 1995–99 and 2000–04, because in most datasets, all patients had been followed up for at least 5 years. We used the period approach33 to estimate 5-year survival for patients diagnosed during 2005–09, because 5 years of follow-up data were not available for all patients (appendix p 174).
We estimated net survival up to 5 years after diagnosis for both adults and children. Net survival represents the cumulative probability that the cancer patients would have survived a given time, say 5 years or more after diagnosis, in the hypothetical situation that the cancer was the only possible cause of death. Net survival can be interpreted as the proportion of cancer patients who survive up to that time, after eliminating other causes of
Articles
www.thelancet.com Vol 385 March 14, 2015 981
death (background mortality). We used the recently developed Pohar Perme estimator34 of net survival imple-mented with the program stns35 in Stata version 13.36 This estimator takes unbiased account of the fact that older patients are more likely than younger patients to die from causes other than cancer—ie, that the competing risks of death are higher for elderly cancer patients.
To control for the wide diff erences in background mortality between participating jurisdictions and over time, we constructed 6514 life tables of all-cause mortality in the general population of each country or the territory covered by each participating registry, by age (single year), sex, and calendar year of death, and by race or ethnic origin in Israel (Arab, Jewish), Malaysia (Chinese, Malay, Indian), New Zealand (Māori, non-Māori), and the USA (Black, White). The method of life table construction depended on whether we received raw data (numbers of deaths and populations) or mortality rates, and on whether the raw data or the mortality rates were by single year of age (so-called complete) or by 5-year or 10-year age group (abridged). We checked the life tables by examination of age-sex-mortality rates, life expectancy at birth (appendix p 175), the probability of death in the age bands 15–59 years, 60–84 years, and 85–99 years and, where necessary, the model residuals.
Of the 279 participating registries, 21 provided complete life tables that did not need interpolation or
smoothing, for each calendar year. For 172 registries, we obtained raw data from either the registry, the relevant national statistical authority, or the Human Mortality Database.37 We derived life tables for 1996 and 2010 if possible, each centred on three calendar years of data (eg, 1995–97, 2009–11) to increase the robustness of the rates. We modelled raw mortality rates with Poisson regression and fl exible functions to obtain smoothed complete life tables extended up to age 99 years. We then created life tables for every calendar year from 1997 to 2009 by linear interpolation between the 1996 and 2010 life tables.38 Rather than extrapolate, we used the 1996 life table for 1995.
62 of 279 registries provided abridged mortality rates, or complete mortality rates that were not smoothed. We used the Ewbank relational model39 with three or four parameters to interpolate (if abridged) and smooth the mortality rates for the registry territory against a high-quality smooth life table for a country with a similar pattern of mortality by age. We could not obtain reliable data on all-cause mortality for 24 registries. We took national life tables published by the UN Population Division40 and interpolated and extended them to age 99 years with the Elandt-Johnson method.41
For each country and registry, we present estimates of age-standardised net survival for each cancer at 5 years after diagnosis. We report cumulative survival probabilities
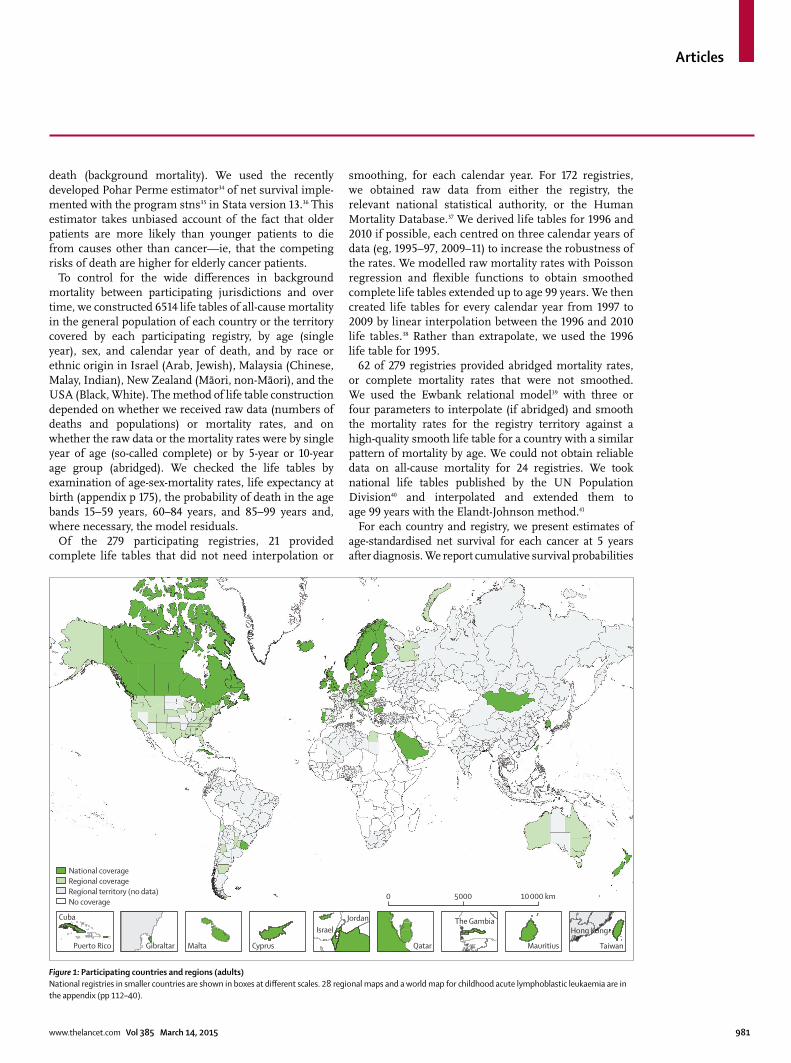
Figure 1: Participating countries and regions (adults)National registries in smaller countries are shown in boxes at diff erent scales. 28 regional maps and a world map for childhood acute lymphoblastic leukaemia are in the appendix (pp 112–40).
National coverageRegional coverageRegional territory (no data)No coverage
5000 10 000 km0
Cuba
Puerto Rico Gibraltar Malta Cyprus
IsraelJordan
Qatar Mauritius
Hong KongThe Gambia
Taiwan
Articles
982 www.thelancet.com Vol 385 March 14, 2015
as percentages. For adults, we used the International Cancer Survival Standard (ICSS) weights, with age at diagnosis categorised into fi ve groups: 15–44 years, 45–54 years, 55–64 years, 65–74 years, and 75–99 years for eight solid tumours and leukaemia in adults; and 15–54 years, 55–64 years, 65–74 years, 75–84 years, and 85–99 years for prostate cancer.42 For children, we estimated survival for the age groups 0–4 years, 5–9 years, and 10–14 years; we obtained age-standardised estimates by assigning equal weights to the three age-specifi c estimates.43 We derived CIs for both unstandardised and age-standardised survival estimates assuming a normal distribution, truncated to the range 0–100. We derived SEs with the Greenwood method44 to construct the CIs
We did not estimate survival if fewer than ten patients were available for analysis. If between ten and 49 patients were available for analysis in a given calendar period (1995–99, 2000–04, 2005–09), we merged data for two consecutive periods. For less common cancers in the smallest populations, we sometimes needed to merge data for all three periods. When between ten and 49 patients in total were available, we only estimated survival for all ages combined. If 50 or more patients were available, we attempted survival estimation for each age group. If an age-specifi c estimate could not be obtained, we merged data for adjacent age groups and assigned the combined estimate to both age groups. If two or more age-specifi c estimates could not be obtained, we present only the unstandardised estimate for all ages combined.
Role of the funding sourcesThe funders had no role in study design, data collection, data analysis, data interpretation, or writing of the report. The corresponding author had full access to all data in the study and had fi nal responsibility for the decision to submit for publication.
Results279 cancer registries from 67 countries provided data for this study (fi gure 1; appendix pp 112–40). Nine African countries took part (ten registries), eight countries were in Central and South America (27 registries), Canada and the USA comprised North America (57 registries), 16 countries were in Asia (50 registries), 30 European countries participated (128 registries), and New Zealand and Australia represented Oceania (seven registries). For countries with less than 100% coverage of the population, the country name is used for brevity in the text (eg, Libya, the USA), but a more accurate term is used in the tables (eg, Libya [Benghazi], US registries). Some registries provided data for only part of their territory.
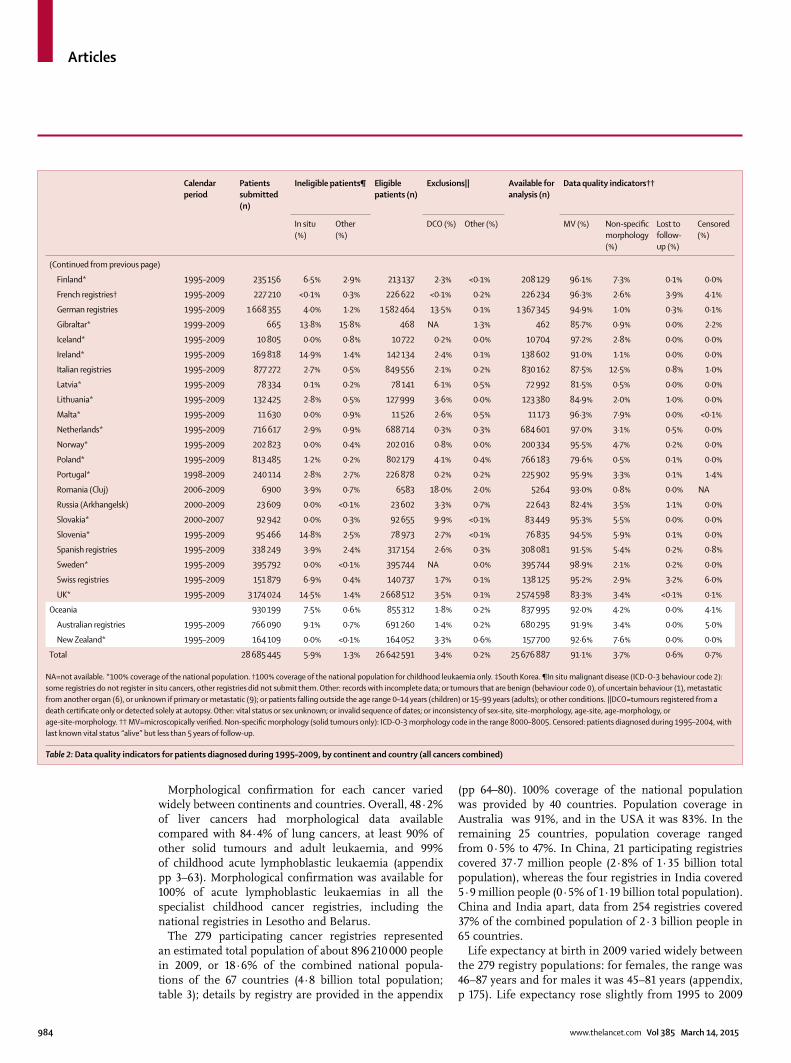
We examined records for 28 685 445 patients diagnosed with cancer of the stomach, colon, rectum, liver, lung, breast (women), cervix, ovary, and prostate in adults (age 15–99 years), leukaemia in adults, and precursor-cell acute lymphoblastic leukaemia in children (age 0–14 years) during the period 1995–2009 (table 2). Of these,
1 682 081 (5·9%) records were for an in situ cancer, mostly of the cervix, breast, colon, or prostate. The proportions of in situ cancer are not comparable directly because some registries do not record in situ cancer, others did not submit data for index sites in which in situ malignant disease is common, and screening programmes in which in situ cancers are frequently detected were introduced in some countries during 1995–2009. The variation between continents is still of interest: for example, a little over 1% of cervical cancers in African registries were in situ, compared with 20% in Central and South American registries and 81% in Oceania. For breast cancer in situ, the variation was from 0·1% in African registries to 16% in North American registries and about 4–5% in other regions of the world (appendix pp 3–63). Patients with in situ cancer were not included in survival analyses.
We excluded a further 360 773 (1·3%) patients either because their year of birth, month or year of diagnosis, or year of last vital status were unknown, or because the tumour was not primary invasive malignant disease (behaviour code 3) or the morphology was that of Kaposi’s sarcoma or lymphoma in a solid organ, or for other reasons (table 2). The proportion of patients with an unknown date of last vital status ranged from 0% to 40% or more for some cancers in some African registries. Proportions are presented in the appendix (pp 3–63) for each registry, for all cancers combined, and for each cancer separately.
Of 26 642 591 patients eligible for inclusion in the survival analyses, 905 841 (3·4%) were excluded because their cancer was registered from a death certifi cate only or discovered at autopsy (table 2), and 59 863 (0·2%) were excluded for other reasons, including defi nite errors (eg, unknown vital status or sex, sex-site error, or invalid dates or sequence of dates) or possible errors (eg, apparent inconsistencies between age, cancer site, and morphology) for which the record was not later confi rmed as correct by the relevant registry.
Of 25 676 887 patients available for survival analyses (96·4% of those eligible), pathological evidence of malignant disease (histological, cytological, or haema-tological fi ndings) was available for 23 338 015 patients for all cancers combined (91·1%; table 2), ranging from 83·1% in Asian registries, 85·5% in African registries, and 87·4% in Central and South American registries to 90–95% in Europe, Oceania, and North America. The range of pathological evidence at a national level was very wide, from 15% in The Gambia, 36% in Mongolia, and 66% in Chinese registries, up to 99% or more in Belgium, Mauritius, and Sweden. For 938 703 (3·7%) patients, morphological features were poorly specifi ed (eg, malignant neoplasm or tumour, ICD-O-3 codes 8000–8005): this proportion also varied widely, from around 1% in North American registries to 17% for all African registries combined and as high as 59% in The Gambia. Data for every registry are shown in the appendix (pp 3–63).
Articles
www.thelancet.com Vol 385 March 14, 2015 983
Calendar period
Patients submitted (n)
Ineligible patients¶ Eligible patients (n)
Exclusions|| Available for analysis (n)
Data quality indicators††
In situ (%)
Other (%)
DCO (%) Other (%) MV (%) Non-specifi c morphology (%)
Lost to follow-up (%)
Censored (%)
Africa 23 325 0·2% 39·5% 14 048 1·4% 9·6% 12 509 85·5% 17·0% 10·2% 28·8%
Algerian registries 1995–2009 6919 <0·1% 5·8% 6515 0·3% 17·4% 5358 93·8% 12·3% 0·0% 21·5%
Lesotho (childhood)† 1995–2009 22 0·0% 0·0% 22 0·0% 0·0% 22 100·0% 0·0% 0·0% 11·8%
Libya (Benghazi) 2003–2005 1698 0·0% 0·4% 1692 8·9% 0·5% 1533 84·4% 16·5% 0·0% 32·4%
Mali (Bamako) 1995–2009 1007 0·0% 78·3% 219 5·0% 2·3% 203 58·6% 41·4% 83·7% 6·4%
Mauritius* 2005–2005 855 0·0% 0·6% 850 0·0% 0·9% 842 100·0% 24·1% 0·0% NA
Nigeria (Ibadan) 1998–2007 2192 2·1% 60·1% 830 0·6% 3·6% 795 70·8% 0·0% 8·9% 65·1%
South Africa (Eastern Cape) 1998–2007 2404 0·0% 2·9% 2335 0·1% 4·4% 2230 70·5% 32·8% 45·7% 25·1%
The Gambia* 1995–1997 387 0·0% 10·1% 348 0·9% 10·3% 309 15·2% 58·9% 3·2% 14·2%
Tunisia (Central) 1995–2007 7841 0·1% 84·1% 1237 NA 1·6% 1217 99·1% 1·0% 0·7% 51·2%
America (Central and South) 467 456 3·0% 8·0% 416 140 13·7% 0·7% 356 173 87·4% 7·7% 0·1% 2·9%
Argentinian registries 1995–2009 40 482 5·0% 7·6% 35 377 11·1% 0·5% 31 244 97·9% 3·7% <0·1% 14·6%
Brazilian registries 1995–2009 119 423 5·4% 20·0% 89 067 9·5% 0·5% 80 113 92·8% 7·1% 0·2% 1·7%
Chilean registries 1998–2008 8920 8·2% 0·7% 8121 10·7% 0·5% 7213 90·3% 4·1% 0·5% 0·0%
Colombian registries 1995–2009 36 140 1·5% 5·7% 33 550 5·7% 0·8% 31 365 88·5% 12·0% <0·1% 19·5%
Cuba* 1998–2006 120 748 0·3% 2·1% 117 883 23·7% 0·3% 89 576 70·6% 11·7% 0·0% 0·0%
Ecuadorian registries 1995–2009 35 395 1·3% 5·7% 32 924 9·7% 4·3% 28 314 92·0% 3·7% 0·0% <0·1%
Puerto Rico* 2000–2009 81 886 3·9% 4·5% 74 937 6·7% 0·3% 69 745 97·2% 1·4% 0·0% 0·0%
Uruguay* 2002–2009 24 462 0·4% 0·3% 24 281 23·4% 0·0% 18 603 80·6% 20·9% 0·0% 0·0%
America (North) 12 233 257 6·0% 1·3% 11 340 569 1·8% 0·2% 11 109 332 94·8% 1·3% 0·8% <0·1%
Canada* 1995–2009 1 392 677 4·3% 0·6% 1 324 227 1·8% 0·5% 1 294 159 88·7% 1·5% 0·0% <0·1%
US registries 1995–2009 10 840 580 6·2% 1·4% 10 016 342 1·8% 0·2% 9 815 173 95·6% 1·3% 0·9% <0·1%
Asia 3 581 339 3·3% 0·9% 3 432 472 4·4% 0·2% 3 274 733 83·1% 11·4% 0·7% 2·6%
Chinese registries 1995–2009 241 044 0·1% 1·3% 237 656 1·6% <0·1% 233 736 66·4% 38·7% 3·5% 0·1%
Cyprus* 2004–2009 9986 2·8% 2·7% 9437 8·6% 0·2% 8609 98·7% 2·1% 0·0% 0·1%
Hong Kong* 1997–2006 6184 0·0% 0·0% 6184 0·0% 0·2% 6169 99·6% <0·1% 9·0% 8·5%
Indian registries 1995–2009 11 732 0·0% 1·5% 11 551 2·7% 0·1% 11 235 81·8% 9·7% 22·9% 9·9%
Indonesia (Jakarta) 2005–2007 3830 0·0% 18·1% 3138 1·3% 0·2% 3091 75·4% 23·0% 0·0% NA
Israel* 1995–2009 202 745 6·1% 2·0% 186 266 3·2% 0·2% 179 921 94·2% 6·4% 0·0% 0·0%
Japanese registries 1995–2009 1 065 707 3·7% 1·0% 1 015 315 13·3% <0·1% 879 341 86·4% 9·9% 0·0% 3·6%
Jordan* 2000–2009 19 191 0·0% 0·6% 19 081 <0·1% 0·9% 18 896 99·3% 1·5% 54·9% 0·0%
Korea*‡ 1995–2009 1 191 749 0·0% 0·8% 1 182 442 <0·1% 0·1% 1 180 925 82·5% 8·9% 0·0% 0·0%
Malaysia (Penang) 1995–2009 15 842 0·0% 2·5% 15 447 2·4% 1·8% 14 800 92·0% 9·8% 0·0% <0·1%
Mongolia* 2005–2009 13 415 1·8% 0·6% 13 096 <0·1% 4·5% 12 510 35·7% 1·2% 16·9% NA
Qatar* 2002–2009 780 0·8% 0·1% 773 2·7% 0·4% 749 90·0% 6·4% 0·0% 5·1%
Saudi Arabia* 1995–2008 24 216 1·4% 0·1% 23 876 2·6% 10·1% 20 860 95·2% 1·6% 0·0% 61·3%
Taiwan* 1995–2009 662 906 9·2% <0·1% 601 480 0·0% 0·1% 600 934 83·1% 9·6% 0·0% 0·0%
Thai registries 1995–2009 47 263 1·4% 0·7% 46 279 4·0% 0·1% 44 406 58·5% 38·4% 0·1% 23·4%
Turkey (Izmir) 1995–2009 64 749 3·3% 3·4% 60 451 3·0% 0·2% 58 551 92·9% 2·1% <0·1% 30·7%
Europe 11 449 869 6·5% 1·0% 10 584 050 4·5% 0·2% 10 086 145 89·7% 3·5% 0·3% 0·4%
Austria * 1995–2009 353 194 6·9% 0·6% 326 730 0·1% 0·9% 323 432 97·6% 2·5% 0·0% 0·0%
Belarus (childhood)† 1995–2009 726 0·0% 0·0% 726 0·0% 0·0% 726 99·9% 0·0% 2·8% 0·0%
Belgium* 2004–2009 256 073 8·7% 0·6% 232 152 <0·1% 0·2% 231 734 98·7% 1·5% 1·1% 0·0%
Bulgaria* 1995–2009 255 768 <0·1% 0·2% 255 158 11·2% <0·1% 226 566 81·4% 1·3% 0·1% 0·0%
Croatia* 1998–2009 148 131 0·0% 0·1% 148 031 6·0% <0·1% 139 147 84·9% 0·4% 0·0% 0·0%
Czech Republic* 1995–2009 469 330 6·4% 1·3% 433 523 7·9% 0·9% 395 462 90·8% 1·9% 0·0% 0·0%
Denmark* 1995–2009 251 533 0·0% 0·2% 250 931 0·4% 0·0% 249 943 93·2% 8·0% 0·1% 0·0%
Estonia* 1995–2008 51 544 1·4% 1·1% 50 283 3·8% 0·4% 48 193 89·0% 3·5% 0·4% 0·0%
(Table 2 continues on next page)
Articles
984 www.thelancet.com Vol 385 March 14, 2015
Morphological confi rmation for each cancer varied widely between continents and countries. Overall, 48·2% of liver cancers had morphological data available compared with 84·4% of lung cancers, at least 90% of other solid tumours and adult leukaemia, and 99% of childhood acute lymphoblastic leukaemia (appendix pp 3–63). Morphological confi rmation was available for 100% of acute lymphoblastic leukaemias in all the specialist childhood cancer registries, including the national registries in Lesotho and Belarus.
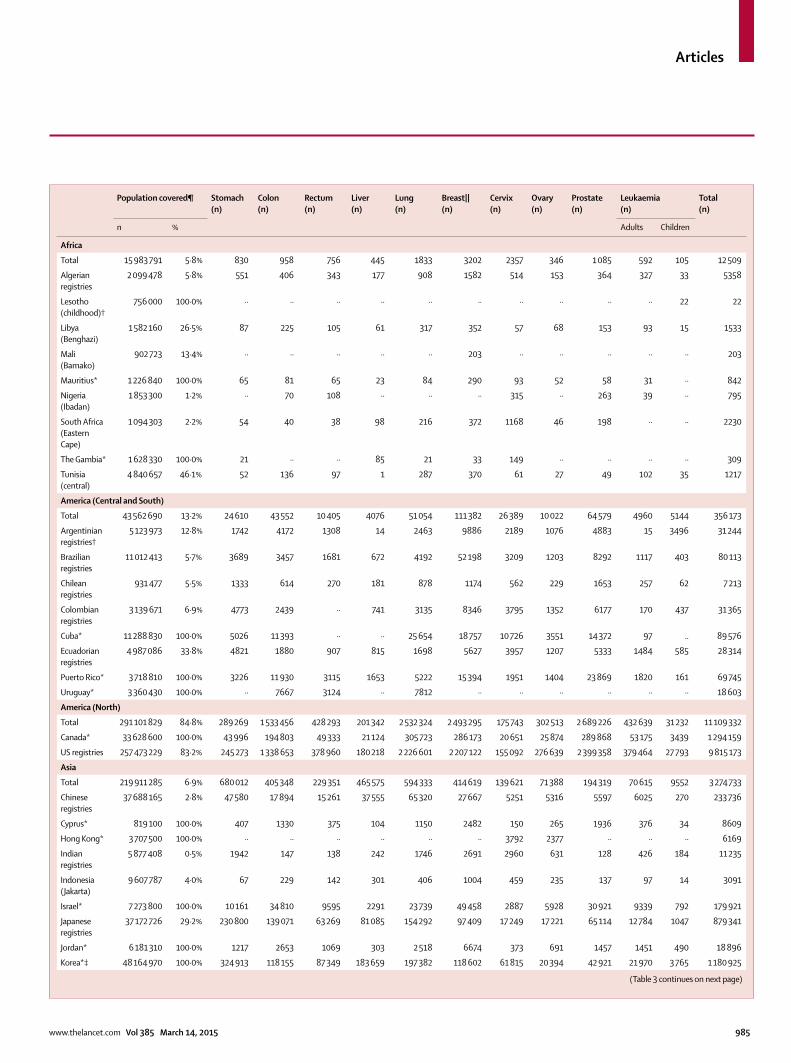
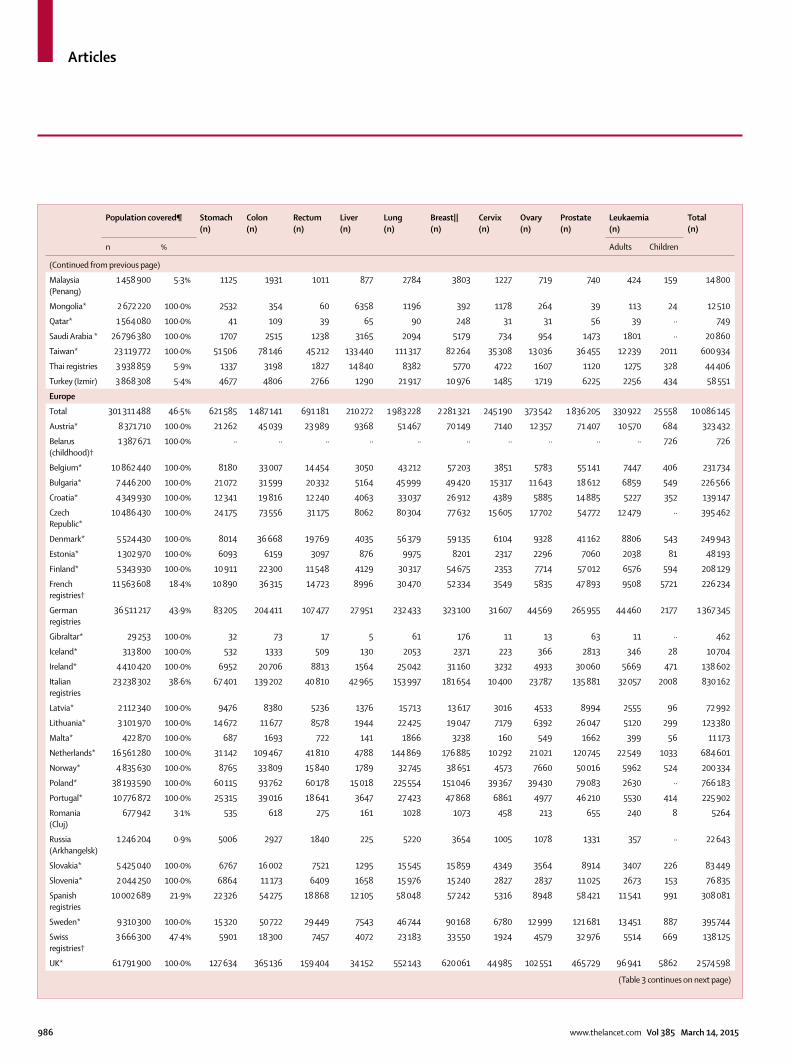
The 279 participating cancer registries represented an estimated total population of about 896 210 000 people in 2009, or 18·6% of the combined national popula-tions of the 67 countries (4·8 billion total population; table 3); details by registry are provided in the appendix
(pp 64–80). 100% coverage of the national population was provided by 40 countries. Population coverage in Australia was 91%, and in the USA it was 83%. In the remaining 25 countries, population coverage ranged from 0·5% to 47%. In China, 21 participating registries covered 37·7 million people (2·8% of 1·35 billion total population), whereas the four registries in India covered 5·9 million people (0·5% of 1·19 billion total population). China and India apart, data from 254 registries covered 37% of the combined population of 2·3 billion people in 65 countries.
Life expectancy at birth in 2009 varied widely between the 279 registry populations: for females, the range was 46–87 years and for males it was 45–81 years (appendix, p 175). Life expectancy rose slightly from 1995 to 2009
Calendar period
Patients submitted (n)
Ineligible patients¶ Eligible patients (n)
Exclusions|| Available for analysis (n)
Data quality indicators††
In situ (%)
Other (%)
DCO (%) Other (%) MV (%) Non-specifi c morphology (%)
Lost to follow-up (%)
Censored (%)
(Continued from previous page)
Finland* 1995–2009 235 156 6·5% 2·9% 213 137 2·3% <0·1% 208 129 96·1% 7·3% 0·1% 0·0%
French registries† 1995–2009 227 210 <0·1% 0·3% 226 622 <0·1% 0·2% 226 234 96·3% 2·6% 3·9% 4·1%
German registries 1995–2009 1 668 355 4·0% 1·2% 1 582 464 13·5% 0·1% 1 367 345 94·9% 1·0% 0·3% 0·1%
Gibraltar* 1999–2009 665 13·8% 15·8% 468 NA 1·3% 462 85·7% 0·9% 0·0% 2·2%
Iceland* 1995–2009 10 805 0·0% 0·8% 10 722 0·2% 0·0% 10 704 97·2% 2·8% 0·0% 0·0%
Ireland* 1995–2009 169 818 14·9% 1·4% 142 134 2·4% 0·1% 138 602 91·0% 1·1% 0·0% 0·0%
Italian registries 1995–2009 877 272 2·7% 0·5% 849 556 2·1% 0·2% 830 162 87·5% 12·5% 0·8% 1·0%
Latvia* 1995–2009 78 334 0·1% 0·2% 78 141 6·1% 0·5% 72 992 81·5% 0·5% 0·0% 0·0%
Lithuania* 1995–2009 132 425 2·8% 0·5% 127 999 3·6% 0·0% 123 380 84·9% 2·0% 1·0% 0·0%
Malta* 1995–2009 11 630 0·0% 0·9% 11 526 2·6% 0·5% 11 173 96·3% 7·9% 0·0% <0·1%
Netherlands* 1995–2009 716 617 2·9% 0·9% 688 714 0·3% 0·3% 684 601 97·0% 3·1% 0·5% 0·0%
Norway* 1995–2009 202 823 0·0% 0·4% 202 016 0·8% 0·0% 200 334 95·5% 4·7% 0·2% 0·0%
Poland* 1995–2009 813 485 1·2% 0·2% 802 179 4·1% 0·4% 766 183 79·6% 0·5% 0·1% 0·0%
Portugal* 1998–2009 240 114 2·8% 2·7% 226 878 0·2% 0·2% 225 902 95·9% 3·3% 0·1% 1·4%
Romania (Cluj) 2006–2009 6900 3·9% 0·7% 6583 18·0% 2·0% 5264 93·0% 0·8% 0·0% NA
Russia (Arkhangelsk) 2000–2009 23 609 0·0% <0·1% 23 602 3·3% 0·7% 22 643 82·4% 3·5% 1·1% 0·0%
Slovakia* 2000–2007 92 942 0·0% 0·3% 92 655 9·9% <0·1% 83 449 95·3% 5·5% 0·0% 0·0%
Slovenia* 1995–2009 95 466 14·8% 2·5% 78 973 2·7% <0·1% 76 835 94·5% 5·9% 0·1% 0·0%
Spanish registries 1995–2009 338 249 3·9% 2·4% 317 154 2·6% 0·3% 308 081 91·5% 5·4% 0·2% 0·8%
Sweden* 1995–2009 395 792 0·0% <0·1% 395 744 NA 0·0% 395 744 98·9% 2·1% 0·2% 0·0%
Swiss registries 1995–2009 151 879 6·9% 0·4% 140 737 1·7% 0·1% 138 125 95·2% 2·9% 3·2% 6·0%
UK* 1995–2009 3 174 024 14·5% 1·4% 2 668 512 3·5% 0·1% 2 574 598 83·3% 3·4% <0·1% 0·1%
Oceania 930 199 7·5% 0·6% 855 312 1·8% 0·2% 837 995 92·0% 4·2% 0·0% 4·1%
Australian registries 1995–2009 766 090 9·1% 0·7% 691 260 1·4% 0·2% 680 295 91·9% 3·4% 0·0% 5·0%
New Zealand* 1995–2009 164 109 0·0% <0·1% 164 052 3·3% 0·6% 157 700 92·6% 7·6% 0·0% 0·0%
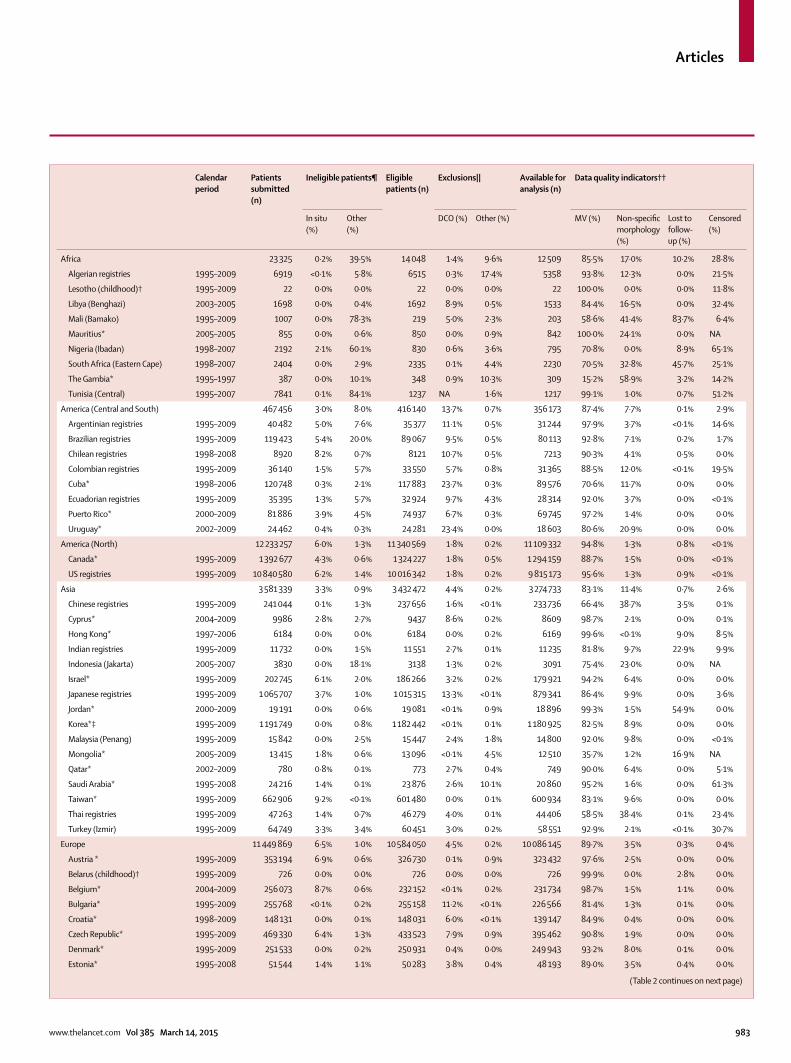
Total 28 685 445 5·9% 1·3% 26 642 591 3·4% 0·2% 25 676 887 91·1% 3·7% 0·6% 0·7%
NA=not available. *100% coverage of the national population. †100% coverage of the national population for childhood leukaemia only. ‡South Korea. ¶In situ malignant disease (ICD-O-3 behaviour code 2): some registries do not register in situ cancers, other registries did not submit them. Other: records with incomplete data; or tumours that are benign (behaviour code 0), of uncertain behaviour (1), metastatic from another organ (6), or unknown if primary or metastatic (9); or patients falling outside the age range 0–14 years (children) or 15–99 years (adults); or other conditions. ||DCO=tumours registered from a death certifi cate only or detected solely at autopsy. Other: vital status or sex unknown; or invalid sequence of dates; or inconsistency of sex-site, site-morphology, age-site, age-morphology, or age-site-morphology. †† MV=microscopically verifi ed. Non-specifi c morphology (solid tumours only): ICD-O-3 morphology code in the range 8000–8005. Censored: patients diagnosed during 1995–2004, with last known vital status “alive” but less than 5 years of follow-up.
Table 2: Data quality indicators for patients diagnosed during 1995–2009, by continent and country (all cancers combined)
Articles
www.thelancet.com Vol 385 March 14, 2015 985
Population covered¶ Stomach (n)
Colon (n)
Rectum (n)
Liver (n)
Lung (n)
Breast||(n)
Cervix (n)
Ovary (n)
Prostate (n)
Leukaemia(n)
Total(n)
n % Adults Children
Africa
Total 15 983 791 5·8% 830 958 756 445 1833 3202 2357 346 1 085 592 105 12 509
Algerian registries
2 099 478 5·8% 551 406 343 177 908 1582 514 153 364 327 33 5358
Lesotho (childhood)†
756 000 100·0% ·· ·· ·· ·· ·· ·· ·· ·· ·· ·· 22 22
Libya (Benghazi)
1 582 160 26·5% 87 225 105 61 317 352 57 68 153 93 15 1533
Mali (Bamako)
902 723 13·4% ·· ·· ·· ·· ·· 203 ·· ·· ·· ·· ·· 203
Mauritius* 1 226 840 100·0% 65 81 65 23 84 290 93 52 58 31 ·· 842
Nigeria (Ibadan)
1 853 300 1·2% ·· 70 108 ·· ·· ·· 315 ·· 263 39 ·· 795
South Africa (Eastern Cape)
1 094 303 2·2% 54 40 38 98 216 372 1168 46 198 ·· ·· 2230
The Gambia* 1 628 330 100·0% 21 ·· ·· 85 21 33 149 ·· ·· ·· ·· 309
Tunisia (central)
4 840 657 46·1% 52 136 97 1 287 370 61 27 49 102 35 1217
America (Central and South)
Total 43 562 690 13·2% 24 610 43 552 10 405 4076 51 054 111 382 26 389 10 022 64 579 4960 5144 356 173
Argentinian registries†
5 123 973 12·8% 1742 4172 1308 14 2463 9886 2189 1076 4883 15 3496 31 244
Brazilian registries
11 012 413 5·7% 3689 3457 1681 672 4192 52 198 3209 1203 8292 1117 403 80 113
Chilean registries
931 477 5·5% 1333 614 270 181 878 1174 562 229 1653 257 62 7 213
Colombian registries
3 139 671 6·9% 4773 2439 ·· 741 3135 8346 3795 1352 6177 170 437 31 365
Cuba* 11 288 830 100·0% 5026 11 393 ·· ·· 25 654 18 757 10 726 3551 14 372 97 .. 89 576
Ecuadorian registries
4 987 086 33·8% 4821 1880 907 815 1698 5627 3957 1207 5333 1484 585 28 314
Puerto Rico* 3 718 810 100·0% 3226 11 930 3115 1653 5222 15 394 1951 1404 23 869 1820 161 69 745
Uruguay* 3 360 430 100·0% ·· 7667 3124 ·· 7812 ·· ·· ·· ·· ·· ·· 18 603
America (North)
Total 291 101 829 84·8% 289 269 1 533 456 428 293 201 342 2 532 324 2 493 295 175 743 302 513 2 689 226 432 639 31 232 11 109 332
Canada* 33 628 600 100·0% 43 996 194 803 49 333 21 124 305 723 286 173 20 651 25 874 289 868 53 175 3439 1 294 159
US registries 257 473 229 83·2% 245 273 1 338 653 378 960 180 218 2 226 601 2 207 122 155 092 276 639 2 399 358 379 464 27 793 9 815 173
Asia
Total 219 911 285 6·9% 680 012 405 348 229 351 465 575 594 333 414 619 139 621 71 388 194 319 70 615 9552 3 274 733
Chinese registries
37 688 165 2·8% 47 580 17 894 15 261 37 555 65 320 27 667 5251 5316 5597 6025 270 233 736
Cyprus* 819 100 100·0% 407 1330 375 104 1150 2482 150 265 1936 376 34 8609
Hong Kong* 3 707 500 100·0% ·· ·· ·· ·· ·· ·· 3792 2377 ·· ·· ·· 6169
Indian registries
5 877 408 0·5% 1942 147 138 242 1746 2691 2960 631 128 426 184 11 235
Indonesia (Jakarta)
9 607 787 4·0% 67 229 142 301 406 1004 459 235 137 97 14 3091
Israel* 7 273 800 100·0% 10 161 34 810 9595 2291 23 739 49 458 2887 5928 30 921 9339 792 179 921
Japanese registries
37 172 726 29·2% 230 800 139 071 63 269 81 085 154 292 97 409 17 249 17 221 65 114 12 784 1047 879 341
Jordan* 6 181 310 100·0% 1217 2653 1069 303 2 518 6674 373 691 1457 1451 490 18 896
Korea*‡ 48 164 970 100·0% 324 913 118 155 87 349 183 659 197 382 118 602 61 815 20 394 42 921 21 970 3 765 1 180 925
(Table 3 continues on next page)
Articles
986 www.thelancet.com Vol 385 March 14, 2015
Population covered¶ Stomach (n)
Colon (n)
Rectum (n)
Liver (n)
Lung (n)
Breast|| (n)
Cervix (n)
Ovary (n)
Prostate (n)
Leukaemia(n)
Total(n)
n % Adults Children
(Continued from previous page)
Malaysia (Penang)
1 458 900 5·3% 1125 1931 1011 877 2784 3803 1227 719 740 424 159 14 800
Mongolia* 2 672 220 100·0% 2532 354 60 6358 1196 392 1178 264 39 113 24 12 510
Qatar* 1 564 080 100·0% 41 109 39 65 90 248 31 31 56 39 ·· 749
Saudi Arabia * 26 796 380 100·0% 1707 2515 1238 3165 2094 5179 734 954 1473 1801 ·· 20 860
Taiwan* 23 119 772 100·0% 51 506 78 146 45 212 133 440 111 317 82 264 35 308 13 036 36 455 12 239 2011 600 934
Thai registries 3 938 859 5·9% 1337 3198 1827 14 840 8382 5770 4722 1607 1120 1275 328 44 406
Turkey (Izmir) 3 868 308 5·4% 4677 4806 2766 1290 21 917 10 976 1485 1719 6225 2256 434 58 551
Europe
Total 301 311 488 46·5% 621 585 1 487 141 691 181 210 272 1 983 228 2 281 321 245 190 373 542 1 836 205 330 922 25 558 10 086 145
Austria* 8 371 710 100·0% 21 262 45 039 23 989 9368 51 467 70 149 7140 12 357 71 407 10 570 684 323 432
Belarus (childhood)†
1 387 671 100·0% ·· ·· ·· ·· ·· ·· ·· ·· ·· ·· 726 726
Belgium* 10 862 440 100·0% 8180 33 007 14 454 3050 43 212 57 203 3851 5783 55 141 7447 406 231 734
Bulgaria* 7 446 200 100·0% 21 072 31 599 20 332 5164 45 999 49 420 15 317 11 643 18 612 6859 549 226 566
Croatia* 4 349 930 100·0% 12 341 19 816 12 240 4063 33 037 26 912 4389 5885 14 885 5227 352 139 147
Czech Republic*
10 486 430 100·0% 24 175 73 556 31 175 8062 80 304 77 632 15 605 17 702 54 772 12 479 ·· 395 462
Denmark* 5 524 430 100·0% 8014 36 668 19 769 4035 56 379 59 135 6104 9328 41 162 8806 543 249 943
Estonia* 1 302 970 100·0% 6093 6159 3097 876 9975 8201 2317 2296 7060 2038 81 48 193
Finland* 5 343 930 100·0% 10 911 22 300 11 548 4129 30 317 54 675 2353 7714 57 012 6576 594 208 129
French registries†
11 563 608 18·4% 10 890 36 315 14 723 8996 30 470 52 334 3549 5835 47 893 9508 5721 226 234
German registries
36 511 217 43·9% 83 205 204 411 107 477 27 951 232 433 323 100 31 607 44 569 265 955 44 460 2177 1 367 345
Gibraltar* 29 253 100·0% 32 73 17 5 61 176 11 13 63 11 ·· 462
Iceland* 313 800 100·0% 532 1333 509 130 2053 2371 223 366 2813 346 28 10 704
Ireland* 4 410 420 100·0% 6952 20 706 8813 1564 25 042 31 160 3232 4933 30 060 5669 471 138 602
Italian registries
23 238 302 38·6% 67 401 139 202 40 810 42 965 153 997 181 654 10 400 23 787 135 881 32 057 2008 830 162
Latvia* 2 112 340 100·0% 9476 8380 5236 1376 15 713 13 617 3016 4533 8994 2555 96 72 992
Lithuania* 3 101 970 100·0% 14 672 11 677 8578 1944 22 425 19 047 7179 6392 26 047 5120 299 123 380
Malta* 422 870 100·0% 687 1693 722 141 1866 3238 160 549 1662 399 56 11 173
Netherlands* 16 561 280 100·0% 31 142 109 467 41 810 4788 144 869 176 885 10 292 21 021 120 745 22 549 1033 684 601
Norway* 4 835 630 100·0% 8765 33 809 15 840 1789 32 745 38 651 4573 7660 50 016 5962 524 200 334
Poland* 38 193 590 100·0% 60 115 93 762 60 178 15 018 225 554 151 046 39 367 39 430 79 083 2630 ·· 766 183
Portugal* 10 776 872 100·0% 25 315 39 016 18 641 3647 27 423 47 868 6861 4977 46 210 5530 414 225 902
Romania (Cluj)
677 942 3·1% 535 618 275 161 1028 1073 458 213 655 240 8 5264
Russia
(Arkhangelsk)1 246 204 0·9% 5006 2927 1840 225 5220 3654 1005 1078 1331 357 ·· 22 643
Slovakia* 5 425 040 100·0% 6767 16 002 7521 1295 15 545 15 859 4349 3564 8914 3407 226 83 449
Slovenia* 2 044 250 100·0% 6864 11 173 6409 1658 15 976 15 240 2827 2837 11 025 2673 153 76 835
Spanish registries
10 002 689 21·9% 22 326 54 275 18 868 12 105 58 048 57 242 5316 8948 58 421 11 541 991 308 081
Sweden* 9 310 300 100·0% 15 320 50 722 29 449 7543 46 744 90 168 6780 12 999 121 681 13 451 887 395 744
Swiss registries†
3 666 300 47·4% 5901 18 300 7457 4072 23 183 33 550 1924 4579 32 976 5514 669 138 125
UK* 61 791 900 100·0% 127 634 365 136 159 404 34 152 552 143 620 061 44 985 102 551 465 729 96 941 5862 2 574 598
(Table 3 continues on next page)
Articles
www.thelancet.com Vol 385 March 14, 2015 987
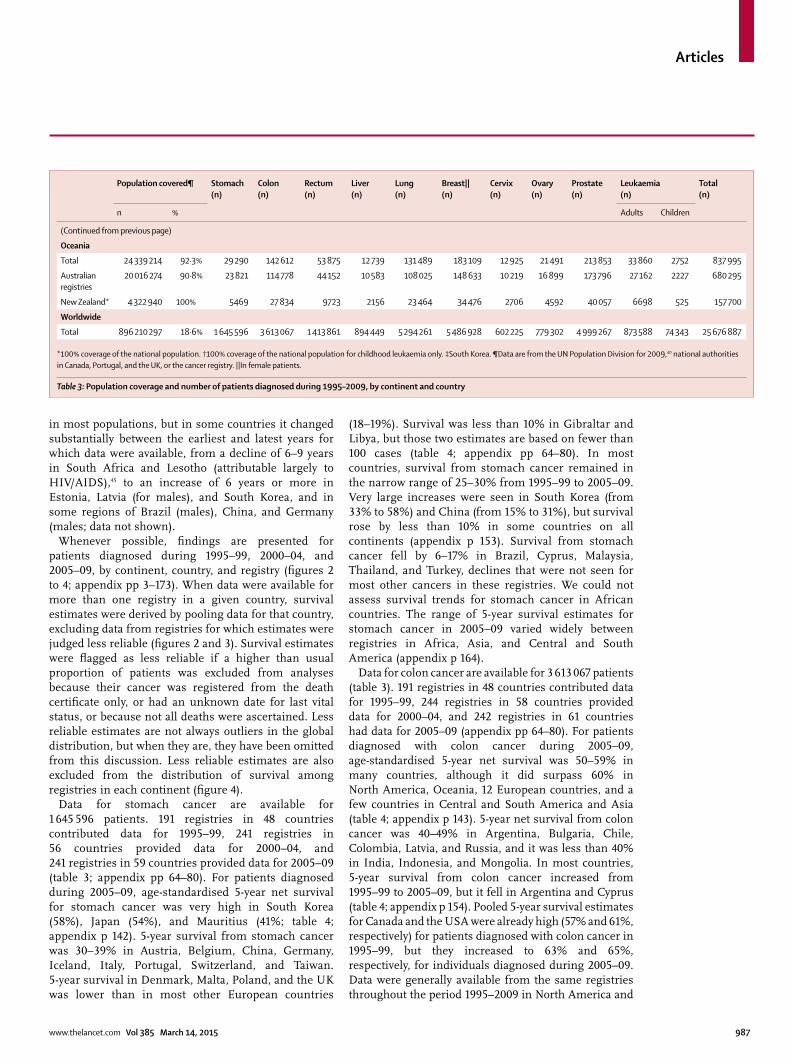
in most populations, but in some countries it changed substantially between the earliest and latest years for which data were available, from a decline of 6–9 years in South Africa and Lesotho (attributable largely to HIV/AIDS),45 to an increase of 6 years or more in Estonia, Latvia (for males), and South Korea, and in some regions of Brazil (males), China, and Germany (males; data not shown).
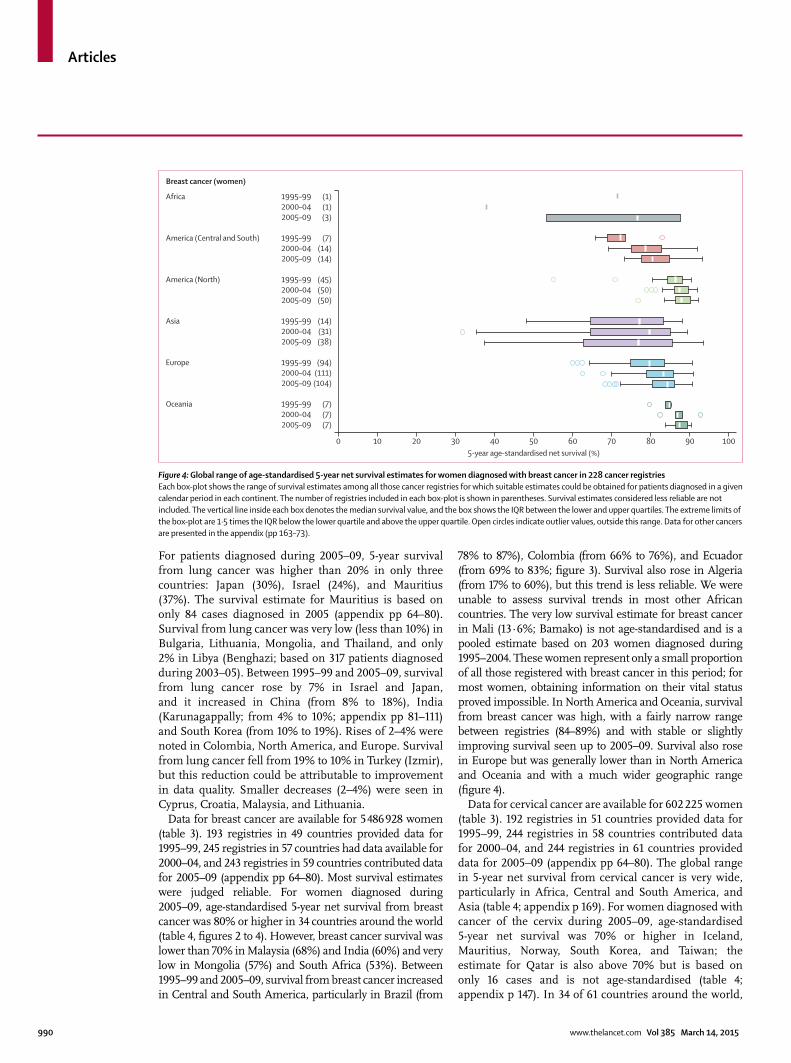
Whenever possible, fi ndings are presented for patients diagnosed during 1995–99, 2000–04, and 2005–09, by continent, country, and registry (fi gures 2 to 4; appendix pp 3–173). When data were available for more than one registry in a given country, survival estimates were derived by pooling data for that country, excluding data from registries for which estimates were judged less reliable (fi gures 2 and 3). Survival estimates were fl agged as less reliable if a higher than usual proportion of patients was excluded from analyses because their cancer was registered from the death certifi cate only, or had an unknown date for last vital status, or because not all deaths were ascertained. Less reliable estimates are not always outliers in the global distribution, but when they are, they have been omitted from this discussion. Less reliable estimates are also excluded from the distribution of survival among registries in each continent (fi gure 4).
Data for stomach cancer are available for 1 645 596 patients. 191 registries in 48 countries contributed data for 1995–99, 241 registries in 56 countries provided data for 2000–04, and 241 registries in 59 countries provided data for 2005–09 (table 3; appendix pp 64–80). For patients diagnosed during 2005–09, age-standardised 5-year net survival for stomach cancer was very high in South Korea (58%), Japan (54%), and Mauritius (41%; table 4; appendix p 142). 5-year survival from stomach cancer was 30–39% in Austria, Belgium, China, Germany, Iceland, Italy, Portugal, Switzerland, and Taiwan. 5-year survival in Denmark, Malta, Poland, and the UK was lower than in most other European countries
(18–19%). Survival was less than 10% in Gibraltar and Libya, but those two estimates are based on fewer than 100 cases (table 4; appendix pp 64–80). In most countries, survival from stomach cancer remained in the narrow range of 25–30% from 1995–99 to 2005–09. Very large increases were seen in South Korea (from 33% to 58%) and China (from 15% to 31%), but survival rose by less than 10% in some countries on all continents (appendix p 153). Survival from stomach cancer fell by 6–17% in Brazil, Cyprus, Malaysia, Thailand, and Turkey, declines that were not seen for most other cancers in these registries. We could not assess survival trends for stomach cancer in African countries. The range of 5-year survival estimates for stomach cancer in 2005–09 varied widely between registries in Africa, Asia, and Central and South America (appendix p 164).
Data for colon cancer are available for 3 613 067 patients (table 3). 191 registries in 48 countries contributed data for 1995–99, 244 registries in 58 countries provided data for 2000–04, and 242 registries in 61 countries had data for 2005–09 (appendix pp 64–80). For patients diagnosed with colon cancer during 2005–09, age-standardised 5-year net survival was 50–59% in many countries, although it did surpass 60% in North America, Oceania, 12 European countries, and a few countries in Central and South America and Asia (table 4; appendix p 143). 5-year net survival from colon cancer was 40–49% in Argentina, Bulgaria, Chile, Colombia, Latvia, and Russia, and it was less than 40% in India, Indonesia, and Mongolia. In most countries, 5-year survival from colon cancer increased from 1995–99 to 2005–09, but it fell in Argentina and Cyprus (table 4; appendix p 154). Pooled 5-year survival estimates for Canada and the USA were already high (57% and 61%, respectively) for patients diagnosed with colon cancer in 1995–99, but they increased to 63% and 65%, respectively, for individuals diagnosed during 2005–09. Data were generally available from the same registries throughout the period 1995–2009 in North America and
Population covered¶ Stomach (n)
Colon (n)
Rectum (n)
Liver (n)
Lung (n)
Breast|| (n)
Cervix (n)
Ovary (n)
Prostate (n)
Leukaemia(n)
Total(n)
n % Adults Children
(Continued from previous page)
Oceania
Total 24 339 214 92·3% 29 290 142 612 53 875 12 739 131 489 183 109 12 925 21 491 213 853 33 860 2752 837 995
Australian registries
20 016 274 90·8% 23 821 114 778 44 152 10 583 108 025 148 633 10 219 16 899 173 796 27 162 2227 680 295
New Zealand* 4 322 940 100% 5469 27 834 9723 2156 23 464 34 476 2706 4592 40 057 6698 525 157 700
Worldwide
Total 896 210 297 18·6% 1 645 596 3 613 067 1 413 861 894 449 5 294 261 5 486 928 602 225 779 302 4 999 267 873 588 74 343 25 676 887
*100% coverage of the national population. †100% coverage of the national population for childhood leukaemia only. ‡South Korea. ¶Data are from the UN Population Division for 2009,40 national authorities in Canada, Portugal, and the UK, or the cancer registry. ||In female patients.
Table 3: Population coverage and number of patients diagnosed during 1995–2009, by continent and country
Articles
988 www.thelancet.com Vol 385 March 14, 2015
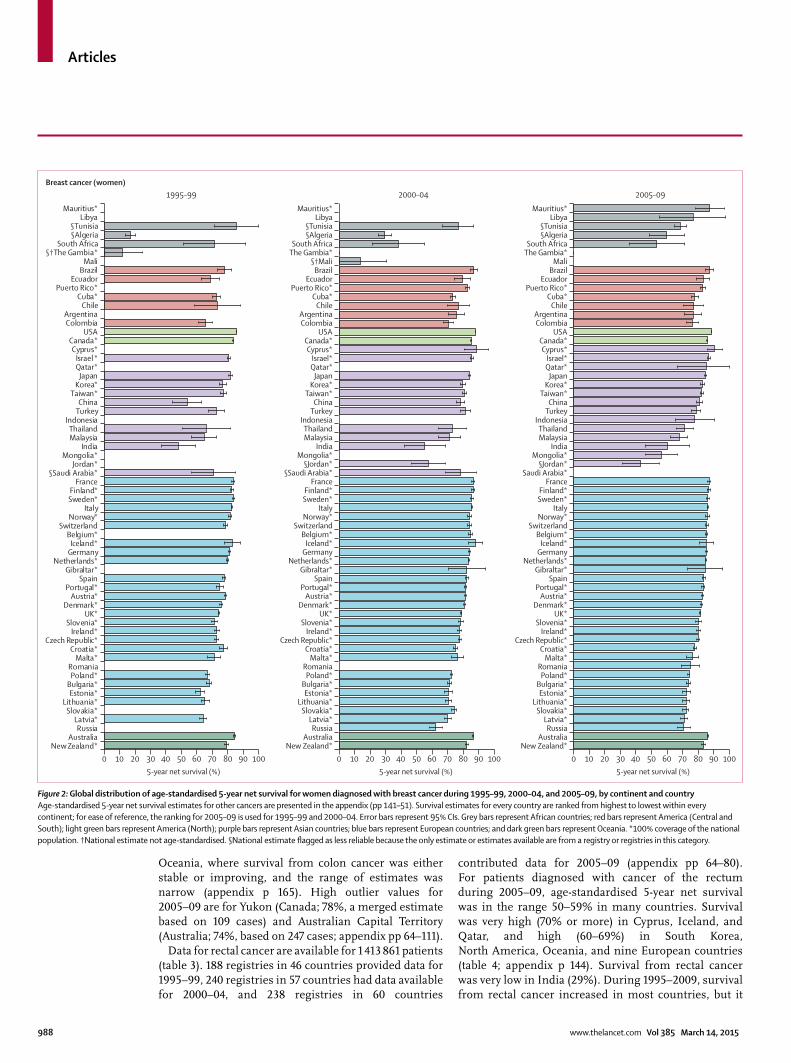
Oceania, where survival from colon cancer was either stable or improving, and the range of estimates was narrow (appendix p 165). High outlier values for 2005–09 are for Yukon (Canada; 78%, a merged estimate based on 109 cases) and Australian Capital Territory (Australia; 74%, based on 247 cases; appendix pp 64–111).
Data for rectal cancer are available for 1 413 861 patients (table 3). 188 registries in 46 countries provided data for 1995–99, 240 registries in 57 countries had data available for 2000–04, and 238 registries in 60 countries
contributed data for 2005–09 (appendix pp 64–80). For patients diagnosed with cancer of the rectum during 2005–09, age-standardised 5-year net survival was in the range 50–59% in many countries. Survival was very high (70% or more) in Cyprus, Iceland, and Qatar, and high (60–69%) in South Korea, North America, Oceania, and nine European countries (table 4; appendix p 144). Survival from rectal cancer was very low in India (29%). During 1995–2009, survival from rectal cancer increased in most countries, but it
0 10 20 30 40 50 60 70 80 90 100
1995–99Breast cancer (women)
5-year net survival (%)0 10 20 30 40 50 60 70 80 90 100
2000–04
5-year net survival (%)
New Zealand*Australia
RussiaLatvia*
Slovakia*Lithuania*
Estonia*Bulgaria*
Poland*Romania
Malta*Croatia*
Czech Republic*Ireland*
Slovenia*UK*
Denmark*Austria*
Portugal*Spain
Gibraltar*Netherlands*
GermanyIceland*
Belgium*Switzerland
Norway*Italy
Sweden*Finland*
France§Saudi Arabia*
§Jordan*Mongolia*
IndiaMalaysiaThailand
IndonesiaTurkeyChina
Taiwan*Korea*
JapanQatar*Israel*
Cyprus*Canada*
USAColombiaArgentina
ChileCuba*
Puerto Rico*Ecuador
Brazil§†Mali
The Gambia*South Africa
§Algeria§Tunisia
LibyaMauritius*
0 10 20 30 40 50 60 70 80 90 100
2005–09
5-year net survival (%)
New Zealand*Australia
RussiaLatvia*
Slovakia*Lithuania*
Estonia*Bulgaria*
Poland*Romania
Malta*Croatia*
Czech Republic*Ireland*
Slovenia*UK*
Denmark*Austria*
Portugal*Spain
Gibraltar*Netherlands*
GermanyIceland*
Belgium*Switzerland
Norway*Italy
Sweden*Finland*
FranceSaudi Arabia*
§Jordan*Mongolia*
IndiaMalaysiaThailand
IndonesiaTurkeyChina
Taiwan*Korea*
JapanQatar*Israel*
Cyprus*Canada*
USAColombiaArgentina
ChileCuba*
Puerto Rico*Ecuador
BrazilMali
The Gambia*South Africa
§Algeria§Tunisia
LibyaMauritius*
New Zealand*Australia
RussiaLatvia*
Slovakia*Lithuania*
Estonia*Bulgaria*
Poland*Romania
Malta*Croatia*
Czech Republic*Ireland*
Slovenia*UK*
Denmark*Austria*
Portugal*Spain
Gibraltar*Netherlands*
GermanyIceland*
Belgium*Switzerland
Norway*Italy
Sweden*Finland*
France§Saudi Arabia*
Jordan*Mongolia*
IndiaMalaysiaThailand
IndonesiaTurkeyChina
Taiwan*Korea*
JapanQatar*Israel *
Cyprus*Canada*
USAColombia
ArgentinaChile
Cuba*Puerto Rico*
EcuadorBrazil
Mali§†The Gambia*
South Africa§Algeria§Tunisia
LibyaMauritius*
Figure 2: Global distribution of age-standardised 5-year net survival for women diagnosed with breast cancer during 1995–99, 2000–04, and 2005–09, by continent and countryAge-standardised 5-year net survival estimates for other cancers are presented in the appendix (pp 141–51). Survival estimates for every country are ranked from highest to lowest within every continent; for ease of reference, the ranking for 2005–09 is used for 1995–99 and 2000–04. Error bars represent 95% CIs. Grey bars represent African countries; red bars represent America (Central and South); light green bars represent America (North); purple bars represent Asian countries; blue bars represent European countries; and dark green bars represent Oceania. *100% coverage of the national population. †National estimate not age-standardised. §National estimate fl agged as less reliable because the only estimate or estimates available are from a registry or registries in this category.
Articles
www.thelancet.com Vol 385 March 14, 2015 989
was stable or even falling in Argentina, Brazil, Chile, India (Karunagappally), Malaysia, and Uruguay (appendix p 155).
Data for liver cancer are available for 894 449 patients (table 3). 189 registries in 46 countries contributed data for 1995–99, 236 registries in 54 countries provided data for 2000–04, and 236 registries in 57 countries had data available for 2005–09 (appendix pp 64–80). However, international comparisons are more limited for liver cancer than for other malignant diseases because estimates from 20 countries were fl agged as less reliable, mainly because of a high proportion of cancer registrations from a death certifi cate only (appendix pp 24–28). Age-standardised 5-year net survival from liver cancer was generally low (10–20%) in most countries, both in the developed and developing world, throughout the period 1995–2009 (table 4; appendix p 145). Survival only reached 20% or more for patients diagnosed during 2005–09 in some east Asian countries (Japan, South Korea, and Taiwan), where a steady rise in survival from liver cancer has been seen since 1995–99. Even for 2005–09, survival was still very low (less than 10%) in Colombia, Denmark,
Estonia, Finland, India, Malta, Mongolia, Norway, Russia, Slovenia, Thailand, and the UK. Estimates judged less reliable were mostly very similar to those that were robust. 5-year survival from liver cancer increased between 1995–99 and 2005–09 in the two countries in North America, four countries in Asia, and 13 European countries. Survival declined in Thailand from 16% to 8% (based on 14 800 cases). The high survival estimate for Mauritius (53%) is a national fi gure, but it is based on only 23 cases and is not age-standardised.
Data for lung cancer are available for 5 294 261 patients (table 3). 190 registries in 48 countries provided data for 1995–99, 240 registries in 57 countries contributed data for 2000–04, and 240 registries in 60 countries had data available for 2005–09 (appendix pp 64–80). Age-standardised 5-year net survival from lung cancer was typically low, in the range 10–20% for most geographical areas, both in the developed and developing world (table 4, appendix pp 146 and 168). The general pattern is very similar to that of liver cancer. International variation in survival is less striking than for cancers with good prognosis, but diff erences are still noticeable.
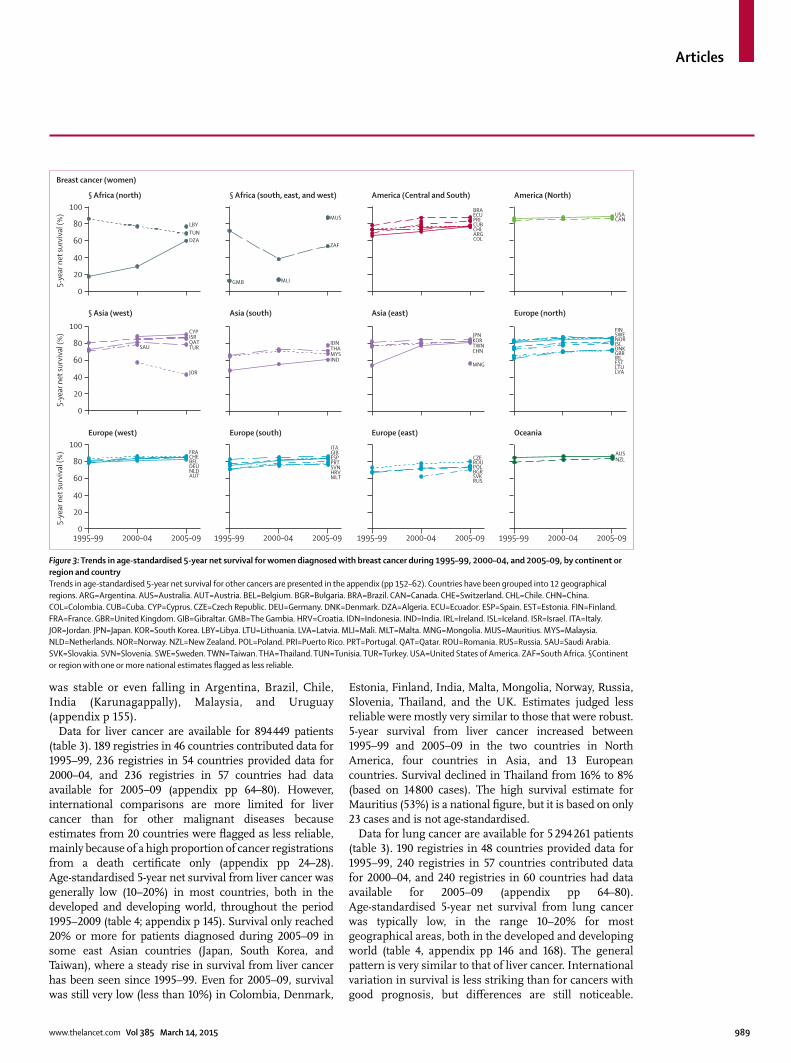
Figure 3: Trends in age-standardised 5-year net survival for women diagnosed with breast cancer during 1995–99, 2000–04, and 2005–09, by continent or region and countryTrends in age-standardised 5-year net survival for other cancers are presented in the appendix (pp 152–62). Countries have been grouped into 12 geographical regions. ARG=Argentina. AUS=Australia. AUT=Austria. BEL=Belgium. BGR=Bulgaria. BRA=Brazil. CAN=Canada. CHE=Switzerland. CHL=Chile. CHN=China. COL=Colombia. CUB=Cuba. CYP=Cyprus. CZE=Czech Republic. DEU=Germany. DNK=Denmark. DZA=Algeria. ECU=Ecuador. ESP=Spain. EST=Estonia. FIN=Finland. FRA=France. GBR=United Kingdom. GIB=Gibraltar. GMB=The Gambia. HRV=Croatia. IDN=Indonesia. IND=India. IRL=Ireland. ISL=Iceland. ISR=Israel. ITA=Italy. JOR=Jordan. JPN=Japan. KOR=South Korea. LBY=Libya. LTU=Lithuania. LVA=Latvia. MLI=Mali. MLT=Malta. MNG=Mongolia. MUS=Mauritius. MYS=Malaysia. NLD=Netherlands. NOR=Norway. NZL=New Zealand. POL=Poland. PRI=Puerto Rico. PRT=Portugal. QAT=Qatar. ROU=Romania. RUS=Russia. SAU=Saudi Arabia. SVK=Slovakia. SVN=Slovenia. SWE=Sweden. TWN=Taiwan. THA=Thailand. TUN=Tunisia. TUR=Turkey. USA=United States of America. ZAF=South Africa. §Continent or region with one or more national estimates fl agged as less reliable.
0
20
40
60
80
100
5-ye
ar n
et su
rviv
al (%
)
MLI
MUS
GMB
0
20
40
60
80
100
5-ye
ar n
et su
rviv
al (%
)
1995–99 2000–04 2005–090
20
40
60
80
100
5-ye
ar n
et su
rviv
al (%
)
1995–99 2000–04 2005–09 1995–99 2000–04 2005–09 1995–99 2000–04 2005–09
§ Africa (north)
Breast cancer (women)
§ Africa (south, east, and west) America (Central and South) America (North)
§ Asia (west) Asia (south) Asia (east) Europe (north)
Europe (west) Europe (south) Europe (east) Oceania
DZA
LBYTUN
ZAF
ARG
BRA
CHLCUB
COL
ECUPRI CAN
USA
IND
IDN
MYSTHA
AUT
BEL
FRA
DEUNLD
CHE
BGR
CZE
POLROU
RUSSVK
NZLAUS
CHN
JPN
MNG
TWNKOR
CYPISR
JOR
QATTURSAU
PRTESPGIBITA
MLTHRVSVN
NOR
DNK
SWEFIN
IRL
LVALTU
GBR
ISL
EST
Articles
990 www.thelancet.com Vol 385 March 14, 2015
For patients diagnosed during 2005–09, 5-year survival from lung cancer was higher than 20% in only three countries: Japan (30%), Israel (24%), and Mauritius (37%). The survival estimate for Mauritius is based on only 84 cases diagnosed in 2005 (appendix pp 64–80). Survival from lung cancer was very low (less than 10%) in Bulgaria, Lithuania, Mongolia, and Thailand, and only 2% in Libya (Benghazi; based on 317 patients diagnosed during 2003–05). Between 1995–99 and 2005–09, survival from lung cancer rose by 7% in Israel and Japan, and it increased in China (from 8% to 18%), India (Karunagappally; from 4% to 10%; appendix pp 81–111) and South Korea (from 10% to 19%). Rises of 2–4% were noted in Colombia, North America, and Europe. Survival from lung cancer fell from 19% to 10% in Turkey (Izmir), but this reduction could be attributable to improvement in data quality. Smaller decreases (2–4%) were seen in Cyprus, Croatia, Malaysia, and Lithuania.
Data for breast cancer are available for 5 486 928 women (table 3). 193 registries in 49 countries provided data for 1995–99, 245 registries in 57 countries had data available for 2000–04, and 243 registries in 59 countries contributed data for 2005–09 (appendix pp 64–80). Most survival estimates were judged reliable. For women diagnosed during 2005–09, age-standardised 5-year net survival from breast cancer was 80% or higher in 34 countries around the world (table 4, fi gures 2 to 4). However, breast cancer survival was lower than 70% in Malaysia (68%) and India (60%) and very low in Mongolia (57%) and South Africa (53%). Between 1995–99 and 2005–09, survival from breast cancer increased in Central and South America, particularly in Brazil (from
78% to 87%), Colombia (from 66% to 76%), and Ecuador (from 69% to 83%; fi gure 3). Survival also rose in Algeria (from 17% to 60%), but this trend is less reliable. We were unable to assess survival trends in most other African countries. The very low survival estimate for breast cancer in Mali (13·6%; Bamako) is not age-standardised and is a pooled estimate based on 203 women diagnosed during 1995–2004. These women represent only a small proportion of all those registered with breast cancer in this period; for most women, obtaining information on their vital status proved impossible. In North America and Oceania, survival from breast cancer was high, with a fairly narrow range between registries (84–89%) and with stable or slightly improving survival seen up to 2005–09. Survival also rose in Europe but was generally lower than in North America and Oceania and with a much wider geographic range (fi gure 4).
Data for cervical cancer are available for 602 225 women (table 3). 192 registries in 51 countries provided data for 1995–99, 244 registries in 58 countries contributed data for 2000–04, and 244 registries in 61 countries provided data for 2005–09 (appendix pp 64–80). The global range in 5-year net survival from cervical cancer is very wide, particularly in Africa, Central and South America, and Asia (table 4; appendix p 169). For women diagnosed with cancer of the cervix during 2005–09, age-standardised 5-year net survival was 70% or higher in Iceland, Mauritius, Norway, South Korea, and Taiwan; the estimate for Qatar is also above 70% but is based on only 16 cases and is not age-standardised (table 4; appendix p 147). In 34 of 61 countries around the world,
Figure 4: Global range of age-standardised 5-year net survival estimates for women diagnosed with breast cancer in 228 cancer registriesEach box-plot shows the range of survival estimates among all those cancer registries for which suitable estimates could be obtained for patients diagnosed in a given calendar period in each continent. The number of registries included in each box-plot is shown in parentheses. Survival estimates considered less reliable are not included. The vertical line inside each box denotes the median survival value, and the box shows the IQR between the lower and upper quartiles. The extreme limits of the box-plot are 1·5 times the IQR below the lower quartile and above the upper quartile. Open circles indicate outlier values, outside this range. Data for other cancers are presented in the appendix (pp 163–73).
Africa 1995–99 (1) 2000–04 (1) 2005–09 (3)
America (Central and South) 1995–99 (7) 2000–04 (14) 2005–09 (14) America (North) 1995–99 (45) 2000–04 (50) 2005–09 (50)
Asia 1995–99 (14) 2000–04 (31) 2005–09 (38)
Europe 1995–99 (94) 2000–04 (111) 2005–09 (104)
Oceania 1995–99 (7) 2000–04 (7) 2005–09 (7)
0 10 20 30 40 50 60 70 80 90 1005-year age-standardised net survival (%)
Breast cancer (women)
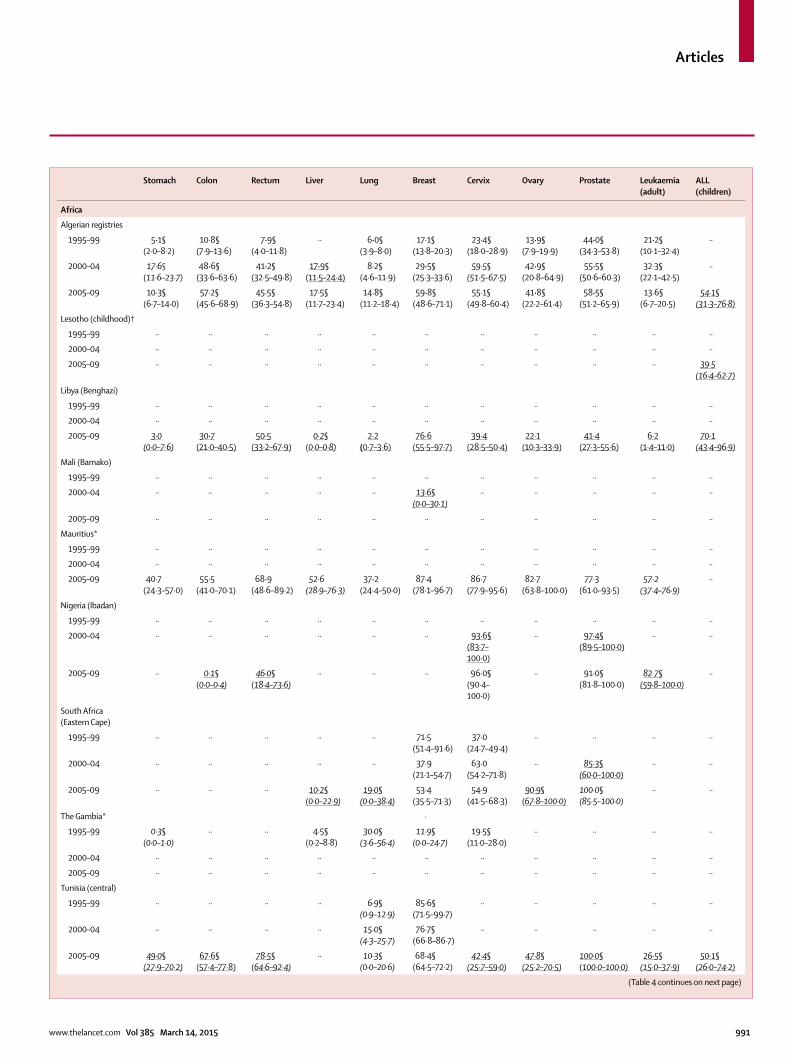
Articles
www.thelancet.com Vol 385 March 14, 2015 991
Stomach Colon Rectum Liver Lung Breast Cervix Ovary Prostate Leukaemia(adult)
ALL (children)
Africa
Algerian registries
1995–99 5·1§(2·0–8·2)
10·8§(7·9–13·6)
7·9§(4·0–11·8)
·· 6·0§(3·9–8·0)
17·1§(13·8–20·3)
23·4§(18·0–28·9)
13·9§(7·9–19·9)
44·0§(34·3–53·8)
21·2§(10·1–32·4)
··
2000–04 17·6§(11·6–23·7)
48·6§(33·6–63·6)
41·2§(32·5–49·8)
17·9§(11·5–24·4)
8·2§(4·6–11·9)
29·5§(25·3–33·6)
59·5§(51·5–67·5)
42·9§(20·8–64·9)
55·5§(50·6–60·3)
32·3§(22·1–42·5)
··
2005–09 10·3§(6·7–14·0)
57·2§(45·6–68·9)
45·5§(36·3–54·8)
17·5§(11·7–23·4)
14·8§(11·2–18·4)
59·8§(48·6–71·1)
55·1§(49·8–60·4)
41·8§(22·2–61·4)
58·5§(51·2–65·9)
13·6§(6·7–20·5)
54·1§(31·3–76·8)
Lesotho (childhood)†
1995–99 ·· ·· ·· ·· ·· ·· ·· ·· ·· ·· ··
2000–04 ·· ·· ·· ·· ·· ·· ·· ·· ·· ·· ··
2005–09 ·· ·· ·· ·· ·· ·· ·· ·· ·· ·· 39·5(16·4–62·7)
Libya (Benghazi)
1995–99 ·· ·· ·· ·· ·· ·· ·· ·· ·· ·· ··
2000–04 ·· ·· ·· ·· ·· ·· ·· ·· ·· ·· ··
2005–09 3·0(0·0–7·6)
30·7(21·0–40·5)
50·5(33·2–67·9)
0·2§(0·0–0·8)
2·2(0·7–3·6)
76·6(55·5–97·7)
39·4(28·5–50·4)
22·1(10·3–33·9)
41·4(27·3–55·6)
6·2(1·4–11·0)
70·1(43·4–96·9)
Mali (Bamako)
1995–99 ·· ·· ·· ·· ·· ·· ·· ·· ·· ·· ··
2000–04 ·· ·· ·· ·· ·· 13·6§(0·0–30·1)
·· ·· ·· ·· ··
2005–09 ·· ·· ·· ·· ·· ·· ·· ·· ·· ·· ··
Mauritius*
1995–99 ·· ·· ·· ·· ·· ·· ·· ·· ·· ·· ··
2000–04 ·· ·· ·· ·· ·· ·· ·· ·· ·· ·· ··
2005–09 40·7(24·3–57·0)
55·5(41·0–70·1)
68·9(48·6–89·2)
52·6(28·9–76·3)
37·2(24·4–50·0)
87·4(78·1–96·7)
86·7(77·9–95·6)
82·7(63·8–100·0)
77·3(61·0–93·5)
57·2(37·4–76·9)
··
Nigeria (Ibadan)
1995–99 ·· ·· ·· ·· ·· ·· ·· ·· ·· ·· ··
2000–04 ·· ·· ·· ·· ·· ·· 93·6§(83·7–100·0)
·· 97·4§(89·5–100·0)
·· ··
2005–09 ·· 0·1§(0·0–0·4)
46·0§(18·4–73·6)
·· ·· ·· 96·0§(90·4–100·0)
·· 91·0§(81·8–100·0)
82·7§(59·8–100·0)
··
South Africa (Eastern Cape)
1995–99 ·· ·· ·· ·· ·· 71·5(51·4–91·6)
37·0(24·7–49·4)
·· ·· ·· ··
2000–04 ·· ·· ·· ·· ·· 37·9(21·1–54·7)
63·0(54·2–71·8)
·· 85·3§(60·0–100·0)
·· ··
2005–09 ·· ·· ·· 10·2§(0·0–22·9)
19·0§(0·0–38·4)
53·4(35·5–71·3)
54·9(41·5–68·3)
90·9§(67·8–100·0)
100·0§(85·5–100·0)
·· ··
The Gambia* ·
1995–99 0·3§(0·0–1·0)
·· ·· 4·5§(0·2–8·8)
30·0§(3·6–56·4)
11·9§(0·0–24·7)
19·5§(11·0–28·0)
·· ·· ·· ··
2000–04 ·· ·· ·· ·· ·· ·· ·· ·· ·· ·· ··
2005–09 ·· ·· ·· ·· ·· ·· ·· ·· ·· ·· ··
Tunisia (central)
1995–99 ·· ·· ·· ·· 6·9§(0·9–12·9)
85·6§(71·5–99·7)
·· ·· ·· ·· ··
2000–04 ·· ·· ·· ·· 15·0§(4·3–25·7)
76·7§(66·8–86·7)
·· ·· ·· ·· ··
2005–09 49·0§(27·9–70·2)
67·6§(57·4–77·8)
78·5§(64·6–92·4)
·· 10·3§(0·0–20·6)
68·4§(64·5–72·2)
42·4§(25·7–59·0)
47·8§(25·2–70·5)
100·0§(100·0–100·0)
26·5§(15·0–37·9)
50·1§(26·0–74·2)
(Table 4 continues on next page)
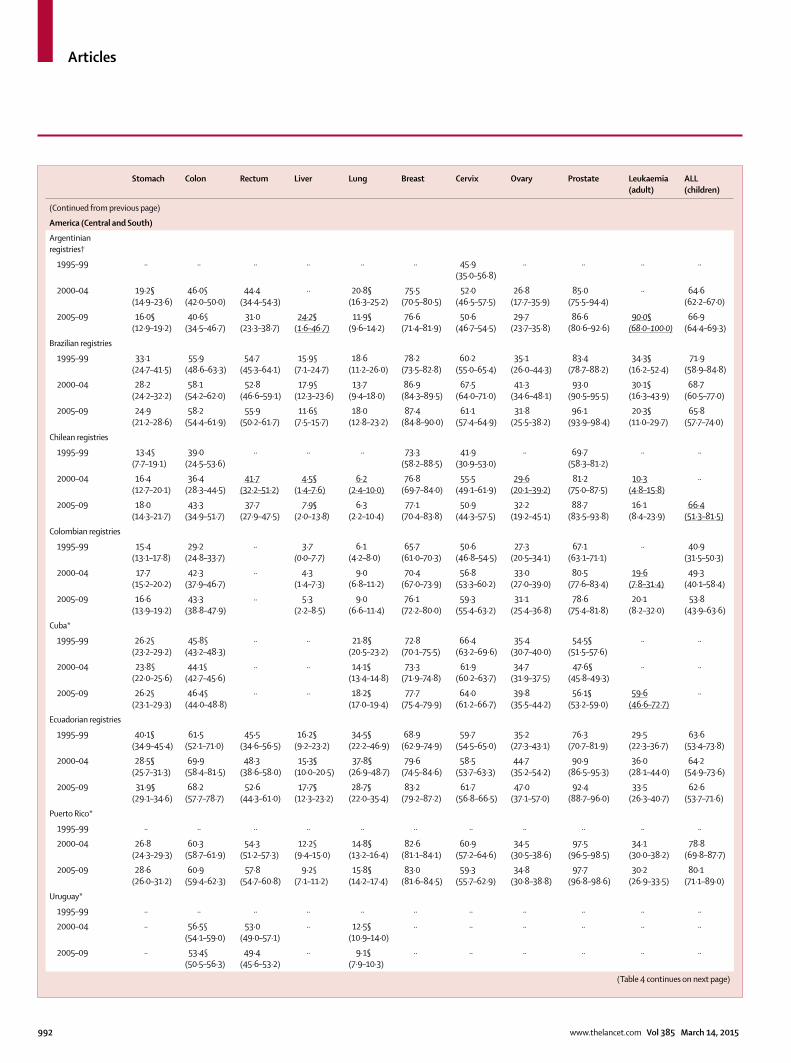
Articles
992 www.thelancet.com Vol 385 March 14, 2015
Stomach Colon Rectum Liver Lung Breast Cervix Ovary Prostate Leukaemia(adult)
ALL (children)
(Continued from previous page)
America (Central and South)
Argentinian registries†
1995–99 ·· ·· ·· ·· ·· ·· 45·9(35·0–56·8)
·· ·· ·· ··
2000–04 19·2§(14·9–23·6)
46·0§(42·0–50·0)
44·4(34·4–54·3)
·· 20·8§(16·3–25·2)
75·5(70·5–80·5)
52·0(46·5–57·5)
26·8(17·7–35·9)
85·0(75·5–94·4)
·· 64·6(62·2–67·0)
2005–09 16·0§(12·9–19·2)
40·6§(34·5–46·7)
31·0(23·3–38·7)
24·2§(1·6–46·7)
11·9§(9·6–14·2)
76·6(71·4–81·9)
50·6(46·7–54·5)
29·7(23·7–35·8)
86·6(80·6–92·6)
90·0§(68·0–100·0)
66·9(64·4–69·3)
Brazilian registries
1995–99 33·1(24·7–41·5)
55·9(48·6–63·3)
54·7(45·3–64·1)
15·9§(7·1–24·7)
18·6(11·2–26·0)
78·2(73·5–82·8)
60·2(55·0–65·4)
35·1(26·0–44·3)
83·4(78·7–88·2)
34·3§(16·2–52·4)
71·9(58·9–84·8)
2000–04 28·2(24·2–32·2)
58·1(54·2–62·0)
52·8(46·6–59·1)
17·9§(12·3–23·6)
13·7(9·4–18·0)
86·9(84·3–89·5)
67·5(64·0–71·0)
41·3(34·6–48·1)
93·0(90·5–95·5)
30·1§(16·3–43·9)
68·7(60·5–77·0)
2005–09 24·9(21·2–28·6)
58·2(54·4–61·9)
55·9(50·2–61·7)
11·6§(7·5–15·7)
18·0(12·8–23·2)
87·4(84·8–90·0)
61·1(57·4–64·9)
31·8(25·5–38·2)
96·1(93·9–98·4)
20·3§(11·0–29·7)
65·8(57·7–74·0)
Chilean registries
1995–99 13·4§(7·7–19·1)
39·0(24·5–53·6)
·· ·· ·· 73·3(58·2–88·5)
41·9(30·9–53·0)
·· 69·7(58·3–81·2)
·· ··
2000–04 16·4(12·7–20·1)
36·4(28·3–44·5)
41·7(32·2–51·2)
4·5§(1·4–7·6)
6·2(2·4–10·0)
76·8(69·7–84·0)
55·5(49·1–61·9)
29·6(20·1–39·2)
81·2(75·0–87·5)
10·3(4·8–15·8)
··
2005–09 18·0(14·3–21·7)
43·3(34·9–51·7)
37·7(27·9–47·5)
7·9§(2·0–13·8)
6·3(2·2–10·4)
77·1(70·4–83·8)
50·9(44·3–57·5)
32·2(19·2–45·1)
88·7(83·5–93·8)
16·1(8·4–23·9)
66·4(51·3–81·5)
Colombian registries
1995–99 15·4(13·1–17·8)
29·2(24·8–33·7)
·· 3·7(0·0–7·7)
6·1(4·2–8·0)
65·7(61·0–70·3)
50·6(46·8–54·5)
27·3(20·5–34·1)
67·1(63·1–71·1)
·· 40·9(31·5–50·3)
2000–04 17·7(15·2–20·2)
42·3(37·9–46·7)
·· 4·3(1·4–7·3)
9·0(6·8–11·2)
70·4(67·0–73·9)
56·8(53·3–60·2)
33·0(27·0–39·0)
80·5(77·6–83·4)
19·6(7·8–31·4)
49·3(40·1–58·4)
2005–09 16·6(13·9–19·2)
43·3(38·8–47·9)
·· 5·3(2·2–8·5)
9·0(6·6–11·4)
76·1(72·2–80·0)
59·3(55·4–63·2)
31·1(25·4–36·8)
78·6(75·4–81·8)
20·1(8·2–32·0)
53·8(43·9–63·6)
Cuba*
1995–99 26·2§(23·2–29·2)
45·8§(43·2–48·3)
·· ·· 21·8§(20·5–23·2)
72·8(70·1–75·5)
66·4(63·2–69·6)
35·4(30·7–40·0)
54·5§(51·5–57·6)
·· ··
2000–04 23·8§(22·0–25·6)
44·1§(42·7–45·6)
·· ·· 14·1§(13·4–14·8)
73·3(71·9–74·8)
61·9(60·2–63·7)
34·7(31·9–37·5)
47·6§(45·8–49·3)
·· ··
2005–09 26·2§(23·1–29·3)
46·4§(44·0–48·8)
·· ·· 18·2§(17·0–19·4)
77·7(75·4–79·9)
64·0(61·2–66·7)
39·8(35·5–44·2)
56·1§(53·2–59·0)
59·6(46·6–72·7)
··
Ecuadorian registries
1995–99 40·1§(34·9–45·4)
61·5(52·1–71·0)
45·5(34·6–56·5)
16·2§(9·2–23·2)
34·5§(22·2–46·9)
68·9(62·9–74·9)
59·7(54·5–65·0)
35·2(27·3–43·1)
76·3(70·7–81·9)
29·5(22·3–36·7)
63·6(53·4–73·8)
2000–04 28·5§(25·7–31·3)
69·9(58·4–81·5)
48·3(38·6–58·0)
15·3§(10·0–20·5)
37·8§(26·9–48·7)
79·6(74·5–84·6)
58·5(53·7–63·3)
44·7(35·2–54·2)
90·9(86·5–95·3)
36·0(28·1–44·0)
64·2(54·9–73·6)
2005–09 31·9§(29·1–34·6)
68·2(57·7–78·7)
52·6(44·3–61·0)
17·7§(12·3–23·2)
28·7§(22·0–35·4)
83·2(79·2–87·2)
61·7(56·8–66·5)
47·0(37·1–57·0)
92·4(88·7–96·0)
33·5(26·3–40·7)
62·6(53·7–71·6)
Puerto Rico*
1995–99 ·· ·· ·· ·· ·· ·· ·· ·· ·· ·· ··
2000–04 26·8(24·3–29·3)
60·3(58·7–61·9)
54·3(51·2–57·3)
12·2§(9·4–15·0)
14·8§(13·2–16·4)
82·6(81·1–84·1)
60·9(57·2–64·6)
34·5(30·5–38·6)
97·5(96·5–98·5)
34·1(30·0–38·2)
78·8(69·8–87·7)
2005–09 28·6(26·0–31·2)
60·9(59·4–62·3)
57·8(54·7–60·8)
9·2§(7·1–11·2)
15·8§(14·2–17·4)
83·0(81·6–84·5)
59·3(55·7–62·9)
34·8(30·8–38·8)
97·7(96·8–98·6)
30·2(26·9–33·5)
80·1(71·1–89·0)
Uruguay*
1995–99 ·· ·· ·· ·· ·· ·· ·· ·· ·· ·· ··
2000–04 ·· 56·5§(54·1–59·0)
53·0(49·0–57·1)
·· 12·5§(10·9–14·0)
·· ·· ·· ·· ·· ··
2005–09 ·· 53·4§(50·5–56·3)
49·4(45·6–53·2)
·· 9·1§(7·9–10·3)
·· ·· ·· ·· ·· ··
(Table 4 continues on next page)
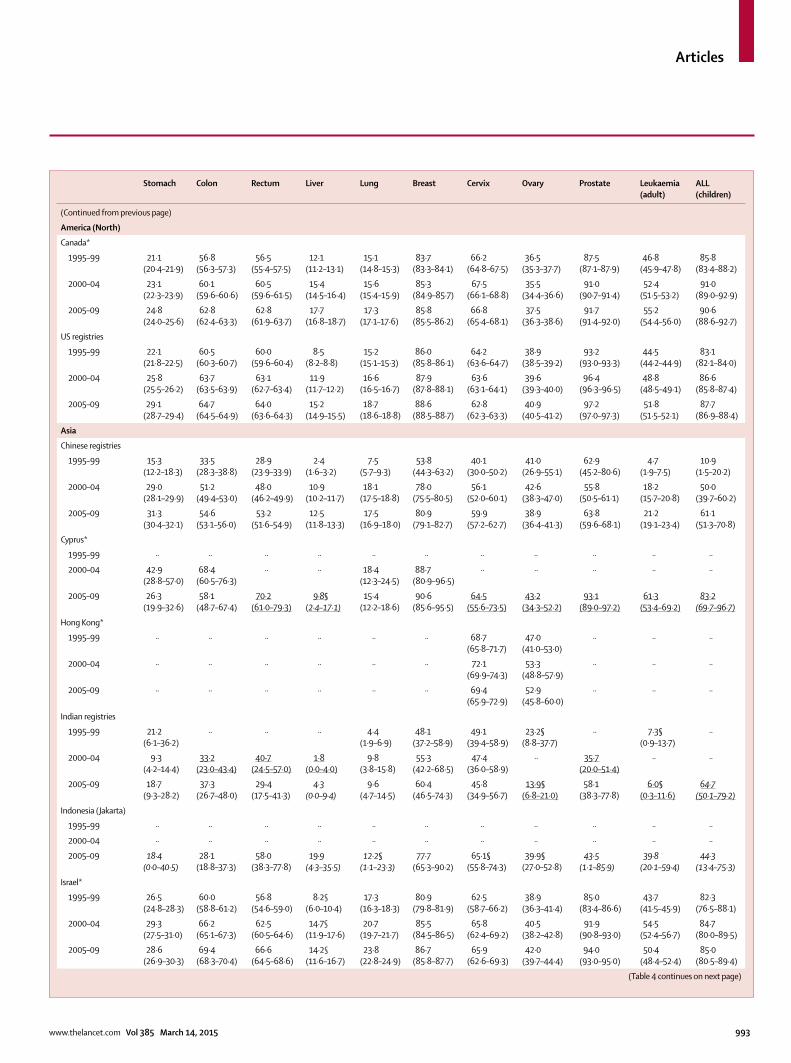
Articles
www.thelancet.com Vol 385 March 14, 2015 993
Stomach Colon Rectum Liver Lung Breast Cervix Ovary Prostate Leukaemia(adult)
ALL (children)
(Continued from previous page)
America (North)
Canada*
1995–99 21·1(20·4–21·9)
56·8(56·3–57·3)
56·5(55·4–57·5)
12·1(11·2–13·1)
15·1(14·8–15·3)
83·7(83·3–84·1)
66·2(64·8–67·5)
36·5(35·3–37·7)
87·5(87·1–87·9)
46·8(45·9–47·8)
85·8(83·4–88·2)
2000–04 23·1(22·3–23·9)
60·1(59·6–60·6)
60·5(59·6–61·5)
15·4(14·5–16·4)
15·6(15·4–15·9)
85·3(84·9–85·7)
67·5(66·1–68·8)
35·5(34·4–36·6)
91·0(90·7–91·4)
52·4(51·5–53·2)
91·0(89·0–92·9)
2005–09 24·8(24·0–25·6)
62·8(62·4–63·3)
62·8(61·9–63·7)
17·7(16·8–18·7)
17·3(17·1–17·6)
85·8(85·5–86·2)
66·8(65·4–68·1)
37·5(36·3–38·6)
91·7(91·4–92·0)
55·2(54·4–56·0)
90·6(88·6–92·7)
US registries
1995–99 22·1(21·8–22·5)
60·5(60·3–60·7)
60·0(59·6–60·4)
8·5(8·2–8·8)
15·2(15·1–15·3)
86·0(85·8–86·1)
64·2(63·6–64·7)
38·9(38·5–39·2)
93·2(93·0–93·3)
44·5(44·2–44·9)
83·1(82·1–84·0)
2000–04 25·8(25·5–26·2)
63·7(63·5–63·9)
63·1(62·7–63·4)
11·9(11·7–12·2)
16·6(16·5–16·7)
87·9(87·8–88·1)
63·6(63·1–64·1)
39·6(39·3–40·0)
96·4(96·3–96·5)
48·8(48·5–49·1)
86·6(85·8–87·4)
2005–09 29·1(28·7–29·4)
64·7(64·5–64·9)
64·0(63·6–64·3)
15·2(14·9–15·5)
18·7(18·6–18·8)
88·6(88·5–88·7)
62·8(62·3–63·3)
40·9(40·5–41·2)
97·2(97·0–97·3)
51·8(51·5–52·1)
87·7(86·9–88·4)
Asia
Chinese registries
1995–99 15·3(12·2–18·3)
33·5(28·3–38·8)
28·9(23·9–33·9)
2·4(1·6–3·2)
7·5(5·7–9·3)
53·8(44·3–63·2)
40·1(30·0–50·2)
41·0(26·9–55·1)
62·9(45·2–80·6)
4·7(1·9–7·5)
10·9(1·5–20·2)
2000–04 29·0(28·1–29·9)
51·2(49·4–53·0)
48·0(46·2–49·9)
10·9(10·2–11·7)
18·1(17·5–18·8)
78·0(75·5–80·5)
56·1(52·0–60·1)
42·6(38·3–47·0)
55·8(50·5–61·1)
18·2(15·7–20·8)
50·0(39·7–60·2)
2005–09 31·3(30·4–32·1)
54·6(53·1–56·0)
53·2(51·6–54·9)
12·5(11·8–13·3)
17·5(16·9–18·0)
80·9(79·1–82·7)
59·9(57·2–62·7)
38·9(36·4–41·3)
63·8(59·6–68·1)
21·2(19·1–23·4)
61·1(51·3–70·8)
Cyprus*
1995–99 ·· ·· ·· ·· ·· ·· ·· ·· ·· ·· ··
2000–04 42·9(28·8–57·0)
68·4(60·5–76·3)
·· ·· 18·4(12·3–24·5)
88·7(80·9–96·5)
·· ·· ·· ·· ··
2005–09 26·3(19·9–32·6)
58·1(48·7–67·4)
70·2(61·0–79·3)
9·8§(2·4–17·1)
15·4(12·2–18·6)
90·6(85·6–95·5)
64·5(55·6–73·5)
43·2(34·3–52·2)
93·1(89·0–97·2)
61·3(53·4–69·2)
83·2(69·7–96·7)
Hong Kong*
1995–99 ·· ·· ·· ·· ·· ·· 68·7(65·8–71·7)
47·0(41·0–53·0)
·· ·· ··
2000–04 ·· ·· ·· ·· ·· ·· 72·1(69·9–74·3)
53·3(48·8–57·9)
·· ·· ··
2005–09 ·· ·· ·· ·· ·· ·· 69·4(65·9–72·9)
52·9(45·8–60·0)
·· ·· ··
Indian registries
1995–99 21·2(6·1–36·2)
·· ·· ·· 4·4(1·9–6·9)
48·1(37·2–58·9)
49·1(39·4–58·9)
23·2§(8·8–37·7)
·· 7·3§(0·9–13·7)
··
2000–04 9·3(4·2–14·4)
33·2(23·0–43·4)
40·7(24·5–57·0)
1·8(0·0–4·0)
9·8(3·8–15·8)
55·3(42·2–68·5)
47·4(36·0–58·9)
·· 35·7(20·0–51·4)
·· ··
2005–09 18·7(9·3–28·2)
37·3(26·7–48·0)
29·4(17·5–41·3)
4·3(0·0–9·4)
9·6(4·7–14·5)
60·4(46·5–74·3)
45·8(34·9–56·7)
13·9§(6·8–21·0)
58·1(38·3–77·8)
6·0§(0·3–11·6)
64·7(50·1–79·2)
Indonesia (Jakarta)
1995–99 ·· ·· ·· ·· ·· ·· ·· ·· ·· ·· ··
2000–04 ·· ·· ·· ·· ·· ·· ·· ·· ·· ·· ··
2005–09 18·4(0·0–40·5)
28·1(18·8–37·3)
58·0(38·3–77·8)
19·9(4·3–35·5)
12·2§(1·1–23·3)
77·7(65·3–90·2)
65·1§(55·8–74·3)
39·9§(27·0–52·8)
43·5(1·1–85·9)
39·8(20·1–59·4)
44·3(13·4–75·3)
Israel*
1995–99 26·5(24·8–28·3)
60·0(58·8–61·2)
56·8(54·6–59·0)
8·2§(6·0–10·4)
17·3(16·3–18·3)
80·9(79·8–81·9)
62·5(58·7–66·2)
38·9(36·3–41·4)
85·0(83·4–86·6)
43·7(41·5–45·9)
82·3(76·5–88·1)
2000–04 29·3(27·5–31·0)
66·2(65·1–67·3)
62·5(60·5–64·6)
14·7§(11·9–17·6)
20·7(19·7–21·7)
85·5(84·5–86·5)
65·8(62·4–69·2)
40·5(38·2–42·8)
91·9(90·8–93·0)
54·5(52·4–56·7)
84·7(80·0–89·5)
2005–09 28·6(26·9–30·3)
69·4(68·3–70·4)
66·6(64·5–68·6)
14·2§(11·6–16·7)
23·8(22·8–24·9)
86·7(85·8–87·7)
65·9(62·6–69·3)
42·0(39·7–44·4)
94·0(93·0–95·0)
50·4(48·4–52·4)
85·0(80·5–89·4)
(Table 4 continues on next page)
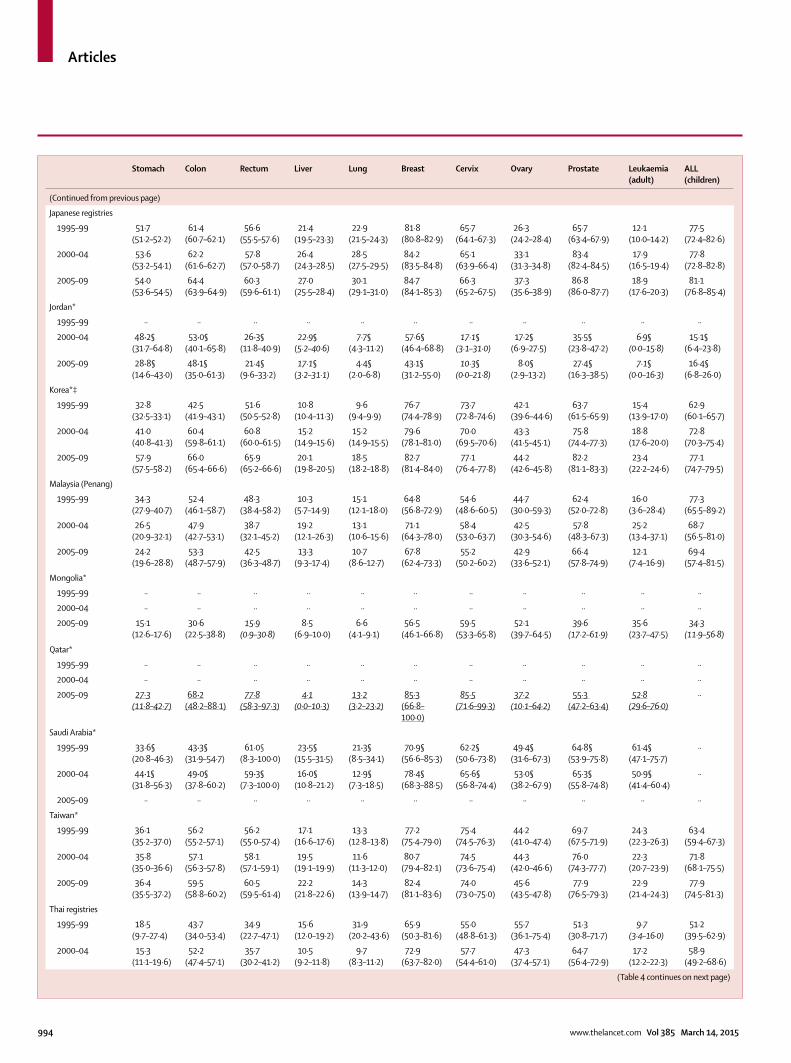
Articles
994 www.thelancet.com Vol 385 March 14, 2015
Stomach Colon Rectum Liver Lung Breast Cervix Ovary Prostate Leukaemia(adult)
ALL (children)
(Continued from previous page)
Japanese registries
1995–99 51·7(51·2–52·2)
61·4(60·7–62·1)
56·6(55·5–57·6)
21·4(19·5–23·3)
22·9(21·5–24·3)
81·8(80·8–82·9)
65·7(64·1–67·3)
26·3(24·2–28·4)
65·7(63·4–67·9)
12·1(10·0–14·2)
77·5(72·4–82·6)
2000–04 53·6(53·2–54·1)
62·2(61·6–62·7)
57·8(57·0–58·7)
26·4(24·3–28·5)
28·5(27·5–29·5)
84·2(83·5–84·8)
65·1(63·9–66·4)
33·1(31·3–34·8)
83·4(82·4–84·5)
17·9(16·5–19·4)
77·8(72·8–82·8)
2005–09 54·0(53·6–54·5)
64·4(63·9–64·9)
60·3(59·6–61·1)
27·0(25·5–28·4)
30·1(29·1–31·0)
84·7(84·1–85·3)
66·3(65·2–67·5)
37·3(35·6–38·9)
86·8(86·0–87·7)
18·9(17·6–20·3)
81·1(76·8–85·4)
Jordan*
1995–99 ·· ·· ·· ·· ·· ·· ·· ·· ·· ·· ··
2000–04 48·2§(31·7–64·8)
53·0§(40·1–65·8)
26·3§(11·8–40·9)
22·9§(5·2–40·6)
7·7§(4·3–11·2)
57·6§(46·4–68·8)
17·1§(3·1–31·0)
17·2§(6·9–27·5)
35·5§(23·8–47·2)
6·9§(0·0–15·8)
15·1§(6·4–23·8)
2005–09 28·8§(14·6–43·0)
48·1§(35·0–61·3)
21·4§(9·6–33·2)
17·1§(3·2–31·1)
4·4§(2·0–6·8)
43·1§(31·2–55·0)
10·3§(0·0–21·8)
8·0§(2·9–13·2)
27·4§(16·3–38·5)
7·1§(0·0–16·3)
16·4§(6·8–26·0)
Korea*‡
1995–99 32·8(32·5–33·1)
42·5(41·9–43·1)
51·6(50·5–52·8)
10·8(10·4–11·3)
9·6(9·4–9·9)
76·7(74·4–78·9)
73·7(72·8–74·6)
42·1(39·6–44·6)
63·7(61·5–65·9)
15·4(13·9–17·0)
62·9(60·1–65·7)
2000–04 41·0(40·8–41·3)
60·4(59·8–61·1)
60·8(60·0–61·5)
15·2(14·9–15·6)
15·2(14·9–15·5)
79·6(78·1–81·0)
70·0(69·5–70·6)
43·3(41·5–45·1)
75·8(74·4–77·3)
18·8(17·6–20·0)
72·8(70·3–75·4)
2005–09 57·9(57·5–58·2)
66·0(65·4–66·6)
65·9(65·2–66·6)
20·1(19·8–20·5)
18·5(18·2–18·8)
82·7(81·4–84·0)
77·1(76·4–77·8)
44·2(42·6–45·8)
82·2(81·1–83·3)
23·4(22·2–24·6)
77·1(74·7–79·5)
Malaysia (Penang)
1995–99 34·3(27·9–40·7)
52·4(46·1–58·7)
48·3(38·4–58·2)
10·3(5·7–14·9)
15·1(12·1–18·0)
64·8(56·8–72·9)
54·6(48·6–60·5)
44·7(30·0–59·3)
62·4(52·0–72·8)
16·0(3·6–28·4)
77·3(65·5–89·2)
2000–04 26·5(20·9–32·1)
47·9(42·7–53·1)
38·7(32·1–45·2)
19·2(12·1–26·3)
13·1(10·6–15·6)
71·1(64·3–78·0)
58·4(53·0–63·7)
42·5(30·3–54·6)
57·8(48·3–67·3)
25·2(13·4–37·1)
68·7(56·5–81·0)
2005–09 24·2(19·6–28·8)
53·3(48·7–57·9)
42·5(36·3–48·7)
13·3(9·3–17·4)
10·7(8·6–12·7)
67·8(62·4–73·3)
55·2(50·2–60·2)
42·9(33·6–52·1)
66·4(57·8–74·9)
12·1(7·4–16·9)
69·4(57·4–81·5)
Mongolia*
1995–99 ·· ·· ·· ·· ·· ·· ·· ·· ·· ·· ··
2000–04 ·· ·· ·· ·· ·· ·· ·· ·· ·· ·· ··
2005–09 15·1(12·6–17·6)
30·6(22·5–38·8)
15·9(0·9–30·8)
8·5(6·9–10·0)
6·6(4·1–9·1)
56·5(46·1–66·8)
59·5(53·3–65·8)
52·1(39·7–64·5)
39·6(17·2–61·9)
35·6(23·7–47·5)
34·3(11·9–56·8)
Qatar*
1995–99 ·· ·· ·· ·· ·· ·· ·· ·· ·· ·· ··
2000–04 ·· ·· ·· ·· ·· ·· ·· ·· ·· ·· ··
2005–09 27·3(11·8–42·7)
68·2(48·2–88·1)
77·8(58·3–97·3)
4·1(0·0–10·3)
13·2(3·2–23·2)
85·3(66·8–100·0)
85·5(71·6–99·3)
37·2(10·1–64·2)
55·3 (47·2–63·4)
52·8(29·6–76·0)
··
Saudi Arabia*
1995–99 33·6§(20·8–46·3)
43·3§(31·9–54·7)
61·0§(8·3–100·0)
23·5§(15·5–31·5)
21·3§(8·5–34·1)
70·9§(56·6–85·3)
62·2§(50·6–73·8)
49·4§(31·6–67·3)
64·8§(53·9–75·8)
61·4§(47·1–75·7)
··
2000–04 44·1§(31·8–56·3)
49·0§(37·8–60·2)
59·3§(7·3– 100·0)
16·0§(10·8–21·2)
12·9§(7·3–18·5)
78·4§(68·3–88·5)
65·6§(56·8–74·4)
53·0§(38·2–67·9)
65·3§(55·8–74·8)
50·9§(41·4–60·4)
··
2005–09 ·· ·· ·· ·· ·· ·· ·· ·· ·· ·· ··
Taiwan*
1995–99 36·1(35·2–37·0)
56·2(55·2–57·1)
56·2(55·0–57·4)
17·1(16·6–17·6)
13·3(12·8–13·8)
77·2(75·4–79·0)
75·4(74·5–76·3)
44·2(41·0–47·4)
69·7(67·5–71·9)
24·3(22·3–26·3)
63·4(59·4–67·3)
2000–04 35·8(35·0–36·6)
57·1(56·3–57·8)
58·1(57·1–59·1)
19·5(19·1–19·9)
11·6(11·3–12·0)
80·7(79·4–82·1)
74·5(73·6–75·4)
44·3(42·0–46·6)
76·0(74·3–77·7)
22·3(20·7–23·9)
71·8(68·1–75·5)
2005–09 36·4(35·5–37·2)
59·5(58·8–60·2)
60·5(59·5–61·4)
22·2(21·8–22·6)
14·3(13·9–14·7)
82·4(81·1–83·6)
74·0(73·0–75·0)
45·6(43·5–47·8)
77·9(76·5–79·3)
22·9(21·4–24·3)
77·9(74·5–81·3)
Thai registries
1995–99 18·5(9·7–27·4)
43·7(34·0–53·4)
34·9(22·7–47·1)
15·6(12·0–19·2)
31·9(20·2–43·6)
65·9(50·3–81·6)
55·0(48·8–61·3)
55·7(36·1–75·4)
51·3(30·8–71·7)
9·7(3·4–16·0)
51·2(39·5–62·9)
2000–04 15·3(11·1–19·6)
52·2(47·4–57·1)
35·7(30·2–41·2)
10·5(9·2–11·8)
9·7(8·3–11·2)
72·9(63·7–82·0)
57·7(54·4–61·0)
47·3(37·4–57·1)
64·7(56·4–72·9)
17·2(12·2–22·3)
58·9(49·2–68·6)
(Table 4 continues on next page)
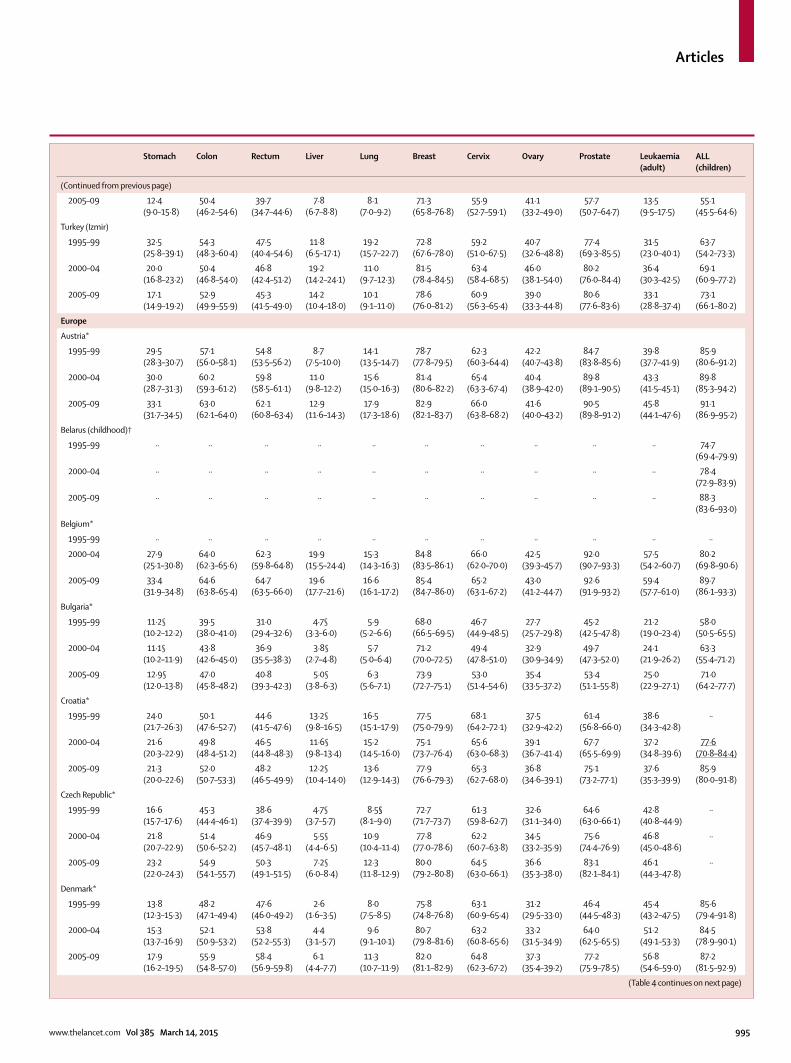
Articles
www.thelancet.com Vol 385 March 14, 2015 995
Stomach Colon Rectum Liver Lung Breast Cervix Ovary Prostate Leukaemia(adult)
ALL (children)
(Continued from previous page)
2005–09 12·4(9·0–15·8)
50·4(46·2–54·6)
39·7(34·7–44·6)
7·8(6·7–8·8)
8·1(7·0–9·2)
71·3(65·8–76·8)
55·9(52·7–59·1)
41·1(33·2–49·0)
57·7(50·7–64·7)
13·5(9·5–17·5)
55·1(45·5–64·6)
Turkey (Izmir)
1995–99 32·5(25·8–39·1)
54·3(48·3–60·4)
47·5(40·4–54·6)
11·8(6·5–17·1)
19·2(15·7–22·7)
72·8(67·6–78·0)
59·2(51·0–67·5)
40·7(32·6–48·8)
77·4(69·3–85·5)
31·5(23·0–40·1)
63·7(54·2–73·3)
2000–04 20·0(16·8–23·2)
50·4(46·8–54·0)
46·8(42·4–51·2)
19·2(14·2–24·1)
11·0(9·7–12·3)
81·5(78·4–84·5)
63·4(58·4–68·5)
46·0(38·1–54·0)
80·2(76·0–84·4)
36·4(30·3–42·5)
69·1(60·9–77·2)
2005–09 17·1(14·9–19·2)
52·9(49·9–55·9)
45·3(41·5–49·0)
14·2(10·4–18·0)
10·1(9·1–11·0)
78·6(76·0–81·2)
60·9(56·3–65·4)
39·0(33·3–44·8)
80·6(77·6–83·6)
33·1(28·8–37·4)
73·1(66·1–80·2)
Europe
Austria*
1995–99 29·5(28·3–30·7)
57·1(56·0–58·1)
54·8(53·5–56·2)
8·7(7·5–10·0)
14·1(13·5–14·7)
78·7(77·8–79·5)
62·3(60·3–64·4)
42·2(40·7–43·8)
84·7(83·8–85·6)
39·8(37·7–41·9)
85·9(80·6–91·2)
2000–04 30·0(28·7–31·3)
60·2(59·3–61·2)
59·8(58·5–61·1)
11·0(9·8–12·2)
15·6(15·0–16·3)
81·4(80·6–82·2)
65·4(63·3–67·4)
40·4(38·9–42·0)
89·8(89·1–90·5)
43·3(41·5–45·1)
89·8(85·3–94·2)
2005–09 33·1(31·7–34·5)
63·0(62·1–64·0)
62·1(60·8–63·4)
12·9(11·6–14·3)
17·9(17·3–18·6)
82·9(82·1–83·7)
66·0(63·8–68·2)
41·6(40·0–43·2)
90·5(89·8–91·2)
45·8(44·1–47·6)
91·1(86·9–95·2)
Belarus (childhood)†
1995–99 ·· ·· ·· ·· ·· ·· ·· ·· ·· ·· 74·7(69·4–79·9)
2000–04 ·· ·· ·· ·· ·· ·· ·· ·· ·· ·· 78·4(72·9–83·9)
2005–09 ·· ·· ·· ·· ·· ·· ·· ·· ·· ·· 88·3(83·6–93·0)
Belgium*
1995–99 ·· ·· ·· ·· ·· ·· ·· ·· ·· ·· ··
2000–04 27·9(25·1–30·8)
64·0(62·3–65·6)
62·3(59·8–64·8)
19·9(15·5–24·4)
15·3(14·3–16·3)
84·8(83·5–86·1)
66·0(62·0–70·0)
42·5(39·3–45·7)
92·0(90·7–93·3)
57·5(54·2–60·7)
80·2(69·8–90·6)
2005–09 33·4(31·9–34·8)
64·6(63·8–65·4)
64·7(63·5–66·0)
19·6(17·7–21·6)
16·6(16·1–17·2)
85·4(84·7–86·0)
65·2(63·1–67·2)
43·0(41·2–44·7)
92·6(91·9–93·2)
59·4(57·7–61·0)
89·7(86·1–93·3)
Bulgaria*
1995–99 11·2§(10·2–12·2)
39·5(38·0–41·0)
31·0(29·4–32·6)
4·7§(3·3–6·0)
5·9(5·2–6·6)
68·0(66·5–69·5)
46·7(44·9–48·5)
27·7(25·7–29·8)
45·2(42·5–47·8)
21·2(19·0–23·4)
58·0(50·5–65·5)
2000–04 11·1§(10·2–11·9)
43·8(42·6–45·0)
36·9(35·5–38·3)
3·8§(2·7–4·8)
5·7(5·0–6·4)
71·2(70·0–72·5)
49·4(47·8–51·0)
32·9(30·9–34·9)
49·7(47·3–52·0)
24·1(21·9–26·2)
63·3(55·4–71·2)
2005–09 12·9§(12·0–13·8)
47·0(45·8–48·2)
40·8(39·3–42·3)
5·0§(3·8–6·3)
6·3(5·6–7·1)
73·9(72·7–75·1)
53·0(51·4–54·6)
35·4(33·5–37·2)
53·4(51·1–55·8)
25·0(22·9–27·1)
71·0(64·2–77·7)
Croatia*
1995–99 24·0(21·7–26·3)
50·1(47·6–52·7)
44·6(41·5–47·6)
13·2§(9·8–16·5)
16·5(15·1–17·9)
77·5(75·0–79·9)
68·1(64·2–72·1)
37·5(32·9–42·2)
61·4(56·8–66·0)
38·6(34·3–42·8)
··
2000–04 21·6(20·3–22·9)
49·8(48·4–51·2)
46·5(44·8–48·3)
11·6§(9·8–13·4)
15·2(14·5–16·0)
75·1(73·7–76·4)
65·6(63·0–68·3)
39·1(36·7–41·4)
67·7(65·5–69·9)
37·2(34·8–39·6)
77·6(70·8–84·4)
2005–09 21·3(20·0–22·6)
52·0(50·7–53·3)
48·2(46·5–49·9)
12·2§(10·4–14·0)
13·6(12·9–14·3)
77·9(76·6–79·3)
65·3(62·7–68·0)
36·8(34·6–39·1)
75·1(73·2–77·1)
37·6(35·3–39·9)
85·9(80·0–91·8)
Czech Republic*
1995–99 16·6(15·7–17·6)
45·3(44·4–46·1)
38·6(37·4–39·9)
4·7§(3·7–5·7)
8·5§(8·1–9·0)
72·7(71·7–73·7)
61·3(59·8–62·7)
32·6(31·1–34·0)
64·6(63·0–66·1)
42·8(40·8–44·9)
··
2000–04 21·8(20·7–22·9)
51·4(50·6–52·2)
46·9(45·7–48·1)
5·5§(4·4–6·5)
10·9(10·4–11·4)
77·8(77·0–78·6)
62·2(60·7–63·8)
34·5(33·2–35·9)
75·6(74·4–76·9)
46·8(45·0–48·6)
··
2005–09 23·2(22·0–24·3)
54·9(54·1–55·7)
50·3(49·1–51·5)
7·2§(6·0–8·4)
12·3(11·8–12·9)
80·0(79·2–80·8)
64·5(63·0–66·1)
36·6(35·3–38·0)
83·1(82·1–84·1)
46·1(44·3–47·8)
··
Denmark*
1995–99 13·8(12·3–15·3)
48·2(47·1–49·4)
47·6(46·0–49·2)
2·6(1·6–3·5)
8·0(7·5–8·5)
75·8(74·8–76·8)
63·1(60·9–65·4)
31·2(29·5–33·0)
46·4(44·5–48·3)
45·4(43·2–47·5)
85·6(79·4–91·8)
2000–04 15·3(13·7–16·9)
52·1(50·9–53·2)
53·8(52·2–55·3)
4·4(3·1–5·7)
9·6(9·1–10·1)
80·7(79·8–81·6)
63·2(60·8–65·6)
33·2(31·5–34·9)
64·0(62·5–65·5)
51·2(49·1–53·3)
84·5(78·9–90·1)
2005–09 17·9(16·2–19·5)
55·9(54·8–57·0)
58·4(56·9–59·8)
6·1(4·4–7·7)
11·3(10·7–11·9)
82·0(81·1–82·9)
64·8(62·3–67·2)
37·3(35·4–39·2)
77·2(75·9–78·5)
56·8(54·6–59·0)
87·2(81·5–92·9)
(Table 4 continues on next page)
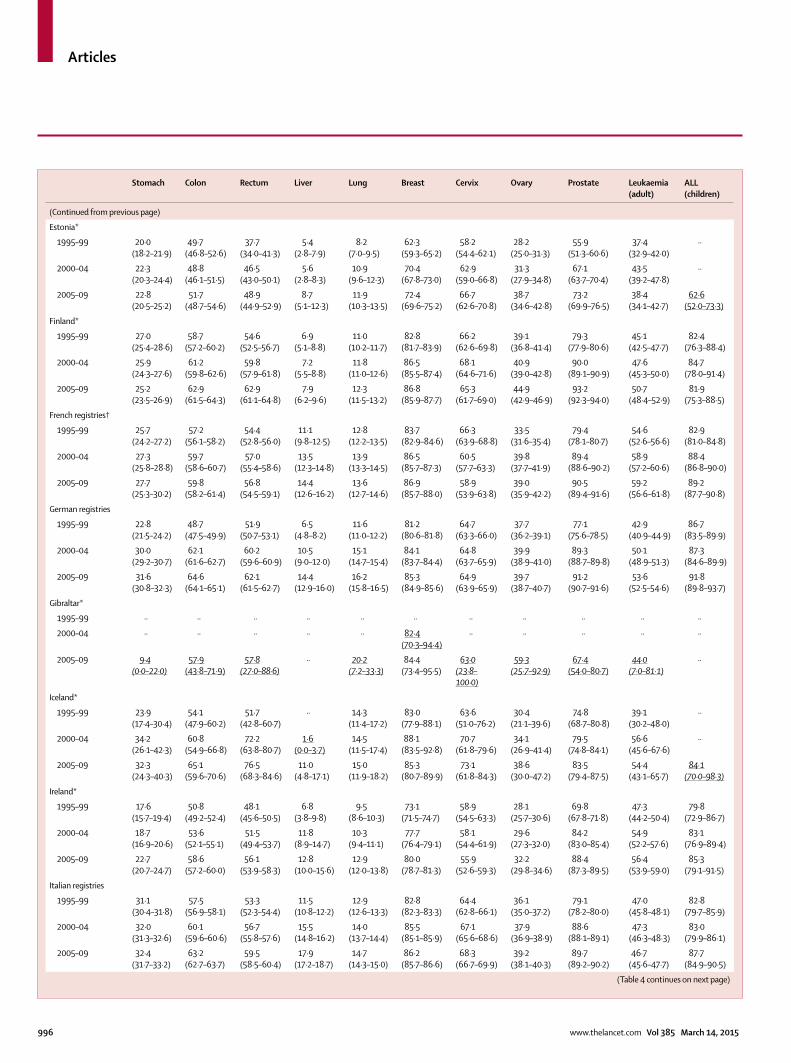
Articles
996 www.thelancet.com Vol 385 March 14, 2015
Stomach Colon Rectum Liver Lung Breast Cervix Ovary Prostate Leukaemia(adult)
ALL (children)
(Continued from previous page)
Estonia*
1995–99 20·0(18·2–21·9)
49·7(46·8–52·6)
37·7(34·0–41·3)
5·4(2·8–7·9)
8·2(7·0–9·5)
62·3(59·3–65·2)
58·2(54·4–62·1)
28·2(25·0–31·3)
55·9(51·3–60·6)
37·4(32·9–42·0)
··
2000–04 22·3(20·3–24·4)
48·8(46·1–51·5)
46·5(43·0–50·1)
5·6(2·8–8·3)
10·9(9·6–12·3)
70·4(67·8–73·0)
62·9(59·0–66·8)
31·3(27·9–34·8)
67·1(63·7–70·4)
43·5(39·2–47·8)
··
2005–09 22·8(20·5–25·2)
51·7(48·7–54·6)
48·9(44·9–52·9)
8·7(5·1–12·3)
11·9(10·3–13·5)
72·4(69·6–75·2)
66·7(62·6–70·8)
38·7(34·6–42·8)
73·2(69·9–76·5)
38·4(34·1–42·7)
62·6(52·0–73·3)
Finland*
1995–99 27·0(25·4–28·6)
58·7(57·2–60·2)
54·6(52·5–56·7)
6·9(5·1–8·8)
11·0(10·2–11·7)
82·8(81·7–83·9)
66·2(62·6–69·8)
39·1(36·8–41·4)
79·3(77·9–80·6)
45·1(42·5–47·7)
82·4(76·3–88·4)
2000–04 25·9(24·3–27·6)
61·2(59·8–62·6)
59·8(57·9–61·8)
7·2(5·5–8·8)
11·8(11·0–12·6)
86·5(85·5–87·4)
68·1(64·6–71·6)
40·9(39·0–42·8)
90·0(89·1–90·9)
47·6(45·3–50·0)
84·7(78·0–91·4)
2005–09 25·2(23·5–26·9)
62·9(61·5–64·3)
62·9(61·1–64·8)
7·9(6·2–9·6)
12·3(11·5–13·2)
86·8(85·9–87·7)
65·3(61·7–69·0)
44·9(42·9–46·9)
93·2(92·3–94·0)
50·7(48·4–52·9)
81·9(75·3–88·5)
French registries†
1995–99 25·7(24·2–27·2)
57·2(56·1–58·2)
54·4(52·8–56·0)
11·1(9·8–12·5)
12·8(12·2–13·5)
83·7(82·9–84·6)
66·3(63·9–68·8)
33·5(31·6–35·4)
79·4(78·1–80·7)
54·6(52·6–56·6)
82·9(81·0–84·8)
2000–04 27·3(25·8–28·8)
59·7(58·6–60·7)
57·0(55·4–58·6)
13·5(12·3–14·8)
13·9(13·3–14·5)
86·5(85·7–87·3)
60·5(57·7–63·3)
39·8(37·7–41·9)
89·4(88·6–90·2)
58·9(57·2–60·6)
88·4(86·8–90·0)
2005–09 27·7(25·3–30·2)
59·8(58·2–61·4)
56·8(54·5–59·1)
14·4(12·6–16·2)
13·6(12·7–14·6)
86·9(85·7–88·0)
58·9(53·9–63·8)
39·0(35·9–42·2)
90·5(89·4–91·6)
59·2(56·6–61·8)
89·2(87·7–90·8)
German registries
1995–99 22·8(21·5–24·2)
48·7(47·5–49·9)
51·9(50·7–53·1)
6·5(4·8–8·2)
11·6(11·0–12·2)
81·2(80·6–81·8)
64·7(63·3–66·0)
37·7(36·2–39·1)
77·1(75·6–78·5)
42·9(40·9–44·9)
86·7(83·5–89·9)
2000–04 30·0(29·2–30·7)
62·1(61·6–62·7)
60·2(59·6–60·9)
10·5(9·0–12·0)
15·1(14·7–15·4)
84·1(83·7–84·4)
64·8(63·7–65·9)
39·9(38·9–41·0)
89·3(88·7–89·8)
50·1(48·9–51·3)
87·3(84·6–89·9)
2005–09 31·6(30·8–32·3)
64·6(64·1–65·1)
62·1(61·5–62·7)
14·4(12·9–16·0)
16·2(15·8–16·5)
85·3(84·9–85·6)
64·9(63·9–65·9)
39·7(38·7–40·7)
91·2(90·7–91·6)
53·6(52·5–54·6)
91·8(89·8–93·7)
Gibraltar*
1995–99 ·· ·· ·· ·· ·· ·· ·· ·· ·· ·· ··
2000–04 ·· ·· ·· ·· ·· 82·4(70·3–94·4)
·· ·· ·· ·· ··
2005–09 9·4(0·0–22·0)
57·9(43·8–71·9)
57·8(27·0–88·6)
·· 20·2(7·2–33·3)
84·4(73·4–95·5)
63·0(23·8–100·0)
59·3(25·7–92·9)
67·4(54·0–80·7)
44·0(7·0–81·1)
··
Iceland*
1995–99 23·9(17·4–30·4)
54·1(47·9–60·2)
51·7(42·8–60·7)
·· 14·3(11·4–17·2)
83·0(77·9–88·1)
63·6(51·0–76·2)
30·4(21·1–39·6)
74·8(68·7–80·8)
39·1(30·2–48·0)
··
2000–04 34·2(26·1–42·3)
60·8(54·9–66·8)
72·2(63·8–80·7)
1·6(0·0–3·7)
14·5(11·5–17·4)
88·1(83·5–92·8)
70·7(61·8–79·6)
34·1(26·9–41·4)
79·5(74·8–84·1)
56·6(45·6–67·6)
··
2005–09 32·3(24·3–40·3)
65·1(59·6–70·6)
76·5(68·3–84·6)
11·0(4·8–17·1)
15·0(11·9–18·2)
85·3(80·7–89·9)
73·1(61·8–84·3)
38·6(30·0–47·2)
83·5(79·4–87·5)
54·4(43·1–65·7)
84·1(70·0–98·3)
Ireland*
1995–99 17·6(15·7–19·4)
50·8(49·2–52·4)
48·1(45·6–50·5)
6·8(3·8–9·8)
9·5(8·6–10·3)
73·1(71·5–74·7)
58·9(54·5–63·3)
28·1(25·7–30·6)
69·8(67·8–71·8)
47·3(44·2–50·4)
79·8(72·9–86·7)
2000–04 18·7(16·9–20·6)
53·6(52·1–55·1)
51·5(49·4–53·7)
11·8(8·9–14·7)
10·3(9·4–11·1)
77·7(76·4–79·1)
58·1(54·4–61·9)
29·6(27·3–32·0)
84·2(83·0–85·4)
54·9(52·2–57·6)
83·1(76·9–89·4)
2005–09 22·7(20·7–24·7)
58·6(57·2–60·0)
56·1(53·9–58·3)
12·8(10·0–15·6)
12·9(12·0–13·8)
80·0(78·7–81·3)
55·9(52·6–59·3)
32·2(29·8–34·6)
88·4(87·3–89·5)
56·4(53·9–59·0)
85·3(79·1–91·5)
Italian registries
1995–99 31·1(30·4–31·8)
57·5(56·9–58·1)
53·3(52·3–54·4)
11·5(10·8–12·2)
12·9(12·6–13·3)
82·8(82·3–83·3)
64·4(62·8–66·1)
36·1(35·0–37·2)
79·1(78·2–80·0)
47·0(45·8–48·1)
82·8(79·7–85·9)
2000–04 32·0(31·3–32·6)
60·1(59·6–60·6)
56·7(55·8–57·6)
15·5(14·8–16·2)
14·0(13·7–14·4)
85·5(85·1–85·9)
67·1(65·6–68·6)
37·9(36·9–38·9)
88·6(88·1–89·1)
47·3(46·3–48·3)
83·0(79·9–86·1)
2005–09 32·4(31·7–33·2)
63·2(62·7–63·7)
59·5(58·5–60·4)
17·9(17·2–18·7)
14·7(14·3–15·0)
86·2(85·7–86·6)
68·3(66·7–69·9)
39·2(38·1–40·3)
89·7(89·2–90·2)
46·7(45·6–47·7)
87·7(84·9–90·5)
(Table 4 continues on next page)
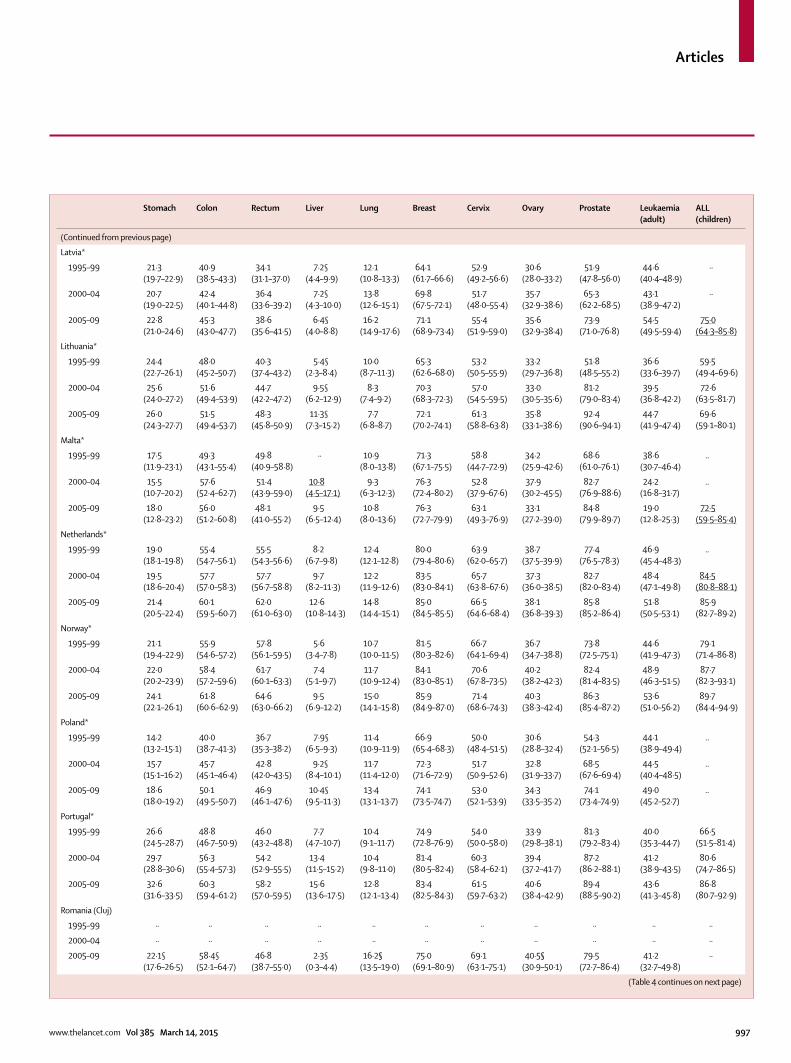
Articles
www.thelancet.com Vol 385 March 14, 2015 997
Stomach Colon Rectum Liver Lung Breast Cervix Ovary Prostate Leukaemia(adult)
ALL (children)
(Continued from previous page)
Latvia*
1995–99 21·3(19·7–22·9)
40·9(38·5–43·3)
34·1(31·1–37·0)
7·2§(4·4–9·9)
12·1(10·8–13·3)
64·1(61·7–66·6)
52·9(49·2–56·6)
30·6(28·0–33·2)
51·9(47·8–56·0)
44·6(40·4–48·9)
··
2000–04 20·7(19·0–22·5)
42·4(40·1–44·8)
36·4(33·6–39·2)
7·2§(4·3–10·0)
13·8(12·6–15·1)
69·8(67·5–72·1)
51·7(48·0–55·4)
35·7(32·9–38·6)
65·3(62·2–68·5)
43·1(38·9–47·2)
··
2005–09 22·8(21·0–24·6)
45·3(43·0–47·7)
38·6(35·6–41·5)
6·4§(4·0–8·8)
16·2(14·9–17·6)
71·1(68·9–73·4)
55·4(51·9–59·0)
35·6(32·9–38·4)
73·9(71·0–76·8)
54·5(49·5–59·4)
75·0(64·3–85·8)
Lithuania*
1995–99 24·4(22·7–26·1)
48·0(45·2–50·7)
40·3(37·4–43·2)
5·4§(2·3–8·4)
10·0(8·7–11·3)
65·3(62·6–68·0)
53·2(50·5–55·9)
33·2(29·7–36·8)
51·8(48·5–55·2)
36·6(33·6–39·7)
59·5(49·4–69·6)
2000–04 25·6(24·0–27·2)
51·6(49·4–53·9)
44·7(42·2–47·2)
9·5§(6·2–12·9)
8·3(7·4–9·2)
70·3(68·3–72·3)
57·0(54·5–59·5)
33·0(30·5–35·6)
81·2(79·0–83·4)
39·5(36·8–42·2)
72·6(63·5–81·7)
2005–09 26·0(24·3–27·7)
51·5(49·4–53·7)
48·3(45·8–50·9)
11·3§(7·3–15·2)
7·7(6·8–8·7)
72·1(70·2–74·1)
61·3(58·8–63·8)
35·8(33·1–38·6)
92·4(90·6–94·1)
44·7(41·9–47·4)
69·6(59·1–80·1)
Malta*
1995–99 17·5(11·9–23·1)
49·3(43·1–55·4)
49·8(40·9–58·8)
·· 10·9(8·0–13·8)
71·3(67·1–75·5)
58·8(44·7–72·9)
34·2(25·9–42·6)
68·6(61·0–76·1)
38·6(30·7–46·4)
..
2000–04 15·5(10·7–20·2)
57·6(52·4–62·7)
51·4(43·9–59·0)
10·8(4·5–17·1)
9·3(6·3–12·3)
76·3(72·4–80·2)
52·8(37·9–67·6)
37·9(30·2–45·5)
82·7(76·9–88·6)
24·2(16·8–31·7)
..
2005–09 18·0(12·8–23·2)
56·0(51·2–60·8)
48·1(41·0–55·2)
9·5(6·5–12·4)
10·8(8·0–13·6)
76·3(72·7–79·9)
63·1(49·3–76·9)
33·1(27·2–39·0)
84·8(79·9–89·7)
19·0(12·8–25·3)
72·5(59·5–85·4)
Nether lands*
1995–99 19·0(18·1–19·8)
55·4(54·7–56·1)
55·5(54·3–56·6)
8·2(6·7–9·8)
12·4(12·1–12·8)
80·0(79·4–80·6)
63·9(62·0–65·7)
38·7(37·5–39·9)
77·4(76·5–78·3)
46·9(45·4–48·3)
..
2000–04 19·5(18·6–20·4)
57·7(57·0–58·3)
57·7(56·7–58·8)
9·7(8·2–11·3)
12·2(11·9–12·6)
83·5(83·0–84·1)
65·7(63·8–67·6)
37·3(36·0–38·5)
82·7(82·0–83·4)
48·4(47·1–49·8)
84·5(80·8–88·1)
2005–09 21·4(20·5–22·4)
60·1(59·5–60·7)
62·0(61·0–63·0)
12·6(10·8–14·3)
14·8(14·4–15·1)
85·0(84·5–85·5)
66·5(64·6–68·4)
38·1(36·8–39·3)
85·8(85·2–86·4)
51·8(50·5–53·1)
85·9(82·7–89·2)
Norway*
1995–99 21·1(19·4–22·9)
55·9(54·6–57·2)
57·8(56·1–59·5)
5·6(3·4–7·8)
10·7(10·0–11·5)
81·5(80·3–82·6)
66·7(64·1–69·4)
36·7(34·7–38·8)
73·8(72·5–75·1)
44·6(41·9–47·3)
79·1(71·4–86·8)
2000–04 22·0(20·2–23·9)
58·4(57·2–59·6)
61·7(60·1–63·3)
7·4(5·1–9·7)
11·7(10·9–12·4)
84·1(83·0–85·1)
70·6(67·8–73·5)
40·2(38·2–42·3)
82·4(81·4–83·5)
48·9(46·3–51·5)
87·7(82·3–93·1)
2005–09 24·1(22·1–26·1)
61·8(60·6–62·9)
64·6(63·0–66·2)
9·5(6·9–12·2)
15·0(14·1–15·8)
85·9(84·9–87·0)
71·4(68·6–74·3)
40·3(38·3–42·4)
86·3(85·4–87·2)
53·6(51·0–56·2)
89·7(84·4–94·9)
Poland*
1995–99 14·2(13·2–15·1)
40·0(38·7–41·3)
36·7(35·3–38·2)
7·9§(6·5–9·3)
11·4(10·9–11·9)
66·9(65·4–68·3)
50·0(48·4–51·5)
30·6(28·8–32·4)
54·3(52·1–56·5)
44·1(38·9–49·4)
..
2000–04 15·7(15·1–16·2)
45·7(45·1–46·4)
42·8(42·0–43·5)
9·2§(8·4–10·1)
11·7(11·4–12·0)
72·3(71·6–72·9)
51·7(50·9–52·6)
32·8(31·9–33·7)
68·5(67·6–69·4)
44·5(40·4–48·5)
..
2005–09 18·6(18·0–19·2)
50·1(49·5–50·7)
46·9(46·1–47·6)
10·4§(9·5–11·3)
13·4(13·1–13·7)
74·1(73·5–74·7)
53·0(52·1–53·9)
34·3(33·5–35·2)
74·1(73·4–74·9)
49·0(45·2–52·7)
..
Portugal*
1995–99 26·6(24·5–28·7)
48·8(46·7–50·9)
46·0(43·2–48·8)
7·7(4·7–10·7)
10·4(9·1–11·7)
74·9(72·8–76·9)
54·0(50·0–58·0)
33·9(29·8–38·1)
81·3(79·2–83·4)
40·0(35·3–44·7)
66·5(51·5–81·4)
2000–04 29·7(28·8–30·6)
56·3(55·4–57·3)
54·2(52·9–55·5)
13·4(11·5–15·2)
10·4(9·8–11·0)
81·4(80·5–82·4)
60·3(58·4–62·1)
39·4(37·2–41·7)
87·2(86·2–88·1)
41·2(38·9–43·5)
80·6(74·7–86·5)
2005–09 32·6(31·6–33·5)
60·3(59·4–61·2)
58·2(57·0–59·5)
15·6(13·6–17·5)
12·8(12·1–13·4)
83·4(82·5–84·3)
61·5(59·7–63·2)
40·6(38·4–42·9)
89·4(88·5–90·2)
43·6(41·3–45·8)
86·8(80·7–92·9)
Romania (Cluj)
1995–99 ·· ·· ·· ·· ·· ·· ·· ·· ·· ·· ··
2000–04 ·· ·· ·· ·· ·· ·· ·· ·· ·· ·· ··
2005–09 22·1§(17·6–26·5)
58·4§(52·1–64·7)
46·8(38·7–55·0)
2·3§(0·3–4·4)
16·2§(13·5–19·0)
75·0(69·1–80·9)
69·1(63·1–75·1)
40·5§(30·9–50·1)
79·5(72·7–86·4)
41·2(32·7–49·8)
··
(Table 4 continues on next page)
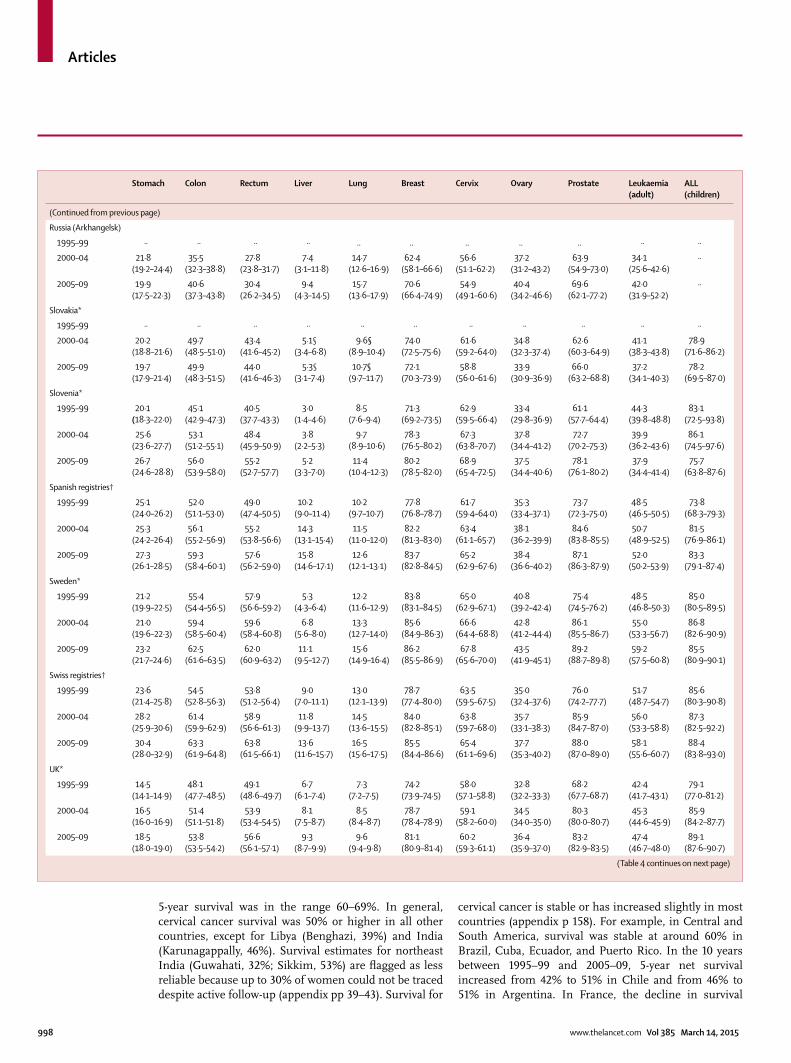
Articles
998 www.thelancet.com Vol 385 March 14, 2015
5-year survival was in the range 60–69%. In general, cervical cancer survival was 50% or higher in all other countries, except for Libya (Benghazi, 39%) and India (Karunagappally, 46%). Survival estimates for northeast India (Guwahati, 32%; Sikkim, 53%) are fl agged as less reliable because up to 30% of women could not be traced despite active follow-up (appendix pp 39–43). Survival for
cervical cancer is stable or has increased slightly in most countries (appendix p 158). For example, in Central and South America, survival was stable at around 60% in Brazil, Cuba, Ecuador, and Puerto Rico. In the 10 years between 1995–99 and 2005–09, 5-year net survival increased from 42% to 51% in Chile and from 46% to 51% in Argentina. In France, the decline in survival
Stomach Colon Rectum Liver Lung Breast Cervix Ovary Prostate Leukaemia(adult)
ALL (children)
(Continued from previous page)
Russia (Arkhan gelsk)
1995–99 ·· ·· ·· ·· .. .. .. .. .. ·· ··
2000–04 21·8(19·2–24·4)
35·5(32·3–38·8)
27·8(23·8–31·7)
7·4(3·1–11·8)
14·7(12·6–16·9)
62·4(58·1–66·6)
56·6(51·1–62·2)
37·2(31·2–43·2)
63·9(54·9–73·0)
34·1(25·6–42·6)
··
2005–09 19·9(17·5–22·3)
40·6(37·3–43·8)
30·4(26·2–34·5)
9·4(4·3–14·5)
15·7(13·6–17·9)
70·6(66·4–74·9)
54·9(49·1–60·6)
40·4(34·2–46·6)
69·6(62·1–77·2)
42·0(31·9–52·2)
··
Slovakia*
1995–99 ·· ·· ·· ·· ·· ·· ·· ·· ·· ·· ··
2000–04 20·2(18·8–21·6)
49·7(48·5–51·0)
43·4(41·6–45·2)
5·1§(3·4–6·8)
9·6§(8·9–10·4)
74·0(72·5–75·6)
61·6(59·2–64·0)
34·8(32·3–37·4)
62·6(60·3–64·9)
41·1(38·3–43·8)
78·9(71·6–86·2)
2005–09 19·7(17·9–21·4)
49·9(48·3–51·5)
44·0(41·6–46·3)
5·3§(3·1–7·4)
10·7§(9·7–11·7)
72·1(70·3–73·9)
58·8(56·0–61·6)
33·9(30·9–36·9)
66·0(63·2–68·8)
37·2(34·1–40·3)
78·2(69·5–87·0)
Slovenia*
1995–99 20·1(18·3–22·0)
45·1(42·9–47·3)
40·5(37·7–43·3)
3·0(1·4–4·6)
8·5(7·6–9·4)
71·3(69·2–73·5)
62·9(59·5–66·4)
33·4(29·8–36·9)
61·1(57·7–64·4)
44·3(39·8–48·8)
83·1(72·5–93·8)
2000–04 25·6(23·6–27·7)
53·1(51·2–55·1)
48·4(45·9–50·9)
3·8(2·2–5·3)
9·7(8·9–10·6)
78·3(76·5–80·2)
67·3(63·8–70·7)
37·8(34·4–41·2)
72·7(70·2–75·3)
39·9(36·2–43·6)
86·1(74·5–97·6)
2005–09 26·7(24·6–28·8)
56·0(53·9–58·0)
55·2(52·7–57·7)
5·2(3·3–7·0)
11·4(10·4–12·3)
80·2(78·5–82·0)
68·9(65·4–72·5)
37·5(34·4–40·6)
78·1(76·1–80·2)
37·9(34·4–41·4)
75·7(63·8–87·6)
Spanish registries†
1995–99 25·1(24·0–26·2)
52·0(51·1–53·0)
49·0(47·4–50·5)
10·2(9·0–11·4)
10·2(9·7–10·7)
77·8(76·8–78·7)
61·7(59·4–64·0)
35·3(33·4–37·1)
73·7(72·3–75·0)
48·5(46·5–50·5)
73·8(68·3–79·3)
2000–04 25·3(24·2–26·4)
56·1(55·2–56·9)
55·2(53·8–56·6)
14·3(13·1–15·4)
11·5(11·0–12·0)
82·2(81·3–83·0)
63·4(61·1–65·7)
38·1(36·2–39·9)
84·6(83·8–85·5)
50·7(48·9–52·5)
81·5(76·9–86·1)
2005–09 27·3(26·1–28·5)
59·3(58·4–60·1)
57·6(56·2–59·0)
15·8(14·6–17·1)
12·6(12·1–13·1)
83·7(82·8–84·5)
65·2(62·9–67·6)
38·4(36·6–40·2)
87·1(86·3–87·9)
52·0(50·2–53·9)
83·3(79·1–87·4)
Sweden*
1995–99 21·2(19·9–22·5)
55·4(54·4–56·5)
57·9(56·6–59·2)
5·3(4·3–6·4)
12·2(11·6–12·9)
83·8(83·1–84·5)
65·0(62·9–67·1)
40·8(39·2–42·4)
75·4(74·5–76·2)
48·5(46·8–50·3)
85·0(80·5–89·5)
2000–04 21·0(19·6–22·3)
59·4(58·5–60·4)
59·6(58·4–60·8)
6·8(5·6–8·0)
13·3(12·7–14·0)
85·6(84·9–86·3)
66·6(64·4–68·8)
42·8(41·2–44·4)
86·1(85·5–86·7)
55·0(53·3–56·7)
86·8(82·6–90·9)
2005–09 23·2(21·7–24·6)
62·5(61·6–63·5)
62·0(60·9–63·2)
11·1(9·5–12·7)
15·6(14·9–16·4)
86·2(85·5–86·9)
67·8(65·6–70·0)
43·5(41·9–45·1)
89·2(88·7–89·8)
59·2(57·5–60·8)
85·5(80·9–90·1)
Swiss registries†
1995–99 23·6(21·4–25·8)
54·5(52·8–56·3)
53·8(51·2–56·4)
9·0(7·0–11·1)
13·0(12·1–13·9)
78·7(77·4–80·0)
63·5(59·5–67·5)
35·0(32·4–37·6)
76·0(74·2–77·7)
51·7(48·7–54·7)
85·6(80·3–90·8)
2000–04 28·2(25·9–30·6)
61·4(59·9–62·9)
58·9(56·6–61·3)
11·8(9·9–13·7)
14·5(13·6–15·5)
84·0(82·8–85·1)
63·8(59·7–68·0)
35·7(33·1–38·3)
85·9(84·7–87·0)
56·0(53·3–58·8)
87·3(82·5–92·2)
2005–09 30·4(28·0–32·9)
63·3(61·9–64·8)
63·8(61·5–66·1)
13·6(11·6–15·7)
16·5(15·6–17·5)
85·5(84·4–86·6)
65·4(61·1–69·6)
37·7(35·3–40·2)
88·0(87·0–89·0)
58·1(55·6–60·7)
88·4(83·8–93·0)
UK*
1995–99 14·5(14·1–14·9)
48·1(47·7–48·5)
49·1(48·6–49·7)
6·7(6·1–7·4)
7·3(7·2–7·5)
74·2(73·9–74·5)
58·0(57·1–58·8)
32·8(32·2–33·3)
68·2(67·7–68·7)
42·4(41·7–43·1)
79·1(77·0–81·2)
2000–04 16·5(16·0–16·9)
51·4(51·1–51·8)
53·9(53·4–54·5)
8·1(7·5–8·7)
8·5(8·4–8·7)
78·7(78·4–78·9)
59·1(58·2–60·0)
34·5(34·0–35·0)
80·3(80·0–80·7)
45·3(44·6–45·9)
85·9(84·2–87·7)
2005–09 18·5(18·0–19·0)
53·8(53·5–54·2)
56·6(56·1–57·1)
9·3(8·7–9·9)
9·6(9·4–9·8)
81·1(80·9–81·4)
60·2(59·3–61·1)
36·4(35·9–37·0)
83·2(82·9–83·5)
47·4(46·7–48·0)
89·1(87·6–90·7)
(Table 4 continues on next page)
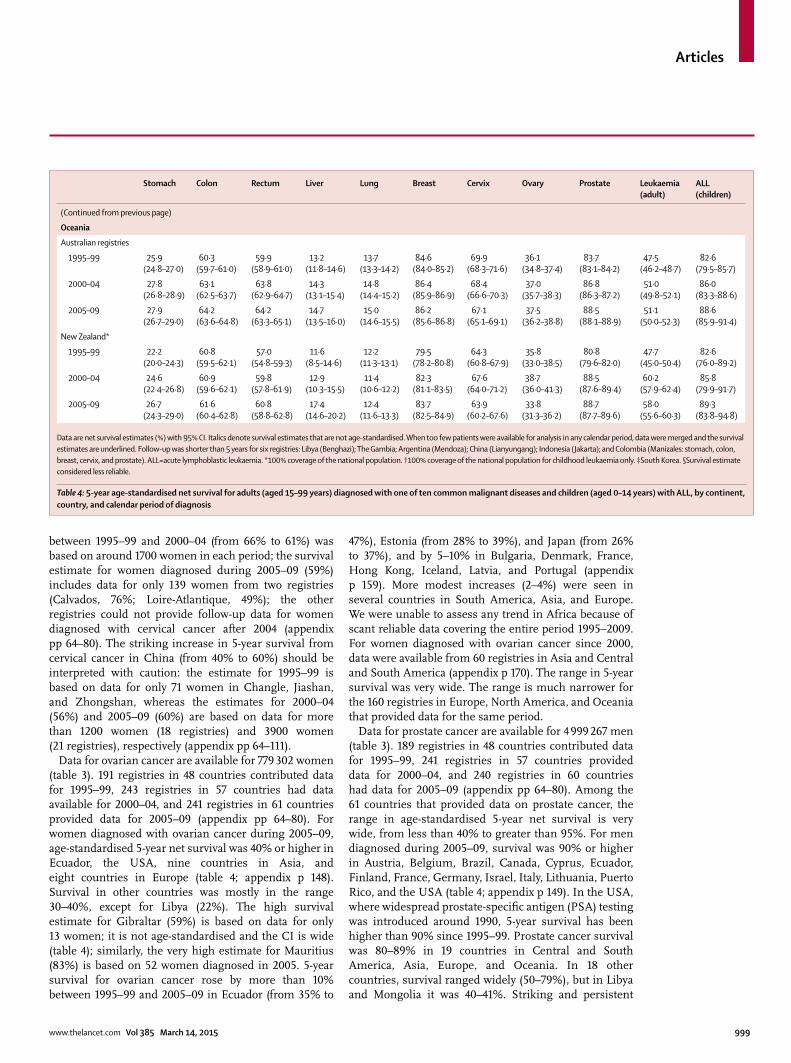
Articles
www.thelancet.com Vol 385 March 14, 2015 999
between 1995–99 and 2000–04 (from 66% to 61%) was based on around 1700 women in each period; the survival estimate for women diagnosed during 2005–09 (59%) includes data for only 139 women from two registries (Calvados, 76%; Loire-Atlantique, 49%); the other registries could not provide follow-up data for women diagnosed with cervical cancer after 2004 (appendix pp 64–80). The striking increase in 5-year survival from cervical cancer in China (from 40% to 60%) should be interpreted with caution: the estimate for 1995–99 is based on data for only 71 women in Changle, Jiashan, and Zhongshan, whereas the estimates for 2000–04 (56%) and 2005–09 (60%) are based on data for more than 1200 women (18 registries) and 3900 women (21 registries), respectively (appendix pp 64–111).
Data for ovarian cancer are available for 779 302 women (table 3). 191 registries in 48 countries contributed data for 1995–99, 243 registries in 57 countries had data available for 2000–04, and 241 registries in 61 countries provided data for 2005–09 (appendix pp 64–80). For women diagnosed with ovarian cancer during 2005–09, age-standardised 5-year net survival was 40% or higher in Ecuador, the USA, nine countries in Asia, and eight countries in Europe (table 4; appendix p 148). Survival in other countries was mostly in the range 30–40%, except for Libya (22%). The high survival estimate for Gibraltar (59%) is based on data for only 13 women; it is not age-standardised and the CI is wide (table 4); similarly, the very high estimate for Mauritius (83%) is based on 52 women diagnosed in 2005. 5-year survival for ovarian cancer rose by more than 10% between 1995–99 and 2005–09 in Ecuador (from 35% to
47%), Estonia (from 28% to 39%), and Japan (from 26% to 37%), and by 5–10% in Bulgaria, Denmark, France, Hong Kong, Iceland, Latvia, and Portugal (appendix p 159). More modest increases (2–4%) were seen in several countries in South America, Asia, and Europe. We were unable to assess any trend in Africa because of scant reliable data covering the entire period 1995–2009. For women diagnosed with ovarian cancer since 2000, data were available from 60 registries in Asia and Central and South America (appendix p 170). The range in 5-year survival was very wide. The range is much narrower for the 160 registries in Europe, North America, and Oceania that provided data for the same period.
Data for prostate cancer are available for 4 999 267 men (table 3). 189 registries in 48 countries contributed data for 1995–99, 241 registries in 57 countries provided data for 2000–04, and 240 registries in 60 countries had data for 2005–09 (appendix pp 64–80). Among the 61 countries that provided data on prostate cancer, the range in age-standardised 5-year net survival is very wide, from less than 40% to greater than 95%. For men diagnosed during 2005–09, survival was 90% or higher in Austria, Belgium, Brazil, Canada, Cyprus, Ecuador, Finland, France, Germany, Israel, Italy, Lithuania, Puerto Rico, and the USA (table 4; appendix p 149). In the USA, where widespread prostate-specifi c antigen (PSA) testing was introduced around 1990, 5-year survival has been higher than 90% since 1995–99. Prostate cancer survival was 80–89% in 19 countries in Central and South America, Asia, Europe, and Oceania. In 18 other countries, survival ranged widely (50–79%), but in Libya and Mongolia it was 40–41%. Striking and persistent
Stomach Colon Rectum Liver Lung Breast Cervix Ovary Prostate Leukaemia(adult)
ALL (children)
(Continued from previous page)
Oceania
Australian registries
1995–99 25·9(24·8–27·0)
60·3(59·7–61·0)
59·9(58·9–61·0)
13·2(11·8–14·6)
13·7(13·3–14·2)
84·6(84·0–85·2)
69·9(68·3–71·6)
36·1(34·8–37·4)
83·7(83·1–84·2)
47·5(46·2–48·7)
82·6(79·5–85·7)
2000–04 27·8(26·8–28·9)
63·1(62·5–63·7)
63·8(62·9–64·7)
14·3(13·1–15·4)
14·8(14·4–15·2)
86·4(85·9–86·9)
68·4(66·6–70·3)
37·0(35·7–38·3)
86·8(86·3–87·2)
51·0(49·8–52·1)
86·0(83·3–88·6)
2005–09 27·9(26·7–29·0)
64·2(63·6–64·8)
64·2(63·3–65·1)
14·7(13·5–16·0)
15·0(14·6–15·5)
86·2(85·6–86·8)
67·1(65·1–69·1)
37·5(36·2–38·8)
88·5(88·1–88·9)
51·1(50·0–52·3)
88·6(85·9–91·4)
New Zealand*
1995–99 22·2(20·0–24·3)
60·8(59·5–62·1)
57·0(54·8–59·3)
11·6(8·5–14·6)
12·2(11·3–13·1)
79·5(78·2–80·8)
64·3(60·8–67·9)
35·8(33·0–38·5)
80·8(79·6–82·0)
47·7(45·0–50·4)
82·6(76·0–89·2)
2000–04 24·6(22·4–26·8)
60·9(59·6–62·1)
59·8(57·8–61·9)
12·9(10·3–15·5)
11·4(10·6–12·2)
82·3(81·1–83·5)
67·6(64·0–71·2)
38·7(36·0–41·3)
88·5(87·6–89·4)
60·2(57·9–62·4)
85·8(79·9–91·7)
2005–09 26·7(24·3–29·0)
61·6(60·4–62·8)
60·8(58·8–62·8)
17·4(14·6–20·2)
12·4(11·6–13·3)
83·7(82·5–84·9)
63·9(60·2–67·6)
33·8(31·3–36·2)
88·7(87·7–89·6)
58·0(55·6–60·3)
89·3(83·8–94·8)
Data are net survival estimates (%) with 95% CI. Italics denote survival estimates that are not age-standardised. When too few patients were available for analysis in any calendar period, data were merged and the survival estimates are underlined. Follow-up was shorter than 5 years for six registries: Libya (Benghazi); The Gambia; Argentina (Mendoza); China (Lianyungang); Indonesia (Jakarta); and Colombia (Manizales: stomach, colon, breast, cervix, and prostate). ALL=acute lymphoblastic leukaemia. *100% coverage of the national population. †100% coverage of the national population for childhood leukaemia only. ‡South Korea. §Survival estimate considered less reliable.
Table 4: 5-year age-standardised net survival for adults (aged 15–99 years) diagnosed with one of ten common malignant diseases and children (aged 0–14 years) with ALL, by continent, country, and calendar period of diagnosis
Articles
1000 www.thelancet.com Vol 385 March 14, 2015
increases in prostate cancer survival were seen in many countries between 1995–99 and 2005–09 (appendix p 160). Survival rose by 10–20% in 22 countries in Central and South America, Asia, and Europe; smaller increases (less than 10%) were seen in 15 countries.
Data for leukaemia in adults are available for 873 588 patients (table 3). 185 registries in 47 countries provided data for 1995–99, 234 registries in 56 countries contributed data for 2000–04, and 232 registries in 60 countries provided data for 2005–09 (appendix pp 64–80). For adults diagnosed with leukaemia during 2005–09, age-standardised 5-year net survival was 50–60% in 21 countries in North America, west Asia, Europe, and Oceania (table 4; appendix p 150). The estimate in Mauritius (57%) is based on 31 patients diagnosed in 2005; it is not age-standardised and has a wide CI. Similarly, the estimate for Cuba (60%) is based on only 97 patients diagnosed during 1998–2006. 5-year net survival from adult leukaemia is generally much lower in the 15 participating Asian countries than in other regions of the world (appendix pp 163–73). With a few exceptions, survival seems to be low in east Asia (eg, from 19% in Japan to 23% in South Korea and Taiwan), high in west Asia (eg, from 33% in Turkey to 53% in Qatar), with a mixed picture in other Asian countries (eg, from 7% in Jordan to 40% in Indonesia). Survival estimates for adult leukaemia from Jordan, India, and Saudi Arabia might be less reliable for international comparison, but the overall pattern of leukaemia survival in Asia is still informative. Survival increases of 10–16% for adult leukaemia were seen in China, Denmark, Germany, Iceland, Latvia, Sweden, and New Zealand. Smaller rises of 5–9% were noted in North America, Israel, Japan, South Korea, and ten European countries. In Malta, 5-year survival fell from 39% in 1995–99 (based on 142 adults) to 19% for 2005–09 (128 adults; appendix p 161). This pattern is surprising, because data quality is very high (appendix pp 54–58) and survival trends for all solid tumours seem to be normal. Smaller declines were seen in several countries, such as Slovakia (from 41% to 37%) and Slovenia (from 44% to 38%).
Data for acute lymphoblastic leukaemia in children are available for 74 343 patients (table 3). 173 registries in 42 countries contributed data for 1995–99, 215 registries in 50 countries provided data for 2000–04, and 213 registries in 53 countries provided data for 2005–09. In Romania (Cluj), data were only available for eight children and survival was not estimated. Of 53 countries, 32 provided data with 100% national population coverage. The geographic range in survival for acute lymphoblastic leukaemia in children was very wide. For patients diagnosed during 2005–09, age-standardised 5-year net survival was 90% or higher in Austria, Belgium, Canada, Germany, and Norway and 80–89% in 21 countries on various continents (table 4; appendix p 151). In many countries, however, 5-year net survival is still lower than 60%, even after adjustment for the very high background
mortality in childhood. Survival was less than 50% in Indonesia, Mongolia, and Lesotho, although these estimates are based on very small numbers. The range of survival estimates for childhood acute lymphoblastic leukaemia in Central and South America (16 registries) and Asia (23 registries) is much lower than the range in North America (48 registries), Europe (83 registries), and Oceania (seven registries; appendix p 173). 5-year survival for childhood acute lymphoblastic leukaemia rose by 10% or more between 1995–99 and 2005–09 in Belarus, Belgium, Bulgaria, China, Colombia, Lithuania, Norway, Portugal, South Korea, Spain, Taiwan, and the UK. The estimate of 11% from China for 1995–99 is based on only 23 children, but the increase from 50% for 2000–04 to 61% for 2005–09 is more reliable. Increases in survival of up to 9% were seen in 16 other countries. 5-year survival in Argentina, Ecuador, and Slovakia was in the range 60–79%, with little or no change over time. Survival seemed to fall in Brazil (from 72% to 66%), Malaysia (from 77% to 69%), and Slovenia (from 83–86% in 1995–2004 to 76% for 2005–09). Survival trends could not be assessed in Africa.
DiscussionWith CONCORD-2, we have initiated worldwide surveillance of trends in cancer survival. In the fi rst CONCORD study,6 comparable estimates of cancer survival worldwide were provided: the study included 1·9 million patients diagnosed with breast, colorectal, or prostate cancer during 1990–94 and followed up to 1999 in 31 countries (panel). CONCORD-2 extends coverage to 25·7 million patients diagnosed with an invasive primary cancer during the 15-year period 1995–2009 in 67 countries. The ten index cancers represent about two-thirds of the overall cancer burden in both low-income and high-income countries.4 Individual patient data provided by 279 population-based cancer registries were prepared with standardised quality-control procedures and subjected to centralised analysis with the latest statistical methods.
The fi ndings do not cover all countries, but they provide at least some population-based cancer survival estimates for 67 countries (26 of low or middle income) that are home to two-thirds of the world’s population, including national data for 40 countries. The estimates are derived from analysis of raw data on the survival of individual cancer patients up to 5 years after diagnosis. Until now, for comparison of global or continental survival, researchers generally needed to interpret scattered reports produced with diverse cancer defi ni tions, quality-control criteria, and survival estimators, for diff erent calendar periods, and age-standardised to diff erent sets of weights.46 More speculative comparisons have been based on modelling of mortality-incidence ratios, sometimes with data from neighbouring regions or countries,47 with all the attendant assumptions.48
Even after adjustment for the wide international variation in levels of mortality from other causes, and with due allowance for variation in quality of data, the
Articles
www.thelancet.com Vol 385 March 14, 2015 1001
global range in 5-year survival from ten cancers in adults and acute lymphoblastic leukaemia in children is very wide. For most cancers, survival in Africa, Asia, and Central and South America is lower, and the range in survival much wider, than in Europe, North America, and Oceania. The wider range is only partly attributable to the fact that not all cancer registries could provide data covering the 15 years from 1995 to 2009; for example, many of the Chinese registries contributed data for 2000–04 but not 2005–09. In North America and Oceania, population coverage was higher than 80% and the same registries generally provided data for the entire period 1995–2009 (fi gure 4; appendix pp 163–73): survival for most cancers was high on a global scale, with a fairly narrow range in estimates between registries.
5-year net survival from stomach cancer is generally in the range 25–30%, but it is very high (50–60%) in Japan, South Korea, and, to a lesser extent, Taiwan. High survival from stomach cancer in Japan,49 South Korea,50 and Taiwan51 is well known, and is likely to be attributable to intensive diagnostic activity, early stage at diagnosis, and radical surgery. Survival varies according to sub-site, morphological type, and stage. Types of cancer with better prognosis might also be more common in Japan and South Korea, but the striking worldwide diff erences in survival suggest important lessons could be learnt from these countries about diagnosis and treatment.
5-year survival has risen for colon and rectal cancers in most developed countries and regions, including North America, Europe, Oceania, and parts of east Asia (South Korea and urban areas in China); increases in breast cancer survival have also been noted in these regions and in parts of Central and South America. These trends are likely to be attributable to earlier diagnosis, reduction in postoperative mortality,52 and more eff ective treatment.53,54 For rectal cancer, preoperative radiotherapy and total mesorectal excision reduce local recurrence and extend survival,55–57 which could account for improvements noted in Canada, Finland, the Netherlands, Norway, Sweden, and the USA, where survival was already high (55–60%) for patients diagnosed in 1995–99 and rose further for those diagnosed during 2005–09 (62–65%). These trends accord with those reported from the Netherlands,58 Scotland, the Nordic countries,59 and elsewhere in Europe.60
Liver and lung cancer remain lethal in both developing and developed countries, with 5-year survival generally lower than 20%, indicating that most patients are still diagnosed when they are inoperable. Primary prevention aimed at reducing tobacco and alcohol consumption, and prevention of chronic hepatitis, will be especially important for these cancers. The very low survival estimate for liver cancer in The Gambia (5%) is based on a sample of only 85 patients diagnosed during 1995–97 who were followed up for less than 5 years, to the end of 1998; it is not age-standardised, but it is unlikely to be far wrong: patients in The Gambia tend to present with very advanced
disease and cirrhosis and are not amenable to surgery.61 Overall completeness of registration is low, but the incidence of liver cancer is comparable with that of other west African populations.62 Data from the national cancer registry for The Gambia, set up in 1986 to support the IARC’s Gambia Hepatitis Intervention Study,63 have been analysed previously,64 but more recent data were unavailable, so we cleaned and analysed them here alongside all other datasets, with permission from IARC.
The global range in 5-year survival from cervical cancer is very wide, from less than 40% to more than 70%. The overall decline in survival from 66% to 61% in France between 1995–99 and 2000–04 was seen in all nine registries (appendix p 105). The decrease might be attributable to removal of less aggressive tumours by more intensive cervical screening for preinvasive lesions.65,66 Survival from cervical cancer in the Nordic countries was stable or rose slightly over the same period.67 By comparison, lower survival in low-income and middle-income countries is striking, since invasive cervical cancer is potentially curable with early detection by screening and appropriate surgery.68
5-year survival from ovarian cancer is generally in the range 30–40% in most parts of the world, but the overall range is much wider. Diversity in international survival might be attributable partly to variations in the proportion of tumours classifi ed as type I (typically early-stage and slow-growing) and type II (typically late-stage and aggressive).69 Diff erences in stage at diagnosis and treatment are also likely to be important.70 Diff erential
Panel: Research in context
Systematic reviewIn the fi rst global comparison of population-based cancer survival (CONCORD),6 wide variations in survival from cancers of the breast (women), colon, rectum, and prostate were reported among 1·9 million adults diagnosed during 1990–94 and followed up to 1999 in 31 countries (16 countries had national coverage). More recent studies have diff ered with respect to geographic and population coverage, calendar period, and analytical methods, and they do not enable worldwide comparison of survival trends.7–9 With CONCORD-2, we have extended coverage to 25·7 million cancer patients diagnosed during the 15-year period 1995–2009 in one of 67 countries (26 of low or middle income), of which 40 countries had national coverage.
InterpretationThe ten index cancers we selected for analysis represent two-thirds of the overall cancer burden in both low-income and high-income countries. 5-year survival from colon, rectal, and breast cancers has increased in most developed countries. Liver and lung cancer remain lethal in both developing and developed countries. Striking increases in prostate cancer survival have occurred in many countries, but trends vary widely. The range in cervical and ovarian cancer survival is very wide, but improvements have been slight. In east Asia, stomach cancer survival is very high, suggesting lessons could be learnt, whereas survival for adult and childhood leukaemia is remarkably low. The global range in survival from precursor-cell acute lymphoblastic leukaemia in children is very wide, suggesting major defi ciencies in the management of what is now a largely curable disease. The fi ndings of our study can be used to assess the extent to which investment in health-care systems is improving their eff ectiveness.
Articles
1002 www.thelancet.com Vol 385 March 14, 2015
classifi cation of borderline and invasive tumours might also contribute. Overall, however, worldwide survival trends show very little improvement between 1995–99 and 2005–09 (appendix p 158). This fi nding accords with the absence of improvement reported from many developed countries.7,9
Striking increases in 5-year survival from prostate cancer have occurred in many countries, but global trends varied widely. Examples include three northern European countries, all with nationwide cancer registration. 5-year survival in Lithuania jumped from 52% for men diagnosed during 1995–99 to 92% for those diagnosed during 2005–09. The rise in Latvia was from 52% to 74%: access to health care in these countries has improved, and opportunistic PSA screening began in 2000.71 In Denmark, survival rose from 46% to 77% over the same period, having been stable at 40% throughout the period 1982–94,72 during which time survival increased rapidly in the other four Nordic countries.73 The Danish Urology Society advised against PSA testing in asymptomatic men in the early 1990s,74 but this advice is now followed less widely. By contrast, survival in North America and Oceania was already very high in the late 1990s, and increases since then have been much smaller. In Africa, we were unable to assess a trend.
Survival from both adult and childhood leukaemia in east Asia is surprisingly low. The low survival for adult leukaemia in Japan, South Korea, and Taiwan is especially surprising, because survival from solid tumours is generally high. Could ethnic or genetic factors play a part? This possibility has been suggested in a recent comparison of survival from chronic lymphocytic leukaemia between Taiwan and the USA.75 Leukaemia survival is also low in China, but haematological malignant diseases have received low priority in cancer control there, with limited access to health insurance and chemotherapy,76 and medical resources in rural areas are poor.77
The global range in 5-year survival from acute lymphoblastic leukaemia in children is very wide, from less than 60% in several countries to 90% or higher in Austria, Belgium, Canada, Germany, and Norway. This fi nding confi rms that major defi ciencies are present in the management of what is now a largely curable disease.78 Failure to start or complete treatment, usually for fi nancial reasons, is an important contributor to the survival defi cit in developing countries.79
Standardised quality controls were applied system-atically to all datasets. Detailed discussions were held with every registry to identify and correct any errors or artifacts in the data. Many registries resubmitted their data after correction, which greatly improved data quality and comparability. The overall proportion of eligible tumours excluded from analysis was low (3·6%), but it was much higher for some registries and varied widely between cancers. For some populations, mostly in low-income and middle-income countries,
these exclusions will have biased survival estimates upwards. Thus, the proportion of cancer registrations from a death certifi cate only was typically higher in countries where survival is low. This leads to exclusion from analysis of a group of patients who tend to have low survival,80 leading to overestimation of the level of survival in that population. This bias would tend to reduce international diff erences.
Various indications suggest that the data submitted by some registries were not exhaustive, either because there were fewer cancer patients than expected or because the full range of haemopoietic malignant diseases was not represented in some of the leukaemia datasets. The smaller number of cancer registrations in Poland for 1995–99 refl ects a national strike of doctors in 1997, but we have little reason to suppose this type of incompleteness would bias survival estimates.
Pathological confi rmation of diagnosis was available for more than 90% of cancers included in the analyses (98·5% for childhood acute lymphoblastic leukaemia), and less than 4% of malignant diseases were assigned to a non-specifi c morphology code. Nevertheless, consider-able variation was noted, and pathological evidence was much less complete for some populations in low-income and middle-income countries (table 2; appendix pp 3–63).
Several registries reported high proportions of intestinal-type adenocarcinoma in the colon and rectum: this morphological type was originally described (in 1965) for carcinoma of the stomach81 and is included in ICD-O-3 (M8144). A similar issue arose with cholangiocarcinoma (M8160) coded as arising in the liver (ICD-O-3 site code C22.0) rather than the intrahepatic bile duct (C22.1). If we were told that pathologists frequently use these terms for malignant disease of the large bowel or liver, respectively, we included the patients in our analyses.
The distribution of cancers within an organ by anatomic sub-site or morphological type can diff er between populations, so any diff erences in survival by sub-site or morphological features could aff ect comparisons of overall survival. We will address the eff ect on survival of these diff erences in biology with more detailed analyses, particularly for cancers of the stomach, lung, and ovary. Leukaemia comprises a broad and heterogeneous group of diseases. We excluded chronic myeloid leukaemia; survival for other major groups will be investigated in more detail.
Premalignant and small malignant lesions can be detected more frequently in countries with mass screening programmes or intensive early diagnostic activity, particularly for cancers of the breast, cervix, colon, rectum, and prostate. Diff erences in tumour stage at diagnosis can contribute to international variations in overall survival between low-income countries.8 Wide diff erences in tumour stage at diagnosis and stage-specifi c survival have also been recorded among high-income countries.59,70,82–84 High-resolution studies of tumour stage at diagnosis, treatment, and adherence to guidelines have helped account for international
Articles
www.thelancet.com Vol 385 March 14, 2015 1003
diff erences in survival.55,85–87 The comparability of data gathered routinely on cancer stage remains poor in developed countries,88 even though the TNM classifi cation89 has been available for more than 60 years. We will examine in more detail the extent to which available data on tumour stage can explain the very wide global diff erences in survival reported by us here.
We imputed the day of diagnosis in data from registries that only record (or were only allowed to submit) the month and year of diagnosis. A few of those registries also submitted survival time in days; our imputation achieved similar results. The eff ect on short-term survival of minor variations in the date of diagnosis is generally small90 and cannot account for the very wide international diff erences in 5-year survival.91
Loss to follow-up of cancer patients in registries using active follow-up varied widely, but most registries also used several passive follow-up techniques. Diff erences between the databases used for passive follow-up can aff ect survival estimates.92,93 When information for all deaths is incomplete or inaccessible from administrative systems, active follow-up by the registry augments completeness of ascertainment of vital status, particularly in low-income and middle-income countries.94 Some registries did not have the resources to follow up all their patients for vital status. Others could not provide follow-up data for at least 5 years after diagnosis for all their patients; for those registries, we have presented survival at 3 or 4 years if possible.
If age-specifi c (and thus age-standardised) survival estimates could not be produced, non-standardised estimates for all ages combined were presented. In some analyses, data had to be pooled across two or three calendar periods, restricting presentation of survival trends. For some countries or regions with very small populations, no survival estimate could be made at all for less common cancers, because very few patients were available for analysis.
We used a rigorously enforced protocol, with centralised data evaluation and analysis to enhance comparability, but international survival comparisons should still be interpreted with caution. Data quality varies widely:95,96 we provided detailed indices of data quality at country and registry level (table 2; appendix pp 3–63), which should be taken into account. Not all countries could provide data for 2005–09. Also, the range in size between the smallest and largest populations included in this report is greater than 1000-fold, both for registries with national coverage (eg, Gibraltar includes 29 000 people and the UK covers 61·8 million people) and those with regional coverage (eg, Nunavut in Canada represents 33 000 people whereas California in the USA includes 37·0 million people). These diff erences are refl ected in the numbers of patients and the width of CIs around survival estimates. However, lack of precision because of small numbers does not necessarily imply that the survival estimates are incorrect or unreliable: high
quality and completeness of data and follow-up can be easier to achieve in small or island populations than in large urban populations.
For robust international comparison of cancer survival, diff erences and trends in background mortality according to age, sex, region, and ethnic origin must be taken into account. In the populations covered by these data, the range in background mortality was very wide, measured by life expectancy at birth (46–87 years in females and 45–81 years in males), and by the change in life expectancy between 1995 and 2009 (appendix p 175), and in other metrics such as the probability of death in middle age (data not shown). We created more than 6500 complete life tables of background mortality to capture these diff erences.
For children with cancer, usual practice is to present the observed probability of survival, including all causes of death,97 rather than net survival, because mortality from other causes is typically very low, at least in developed countries. Here, however, we have estimated net survival for children with acute lymphoblastic leukaemia because, among the 53 countries for which data could be analysed, mortality from other causes in childhood varied very widely. In 2002, infant mortality ranged from less than one death per 1000 livebirths to more than 120 deaths per 1000 livebirths (in some African populations); under-5 mortality ranged from less than one death per 1000 livebirths to more than 200 deaths per 1000 livebirths; and the overall probability of death before age 15 years ranged from one death per 1000 livebirths to more than 250 per 1000 livebirths (data not shown). For a worldwide comparison of survival from childhood acute lymphoblastic leukaemia, it seemed especially important to eliminate the eff ect of this wide variation in background mortality between countries and over time.
Net survival was age-standardised in most estimates for both adults and children. Age standardisation minimises the risk of reporting international diff erences or trends in cancer survival that are attributable solely to international diff erences or changes over time in the age distribution of cancer patients.42
We included both fi rst and higher order cancers in our analyses. The eff ect of multiple primary cancers on overall survival is typically only 1–2%,98 but the proportion of such cancers in a given population is aff ected by the set of rules used to defi ne them99 and by the longevity of the registry.100 Some participating registries began operation in the 1950s whereas others only started after 2000. In long-established registries, 10% or more of patients might be registered with more than one cancer.101 This proportion is lower in newer registries, because a second cancer will typically be registered as the patient’s fi rst. Restriction to fi rst primaries can also aff ect international comparison of survival trends, because the number of long-term survivors at high risk of another cancer is increasing, particularly in high-income countries.102 Exclusion of second cancers would, therefore, tend to bias international survival comparisons in favour of wealthier countries.103 The rules for defi ning multiple
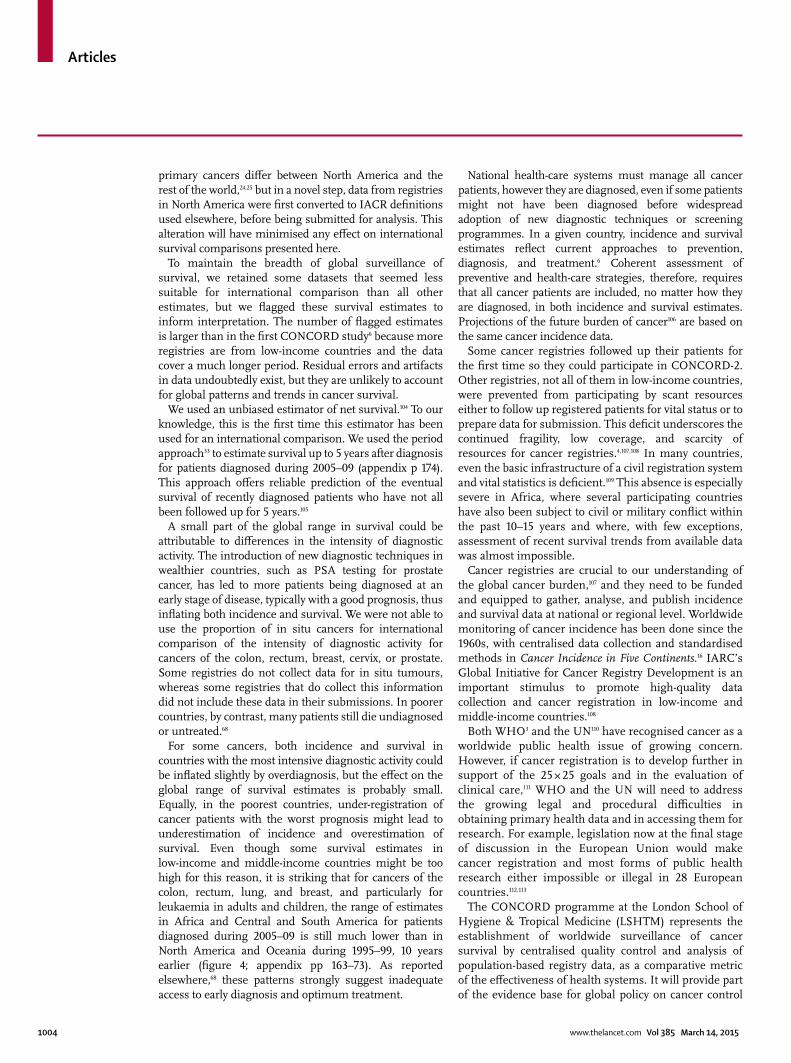
Articles
1004 www.thelancet.com Vol 385 March 14, 2015
primary cancers diff er between North America and the rest of the world,24,25 but in a novel step, data from registries in North America were fi rst converted to IACR defi nitions used elsewhere, before being submitted for analysis. This alteration will have minimised any eff ect on international survival comparisons presented here.
To maintain the breadth of global surveillance of survival, we retained some datasets that seemed less suitable for international comparison than all other estimates, but we fl agged these survival estimates to inform interpretation. The number of fl agged estimates is larger than in the fi rst CONCORD study6 because more registries are from low-income countries and the data cover a much longer period. Residual errors and artifacts in data undoubtedly exist, but they are unlikely to account for global patterns and trends in cancer survival.
We used an unbiased estimator of net survival.104 To our knowledge, this is the fi rst time this estimator has been used for an international comparison. We used the period approach33 to estimate survival up to 5 years after diagnosis for patients diagnosed during 2005–09 (appendix p 174). This approach off ers reliable prediction of the eventual survival of recently diagnosed patients who have not all been followed up for 5 years.105
A small part of the global range in survival could be attributable to diff erences in the intensity of diagnostic activity. The introduction of new diagnostic techniques in wealthier countries, such as PSA testing for prostate cancer, has led to more patients being diagnosed at an early stage of disease, typically with a good prognosis, thus infl ating both incidence and survival. We were not able to use the proportion of in situ cancers for international comparison of the intensity of diagnostic activity for cancers of the colon, rectum, breast, cervix, or prostate. Some registries do not collect data for in situ tumours, whereas some registries that do collect this information did not include these data in their submissions. In poorer countries, by contrast, many patients still die undiagnosed or untreated.68
For some cancers, both incidence and survival in countries with the most intensive diagnostic activity could be infl ated slightly by overdiagnosis, but the eff ect on the global range of survival estimates is probably small. Equally, in the poorest countries, under-registration of cancer patients with the worst prognosis might lead to underestimation of incidence and overestimation of survival. Even though some survival estimates in low-income and middle-income countries might be too high for this reason, it is striking that for cancers of the colon, rectum, lung, and breast, and particularly for leukaemia in adults and children, the range of estimates in Africa and Central and South America for patients diagnosed during 2005–09 is still much lower than in North America and Oceania during 1995–99, 10 years earlier (fi gure 4; appendix pp 163–73). As reported elsewhere,68 these patterns strongly suggest inadequate access to early diagnosis and optimum treatment.
National health-care systems must manage all cancer patients, however they are diagnosed, even if some patients might not have been diagnosed before widespread adoption of new diagnostic techniques or screening programmes. In a given country, incidence and survival estimates refl ect current approaches to prevention, diagnosis, and treatment.6 Coherent assessment of preventive and health-care strategies, therefore, requires that all cancer patients are included, no matter how they are diagnosed, in both incidence and survival estimates. Projections of the future burden of cancer106 are based on the same cancer incidence data.
Some cancer registries followed up their patients for the fi rst time so they could participate in CONCORD-2. Other registries, not all of them in low-income countries, were prevented from participating by scant resources either to follow up registered patients for vital status or to prepare data for submission. This defi cit underscores the continued fragility, low coverage, and scarcity of resources for cancer registries.4,107,108 In many countries, even the basic infrastructure of a civil registration system and vital statistics is defi cient.109 This absence is especially severe in Africa, where several participating countries have also been subject to civil or military confl ict within the past 10–15 years and where, with few exceptions, assessment of recent survival trends from available data was almost impossible.
Cancer registries are crucial to our understanding of the global cancer burden,107 and they need to be funded and equipped to gather, analyse, and publish incidence and survival data at national or regional level. Worldwide monitoring of cancer incidence has been done since the 1960s, with centralised data collection and standardised methods in Cancer Incidence in Five Continents.16 IARC’s Global Initiative for Cancer Registry Development is an important stimulus to promote high-quality data collection and cancer registration in low-income and middle-income countries.108
Both WHO3 and the UN110 have recognised cancer as a worldwide public health issue of growing concern. However, if cancer registration is to develop further in support of the 25 × 25 goals and in the evaluation of clinical care,111 WHO and the UN will need to address the growing legal and procedural diffi culties in obtaining primary health data and in accessing them for research. For example, legislation now at the fi nal stage of discussion in the European Union would make cancer registration and most forms of public health research either impossible or illegal in 28 European countries.112,113
The CONCORD programme at the London School of Hygiene & Tropical Medicine (LSHTM) represents the establishment of worldwide surveillance of cancer survival by centralised quality control and analysis of population-based registry data, as a comparative metric of the eff ectiveness of health systems. It will provide part of the evidence base for global policy on cancer control
Articles
www.thelancet.com Vol 385 March 14, 2015 1005
and should contribute to the overarching goal of the World Cancer Declaration 201314 and, more broadly, to the “revolution in metrics for global health”.114
At a national level, cancer outcomes are aff ected by the organisation and funding of access to health services.115 Improvements in cancer survival have been reported after major political and economic changes in Estonia,116 Lithuania,117 and Germany.118 In turn, low survival has aff ected the development of cancer strategy in countries such as Algeria,119 Brazil,120,121 Mexico,122 China, India, and Russia,123 and in many wealthier countries.4
Some of the conclusions drawn from these analyses are similar to those for patients diagnosed 20–25 years ago.6 The fi ndings of this study can be used to assess the extent to which investment in health-care systems is improving their eff ectiveness. We will examine survival trends and diff erentials in relation to health economic indicators to assess why improvements in survival are so slow and unequal.
Most of the wide global range in cancer survival is probably attributable to inequity in access to optimum diagnostic and treatment services,6 both in rich124–126 and poor127,128 countries. Availability of linear accelerators varies more than ten-fold worldwide, from one machine per 500 000 population to less than one per fi ve million people, and more than 30 countries in Africa and Asia have no radiotherapy service at all.129 Cancer survival in Europe has been associated with gross national product, total national expenditure on health and investment in health technology (eg, CT scanners, radiotherapy units),130 and with suboptimum allocation of available resources.86 The global economic cost of cancer from premature death and lost productivity was estimated at US$895 billion in 2008, excluding direct treatment costs estimated at $300 billion.131 Even in wealthy countries, the rapidly growing costs of cancer treatment have raised concerns about the growing use of tests, imaging, and treatments that are expensive but have marginal value.132 At the same time, closing the rich–poor divide in access to cancer treatment has been described as “an equity imperative”.133,134 The fi ndings reported here confi rm the global divide in outcomes.
The fi rst international study of cancer survival was published 50 years ago.5 In the same year, Alexander Langmuir, founder of the US Centers for Disease Control and Prevention’s epidemic intelligence service, commented on national outbreaks of infectious disease: “good surveillance does not necessarily ensure the making of the right decisions, but it reduces the chances of wrong ones”.135 His view applies today to non-communicable diseases such as cancer, for which long-term surveillance of incidence, mortality, and survival is increasingly important. Survival is a key metric of overall progress in cancer control.4 Continuous worldwide surveillance of cancer survival should become both an indispensable source of information for cancer patients and researchers and a stimulus for politicians to improve health policy and health-care systems.
ContributorsCA, HKW, RM-G, CS, GAS, BR, HS, TCT and MPC drafted the protocol; CA, HKW, GAS, W-QC, OJO, MJS, HY, TM, MB-L, TCT, and MPC obtained statutory and ethics approvals; HKW, FB, CJJ, RM-G, CS, GAS, W-QC, OJO, MJS, HY, TM, MB-L, HS, and TCT contributed to data acquisition; CA, DS, FB, MPC and BR prepared the life tables; CA, HC, RH, DS, X-SW, FB, JVA, AB, BR, and MPC had access to all raw data; CA, HC, RH, DS, X-SW, FB, JVA, CJJ, AB, and MPC did the data preparation, quality control and analyses, and checked the results; CA and MPC drafted the report. All authors contributed to writing the fi nal report and approved the version to be published. All members of the CONCORD Working Group had access to the results at all steps of data preparation, quality control, and analyses, and contributed to interpretation of the fi ndings.
CONCORD Working GroupAfrica—Algeria: S Bouzbid (Registre du Cancer d’Annaba); M Hamdi-Chérif*, Z Zaidi (Registre du Cancer de Sétif); Gambia: E Bah, R Swaminathan (National Cancer Registry); Lesotho: SH Nortje, CD Stefan (Children’s Haematology Oncology Clinics - Lesotho); Libya: MM El Mistiri (Benghazi Cancer Registry); Mali: S Bayo, B Malle (Kankou Moussa University); Mauritius: SS Manraj, R Sewpaul-Sungkur (Mauritius Cancer Registry); Nigeria: A Fabowale, OJ Ogunbiyi* (Ibadan Cancer Registry); South Africa: D Bradshaw, NIM Somdyala (Eastern Cape Province Cancer Registry); Sudan: M Abdel-Rahman (University of Khartoum); Tunisia: L Jaidane, M Mokni (Registre du Cancer du Centre Tunisien).America (Central and South)—Argentina: I Kumcher, F Moreno (National Childhood Cancer Registry); MS González, E Laura (Registro Regional de Tumores del Sur de la Provincia de Buenos Aires); FV Pugh, ME Torrent (Chubut Cancer Registry); B Carballo Quintero, R Fita (Registro de Tumores de Córdoba); D Garcilazo, PL Giacciani (Entre Rios Cancer Registry); MC Diumenjo, WD Laspada (Registro Provincial de Tumores de Mendoza); MA Green, MF Lanza (Registro de Cáncer de Santa Fe); SG Ibañez (Tierra del Fuego Cancer Registry); Brazil: CA Lima, E Lobo (Registro de Câncer de Base Populacional de Aracaju); C Daniel, C Scandiuzzi (Cancer Registry of Distrito Federal); PCF De Souza (Registro de Câncer de Base Populacional de Cuiabá); K Del Pino, C Laporte (Registro de Curitiba); MP Curado, JC de Oliveira (Registro de Goiânia); CLA Veneziano, DB Veneziano (Registro de Câncer de Base Populacional de Jahu); TS Alexandre, AS Verdugo (Registro de Câncer de São Paulo); S Koifman†* (National School of Public Health); G Azevedo e Silva* (University of Rio de Janeiro); Chile: JC Galaz, JA Moya (Registro Poblacional de Cáncer Region de Antofagasta); DA Herrmann, AM Jofre (Registro Poblacional Region de Los Rios); Colombia: CJ Uribe (Registro Poblacional de Cáncer Area Metropolitana de Bucaramanga); LE Bravo (Cali Cancer Registry); G Lopez Guarnizo (Registro Poblacional de Cáncer Manizales); DM Jurado, MC Yepes (Registro Poblacional de Cáncer del Municipio de Pasto); Cuba: YH Galán, P Torres (Registro Nacional de Cáncer de Cuba); Ecuador: F Martínez-Reyes (Cuenca Tumor Registry); L Jaramillo, R Quinto (Guayaquil Cancer Registry); P Cueva, J Yépez (Quito Cancer Registry); Puerto Rico: CR Torres-Cintrón, G Tortolero-Luna (Puerto Rico Central Cancer Registry); Uruguay: R Alonso, E Barrios (Registro Nacional de Cáncer).America (North)—Canada: C Russell, L Shack (Alberta Cancer Registry); AJ Coldman, RR Woods (British Columbia Cancer Registry); G Noonan, D Turner* (Manitoba Cancer Registry); E Kumar, B Zhang (New Brunswick Provincial Cancer Registry); FR McCrate, S Ryan (Newfoundland Cancer Registry); H Hannah (Northwest Territories Cancer Registry); RAD Dewar, M MacIntyre (Nova Scotia Surveillance and Epidemiology Unit); A Lalany, M Ruta (Nunavut Department of Health and Social Services); L Marrett, DE Nishri* (Ontario Cancer Registry); KA Vriends (Prince Edward Island Cancer Registry); C Bertrand, R Louchini (Registre Québécois du Cancer); KI Robb, H Stuart-Panko (Saskatchewan Cancer Registry); S Demers, S Wright (Yukon Government); USA: J George, X Shen (Alabama Statewide Cancer Registry); JT Brockhouse, DK O’Brien (Alaska Cancer Registry); L Almon, JL Young* (Metropolitan Atlanta Registry); J Bates (California State Cancer Registry); R Rycroft (Colorado Central Cancer Registry); L Mueller, C Phillips (Connecticut Tumor Registry); H Ryan, J Walrath (Delaware Cancer Registry); A Schwartz, F Vigneau (Metropolitan Detroit
Articles
1006 www.thelancet.com Vol 385 March 14, 2015
Cancer Surveillance System); JA MacKinnon, B Wohler (Florida Cancer Data System); R Bayakly, KC Ward (Georgia Comprehensive Cancer Registry); K Davidson-Allen, S Glaser (Greater Bay Area Cancer Registry); D West (Cancer Registry of Greater California); MD Green, BY Hernandez (Hawaii Tumor Registry); CJ Johnson (Cancer Data Registry of Idaho); CF Lynch, KM McKeen (State Health Registry of Iowa); B Huang, TC Tucker* (Kentucky Cancer Registry); D Deapen, L Liu (Los Angeles Cancer Surveillance Program); MC Hsieh, XC Wu (Louisiana Tumor Registry); K Stern (Maryland Cancer Registry); ST Gershman, RC Knowlton (Massachusetts Cancer Registry); G Copeland, G Spivak (Michigan State Cancer Surveillance Program); DB Rogers (Mississippi Cancer Registry); D Lemons, LL Williamson (Montana Central Tumor Registry); M Hood, H Jerry (Nebraska Cancer Registry); GM Hosain, JR Rees (New Hampshire State Cancer Registry); KS Pawlish, A Stroup (New Jersey State Cancer Registry); C Key, C Wiggins (New Mexico Tumor Registry); AR Kahn, MJ Schymura (New York State Cancer Registry); G Leung, C Rao (North Carolina Central Cancer Registry); L Giljahn, B Warther (Ohio Cancer Incidence Surveillance System); A Pate (Oklahoma Central Cancer Registry); M Patil, DK Shipley (Oregon State Cancer Registry); M Esterly, RD Otto (Pennsylvania Cancer Registry); JP Fulton, DL Rousseau (Rhode Island Cancer Registry); TA Janes, SM Schwartz (Seattle Cancer Surveillance System); SW Bolick, DM Hurley (South Carolina Central Cancer Registry); RA Tenney, MA Whiteside (Tennessee Cancer Registry); A Hakenewerth, MA Williams (Texas Cancer Registry); K Herget, C Sweeney (Utah Cancer Registry); J Martin, S Wang (Virginia Cancer Registry); MG Harrelson, MB Keitheri Cheteri (Washington State Cancer Registry); AG Hudson (West Virginia Cancer Registry); R Borchers, L Stephenson (Wisconsin Department of Health Services); JR Espinoza (Wyoming Cancer Surveillance Program); HK Weir* (Centers for Disease Control and Prevention); BK Edwards* (National Cancer Institute).Asia—China: N Wang, L Yang (Beijing Cancer Registry); JS Chen (Changle City Cancer Registry); GH Song (Cixian Cancer Registry); XP Gu (Dafeng County Center for Disease Control and Prevention); P Zhang (Dalian Centers for Disease Prevention and Control); HM Ge (Donghai County Center for Disease Prevention and Control); DL Zhao (Feicheng County); JH Zhang (Ganyu Center for Disease Prevention and Control); FD Zhu (Guanyun Cancer Registry); JG Tang (Haimen Cancer Registry); Y Shen (Haining City Cancer Registry); J Wang (Jianhu Cancer Registry); QL Li (Jiashan County Cancer Registry); SP Yang (Jintan Cancer Registry); JM Dong, WW Li (Lianyungang Center for Disease Prevention and Control); LP Cheng (Henan Province Central Cancer Registry); JG Chen (Qidong County Cancer Registry); QH Huang (Sihui Cancer Registry); SQ Huang (Taixing Cancer Registry); GP Guo (Cancer Institute of Yangzhong City); K Wei (Zhongshan City Cancer Registry); WQ Chen*, H Zeng (National Central Cancer Registry China); Cyprus: AV Demetriou, P Pavlou (Cyprus Cancer Registry); Hong Kong: WK Mang, KC Ngan (Hong Kong Cancer Registry); India: R Swaminathan (Chennai Cancer Registry); AC Kataki, M Krishnatreya (Guwahati Cancer Registry); PA Jayalekshmi, P Sebastian (Karunagappally Cancer Registry); SD Sapkota, Y Verma (Population Based Cancer Registry, Sikkim); A Nandakumar* (National Centre for Disease Informatics and Research; National Cancer Registry Programme); Indonesia: E Suzanna (Jakarta Cancer Registry); Israel: L Keinan-Boker, BG Silverman (Israel National Cancer Registry); Japan: H Ito (Aichi Cancer Registry); M Hattori (Fukui Cancer Registry); H Sugiyama, M Utada (Hiroshima Prefecture Cancer Registry); K Katayama, S Natsui (Kanagawa Cancer Registry); T Matsuda*, Y Nishino (Miyagi Prefectural Cancer Registry); T Koike (Niigata Prefecture Cancer Registry); A Ioka, K Nakata (Osaka Cancer Registry); K Kosa (Saga Prefectural Cancer Registry); I Oki (Tochigi Prefectural Cancer Registry); A Shibata (Yamagata Cancer Registry); Jordan: O Nimri (Jordan National Cancer Registry); Malaysia: A Ab Manan, N Bhoo Pathy (Penang Cancer Registry); Mongolia: C Ochir, S Tuvshingerel (Cancer Registry of Mongolia); Qatar: AM Al Khater, MM El Mistiri (Qatar Cancer Registry); Saudi Arabia: H Al-Eid (Saudi National Cancer Registry); South Korea: KW Jung, YJ Won (Korea Central Cancer Registry); S Park (University of Yonsei); Taiwan: CJ Chiang, MS Lai (Taiwan Cancer Registry); Thailand: K Suwanrungruang, S Wiangnon (Khon Kaen Provincial Registry); K Daoprasert, D Pongnikorn (Lampang Cancer Registry); SL Geater, H Sriplung (Songkhla Cancer Registry);
Turkey: S Eser, CI Yakut (Izmir Cancer Registry).Europe—Austria: M Hackl, N Zielonke (Austrian National Cancer Registry); H Mühlböck, W Oberaigner (Tyrol Cancer Registry); M Piñeros* (IAEA, PACT Programme); Belarus: AA Zborovskaya (Belarus Childhood Cancer Subregistry); Belgium: K Henau, L Van Eycken (Belgian Cancer Registry); Bulgaria: N Dimitrova, Z Valerianova (Bulgarian National Cancer Registry); Croatia: M Šekerija, A Znaor (Croatian National Cancer Registry); Czech Republic: M Zvolský (Czech National Cancer Registry); Denmark: G Engholm, H Storm* (Danish Cancer Society); Estonia: T Aareleid, M Mägi (Estonian Cancer Registry); Finland: N Malila, K Seppä (Cancer Society of Finland); France: M Velten (Bas-Rhin General Cancer Registry); E Cornet, X Troussard (Registre Régional des Hémopathies Malignes de Basse Normandie); AM Bouvier, J Faivre (Burgundy Digestive Cancer Registry); AV Guizard (Calvados General Cancer Registry); V Bouvier, G Launoy (Calvados Digestive Cancer Registry); P Arveux (Côte-d’Or Gynaecologic Cancer Registry); M Maynadié, M Mounier (Côte-d’Or Haematopoietic Malignancies Registry); AS Woronoff (Doubs and Belfort Territory General Cancer Registry); M Daoulas (Finistère Cancer Registry); J Clavel (National Registry of Childhood Haematopoietic Malignancies); S Le Guyader-Peyrou, A Monnereau (Gironde Haematopoietic Malignancies Registry); B Trétarre (Hérault General Cancer Registry); M Colonna (Isère General Cancer Registry); S Delacour-Billon, F Molinié (Loire-Atlantique-Vendée Cancer Registry); S Bara, D Degré (Manche General Cancer Registry); O Ganry, B Lapôtre-Ledoux (Somme General Cancer Registry); P Grosclaude (Tarn General Cancer Registry); JM Lutz* (Grenoble); A Belot, J Estève (Hospices Civils de Lyon); D Forman* (International Agency for Research on Cancer); F Sassi (Organisation for Economic Co-operation and Development); Germany: R Stabenow (Common Cancer Registry of the Federal States); A Eberle (Bremen Cancer Registry); A Nennecke (Hamburg Cancer Registry); J Kieschke, E Sirri (Epidemiological Cancer Registry of Lower Saxony); H Kajueter (North Rhine Westphalia Cancer Registry); K Emrich, SR Zeissig (Rhineland Palatinate Cancer Registry); B Holleczek (Saarland Cancer Registry); N Eisemann, A Katalinic (Schleswig-Holstein Cancer Registry); H Brenner (German Cancer Research Center); Gibraltar: RA Asquez, V Kumar (Gibraltar Cancer Registry); Iceland: EJ Ólafsdóttir, L Tryggvadóttir (Icelandic Cancer Registry); Ireland: H Comber, PM Walsh (National Cancer Registry); H Sundseth* (European Institute of Women’s Health); Italy: T Dal Cappello, G Mazzoleni (Registro Tumori Alto Adige); A Giacomin (Registro Tumori Biella); M Castaing, S Sciacca (Integrated Cancer Registry of Catania-Messina-Siracusa-Enna); A Sutera (Registro Tumori Catanzaro); M Corti, G Gola (Registro Tumori della Provincia di Como); S Ferretti (Registro Tumori della Provincia di Ferrara); D Serraino, A Zucchetto (Registro Tumori del Friuli Venezia Giulia); R Lillini, M Vercelli (Registro Tumori Regione Liguria); S Busco, F Pannozzo (Registro Tumori della Provincia di Latina); S Vitarelli (Registro Tumori della Provincia di Macerata); P Ricci (Registro Tumori Mantova); V Pascucci (Registro Tumori Marche Childhood); M Autelitano (Registro Tumori Milano); C Cirilli, M Federico (Registro Tumori della Provincia di Modena); M Fusco, MF Vitale (Registro Tumori della ASL Napoli 3 sud); M Usala (Nuoro Cancer Registry); R Cusimano, F Vitale (Registro Tumori Palermo); M Michiara, P Sgargi (Registro Tumori della Provincia di Parma); C Sacerdote (Piedmont Childhood Cancer Registry); R Tumino (Registro Tumori della Provincia di Ragusa); L Mangone (Registro Tumori Reggio Emilia); F Falcini (Registro Tumori della Romagna); L Cremone (Registro Tumori Salerno); M Budroni, R Cesaraccio (Registro Tumori della Provincia di Sassari); A Madeddu, F Tisano (Registro Tumori Siracusa); S Maspero, R Tessandori (Registro Tumori della Provincia di Sondrio); G Candela, T Scuderi (Registro Tumori Trapani); S Piff er (Registro Tumori Trento); S Rosso, R Zanetti (Registro Tumori Piemonte Città di Torino); A Caldarella, E Crocetti (Registro Tumori della Regione Toscana); F La Rosa, F Stracci (Registro Tumori Umbro di Popolazione); P Contiero, G Tagliabue (Registro Tumori Lombardia, Provincia di Varese); P Zambon (Registro Tumori Veneto); P Baili, F Berrino*, G Gatta, M Sant* (National Cancer Institute); R Capocaccia*, R De Angelis, A Verdecchia* (National Centre for Epidemiology); Latvia: E Liepina, A Maurina (Latvian Cancer Registry); Lithuania: G Smailyte (Lithuanian Cancer Registry); Malta: D Agius, N Calleja (Malta National Cancer Registry); Netherlands: S Siesling (Comprehensive Cancer Centre of the Netherlands); Norway:
Articles
www.thelancet.com Vol 385 March 14, 2015 1007
S Larønningen, B Møller (The Cancer Registry of Norway); Poland: A Dyzmann-Sroka, M Trojanowski (Greater Poland Cancer Registry); S Góźdż, R Mężyk (Cancer Registry of Kielce); M Grądalska-Lampart, AU Radziszewska (Podkarpackie Cancer Registry); J Didkowska, U Wojciechowska (National Cancer Registry); J Błaszczyk, K Kępska (Lower Silesian Cancer Registry); M Bielska-Lasota (National Institute of Public Health); Portugal: G Forjaz, RA Rego (Registo Oncológico Regional dos Açores); J Bastos (Registo Oncológico Regional do Centro); L Antunes, MJ Bento (Registo Oncológico Regional do Norte); AM da Costa Miranda, A Mayer-da-Silva (Registo Oncólogico Regional do Sul); Romania: D Coza, AI Todescu (Cancer Institute I. Chiricuta); Russia: A Krasilnikov, M Valkov (Arkhangelsk Regional Cancer Registry); Slovakia: J Adamcik, C Safaei Diba (National Cancer Registry of Slovakia); Slovenia: M Primic Žakelj, T Žagar (Cancer Registry of Republic of Slovenia); J Stare (University of Ljubljana); Spain: E Almar, A Mateos (Registro de Cáncer de Albacete); MV Argüelles, JR Quirós (Registro de Tumores del Principado de Asturias); J Bidaurrazaga, N Larrañaga (Basque Country Cancer Registry); JM Díaz García, AI Marcos (Registro de Cáncer de Cuenca); R Marcos-Gragera, ML Vilardell Gil (Registre de Càncer de Girona); E Molina, MJ Sánchez (Registro de Cáncer de Granada); M Ramos Montserrat (Mallorca Cancer Registry); MD Chirlaque, C Navarro (Murcia Cancer Registry); E Ardanaz (Registro de Cáncer de Navarra); S Felipe Garcia, R Peris-Bonet (Registro Nacional de Tumores Infantiles); J Galceran (Tarragona Cancer Registry); Sweden: S Khan, M Lambe (Swedish Cancer Registry); Switzerland: B Camey (Registre Fribourgeois des Tumeurs); C Bouchardy, M Usel (Geneva Cancer Registry); SM Ess, C Hermann (Cancer Registry Grisons and Glarus; Cancer Registry of St Gallen-Appenzell); FG Levi, M Maspoli-Conconi (Registre Neuchâtelois des Tumeurs); CE Kuehni, VR Mitter (Swiss Childhood Cancer Registry); A Bordoni, A Spitale (Registro Tumori Cantone Ticino); A Chiolero, I Konzelmann (Registre Valaisan des Tumeurs); SI Dehler, RI Laue (Krebsregister Kanton Zürich); United Kingdom: D Meechan, J Poole (East Midlands); D Greenberg, J Rashbass (East of England); E Davies, K Linklater (London); E Morris (North East); T Moran (North West); F Bannon, A Gavin (Northern Ireland Cancer Registry); RJ Black, DH Brewster (Scottish Cancer Registry); M Roche (South East); S McPhail, J Verne (South West); M Murphy, C Stiller* (National Registry of Childhood Tumours); DW Huws, C White (Welsh Cancer Intelligence & Surveillance Unit); G Lawrence (West Midlands); C Brook, J Wilkinson (Yorkshire and the Humber); P Finan (Leeds General Infi rmary); JV Ahn, C Allemani*, A Bonaventure, H Carreira, MP Coleman*, R Harewood, B Rachet*, N Sanz, D Spika, XS Wang (London School of Hygiene & Tropical Medicine); R Stephens* (National Cancer Research Institute, London); J Butler (Royal Marsden Hospital); M Peake (University of Leicester).Oceania—Australia: E Chalker, L Newman (Australian Capital Territory Cancer Registry); D Baker, MJ Soeberg (NSW Central Cancer Registry); C Scott (Queensland Cancer Registry); BC Stokes, A Venn (Tasmanian Cancer Registry); H Farrugia, GG Giles (Victorian Cancer Registry); T Threlfall (Western Australian Cancer Registry); D Currow*, H You (Cancer Institute NSW); New Zealand: C Lewis, SA Miles (New Zealand Cancer Registry).*CONCORD Steering Committee. †Sergio Koifman passed away on May 21, 2014.
Declaration of interestsWe declare no competing interests.
AcknowledgmentsThis work was funded by the Canadian Partnership Against Cancer, Cancer Focus Northern Ireland, Cancer Institute New South Wales, Cancer Research UK (C1336/A16148), US Centers for Disease Control and Prevention (CDC; 12FED03123, ACO12036), Swiss Re, Swiss Cancer Research foundation, Swiss Cancer League, and the University of Kentucky (3049024672-12-568). We thank cancer registry personnel who have recorded diagnoses and outcomes for every cancer patient in their jurisdiction. We thank colleagues who translated the protocol into diff erent languages: Gustavo Hernandez Suarez (Colombian National Cancer Institute); Marion Piñeros (International Atomic Energy Agency, Austria); Natalia Sanz (LSHTM); Yannan Yuan (Beijing University Cancer Hospital); Ning Wang (Beijing Cancer Registry); Xiao-Si Wang (LSHTM);
Ruoran Li (LSHTM); Gulnar Azevedo e Silva (University of Rio de Janeiro); Renata Abrahão (LSHTM); Helena Carreira (LSHTM); and Manuela Quaresma (LSHTM). We thank colleagues at LSHTM who gave help and advice: Natalia Sanz (CONCORD programme manager), Camille Maringe, Andy Sloggett, Sarah Walters, Laura Woods, Manuela Quaresma, Hakim Miah, Yuki Alencar, and Tanisha Lewis. We also thank: Chris Johnson (Cancer Data Registry of Idaho), Amy Kahn (New York State Cancer Registry), Ron Dewar (Cancer Care Nova Scotia), and Jennifer Stevens (US National Cancer Institute) for the program to convert NAACCR data structures to meet the CONCORD protocol; Angela Mariotto (US National Cancer Institute) for US mortality data; and Giovanni Luca Lo Magno (Caltanissetta, Italy) for the program to convert Stata output into Word fi les. Finally, we thank Gabriela Abriata (Instituto Nacional del Cáncer, Argentina); Magnus Lindelow (World Bank, Brazil); Heather Bryant (Canadian Partnership Against Cancer); Brendan Hanley (Yukon Government); Carlotta Buzzoni (Registro Tumori della Regione Toscana and AIRTum, Italy); Andrea Micheli (Italian National Cancer Institute); Roberto Zanetti (International Association of Cancer Registries); Santa Pildava (Latvian Cancer Registry); Vladimir Stevanovic (New Zealand Ministry of Health); Jose Maria Martin-Moreno (University of Valencia); Diego Salmerón (Murcia Cancer Registry); Alojz Peterle (European Parliament); Louise Abela (LSHTM); Liam Crosby (LSHTM); Daniel Ryan (Swiss Re); and Marcus Plescia (CDC). CONCORD has been endorsed by the following agencies: Asociación Española contra el Cáncer (Madrid, Spain); Association of European Cancer Leagues (Brussels, Belgium); British Embassy in Algiers (Algeria); Canadian Association of Provincial Cancer Agencies (Toronto, Canada); Canadian Council of Cancer Registries (Toronto, Canada); Danish Cancer Society (Copenhagen, Denmark); European CanCer Organisation (Brussels, Belgium); European Institute for Women’s Health (Dublin, Ireland); Institut National du Cancer (Paris, France); IARC (Lyon, France); International Atomic Energy Agency (Vienna, Austria); International Network for Cancer Treatment and Research (Brussels, Belgium); Israel Centre for Disease Control (Tel-Hashomer, Israel); Jolanta Kwaśniewska’s Foundation (Warsaw, Poland); Members of the European Parliament Against Cancer (Brussels, Belgium); Center for Global Health (National Cancer Institute, USA); Consumer Liaison Group (National Institute for Health Research, UK); National Institute for Cancer Epidemiology and Registration (Zurich, Switzerland); NAACCR (Chicago, USA); Organisation for Economic Co-operation and Development (Paris, France); Union for International Cancer Control (Geneva, Switzerland); WHO Regional Offi ce for Europe (Copenhagen, Denmark); and the World Bank (Washington, DC, USA). The fi ndings, interpretation, and conclusions in this report are those of the authors and do not necessarily represent the opinions or offi cial position of the funding sources or of the British Columbia Cancer Agency, Cancer Care Ontario, Maryland Cancer Registry, New Hampshire Department of Health and Human Services, New York City Department of Health and Mental Hygiene, Pennsylvania Department of Health, Ohio Department of Health, West Virginia Cancer Registry, the CDC, or the Health Directorate of the Australian Capital Territory.
References 1 Vineis P, Wild CP. Global cancer patterns: causes and prevention.
Lancet 2014; 383: 549–57. 2 Cavalli F. An appeal to world leaders: stop cancer now. Lancet 2013;
381: 425–26. 3 WHO. Decisions and list of resolutions of the 65th World Health
Assembly: prevention and control of noncommunicable diseases—follow-up to the High-level Meeting of the United Nations General Assembly on the prevention and control of non-communicable diseases (A65/DIV/3). Geneva: World Health Organization, 2012.
4 Coleman MP. Cancer survival: global surveillance will stimulate health policy and improve equity. Lancet 2014; 383: 564–73.
5 Cutler SJ, ed. International symposium on end results of cancer therapy (NCI monograph 15). Bethesda: National Cancer Institute, 1964.
6 Coleman MP, Quaresma M, Berrino F, et al, and the CONCORD Working Group. Cancer survival in fi ve continents: a worldwide population-based study (CONCORD). Lancet Oncol 2008; 9: 730–56.
Articles
1008 www.thelancet.com Vol 385 March 14, 2015
7 De Angelis R, Sant M, Coleman MP, et al, and the EUROCARE-5 Working Group. Cancer survival in Europe 1999–2007 by country and age: results of EUROCARE-5—a population-based study. Lancet Oncol 2014; 15: 23–34.
8 Sankaranarayanan R, Swaminathan R, Brenner H, et al. Cancer survival in Africa, Asia, and Central America: a population-based study. Lancet Oncol 2010; 11: 165–73.
9 Coleman MP, Forman D, Bryant H, et al, and the ICBP Module 1 Working Group. Cancer survival in Australia, Canada, Denmark, Norway, Sweden, and the UK, 1995–2007 (the International Cancer Benchmarking Partnership): an analysis of population-based cancer registry data. Lancet 2011; 377: 127–38.
10 Department of Health. Improving outcomes: a strategy for cancer. London: Department of Health, 2011.
11 Rachet B, Maringe C, Nur U, et al. Population-based cancer survival trends in England and Wales up to 2007: an assessment of the NHS cancer plan for England. Lancet Oncol 2009; 10: 351–69.
12 Rachet B, Ellis L, Maringe C, et al. Socioeconomic inequalities in cancer survival in England after the NHS Cancer Plan. Br J Cancer 2010; 103: 446–53.
13 National Audit Offi ce. Delivering the cancer reform strategy (HC 568, session 2010–2011). London: Stationery Offi ce, 2010.
14 UICC. World cancer declaration 2013. http://www.uicc.org/world-cancer-declaration (accessed May 1, 2014).
15 Curado MP, Edwards BK, Shin HR, et al, eds. Cancer incidence in fi ve continents, vol IX (IARC scientifi c publications no 160). Lyon: International Agency for Research on Cancer, 2007.
16 IARC. CI5: cancer incidence in fi ve continents. 2010. http://ci5.iarc.fr (accessed May 1, 2014).
17 UN. Composition of macro geographical (continental) regions, geographical sub-regions, and selected economic and other groupings. Oct 31, 2013. http://unstats.un.org/unsd/methods/m49/m49regin.htm (accessed May 1, 2014).
18 Hijmans R. GADM database of global administrative areas (version 2.0). January, 2012. http://www.gadm.org/ (accessed Oct 1, 2013).
19 Fritz AG, Percy C, Jack A, et al, eds. International Classifi cation of Diseases for Oncology (ICD-O), 3rd edn. Geneva: World Health Organization, 2000.
20 Sant M, Allemani C, Tereanu C, et al. Incidence of hematologic malignancies in Europe by morphologic subtype: results of the HAEMACARE project. Blood 2010; 116: 3724–34.
21 Sant M, Karjalainen-Lindsberg ML, Maynadié M, et al, and the HAEMACARE Working Group. Manual for coding and reporting haematological malignancies. Tumori 2010; 96: i-A32.
22 Swerdlow SH, Campo E, Harris NL, et al. WHO classifi cation of tumours of haematopoietic and lymphoid tissues, 4th edn (WHO classifi cation of tumours, vol 2). Geneva: World Health Organisation, 2008.
23 Woods LM, Rachet B, Ellis L, Coleman MP. Full dates (day, month, year) should be used in population-based cancer survival studies. Int J Cancer 2012; 131: E1120–24.
24 Surveillance Epidemiology and End Results program. Multiple primary and histology coding rules. Jan 1, 2007. http://seer.cancer.gov/tools/mphrules/2007_mphrules_manual_08242012.pdf (accessed Aug 18, 2014).
25 European Network of Cancer Registries. Recommendations for coding multiple primaries. July 31, 2011. http://www.encr.eu/images/docs/recommendations/MPrules_july2004.pdf (accessed Nov 14, 2014).
26 Capocaccia R, Gatta G, Roazzi P, et al. The EUROCARE-3 database: methodology of data collection, standardisation, quality control and statistical analysis. Ann Oncol 2003; 14 (suppl 5): 14–27.
27 Li R, Abela L, Moore J, et al. Control of data quality for population-based cancer survival analysis. Cancer Epidemiol 2014; 38: 314–20.
28 De Angelis R, Francisci S, Baili P, et al. The EUROCARE-4 database on cancer survival in Europe: data standardisation, quality control and methods of statistical analysis. Eur J Cancer 2009; 45 (suppl 6): 909–30.
29 Ferlay J, Burkhard C, Whelan S, Parkin DM. Check and conversions programs for cancer registries: IARC/IACR tools for cancer registries. Lyon: International Association for Research on Cancer, 2005.
30 Lakhani SR, Ellis IO, Schnitt SJ, Tan PH, van de Vijver MJ, eds. WHO classifi cation of tumours of the breast, 4th edn. Geneva: World Health Organization, 2012.
31 Kurman RJ, Carcangiu ML, Herrington CS, Young RH, eds. WHO classifi cation of tumours of female reproductive organs, 4th edn. Geneva: World Health Organization, 2014.
32 Bosman FT, Carneiro F, Hruban RH, Theise ND, eds. WHO classifi cation of tumours of the digestive system, 4th edn. Geneva: World Health Organization, 2010.
33 Brenner H, Gefeller O. An alternative approach to monitoring cancer patient survival. Cancer 1996; 78: 2004–10.
34 Pohar Perme M, Henderson R, Stare J. An approach to estimation in relative survival regression. Biostatistics 2009; 10: 136–46.
35 Clerc-Urmès I, Grzebyk M, Hédelin G. Net survival estimation with stns. Stata J 2014; 14: 87–102.
36 StataCorp. STATA statistical software, version 13. College Station, TX: Stata Corporation, 2013.
37 University of California, Max Planck Institute for Demographic Research. Human mortality database. http://www.mortality.org (accessed May 1, 2014).
38 Micheli A, Baili P, Mugno E, et al. Life expectancy and cancer survival in the EUROCARE-3 cancer registry areas. Ann Oncol 2003; 14 (suppl 5): 28–40.
39 Ewbank DC, Gomez de Leon JC, Stoto MA. A reducible four-parameter system of model life tables. Popul Stud (Camb) 1983; 37: 105–29.
40 UN Population Division. World population prospects: the 2012 revision—vol I, comprehensive tables (ST/ESA/SER.A/336). New York: UN Department of Economic and Social Aff airs, 2013.
41 Elandt-Johnson RC, Johnson NL. Survival models and data analysis (Wiley series in probability and mathematical statistics). Indianapolis: John Wiley & Sons, 1980.
42 Corazziari I, Quinn MJ, Capocaccia R. Standard cancer patient population for age standardising survival ratios. Eur J Cancer 2004; 40: 2307–16.
43 Stiller CA, Bunch KJ. Trends in survival for childhood cancer in Britain diagnosed 1971–85. Br J Cancer 1990; 62: 806–15.
44 Greenwood M. The natural duration of cancer (report on public health and medical subjects no 33). London: Stationery Offi ce, 1926.
45 UN Population Division. Mortality and the demographic impact of HIV/AIDS. In: World population prospects: the 2004 revision. New York: UN Department of Economic and Social Aff airs, 2005: pp 54–82.
46 Youlden DR, Cramb SM, Dunn NA, Muller JM, Pyke CM, Baade PD. The descriptive epidemiology of female breast cancer: an international comparison of screening, incidence, survival and mortality. Cancer Epidemiol 2012; 36: 237–48.
47 Jönsson B, Wilking N. A global comparison regarding patient access to cancer drugs. Ann Oncol 2007; 18 (suppl 3): 1–74.
48 Ellis L, Woods LM, Estève J, Eloranta S, Coleman MP, Rachet B. Cancer incidence, survival and mortality: explaining the concepts. Int J Cancer 2014; 135: 1774–82.
49 Matsuda T, Ajiki W, Marugame T, Ioka A, Tsukuma H, Sobue T. Population-based survival of cancer patients diagnosed between 1993 and 1999 in Japan: a chronological and international comparative study. Jpn J Clin Oncol 2011; 41: 40–51.
50 National Cancer Center. Cancer facts and fi gures 2010 in the Republic of Korea. Seoul: Ministry of Health and Welfare, 2010.
51 Wang CS, Hsieh CC, Chao TC, et al. Resectable gastric cancer: operative mortality and survival analysis. Chang Gung Med J 2002; 25: 216–27.
52 Mitry E, Bouvier AM, Estève J, Faivre J. Benefi t of operative mortality reduction on colorectal cancer survival. Br J Surg 2002; 89: 1557–62.
53 Chawla N, Butler EN, Lund J, Warren JL, Harlan LC, Yabroff KR. Patterns of colorectal cancer care in Europe, Australia, and New Zealand. J Natl Cancer Inst Monogr 2013; 46: 36–61.
54 Innos K, Soplepmann J, Suuroja T, Melnik P, Aareleid T. Survival for colon and rectal cancer in Estonia: role of staging and treatment. Acta Oncol 2012; 51: 521–27.
55 Allemani C, Rachet B, Weir HK, et al. Colorectal cancer survival in the USA and Europe: a CONCORD high-resolution study. BMJ Open 2013; 3: e003055.
56 Kapiteijn E, Marijnen CA, Nagtegaal ID, et al. Preoperative radiotherapy combined with total mesorectal excision for resectable rectal cancer. N Engl J Med 2001; 345: 638–46.
Articles
www.thelancet.com Vol 385 March 14, 2015 1009
57 Mitry E, Bouvier AM, Estève J, Faivre J. Improvement in colorectal cancer survival: a population-based study. Eur J Cancer 2005; 41: 2297–303.
58 Elferink MA, van Steenbergen LN, Krijnen P, et al. Marked improvements in survival of patients with rectal cancer in the Netherlands following changes in therapy, 1989-2006. Eur J Cancer 2010; 46: 1421–29.
59 Folkesson J, Engholm G, Ehrnrooth E, et al. Rectal cancer survival in the Nordic countries and Scotland. Int J Cancer 2009; 125: 2406–12.
60 Brenner H, Bouvier AM, Foschi R, et al. Progress in colorectal cancer survival in Europe from the late 1980s to the early 21st century: the EUROCARE study. Int J Cancer 2012; 131: 1649–58.
61 Umoh NJ, Lesi OA, Mendy M, et al. Aetiological diff erences in demographical, clinical and pathological characteristics of hepatocellular carcinoma in The Gambia. Liver Int 2011; 31: 215–21.
62 Shimakawa Y, Bah E, Wild CP, Hall AJ. Evaluation of data quality at the Gambia national cancer registry. Int J Cancer 2013; 132: 658–65.
63 Viviani S, Carrieri P, Bah E, et al. 20 years into the Gambia Hepatitis Intervention Study: assessment of initial hypotheses and prospects for evaluation of protective eff ectiveness against liver cancer. Cancer Epidemiol Biomarkers Prev 2008; 17: 3216–23.
64 Sankaranarayanan R, Black RJ, Parkin DM, eds. Cancer survival in developing countries (IARC scientifi c publications no 145). Lyon: International Agency for Research on Cancer, 1998.
65 Bossard N, Velten M, Remontet L, et al. Survival of cancer patients in France: a population-based study from the Association of French Cancer Registries (FRANCIM). Eur J Cancer 2007; 43: 149–60.
66 Gatta G, Capocaccia R, Hakulinen T, et al. Variations in survival for invasive cervical cancer among European women, 1978–89. Cancer Causes Control 1999; 10: 575–81.
67 Klint A, Tryggvadottir L, Bray F, et al. Trends in the survival of patients diagnosed with cancer in female genital organs in the Nordic countries 1964–2003 followed up to the end of 2006. Acta Oncol 2010; 49: 632–43.
68 Farmer P, Frenk J, Knaul FM, et al. Expansion of cancer care and control in countries of low and middle income: a call to action. Lancet 2010; 376: 1186–93.
69 Kurman RJ, Shih IM. The origin and pathogenesis of epithelial ovarian cancer: a proposed unifying theory. Am J Surg Pathol 2010; 34: 433–43.
70 Maringe C, Walters S, Butler J, et al. Stage at diagnosis and ovarian cancer survival: evidence from the International Cancer Benchmarking Partnership. Gynecol Oncol 2012; 127: 75–82.
71 Mitenbergs U, Taube M, Misins J, et al. Latvia: health system review 2012. Health Sys Trans 2012; 14: 1–191.
72 Tretli S, Engeland A, Haldorsen T, et al. Prostate cancer: look to Denmark? J Natl Cancer Inst 1996; 88: 128.
73 Coleman MP, Gatta G, Verdecchia A, et al. EUROCARE-3 summary: cancer survival in Europe at the end of the 20th century. Ann Oncol 2003; 14 (suppl 5): 128–49.
74 Brasso K, Iversen P. Prostatic cancer 2006: status and new challenges. Ugeskr Læger 2006; 168: 1243 (in Danish).
75 Wu SJ, Chiang CJ, Lin CT, Tien HF, Lai MS. Improving but inferior survival in patients with chronic lymphocytic leukemia in Taiwan: a population-based study, 1990–2004. PLoS One 2013; 8: e62930.
76 Chen X-C, Chen X-Z. Epidemiological diff erences in haematological malignancies between Europe and China. Lancet Oncol 2014; 15: e471–72.
77 Zeng H, Zheng R, Guo Y, et al. Cancer survival in China, 2003–2005: a population-based study Int J Cancer 2014; published online Oct 3. http://dx.doi.org/10.1002/ijc.29227.
78 Pui CH, Evans WE. A 50-year journey to cure childhood acute lymphoblastic leukemia. Semin Hematol 2013; 50: 185–96.
79 Mostert S, Arora RS, Arreola M, et al. Abandonment of treatment for childhood cancer: position statement of a SIOP PODC Working Group. Lancet Oncol 2011; 12: 719–20.
80 Berrino F, Estève J, Coleman MP. Basic issues in the estimation and comparison of cancer patient survival. In: Berrino F, Sant M, Verdecchia A, Capocaccia R, Hakulinen T, Estève J, eds. Survival of cancer patients in Europe: the EUROCARE study (IARC scientifi c publications no 132). Lyon: International Agency for Research on Cancer, 1995: pp 1–14.
81 Lauren P. The two histological main types of gastric carcinoma: diff use and so-called intestinal-type carcinoma—an attempt at a histo-clinical classifi cation. Acta Pathol Microbiol Scand 1965; 64: 31–49.
82 Maringe C, Walters S, Rachet B, et al. Stage at diagnosis and colorectal cancer survival in six high-income countries: a population-based study of patients diagnosed during 2000–7. Acta Oncol 2013; 52: 919–32.
83 Walters S, Maringe C, Butler J, et al. Breast cancer survival and stage at diagnosis in Australia, Canada, Denmark, Norway, Sweden and the UK, 2000–2007: a population-based study. Br J Cancer 2013; 108: 1195–208.
84 Walters S, Maringe C, Coleman MP, et al. Lung cancer survival and stage at diagnosis in Australia, Canada, Denmark, Norway, Sweden and the United Kingdom: a population-based study, 2004–2007. Thorax 2013; 68: 551–64.
85 Allemani C, Sant M, Weir HK, et al. Breast cancer survival in the US and Europe: a CONCORD high-resolution study. Int J Cancer 2013; 132: 1170–81.
86 Allemani C, Storm H, Voogd AC, et al. Variation in ‘standard care’ for breast cancer across Europe: a EUROCARE-3 high resolution study. Eur J Cancer 2010; 46: 1528–36.
87 Minicozzi P, Bouvier AM, Faivre J, Sant M, on behalf of the study working group. Management of rectal cancers in relation to treatment guidelines: a population-based study comparing Italian and French patients. Dig Liver Dis 2014; 46: 645–51.
88 Walters S, Maringe C, Butler J, Brierley JD, Rachet B, Coleman MP. Comparability of stage data in cancer registries in six countries: lessons from the International Cancer Benchmarking Partnership. Int J Cancer 2013; 132: 676–85.
89 Sobin LH, Gospodarowicz M, Wittekind C, eds. TNM classifi cation of malignant tumours, 7th edn. New York: John Wiley & Sons, 2009.
90 Dickman PW, Hakulinen T. The accuracy of index dates and calculation of survival time from cancer registry data. J Epidemiol Biostat 1997; 2: 87–94.
91 Rutherford MJ, Møller H, Lambert PC. A comprehensive assessment of the impact of errors in the cancer registration process on 1- and 5-year relative survival estimates. Br J Cancer 2013; 108: 691–98.
92 Johnson CJ, Weir HK, Fink AK, et al. The impact of National Death Index linkages on population-based cancer survival rates in the United States. Cancer Epidemiol 2013; 37: 20–28.
93 Johnson CJ, Weir HK, Yin D, Niu X. The impact of patient follow-up on population-based survival rates. J Registry Manage 2010; 37: 86–103.
94 Swaminathan R. Lack of active follow-up of cancer patients in Chennai, India: implications for population-based survival estimates. Bull World Health Organ 2008; 86: 509–15.
95 Bray F, Parkin DM. Evaluation of data quality in the cancer registry: principles and methods—part I, comparability, validity and timeliness. Eur J Cancer 2009; 45: 747–55.
96 Parkin DM, Bray F. Evaluation of data quality in the cancer registry: principles and methods—part II, completeness. Eur J Cancer 2009; 45: 756–64.
97 Gatta G, Botta L, Rossi S, et al, and the EUROCARE Working Group. Childhood cancer survival in Europe 1999–2007: results of EUROCARE-5—a population-based study. Lancet Oncol 2014; 15: 35–47.
98 Ellison LF. Measuring the eff ect of including multiple cancers in survival analyses using data from the Canadian Cancer Registry. Cancer Epidemiol 2010; 34: 550–55.
99 Weir HK, Johnson CJ, Thompson TD. The eff ect of multiple primary rules on population-based cancer survival. Cancer Causes Control 2013; 24: 1231–42.
100 Rosso S, De Angelis R, Ciccolallo L, et al. Multiple tumours in survival estimates. Eur J Cancer 2009; 45 (suppl 6): 1080–94.
101 Curtis RE, Freedman DM, Ron E, et al. New malignancies among cancer survivors: SEER cancer registries 1973–2000 (NIH publication no 05-3302). Bethesda: National Cancer Institute, 2006.
102 Mariotto AB, Rowland JH, Ries LA, Scoppa S, Feuer EJ. Multiple cancer prevalence: a growing challenge in long-term survivorship. Cancer Epidemiol Biomarkers Prev 2007; 16: 566–71.
103 Brenner H, Hakulinen T. Patients with previous cancer should not be excluded in international comparative cancer survival studies. Int J Cancer 2007; 121: 2274–78.
Articles
1010 www.thelancet.com Vol 385 March 14, 2015
104 Danieli C, Remontet L, Bossard N, Roche L, Belot A. Estimating net survival: the importance of allowing for informative censoring. Stat Med 2012; 31: 775–86.
105 Brenner H, Gefeller O, Hakulinen T. Period analysis for ‘up-to-date’ cancer survival data: theory, empirical evaluation, computational realisation and applications. Eur J Cancer 2004; 40: 326–35.
106 Bray F, Jemal A, Grey N, Ferlay J, Forman D. Global cancer transitions according to the Human Development Index (2008–2030): a population-based study. Lancet Oncol 2012; 13: 790–801.
107 Parkin DM. The evolution of the population-based cancer registry. Nat Rev Cancer 2006; 6: 603–12.
108 Bray F, Znaor A, Cueva P, et al. Planning and developing population-based cancer registration in low- and middle-income settings (IARC technical publication no 43). Lyon: International Agency for Research on Cancer, 2014.
109 Setel PW, Macfarlane SB, Szreter S, et al, on behalf of the Monitoring of Vital Events (MoVE) writing group. A scandal of invisibility: making everyone count by counting everyone. Lancet 2007; 370: 1569–77.
110 United Nations. Political declaration of the high-level meeting of the general assembly on the prevention and control of non-communicable diseases (A/RES/66/2). Jan 24, 2012. http://www.who.int/nmh/events/un_ncd_summit2011/political_declaration_en.pdf?ua=1 (accessed May 1, 2014).
111 Sankila R, Black R, Coebergh JWW, et al. Evaluation of clinical care by cancer registries. Lyon: IARC Press, 2003.
112 Andersen MR, Storm HH, on behalf of the Eurocourse Work Package 2 Group. Cancer registration, public health and the reform of the European data protection framework: abandoning or improving European public health research? Eur J Cancer 2013; published online Oct 10. http://dx.doi.org/10.1016/j.ejca.2013.09.005.
113 Casali PG. Risks of the new EU data protection regulation: an ESMO position paper endorsed by the European oncology community. Ann Oncol 2014; 25: 1458–61.
114 Horton R. Offl ine: the third revolution in global health. Lancet 2014; 383: 1620.
115 Karanikolos M, Ellis L, Coleman MP, McKee M. Health systems performance and cancer outcomes. J Natl Cancer Inst Monogr 2013; 46: 7–12.
116 Aareleid T, Brenner H. Trends in cancer patient survival in Estonia before and after the transition from a Soviet Republic to an open-market economy. Int J Cancer 2002; 102: 45–50.
117 Krilaviciute A, Smailyte G, Brenner H, Gondos A. Cancer survival in Lithuania after the restoration of independence: rapid improvements, but persisting major gaps. Acta Oncol 2014; 53: 1238–44.
118 Jansen L, Gondos A, Eberle A, et al. Cancer survival in Eastern and Western Germany after the fall of the iron curtain. Eur J Epidemiol 2012; 27: 689–93.
119 Beniaiche K. La défi cience de notre système de santé est à l’origine du taux de survie si bas. Nov 30, 2012. http://www.elwatan.dz/actualite/la-defi cience-de-notre-systeme-de-sante-est-a-l-origine-du-taux-de-survie-si-bas-30-11-2012-194147_109.php (accessed Jan 5, 2013).
120 Schmidt MI, Duncan BB, Azevedo e Silva G, et al. Chronic non-communicable diseases in Brazil: burden and current challenges. Lancet 2011; 377: 1949–61.
121 Ministério da Saúde. Plano de ações estratégicas para o enfrentamento de doenças crônicas não-transmissíveis (DCNT) no Brasil 2011–2022. Brasília: Ministério da Saúde, 2011.
122 Pérez-Cuevas R, Doubova SV, Zapata-Tarres M, et al. Scaling up cancer care for children without medical insurance in developing countries: the case of Mexico. Pediatr Blood Cancer 2013; 60: 196–203.
123 Goss PE, Strasser-Weippl K, Lee-Bychkovsky BL, et al. Challenges to eff ective cancer control in China, India, and Russia. Lancet Oncol 2014; 15: 489–538.
124 Tomatis L. Inequalities in survival from cancer. Tumori 1997; 83: 505–07.
125 Berrino F, De Angelis R, Sant M, et al, and the EUROCARE Working group. Survival for eight major cancers and all cancers combined for European adults diagnosed in 1995–99: results of the EUROCARE-4 study. Lancet Oncol 2007; 8: 773–83.
126 Organisation for Economic Co-operation and Development. Cancer care: assuring quality to improve survival. Paris: OECD, 2013.
127 Gondos A, Brenner H, Wabinga H, Parkin DM. Cancer survival in Kampala, Uganda. Br J Cancer 2005; 92: 1808–12.
128 Gondos A, Chokunonga E, Brenner H, et al. Cancer survival in a southern African urban population. Int J Cancer 2004; 112: 860–64.
129 Samiei M. Challenges of making radiotherapy accessible in developing countries. In: Magrath I, ed. Cancer care in emerging health systems. Brussels: International Network for Cancer Treatment and Research, 2013: pp 87–96.
130 Gatta G, Trama A, Capocaccia R. Variations in cancer survival and patterns of care across Europe: roles of wealth and health-care organization. J Natl Cancer Inst Monogr 2013; 46: 79–87.
131 Sullivan R, Peppercorn J, Sikora K, et al. Delivering aff ordable cancer care in high-income countries. Lancet Oncol 2011; 12: 933–80.
132 Kelly RJ, Smith TJ. Delivering maximum clinical benefi t at an aff ordable price: engaging stakeholders in cancer care. Lancet Oncol 2014; 15: e112–18.
133 Knaul FM, Frenk J, Shulman LN. Closing the cancer divide: a blueprint to expand access in low and middle income countries. Boston: Harvard Global Equity Initiative, 2011.
134 Knaul FM, Gralow J, Atun R, Bhadelia A. Closing the cancer divide: an equity imperative. Boston: Harvard University Press, 2011.
135 Langmuir AD. The surveillance of communicable diseases of national importance. N Engl J Med 1963; 268: 182–92.