Embed Size (px)
Citation preview
www.ierjournal.org International Engineering Research Journal (IERJ) Special Issue 2 Page 2093-2100, 2015, ISSN 2395-1621
© 2015, IERJ All Rights Reserved Page 1
ISSN 2395-1621
Evaluate and Improve Torsional
Stiffness of BIW
Using FEA and Validate Results with
Test
Sushant S. Dinde
Mechanical Department, Pune University
ABSTRACT
ARTICLE INFO
In a vehicle design, global body torsional stiffness is one of the important design
parameter which affects ride & handling performance of ground vehicles [2]. Also, in a
vehicle it’s important that front and rear suspension act in right way relative to each
other & this behavior of suspension systems are driven by body torsional stiffness.
Apart from vehicle dynamics performance, torsional stiffness plays an important role
for improving the structural capabilities of a vehicle body. Hence, it becomes important
to evaluate the torsional stiffness performance of a BIW (body in white) [3].
Current industrial methods for evaluating torsional stiffness are having several
downsides like high cost for test setups [2, 3], more time consumption for test setup
preparation which leads in delay of programs. Recent technique like finite element
analysis helps to evaluate car body torsional stiffness & also helps to improve torsional
stiffness if any shortfall of target by performing several iterations using FEA in shorter
time.The objective of this project is to evaluate the torsional Stiffness of Body-In-White
[BIW] in initial design phase using FEA methodology & validate FEA results with
Physical test [1, 2].
In the initial design phase, body doesn’t meet torsional stiffness target because of
immature design CAD data. Hence, this project also aims to improve torsional stiffness
by identifying susceptible areas in body & without adding significant weight in body,
using finite element analysis technique. However, it’s important to validate final FEA
results with Physical test to gain confidence about FEA technique.
Keywords— Torsional stiffness, BIW, CAE, Physical Testing
Article History
Received :18th
November
2015
Received in revised form :
19th
November 2015
Accepted : 21st
November ,
2015
Published online :
22nd
November 2015
I. INTRODUCTION
In a vehicle, Body in white (BIW) [3] is major constitute of
which main role is to hold & support the other subsystems
like powertrain, suspension system, closures systems like
door, bonnet, tailgate, exhaust system & so many. „Body in
White‟ is referring one of important term in design phase of
vehicle & mainly consist of all sheet metal parts welded
together without painting. In short, BIW refers to assembly
of sheet metal parts without any trim parts. This major
portion of vehicle is having significant role in vehicle ride &
handling performance [2] & so many other design
performances. This ride & handling performance is driven
by stiffness of body which can be described as a resistance
to deflection. Based on deflection of body, stiffness is
categorized in bending stiffness & torsional stiffness.
„Torsional stiffness‟ of body in white can be defined as
the resistance offered by body to twist because of
asymmetric load. It is essential to have a stiff body which
acts a better rigid structure for other subsystems. Stiffer
BIW improves design performance like it gives better
resistant to noise, vibration & also plays major role in
vehicle dynamics to act front & rear suspension in right way
[2]. Hence, it is important in designing of vehicle to
evaluate stiffness of BIW which undergoes for asymmetric
loading condition & causing torsion of body. It is must to
www.ierjournal.org International Engineering Research Journal (IERJ) Special Issue 2 Page 2093-2100, 2015, ISSN 2395-1621
© 2015, IERJ All Rights Reserved Page 2
compare this torsional stiffness of BIW against generic
target which are decided based on benchmarking of other
vehicle‟s BIW & decided at the start of any program.
BIW is complicated structure & it become difficult to
evaluate torsional stiffness performance analytically.
Currently, in an automotive field, computer aided
engineering (CAE) methods are increasingly used to predict
design performance [1]. This paper includes the evaluation
of torsional stiffness of a body in white using Finite element
analysis (FEA) techniques & compares it against generic
target decided by benchmarking. Since CAD data of BIW
provided by designer is immature in its initial design phase
of program. Hence, this paper also covers improvement of
torsional stiffness by identifying weaknesses in structure if
any shortfall of target, by performing different iterations in
CAE. It aims to provide better design solution which is
efficient in terms of weight & also meet the torsional
stiffness performance.
In order to have good confidence about CAE work which
gives better design solutions, it is essential to have physical
testing [3]. Body in white with best design solution
developed in CAE to meet its torsional stiffness target, is
being tested to check torsional stiffness performance. CAE
helps to save cost & time of physical test by doing testing
only on best designs delivered using FEA methodology.
How Torsion Load Causes Twisting of BIW:
Normally, when vehicle is running on road & when it come
across some pothole or bumps, one of vehicle wheel get
upward & other downward which applies asymmetric load at
front and at rear shock tower. This asymmetric loading causes
the twisting of BIW components & causes BIW torsion. This
vertical asymmetric load case gives a combination of bending
and torsion on the vehicle [1]. The pure torsion load cannot be
experienced on the road, since the weight of the vehicle is
always acting in downward direction so that there cannot be a
negative wheel reaction [1].This opposite loading at shock
tower (where suspension system gets attached to body)
produces twisting of body along length at some angle which
is called as angle of twist.
II. METHODOLOGY
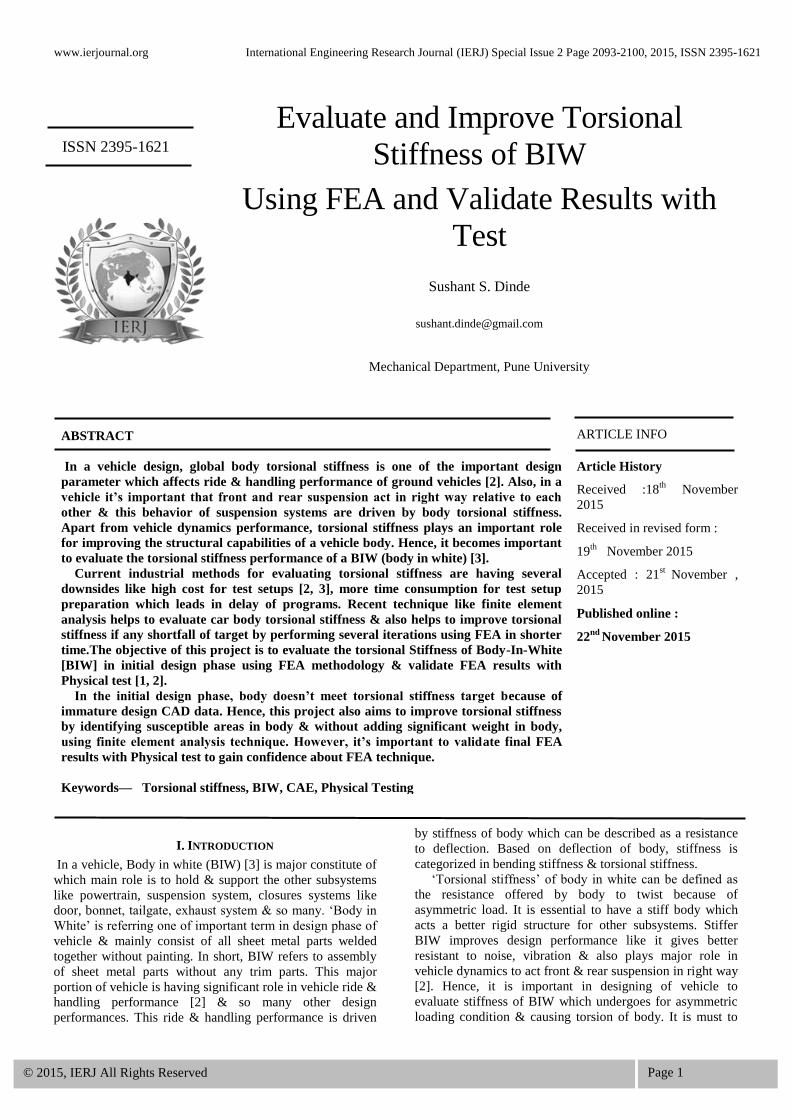
Below figure refers to methodology used during this project.
Figure 1- Process Flow
This project is basically includes four major steps as a
described below-
1. Finite Element Modeling & Modal Analysis:
This is the most time consuming & important part of this
project work. To start with FE modeling of different BIW
parts, all sheet metal parts are modeled as 2D elements
(TRIA & QUARD elements) whereas casting & solid parts
are modeled as 3D elements (TETRA elements). Modeling
of casting parts with tetra elements becomes easy & less
time consuming because of complicated geometry.
Appropriate connections are made based on provided data
by design engineer like spot welds, adhesives etc. BIW
model which considered for this project work is Fixed Metal
roof BIW. Element sized used for modeling the BIW parts is
10 mm & all the parts are need to mesh as per standard
modeling practices & can meet the element quality criteria.
There are some modeling checks which needs to do after
complete modeling as per below-
The following items must be verified for the full model:
No duplicated grids or elements.
No unintentional „flying‟ parts. No free end for
rigid elements.
No loop for rigid elements.
No unmatched local coordinate system for spring
elements.
No missing/duplicate parts.
The total weight of FE model should match the design
weight.
Once the meshed model is ready then it‟s important to
check the structural integrity of model for any missing
connection or any free component. This can be possible by
running the free free modal analysis which will give first six
rigid body modes if all parts are properly connected. However,
modal animations need to check in details for any missing
spot welds by scaling the animation view. Below checks
needs to do in order to make sure the model is perfectly
connected & is ready to use for further analysis otherwise it
may give the wrong results.
It is recommended to run a free-free normal mode
analysis to check the model connections. The following are
the items that should be verified in BIW FE model:
The mass & C.G are reasonable.
There should be six rigid modes for body, with their natural
frequencies less than 0.1 Hz.
The six rigid body modes should represent both the three
translational modes and three rotational modes in x, y and z
directions, individually or any linear combination of them.
The frequencies of flexible modes are reasonable. No „flying‟
parts.
In consultation with Test engineer, the FE model of
torsional stiffness rig modeled & confirmed to use for
further analysis work.
2. Run Static Stiffness Analysis &Calculate Torsional
Stiffness:
After confirmation of structural integrity of FE model, job
need to run for static stiffness analysis which will gives the
output as a displacement after applying a static load which
will twist BIW. With this FE output data, need to do some
calculations to evaluate torsional stiffness & also need to
compare with generic torsional stiffness target of BIW.
3. Perform Iterations to Improve Torsional Stiffness & Find
Best Design Solution:
Since, CAD data provided by design engineer is of initial
www.ierjournal.org International Engineering Research Journal (IERJ) Special Issue 2 Page 2093-2100, 2015, ISSN 2395-1621
© 2015, IERJ All Rights Reserved Page 3
design phase & it‟s pretty impossible to meet design target in
first place & hence some design iterations need to perform in
CAE which can meet torsional stiffness target with providing
best design solution in terms of weight & saving of cost.
4. Physical Test & Validation of Results:
With the best design solution find in CAE, physical testing
done & validated the CAE vs. Test results which his has
saved a cost & time of test setup.
FEA Tools Used:
There are different FEA tools available in market & having
different capabilities.
Torsional stiffness is a static load case & MSc Nastran is well
known for static analysis. MSc Nastran (version 2013) is used
as a solver while hyper mesh 12.0 is used as a preprocessor &
hyper view 12.0 as a post processor.
III. CAE ANALYSIS
To start with this project, we first required perfect FE
model of BIW modelled in hyper mesh. Along with BIW FE
model, we have modelled the test rig model in FE. This test
rig has modelled in FE in consultation with Test engineer.
Test engineer has explained actual working of test rig &
then modelled in FE. This discussion helps to understand
how BIW is held on rig & where the accelerometers
attached to measure responses on BIW.
Design engineer has provided the CAD data of BIW
which contains around 120 components, mostly sheet metal
part & few casting parts. This all components are meshed in
hyper mesh (fig 2). Sheet metal parts are represented as 2D
elements (CTRIA & CQUARD) while casting parts are
represented as 3D elements (CTETRA). All spot welds are
modelled as REB3-HEXA- REB3 connecting to different
panels. Spot welds which are connecting to two panels are
modelled as 2T while spot welds connecting to three panels
are modelled as 3T. Structural adhesives are modelled as
RBE3-HEXA REB3. Normally, in manufacturing adhesives
are spread along the flanges of panel which doesn‟t allow
move panels & to have perfect spot welding.
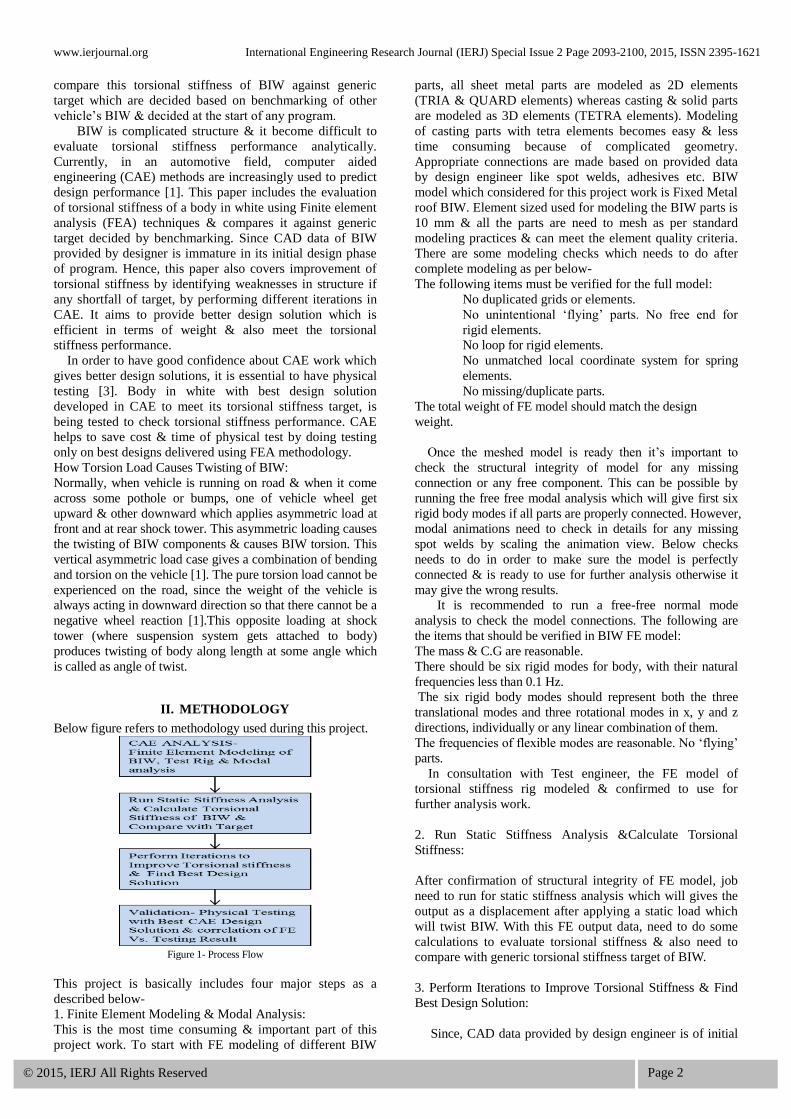
On a similar way of test, response points, loading &
constrained are modelled in FE rig (fig 3).
Figure 2- FE Model of BIW
Figure 3- FE model of Test Rig representing load & constraints
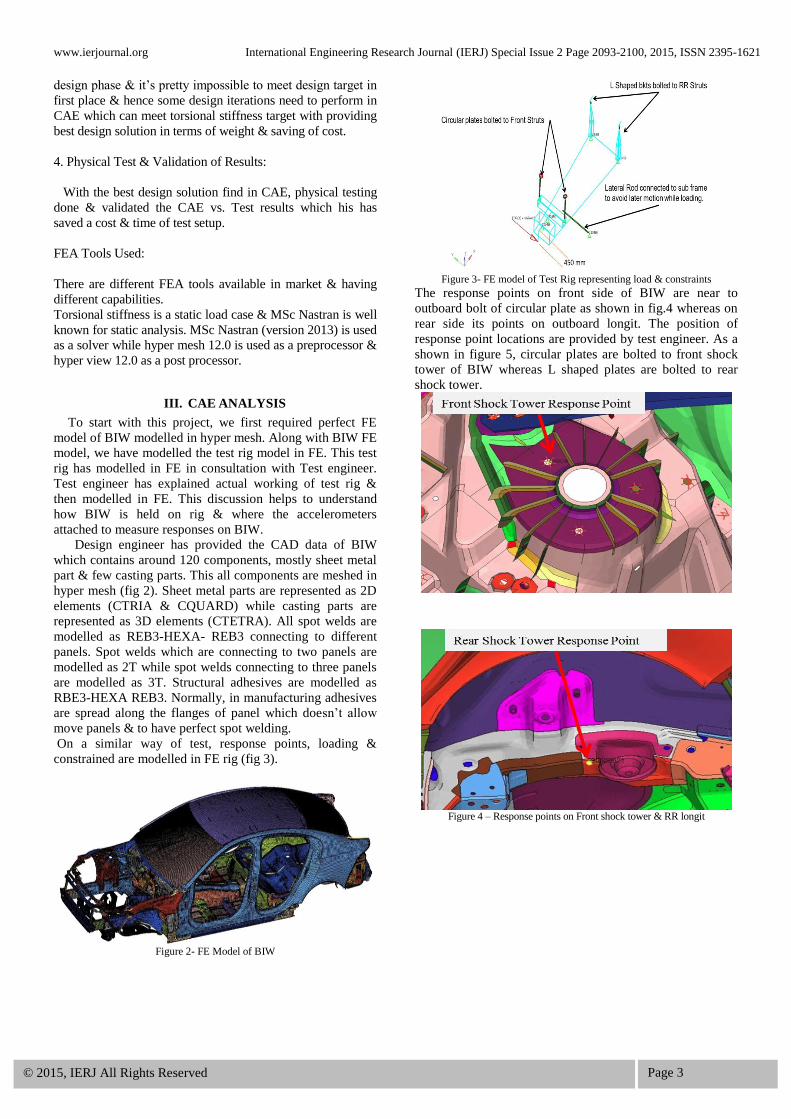
The response points on front side of BIW are near to
outboard bolt of circular plate as shown in fig.4 whereas on
rear side its points on outboard longit. The position of
response point locations are provided by test engineer. As a
shown in figure 5, circular plates are bolted to front shock
tower of BIW whereas L shaped plates are bolted to rear
shock tower.
Figure 4 – Response points on Front shock tower & RR longit
www.ierjournal.org International Engineering Research Journal (IERJ) Special Issue 2 Page 2093-2100, 2015, ISSN 2395-1621
© 2015, IERJ All Rights Reserved Page 4
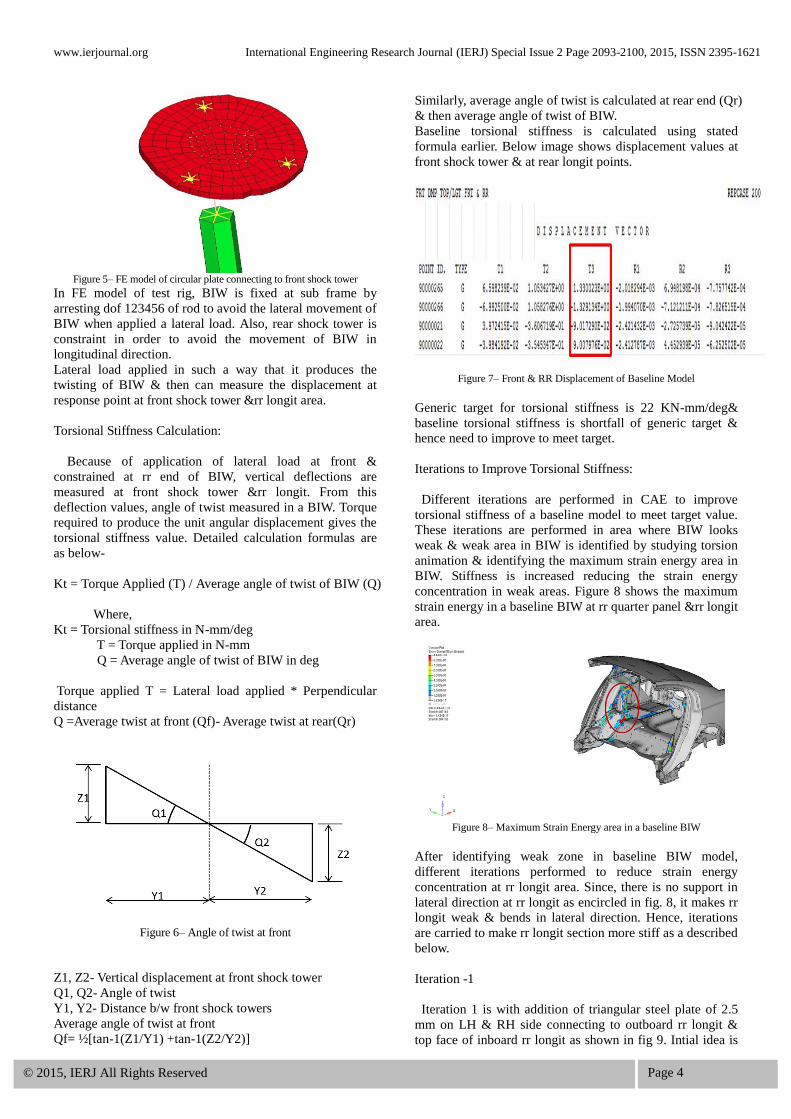
Figure 5– FE model of circular plate connecting to front shock tower
In FE model of test rig, BIW is fixed at sub frame by
arresting dof 123456 of rod to avoid the lateral movement of
BIW when applied a lateral load. Also, rear shock tower is
constraint in order to avoid the movement of BIW in
longitudinal direction.
Lateral load applied in such a way that it produces the
twisting of BIW & then can measure the displacement at
response point at front shock tower &rr longit area.
Torsional Stiffness Calculation:
Because of application of lateral load at front &
constrained at rr end of BIW, vertical deflections are
measured at front shock tower &rr longit. From this
deflection values, angle of twist measured in a BIW. Torque
required to produce the unit angular displacement gives the
torsional stiffness value. Detailed calculation formulas are
as below-
Kt = Torque Applied (T) / Average angle of twist of BIW (Q)
Where,
Kt = Torsional stiffness in N-mm/deg
T = Torque applied in N-mm
Q = Average angle of twist of BIW in deg
Torque applied T = Lateral load applied * Perpendicular
distance
Q =Average twist at front (Qf)- Average twist at rear(Qr)
Figure 6– Angle of twist at front
Z1, Z2- Vertical displacement at front shock tower
Q1, Q2- Angle of twist
Y1, Y2- Distance b/w front shock towers
Average angle of twist at front
Qf= ½[tan-1(Z1/Y1) +tan-1(Z2/Y2)]
Similarly, average angle of twist is calculated at rear end (Qr)
& then average angle of twist of BIW.
Baseline torsional stiffness is calculated using stated
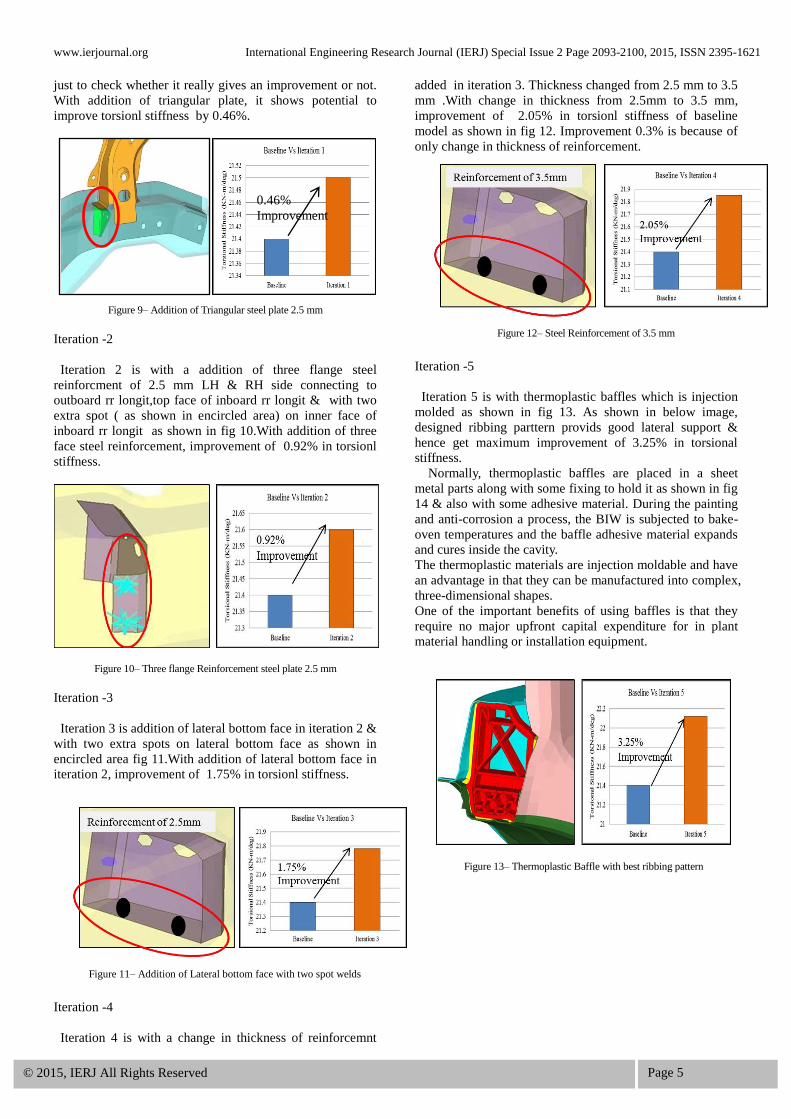
formula earlier. Below image shows displacement values at
front shock tower & at rear longit points.
Figure 7– Front & RR Displacement of Baseline Model
Generic target for torsional stiffness is 22 KN-mm/deg&
baseline torsional stiffness is shortfall of generic target &
hence need to improve to meet target.
Iterations to Improve Torsional Stiffness:
Different iterations are performed in CAE to improve
torsional stiffness of a baseline model to meet target value.
These iterations are performed in area where BIW looks
weak & weak area in BIW is identified by studying torsion
animation & identifying the maximum strain energy area in
BIW. Stiffness is increased reducing the strain energy
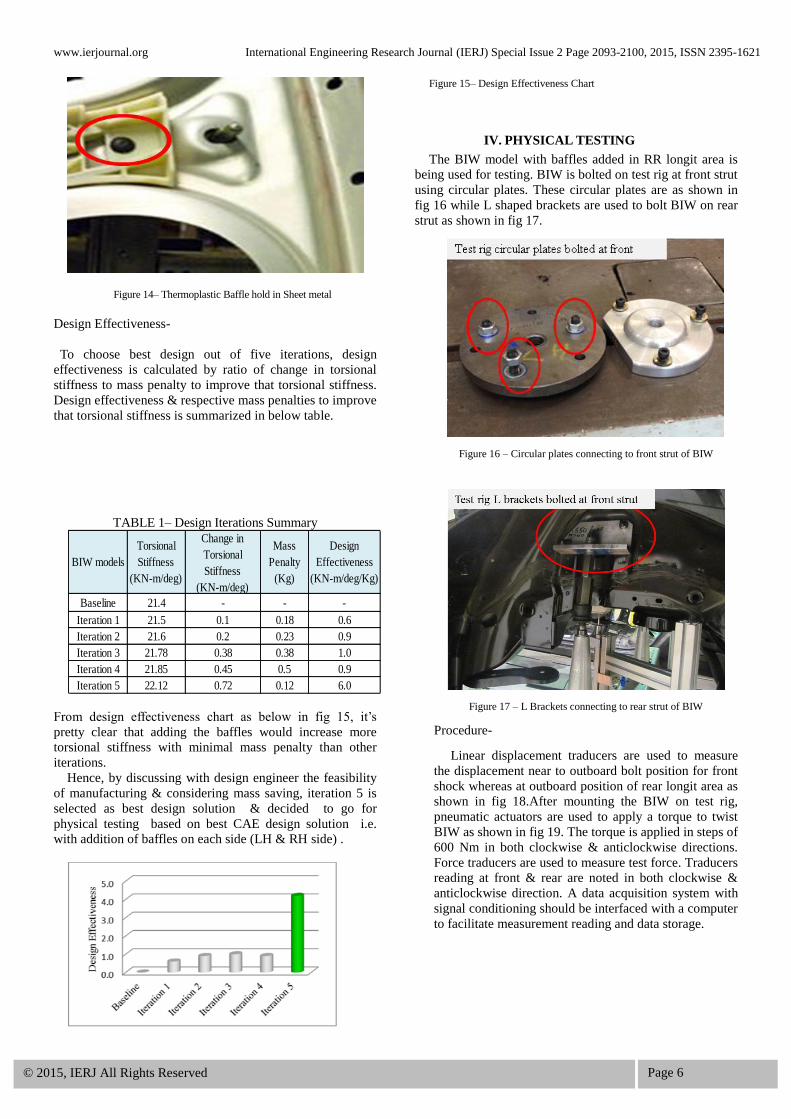
concentration in weak areas. Figure 8 shows the maximum
strain energy in a baseline BIW at rr quarter panel &rr longit
area.
Figure 8– Maximum Strain Energy area in a baseline BIW
After identifying weak zone in baseline BIW model,
different iterations performed to reduce strain energy
concentration at rr longit area. Since, there is no support in
lateral direction at rr longit as encircled in fig. 8, it makes rr
longit weak & bends in lateral direction. Hence, iterations
are carried to make rr longit section more stiff as a described
below.
Iteration -1
Iteration 1 is with addition of triangular steel plate of 2.5
mm on LH & RH side connecting to outboard rr longit &
top face of inboard rr longit as shown in fig 9. Intial idea is
www.ierjournal.org International Engineering Research Journal (IERJ) Special Issue 2 Page 2093-2100, 2015, ISSN 2395-1621
© 2015, IERJ All Rights Reserved Page 5
just to check whether it really gives an improvement or not.
With addition of triangular plate, it shows potential to
improve torsionl stiffness by 0.46%.
Figure 9– Addition of Triangular steel plate 2.5 mm
Iteration -2
Iteration 2 is with a addition of three flange steel
reinforcment of 2.5 mm LH & RH side connecting to
outboard rr longit,top face of inboard rr longit & with two
extra spot ( as shown in encircled area) on inner face of
inboard rr longit as shown in fig 10.With addition of three
face steel reinforcement, improvement of 0.92% in torsionl
stiffness.
Figure 10– Three flange Reinforcement steel plate 2.5 mm
Iteration -3
Iteration 3 is addition of lateral bottom face in iteration 2 &
with two extra spots on lateral bottom face as shown in
encircled area fig 11.With addition of lateral bottom face in
iteration 2, improvement of 1.75% in torsionl stiffness.
Figure 11– Addition of Lateral bottom face with two spot welds
Iteration -4
Iteration 4 is with a change in thickness of reinforcemnt
added in iteration 3. Thickness changed from 2.5 mm to 3.5
mm .With change in thickness from 2.5mm to 3.5 mm,
improvement of 2.05% in torsionl stiffness of baseline
model as shown in fig 12. Improvement 0.3% is because of
only change in thickness of reinforcement.
Figure 12– Steel Reinforcement of 3.5 mm
Iteration -5
Iteration 5 is with thermoplastic baffles which is injection
molded as shown in fig 13. As shown in below image,
designed ribbing parttern provids good lateral support &
hence get maximum improvement of 3.25% in torsional
stiffness.
Normally, thermoplastic baffles are placed in a sheet
metal parts along with some fixing to hold it as shown in fig
14 & also with some adhesive material. During the painting
and anti-corrosion a process, the BIW is subjected to bake-
oven temperatures and the baffle adhesive material expands
and cures inside the cavity.
The thermoplastic materials are injection moldable and have
an advantage in that they can be manufactured into complex,
three-dimensional shapes.
One of the important benefits of using baffles is that they
require no major upfront capital expenditure for in plant
material handling or installation equipment.
Figure 13– Thermoplastic Baffle with best ribbing pattern
0.46%
Improvement
www.ierjournal.org International Engineering Research Journal (IERJ) Special Issue 2 Page 2093-2100, 2015, ISSN 2395-1621
© 2015, IERJ All Rights Reserved Page 6
Figure 14– Thermoplastic Baffle hold in Sheet metal
Design Effectiveness-
To choose best design out of five iterations, design
effectiveness is calculated by ratio of change in torsional
stiffness to mass penalty to improve that torsional stiffness.
Design effectiveness & respective mass penalties to improve
that torsional stiffness is summarized in below table.
TABLE 1– Design Iterations Summary
BIW models
Torsional
Stiffness
(KN-m/deg)
Change in
Torsional
Stiffness
(KN-m/deg)
Mass
Penalty
(Kg)
Design
Effectiveness
(KN-m/deg/Kg)
Baseline 21.4 - - -
Iteration 1 21.5 0.1 0.18 0.6
Iteration 2 21.6 0.2 0.23 0.9
Iteration 3 21.78 0.38 0.38 1.0
Iteration 4 21.85 0.45 0.5 0.9
Iteration 5 22.12 0.72 0.12 6.0
From design effectiveness chart as below in fig 15, it‟s
pretty clear that adding the baffles would increase more
torsional stiffness with minimal mass penalty than other
iterations.
Hence, by discussing with design engineer the feasibility
of manufacturing & considering mass saving, iteration 5 is
selected as best design solution & decided to go for
physical testing based on best CAE design solution i.e.
with addition of baffles on each side (LH & RH side) .
Figure 15– Design Effectiveness Chart
IV. PHYSICAL TESTING
The BIW model with baffles added in RR longit area is
being used for testing. BIW is bolted on test rig at front strut
using circular plates. These circular plates are as shown in
fig 16 while L shaped brackets are used to bolt BIW on rear
strut as shown in fig 17.
Figure 16 – Circular plates connecting to front strut of BIW
Figure 17 – L Brackets connecting to rear strut of BIW
Procedure-
Linear displacement traducers are used to measure
the displacement near to outboard bolt position for front
shock whereas at outboard position of rear longit area as
shown in fig 18.After mounting the BIW on test rig,
pneumatic actuators are used to apply a torque to twist
BIW as shown in fig 19. The torque is applied in steps of
600 Nm in both clockwise & anticlockwise directions.
Force traducers are used to measure test force. Traducers
reading at front & rear are noted in both clockwise &
anticlockwise direction. A data acquisition system with
signal conditioning should be interfaced with a computer
to facilitate measurement reading and data storage.
Test rig circular plates bolted at front
strut
www.ierjournal.org International Engineering Research Journal (IERJ) Special Issue 2 Page 2093-2100, 2015, ISSN 2395-1621
© 2015, IERJ All Rights Reserved Page 7
Figure 18 – Front & Rear traducers on BIW
Figure 19 – Pneumatic system to apply torque
Below table shows readings of BIW torsion test.
Table 2– BIW torsion test readings
CAE Vs Test Correlation-
Torsional stiffness measured using CAE methodology for a
best design solution obtained & torsional stiffnes calculated
using test is compared.. Figure 20 shows CAE vs Test
tosional stiffness values & comparison of torsional stiffness
result & physical test result.A correlation of 96% was
established with the physical testing results and CAE as
shown in fig 20.
Figure 20 – Comparison of Test Vs CAE results
V. CONCLUSION
In this paper, BIW torsional stiffness is evaluated using
CAE & target is achieved with minimum mass penalty.
Results have been tested with best design solution obtained
in CAE & show good correlation of CAE vs. TEST results.
A correlation of 96% is established with the physical test
and CAE for best design solution.
In conclusion, this paper helps to understand
importance of CAE technique to evaluate torsional stiffness.
CAE techniques also help to meet target of torsional
stiffness of BIW by performing different iterations in quick
time which ultimately helps to save time & cost of test setup.
ACKNOWLEDGEMENT
The author would like to thank project guide Prof. P.A.
Narwade, PG coordinator Prof. R.Navthar& HOD Prof. P.A.
Deokule for their valuable guidance, support and help from
time to time during work. Also, author would like to thanks
TATA Technologies, Ltd, Pune for giving an opportunity to
work on this project.
www.ierjournal.org International Engineering Research Journal (IERJ) Special Issue 2 Page 2093-2100, 2015, ISSN 2395-1621
© 2015, IERJ All Rights Reserved Page 8
DEFINATION/ABBREVIATIONS
CAE - Computer Aided Engineering
CAD - Computer Aided Designing
DOF- Degree of freedom
FEA- Finite Element Analysis
Kt = Torsional stiffness in N-mm/deg
T = Torque applied in N-mm
Q = Average angle of twist of BIW in deg
Qf= Average angle of twist at front in deg
Qr= Average angle of twist at front in deg
Z1, Z2- Vertical displacement at front shock tower
Y1, Y2- Distance b/w front shock towers
REFRENCES
[1] Ramachandran, R., Dehariya, N., Kumar, G., Agarwal,
H. et al.,
"Methodology to Measure BIW Torsional Stiffness and
Study to Identify
and Optimize Critical Panels," SAE Technical Paper 2015-
26-0224,
2015,doi: 10.4271/2015-26-0224.
[2] Hari Krishnan M, N Sreeraj, C Bhaskar, G Nagaraju
and R Mugundaram “Establishing Correlation between
Torsional and Lateral Stiffness Parameters of BIW and
Vehicle Handling Performance” SAE Technical Paper
2011-01-0089, 2011, doi: 10.4271/2011-01-0089
[3] Karan R. Khanse and Shekhar P Pathak, “Test Set-Up
of BIW (Body in White) Stiffness Measurements”, SAE
Technical Paper 2013-01-1439, 2013, doi:
10.4271/2013-01-1439
[4] Steven Tebby1, Ebrahim Esmailzadeh2 and Ahmad
Barari3 “Methods to Determine Torsion Stiffness in an
Automotive Chassis” doi:
10.3722/cadaps.2011.PACE.67-75
[5] J. Helsen 1,L. Cremers 2,P. Mas 3, P. Sas 1,” Global
static and dynamic car body stiffness based on a single
experimental modal analysis test”
K.U.Leuven, Department of Mechanical Engineering,
Celestijnenlaan
300 B, B-3001, Heverlee, Belgium.
[6] MSC Nastran 2012.2 Installation and Operations
Guide.
[7] http://www.adhesivesmag.com/articles/polymers-
elastomers-and-two-component-foams-seal-reduce-
noise-vibration-and-harshness-reduce-vehicle-weight-
and-provide-easy-application