Embed Size (px)
Citation preview
STIBNITE GOLD PROJECT, IDAHO USA 2014 PRE-FEASIBILITY STUDY
www.midasgoldcorp.com
MAX.TSX MDRPF.OTCQX
December 15, 2014
2 December 15, 2014 Gold, rediscovered.
Forward Looking Statements Statements contained in this presentation that are not historical facts are “forward-looking information” or “forward-looking statements” (collectively, “Forward-Looking Information”) within the meaning of applicable Canadian securities legislation and the United States Private Securities Litigation Reform Act of 1995. Forward Looking Information includes, but is not limited to, disclosure regarding possible events, conditions or financial performance that is based on assumptions about future economic conditions and courses of action; the timing and costs of future activities on the Corporation‘s properties, including but not limited to development and operating costs in the event that a production decision is made; success of exploration, development and environmental protection and remediation activities; permitting time lines and requirements,; requirements for additional capital,; requirements for additional water rights and the potential effect of proposed notices of environmental conditions relating to mineral claims; planned exploration and development of properties and the results thereof; planned expenditures and budgets and the execution thereof. In certain cases, Forward-Looking Information can be identified by the use of words and phrases such as “plans”, “expects” or “does not expect”, “is expected”, “budget”, “scheduled”, “estimates”, “forecasts”, “intends”, “anticipates”, “potential”, “confirm” or “does not anticipate”, “believes”, “contemplates”, “recommends” or variations of such words and phrases or statements that certain actions, events or results “may”, “could”, “would”, “might” or “will be taken”, “occur” or “be achieved”. Statements concerning mineral resource and mineral reserve estimates may also be deemed to constitute Forward-Looking Information to the extent that they involve estimates of the mineralization that may be encountered if the Stibnite Gold Project is developed. In preparing the Forward-Looking Information in this presentation, the Corporation has applied several material assumptions, including, but not limited to, that any additional financing needed will be available on reasonable terms; the exchange rates for the U.S. and Canadian currencies in 2015(?) will be consistent with the Corporation‘s expectations; that the current exploration, development, environmental and other objectives concerning the Stibnite Gold Project can be achieved and that its other corporate activities will proceed as expected; that the current price and demand for gold will be sustained or will improve; that general business and economic conditions will not change in a materially adverse manner and that all necessary governmental approvals for the planned exploration, development and environmental protection activities on the Stibnite Gold Project will be obtained in a timely manner and on acceptable terms; the continuity of the price of gold and other metals, economic and political conditions and operations. Forward-Looking Information involves known and unknown risks, uncertainties and other factors which may cause the actual results, performance or achievements of the Corporation to be materially different from any future results, performance or achievements expressed or implied by the Forward-Looking Information. Such risks and other factors include, among others, the industry-wide risks and project-specific risks identified in the PFS and summarized above; risks related to the availability of financing on commercially reasonable terms and the expected use of proceeds; operations and contractual obligations; changes in exploration programs based upon results of exploration; changes in estimated mineral reserves or mineral resources; future prices of metals; availability of third party contractors; availability of equipment; failure of equipment to operate as anticipated; accidents, effects of weather and other natural phenomena and other risks associated with the mineral exploration industry; environmental risks, including environmental matters under US federal and Idaho rules and regulations; impact of environmental remediation requirements and the terms of existing and potential consent decrees on the Corporation‘s planned exploration and development activities on the Stibnite Gold Project; certainty of mineral title; community relations; delays in obtaining governmental approvals or financing; fluctuations in mineral prices; the Corporation‘s dependence on one mineral project; the nature of mineral exploration and mining and the uncertain commercial viability of certain mineral deposits; the Corporation‘s lack of operating revenues; governmental regulations and the ability to obtain necessary licences and permits; risks related to mineral properties being subject to prior unregistered agreements, transfers or claims and other defects in title; currency fluctuations; changes in environmental laws and regulations and changes in the application of standards pursuant to existing laws and regulations which may increase costs of doing business and restrict operations; risks related to dependence on key personnel; and estimates used in financial statements proving to be incorrect; as well as those factors discussed in the Corporation's public disclosure record. Although the Corporation has attempted to identify important factors that could affect the Corporation and may cause actual actions, events or results to differ materially from those described in Forward-Looking Information, there may be other factors that cause actions, events or results not to be as anticipated, estimated or intended. There can be no assurance that Forward-Looking Information will prove to be accurate, as actual results and future events could differ materially from those anticipated in such statements. Accordingly, readers should not place undue reliance on Forward-Looking Information.
Except as required by law, the Corporation does not assume any obligation to release publicly any revisions to Forward-Looking Information contained in this presentation to reflect events or circumstances after the date hereof or to reflect the occurrence of unanticipated events.
Cautionary Note The presentation has been prepared by Midas Gold management and does not represent a recommendation to buy or sell these securities. Investors should always consult their investment advisors prior to making any investment decisions.
3 December 15, 2014 Gold, rediscovered.
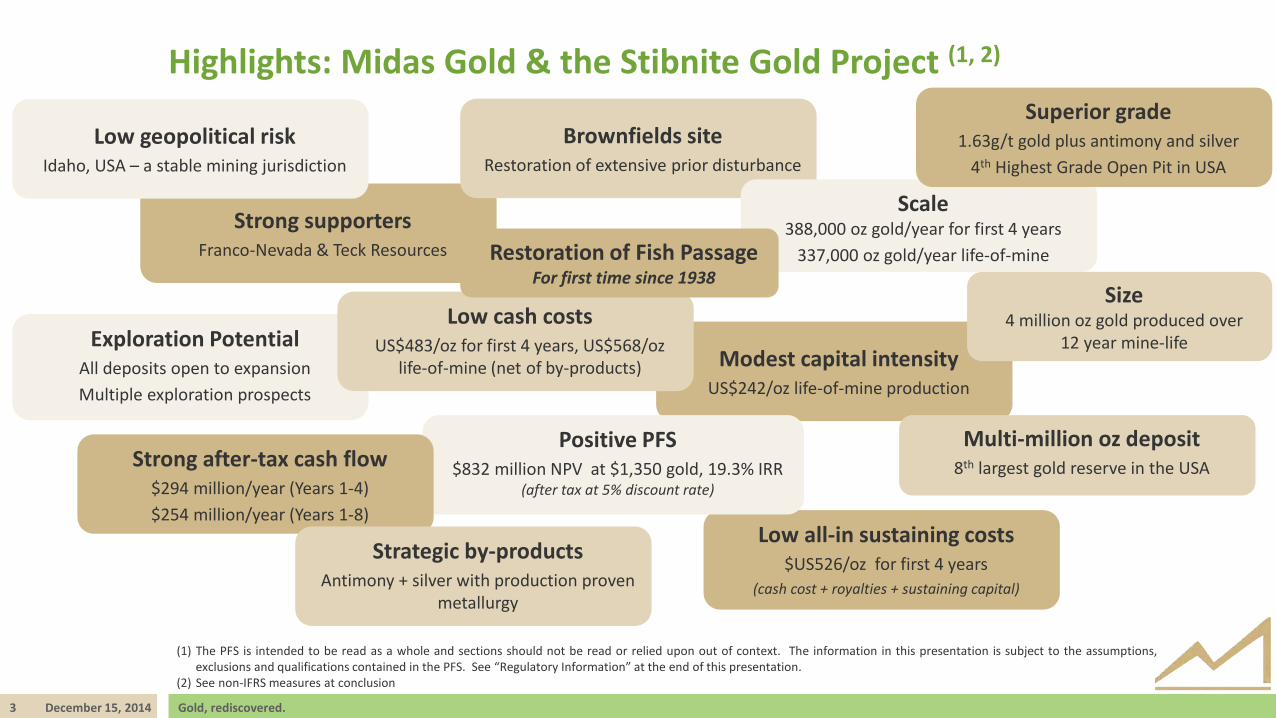
Highlights: Midas Gold & the Stibnite Gold Project (1, 2)
Modest capital intensity
US$242/oz life-of-mine production
Low all-in sustaining costs $US526/oz for first 4 years
(cash cost + royalties + sustaining capital)
Exploration Potential All deposits open to expansion Multiple exploration prospects
Strong supporters Franco-Nevada & Teck Resources
Low geopolitical risk Idaho, USA – a stable mining jurisdiction
Multi-million oz deposit 8th largest gold reserve in the USA
Low cash costs US$483/oz for first 4 years, US$568/oz
life-of-mine (net of by-products)
Brownfields site Restoration of extensive prior disturbance
Positive PFS $832 million NPV at $1,350 gold, 19.3% IRR
(after tax at 5% discount rate)
(1) The PFS is intended to be read as a whole and sections should not be read or relied upon out of context. The information in this presentation is subject to the assumptions, exclusions and qualifications contained in the PFS. See “Regulatory Information” at the end of this presentation.
(2) See non-IFRS measures at conclusion
Scale 388,000 oz gold/year for first 4 years
337,000 oz gold/year life-of-mine
Superior grade 1.63g/t gold plus antimony and silver
4th Highest Grade Open Pit in USA
Strong after-tax cash flow $294 million/year (Years 1-4) $254 million/year (Years 1-8)
Strategic by-products
Antimony + silver with production proven metallurgy
Size 4 million oz gold produced over
12 year mine-life
Restoration of Fish Passage For first time since 1938
4 December 15, 2014 Gold, rediscovered.
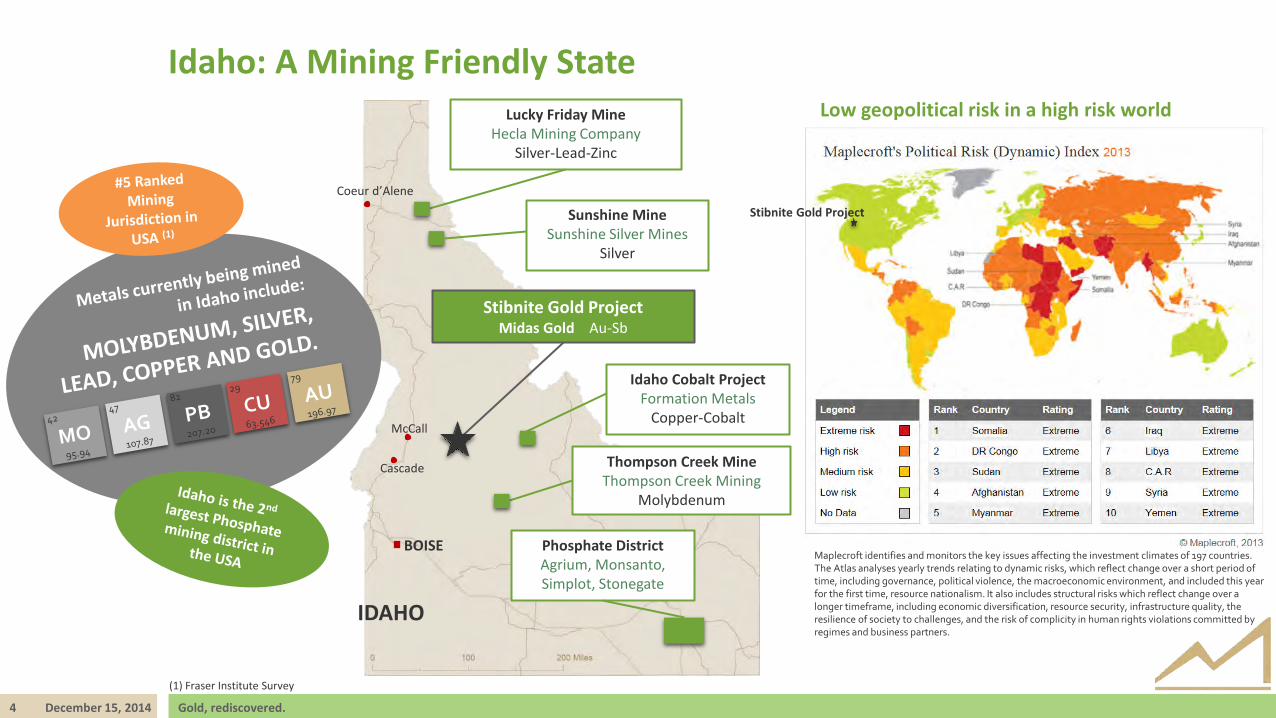
Idaho: A Mining Friendly State
Maplecroft identifies and monitors the key issues affecting the investment climates of 197 countries. The Atlas analyses yearly trends relating to dynamic risks, which reflect change over a short period of time, including governance, political violence, the macroeconomic environment, and included this year for the first time, resource nationalism. It also includes structural risks which reflect change over a longer timeframe, including economic diversification, resource security, infrastructure quality, the resilience of society to challenges, and the risk of complicity in human rights violations committed by regimes and business partners.
Stibnite Gold Project Midas Gold Au-Sb
Thompson Creek Mine Thompson Creek Mining
Molybdenum
Phosphate District Agrium, Monsanto, Simplot, Stonegate
Sunshine Mine Sunshine Silver Mines
Silver
Lucky Friday Mine Hecla Mining Company
Silver-Lead-Zinc
Idaho Cobalt Project Formation Metals
Copper-Cobalt
Coeur d’Alene
Cascade
BOISE
IDAHO
Low geopolitical risk in a high risk world
McCall
(1) Fraser Institute Survey
Stibnite Gold Project
5 December 15, 2014 Gold, rediscovered.
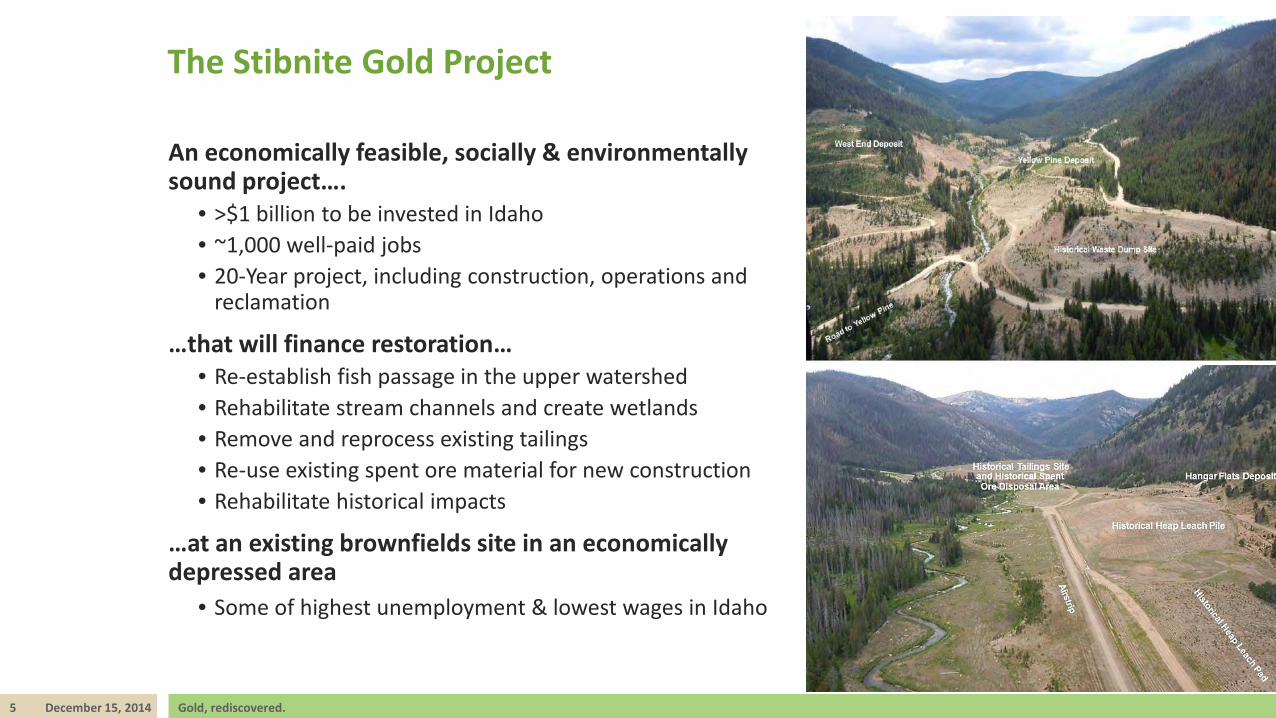
The Stibnite Gold Project
An economically feasible, socially & environmentally sound project….
• >$1 billion to be invested in Idaho • ~1,000 well-paid jobs • 20-Year project, including construction, operations and
reclamation
…that will finance restoration… • Re-establish fish passage in the upper watershed • Rehabilitate stream channels and create wetlands • Remove and reprocess existing tailings • Re-use existing spent ore material for new construction • Rehabilitate historical impacts
…at an existing brownfields site in an economically depressed area
• Some of highest unemployment & lowest wages in Idaho

THE STIBNITE GOLD PROJECT
2014 PFS HIGHLIGHTS
7 December 15, 2014 Gold, rediscovered.
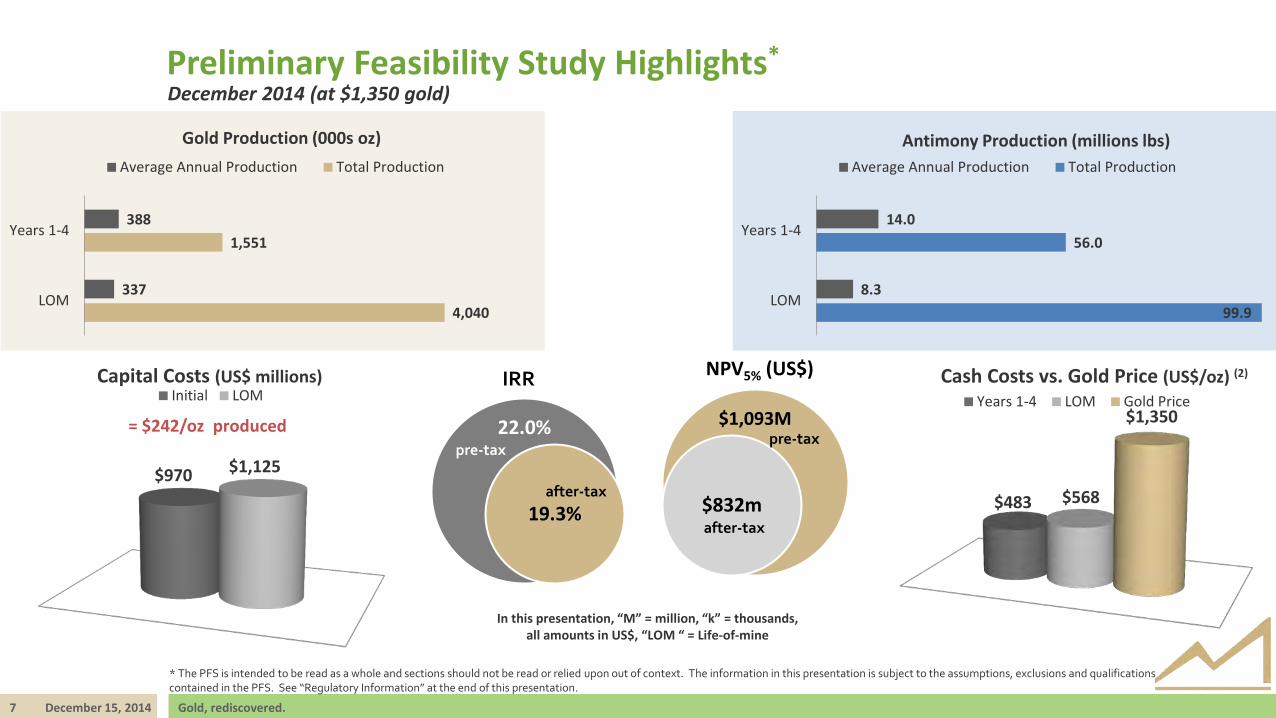
Preliminary Feasibility Study Highlights* December 2014 (at $1,350 gold)
* The PFS is intended to be read as a whole and sections should not be read or relied upon out of context. The information in this presentation is subject to the assumptions, exclusions and qualifications contained in the PFS. See “Regulatory Information” at the end of this presentation.
In this presentation, “M” = million, “k” = thousands, all amounts in US$, “LOM “ = Life-of-mine
14.0
8.3
56.0
99.9
Years 1-4
LOM
Antimony Production (millions lbs) Average Annual Production Total Production
22.0%
19.3%
IRR
pre-tax
after-tax
$1,093M
$832m
NPV5% (US$)
pre-tax
after-tax
= $242/oz produced
$483 $568
$1,350
Cash Costs vs. Gold Price (US$/oz) (2)
Years 1-4 LOM Gold Price
$970 $1,125
Capital Costs (US$ millions) Initial LOM
388
337
1,551
4,040
Years 1-4
LOM
Gold Production (000s oz) Average Annual Production Total Production
8 December 15, 2014 Gold, rediscovered.
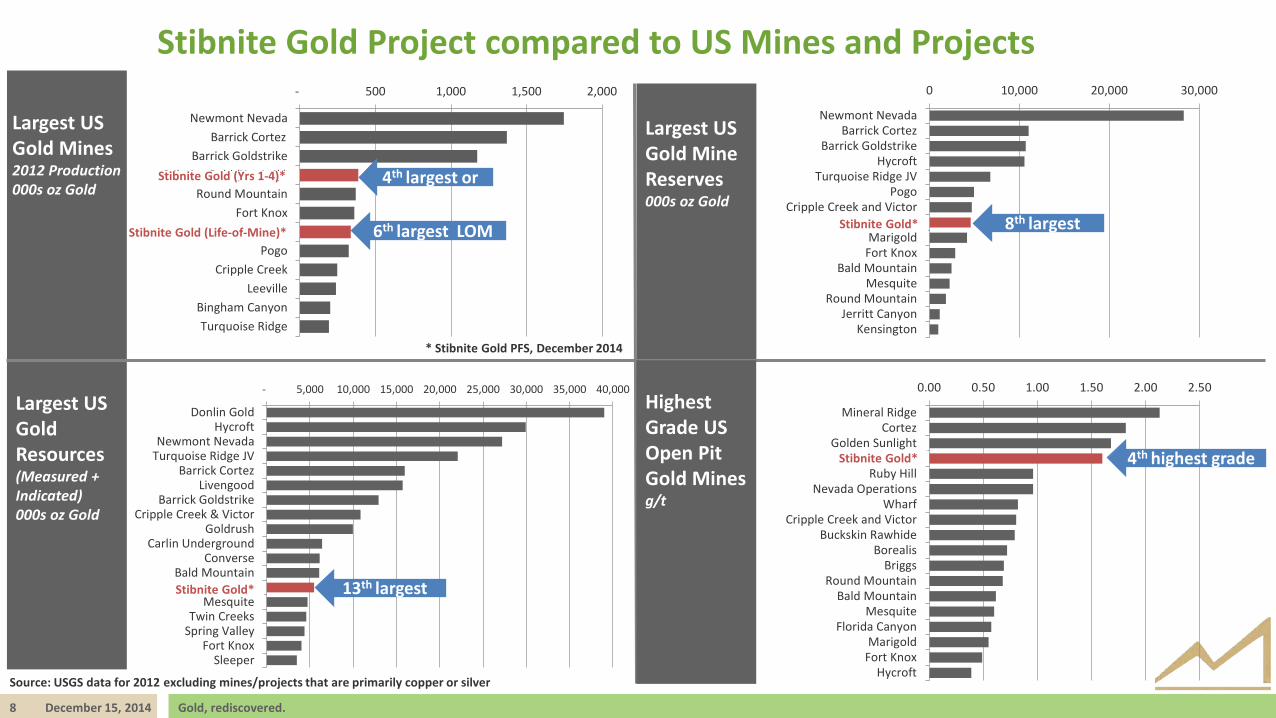
Stibnite Gold Project compared to US Mines and Projects - 500 1,000 1,500 2,000
Newmont NevadaBarric Cortez
Barrick GoldstrikeStibnite Gold (Yrs 1-4)*
Round MountainFort Knox
Stibnite Gold (Life-of-mine)*Pogo
Cripple CreekLeeville
Bingham CanyonTurquoise Ridge
- 5,000 10,000 15,000 20,000 25,000 30,000 35,000 40,000
Donlin GoldHycroft
Newmont NevadaTurquoise Ridge JV
Barrick CortezLivengood
Barrick GoldstrikeCripple Creek & Victor
GoldrushCarlin Underground
ConverseBald MountainStibnite Gold*
MesquiteTwin Creeks
Spring ValleyFort Knox
Sleeper
0 10,000 20,000 30,000
Newmont NevadaBarrick Cortez
Barrick GoldstrikeHycroft
Turquoise Ridge JVPogo
Cripple Creek and VictorStibnite Gold*
MarigoldFort Knox
Bald MountainMesquite
Round MountainJerritt Canyon
Kensington
0.00 0.50 1.00 1.50 2.00 2.50
Mineral RidgeCortez
Golden SunlightStibnite Gold*
Ruby HillNevada Operations
WharfCripple Creek and Victor
Buckskin RawhideBorealis
BriggsRound Mountain
Bald MountainMesquite
Florida CanyonMarigold
Fort KnoxHycroft
Source: USGS data for 2012 excluding mines/projects that are primarily copper or silver
4th largest or
6th largest LOM
Stibnite Gold (Yrs 1-4)*
Stibnite Gold (Life-of-Mine)* Stibnite Gold*
Stibnite Gold*
Stibnite Gold*
8th largest
13th largest
4th highest grade
Largest US Gold Mines 2012 Production 000s oz Gold
Largest US Gold Mine Reserves 000s oz Gold
Largest US Gold Resources (Measured + Indicated) 000s oz Gold
Highest Grade US Open Pit Gold Mines g/t
Barrick Cortez
* Stibnite Gold PFS, December 2014
THE STIBNITE GOLD PROJECT
2014 PFS SUMMARY
10 December 15, 2014 Gold, rediscovered.
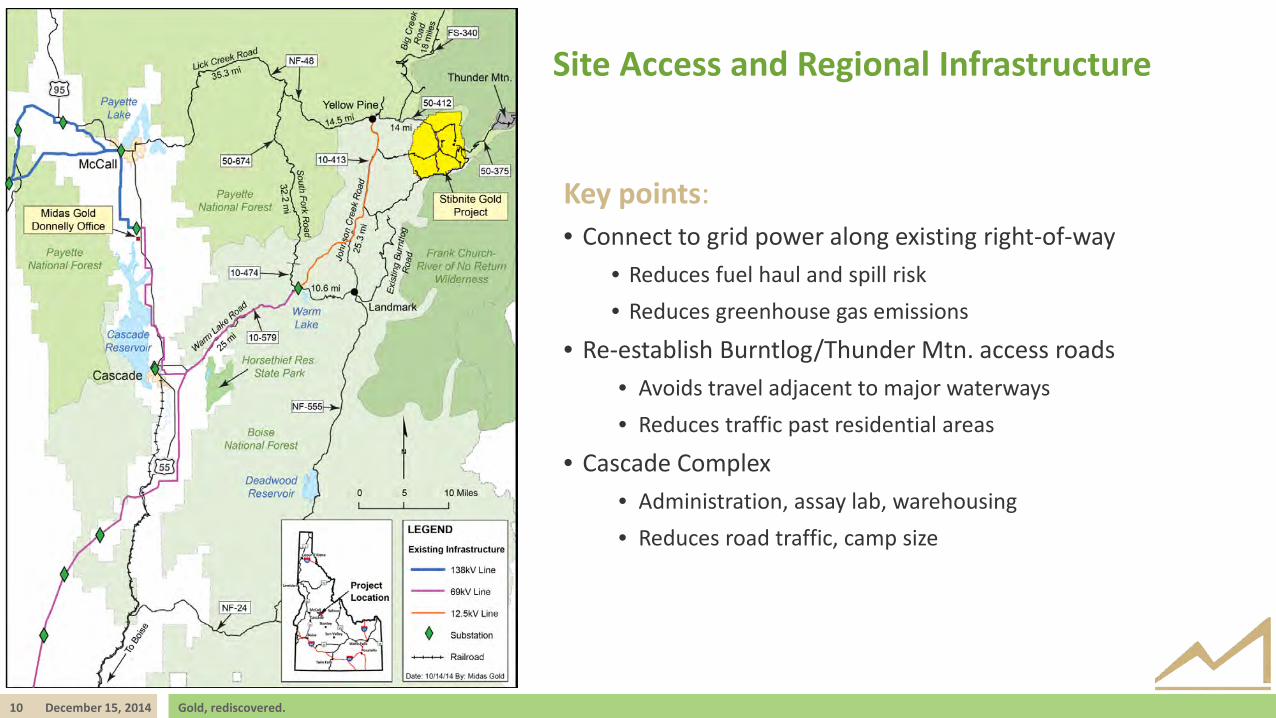
Site Access and Regional Infrastructure
Key points: • Connect to grid power along existing right-of-way
• Reduces fuel haul and spill risk • Reduces greenhouse gas emissions
• Re-establish Burntlog/Thunder Mtn. access roads • Avoids travel adjacent to major waterways • Reduces traffic past residential areas
• Cascade Complex • Administration, assay lab, warehousing • Reduces road traffic, camp size

11 December 15, 2014 Gold, rediscovered.
Mineral Resources and Reserves By Deposit* (September 10, 2014 / December 15, 2014)
Indicated Inferred
2.8 Moz 1.93 g/t Au
0.4 Moz 1.31 g/t Au
Indicated Inferred
1.1 Moz
0.4 Moz 1.52 g/t Au
Indicated Inferred
1.5 Moz 1.30 g/t Au
0.3 Moz 1.15 g/t Au
Yellow Pine Hangar Flats West End
* See disclaimers on at back of the presentation and Company news release dated September 10, 2014 for full details on the resource estimate.
Probable Reserves: 2.5 Moz 1.97 g/t
Probable Reserves: 0.69 Moz 1.53 g/t
Probable Reserves: 1.26 Moz 1.22 g/t
Plus reserves of 102,000 oz at a grade of 1.17 g/t gold in historic tailings
Totals for all deposits: PROBABLE RESERVES 4.6 Moz included in INDICATED 5.5Moz and INFERRED 1.1 Moz

12 December 15, 2014 Gold, rediscovered.
PFS Project Description • Power supplied via state grid installed along existing right-of-way • Fish passage around Yellow Pine pit during operations • Mining fleet based on 200 ton haul trucks and loaders • 3 pits and reprocessing of historical tailings • 22,050 tons/day process plant:
• Primary (jaw) crusher & conveyor to crushed ore stockpile • One SAG and one ball mill • Antimony flotation with filtration and sale of concentrate • Gold flotation – rougher concentrates direct to autoclave (except West End) • Oxidize gold concentrate with single autoclave • Carbon-in-leach (CIL) circuit, carbon stripping & refining to doré • CN-destruction of CIL tailings
• Synthetically lined tailings storage facility for comingled tailings • Rockfill dam • 200 million tons of waste rock buttress against rockfill dam
• Backfilling of Yellow Pine pit to restore river channel and fish passage on closure

13 December 15, 2014 Gold, rediscovered.
Ore & Waste Rock Mining Schedule (Ore mined in Year -1 is stockpiled and then processed in Year 1)
0
80
160
240
320
400
480
560
0
5,000
10,000
15,000
20,000
25,000
30,000
35,000
-1 1 2 3 4 5 6 7 8 9 10 11 12
Cont
aine
d G
old
(000
s oz)
Mat
eria
l Mov
emen
t (00
0s to
ns)
Year of Operation
Ore Waste Rock Contained Au
Key points: • 95.1 million tons of ore from Yellow
Pine, Hangar Flats and West End • 3.0 million tons of historic tailings • Phased mining reduces upfront
waste rock removal • Strip ratio of 3.5:1 • Spent heap leach ore reused for
construction • West End waste rock used to
backfill Yellow Pine pit to restore fish passage
The PFS is intended to be read as a whole and sections should not be read or relied upon out of context. The information in this presentation is subject to the assumptions, exclusions and qualifications contained in the PFS. See “Regulatory Information” at the end of this presentation.

14 December 15, 2014 Gold, rediscovered.
(Mineralized material mined in Year -1 is stockpiled and then processed in Year 1)
Ore Mined from Each Deposit by Type and Year
0.00
0.01
0.02
0.03
0.04
0.05
0.06
0.07
0.08
0.09
0
1,000
2,000
3,000
4,000
5,000
6,000
7,000
8,000
9,000
-1 1 2 3 4 5 6 7 8 9 10 11 12
Gol
d He
ad G
rade
(oz /
ton)
Ore
Min
ed (0
00s
tons
)
Year YP Hi Sb Ore YP Low Sb Ore HF Hi Sb OreHF Low Sb Ore WE Low Sb Ore WE Oxide OreHistoric Tailings Mined Gold Grade (oz/t)
Key points: • Sequential mining of deposits
• Allows backfilling of Yellow Pine pit
• Higher gold grades up-front • High grade antimony in early
years • Oxides mined throughout life
• Reduces mill downtime
• Historic tailings reprocessed in Years 1-4
The PFS is intended to be read as a whole and sections should not be read or relied upon out of context. The information in this presentation is subject to the assumptions, exclusions and qualifications contained in the PFS. See “Regulatory Information” at the end of this presentation.

15 December 15, 2014 Gold, rediscovered.
Metallurgy: Robust Gold & Antimony Recoveries
Extensive PFS test program • 7 master composites • 114 variability composites
Net overall Gold Recoveries
Yellow Pine 90% West End 86% Hangar Flats 87% Historic Tailings 75%
Antimony Recoveries Yellow Pine 87% Hangar Flats 82%
Jaw Crusher SAG Mill Ball Mill
Antimony Flotation
Gold Flotation
Pressure Oxidation
Gold Leach & Recovery
Antimony Concentrate
Gold Doré
Oxi
des
(~14
%)
High Sb Sulphides (~14%)
Tailings
Low
Sb
Sulp
hide
s (~
72%
)
Simplified Flow Sheet
The PFS is intended to be read as a whole and sections should not be read or relied upon out of context. The information in this presentation is subject to the assumptions, exclusions and qualifications contained in the PFS. See “Regulatory Information” at the end of this presentation.
Tailings
16 December 15, 2014 Gold, rediscovered.
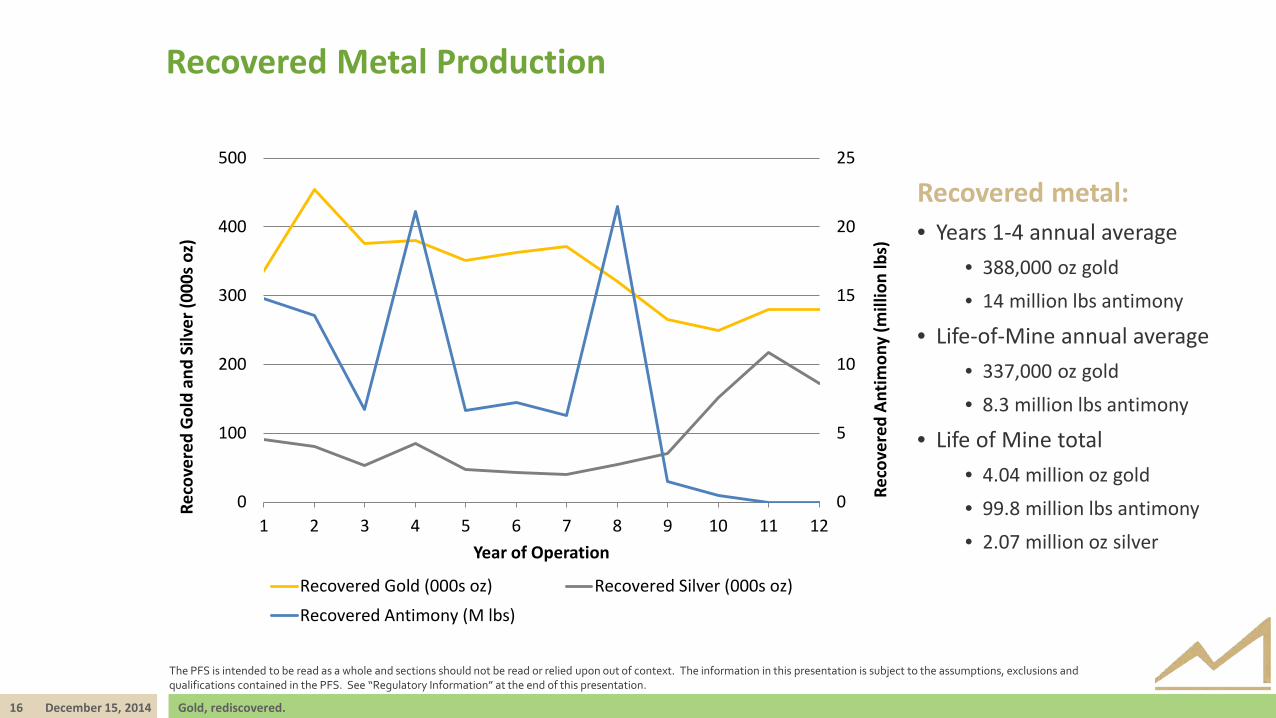
Recovered Metal Production
0
5
10
15
20
25
0
100
200
300
400
500
1 2 3 4 5 6 7 8 9 10 11 12
Reco
vere
d An
timon
y (m
illio
n lb
s)
Reco
vere
d G
old
and
Silv
er (0
00s
oz)
Year of Operation
Recovered Gold (000s oz) Recovered Silver (000s oz)Recovered Antimony (M lbs)
Recovered metal: • Years 1-4 annual average
• 388,000 oz gold • 14 million lbs antimony
• Life-of-Mine annual average • 337,000 oz gold • 8.3 million lbs antimony
• Life of Mine total • 4.04 million oz gold • 99.8 million lbs antimony • 2.07 million oz silver
The PFS is intended to be read as a whole and sections should not be read or relied upon out of context. The information in this presentation is subject to the assumptions, exclusions and qualifications contained in the PFS. See “Regulatory Information” at the end of this presentation.
17 December 15, 2014 Gold, rediscovered.
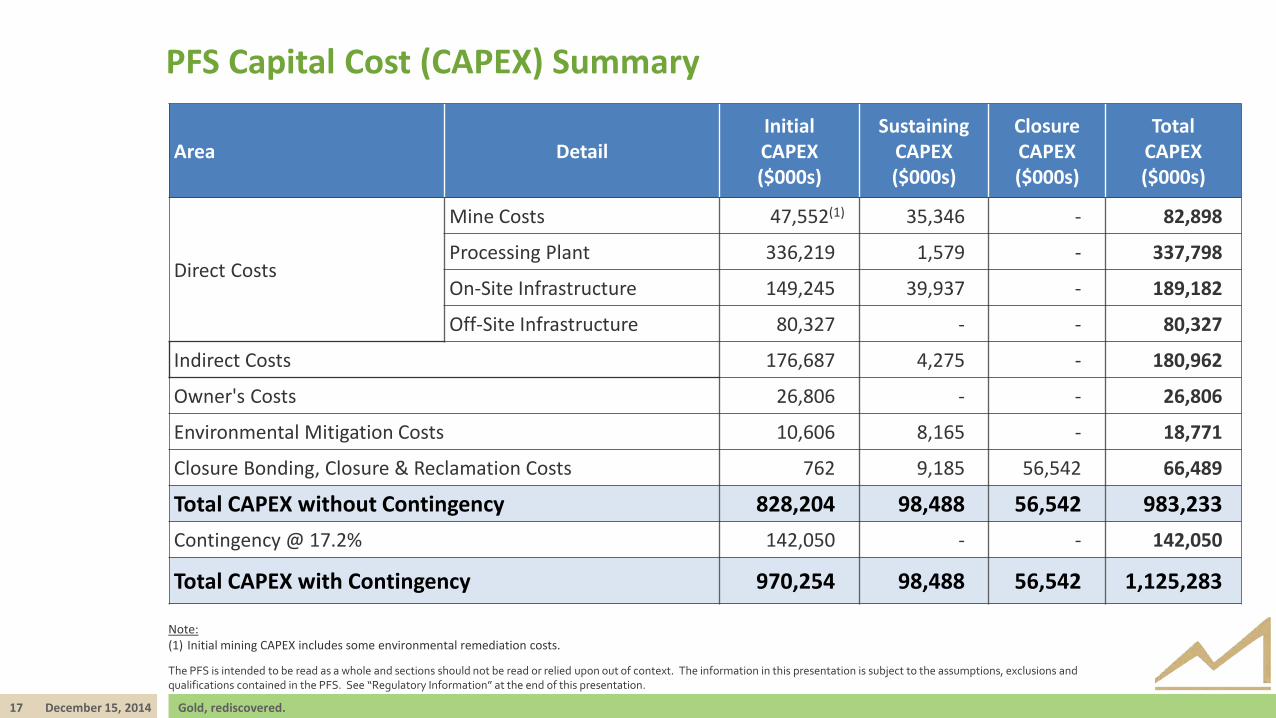
PFS Capital Cost (CAPEX) Summary
Area Detail Initial CAPEX ($000s)
Sustaining CAPEX ($000s)
Closure CAPEX ($000s)
Total CAPEX ($000s)
Direct Costs
Mine Costs 47,552(1) 35,346 - 82,898
Processing Plant 336,219 1,579 - 337,798
On-Site Infrastructure 149,245 39,937 - 189,182
Off-Site Infrastructure 80,327 - - 80,327
Indirect Costs 176,687 4,275 - 180,962
Owner's Costs 26,806 - - 26,806
Environmental Mitigation Costs 10,606 8,165 - 18,771
Closure Bonding, Closure & Reclamation Costs 762 9,185 56,542 66,489
Total CAPEX without Contingency 828,204 98,488 56,542 983,233 Contingency @ 17.2% 142,050 - - 142,050
Total CAPEX with Contingency 970,254 98,488 56,542 1,125,283
The PFS is intended to be read as a whole and sections should not be read or relied upon out of context. The information in this presentation is subject to the assumptions, exclusions and qualifications contained in the PFS. See “Regulatory Information” at the end of this presentation.
Note: (1) Initial mining CAPEX includes some environmental remediation costs.

18 December 15, 2014 Gold, rediscovered.
PFS Operating Cost (OPEX) Summary (Base Case)
Cash Operating Cost Estimate Life-Of-Mine Average Years 1-4 Average
$/tons mined $/tons milled $/oz Au $/tons milled $/oz Au
Mining OPEX(1) 2.00 9.08 222 10.04 222
Processing OPEX 14.45 354 14.10 312
General & Administrative OPEX 3.13 77 3.01 67
Cash Costs(2)(3) 26.65 653 27.15 601
By-product credits -3.45 -85 -5.32 -118
Cash Costs after by-product Credits(3) 23.20 568 21.83 483
Notes: (1) Mining OPEX excludes capitalized stripping. (2) Cash costs shown in this table are before royalties, refining, and transportation charges; for these, see below. (3) See non-IFRS measures at conclusion.
The PFS is intended to be read as a whole and sections should not be read or relied upon out of context. The information in this presentation is subject to the assumptions, exclusions and qualifications contained in the PFS. See “Regulatory Information” at the end of this presentation.

19 December 15, 2014 Gold, rediscovered.
PFS Metal Price Assumptions
Case
Metal Prices
Basis Gold ($/oz)
Silver(1) ($/oz)
Antimony(1) ($/lb)
Case A 1,200 20.00 4.00 Lower-bound case that reflects the lower prices over the past 36 months and spot on December 1, 2014.
Case B (Base Case) 1,350 22.50 4.50 Approximate 24-month trailing average gold price
as of December 1, 2014.
Case C 1,500 25.00 5.00 Approximate 48-month trailing average gold price as of December 1, 2014.
Case D 1,650 27.50 5.50 An upside case to show project potential at metal prices approximately 20% higher than the base case.
Note: (1) Prices were set at a constant gold:silver ratio ($/oz:$/oz) of 60:1 and a constant gold:antimony ratio ($/oz:$/lb) of 300:1 for simplicity of analysis, although individual price
relationships may not be as directly correlated over time. Historic gold:silver ratios have averaged around 60:1. The PFS is intended to be read as a whole and sections should not be read or relied upon out of context. The information in this presentation is subject to the assumptions, exclusions and qualifications contained in the PFS. See “Regulatory Information” at the end of this presentation.
20 December 15, 2014 Gold, rediscovered.
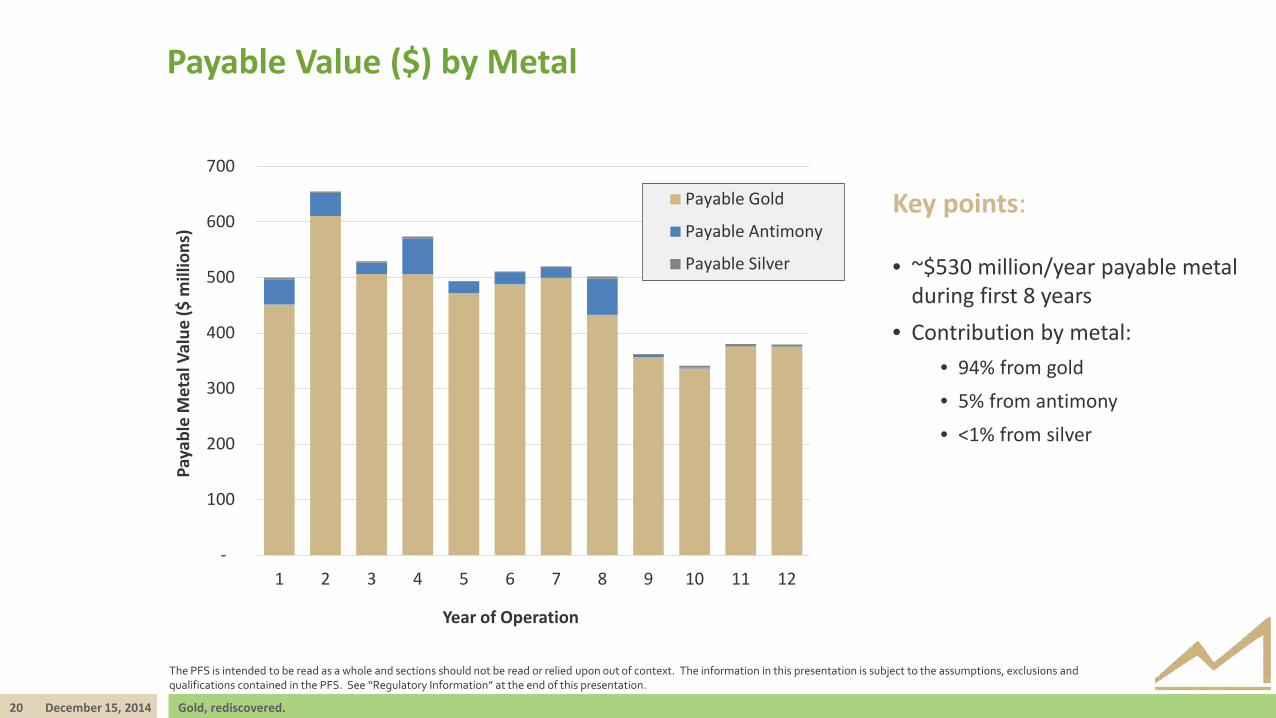
Payable Value ($) by Metal
-
100
200
300
400
500
600
700
1 2 3 4 5 6 7 8 9 10 11 12
Paya
ble
Met
al V
alue
($ m
illio
ns)
Year of Operation
Payable Gold
Payable Antimony
Payable Silver
Key points: • ~$530 million/year payable metal
during first 8 years • Contribution by metal:
• 94% from gold • 5% from antimony • <1% from silver
The PFS is intended to be read as a whole and sections should not be read or relied upon out of context. The information in this presentation is subject to the assumptions, exclusions and qualifications contained in the PFS. See “Regulatory Information” at the end of this presentation.
21 December 15, 2014 Gold, rediscovered.
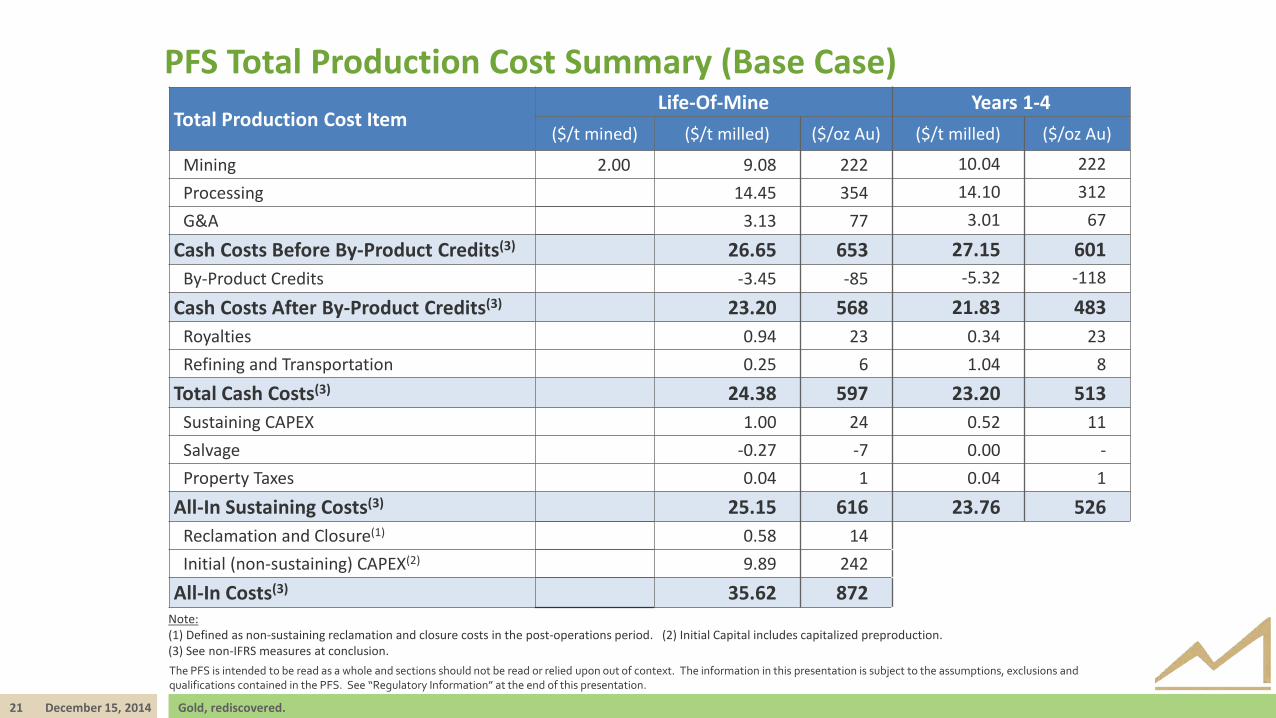
PFS Total Production Cost Summary (Base Case)
Note: (1) Defined as non-sustaining reclamation and closure costs in the post-operations period. (2) Initial Capital includes capitalized preproduction. (3) See non-IFRS measures at conclusion.
Total Production Cost Item Life-Of-Mine Years 1-4
($/t mined) ($/t milled) ($/oz Au) ($/t milled) ($/oz Au)
Mining 2.00 9.08 222 10.04 222 Processing 14.45 354 14.10 312 G&A 3.13 77 3.01 67
Cash Costs Before By-Product Credits(3) 26.65 653 27.15 601 By-Product Credits -3.45 -85 -5.32 -118
Cash Costs After By-Product Credits(3) 23.20 568 21.83 483 Royalties 0.94 23 0.34 23 Refining and Transportation 0.25 6 1.04 8
Total Cash Costs(3) 24.38 597 23.20 513 Sustaining CAPEX 1.00 24 0.52 11 Salvage -0.27 -7 0.00 - Property Taxes 0.04 1 0.04 1
All-In Sustaining Costs(3) 25.15 616 23.76 526 Reclamation and Closure(1) 0.58 14 Initial (non-sustaining) CAPEX(2) 9.89 242
All-In Costs(3) 35.62 872
The PFS is intended to be read as a whole and sections should not be read or relied upon out of context. The information in this presentation is subject to the assumptions, exclusions and qualifications contained in the PFS. See “Regulatory Information” at the end of this presentation.
22 December 15, 2014 Gold, rediscovered.
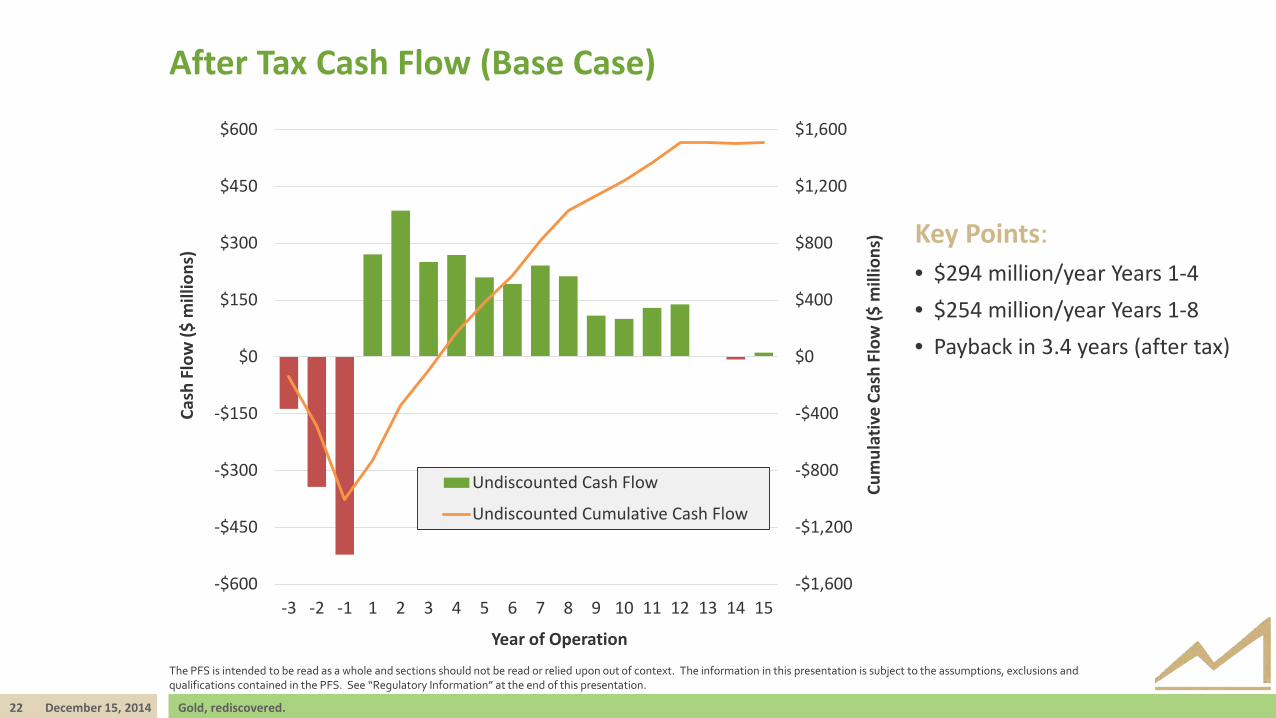
After Tax Cash Flow (Base Case)
-$1,600
-$1,200
-$800
-$400
$0
$400
$800
$1,200
$1,600
-$600
-$450
-$300
-$150
$0
$150
$300
$450
$600
-3 -2 -1 1 2 3 4 5 6 7 8 9 10 11 12 13 14 15
Cum
ulat
ive
Cash
Flo
w ($
mill
ions
)
Cash
Flo
w ($
mill
ions
)
Year of Operation
Undiscounted Cash Flow
Undiscounted Cumulative Cash Flow
Key Points: • $294 million/year Years 1-4 • $254 million/year Years 1-8 • Payback in 3.4 years (after tax)
The PFS is intended to be read as a whole and sections should not be read or relied upon out of context. The information in this presentation is subject to the assumptions, exclusions and qualifications contained in the PFS. See “Regulatory Information” at the end of this presentation.
23 December 15, 2014 Gold, rediscovered.
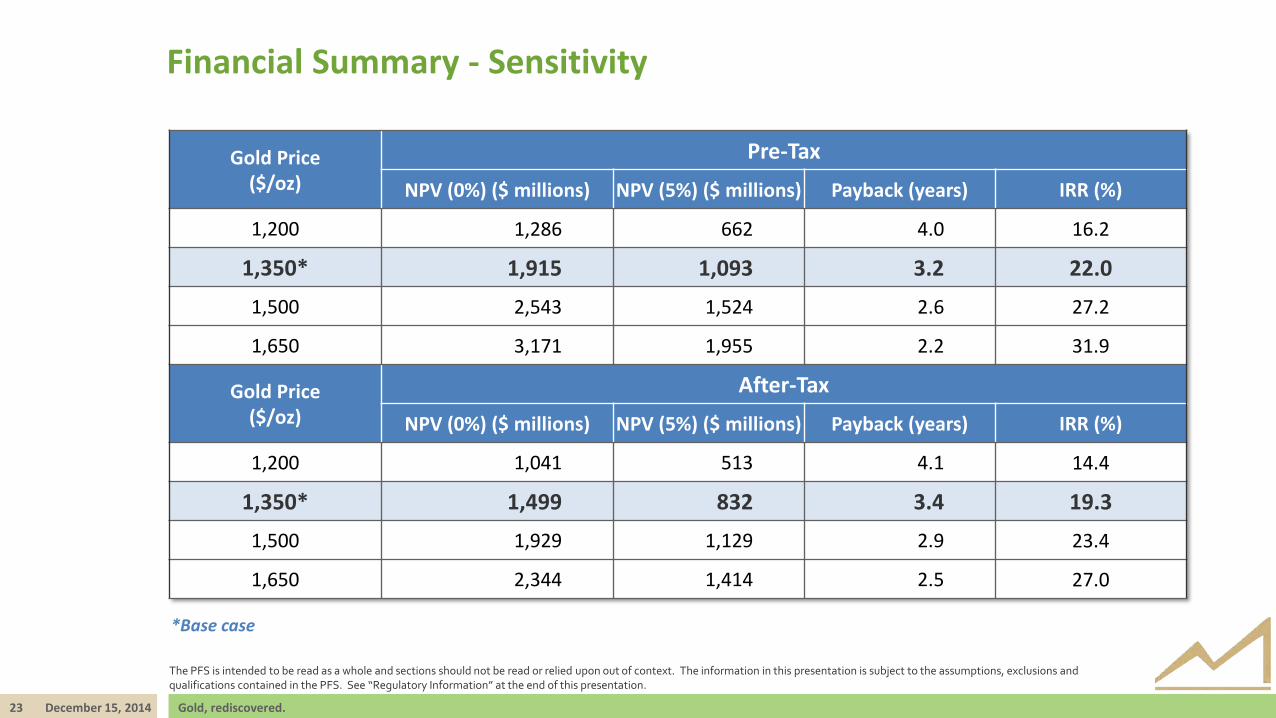
Gold Price ($/oz)
Pre-Tax
NPV (0%) ($ millions) NPV (5%) ($ millions) Payback (years) IRR (%)
1,200 1,286 662 4.0 16.2
1,350* 1,915 1,093 3.2 22.0
1,500 2,543 1,524 2.6 27.2
1,650 3,171 1,955 2.2 31.9
Gold Price ($/oz)
After-Tax
NPV (0%) ($ millions) NPV (5%) ($ millions) Payback (years) IRR (%)
1,200 1,041 513 4.1 14.4
1,350* 1,499 832 3.4 19.3
1,500 1,929 1,129 2.9 23.4
1,650 2,344 1,414 2.5 27.0
*Base case
Financial Summary - Sensitivity
The PFS is intended to be read as a whole and sections should not be read or relied upon out of context. The information in this presentation is subject to the assumptions, exclusions and qualifications contained in the PFS. See “Regulatory Information” at the end of this presentation.

24 December 15, 2014 Gold, rediscovered.
Employment - Direct
0
100
200
300
400
500
600
1 2 3 4 5 6 7 8 9 10 11 12
Num
ber o
f Dire
ct E
mpl
oyee
s
Year of Operation
Mine Operations Mine General Mine Maintenance
Process General & Admin.
Key points: • $28,000/year avg. salary in Idaho • $72,500/year avg. mining salary in
Idaho • 3 year construction period:
• ~700 jobs created in Idaho - ~400 direct
- >300 indirect
• 12 year operating life: • ~1,000 jobs created in Idaho
- ~500 direct jobs - ~500 indirect jobs
• Aggregate annual payroll: • $48 million/year - Construction • $56 million/year - Operations
The PFS is intended to be read as a whole and sections should not be read or relied upon out of context. The information in this presentation is subject to the assumptions, exclusions and qualifications contained in the PFS. See “Regulatory Information” at the end of this presentation.
25 December 15, 2014 Gold, rediscovered.
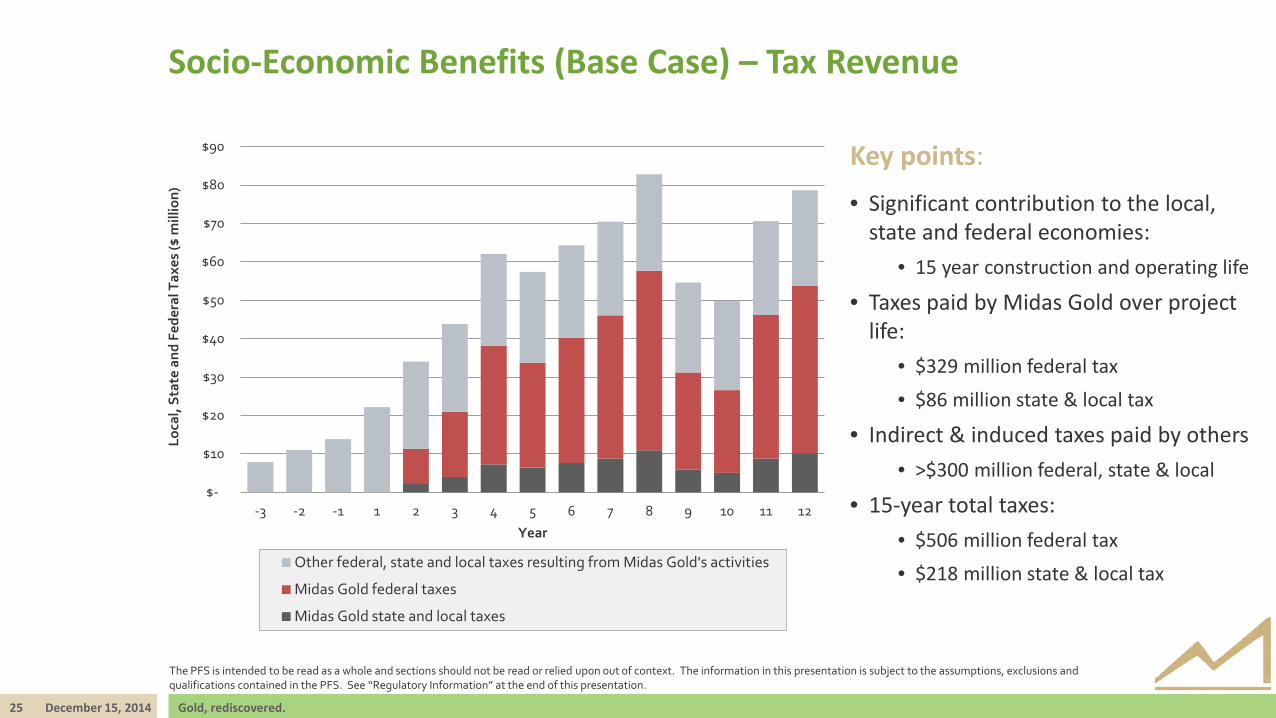
Socio-Economic Benefits (Base Case) – Tax Revenue
Key points: • Significant contribution to the local,
state and federal economies: • 15 year construction and operating life
• Taxes paid by Midas Gold over project life:
• $329 million federal tax • $86 million state & local tax
• Indirect & induced taxes paid by others • >$300 million federal, state & local
• 15-year total taxes: • $506 million federal tax • $218 million state & local tax
The PFS is intended to be read as a whole and sections should not be read or relied upon out of context. The information in this presentation is subject to the assumptions, exclusions and qualifications contained in the PFS. See “Regulatory Information” at the end of this presentation.
$-
$10
$20
$30
$40
$50
$60
$70
$80
$90
-3 -2 -1 1 2 3 4 5 6 7 8 9 10 11 12
Loca
l, St
ate
and
Fede
ral T
axes
($ m
illio
n)
Year
Other federal, state and local taxes resulting from Midas Gold's activities
Midas Gold federal taxes
Midas Gold state and local taxes

26 December 15, 2014 Gold, rediscovered.
Brownfields Site
Objectives: • Reduce incremental impact • Reuse previously impacted areas • Reclaim historically impacted areas
Outcomes: • Upgrade existing Burntlog Road • Use existing power line corridor • Reprocess historic tailings • Reuse impacted area for waste rock • Reuse existing haul roads • Re-mine previously mined areas • West End waste rock used to backfill Yellow Pine pit
27 December 15, 2014 Gold, rediscovered.
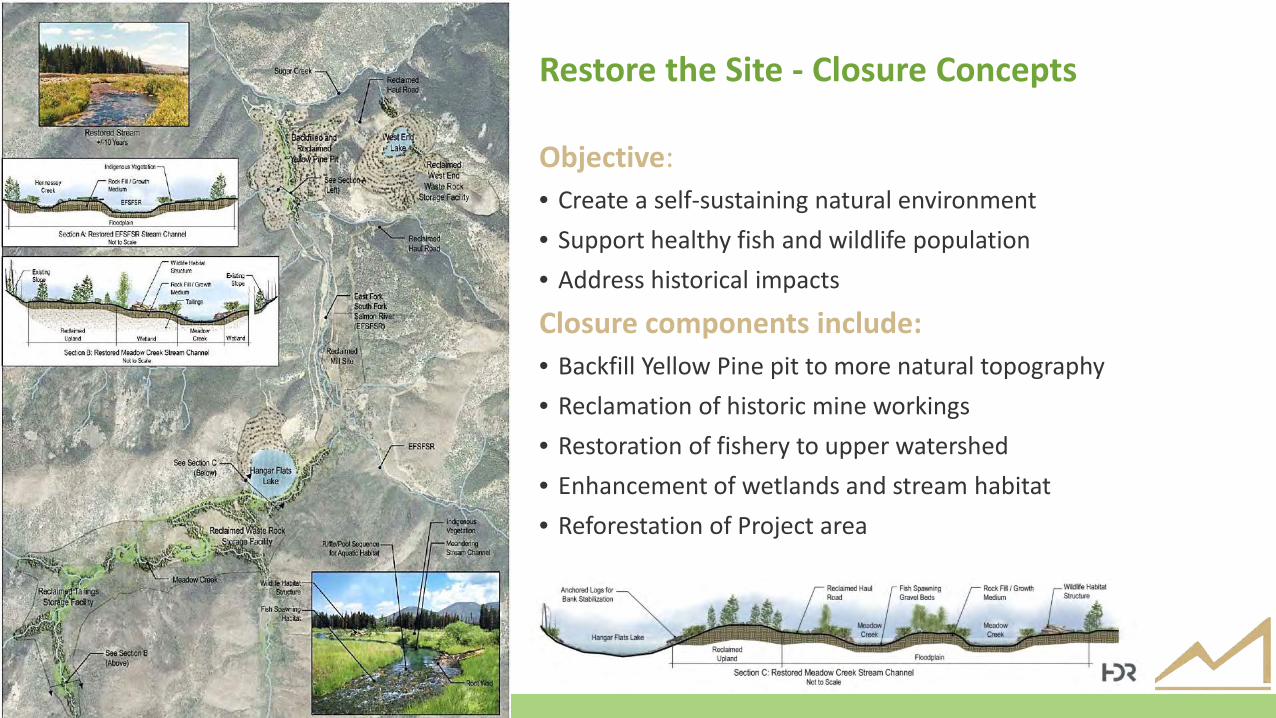
Restore the Site - Closure Concepts
Objective: • Create a self-sustaining natural environment • Support healthy fish and wildlife population • Address historical impacts
Closure components include: • Backfill Yellow Pine pit to more natural topography • Reclamation of historic mine workings • Restoration of fishery to upper watershed • Enhancement of wetlands and stream habitat • Reforestation of Project area

28 December 15, 2014 Gold, rediscovered.
Industry-wide Risks & Opportunities
• Use of historic data in mineral resource estimates, which could affect the estimates • Limited geotechnical data which could affect pit slopes or ground stability in
infrastructure areas • Loss of gold into antimony concentrates where there is potentially significantly lower
payability • Water management and chemistry, which could affect diversion and closure designs
and/or the need for long term water treatment • Construction schedule
• Changes in capital and operating costs related to inputs like steel and fuel • Metal prices • Permitting timelines • Other typical industry-wide matters
Project Specific Risks
29 December 15, 2014 Gold, rediscovered.
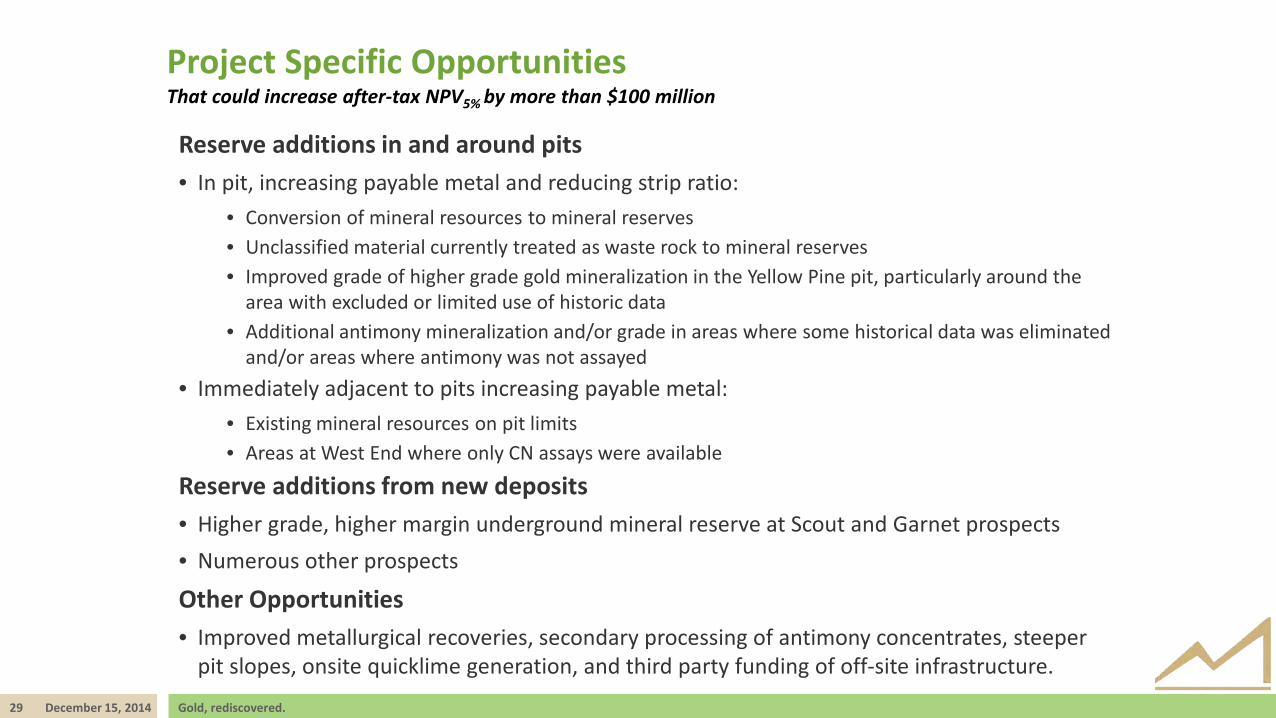
Project Specific Opportunities That could increase after-tax NPV5% by more than $100 million
Reserve additions in and around pits • In pit, increasing payable metal and reducing strip ratio:
• Conversion of mineral resources to mineral reserves • Unclassified material currently treated as waste rock to mineral reserves • Improved grade of higher grade gold mineralization in the Yellow Pine pit, particularly around the
area with excluded or limited use of historic data • Additional antimony mineralization and/or grade in areas where some historical data was eliminated
and/or areas where antimony was not assayed • Immediately adjacent to pits increasing payable metal:
• Existing mineral resources on pit limits • Areas at West End where only CN assays were available
Reserve additions from new deposits • Higher grade, higher margin underground mineral reserve at Scout and Garnet prospects • Numerous other prospects
Other Opportunities • Improved metallurgical recoveries, secondary processing of antimony concentrates, steeper
pit slopes, onsite quicklime generation, and third party funding of off-site infrastructure.

30 December 15, 2014 Gold, rediscovered.
Existing Deposits: • Resource to reserve conversion • Resource/reserve expansion immediately adjacent to pits • In pit unclassified materials • Grade &/or oz increases in historic data areas
Priority Prospects: • Small tonnage, high grade
e.g. Garnet, Scout, Upper Midnight • Bulk tonnage
e.g. Cinnamid-Ridgetop, Saddle-Fern, Rabbit • Undefined airborne targets
e.g. Mule, Salt & Pepper, Blow-out
-
500
1,000
1,500
2,000
2,500
3,000
< 1M oz 1-2M oz 2-5M oz 5-10M oz 10-30M oz >30M oz
# of
Dep
osits
Contained oz of Gold
Stibnite Gold Project
(1) Source: Mineral Economics Group, RBC Capital Markets
Rarity of Global Gold Deposits >5m oz(1)
Resource & Reserve Potential

2014 PFS VS.
2012 PEA
32 December 15, 2014 Gold, rediscovered.
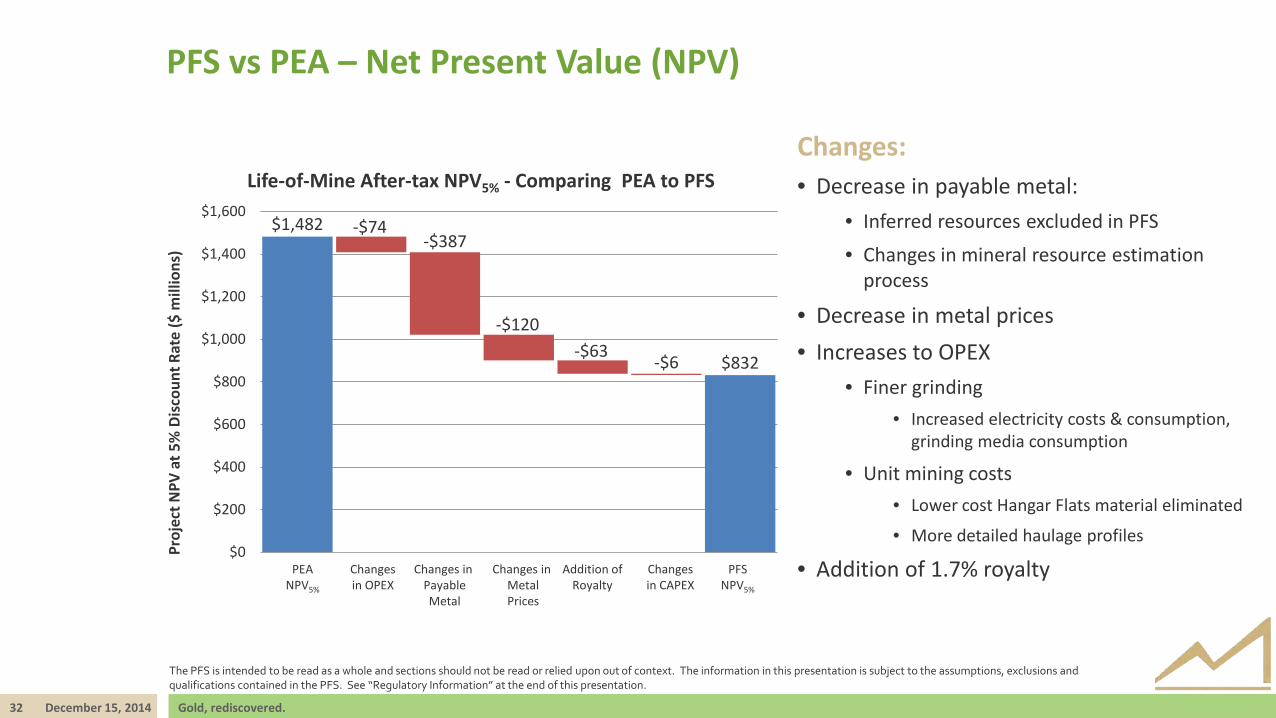
PFS vs PEA – Net Present Value (NPV)
$1,482
$832
-$74 -$387
-$120 -$63 -$6
$0
$200
$400
$600
$800
$1,000
$1,200
$1,400
$1,600
PEANPV
Change inOpex
Change inPayable Metal
Change inMetal Prices
Addition ofRoyalty
Change inCapex
PFSNPV
Proj
ect N
PV a
t 5%
Dis
coun
t Rat
e ($
mill
ions
) Life-of-Mine After-tax NPV5% - Comparing PEA to PFS
Changes: • Decrease in payable metal:
• Inferred resources excluded in PFS • Changes in mineral resource estimation
process
• Decrease in metal prices • Increases to OPEX
• Finer grinding • Increased electricity costs & consumption,
grinding media consumption
• Unit mining costs • Lower cost Hangar Flats material eliminated
• More detailed haulage profiles
• Addition of 1.7% royalty
The PFS is intended to be read as a whole and sections should not be read or relied upon out of context. The information in this presentation is subject to the assumptions, exclusions and qualifications contained in the PFS. See “Regulatory Information” at the end of this presentation.
PEA NPV5%
Changes in OPEX
Changes in Payable Metal
Changes in Metal Prices
Addition of Royalty
Changes in CAPEX
PFS NPV5%

33 December 15, 2014 Gold, rediscovered.
PFS vs PEA – Life-of-Mine Capital Costs (CAPEX)
Changes: • Reductions in mining related costs
• Smaller Hangar Flats pit reduces waste rock and additional equipment requirements
• Leasing major mining equipment
• Contingency reduced • Refined project estimates
• Increases in process plant CAPEX • Related to design changes
• Increased onsite & offsite infrastructure • Power line and access road
• Increased closure costs • Improved quantification of
requirements
$1,182
$31 $97 $19
$1,125 -$176 -$28
0
200
400
600
800
1,000
1,200
1,400
LOM PEACAPEX
Mining Processingand Utilities
Infrastructure Owner CostsMitigation
and Closure
Contigency LOM PFSCAPEX
Life
-of-M
ine
CAPE
X ($
mill
ions
)
Life-of-Mine CAPEX - Comparing PEA to PFS
The PFS is intended to be read as a whole and sections should not be read or relied upon out of context. The information in this presentation is subject to the assumptions, exclusions and qualifications contained in the PFS. See “Regulatory Information” at the end of this presentation.
34 December 15, 2014 Gold, rediscovered.
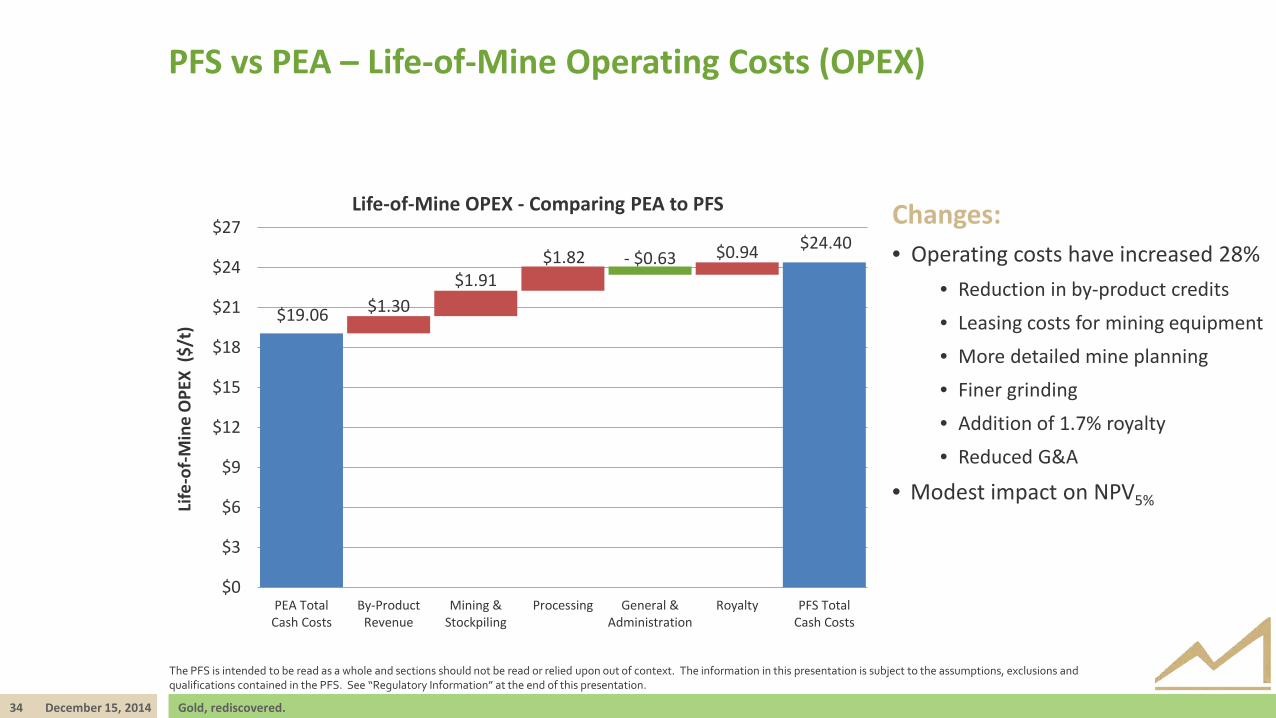
PFS vs PEA – Life-of-Mine Operating Costs (OPEX)
Changes: • Operating costs have increased 28%
• Reduction in by-product credits • Leasing costs for mining equipment • More detailed mine planning • Finer grinding • Addition of 1.7% royalty • Reduced G&A
• Modest impact on NPV5%
$19.06 $1.30 $1.91
$1.82 $0.94 $24.40 - $0.63
$0
$3
$6
$9
$12
$15
$18
$21
$24
$27
PEA TotalCash Costs
By-ProductRevenue
Mining &Stockpiling
Processing General &Administration
Royalty PFS TotalCash Costs
Life
-of-M
ine
OPE
X ($
/t)
Life-of-Mine OPEX - Comparing PEA to PFS
The PFS is intended to be read as a whole and sections should not be read or relied upon out of context. The information in this presentation is subject to the assumptions, exclusions and qualifications contained in the PFS. See “Regulatory Information” at the end of this presentation.

MOVING FORWARD
36 December 15, 2014 Gold, rediscovered.
Regulatory Steps
• Use PFS to engage with regulators, communities, other stakeholders
• Consider and optimize options
• Mitigate impacts
• Demonstrate:
• Concurrent environmental & fisheries enhancement as part of overall mine plan
• A robust closure and final reclamation plan
• Significant local benefits through employment & business opportunities
• Consider Plan of Operations & Environmental Impact Statement for mining & processing operation
• Participation of USFS, US EPA, US Army Corps of Engineers, NOAA Fisheries at federal level, Idaho DEQ, Idaho Dept. of Water Resources, Idaho Dept. of Lands, Idaho Dept. of Fish & Game, et al.
• 50+ permits required
• Ongoing regulatory cooperation through Idaho’s Joint Review Process
• Continued regulator, community and stakeholder engagement
37 December 15, 2014 Gold, rediscovered.
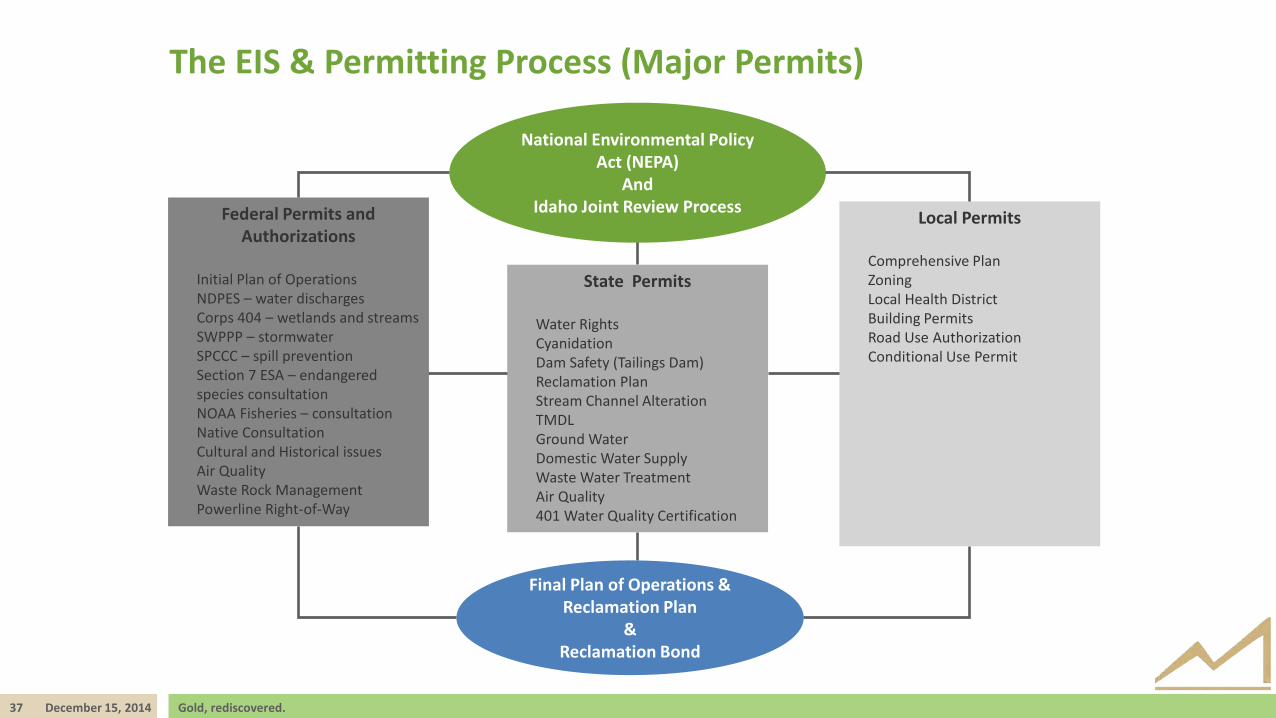
The EIS & Permitting Process (Major Permits)
National Environmental Policy Act (NEPA)
And Idaho Joint Review Process Federal Permits and
Authorizations
Initial Plan of Operations NDPES – water discharges Corps 404 – wetlands and streams SWPPP – stormwater SPCCC – spill prevention Section 7 ESA – endangered species consultation NOAA Fisheries – consultation Native Consultation Cultural and Historical issues Air Quality Waste Rock Management Powerline Right-of-Way
State Permits
Water Rights Cyanidation Dam Safety (Tailings Dam) Reclamation Plan Stream Channel Alteration TMDL Ground Water Domestic Water Supply Waste Water Treatment Air Quality 401 Water Quality Certification
Local Permits
Comprehensive Plan Zoning Local Health District Building Permits Road Use Authorization Conditional Use Permit
Final Plan of Operations & Reclamation Plan
& Reclamation Bond

38 December 15, 2014 Gold, rediscovered.
A Sustainable Project Planned For Closure & Reclamation
Remediate legacy disturbance • Tailings, waste dumps, mill & smelter site,
Design for closure • Wetlands, restore drainage channels
Protect and enhance water quality, fisheries, wetlands, groundwater
• Restore fish passage, reduce sedimentation
Engage, inform, consult & consider stakeholders’ input • Address local priorities
Demonstrate significant net local benefits • Employment, tax benefits and environment
Evaluate & incorporate options to reduce environmental footprint
• Innovative design concepts
Do What is Right:
Current
After

39 December 15, 2014 Gold, rediscovered.
Sustainability: Taking a Proactive Approach
A positive local impact now - be a good citizen: • Hire locally • Use local suppliers & contractors • Participate in and support local activities • Openness & engagement
Do more than is required: • Voluntary environmental remediation
• 26,500 trees planted, more to come
• Sediment reduction measures
• High environmental and safety standards • Zero lost time incidents in 2013 and 2014
Restore the site • Incorporate remediation and restoration into project
design and planning • Restore fish passage, cleaner water
40 December 15, 2014 Gold, rediscovered.
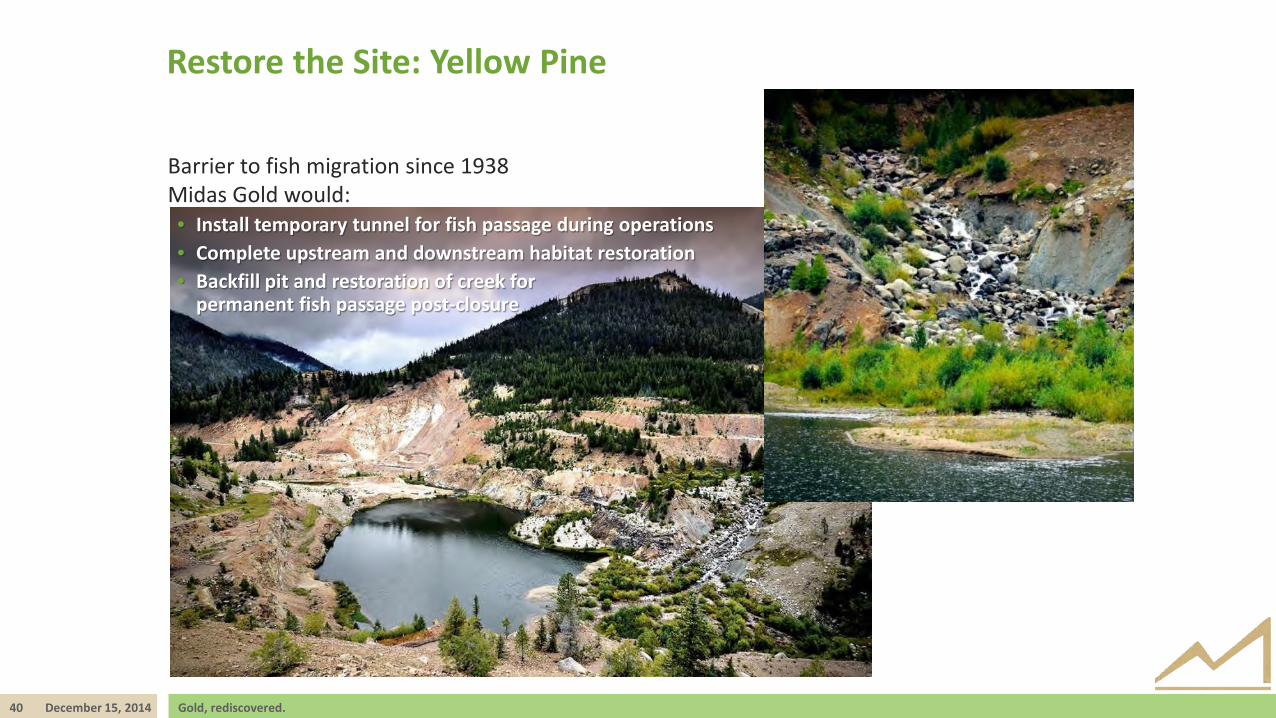
Restore the Site: Yellow Pine
Barrier to fish migration since 1938 Midas Gold would: • Install temporary tunnel for fish passage during operations • Complete upstream and downstream habitat restoration • Backfill pit and restoration of creek for
permanent fish passage post-closure

ADDITIONAL INFORMATION
42 December 15, 2014 Gold, rediscovered.
PFS Team Midas Gold team led by John Meyer, VP Development. Responsible Qualified Persons are:
Conrad E. Huss, P.E., M3 Engineering & Technology Corp. • Introductory and background information, infrastructure, capital and operating costs, economic analysis, conclusions
and recommendations
Garth Kirkham, P. Geo, Kirkham Geosystems Ltd. • Geology, drilling, data verification and mineral resource estimates
Christopher Martin, C.Eng., Blue Coast Metallurgy Ltd. • Mineral processing and metallurgical testing
John M. Marek, P.E., Independent Mining Consultants Inc. • Mineral reserves, mine planning and related capital and operating costs
Allen R. Anderson, P.E., Allen R. Anderson Metallurgical Engineer Inc. • Recovery methods;
Richard C. Kinder, P.E., HDR Engineering Inc. • Access road
Peter E. Kowalewski, P.E., Tierra Group International Ltd. • Climatology, hydrology, tailings and water management infrastructure, closure and related matters
or
INDEPENDENT MINING CONSULTANTS, INC.
43 December 15, 2014 Gold, rediscovered.
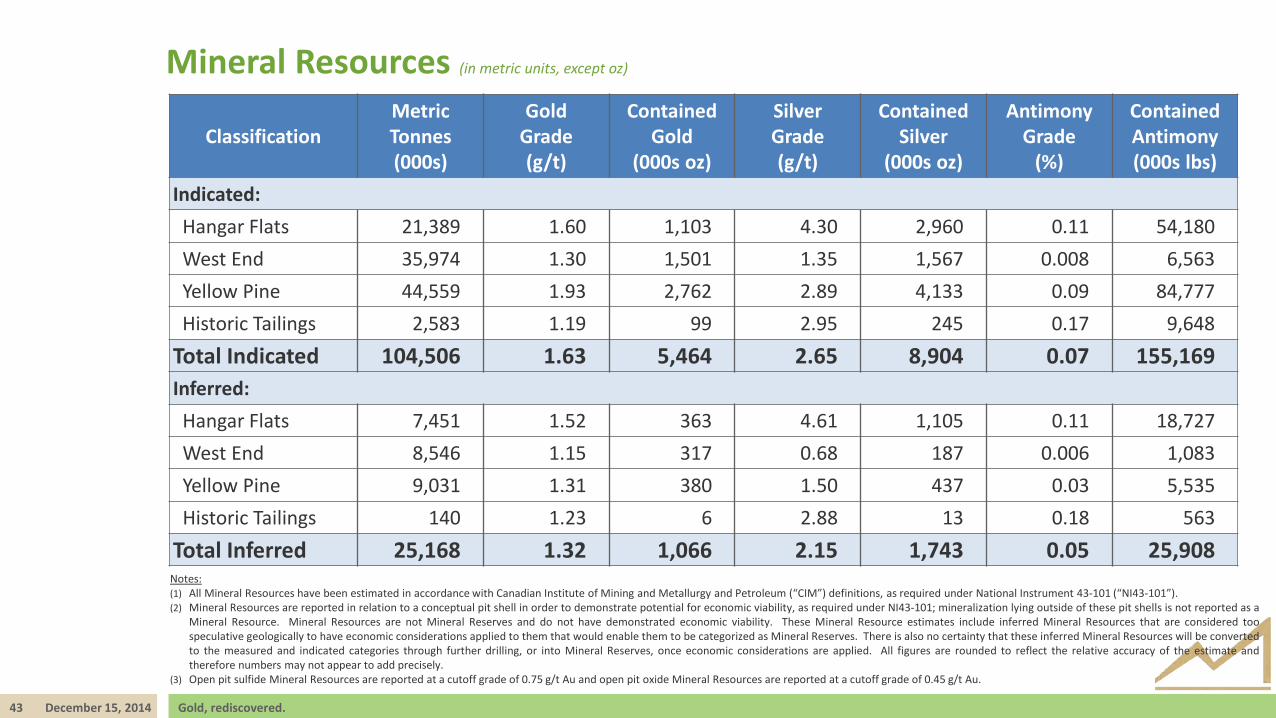
Mineral Resources (in metric units, except oz)
Classification Metric Tonnes (000s)
Gold Grade (g/t)
Contained Gold
(000s oz)
Silver Grade (g/t)
Contained Silver
(000s oz)
Antimony Grade
(%)
Contained Antimony (000s lbs)
Indicated: Hangar Flats 21,389 1.60 1,103 4.30 2,960 0.11 54,180 West End 35,974 1.30 1,501 1.35 1,567 0.008 6,563 Yellow Pine 44,559 1.93 2,762 2.89 4,133 0.09 84,777 Historic Tailings 2,583 1.19 99 2.95 245 0.17 9,648
Total Indicated 104,506 1.63 5,464 2.65 8,904 0.07 155,169 Inferred: Hangar Flats 7,451 1.52 363 4.61 1,105 0.11 18,727 West End 8,546 1.15 317 0.68 187 0.006 1,083 Yellow Pine 9,031 1.31 380 1.50 437 0.03 5,535 Historic Tailings 140 1.23 6 2.88 13 0.18 563
Total Inferred 25,168 1.32 1,066 2.15 1,743 0.05 25,908 Notes: (1) All Mineral Resources have been estimated in accordance with Canadian Institute of Mining and Metallurgy and Petroleum (“CIM”) definitions, as required under National Instrument 43-101 (“NI43-101”). (2) Mineral Resources are reported in relation to a conceptual pit shell in order to demonstrate potential for economic viability, as required under NI43-101; mineralization lying outside of these pit shells is not reported as a
Mineral Resource. Mineral Resources are not Mineral Reserves and do not have demonstrated economic viability. These Mineral Resource estimates include inferred Mineral Resources that are considered too speculative geologically to have economic considerations applied to them that would enable them to be categorized as Mineral Reserves. There is also no certainty that these inferred Mineral Resources will be converted to the measured and indicated categories through further drilling, or into Mineral Reserves, once economic considerations are applied. All figures are rounded to reflect the relative accuracy of the estimate and therefore numbers may not appear to add precisely.
(3) Open pit sulfide Mineral Resources are reported at a cutoff grade of 0.75 g/t Au and open pit oxide Mineral Resources are reported at a cutoff grade of 0.45 g/t Au.
44 December 15, 2014 Gold, rediscovered.
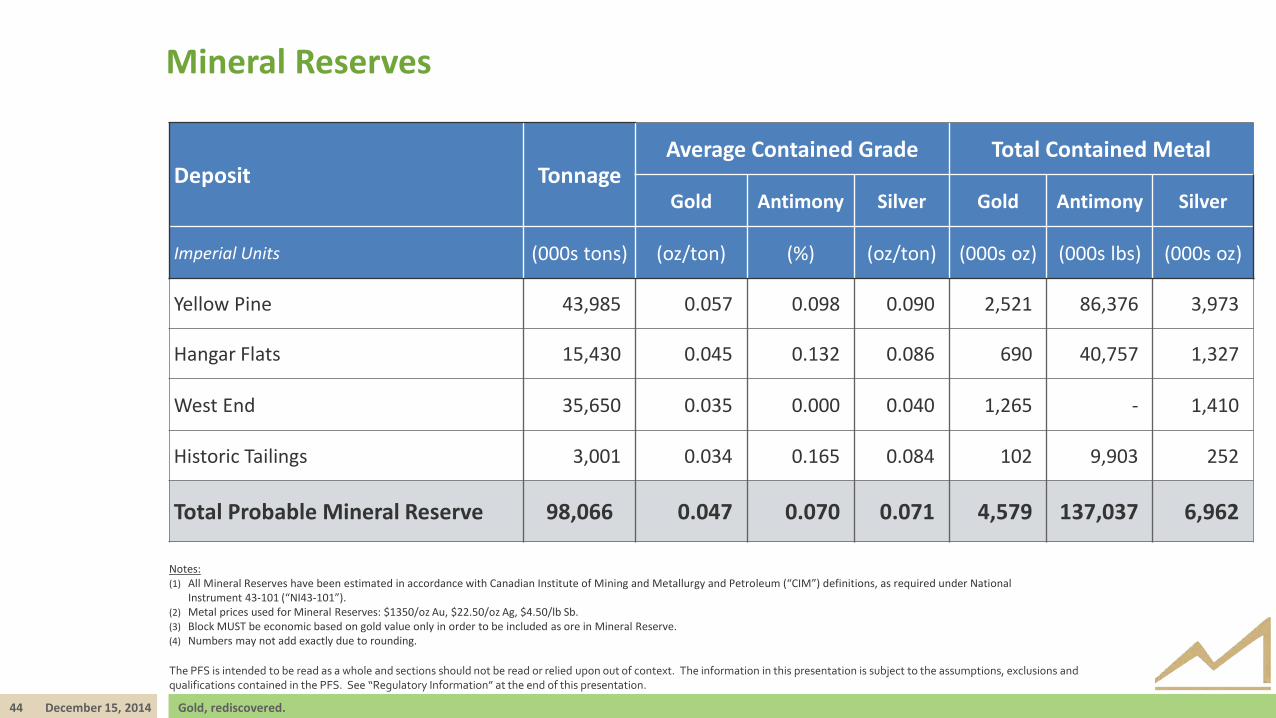
Mineral Reserves
Deposit Tonnage Average Contained Grade Total Contained Metal
Gold Antimony Silver Gold Antimony Silver
Imperial Units (000s tons) (oz/ton) (%) (oz/ton) (000s oz) (000s lbs) (000s oz)
Yellow Pine 43,985 0.057 0.098 0.090 2,521 86,376 3,973
Hangar Flats 15,430 0.045 0.132 0.086 690 40,757 1,327
West End 35,650 0.035 0.000 0.040 1,265 - 1,410
Historic Tailings 3,001 0.034 0.165 0.084 102 9,903 252
Total Probable Mineral Reserve 98,066 0.047 0.070 0.071 4,579 137,037 6,962
Notes: (1) All Mineral Reserves have been estimated in accordance with Canadian Institute of Mining and Metallurgy and Petroleum (“CIM”) definitions, as required under National
Instrument 43-101 (“NI43-101”). (2) Metal prices used for Mineral Reserves: $1350/oz Au, $22.50/oz Ag, $4.50/lb Sb. (3) Block MUST be economic based on gold value only in order to be included as ore in Mineral Reserve. (4) Numbers may not add exactly due to rounding.
The PFS is intended to be read as a whole and sections should not be read or relied upon out of context. The information in this presentation is subject to the assumptions, exclusions and qualifications contained in the PFS. See “Regulatory Information” at the end of this presentation.
45 December 15, 2014 Gold, rediscovered.
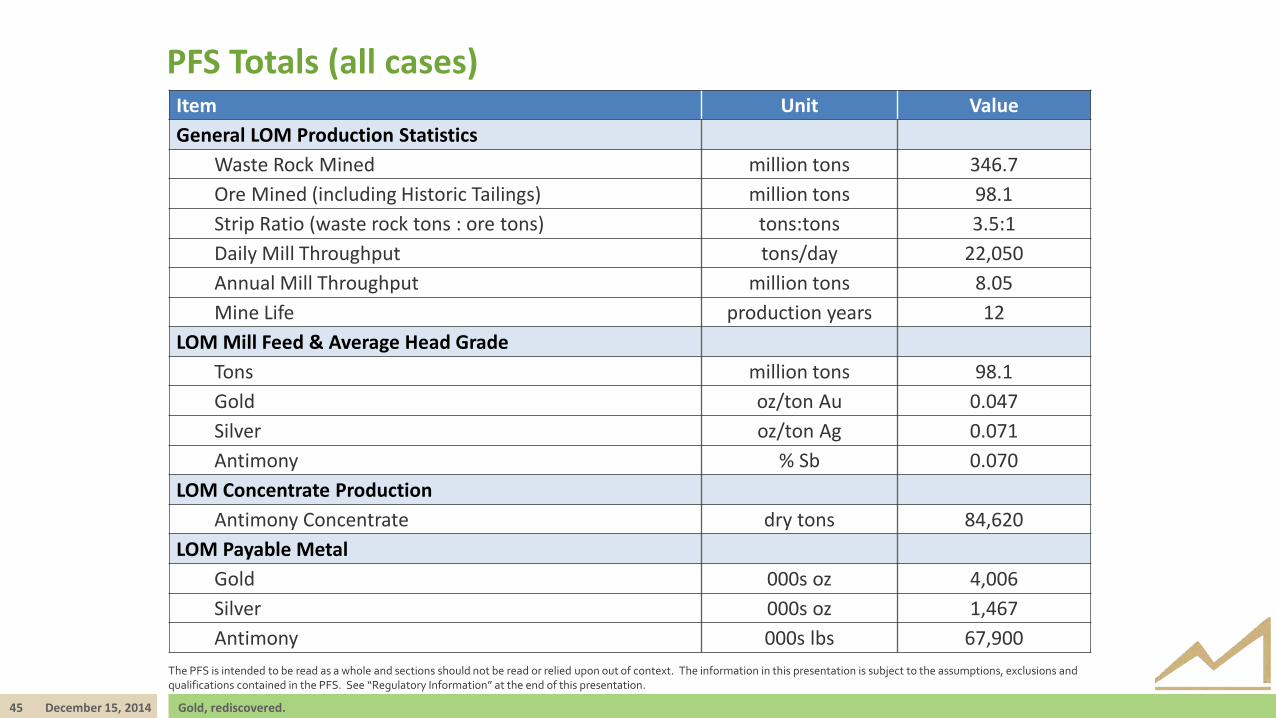
PFS Totals (all cases) Item Unit Value General LOM Production Statistics
Waste Rock Mined million tons 346.7 Ore Mined (including Historic Tailings) million tons 98.1 Strip Ratio (waste rock tons : ore tons) tons:tons 3.5:1 Daily Mill Throughput tons/day 22,050 Annual Mill Throughput million tons 8.05 Mine Life production years 12
LOM Mill Feed & Average Head Grade Tons million tons 98.1 Gold oz/ton Au 0.047 Silver oz/ton Ag 0.071 Antimony % Sb 0.070
LOM Concentrate Production Antimony Concentrate dry tons 84,620
LOM Payable Metal Gold 000s oz 4,006 Silver 000s oz 1,467 Antimony 000s lbs 67,900
The PFS is intended to be read as a whole and sections should not be read or relied upon out of context. The information in this presentation is subject to the assumptions, exclusions and qualifications contained in the PFS. See “Regulatory Information” at the end of this presentation.
46 December 15, 2014 Gold, rediscovered.
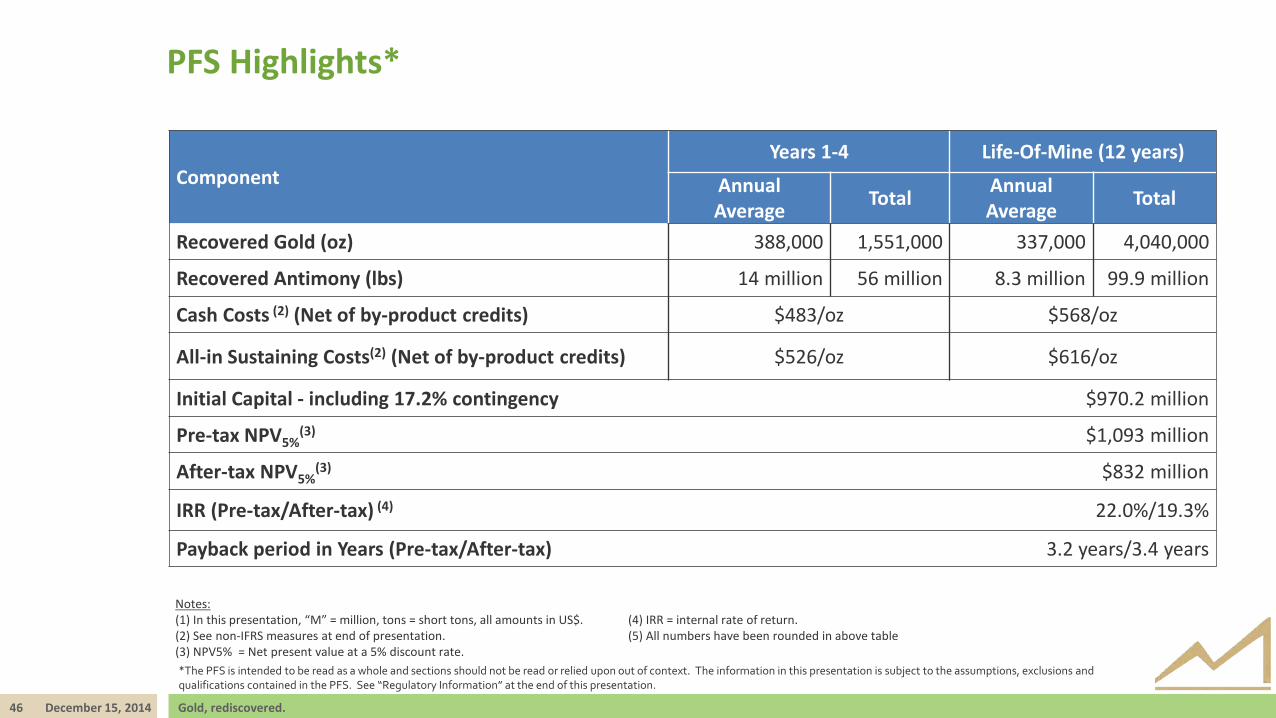
PFS Highlights*
Component Years 1-4 Life-Of-Mine (12 years)
Annual Average Total Annual
Average Total
Recovered Gold (oz) 388,000 1,551,000 337,000 4,040,000
Recovered Antimony (lbs) 14 million 56 million 8.3 million 99.9 million
Cash Costs (2) (Net of by-product credits) $483/oz $568/oz
All-in Sustaining Costs(2) (Net of by-product credits) $526/oz $616/oz
Initial Capital - including 17.2% contingency $970.2 million
Pre-tax NPV5%(3) $1,093 million
After-tax NPV5%(3) $832 million
IRR (Pre-tax/After-tax) (4) 22.0%/19.3%
Payback period in Years (Pre-tax/After-tax) 3.2 years/3.4 years
Notes: (1) In this presentation, “M” = million, tons = short tons, all amounts in US$. (2) See non-IFRS measures at end of presentation. (3) NPV5% = Net present value at a 5% discount rate. *The PFS is intended to be read as a whole and sections should not be read or relied upon out of context. The information in this presentation is subject to the assumptions, exclusions and qualifications contained in the PFS. See “Regulatory Information” at the end of this presentation.
(4) IRR = internal rate of return. (5) All numbers have been rounded in above table
47 December 15, 2014 Gold, rediscovered.
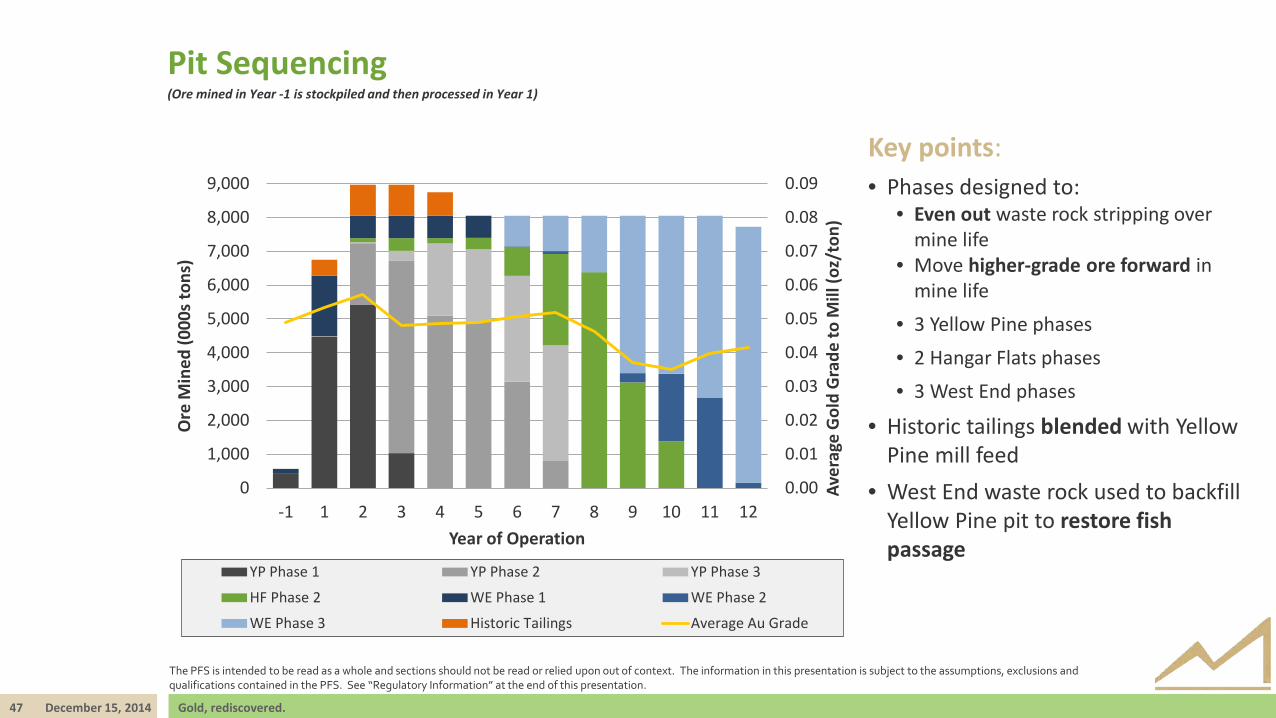
(Ore mined in Year -1 is stockpiled and then processed in Year 1)
Pit Sequencing
0.00
0.01
0.02
0.03
0.04
0.05
0.06
0.07
0.08
0.09
0
1,000
2,000
3,000
4,000
5,000
6,000
7,000
8,000
9,000
-1 1 2 3 4 5 6 7 8 9 10 11 12
Aver
age
Gol
d G
rade
to M
ill (o
z/to
n)
Ore
Min
ed (0
00s
tons
)
Year of Operation
YP Phase 1 YP Phase 2 YP Phase 3
HF Phase 2 WE Phase 1 WE Phase 2
WE Phase 3 Historic Tailings Average Au Grade
Key points: • Phases designed to:
• Even out waste rock stripping over mine life
• Move higher-grade ore forward in mine life
• 3 Yellow Pine phases • 2 Hangar Flats phases • 3 West End phases
• Historic tailings blended with Yellow Pine mill feed
• West End waste rock used to backfill Yellow Pine pit to restore fish passage
The PFS is intended to be read as a whole and sections should not be read or relied upon out of context. The information in this presentation is subject to the assumptions, exclusions and qualifications contained in the PFS. See “Regulatory Information” at the end of this presentation.
48 December 15, 2014 Gold, rediscovered.
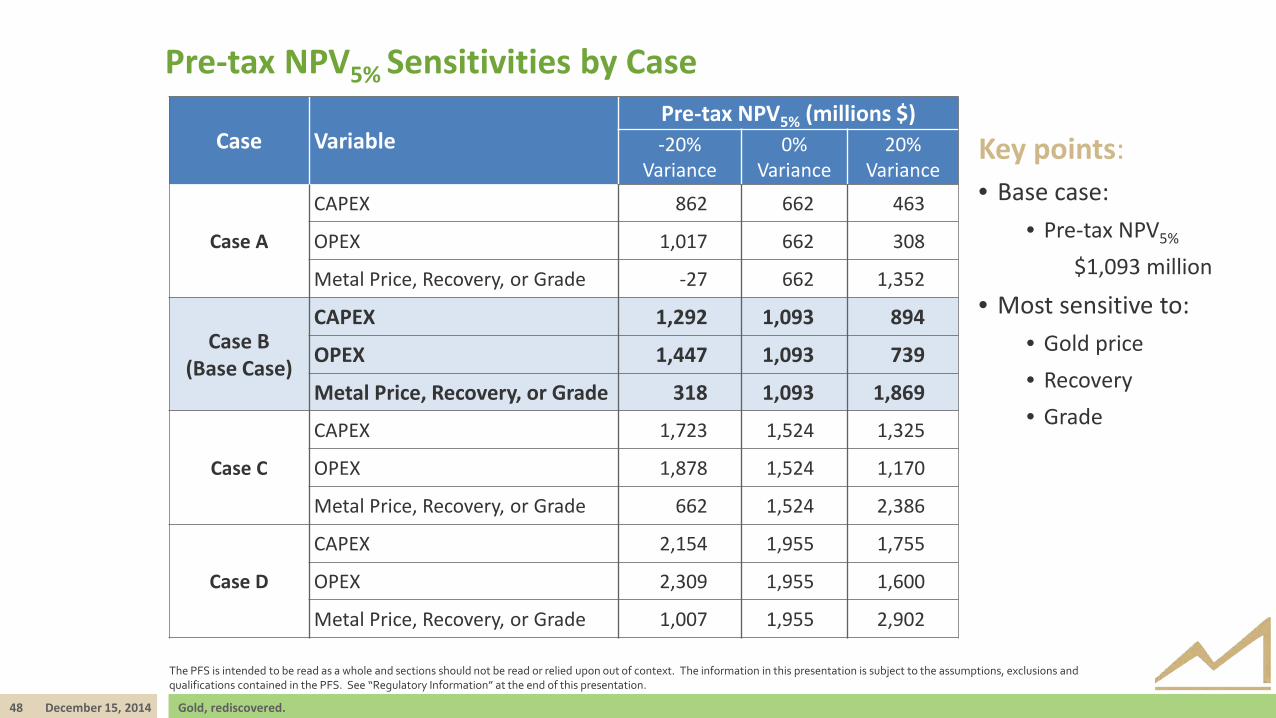
Pre-tax NPV5% Sensitivities by Case
Case Variable Pre-tax NPV5% (millions $) -20%
Variance 0%
Variance 20%
Variance
Case A
CAPEX 862 662 463
OPEX 1,017 662 308
Metal Price, Recovery, or Grade -27 662 1,352
Case B (Base Case)
CAPEX 1,292 1,093 894
OPEX 1,447 1,093 739
Metal Price, Recovery, or Grade 318 1,093 1,869
Case C
CAPEX 1,723 1,524 1,325
OPEX 1,878 1,524 1,170
Metal Price, Recovery, or Grade 662 1,524 2,386
Case D
CAPEX 2,154 1,955 1,755
OPEX 2,309 1,955 1,600
Metal Price, Recovery, or Grade 1,007 1,955 2,902
Key points: • Base case:
• Pre-tax NPV5% $1,093 million
• Most sensitive to: • Gold price • Recovery • Grade
The PFS is intended to be read as a whole and sections should not be read or relied upon out of context. The information in this presentation is subject to the assumptions, exclusions and qualifications contained in the PFS. See “Regulatory Information” at the end of this presentation.

49 December 15, 2014 Gold, rediscovered.
After-tax NPV5% Sensitivities by Case
Case Variable After-Tax NPV5% (Millions $) -20%
Variance 0%
Variance 20%
Variance
Case A
CAPEX 676 513 346
OPEX 760 513 239
Metal Price, Recovery, or Grade -30 513 1,012
Case B (Base Case)
CAPEX 980 832 674
OPEX 1,057 832 577
Metal Price, Recovery, or Grade 244 832 1,357
Case C
CAPEX 1,266 1,129 982
OPEX 1,341 1,129 903
Metal Price, Recovery, or Grade 513 1,129 1,696
Case D
CAPEX 1,548 1,414 1,277
OPEX 1,623 1,414 1,200
Metal Price, Recovery, or Grade 770 1,414 2,035
Key points: • Base case:
• After-tax NPV5% $832 million
• Most sensitive to: • Gold price • Recovery • Grade
The PFS is intended to be read as a whole and sections should not be read or relied upon out of context. The information in this presentation is subject to the assumptions, exclusions and qualifications contained in the PFS. See “Regulatory Information” at the end of this presentation.

REGULATORY INFORMATION
51 December 15, 2014 Gold, rediscovered.
The technical information in this presentation (the “Technical Information”) has been approved by Stephen P. Quin, P. Geo., President & CEO of Midas Gold Corp. (together with its subsidiaries, “Midas Gold”) and a Qualified Person. Midas Gold’s exploration activities at Stibnite Gold were carried out under the supervision of Christopher Dail, C.P.G., Qualified Person and Exploration Manager and Richard Moses, C.P.G., Qualified Person and Site Operations Manager. For readers to fully understand the information in this presentation, they should read the Pre-Feasibility Study Report (to be available on SEDAR or at www.midasgoldcorp.com) in its entirety (the “Technical Report”), including all qualifications, assumptions and exclusions that relate to the information set out in this presentation that qualifies the Technical Information. The Technical Report is intended to be read as a whole, and sections or summaries should not be read or relied upon out of context. The technical information in the Technical Report is subject to the assumptions and qualifications contained therein.
Mineral resources that are not mineral reserves do not have demonstrated economic viability. Mineral resource estimates do not account for mineability, selectivity, mining loss and dilution. These mineral resource estimates include inferred mineral resources that are considered too speculative geologically to have economic considerations applied to them that would enable them to be categorized as mineral reserves. There is also no certainty that these Inferred mineral resources will be converted to the Measured and Indicated categories through further drilling, or into mineral reserves, once economic considerations are applied.
The mineral resources and mineral reserves at the Stibnite Gold Project are contained within areas that have seen historic disturbance resulting from prior mining activities. In order for Midas Gold to advance its interests at Stibnite, the Project will be subject to a number of federal, State and local laws and regulations and will require permits to conduct its activities. However, Midas Gold is not aware of any environmental, permitting, legal or other reasons that would prevent it from advancing the project.
The PFS was compiled by M3 Engineering & Technology Corp. (“M3”) which was engaged by Midas Gold Corp.’s wholly owned subsidiary, Midas Gold, Inc. (“MGI”), to evaluate potential options for the possible redevelopment of the Stibnite Gold Project based on information available up to the date of the PFS. Givens Pursley LLP (land tenure), Kirkham Geosystems Ltd. (mineral resources), Blue Coast Metallurgy Ltd. (metallurgy), Pieterse Consulting, Inc. (autoclave), Independent Mining Consultants Inc. (mine plan and mineral reserves), Allen R. Anderson Metallurgical Engineer Inc. (recovery methods), HDR Engineering Inc. (access road), SPF Water Engineering, LLC (water rights) and Tierra Group International Ltd. (tailings, water management infrastructure and closure) also contributed to the PFS. Additional details of responsibilities are provided at the end of this news release and in the technical report to be filed on SEDAR by the end of 2014. The PFS supersedes and replaces the technical report entitled ‘Preliminary Economic Assessment Technical Report for the Golden Meadows Project, Idaho’ prepared by SRK Consulting (Canada) Inc. and dated September 21, 2012 (PEA) and that reporte PEA should no longer be relied upon.
"Cash Costs", “All-in Sustaining Costs” and “Total costs” are not Performance Measures reported in accordance with International Financial Reporting Standards (“IFRS”). These performance measures are included because these statistics are key performance measures that management uses to monitor performance. Management uses these statistics to assess how the Project ranks against its peer projects and to assess the overall effectiveness and efficiency of the contemplated mining operations. These performance measures do not have a meaning within IFRS and, therefore, amounts presented may not be comparable to similar data presented by other mining companies. These performance measures should not be considered in isolation as a substitute for measures of performance in accordance with IFRS.
Compliance With NI43-101
Non-IFRS Reporting Measures
FOR MORE INFORMATION: Tel: 778.724.4700 Fax: 604.558.4700 E-mail: [email protected] Suite 1250 – 999 West Hastings Street Vancouver, BC CANADA V6C 2W2 www.midasgoldcorp.com