Embed Size (px)
Citation preview
IEEE TRANSACTIONS ON AUDIO, SPEECH, AND LANGUAGE PROCESSING, VOL. 22, NO. 12, DECEMBER 2014 1
STFT Phase Reconstruction in Voiced Speech for
an Improved Single-Channel Speech EnhancementMartin Krawczyk and Timo Gerkmann, Member, IEEE
Abstract—The enhancement of speech which is corrupted bynoise is commonly performed in the short-time discrete Fouriertransform domain. In case only a single microphone signalis available, typically only the spectral amplitude is modified.However, it has recently been shown that an improved spectralphase can as well be utilized for speech enhancement, e.g. forphase-sensitive amplitude estimation. In this paper we thereforepresent a method to reconstruct the spectral phase of voicedspeech from only the fundamental frequency and the noisyobservation. The importance of the spectral phase is highlightedand we elaborate on the reason why noise reduction can beachieved by modifications of the spectral phase. We show that,when the noisy phase is enhanced using the proposed phasereconstruction, instrumental measures predict an increase ofspeech quality over a range of signal to noise ratios, even withoutexplicit amplitude enhancement.
Index Terms—phase estimation, noise reduction, speech en-hancement, signal reconstruction.
I. INTRODUCTION
In this paper, we focus on the enhancement of single-
channel speech corrupted by additive noise. Besides applica-
tions where only a single microphone is available, e.g. due
to limited battery capacity, computational power, or space,
single-channel speech enhancement is relevant also as a post-
processing step to multi-channel spatial processing. The re-
duction of detrimental noise components is indispensable, e.g.
in hearing devices and smartphones, which are expected to
work reliably also in adverse acoustical situations.
Many well-known and frequently employed noise reduction
algorithms are formulated in the short-time discrete Fourier
transform (STFT) domain, since it allows for spectro-temporal
selective processing of sounds, while being intuitive to in-
terpret and fast to compute. The complex valued spectral
coefficients can be represented in terms of their amplitudes and
phases. Frequently, it is assumed that the enhancement of the
noisy spectral amplitude is perceptively more important than
the enhancement of the spectral phase [1]. Thus, research has
mainly focused on the estimation of the clean speech spectral
amplitudes from the noisy observation, while the enhancement
of the noisy spectral phase attracted far less interest. The
short-time spectral amplitude estimator (STSA) and the log-
spectral amplitude estimator (LSA) proposed by Ephraim and
Copyright (c) 2014 IEEE. Personal use of this material is permitted.However, permission to use this material for any other purposes must beobtained from the IEEE by sending a request to [email protected].
The authors are with the Speech Signal Processing Group, Department ofMedical Physics and Acoustics and Cluster of Excellence ”Hearing4all”, Uni-versitat Oldenburg, 26111 Oldenburg, Germany, e-mail: martin.krawczyk,[email protected], web: www.speech.uni-oldenburg.de. Thiswork was supported by the DFG Cluster of Excellence EXC 1077/1 ”Hear-ing4all” and by the DFG Project GE2538/2-1.
Malah [2], [3] are probably the most popular examples of such
amplitude enhancement schemes. The authors also showed that
for Gaussian distributed real and imaginary parts of the clean
and noise spectral coefficients, the minimum mean square error
(MMSE) optimal estimate of the clean spectral phase is the
noisy phase itself, justifying its use for signal reconstruction
[2].
Nevertheless, in the recent past, research on the role of
the spectral phase picked up pace, e.g. [4]–[14]. Paliwal et
al. [4] investigated the importance of the spectral phase in
speech enhancement and came to the conclusion ”that research
into better phase spectrum estimation algorithms, while a
challenging task, could be worthwhile”. They showed that an
enhanced spectral phase can indeed lead to an increased speech
quality. Motivated by these findings, in this paper we present
a novel approach towards the enhancement of noise corrupted
speech based on improved spectral phases.
Because of signal correlations and since neighboring STFT
segments are typically overlapping by 50% or more, the
spectral coefficients of successive segments are correlated. Fur-
thermore, spectral coefficients of neighboring frequency bands
show dependencies due to the limited length of the signal
segments and the form of the spectral analysis window. This
effect is known as spectral leakage and affects both, spectral
amplitudes as well as phases. These relations are exploited
by the approach of Griffin and Lim [1], which iteratively
estimates spectral phases given the spectral amplitudes of a
speech signal. For this, the STFT and its inverse are repeatedly
computed, where the spectral amplitude is constrained to stay
unchanged and only the phase is updated. Over the years,
various modifications of this approach have been proposed. For
a compact overview see [7]. It has been reported that with the
iterative approach of Griffin and Lim perceptually good results
can be achieved in case the clean spectral amplitudes are
perfectly known [7]. However, if the amplitudes are estimated,
as it is the case in noise reduction, the benefit is limited
[15]. A related approach on combined amplitude and phase
estimation in noise reduction and source separation is known
as consistent Wiener filtering [8], where the classical Wiener
filter is constrained to yield a consistent estimate of the clean
spectral coefficients, obeying the correct relations between
adjacent time-frequency points. Besides approaches aiming at
estimating the clean speech spectral phase, Sugiyama et. al
[6] also pointed out the importance of the spectral phase of
the noise components and proposed a noise reduction scheme
based on the randomization of the spectral phase of the noise.
Also for single-channel speech separation, estimates of
the clean spectral phase have been shown to yield valuable
information that can effectively be employed to improve the
IEEE TRANSACTIONS ON AUDIO, SPEECH, AND LANGUAGE PROCESSING, VOL. 22, NO. 12, DECEMBER 2014 2
separation performance, e.g. [9], [10]. While [9] again relies
on an iterative procedure for estimating the spectral phases,
in [10] a non-iterative approach for two concurring sources
incorporating the group-delay function is proposed. For these
approaches, the spectral amplitudes of all sources need to be
known.
In this contribution, evolving from our preliminary work
in [16], we first discuss visualizations of the speech spectral
phase to reveal structures in the phase and show that these
phase structures are disturbed by additive noise. Then, a
method to recover the clean spectral phase of voiced speech
along time and frequency is presented. We again exploit the
relations of neighboring time-frequency points due to the
structure of the STFT, but also incorporate signal information
using a harmonic model for voiced speech. Independently
of our work, employment of harmonic-model-based spectral
phase estimates has also been proposed in [17]. There, the
phase estimation is performed only along time and only in the
direct neighborhood of the harmonic components. In contrast
to that, our approach also reconstructs the phase between the
harmonic components across frequency bands. We will show
that this phase reconstruction between the harmonics allows
for an increased noise reduction during voiced speech when
the phase estimates are employed for speech enhancement.
Note that for the proposed phase reconstruction algorithm
only the fundamental frequency of the speech signal needs
to be estimated. We explain why by only combining the
reconstructed phase with noisy amplitudes, noise between
spectral harmonics can be reduced, and show that this im-
proves the speech quality predicted by instrumental measures.
Informal listening confirms the noise reduction during voiced
speech at the expense of a slightly synthetic sounding residual
signal. These artifacts are however effectively alleviated by
incorporating uncertainty about the phase estimate and by
combination with amplitude enhancement [12]–[14].
This paper is organized as follows: In Sec. II, we introduce
the signal model and derive a novel, visually more informative
representation of the spectral phase. An approach for phase
reconstruction along time is presented in Sec. III, followed by
phase reconstruction across frequency and a combination of
both in Sec. IV. In Sec. V, the proposed phase reconstruction
methods are analyzed in detail and utilized for the reduction
of noise. Then, our algorithms are evaluated on a database of
noise-corrupted speech in Sec. VI.
II. SIGNAL MODEL AND NOTATION
We assume that at each time instance n the clean speech
signal s (n) is degraded by additive noise v (n) and that only
the noisy mixture y (n) = s (n)+v (n) is observed. The noisy
observation is separated into segments of M samples, using a
hop size of L samples. Each segment is first multiplied with an
analysis window w (n) and then transformed using the discrete
Fourier transform (DFT). The resulting STFT representation
is denoted as
Yk,ℓ = Sk,ℓ + Vk,ℓ
=
N−1∑
n=0
y (ℓL+ n)w (n) e−jΩkn, (1)
freq
uen
cy[k
Hz]
amplitude
0.5 1 1.5 2 2.5-80
-60
-40
-20
0
0
1
2
3
4phase
0.5 1 1.5 2 2.5−π
0
π
0
1
2
3
4
time [sec]
freq
uen
cy[k
Hz]
instantaneous frequency
0.5 1 1.5 2 2.5−π
0
π
0
1
2
3
4
time [sec]
BPD
0.5 1 1.5 2 2.5−π
0
π
0
1
2
3
4
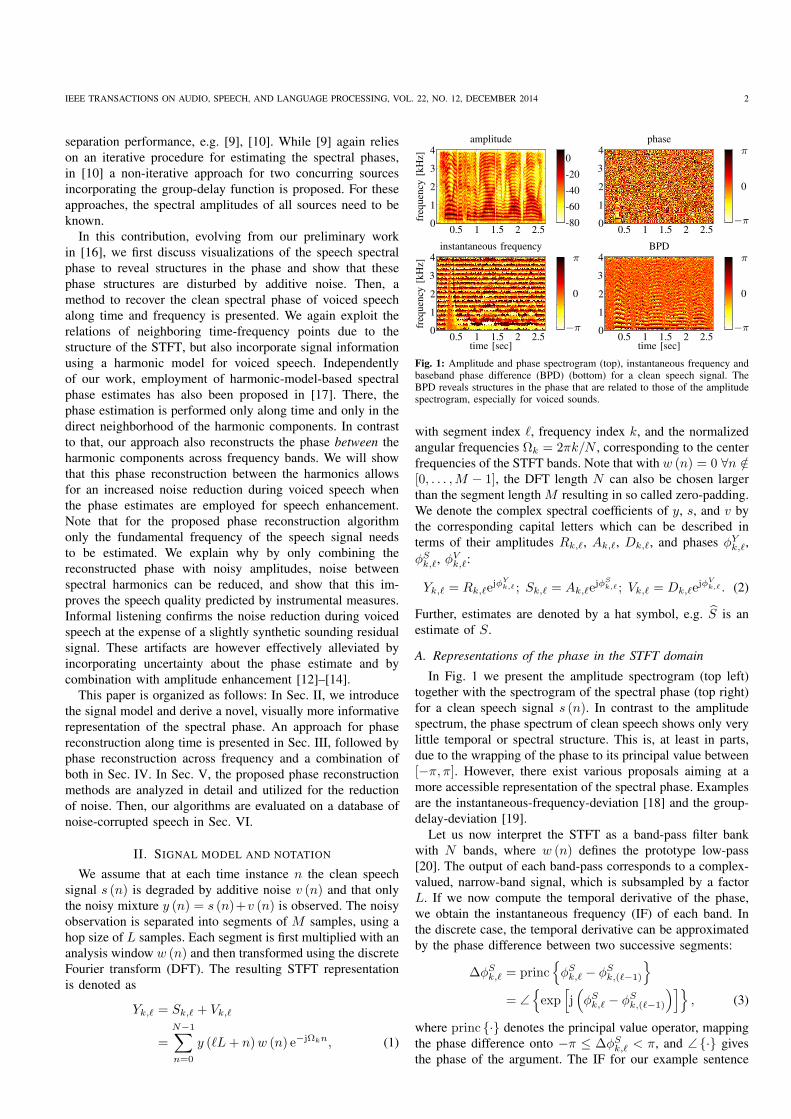
Fig. 1: Amplitude and phase spectrogram (top), instantaneous frequency andbaseband phase difference (BPD) (bottom) for a clean speech signal. TheBPD reveals structures in the phase that are related to those of the amplitudespectrogram, especially for voiced sounds.
with segment index ℓ, frequency index k, and the normalized
angular frequencies Ωk = 2πk/N , corresponding to the center
frequencies of the STFT bands. Note that with w (n) = 0 ∀n /∈[0, . . . ,M − 1], the DFT length N can also be chosen larger
than the segment length M resulting in so called zero-padding.
We denote the complex spectral coefficients of y, s, and v by
the corresponding capital letters which can be described in
terms of their amplitudes Rk,ℓ, Ak,ℓ, Dk,ℓ, and phases φYk,ℓ,
φSk,ℓ, φ
Vk,ℓ:
Yk,ℓ = Rk,ℓejφY
k,ℓ ; Sk,ℓ = Ak,ℓejφS
k,ℓ ; Vk,ℓ = Dk,ℓejφV
k,ℓ . (2)
Further, estimates are denoted by a hat symbol, e.g. S is an
estimate of S.
A. Representations of the phase in the STFT domain
In Fig. 1 we present the amplitude spectrogram (top left)
together with the spectrogram of the spectral phase (top right)
for a clean speech signal s (n). In contrast to the amplitude
spectrum, the phase spectrum of clean speech shows only very
little temporal or spectral structure. This is, at least in parts,
due to the wrapping of the phase to its principal value between
[−π, π]. However, there exist various proposals aiming at a
more accessible representation of the spectral phase. Examples
are the instantaneous-frequency-deviation [18] and the group-
delay-deviation [19].
Let us now interpret the STFT as a band-pass filter bank
with N bands, where w (n) defines the prototype low-pass
[20]. The output of each band-pass corresponds to a complex-
valued, narrow-band signal, which is subsampled by a factor
L. If we now compute the temporal derivative of the phase,
we obtain the instantaneous frequency (IF) of each band. In
the discrete case, the temporal derivative can be approximated
by the phase difference between two successive segments:
∆φSk,ℓ = princ
φSk,ℓ − φS
k,(ℓ−1)
= ∠
exp
[j(φSk,ℓ − φS
k,(ℓ−1)
)], (3)
where princ · denotes the principal value operator, mapping
the phase difference onto −π ≤ ∆φSk,ℓ < π, and ∠ · gives
the phase of the argument. The IF for our example sentence
IEEE TRANSACTIONS ON AUDIO, SPEECH, AND LANGUAGE PROCESSING, VOL. 22, NO. 12, DECEMBER 2014 3
freq
uen
cy[k
Hz]
clean amplitude
0.2 0.6 1 1.4 1.8
-40
-20
0
20
40
0
1
2
3
4noisy amplitude
0.2 0.6 1 1.4 1.8-40
-20
0
20
40
0
1
2
3
4enhanced amplitude
0.2 0.6 1 1.4 1.8-40
-20
0
20
40
0
1
2
3
4enh. amp. using clean phase
0.2 0.6 1 1.4 1.8-40
-20
0
20
40
0
1
2
3
4
time [sec]
freq
uen
cy[k
Hz]
clean BPD
0.2 0.6 1 1.4 1.8 −π
0
π
0
1
2
3
4
time [sec]
noisy BPD
0.2 0.6 1 1.4 1.8 −π
0
π
0
1
2
3
4
time [sec]
enhanced BPD
0.2 0.6 1 1.4 1.8 −π
0
π
0
1
2
3
4
time [sec]
enh. BPD using clean phase
0.2 0.6 1 1.4 1.8 −π
0
π
0
1
2
3
4
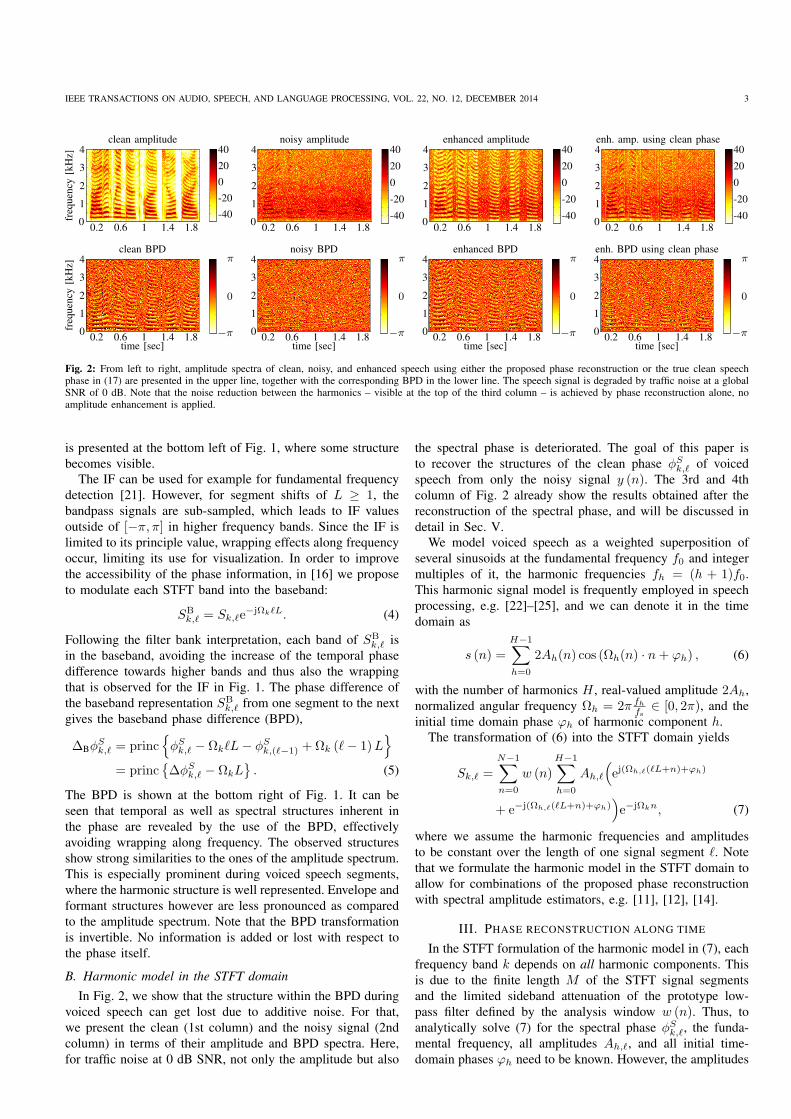
Fig. 2: From left to right, amplitude spectra of clean, noisy, and enhanced speech using either the proposed phase reconstruction or the true clean speechphase in (17) are presented in the upper line, together with the corresponding BPD in the lower line. The speech signal is degraded by traffic noise at a globalSNR of 0 dB. Note that the noise reduction between the harmonics – visible at the top of the third column – is achieved by phase reconstruction alone, noamplitude enhancement is applied.
is presented at the bottom left of Fig. 1, where some structure
becomes visible.
The IF can be used for example for fundamental frequency
detection [21]. However, for segment shifts of L ≥ 1, the
bandpass signals are sub-sampled, which leads to IF values
outside of [−π, π] in higher frequency bands. Since the IF is
limited to its principle value, wrapping effects along frequency
occur, limiting its use for visualization. In order to improve
the accessibility of the phase information, in [16] we propose
to modulate each STFT band into the baseband:
SBk,ℓ = Sk,ℓe
−jΩkℓL. (4)
Following the filter bank interpretation, each band of SBk,ℓ is
in the baseband, avoiding the increase of the temporal phase
difference towards higher bands and thus also the wrapping
that is observed for the IF in Fig. 1. The phase difference of
the baseband representation SBk,ℓ from one segment to the next
gives the baseband phase difference (BPD),
∆BφSk,ℓ = princ
φSk,ℓ − ΩkℓL− φS
k,(ℓ−1) +Ωk (ℓ− 1)L
= princ∆φS
k,ℓ − ΩkL. (5)
The BPD is shown at the bottom right of Fig. 1. It can be
seen that temporal as well as spectral structures inherent in
the phase are revealed by the use of the BPD, effectively
avoiding wrapping along frequency. The observed structures
show strong similarities to the ones of the amplitude spectrum.
This is especially prominent during voiced speech segments,
where the harmonic structure is well represented. Envelope and
formant structures however are less pronounced as compared
to the amplitude spectrum. Note that the BPD transformation
is invertible. No information is added or lost with respect to
the phase itself.
B. Harmonic model in the STFT domain
In Fig. 2, we show that the structure within the BPD during
voiced speech can get lost due to additive noise. For that,
we present the clean (1st column) and the noisy signal (2nd
column) in terms of their amplitude and BPD spectra. Here,
for traffic noise at 0 dB SNR, not only the amplitude but also
the spectral phase is deteriorated. The goal of this paper is
to recover the structures of the clean phase φSk,ℓ of voiced
speech from only the noisy signal y (n). The 3rd and 4th
column of Fig. 2 already show the results obtained after the
reconstruction of the spectral phase, and will be discussed in
detail in Sec. V.
We model voiced speech as a weighted superposition of
several sinusoids at the fundamental frequency f0 and integer
multiples of it, the harmonic frequencies fh = (h + 1)f0.
This harmonic signal model is frequently employed in speech
processing, e.g. [22]–[25], and we can denote it in the time
domain as
s (n) =
H−1∑
h=0
2Ah(n) cos (Ωh(n) · n+ ϕh) , (6)
with the number of harmonics H , real-valued amplitude 2Ah,
normalized angular frequency Ωh = 2π fhfs
∈ [0, 2π), and the
initial time domain phase ϕh of harmonic component h.
The transformation of (6) into the STFT domain yields
Sk,ℓ =N−1∑
n=0
w (n)H−1∑
h=0
Ah,ℓ
(ej(Ωh,ℓ(ℓL+n)+ϕh)
+ e−j(Ωh,ℓ(ℓL+n)+ϕh))e−jΩkn, (7)
where we assume the harmonic frequencies and amplitudes
to be constant over the length of one signal segment ℓ. Note
that we formulate the harmonic model in the STFT domain to
allow for combinations of the proposed phase reconstruction
with spectral amplitude estimators, e.g. [11], [12], [14].
III. PHASE RECONSTRUCTION ALONG TIME
In the STFT formulation of the harmonic model in (7), each
frequency band k depends on all harmonic components. This
is due to the finite length M of the STFT signal segments
and the limited sideband attenuation of the prototype low-
pass filter defined by the analysis window w (n). Thus, to
analytically solve (7) for the spectral phase φSk,ℓ, the funda-
mental frequency, all amplitudes Ah,ℓ, and all initial time-
domain phases ϕh need to be known. However, the amplitudes
IEEE TRANSACTIONS ON AUDIO, SPEECH, AND LANGUAGE PROCESSING, VOL. 22, NO. 12, DECEMBER 2014 4
W (Ω− Ωk)
Ωh=0 Ωh=1 Ωh=2 Ω
|S|
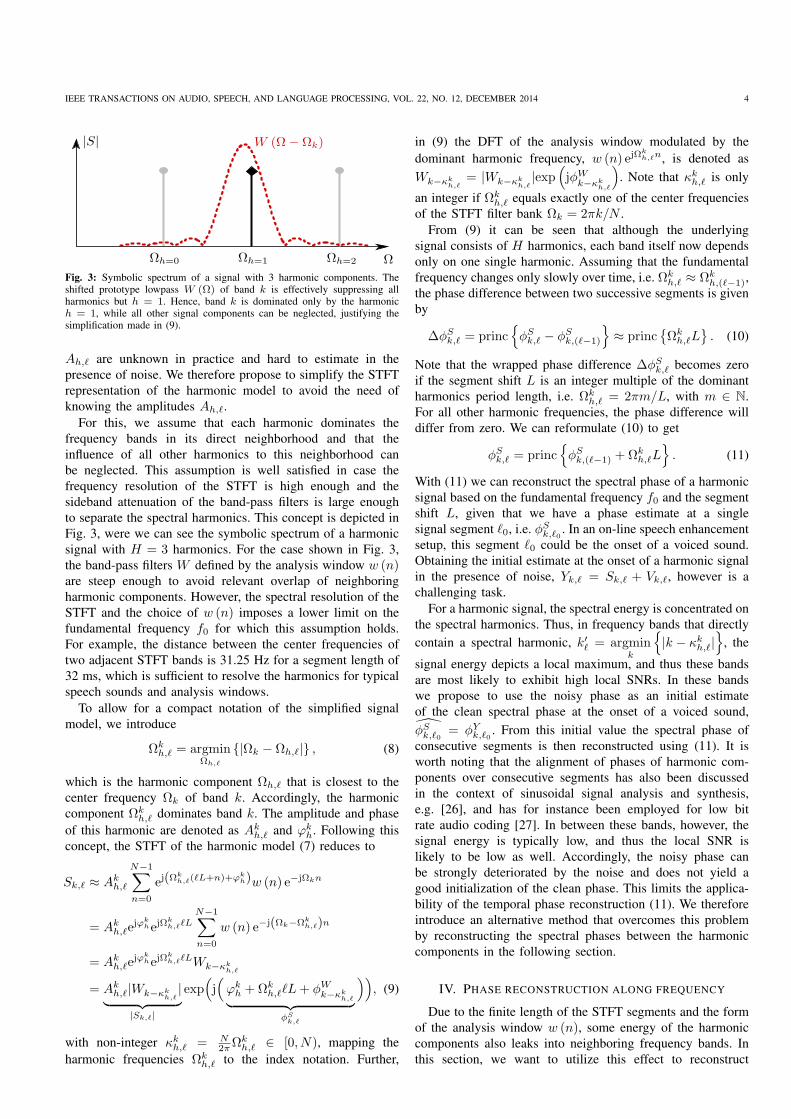
Fig. 3: Symbolic spectrum of a signal with 3 harmonic components. Theshifted prototype lowpass W (Ω) of band k is effectively suppressing allharmonics but h = 1. Hence, band k is dominated only by the harmonich = 1, while all other signal components can be neglected, justifying thesimplification made in (9).
Ah,ℓ are unknown in practice and hard to estimate in the
presence of noise. We therefore propose to simplify the STFT
representation of the harmonic model to avoid the need of
knowing the amplitudes Ah,ℓ.
For this, we assume that each harmonic dominates the
frequency bands in its direct neighborhood and that the
influence of all other harmonics to this neighborhood can
be neglected. This assumption is well satisfied in case the
frequency resolution of the STFT is high enough and the
sideband attenuation of the band-pass filters is large enough
to separate the spectral harmonics. This concept is depicted in
Fig. 3, were we can see the symbolic spectrum of a harmonic
signal with H = 3 harmonics. For the case shown in Fig. 3,
the band-pass filters W defined by the analysis window w (n)are steep enough to avoid relevant overlap of neighboring
harmonic components. However, the spectral resolution of the
STFT and the choice of w (n) imposes a lower limit on the
fundamental frequency f0 for which this assumption holds.
For example, the distance between the center frequencies of
two adjacent STFT bands is 31.25 Hz for a segment length of
32 ms, which is sufficient to resolve the harmonics for typical
speech sounds and analysis windows.
To allow for a compact notation of the simplified signal
model, we introduce
Ωkh,ℓ = argmin
Ωh,ℓ
|Ωk − Ωh,ℓ| , (8)
which is the harmonic component Ωh,ℓ that is closest to the
center frequency Ωk of band k. Accordingly, the harmonic
component Ωkh,ℓ dominates band k. The amplitude and phase
of this harmonic are denoted as Akh,ℓ and ϕk
h. Following this
concept, the STFT of the harmonic model (7) reduces to
Sk,ℓ ≈ Akh,ℓ
N−1∑
n=0
ej(Ωkh,ℓ(ℓL+n)+ϕk
h)w (n) e−jΩkn
= Akh,ℓe
jϕkhejΩ
kh,ℓℓL
N−1∑
n=0
w (n) e−j(Ωk−Ωkh,ℓ)n
= Akh,ℓe
jϕkhejΩ
kh,ℓℓLWk−κk
h,ℓ
= Akh,ℓ|Wk−κk
h,ℓ|
︸ ︷︷ ︸|Sk,ℓ|
exp(j(ϕkh +Ωk
h,ℓℓL+ φWk−κk
h,ℓ︸ ︷︷ ︸φSk,ℓ
)), (9)
with non-integer κkh,ℓ = N
2πΩkh,ℓ ∈ [0, N), mapping the
harmonic frequencies Ωkh,ℓ to the index notation. Further,
in (9) the DFT of the analysis window modulated by the
dominant harmonic frequency, w (n) ejΩkh,ℓn, is denoted as
Wk−κkh,ℓ
= |Wk−κkh,ℓ
|exp(jφW
k−κkh,ℓ
). Note that κk
h,ℓ is only
an integer if Ωkh,ℓ equals exactly one of the center frequencies
of the STFT filter bank Ωk = 2πk/N .
From (9) it can be seen that although the underlying
signal consists of H harmonics, each band itself now depends
only on one single harmonic. Assuming that the fundamental
frequency changes only slowly over time, i.e. Ωkh,ℓ ≈ Ωk
h,(ℓ−1),
the phase difference between two successive segments is given
by
∆φSk,ℓ = princ
φSk,ℓ − φS
k,(ℓ−1)
≈ princ
Ωk
h,ℓL. (10)
Note that the wrapped phase difference ∆φSk,ℓ becomes zero
if the segment shift L is an integer multiple of the dominant
harmonics period length, i.e. Ωkh,ℓ = 2πm/L, with m ∈ N.
For all other harmonic frequencies, the phase difference will
differ from zero. We can reformulate (10) to get
φSk,ℓ = princ
φSk,(ℓ−1) +Ωk
h,ℓL. (11)
With (11) we can reconstruct the spectral phase of a harmonic
signal based on the fundamental frequency f0 and the segment
shift L, given that we have a phase estimate at a single
signal segment ℓ0, i.e. φSk,ℓ0
. In an on-line speech enhancement
setup, this segment ℓ0 could be the onset of a voiced sound.
Obtaining the initial estimate at the onset of a harmonic signal
in the presence of noise, Yk,ℓ = Sk,ℓ + Vk,ℓ, however is a
challenging task.
For a harmonic signal, the spectral energy is concentrated on
the spectral harmonics. Thus, in frequency bands that directly
contain a spectral harmonic, k′ℓ = argmink
|k − κk
h,ℓ|
, the
signal energy depicts a local maximum, and thus these bands
are most likely to exhibit high local SNRs. In these bands
we propose to use the noisy phase as an initial estimate
of the clean spectral phase at the onset of a voiced sound,
φSk,ℓ0
= φYk,ℓ0
. From this initial value the spectral phase of
consecutive segments is then reconstructed using (11). It is
worth noting that the alignment of phases of harmonic com-
ponents over consecutive segments has also been discussed
in the context of sinusoidal signal analysis and synthesis,
e.g. [26], and has for instance been employed for low bit
rate audio coding [27]. In between these bands, however, the
signal energy is typically low, and thus the local SNR is
likely to be low as well. Accordingly, the noisy phase can
be strongly deteriorated by the noise and does not yield a
good initialization of the clean phase. This limits the applica-
bility of the temporal phase reconstruction (11). We therefore
introduce an alternative method that overcomes this problem
by reconstructing the spectral phases between the harmonic
components in the following section.
IV. PHASE RECONSTRUCTION ALONG FREQUENCY
Due to the finite length of the STFT segments and the form
of the analysis window w (n), some energy of the harmonic
components also leaks into neighboring frequency bands. In
this section, we want to utilize this effect to reconstruct
IEEE TRANSACTIONS ON AUDIO, SPEECH, AND LANGUAGE PROCESSING, VOL. 22, NO. 12, DECEMBER 2014 5
the spectral phase across frequency. Since the reconstruction
across frequencies can be performed independently for every
signal segment, we drop the index ℓ to allow for a compact
notation. Again, we assume that the frequency resolution of the
STFT and the analysis window w (n) are chosen such that the
spectral harmonics can still be separated. Accordingly, each
band is dominated only by the closest harmonic component,
and we can thus again employ our simplified signal model (9).
From (9) it can be seen that the spectral phases,
φSk,ℓ = princ
ϕkh +Ωk
hℓL+ φWk−κk
h
, (12)
of bands that are dominated by the same harmonic Ωkh are
directly related via the spectral phase of the shifted analysis
window φWk−κk
h
. Accordingly, we can infer the spectral phase
of a band from its neighbors by accounting for the phase
shift introduced by the spectral representation of the analysis
window W . Starting from bands k′ that contain harmonic
components, we obtain the spectral phases in the surrounding
bands k′ + i, with integer i ∈ [−∆k, . . . ,∆k], via
φSk′+i = princ
φSk′ − φW
k′−κkh
+ φWk′−κk
h+i
. (13)
In order for k′ + i to cover all frequency bands associated to
the same spectral harmonic, here we choose ∆k = ⌈κ0/2⌉,
with ⌈·⌉ denoting the ceiling function. For instance, for the
example in Fig. 4 ∆k is one.
For a noisy speech signal, (13) is initialized with the noisy
spectral phase in bands k′ containing harmonic components,
φSk′ = φY
k′ , again assuming that the local SNR is relatively
high as compared to the neighboring bands. In this way, we
utilize phase information in high SNR bands k′ to infer the
spectral phase in the surrounding, low SNR bands k′+i. Next,
we discuss how the spectral phase of the analysis window,
φWk−κk
h
and φWk−κk
h+i
, can be obtained for integer as well as
non-integer κkh.
A. Obtaining the Spectral Phase of the Analysis Window
For harmonic frequencies that directly fall onto a center
frequency of an STFT band, κkh is an integer value. Thus, we
can simply apply the DFT to the analysis window and directly
take φWk−κk
h
and φWk−κk
h+i
from Wk for each k and h.
For the general case of arbitrary harmonic frequencies, κkh is
usually not an integer and k−κkh does not fall onto the STFT
frequency grid. Thus, φWk−κk
h
cannot be taken directly from the
DFT of w (n) anymore. We will first discuss the relevance of
a simple linear phase assumption. Then, an analytic solution
for a frequently used class of symmetric analysis windows
is presented, followed by a general approach for arbitrary
window functions.
1) Linear Phase Assumption: In spectral analysis and en-
hancement of speech signals, symmetric windows are em-
ployed most frequently. First, let us consider a non-causal,
real-valued window function with a length of M samples
which is symmetric around n = 0. Such a window function
depicts a real-valued discrete-time Fourier transform (DTFT)
representation WNC (Ω). To make the window function causal
it is shifted in time by M−12 samples, leading to W (Ω) =
WNC (Ω) exp(−jΩM−1
2
). From this formulation and knowing
that WNC (Ω) is real-valued, it might seem reasonable to
draw the desired window phases φWk−κk
h
directly from the
linear phase term −ΩM−12 , independent of the actual form
of the symmetric window function. For a DFT length of Nsamples we would expect a phase shift between two bands
of φWk−κk
h+i
− φWk−κk
h
= −Ωk+iM−1
2 + ΩkM−1
2 = −iπM−1N
,
which is independent of band index k. This phase difference
could then be employed for phase reconstruction along fre-
quency in (13).
However, although WNC is real-valued, still its sign might
change along frequency, introducing phase jumps of π. Thus,
we reformulate the DTFT of the causal window as
W (Ω) = |WNC (Ω) |exp
[− j
(ΩM − 1
2
+ 0.5π (1− sign WNC (Ω))
)], (14)
where sign x is 1 for x ≥ 0 and −1 for x < 0. From (14)
it can be seen that even for symmetric window functions the
spectral phase of the window is not only given by −ΩM−12 ,
but also depends on the form of the window. In order to
analytically obtain φWk−κk
h
and φWk−κk
h+i
we therefore need
to know the exact DTFT of the window function W (Ω).Still, the linear phase assumption might serve as a sufficient
approximation when aiming at a fast and simple solution.
2) Symmetric Half-Cosine-Based Window Functions: Here
we present an analytic solution for the computation of spectral
phases for some frequently employed symmetric analysis
windows, including the rectangular, Hann, and Hamming win-
dows. All three belong to the same class of window functions
that can be expressed as, see e.g. [28, Sec. III]:
w (n) =
[a− (1− a) cos
(n2π
M
)]rect
(n− M−1
2
M
),
(15)
with a = 1 giving a rectangular window, a = 0.5 a Hann win-
dow, and a = 0.54 a Hamming window. Here, rect(
n−M−1
2
M
)
denotes a causal rectangular function that is 1 for 0 ≤ n < M .
Note that in contrast to [28, Sec. III] the definition in (15) is
chosen such that the period length of the cosine is exactly
two times the window length. This allows for a periodic
extension of the window, which is desired in segment-based
signal processing which aims at perfect reconstruction.
Using basic properties of Fourier analysis and simple al-
gebraic computations, the DTFT of (15) can be formulated
as
W (Ω) = sin
(M
2Ω
)e−jM−1
2Ω
[a
1
sin(12Ω)
−1− a
2
(exp
(−j π
M
)
sin(12
(Ω− 2π
M
)) + exp(j πM
)
sin(12
(Ω+ 2π
M
)))]
, (16)
with the special cases W (0) = Ma and W(2πM
)=
−W(− 2π
M
)= − 1−a
2 M . From (16) we can see that we have
a linear phase term e−jM−1
2Ω and a nonlinear part inside the
bracket with phase jumps at the poles of the fractions. Using
(16), the spectral phases of the analysis window φWk−κk
h
and
IEEE TRANSACTIONS ON AUDIO, SPEECH, AND LANGUAGE PROCESSING, VOL. 22, NO. 12, DECEMBER 2014 6
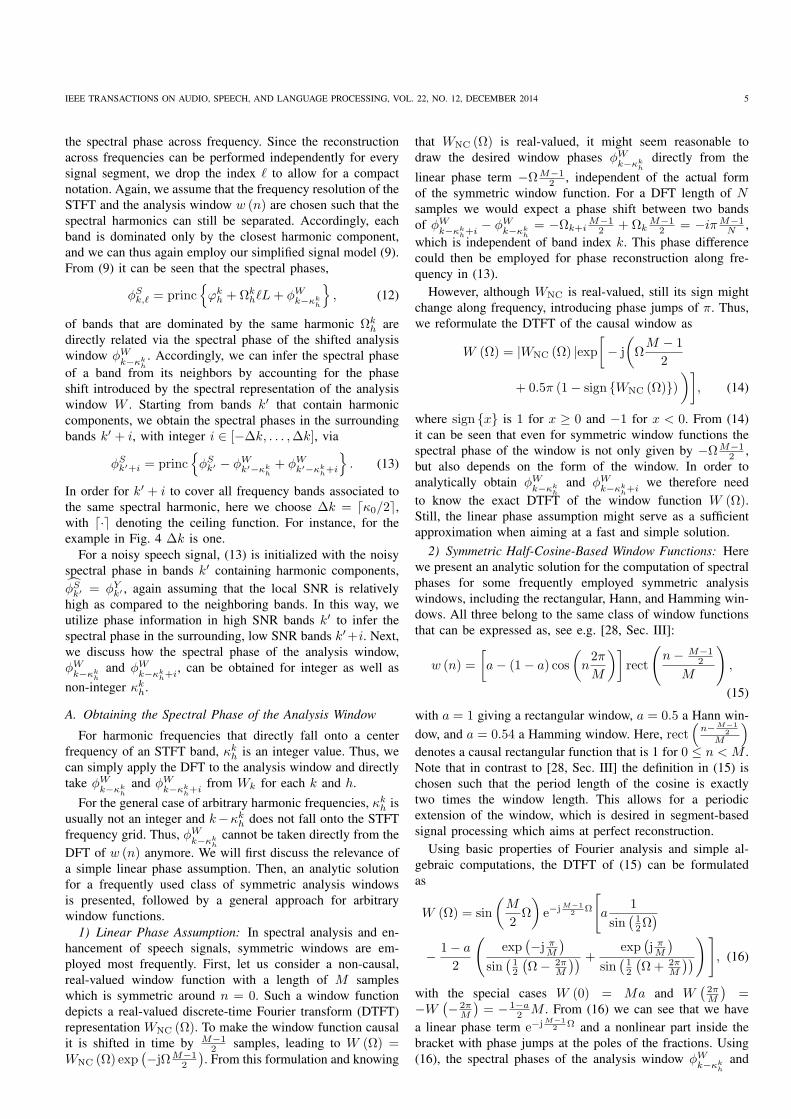
k
l0 l
voiced
k′
k′
k′
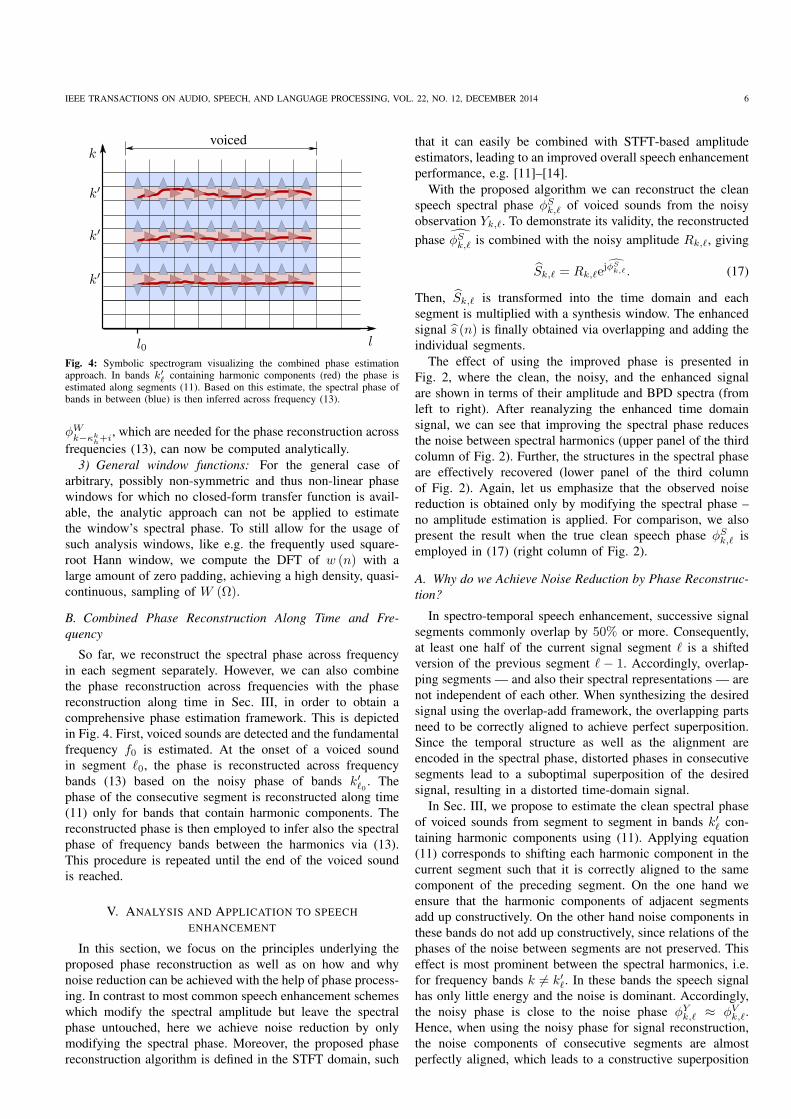
Fig. 4: Symbolic spectrogram visualizing the combined phase estimationapproach. In bands k′
ℓcontaining harmonic components (red) the phase is
estimated along segments (11). Based on this estimate, the spectral phase ofbands in between (blue) is then inferred across frequency (13).
φWk−κk
h+i
, which are needed for the phase reconstruction across
frequencies (13), can now be computed analytically.
3) General window functions: For the general case of
arbitrary, possibly non-symmetric and thus non-linear phase
windows for which no closed-form transfer function is avail-
able, the analytic approach can not be applied to estimate
the window’s spectral phase. To still allow for the usage of
such analysis windows, like e.g. the frequently used square-
root Hann window, we compute the DFT of w (n) with a
large amount of zero padding, achieving a high density, quasi-
continuous, sampling of W (Ω).
B. Combined Phase Reconstruction Along Time and Fre-
quency
So far, we reconstruct the spectral phase across frequency
in each segment separately. However, we can also combine
the phase reconstruction across frequencies with the phase
reconstruction along time in Sec. III, in order to obtain a
comprehensive phase estimation framework. This is depicted
in Fig. 4. First, voiced sounds are detected and the fundamental
frequency f0 is estimated. At the onset of a voiced sound
in segment ℓ0, the phase is reconstructed across frequency
bands (13) based on the noisy phase of bands k′ℓ0 . The
phase of the consecutive segment is reconstructed along time
(11) only for bands that contain harmonic components. The
reconstructed phase is then employed to infer also the spectral
phase of frequency bands between the harmonics via (13).
This procedure is repeated until the end of the voiced sound
is reached.
V. ANALYSIS AND APPLICATION TO SPEECH
ENHANCEMENT
In this section, we focus on the principles underlying the
proposed phase reconstruction as well as on how and why
noise reduction can be achieved with the help of phase process-
ing. In contrast to most common speech enhancement schemes
which modify the spectral amplitude but leave the spectral
phase untouched, here we achieve noise reduction by only
modifying the spectral phase. Moreover, the proposed phase
reconstruction algorithm is defined in the STFT domain, such
that it can easily be combined with STFT-based amplitude
estimators, leading to an improved overall speech enhancement
performance, e.g. [11]–[14].
With the proposed algorithm we can reconstruct the clean
speech spectral phase φSk,ℓ of voiced sounds from the noisy
observation Yk,ℓ. To demonstrate its validity, the reconstructed
phase φSk,ℓ is combined with the noisy amplitude Rk,ℓ, giving
Sk,ℓ = Rk,ℓejφS
k,ℓ . (17)
Then, Sk,ℓ is transformed into the time domain and each
segment is multiplied with a synthesis window. The enhanced
signal s (n) is finally obtained via overlapping and adding the
individual segments.
The effect of using the improved phase is presented in
Fig. 2, where the clean, the noisy, and the enhanced signal
are shown in terms of their amplitude and BPD spectra (from
left to right). After reanalyzing the enhanced time domain
signal, we can see that improving the spectral phase reduces
the noise between spectral harmonics (upper panel of the third
column of Fig. 2). Further, the structures in the spectral phase
are effectively recovered (lower panel of the third column
of Fig. 2). Again, let us emphasize that the observed noise
reduction is obtained only by modifying the spectral phase –
no amplitude estimation is applied. For comparison, we also
present the result when the true clean speech phase φSk,ℓ is
employed in (17) (right column of Fig. 2).
A. Why do we Achieve Noise Reduction by Phase Reconstruc-
tion?
In spectro-temporal speech enhancement, successive signal
segments commonly overlap by 50% or more. Consequently,
at least one half of the current signal segment ℓ is a shifted
version of the previous segment ℓ − 1. Accordingly, overlap-
ping segments — and also their spectral representations — are
not independent of each other. When synthesizing the desired
signal using the overlap-add framework, the overlapping parts
need to be correctly aligned to achieve perfect superposition.
Since the temporal structure as well as the alignment are
encoded in the spectral phase, distorted phases in consecutive
segments lead to a suboptimal superposition of the desired
signal, resulting in a distorted time-domain signal.
In Sec. III, we propose to estimate the clean spectral phase
of voiced sounds from segment to segment in bands k′ℓ con-
taining harmonic components using (11). Applying equation
(11) corresponds to shifting each harmonic component in the
current segment such that it is correctly aligned to the same
component of the preceding segment. On the one hand we
ensure that the harmonic components of adjacent segments
add up constructively. On the other hand noise components in
these bands do not add up constructively, since relations of the
phases of the noise between segments are not preserved. This
effect is most prominent between the spectral harmonics, i.e.
for frequency bands k 6= k′ℓ. In these bands the speech signal
has only little energy and the noise is dominant. Accordingly,
the noisy phase is close to the noise phase φYk,ℓ ≈ φV
k,ℓ.
Hence, when using the noisy phase for signal reconstruction,
the noise components of consecutive segments are almost
perfectly aligned, which leads to a constructive superposition
IEEE TRANSACTIONS ON AUDIO, SPEECH, AND LANGUAGE PROCESSING, VOL. 22, NO. 12, DECEMBER 2014 7
time domain error before syn. win.
amp
litu
de
-0.1
0
0.1spectrum before syn. win.
amp
litu
de
[dB
]
cleannoisy
modified-60
-40
-20
0
time domain error after syn. win.
amp
litu
de
-0.1
0
0.1spectrum after syn. win.
amp
litu
de
[dB
]
-60
-40
-20
0
time domain error after overlap-add
time [ms]
amp
litu
de
0 5 10 15 20 25 30-0.1
0
0.1spectrum after overlap-add
frequency [kHz]
amp
litu
de
[dB
]
0 0.4 0.8 1.2 1.6 2
-60
-40
-20
0
Fig. 5: Differences of a noisy and an enhanced segment to the clean harmonicsignal with f0 = 222 Hz (left column) together with the signals’ amplitudespectra (right column). The white Gaussian noise at 0 dB SNR is alreadyreduced between the harmonics after application of a synthesis window(middle). Further noise reduction is observed after overlapping and addingneighboring segments (bottom).
during overlap-add. When we now employ the reconstructed
phase obtained via (13) in the noise-dominated bands between
harmonics, destructive interference of noise components is
achieved, explaining the noise reduction that is observed in
Fig. 2.
The degree of noise reduction that can be achieved by
phase reconstruction alone depends particularly on the amount
of overlap. The higher the overlap is, the more consecutive
signal segments are added up when reconstructing the time-
domain signal. Thus, the effect of destructive interference of
adjacent noise components increases with increasing overlap,
while the desired signal still adds up constructively. From our
experience, an overlap of 7/8th of the segment length results
in a good trade-off between noise reduction and additional
processing load.
Independently of the overlap, noise reduction is also
achieved when we apply a spectral synthesis window after
phase reconstruction. This is depicted in Fig. 5 for a harmonic
signal in white noise at 0 dB SNR with f0 = 222 Hz,
Ah = 0.5 ∀h, square root Hann windows for analysis and
synthesis, a segment length of 32 ms and an overlap of 28 ms.
The amplitude spectra for a single STFT segment of the clean,
the noisy, and the enhanced signal employing the reconstructed
phase (right) are presented together with the time-domain
deviations of the noisy and the enhanced signal from the clean
reference (left). It can be seen that phase reconstruction leads
to noise components at the segment boundaries (top left),
which are suppressed by the synthesis window, resulting in
noise reduction between harmonics (middle). After overlap-
add of neighboring segments, the noise is further reduced
(bottom). This effect is most visible in the frequency domain in
the right column. For the given example, the SNR is improved
by 4 dB after application of the synthesis window and by 8 dB
after overlap-add.
Besides these effects, also the length and the form of the
employed analysis window w (n) play an important role. The
choice of w (n) determines the spectral resolution, and thus
also how well harmonic components can be resolved. For long
windows with strong side-band attenuation, harmonics are well
resolved and the assumption of a single dominant component
per frequency band is well fulfilled. On the contrary, in [4]
a Chebychev window with a low dynamic range has been
shown to be a promising choice for phase based speech
enhancement. However, such windows depict only a low side-
band attenuation and are thus not suited for our application
since the spectral harmonics are not well separated.
B. Limits of the Proposed Approach
The harmonic model is frequently employed in speech
processing and holds well for many voiced speech sounds.
However, mixed excitation signals can not be perfectly de-
scribed in terms of the harmonic model (6), and the enhanced
signal might thus sound more harmonic than the actual speech
signal. Furthermore, for the proposed phase reconstruction to
work reliably even in adverse acoustic scenarios, a robust
fundamental frequency estimator is essential. Here, we employ
PEFAC [29], a fundamental frequency estimator which showed
to be robust even to high levels of noise. A common issue
in sinusoidal modeling is that the influence of fundamental
frequency estimation errors ef0 increases for higher harmonics
h, since fh = (h+1)f0 = (h+1)f0+(h+1)ef0 . Accordingly,
we also expect phase estimates based on a harmonic model
to be more precise in low frequencies as compared to high
frequencies. Thus, the proposed enhancement scheme is most
effective in lower frequency regions. Note that it is possible to
limit the number of harmonics H of the signal model in order
to avoid phase reconstruction where the estimated frequencies
fh are not sufficiently reliable anymore. H can be chosen
independently of the observed signal or estimated on-line, e.g.
in combination with the fundamental frequency [30]. In order
to keep the complexity of the algorithm as low as possible,
in this paper we do not estimate H , but choose it such that
the harmonic model covers the frequency range up to 4 kHz,
i.e. H = ⌊ 4000f0
⌋. Here, ⌊·⌋ denotes the flooring operator. The
choice of the number of harmonics is a trade-off between noise
reduction and speech distortions in higher frequency compo-
nents. Note that reconstructing the spectral phase along time
(11) is potentially more sensitive to fundamental frequency
estimation errors than the reconstruction across frequencies
(13), since estimation errors may accumulate from segment to
segment.
Since a harmonic signal model is employed, the phase-
based speech enhancement considered here is applicable only
for voiced sounds. In unvoiced sounds, the phase cannot be
reconstructed and the noisy phase is not modified. Hence, the
noisy signal is enhanced only during voiced speech. At tran-
sitions from enhanced voiced sounds to unprocessed unvoiced
sounds we consequently observe sudden changes of the noise
power. This effect is most prominent in severe noise conditions
and can be observed in the upper panel of the 3rd column
of Fig. 2. This issue is alleviated when combining the phase
enhancement with amplitude enhancement as proposed in e.g.
[13], [14]. There, the complete signal is enhanced, dampening
IEEE TRANSACTIONS ON AUDIO, SPEECH, AND LANGUAGE PROCESSING, VOL. 22, NO. 12, DECEMBER 2014 8
the differences between voiced and unvoiced speech parts and
possibly increasing the overall improvement.
VI. EVALUATION
To evaluate the potential of the proposed phase recon-
struction in speech enhancement, we consider 128 sentences
of the TIMIT [32] core set, one half uttered by female
speakers and the other half by male speakers. The speech
samples are deteriorated by babble noise and non-stationary
traffic noise recorded at a busy street crossing, respectively,
at various SNRs. As we reconstruct the phase only up to
4 kHz, the noisy speech is modified only in this frequency
region and we thus choose a sampling rate of fs = 8 kHz.
The noisy signals are split into segments of 32 ms with a
segment shift of 4 ms, corresponding to a relative overlap
of 7/8th and N = M = 256. For analysis and synthesis
we apply a square-root Hann window. The improvement of
speech quality is instrumentally evaluated using the Perceptual
Evaluation of Speech Quality (PESQ) [33] and the frequency-
weighted segmental SNR (fwSNRseg) [34] as implemented
in [35]. Although PESQ has originally been developed for the
evaluation of coded speech, it has been shown to correlate also
with the quality of enhanced speech [36]. The improvements
relative to the noisy input signal are reported for traffic noise
in Fig. 6 and for babble noise in Fig. 7.
For the enhancement of the noisy speech we combine the
reconstructed spectral phase with the noisy spectral ampli-
tude according to (17). The fundamental frequency is blindly
estimated on the noisy speech using the noise robust funda-
mental frequency estimator PEFAC [29]. The spectral phase
is reconstructed either along time (11) in each STFT band
separately, across frequency based on the noisy phase in bands
k′ℓ (13), or via the combined approach presented in Sec. IV-B,
denoted as ”time”, ”frequency”, and ”combi”, respectively.
The spectral phase of the analysis window φW that is needed
for the phase reconstruction across frequencies is obtained via
zero-padding as discussed in Sec. IV-A3. We also investigate
the influence of fundamental frequency estimation errors. For
this, we present both, the enhancement results obtained using
the blind fundamental frequency estimates as well as the
outcome when the ground truth annotation for the fundamental
frequency [29], [31], denoted as ”oracle f0”, is employed.
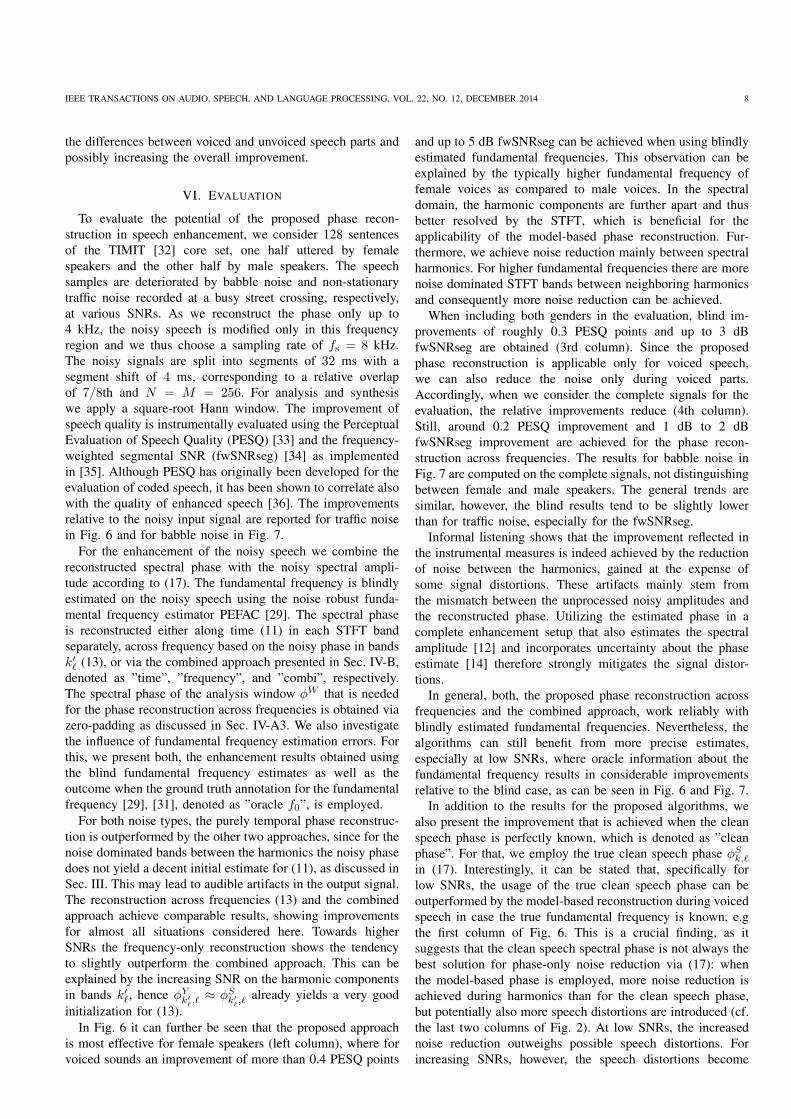
For both noise types, the purely temporal phase reconstruc-
tion is outperformed by the other two approaches, since for the
noise dominated bands between the harmonics the noisy phase
does not yield a decent initial estimate for (11), as discussed in
Sec. III. This may lead to audible artifacts in the output signal.
The reconstruction across frequencies (13) and the combined
approach achieve comparable results, showing improvements
for almost all situations considered here. Towards higher
SNRs the frequency-only reconstruction shows the tendency
to slightly outperform the combined approach. This can be
explained by the increasing SNR on the harmonic components
in bands k′ℓ, hence φYk′
ℓ,ℓ ≈ φS
k′
ℓ,ℓ already yields a very good
initialization for (13).
In Fig. 6 it can further be seen that the proposed approach
is most effective for female speakers (left column), where for
voiced sounds an improvement of more than 0.4 PESQ points
and up to 5 dB fwSNRseg can be achieved when using blindly
estimated fundamental frequencies. This observation can be
explained by the typically higher fundamental frequency of
female voices as compared to male voices. In the spectral
domain, the harmonic components are further apart and thus
better resolved by the STFT, which is beneficial for the
applicability of the model-based phase reconstruction. Fur-
thermore, we achieve noise reduction mainly between spectral
harmonics. For higher fundamental frequencies there are more
noise dominated STFT bands between neighboring harmonics
and consequently more noise reduction can be achieved.
When including both genders in the evaluation, blind im-
provements of roughly 0.3 PESQ points and up to 3 dB
fwSNRseg are obtained (3rd column). Since the proposed
phase reconstruction is applicable only for voiced speech,
we can also reduce the noise only during voiced parts.
Accordingly, when we consider the complete signals for the
evaluation, the relative improvements reduce (4th column).
Still, around 0.2 PESQ improvement and 1 dB to 2 dB
fwSNRseg improvement are achieved for the phase recon-
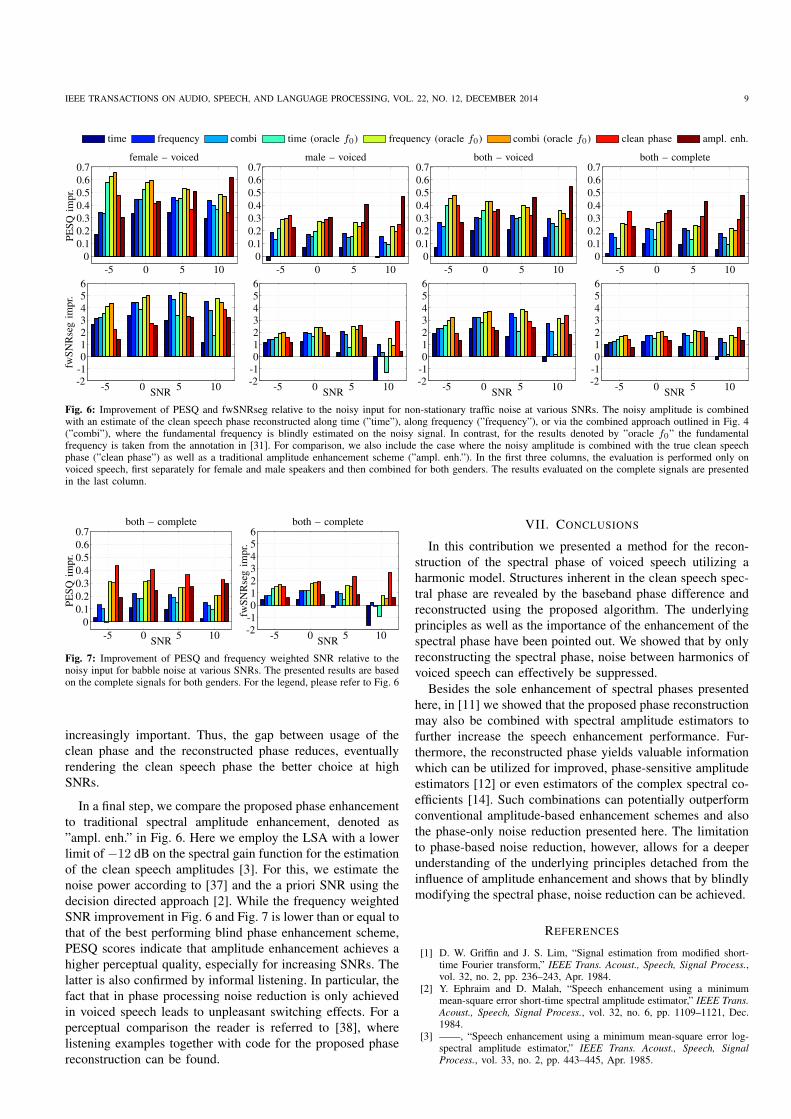
struction across frequencies. The results for babble noise in
Fig. 7 are computed on the complete signals, not distinguishing
between female and male speakers. The general trends are
similar, however, the blind results tend to be slightly lower
than for traffic noise, especially for the fwSNRseg.
Informal listening shows that the improvement reflected in
the instrumental measures is indeed achieved by the reduction
of noise between the harmonics, gained at the expense of
some signal distortions. These artifacts mainly stem from
the mismatch between the unprocessed noisy amplitudes and
the reconstructed phase. Utilizing the estimated phase in a
complete enhancement setup that also estimates the spectral
amplitude [12] and incorporates uncertainty about the phase
estimate [14] therefore strongly mitigates the signal distor-
tions.
In general, both, the proposed phase reconstruction across
frequencies and the combined approach, work reliably with
blindly estimated fundamental frequencies. Nevertheless, the
algorithms can still benefit from more precise estimates,
especially at low SNRs, where oracle information about the
fundamental frequency results in considerable improvements
relative to the blind case, as can be seen in Fig. 6 and Fig. 7.
In addition to the results for the proposed algorithms, we
also present the improvement that is achieved when the clean
speech phase is perfectly known, which is denoted as ”clean
phase”. For that, we employ the true clean speech phase φSk,ℓ
in (17). Interestingly, it can be stated that, specifically for
low SNRs, the usage of the true clean speech phase can be
outperformed by the model-based reconstruction during voiced
speech in case the true fundamental frequency is known, e.g
the first column of Fig. 6. This is a crucial finding, as it
suggests that the clean speech spectral phase is not always the
best solution for phase-only noise reduction via (17): when
the model-based phase is employed, more noise reduction is
achieved during harmonics than for the clean speech phase,
but potentially also more speech distortions are introduced (cf.
the last two columns of Fig. 2). At low SNRs, the increased
noise reduction outweighs possible speech distortions. For
increasing SNRs, however, the speech distortions become
IEEE TRANSACTIONS ON AUDIO, SPEECH, AND LANGUAGE PROCESSING, VOL. 22, NO. 12, DECEMBER 2014 9
time frequency combi time (oracle f0) frequency (oracle f0) combi (oracle f0) clean phase ampl. enh.
PE
SQ
imp
r.
female – voiced
-5 0 5 10
0
0.1
0.2
0.3
0.4
0.5
0.6
0.7male – voiced
-5 0 5 10
0
0.1
0.2
0.3
0.4
0.5
0.6
0.7both – voiced
-5 0 5 10
0
0.1
0.2
0.3
0.4
0.5
0.6
0.7both – complete
-5 0 5 10
0
0.1
0.2
0.3
0.4
0.5
0.6
0.7
fwS
NR
seg
imp
r.
SNR-5 0 5 10
-2
-1
0
1
2
3
4
5
6
SNR-5 0 5 10
-2
-1
0
1
2
3
4
5
6
SNR-5 0 5 10
-2
-1
0
1
2
3
4
5
6
SNR-5 0 5 10
-2
-1
0
1
2
3
4
5
6
Fig. 6: Improvement of PESQ and fwSNRseg relative to the noisy input for non-stationary traffic noise at various SNRs. The noisy amplitude is combinedwith an estimate of the clean speech phase reconstructed along time (”time”), along frequency (”frequency”), or via the combined approach outlined in Fig. 4(”combi”), where the fundamental frequency is blindly estimated on the noisy signal. In contrast, for the results denoted by ”oracle f0” the fundamentalfrequency is taken from the annotation in [31]. For comparison, we also include the case where the noisy amplitude is combined with the true clean speechphase (”clean phase”) as well as a traditional amplitude enhancement scheme (”ampl. enh.”). In the first three columns, the evaluation is performed only onvoiced speech, first separately for female and male speakers and then combined for both genders. The results evaluated on the complete signals are presentedin the last column.
PE
SQ
imp
r.
SNR
both – complete
-5 0 5 10
0
0.1
0.2
0.3
0.4
0.5
0.6
0.7
fwS
NR
seg
imp
r.
SNR
both – complete
-5 0 5 10-2
-1
0
1
2
3
4
5
6
Fig. 7: Improvement of PESQ and frequency weighted SNR relative to thenoisy input for babble noise at various SNRs. The presented results are basedon the complete signals for both genders. For the legend, please refer to Fig. 6
increasingly important. Thus, the gap between usage of the
clean phase and the reconstructed phase reduces, eventually
rendering the clean speech phase the better choice at high
SNRs.
In a final step, we compare the proposed phase enhancement
to traditional spectral amplitude enhancement, denoted as
”ampl. enh.” in Fig. 6. Here we employ the LSA with a lower
limit of −12 dB on the spectral gain function for the estimation
of the clean speech amplitudes [3]. For this, we estimate the
noise power according to [37] and the a priori SNR using the
decision directed approach [2]. While the frequency weighted
SNR improvement in Fig. 6 and Fig. 7 is lower than or equal to
that of the best performing blind phase enhancement scheme,
PESQ scores indicate that amplitude enhancement achieves a
higher perceptual quality, especially for increasing SNRs. The
latter is also confirmed by informal listening. In particular, the
fact that in phase processing noise reduction is only achieved
in voiced speech leads to unpleasant switching effects. For a
perceptual comparison the reader is referred to [38], where
listening examples together with code for the proposed phase
reconstruction can be found.
VII. CONCLUSIONS
In this contribution we presented a method for the recon-
struction of the spectral phase of voiced speech utilizing a
harmonic model. Structures inherent in the clean speech spec-
tral phase are revealed by the baseband phase difference and
reconstructed using the proposed algorithm. The underlying
principles as well as the importance of the enhancement of the
spectral phase have been pointed out. We showed that by only
reconstructing the spectral phase, noise between harmonics of
voiced speech can effectively be suppressed.
Besides the sole enhancement of spectral phases presented
here, in [11] we showed that the proposed phase reconstruction
may also be combined with spectral amplitude estimators to
further increase the speech enhancement performance. Fur-
thermore, the reconstructed phase yields valuable information
which can be utilized for improved, phase-sensitive amplitude
estimators [12] or even estimators of the complex spectral co-
efficients [14]. Such combinations can potentially outperform
conventional amplitude-based enhancement schemes and also
the phase-only noise reduction presented here. The limitation
to phase-based noise reduction, however, allows for a deeper
understanding of the underlying principles detached from the
influence of amplitude enhancement and shows that by blindly
modifying the spectral phase, noise reduction can be achieved.
REFERENCES
[1] D. W. Griffin and J. S. Lim, “Signal estimation from modified short-time Fourier transform,” IEEE Trans. Acoust., Speech, Signal Process.,vol. 32, no. 2, pp. 236–243, Apr. 1984.
[2] Y. Ephraim and D. Malah, “Speech enhancement using a minimummean-square error short-time spectral amplitude estimator,” IEEE Trans.
Acoust., Speech, Signal Process., vol. 32, no. 6, pp. 1109–1121, Dec.1984.
[3] ——, “Speech enhancement using a minimum mean-square error log-spectral amplitude estimator,” IEEE Trans. Acoust., Speech, Signal
Process., vol. 33, no. 2, pp. 443–445, Apr. 1985.
IEEE TRANSACTIONS ON AUDIO, SPEECH, AND LANGUAGE PROCESSING, VOL. 22, NO. 12, DECEMBER 2014 10
[4] K. Paliwal, K. Wojcicki, and B. Shannon, “The importance of phase inspeech enhancement,” ELSEVIER Speech Commun., vol. 53, no. 4, pp.465–494, Apr. 2011.
[5] M. Kazama, S. Gotoh, M. Tohyama, and T. Houtgast, “On the sig-nificance of phase in the short term Fourier spectrum for speechintelligibility,” J. Acoust. Soc. Amer., vol. 127, no. 3, pp. 1432–1439,Mar. 2010.
[6] A. Sugiyama and R. Miyahara, “Phase randomization - a new paradigmfor single-channel signal enhancement,” in IEEE Int. Conf. Acoust.,
Speech, Signal Process. (ICASSP), Vancouver, Canada, May 2013, pp.7487–7491.
[7] N. Sturmel and L. Daudet, “Signal reconstruction from STFT magnitude:a state of the art,” in International Conference on Digital Audio Effects
(DAFx), Paris, France, Sep. 2011, pp. 375–386.[8] J. Le Roux and E. Vincent, “Consistent Wiener filtering for audio source
separation,” IEEE Signal Process. Lett., vol. 20, no. 3, pp. 217–220, Mar.2013.
[9] D. Gunawan and D. Sen, “Iterative phase estimation for the synthesis ofseparated sources from single-channel mixtures,” IEEE Signal Process.
Lett., vol. 17, no. 5, pp. 421–424, May 2010.[10] P. Mowlaee, R. Saeidi, and R. Martin, “Phase estimation for signal
reconstruction in single-channel speech separation,” in ISCA Interspeech,Portland, OR, USA, Sep. 2012.
[11] T. Gerkmann, M. Krawczyk, and R. Rehr, “Phase estimation in speechenhancement — unimportant, important, or impossible?” in IEEE Conv.
Elect. Electron. Eng. Israel, Eilat, Israel, Nov. 2012.[12] T. Gerkmann and M. Krawczyk, “MMSE-optimal spectral amplitude
estimation given the STFT-phase,” IEEE Signal Process. Lett., vol. 20,no. 2, pp. 129–132, Feb. 2013.
[13] M. Krawczyk, R. Rehr, and T. Gerkmann, “Phase-sensitive real-timecapable speech enhancement under voiced-unvoiced uncertainty,” inEURASIP Europ. Signal Process. Conf. (EUSIPCO), Marrakech, Mo-rocco, Sep. 2013.
[14] T. Gerkmann, “Bayesian estimation of clean speech spectral coefficientsgiven a priori knowledge of the phase,” IEEE Trans. Signal Process.,vol. 62, no. 16, pp. 4199–4208, Aug 2014.
[15] D. Griffin, D. Deadrick, and J. Lim, “Speech synthesis from short-timeFourier transform magnitude and its application to speech processing,”in IEEE Int. Conf. Acoust., Speech, Signal Process. (ICASSP), vol. 9,Mar 1984, pp. 61–64.
[16] M. Krawczyk and T. Gerkmann, “STFT phase improvement for singlechannel speech enhancement,” in Int. Workshop Acoustic Echo, Noise
Control (IWAENC), Aachen, Germany, Sep. 2012.[17] E. Mehmetcik and T. Ciloglu, “Speech enhancement by maintaining
phase continuity,” in Proc. of Meetings of the Acoustical Society of
America, vol. 18, no. 055002, Nov. 2012.[18] A. P. Stark and K. K. Paliwal, “Speech analysis using instantaneous
frequency deviation,” in ISCA Interspeech, vol. 9, Brisbane, Australia,Sep. 2008, pp. 2602–2605.
[19] ——, “Group-delay-deviation based spectral analysis of speech,” inISCA Interspeech, vol. 10, Brighton, UK, Sep. 2009, pp. 1083–1086.
[20] P. Vary, “Noise suppression by spectral magnitude estimation – mech-anism and theoretical limits,” ELSEVIER Signal Process., vol. 8, pp.387–400, May 1985.
[21] F. J. Charpentier, “Pitch detection using the short-term phase spectrum,”in IEEE Int. Conf. Acoust., Speech, Signal Process. (ICASSP), Tokyo,Japan, April 1986, pp. 113–116.
[22] T. Quatieri and R. McAulay, “Noise reduction using a soft-decisionsine-wave vector quantizer,” in IEEE Int. Conf. Acoust., Speech, Signal
Process. (ICASSP), Apr 1990, pp. 821–824 vol.2.[23] M. E. Deisher and A. S. Spanias, “Speech enhancement using state-
based estimation and sinusoidal modeling,” J. Acoust. Soc. Amer., vol.102, no. 2, pp. 1141–1148, 1997.
[24] J. Jensen and J. H. Hansen, “Speech enhancement using a constrainediterative sinusoidal model,” IEEE Trans. Speech Audio Process., vol. 9,no. 7, pp. 731–740, Oct. 2001.
[25] M. McCallum and B. Guillemin, “Stochastic-deterministic mmse stftspeech enhancement with general a priori information,” IEEE Trans.
Audio, Speech, Language Process., vol. 21, no. 7, pp. 1445–1457, July2013.
[26] R. McAulay and T. Quatieri, “Speech analysis/synthesis based on asinusoidal representation,” IEEE Trans. Acoust., Speech, Signal Process.,vol. 34, no. 4, pp. 744–754, Aug 1986.
[27] K. Hamdy, M. Ali, and A. Tewfik, “Low bit rate high quality audiocoding with combined harmonic and wavelet representations,” in IEEE
Int. Conf. Acoust., Speech, Signal Process. (ICASSP), May 1996, pp.1045–1048 vol. 2.
[28] P. Vary and R. Martin, Digital Speech Transmission: Enhancement,
Coding And Error Concealment. Chichester, West Sussex, UK: JohnWiley & Sons, 2006.
[29] S. Gonzalez and M. Brookes, “PEFAC – a pitch estimation algorithmrobust to high levels of noise,” IEEE Trans. Audio, Speech, Language
Process., vol. 22, no. 2, pp. 518–530, Feb. 2014.[30] M. Christensen, J. Hojvang, A. Jakobsson, and S. Jensen, “Joint
fundamental frequency and order estimation using optimal filtering,”EURASIP Journal on Advances in Signal Processing, vol. 2011, no. 1,p. 13, 2011.
[31] S. Gonzalez, “Pitch of the core TIMIT database set,” http://www.ee.ic.ac.uk/hp/staff/dmb/data/TIMITfxv.zip, Feb. 2014.
[32] J. S. Garofolo, “DARPA TIMIT acoustic-phonetic speech database,”National Institute of Standards and Technology (NIST), 1988.
[33] ITU-T, “Perceptual evaluation of speech quality (PESQ),” ITU-T Rec-
ommendation P.862, 2001.[34] J. Tribolet, P. Noll, B. McDermott, and R. Crochiere, “A study of
complexity and quality of speech waveform coders,” in IEEE Int. Conf.
Acoust., Speech, Signal Process. (ICASSP), vol. 3, Apr 1978, pp. 586–590.
[35] M. Brookes, “VOICEBOX: a speech processing toolbox forMATLAB.” [Online]. Available: http://www.ee.ic.ac.uk/hp/staff/dmb/voicebox/voicebox.html
[36] Y. Hu and P. Loizou, “Evaluation of objective quality measures forspeech enhancement,” IEEE Trans. Audio, Speech, Language Process.,vol. 16, no. 1, pp. 229–238, Jan 2008.
[37] T. Gerkmann and R. C. Hendriks, “Unbiased MMSE-based noise powerestimation with low complexity and low tracking delay,” IEEE Trans.
Audio, Speech, Language Process., vol. 20, no. 4, pp. 1383–1393, May2012.
[38] M. Krawczyk and T. Gerkmann. STFT phase reconstruction based ona harmonic model: listening examples and code. [Online]. Available:http://www.speech.uni-oldenburg.de/phasereconstruction.html
Martin Krawczyk studied electrical and informa-tion engineering at the Ruhr-Universitat Bochum,Germany. His major was communication technologywith a focus on audio processing and he receivedhis Dipl.-Ing. degree in August 2011. From January2010 to July 2010 he was with Siemens CorporateResearch in Princeton, NJ, USA. Since November2011 he is pursuing a Ph.D in the field of speechenhancement and noise reduction at the UniversitatOldenburg, Oldenburg, Germany.
Timo Gerkmann studied electrical engineering atthe universities of Bremen and Bochum, Germany.He received his Dipl.-Ing. degree in 2004 andhis Dr.-Ing. degree in 2010 both at the Instituteof Communication Acoustics (IKA) at the Ruhr-Universitat Bochum, Bochum, Germany. In 2005, hewas with Siemens Corporate Research in Princeton,NJ, USA. During 2010 to 2011 Dr. Gerkmann wasa postdoctoral researcher at the Sound and ImageProcessing Lab at the Royal Institute of Technology(KTH), Stockholm, Sweden. Since 2011 he has been
a professor for Speech Signal Processing at the Universitat Oldenburg,Oldenburg, Germany. His main research interests are digital speech and audioprocessing, including speech enhancement, modeling of speech signals, andhearing devices.


![Time Domain Methods in Speech Processing speech... · Coefficients, Formants, Vocal TPl ilAil voiced sound T T ... • Representation goes from time sample x[n],n to parameter =",0,1,2,"](https://img.pdfslide.us/doc/110x75/60e68950e0db17356a14522e/time-domain-methods-in-speech-processing-speech-coefficients-formants-vocal.jpg)