Embed Size (px)
Citation preview

The Economic Impact of
Steward Health Care System
on the Massachusetts Economy: 2010-2012

04 Executive summary
07 Introduction
08 Investments
08 Hospital purchases
10 Construction and capital improvements
13 Ambulatory physicians
13 Information technology
14 Growth of operations
18 Economic impact of investments and growth
21 Employment profile
22 Tax impact
25 Community benefit
26 Socioeconomic impact
30 Affordability
33 Quality
35 Conclusion
36 Appendix
36 Methodology
38 Other detail
42 Definition of not-for-profit and for-profit hospitals
43 Summary of Asset Purchase Agreement
44 Sources cited
45 Index of exhibits
Table of Contents
4
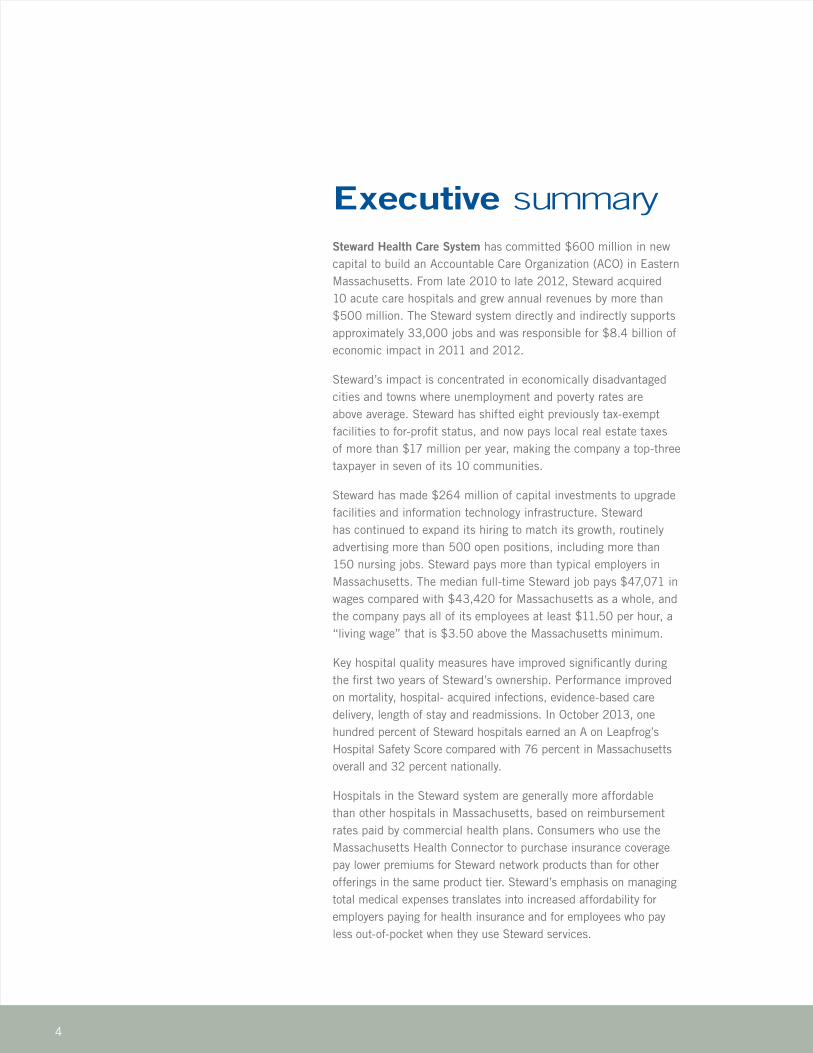
Executive summarySteward Health Care System has committed $600 million in new capital to build an Accountable Care Organization (ACO) in Eastern Massachusetts. From late 2010 to late 2012, Steward acquired 10 acute care hospitals and grew annual revenues by more than $500 million. The Steward system directly and indirectly supports approximately 33,000 jobs and was responsible for $8.4 billion of economic impact in 2011 and 2012.
Steward’s impact is concentrated in economically disadvantaged cities and towns where unemployment and poverty rates are above average. Steward has shifted eight previously tax-exempt facilities to for-profit status, and now pays local real estate taxes of more than $17 million per year, making the company a top-three taxpayer in seven of its 10 communities.
Steward has made $264 million of capital investments to upgrade facilities and information technology infrastructure. Steward has continued to expand its hiring to match its growth, routinely advertising more than 500 open positions, including more than 150 nursing jobs. Steward pays more than typical employers in Massachusetts. The median full-time Steward job pays $47,071 in wages compared with $43,420 for Massachusetts as a whole, and the company pays all of its employees at least $11.50 per hour, a “living wage” that is $3.50 above the Massachusetts minimum.
Key hospital quality measures have improved significantly during the first two years of Steward’s ownership. Performance improved on mortality, hospital- acquired infections, evidence-based care delivery, length of stay and readmissions. In October 2013, one hundred percent of Steward hospitals earned an A on Leapfrog’s Hospital Safety Score compared with 76 percent in Massachusetts overall and 32 percent nationally.
Hospitals in the Steward system are generally more affordable than other hospitals in Massachusetts, based on reimbursement rates paid by commercial health plans. Consumers who use the Massachusetts Health Connector to purchase insurance coverage pay lower premiums for Steward network products than for other offerings in the same product tier. Steward’s emphasis on managing total medical expenses translates into increased affordability for employers paying for health insurance and for employees who pay less out-of-pocket when they use Steward services.
5
Steward acquired 10 acute care hospitals between 2010 and 2012, growing annual revenue more than $500 million

6
Steward is a for-profit
company, which paid more than $26 million in taxes in 2012
7
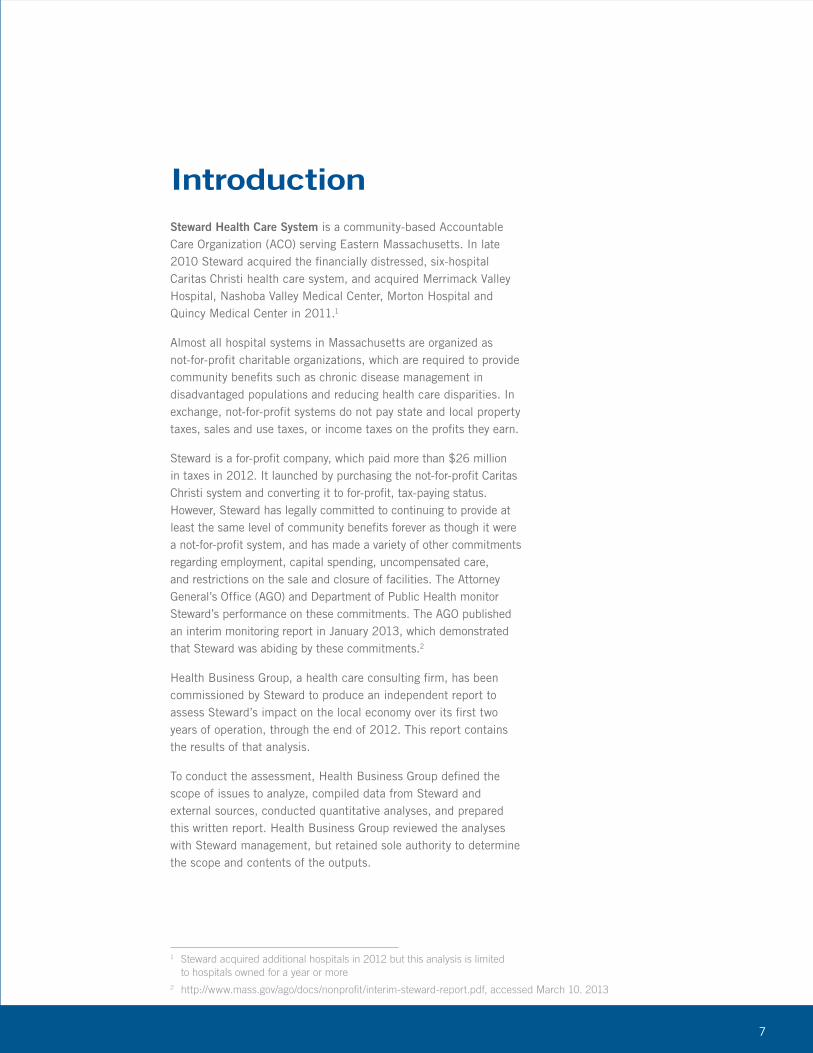
Introduction Steward Health Care System is a community-based Accountable Care Organization (ACO) serving Eastern Massachusetts. In late 2010 Steward acquired the financially distressed, six-hospital Caritas Christi health care system, and acquired Merrimack Valley Hospital, Nashoba Valley Medical Center, Morton Hospital and Quincy Medical Center in 2011.1
Almost all hospital systems in Massachusetts are organized as not-for-profit charitable organizations, which are required to provide community benefits such as chronic disease management in disadvantaged populations and reducing health care disparities. In exchange, not-for-profit systems do not pay state and local property taxes, sales and use taxes, or income taxes on the profits they earn.
Steward is a for-profit company, which paid more than $26 million in taxes in 2012. It launched by purchasing the not-for-profit Caritas Christi system and converting it to for-profit, tax-paying status. However, Steward has legally committed to continuing to provide at least the same level of community benefits forever as though it were a not-for-profit system, and has made a variety of other commitments regarding employment, capital spending, uncompensated care, and restrictions on the sale and closure of facilities. The Attorney General’s Office (AGO) and Department of Public Health monitor Steward’s performance on these commitments. The AGO published an interim monitoring report in January 2013, which demonstrated that Steward was abiding by these commitments. 2
Health Business Group, a health care consulting firm, has been commissioned by Steward to produce an independent report to assess Steward’s impact on the local economy over its first two years of operation, through the end of 2012. This report contains the results of that analysis.
To conduct the assessment, Health Business Group defined the scope of issues to analyze, compiled data from Steward and external sources, conducted quantitative analyses, and prepared this written report. Health Business Group reviewed the analyses with Steward management, but retained sole authority to determine the scope and contents of the outputs.
1 Steward acquired additional hospitals in 2012 but this analysis is limited to hospitals owned for a year or more2 http://www.mass.gov/ago/docs/nonprofit/interim-steward-report.pdf, accessed March 10. 2013
8
InvestmentsSteward Health Care commenced operations in November 2010 with a commitment of $600 million from Cerberus Capital Management, a New York based private equity firm whose investors include large public pension funds and endowments, to invest in the acquisition, improvement and growth of a community-based health care system in Eastern Massachusetts. Its stated business objective was to “develop a high-quality, lower-cost, community-based health care system that can serve as a viable alternative to more expensive models of care, such as those often centered at urban academic medical centers.”3
The AGO conducted a comprehensive review of the initial transaction in 2010 and concluded that the formation of Steward was in the public interest. In particular, the AGO determined that without an infusion of funds from Steward, the Caritas hospitals would be in unstable financial condition and lack the capital to invest to upgrade aging facilities, that at least one hospital would likely have to close due to financial distress, and that the pensions of 13,000 Caritas employees and retirees would be at risk.4 The proposed transaction was also reviewed by the Department of Public Health, Supreme Judicial Court, Roman Catholic Archdiocese of Boston, and the Vatican.
During its first two years of operation, Steward deployed $313 million in outside capital to purchase hospitals and other assets. In addition, the company invested $202.5 million in new construction and capital improvements, and another $60.7 million in information technology.
Hospital purchases
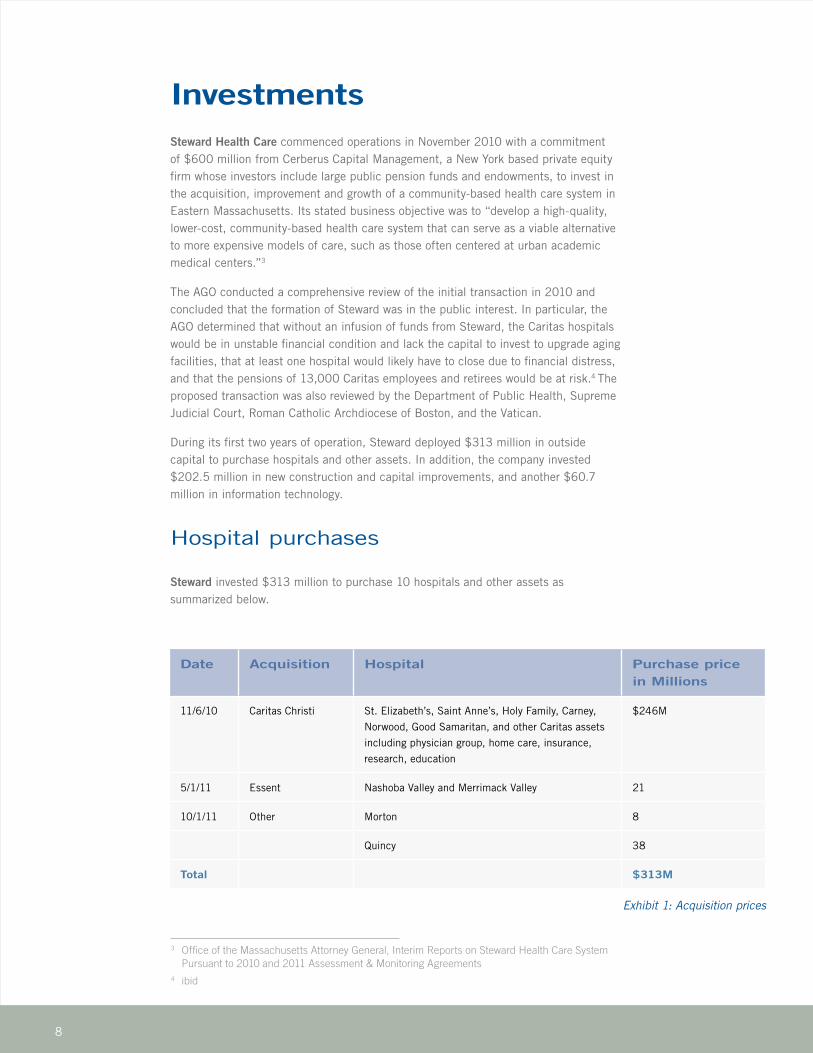
Steward invested $313 million to purchase 10 hospitals and other assets as summarized below.
Date Acquisition Hospital Purchase price in Millions
11/6/10 Caritas Christi St. Elizabeth’s, Saint Anne’s, Holy Family, Carney,
Norwood, Good Samaritan, and other Caritas assets
including physician group, home care, insurance,
research, education
$246M
5/1/11 Essent Nashoba Valley and Merrimack Valley 21
10/1/11 Other Morton 8
Quincy 38
Total $313M
Exhibit 1: Acquisition prices
3 Office of the Massachusetts Attorney General, Interim Reports on Steward Health Care System Pursuant to 2010 and 2011 Assessment & Monitoring Agreements 4 ibid

9
The company invested $202.5 million in new construction and capital investments
10
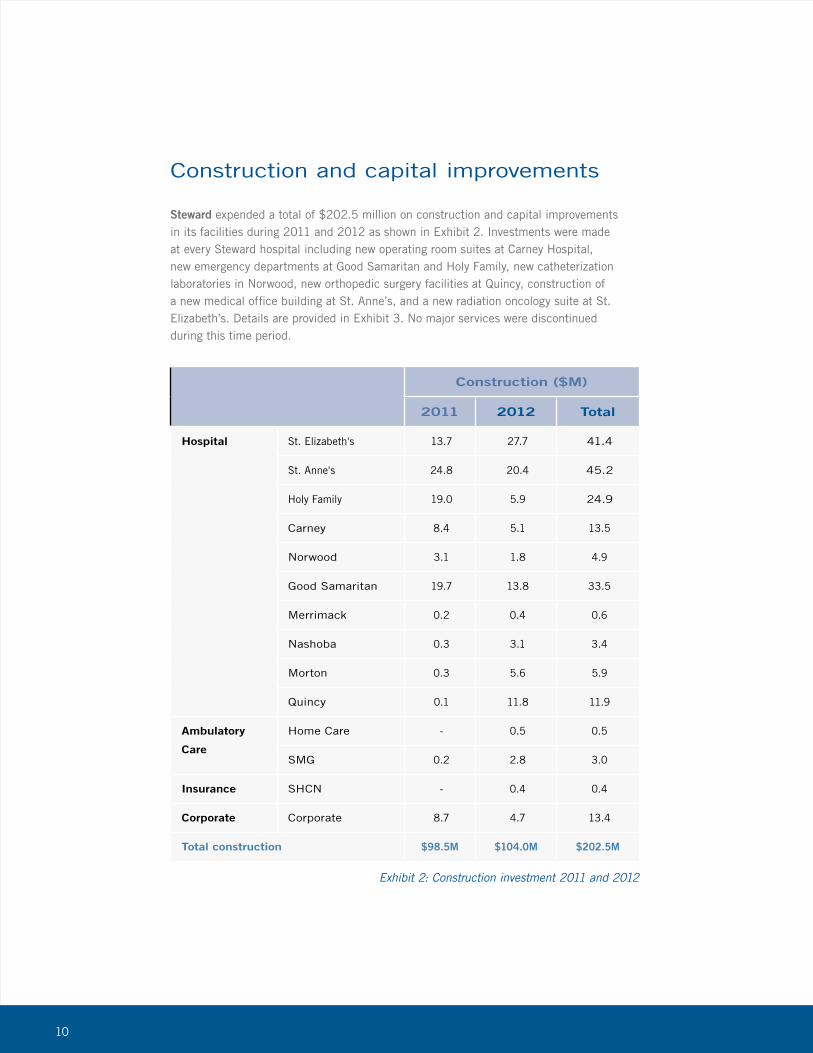
Construction and capital improvements
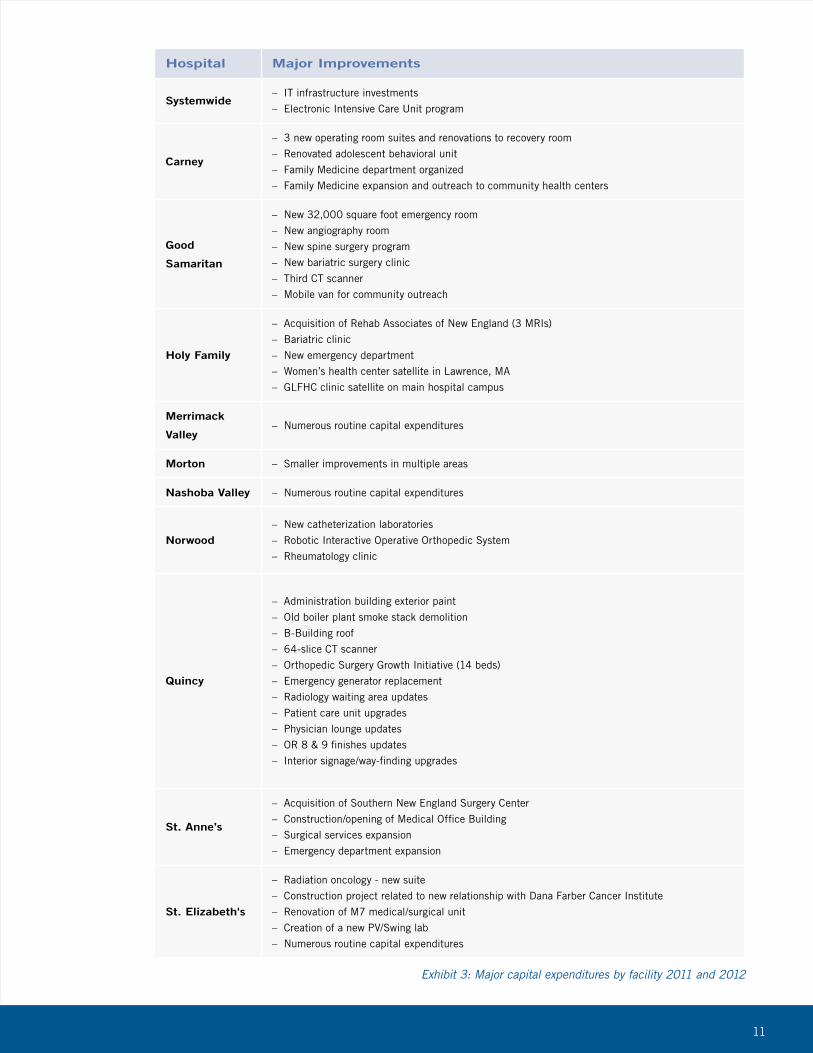
Steward expended a total of $202.5 million on construction and capital improvements in its facilities during 2011 and 2012 as shown in Exhibit 2. Investments were made at every Steward hospital including new operating room suites at Carney Hospital, new emergency departments at Good Samaritan and Holy Family, new catheterization laboratories in Norwood, new orthopedic surgery facilities at Quincy, construction of a new medical office building at St. Anne’s, and a new radiation oncology suite at St. Elizabeth’s. Details are provided in Exhibit 3. No major services were discontinuedduring this time period.
Construction ($M)
2011 2012 Total
Hospital St. Elizabeth's 13.7 27.7 41.4
St. Anne's 24.8 20.4 45.2
Holy Family 19.0 5.9 24.9
Carney 8.4 5.1 13.5
Norwood 3.1 1.8 4.9
Good Samaritan 19.7 13.8 33.5
Merrimack 0.2 0.4 0.6
Nashoba 0.3 3.1 3.4
Morton 0.3 5.6 5.9
Quincy 0.1 11.8 11.9
Ambulatory
Care
Home Care - 0.5 0.5
SMG 0.2 2.8 3.0
Insurance SHCN - 0.4 0.4
Corporate Corporate 8.7 4.7 13.4
Total construction $98.5M $104.0M $202.5M
Exhibit 2: Construction investment 2011 and 2012
11
Hospital Major Improvements
Systemwide– IT infrastructure investments
– Electronic Intensive Care Unit program
Carney
– 3 new operating room suites and renovations to recovery room
– Renovated adolescent behavioral unit
– Family Medicine department organized
– Family Medicine expansion and outreach to community health centers
Good
Samaritan
– New 32,000 square foot emergency room
– New angiography room
– New spine surgery program
– New bariatric surgery clinic
– Third CT scanner
– Mobile van for community outreach
Holy Family
– Acquisition of Rehab Associates of New England (3 MRIs)
– Bariatric clinic
– New emergency department
– Women’s health center satellite in Lawrence, MA
– GLFHC clinic satellite on main hospital campus
Merrimack
Valley– Numerous routine capital expenditures
Morton – Smaller improvements in multiple areas
Nashoba Valley – Numerous routine capital expenditures
Norwood– New catheterization laboratories
– Robotic Interactive Operative Orthopedic System
– Rheumatology clinic
Quincy
– Administration building exterior paint
– Old boiler plant smoke stack demolition
– B-Building roof
– 64-slice CT scanner
– Orthopedic Surgery Growth Initiative (14 beds)
– Emergency generator replacement
– Radiology waiting area updates
– Patient care unit upgrades
– Physician lounge updates
– OR 8 & 9 finishes updates
– Interior signage/way-finding upgrades
St. Anne’s
– Acquisition of Southern New England Surgery Center
– Construction/opening of Medical Office Building
– Surgical services expansion
– Emergency department expansion
St. Elizabeth's
– Radiation oncology - new suite
– Construction project related to new relationship with Dana Farber Cancer Institute
– Renovation of M7 medical/surgical unit
– Creation of a new PV/Swing lab
– Numerous routine capital expenditures
Exhibit 3: Major capital expenditures by facility 2011 and 2012
12
Steward is focused
on providing care in the
most clinically appropriate and
cost effective settings
13
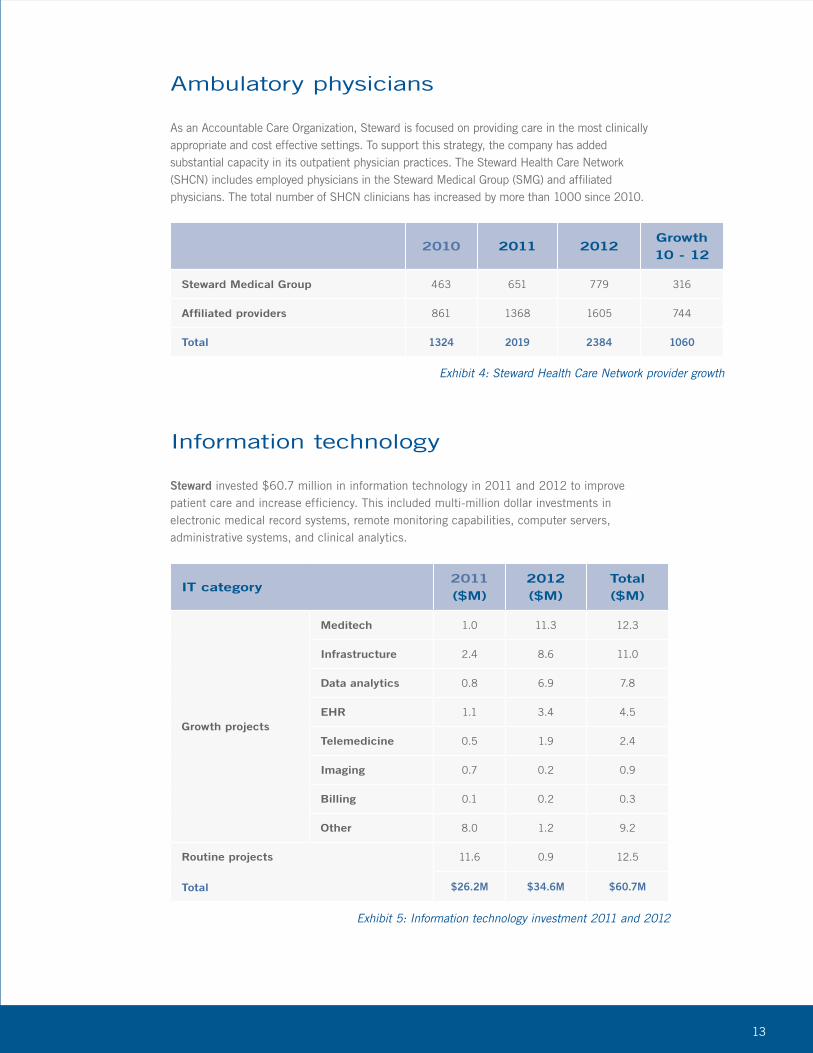
Ambulatory physicians
As an Accountable Care Organization, Steward is focused on providing care in the most clinically appropriate and cost effective settings. To support this strategy, the company has added substantial capacity in its outpatient physician practices. The Steward Health Care Network (SHCN) includes employed physicians in the Steward Medical Group (SMG) and affiliated physicians. The total number of SHCN clinicians has increased by more than 1000 since 2010.
Information technology
Steward invested $60.7 million in information technology in 2011 and 2012 to improve patient care and increase efficiency. This included multi-million dollar investments in electronic medical record systems, remote monitoring capabilities, computer servers, administrative systems, and clinical analytics.
2010 2011 2012Growth 10 - 12
Steward Medical Group 463 651 779 316
Affiliated providers 861 1368 1605 744
Total 1324 2019 2384 1060
Exhibit 4: Steward Health Care Network provider growth
IT category2011 ($M)
2012 ($M)
Total ($M)
Growth projects
Meditech 1.0 11.3 12.3
Infrastructure 2.4 8.6 11.0
Data analytics 0.8 6.9 7.8
EHR 1.1 3.4 4.5
Telemedicine 0.5 1.9 2.4
Imaging 0.7 0.2 0.9
Billing 0.1 0.2 0.3
Other 8.0 1.2 9.2
Routine projects
Total
11.6 0.9 12.5
$26.2M $34.6M $60.7M
Exhibit 5: Information technology investment 2011 and 2012
14
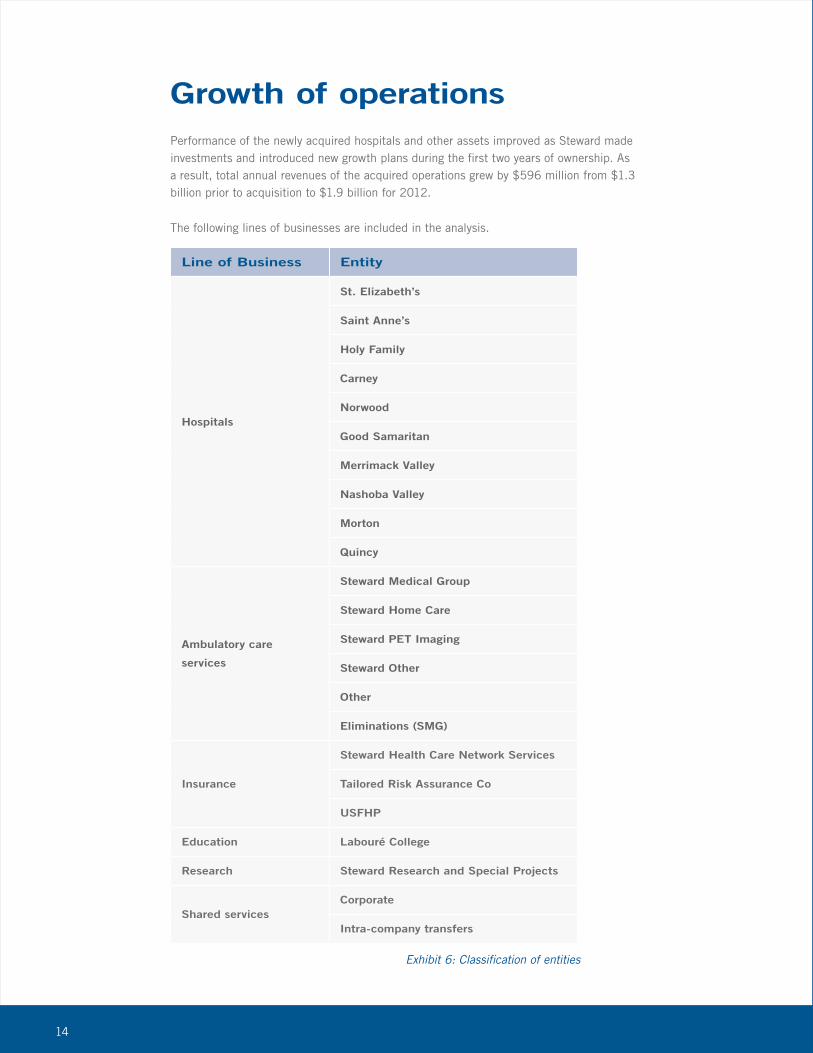
Growth of operationsPerformance of the newly acquired hospitals and other assets improved as Steward made investments and introduced new growth plans during the first two years of ownership. As a result, total annual revenues of the acquired operations grew by $596 million from $1.3 billion prior to acquisition to $1.9 billion for 2012.
The following lines of businesses are included in the analysis.
Line of Business Entity
Hospitals
St. Elizabeth’s
Saint Anne’s
Holy Family
Carney
Norwood
Good Samaritan
Merrimack Valley
Nashoba Valley
Morton
Quincy
Ambulatory care
services
Steward Medical Group
Steward Home Care
Steward PET Imaging
Steward Other
Other
Eliminations (SMG)
Insurance
Steward Health Care Network Services
Tailored Risk Assurance Co
USFHP
Education Labouré College
Research Steward Research and Special Projects
Shared servicesCorporate
Intra-company transfers
Exhibit 6: Classification of entities
15
Annual revenues of the acquired operations grew by $596 million

16
Revenue has grown
consistently since 2010
17
Line of Business
FY 2010 Pre-
Acquisition
($M)
FY2011 ($M) FY2012 ($M)
Hospitals 1,053 1,242 1,476
Ambulatory care services 204 255 352
Clinical services subtotal 1,257 1,497 1,828
Insurance 165 197 211
Education 8 9 12
Research 1 7 9
Shared services (83) (106) (116)
Total $1,348M $1,604M $1,944M
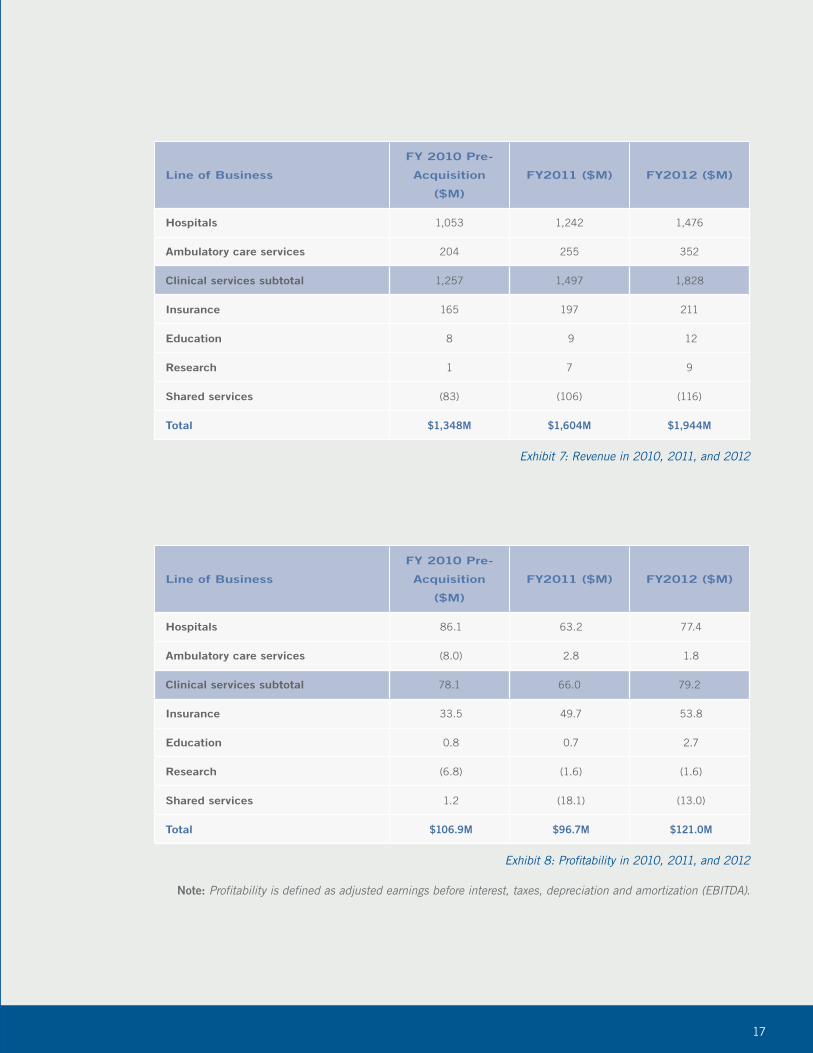
Exhibit 7: Revenue in 2010, 2011, and 2012
Line of Business
FY 2010 Pre-
Acquisition
($M)
FY2011 ($M) FY2012 ($M)
Hospitals 86.1 63.2 77.4
Ambulatory care services (8.0) 2.8 1.8
Clinical services subtotal 78.1 66.0 79.2
Insurance 33.5 49.7 53.8
Education 0.8 0.7 2.7
Research (6.8) (1.6) (1.6)
Shared services 1.2 (18.1) (13.0)
Total $106.9M $96.7M $121.0M
Exhibit 8: Profitability in 2010, 2011, and 2012
Note: Profitability is defined as adjusted earnings before interest, taxes, depreciation and amortization (EBITDA).

18
Economic impact of investments and growthSteward’s new capital investments and success in growing its operations had a very significant impact on the economy of Eastern Massachusetts in 2011 and 2012. This includes the direct impact to Steward employees through wages, indirect impacts to suppliers as they respond to opportunities from Steward, and induced benefits as employee and supplier spending ripple through the economy to unrelated local businesses such as grocery stores, auto dealers, and dry cleaners.
Based on the U.S. Bureau of Economic Analysis multipliers, Steward Health Care System’s total local economic impact in 2011 and 2012 is estimated at $8.4 billion, which translates into a total of approximately 33,000 direct, indirect, and induced jobs. A highly conservative “incremental” analysis approach, which considers only the new investment and growth of operations in 2011 and 2012, provides an economic impact estimate of $1.6 billion and job impact of 2,400.
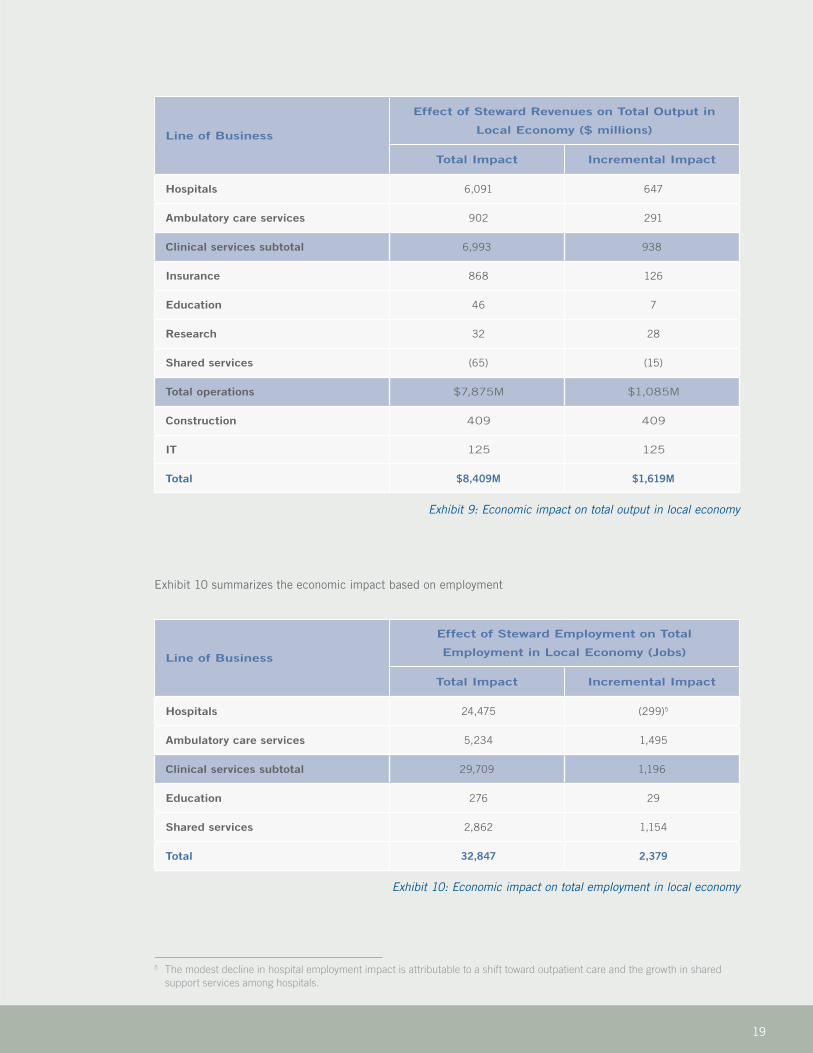
Exhibit 9 summarizes Steward’s economic impact using the total and incremental approaches for economic output, which is based on revenue.
19
Line of Business
Effect of Steward Revenues on Total Output in
Local Economy ($ millions)
Total Impact Incremental Impact
Hospitals 6,091 647
Ambulatory care services 902 291
Clinical services subtotal 6,993 938
Insurance 868 126
Education 46 7
Research 32 28
Shared services (65) (15)
Total operations $7,875M $1,085M
Construction 409 409
IT 125 125
Total $8,409M $1,619M
Exhibit 9: Economic impact on total output in local economy
5 The modest decline in hospital employment impact is attributable to a shift toward outpatient care and the growth in shared support services among hospitals.
Line of Business
Effect of Steward Employment on Total
Employment in Local Economy (Jobs)
Total Impact Incremental Impact
Hospitals 24,475 (299)5
Ambulatory care services 5,234 1,495
Clinical services subtotal 29,709 1,196
Education 276 29
Shared services 2,862 1,154
Total 32,847 2,379
Exhibit 10: Economic impact on total employment in local economy
Exhibit 10 summarizes the economic impact based on employment

20
The number of employees
rose by 3,725,
from 11,624 to 15,349
21
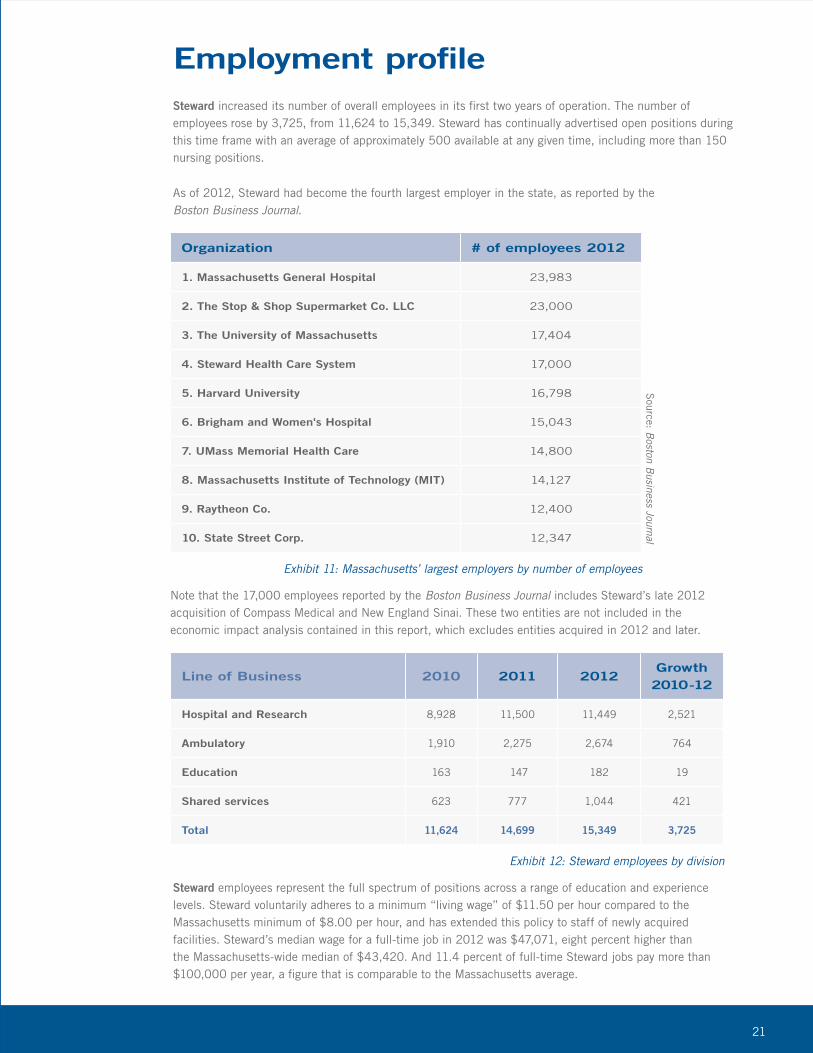
Employment profileSteward increased its number of overall employees in its first two years of operation. The number of employees rose by 3,725, from 11,624 to 15,349. Steward has continually advertised open positions during this time frame with an average of approximately 500 available at any given time, including more than 150 nursing positions.
As of 2012, Steward had become the fourth largest employer in the state, as reported by the Boston Business Journal.
Organization # of employees 2012
1. Massachusetts General Hospital 23,983
2. The Stop & Shop Supermarket Co. LLC 23,000
3. The University of Massachusetts 17,404
4. Steward Health Care System 17,000
5. Harvard University 16,798
6. Brigham and Women's Hospital 15,043
7. UMass Memorial Health Care 14,800
8. Massachusetts Institute of Technology (MIT) 14,127
9. Raytheon Co. 12,400
10. State Street Corp. 12,347
Exhibit 11: Massachusetts’ largest employers by number of employees
Source: B
oston Business Journal
Note that the 17,000 employees reported by the Boston Business Journal includes Steward’s late 2012 acquisition of Compass Medical and New England Sinai. These two entities are not included in the economic impact analysis contained in this report, which excludes entities acquired in 2012 and later.
Line of Business 2010 2011 2012Growth 2010-12
Hospital and Research 8,928 11,500 11,449 2,521
Ambulatory 1,910 2,275 2,674 764
Education 163 147 182 19
Shared services 623 777 1,044 421
Total 11,624 14,699 15,349 3,725
Exhibit 12: Steward employees by division
Steward employees represent the full spectrum of positions across a range of education and experience levels. Steward voluntarily adheres to a minimum “living wage” of $11.50 per hour compared to the Massachusetts minimum of $8.00 per hour, and has extended this policy to staff of newly acquired facilities. Steward’s median wage for a full-time job in 2012 was $47,071, eight percent higher than the Massachusetts-wide median of $43,420. And 11.4 percent of full-time Steward jobs pay more than $100,000 per year, a figure that is comparable to the Massachusetts average.
22
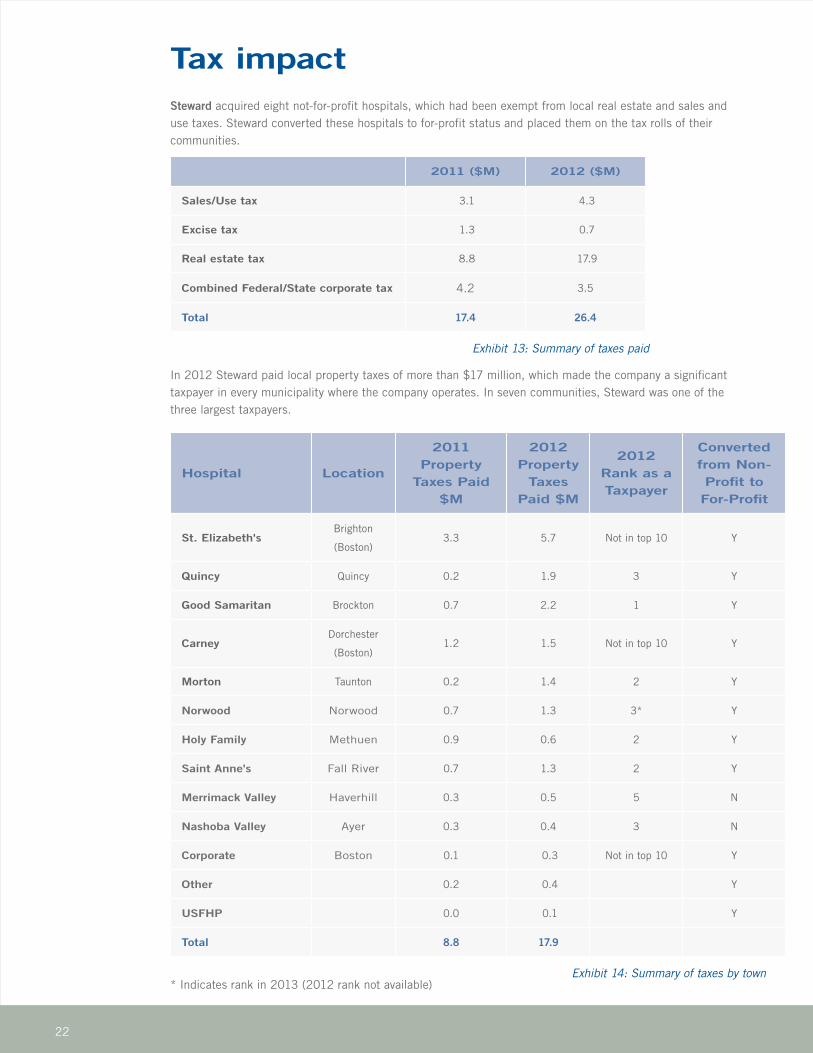
Hospital Location
2011 Property
Taxes Paid $M
2012 Property
Taxes Paid $M
2012 Rank as a Taxpayer
Converted from Non-Profit to For-Profit
St. Elizabeth's Brighton
(Boston)3.3 5.7 Not in top 10 Y
Quincy Quincy 0.2 1.9 3 Y
Good Samaritan Brockton 0.7 2.2 1 Y
Carney Dorchester
(Boston)1.2 1.5 Not in top 10 Y
Morton Taunton 0.2 1.4 2 Y
Norwood Norwood 0.7 1.3 3* Y
Holy Family Methuen 0.9 0.6 2 Y
Saint Anne's Fall River 0.7 1.3 2 Y
Merrimack Valley Haverhill 0.3 0.5 5 N
Nashoba Valley Ayer 0.3 0.4 3 N
Corporate Boston 0.1 0.3 Not in top 10 Y
Other 0.2 0.4 Y
USFHP 0.0 0.1 Y
Total 8.8 17.9
Exhibit 14: Summary of taxes by town
Tax impactSteward acquired eight not-for-profit hospitals, which had been exempt from local real estate and sales and use taxes. Steward converted these hospitals to for-profit status and placed them on the tax rolls of their communities.
2011 ($M) 2012 ($M)
Sales/Use tax 3.1 4.3
Excise tax 1.3 0.7
Real estate tax 8.8 17.9
Combined Federal/State corporate tax 4.2 3.5
Total 17.4 26.4
Exhibit 13: Summary of taxes paid
In 2012 Steward paid local property taxes of more than $17 million, which made the company a significant taxpayer in every municipality where the company operates. In seven communities, Steward was one of the three largest taxpayers.
* Indicates rank in 2013 (2012 rank not available)

23
In 2012 Steward paid local property taxes of more than $17 million

24
In its first two years of
operations Steward
provided over $100 million
in community benefit spending
25
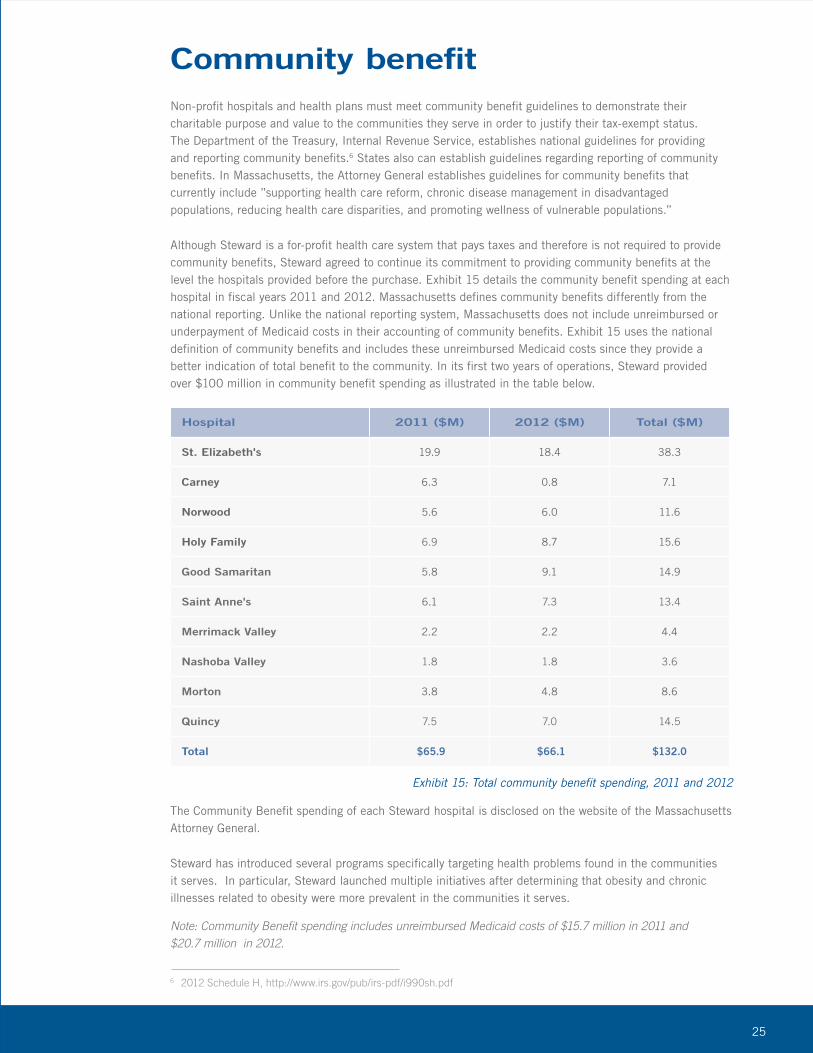
Community benefitNon-profit hospitals and health plans must meet community benefit guidelines to demonstrate their charitable purpose and value to the communities they serve in order to justify their tax-exempt status. The Department of the Treasury, Internal Revenue Service, establishes national guidelines for providing and reporting community benefits.6 States also can establish guidelines regarding reporting of community benefits. In Massachusetts, the Attorney General establishes guidelines for community benefits that currently include ”supporting health care reform, chronic disease management in disadvantaged populations, reducing health care disparities, and promoting wellness of vulnerable populations.”
Although Steward is a for-profit health care system that pays taxes and therefore is not required to provide community benefits, Steward agreed to continue its commitment to providing community benefits at the level the hospitals provided before the purchase. Exhibit 15 details the community benefit spending at each hospital in fiscal years 2011 and 2012. Massachusetts defines community benefits differently from the national reporting. Unlike the national reporting system, Massachusetts does not include unreimbursed or underpayment of Medicaid costs in their accounting of community benefits. Exhibit 15 uses the national definition of community benefits and includes these unreimbursed Medicaid costs since they provide a better indication of total benefit to the community. In its first two years of operations, Steward provided over $100 million in community benefit spending as illustrated in the table below.
Hospital 2011 ($M) 2012 ($M) Total ($M)
St. Elizabeth's 19.9 18.4 38.3
Carney 6.3 0.8 7.1
Norwood 5.6 6.0 11.6
Holy Family 6.9 8.7 15.6
Good Samaritan 5.8 9.1 14.9
Saint Anne's 6.1 7.3 13.4
Merrimack Valley 2.2 2.2 4.4
Nashoba Valley 1.8 1.8 3.6
Morton 3.8 4.8 8.6
Quincy 7.5 7.0 14.5
Total $65.9 $66.1 $132.0
Exhibit 15: Total community benefit spending, 2011 and 2012
6 2012 Schedule H, http://www.irs.gov/pub/irs-pdf/i990sh.pdf
Note: Community Benefit spending includes unreimbursed Medicaid costs of $15.7 million in 2011 and $20.7 million in 2012.
The Community Benefit spending of each Steward hospital is disclosed on the website of the Massachusetts Attorney General.
Steward has introduced several programs specifically targeting health problems found in the communities it serves. In particular, Steward launched multiple initiatives after determining that obesity and chronic illnesses related to obesity were more prevalent in the communities it serves.
26
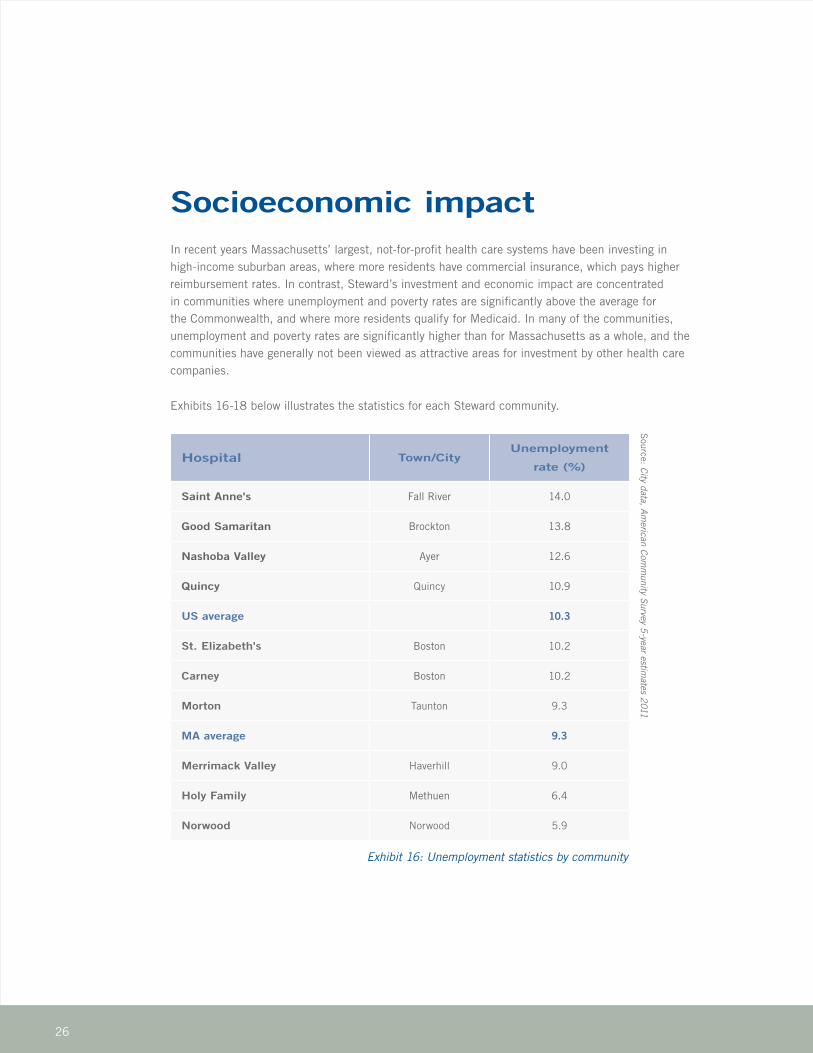
Socioeconomic impactIn recent years Massachusetts’ largest, not-for-profit health care systems have been investing in high-income suburban areas, where more residents have commercial insurance, which pays higher reimbursement rates. In contrast, Steward’s investment and economic impact are concentrated in communities where unemployment and poverty rates are significantly above the average for the Commonwealth, and where more residents qualify for Medicaid. In many of the communities, unemployment and poverty rates are significantly higher than for Massachusetts as a whole, and the communities have generally not been viewed as attractive areas for investment by other health care companies.
Exhibits 16-18 below illustrates the statistics for each Steward community.
Hospital Town/CityUnemployment
rate (%)
Saint Anne's Fall River 14.0
Good Samaritan Brockton 13.8
Nashoba Valley Ayer 12.6
Quincy Quincy 10.9
US average 10.3
St. Elizabeth's Boston 10.2
Carney Boston 10.2
Morton Taunton 9.3
MA average 9.3
Merrimack Valley Haverhill 9.0
Holy Family Methuen 6.4
Norwood Norwood 5.9
Exhibit 16: Unemployment statistics by community
Source: City data, Am
erican Comm
unity Survey 5-year estim
ates 2011

27
Steward’s investment and economic impact are concentrated in communities where unemployment and poverty rates are significantly above the average for the Commonwealth

28
Steward provides their communities
with convenient, local access
to quality care regardless of
socioeconomic status

29
Hospital Town/City% Below poverty
level
Saint Anne's Fall River 21.4
St. Elizabeth’s Boston 21.4
Carney Boston 21.4
US average 15.9
Good Samaritan Brockton 15.6
Nashoba Valley Ayer 14.5
Morton Taunton 12.5
Merrimack Valley Haverhill 12.1
MA average 11.6
Quincy Quincy 10.4
Holy Family Methuen 7.7
Norwood Norwood 6.0
Exhibit 18: Poverty levels by community
Hospital Town/CityPer capita
income ($)
Saint Anne's Fall River $21,118
Good Samaritan Brockton $22,312
Morton Taunton $26,309
US average $26,708
Holy Family Methuen $29,778
Nashoba Valley Ayer $30,456
Merrimack Valley Haverhill $30,574
Quincy Quincy $32,911
St. Elizabeth’s Boston $33,158
Carney Boston $33,158
MA average $34,041
Norwood Norwood $35,997
Exhibit 17: Per capita income by community
Source: City data, Am
erican Comm
unity Survey 5-year estim
ates 2011 S
ource: City data, American Com
munity Survey 5
-year estimates 2011
30
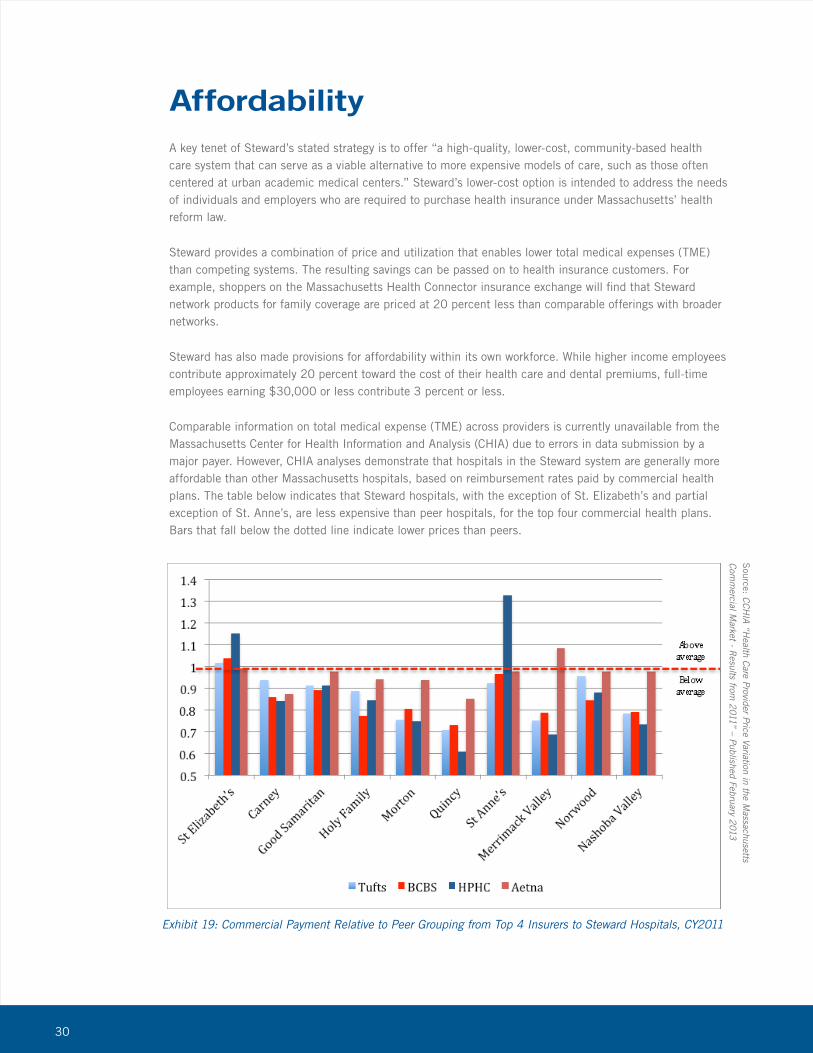
AffordabilityA key tenet of Steward’s stated strategy is to offer “a high-quality, lower-cost, community-based health care system that can serve as a viable alternative to more expensive models of care, such as those often centered at urban academic medical centers.” Steward’s lower-cost option is intended to address the needs of individuals and employers who are required to purchase health insurance under Massachusetts’ health reform law.
Steward provides a combination of price and utilization that enables lower total medical expenses (TME) than competing systems. The resulting savings can be passed on to health insurance customers. For example, shoppers on the Massachusetts Health Connector insurance exchange will find that Steward network products for family coverage are priced at 20 percent less than comparable offerings with broader networks.
Steward has also made provisions for affordability within its own workforce. While higher income employees contribute approximately 20 percent toward the cost of their health care and dental premiums, full-time employees earning $30,000 or less contribute 3 percent or less.
Comparable information on total medical expense (TME) across providers is currently unavailable from the Massachusetts Center for Health Information and Analysis (CHIA) due to errors in data submission by a major payer. However, CHIA analyses demonstrate that hospitals in the Steward system are generally more affordable than other Massachusetts hospitals, based on reimbursement rates paid by commercial health plans. The table below indicates that Steward hospitals, with the exception of St. Elizabeth’s and partial exception of St. Anne’s, are less expensive than peer hospitals, for the top four commercial health plans. Bars that fall below the dotted line indicate lower prices than peers.
Exhibit 19: Commercial Payment Relative to Peer Grouping from Top 4 Insurers to Steward Hospitals, CY2011
Source: C
CHIA “H
ealth Care Provider Price Variation in the Massachusetts
Comm
ercial Market - R
esults from 2011” – Published February 2013
31
Steward provides a combination of price and utilization that enables lower total medical expenses
32
Key hospital quality measures
have improved during the first
two years of ownership
33
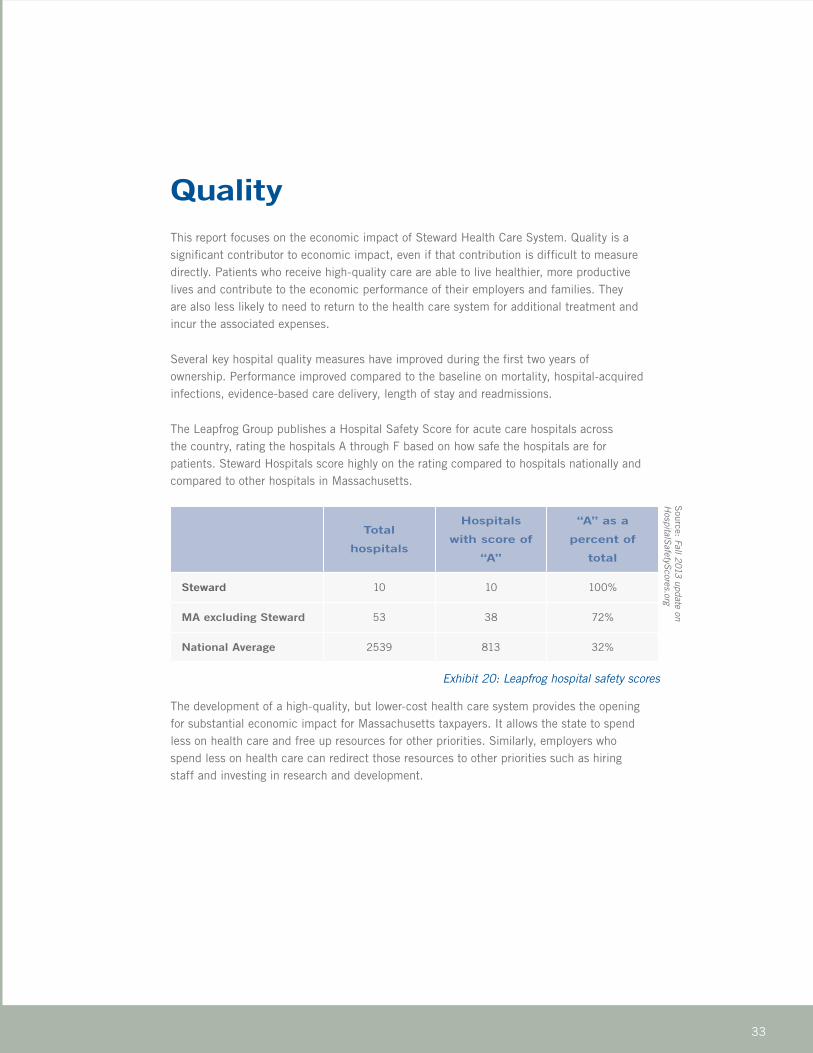
QualityThis report focuses on the economic impact of Steward Health Care System. Quality is a significant contributor to economic impact, even if that contribution is difficult to measure directly. Patients who receive high-quality care are able to live healthier, more productive lives and contribute to the economic performance of their employers and families. They are also less likely to need to return to the health care system for additional treatment and incur the associated expenses.
Several key hospital quality measures have improved during the first two years of ownership. Performance improved compared to the baseline on mortality, hospital-acquired infections, evidence-based care delivery, length of stay and readmissions.
The Leapfrog Group publishes a Hospital Safety Score for acute care hospitals across the country, rating the hospitals A through F based on how safe the hospitals are for patients. Steward Hospitals score highly on the rating compared to hospitals nationally and compared to other hospitals in Massachusetts.
The development of a high-quality, but lower-cost health care system provides the opening for substantial economic impact for Massachusetts taxpayers. It allows the state to spend less on health care and free up resources for other priorities. Similarly, employers who spend less on health care can redirect those resources to other priorities such as hiring staff and investing in research and development.
Total
hospitals
Hospitals
with score of
“A”
“A” as a
percent of
total
Steward 10 10 100%
MA excluding Steward 53 38 72%
National Average 2539 813 32%
Exhibit 20: Leapfrog hospital safety scores
Source: Fall 2013 update on
HospitalSafetyScores.org
34
Steward Health Care System has
made a very substantial
impact on the economy
35
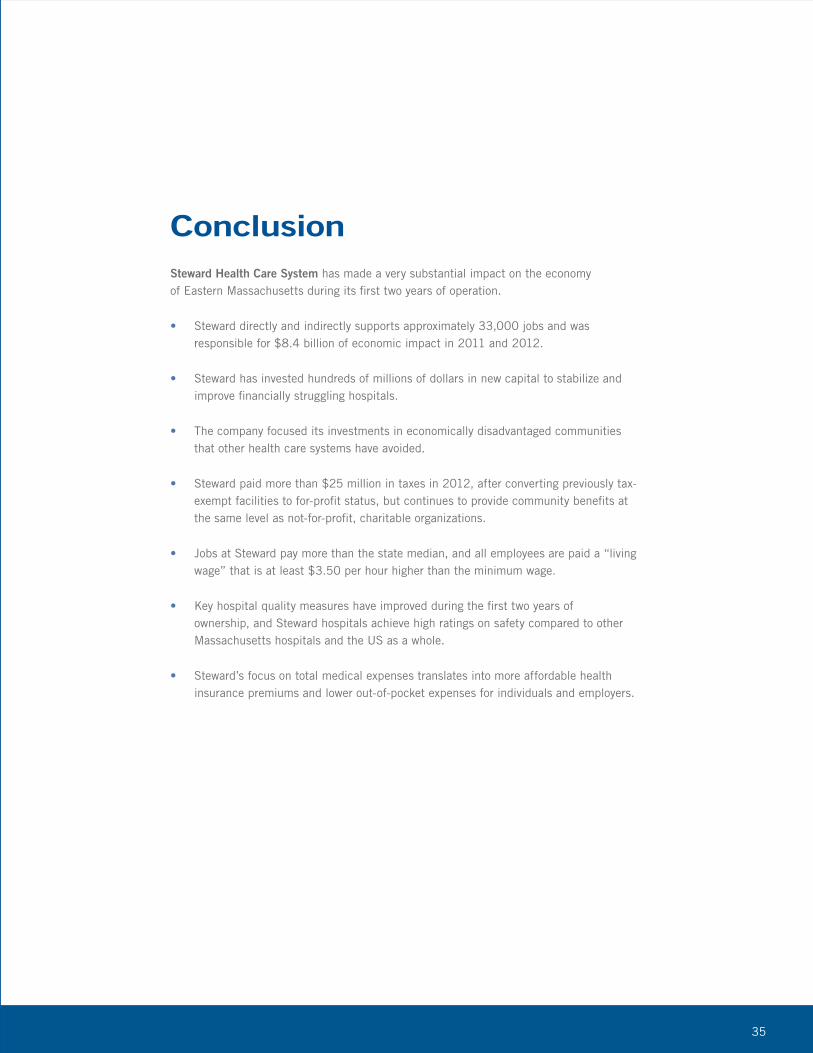
ConclusionSteward Health Care System has made a very substantial impact on the economy of Eastern Massachusetts during its first two years of operation.
• Steward directly and indirectly supports approximately 33,000 jobs and was responsible for $8.4 billion of economic impact in 2011 and 2012.
• Steward has invested hundreds of millions of dollars in new capital to stabilize and improve financially struggling hospitals.
• The company focused its investments in economically disadvantaged communities that other health care systems have avoided.
• Steward paid more than $25 million in taxes in 2012, after converting previously tax-exempt facilities to for-profit status, but continues to provide community benefits at the same level as not-for-profit, charitable organizations.
• Jobs at Steward pay more than the state median, and all employees are paid a “living wage” that is at least $3.50 per hour higher than the minimum wage.
• Key hospital quality measures have improved during the first two years of ownership, and Steward hospitals achieve high ratings on safety compared to other Massachusetts hospitals and the US as a whole.
• Steward’s focus on total medical expenses translates into more affordable health insurance premiums and lower out-of-pocket expenses for individuals and employers.

36
Appendix
Methodology
In order to determine the economic impact of Steward, Health Business Group developed an economic impact model using the Bureau of Economic Analysis RIMS II regional input-output (I-O) multipliers. According to the RIMS II User Handbook, these multipliers “measure the economic impact of a change in final demand, in earnings, or in employment on a region’s economy.” Economic multipliers are based on 2010 national annual input-output data. Regional data from 2010 were used for the region comprising the following eight counties:
• Bristol County, MA
• Essex, MA
• Middlesex, MA
• Norfolk, MA
• Plymouth, MA
• Suffolk, MA
• Rockingham, NH
• Stratford, NH
Steward engaged in a variety of types of operations, and therefore each line of business was analyzed separately:
• Construction
• Insurance carriers and related activities
• Professional, scientific, and technical services
• Management of companies and enterprises
• Educational services
• Ambulatory care services
• Hospitals
Health Business Group calculated impact in two different ways:
• Total impact measures the results from the first two years of operations. It assumes that no activity would have taken place without Steward’s investment.
• Incremental impact is a conservative approach which measures the impact of the new investment and growth, rather than measuring the impact of the total enterprise.
37
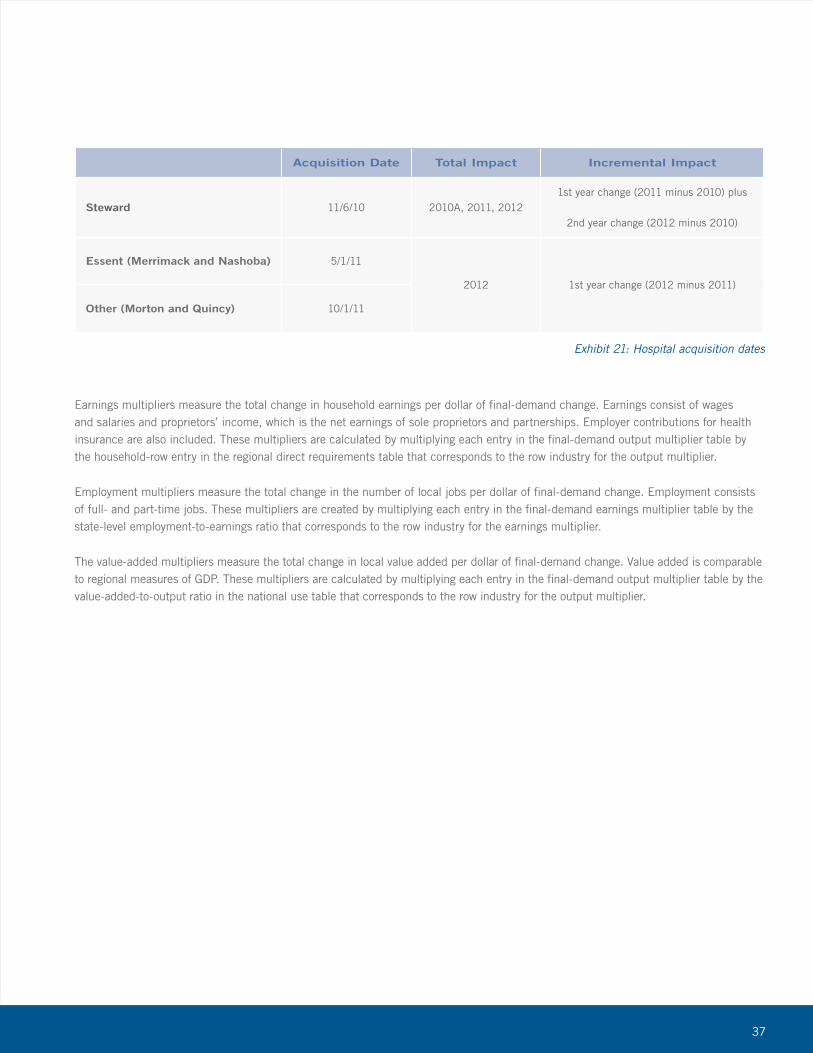
Acquisition Date Total Impact Incremental Impact
Steward 11/6/10 2010A, 2011, 20121st year change (2011 minus 2010) plus
2nd year change (2012 minus 2010)
Essent (Merrimack and Nashoba) 5/1/11
2012 1st year change (2012 minus 2011)
Other (Morton and Quincy) 10/1/11
Exhibit 21: Hospital acquisition dates
Earnings multipliers measure the total change in household earnings per dollar of final-demand change. Earnings consist of wages and salaries and proprietors’ income, which is the net earnings of sole proprietors and partnerships. Employer contributions for health insurance are also included. These multipliers are calculated by multiplying each entry in the final-demand output multiplier table by the household-row entry in the regional direct requirements table that corresponds to the row industry for the output multiplier.
Employment multipliers measure the total change in the number of local jobs per dollar of final-demand change. Employment consists of full- and part-time jobs. These multipliers are created by multiplying each entry in the final-demand earnings multiplier table by the state-level employment-to-earnings ratio that corresponds to the row industry for the earnings multiplier.
The value-added multipliers measure the total change in local value added per dollar of final-demand change. Value added is comparable to regional measures of GDP. These multipliers are calculated by multiplying each entry in the final-demand output multiplier table by the value-added-to-output ratio in the national use table that corresponds to the row industry for the output multiplier.
38
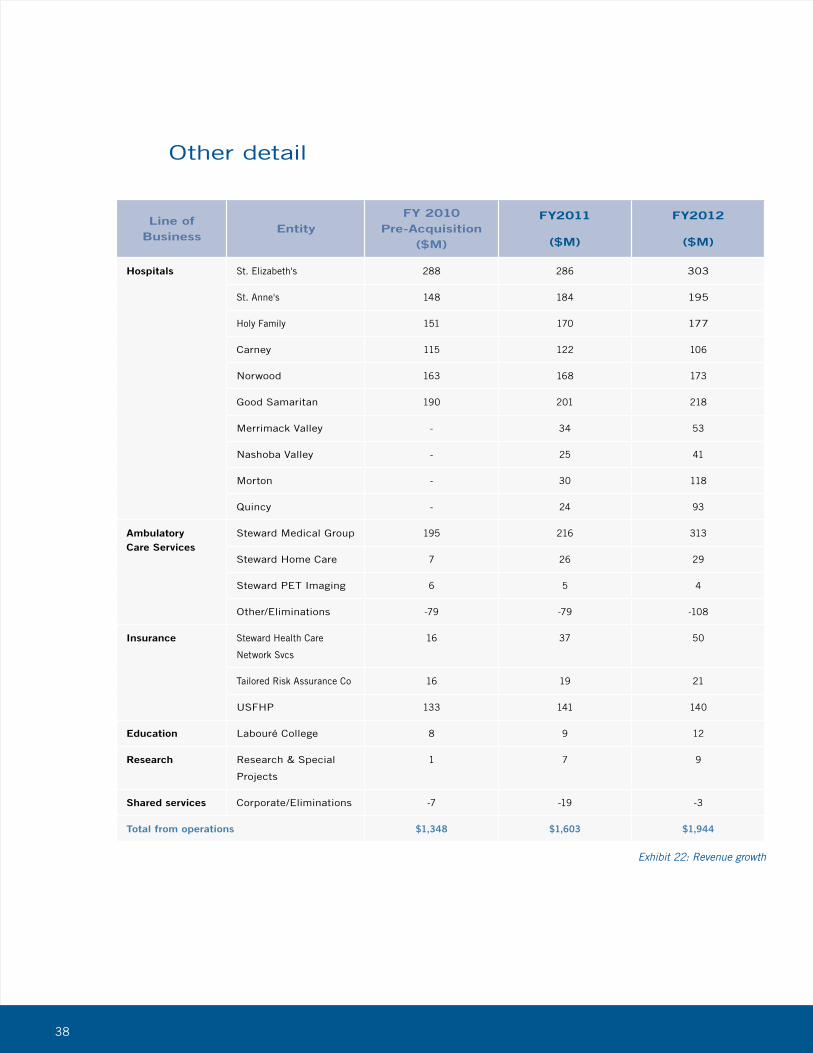
Line of Business
EntityFY 2010
Pre-Acquisition ($M)
FY2011
($M)
FY2012
($M)
Hospitals St. Elizabeth's 288 286 303
St. Anne's 148 184 195
Holy Family 151 170 177
Carney 115 122 106
Norwood 163 168 173
Good Samaritan 190 201 218
Merrimack Valley - 34 53
Nashoba Valley - 25 41
Morton - 30 118
Quincy - 24 93
Ambulatory Care Services
Steward Medical Group 195 216 313
Steward Home Care 7 26 29
Steward PET Imaging 6 5 4
Other/Eliminations -79 -79 -108
Insurance Steward Health Care
Network Svcs
16 37 50
Tailored Risk Assurance Co 16 19 21
USFHP 133 141 140
Education Labouré College 8 9 12
Research Research & Special
Projects
1 7 9
Shared services Corporate/Eliminations -7 -19 -3
Total from operations $1,348 $1,603 $1,944
Exhibit 22: Revenue growth
Other detail
39
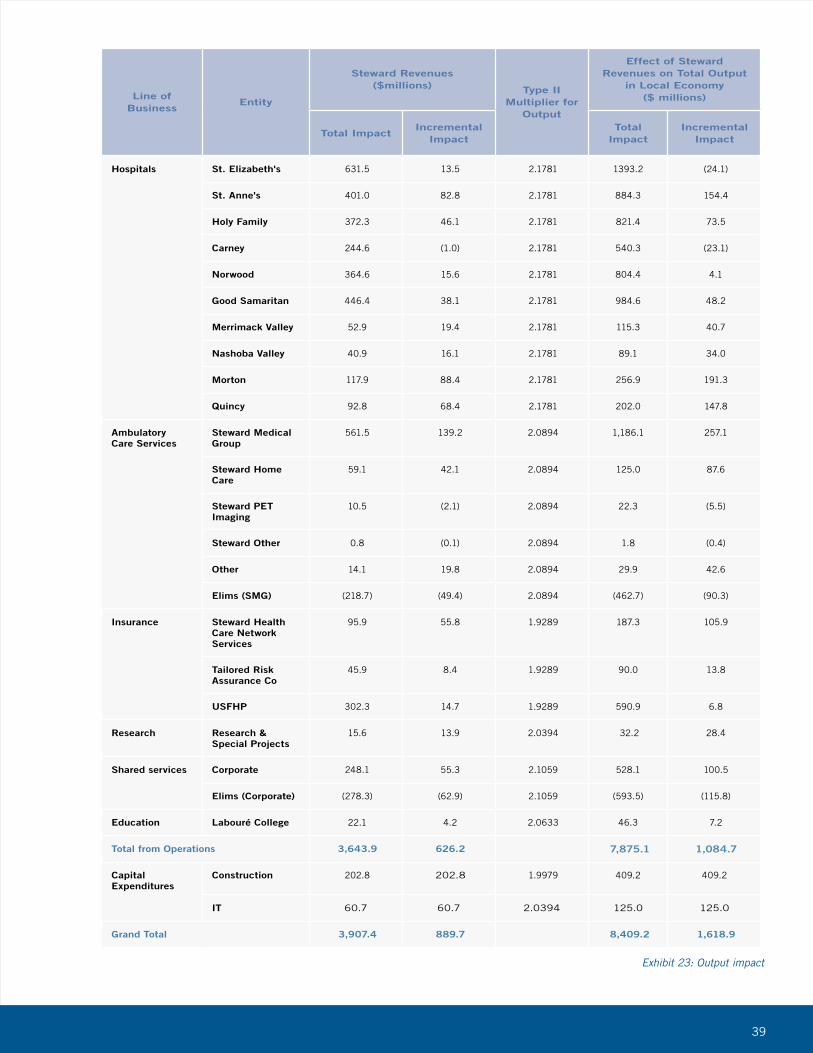
Line of Business
Entity
Steward Revenues ($millions) Type II
Multiplier for Output
Effect of Steward Revenues on Total Output
in Local Economy ($ millions)
Total ImpactIncremental
ImpactTotal
ImpactIncremental
Impact
Hospitals St. Elizabeth's 631.5 13.5 2.1781 1393.2 (24.1)
St. Anne's 401.0 82.8 2.1781 884.3 154.4
Holy Family 372.3 46.1 2.1781 821.4 73.5
Carney 244.6 (1.0) 2.1781 540.3 (23.1)
Norwood 364.6 15.6 2.1781 804.4 4.1
Good Samaritan 446.4 38.1 2.1781 984.6 48.2
Merrimack Valley 52.9 19.4 2.1781 115.3 40.7
Nashoba Valley 40.9 16.1 2.1781 89.1 34.0
Morton 117.9 88.4 2.1781 256.9 191.3
Quincy 92.8 68.4 2.1781 202.0 147.8
Ambulatory Care Services
Steward Medical Group
561.5 139.2 2.0894 1,186.1 257.1
Steward Home Care
59.1 42.1 2.0894 125.0 87.6
Steward PET Imaging
10.5 (2.1) 2.0894 22.3 (5.5)
Steward Other 0.8 (0.1) 2.0894 1.8 (0.4)
Other 14.1 19.8 2.0894 29.9 42.6
Elims (SMG) (218.7) (49.4) 2.0894 (462.7) (90.3)
Insurance Steward Health Care Network Services
95.9 55.8 1.9289 187.3 105.9
Tailored Risk Assurance Co
45.9 8.4 1.9289 90.0 13.8
USFHP 302.3 14.7 1.9289 590.9 6.8
Research Research & Special Projects
15.6 13.9 2.0394 32.2 28.4
Shared services Corporate 248.1 55.3 2.1059 528.1 100.5
Elims (Corporate) (278.3) (62.9) 2.1059 (593.5) (115.8)
Education Labouré College 22.1 4.2 2.0633 46.3 7.2
Total from Operations 3,643.9 626.2 7,875.1 1,084.7
Capital Expenditures
Construction 202.8 202.8 1.9979 409.2 409.2
IT 60.7 60.7 2.0394 125.0 125.0
Grand Total 3,907.4 889.7 8,409.2 1,618.9
Exhibit 23: Output impact

40
Line of Business
Entity
Steward Payroll and Benefits ($millions) Type II
Multiplier for Output
Effect of Steward Payroll and Benefits on Total
Labor Income ($ millions)
Total ImpactIncremental
ImpactTotal
ImpactIncremental
Impact
Hospitals St. Elizabeth's 317.3 (2.7) 1.7942 599.5 (5.0)
St. Anne's 157.7 12.5 1.7942 298.0 23.5
Holy Family 185.9 9.6 1.7942 351.2 18.0
Carney 135.6 (7.1) 1.7942 256.1 (13.4)
Norwood 196.9 (5.7) 1.7942 372.0 (10.7)
Good Samaritan 221.7 5.7 1.7942 418.9 10.7
Merrimack Valley 28.1 8.7 1.7942 53.2 16.4
Nashoba Valley 20.2 6.7 1.7942 38.1 12.7
Morton 62.7 43.8 1.7942 118.4 82.7
Quincy 53.3 38.5 1.7942 100.7 72.7
Ambulatory Care Services
Steward Medical Group
394.3 55.3 1.6349 678.7 95.3
Steward Home Care
49.2 36.4 1.6349 84.7 62.7
Steward PET Imaging
2.2 (0.2) 1.6349 3.8 (0.4)
Steward Other - (0.0) 1.6349 - (0.1)
Other 2.3 (10.4) 1.6349 3.9 (17.8)
Elims (SMG) (2.8) (2.0) 1.6349 (4.8) (3.4)
Insurance Steward Health Care Network Services
11.8 6.2 2.0119 24.9 13.1
Tailored Risk Assurance Co
- - 2.0119 - -
USFHP 8.7 1.3 2.0119 18.5 2.7
Research Research & Special Projects
12.4 0.7 1.6593 21.7 1.3
Shared services Corporate 145.3 29.4 1.7390 266.1 53.9
Elims (Corporate) (3.5) (2.5) 1.7390 (6.5) (4.6)
Education Labouré College 13.1 (0.5) 1.5953 22.0 (0.8)
Total from Operations 2,012.5 223.6 1.3357 3,719.2 409.3
Exhibit 24: Earnings impact
41
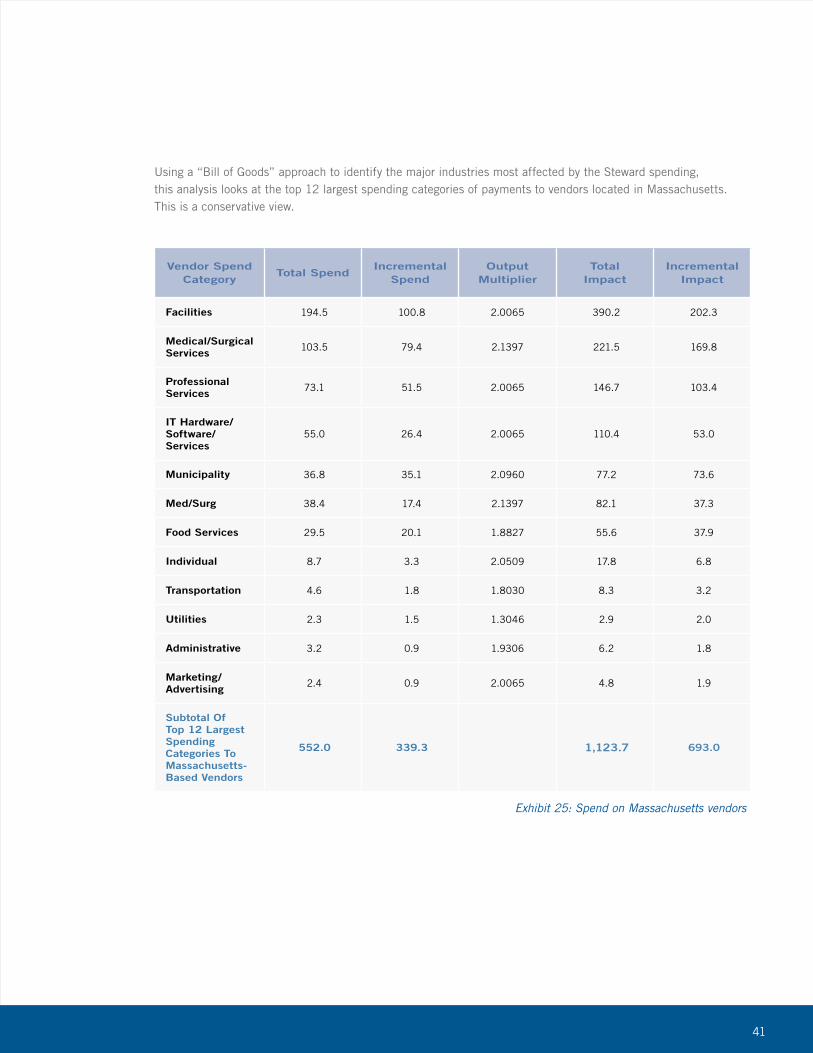
Vendor Spend Category
Total SpendIncremental
SpendOutput
MultiplierTotal
ImpactIncremental
Impact
Facilities 194.5 100.8 2.0065 390.2 202.3
Medical/Surgical Services 103.5 79.4 2.1397 221.5 169.8
Professional Services 73.1 51.5 2.0065 146.7 103.4
IT Hardware/Software/Services
55.0 26.4 2.0065 110.4 53.0
Municipality 36.8 35.1 2.0960 77.2 73.6
Med/Surg 38.4 17.4 2.1397 82.1 37.3
Food Services 29.5 20.1 1.8827 55.6 37.9
Individual 8.7 3.3 2.0509 17.8 6.8
Transportation 4.6 1.8 1.8030 8.3 3.2
Utilities 2.3 1.5 1.3046 2.9 2.0
Administrative 3.2 0.9 1.9306 6.2 1.8
Marketing/Advertising 2.4 0.9 2.0065 4.8 1.9
Subtotal Of Top 12 Largest Spending Categories To Massachusetts-Based Vendors
552.0 339.3 1,123.7 693.0
Exhibit 25: Spend on Massachusetts vendors
Using a “Bill of Goods” approach to identify the major industries most affected by the Steward spending, this analysis looks at the top 12 largest spending categories of payments to vendors located in Massachusetts. This is a conservative view.
42
Definition of not-for-profit and for-profit hospitals
“A nonprofit hospital means the facility does not pay either state or local property taxes or federal income taxes because it is considered a charity, and proves certain community benefits in accord with state and federal guidelines.
“A for-profit, or investor-owned, hospital means the facility is either owned by private investors or is owned publicly by shareholders and is part of a company that issues shares of stock to raise revenue to expand the hospital activities. For-profit hospitals have historically been based in the southern part of the United States, particularly in Florida and Texas. But in recent years, investor-owned hospitals have expanded nationally, purchasing often financially distressed facilities or stand-alone hospitals that are in need of access to capital for expansion. Depending on economic conditions, for-profit hospitals can have better access to capital than nonprofits that expand by issuing debt through tax-exempt bonds.
“The Congressional Budget Office (CBO) found that ‘on average, nonprofit hospitals provided higher levels of uncompensated care than did otherwise similar for-profit hospitals. Among individual hospitals, however, the provision of uncompensated care varied widely, and the distributions for nonprofit and for-profit hospitals largely overlapped. Nonprofit hospitals were more likely than otherwise similar for-profit hospitals to provide certain specialized services but were found to provide care to fewer Medicaid-covered patients as a share of their total patient population. On average, nonprofit hospitals were found to operate in areas with higher average incomes, lower poverty rates, and lower rates of un-insurance than for-profit hospitals.’”7
7 Source: Medicare FAQs: http://medicarenewsgroup.com/news/medicare-faqs/individual-faq?faqId=31a98723-ad91-4801-9bd8- 1f968a7c0f1b, accessed May 30, 2013.
43
Summary of Asset Purchase Agreement
A summary of some of the important provisions included in Steward’s Asset Purchaser Agreements and its Assessment and Monitoring Agreement, for the purchased hospitals, can be summarized in the following areas: employment and employee benefits/environment, involvement of community, investments, liabilities and debt repayment, investments and hospital activity, and reporting obligations. Each area is briefly summarized below.
Employment and Employee Benefits/Environment
Steward agreed to offer continued employment on the same terms to all employees who were not physicians and physicians who were involved in “Qualifying Physician Contracts.” The new positions were offered with salaries, wages, and benefits consistent with those immediately prior to closing date. Full credit for eligibility to other benefits and vesting were also provided. Steward was also required to recognize and was bound to each union that was party to an unexpired collective bargaining agreement.
Involvement of Community
Steward agreed to continue the provision of community benefits and mission-related services, including pastoral care for patients, families, professionals and employees. They agreed to maintain policies on indigent and charity care. Steward also agreed to form local governing boards consisting of medical staff members, community leaders and each hospital’s CEO to govern the following decisions: 1) borrowing in excess of $500,000, 2) additions or conversions that constitute substantial changes in service, 3) approval of capital and operating budgets, and 4) approval of the filing of an application for determination of need (DON).
Liabilities and Debt Repayment
Steward agreed to assume all pension obligations, repayment of virtually all of the Caritas outstanding debt – not to exceed $259 million – and assumed certain liabilities.
Investments and Hospital Activity
Steward committed to spend no less than $400M on investments in the hospitals “to promote the financial health, well being and/or growth of the health care system” before its fourth anniversary or donate to a charitable foundation designated by the Attorney General. It also agreed to keep all hospitals open and maintain services for at least three years. Steward agreed to maintain hospital names and commitments made by the hospitals to its donors regarding named portions of its hospitals. Steward agreed to a prohibition from IPO, debt, selling and/or transferring any of its hospitals for a period of at least three years.
Regulatory, Reporting, and Monitoring Obligations
Steward agreed to cooperate fully with investigations, reports, and studies conducted by the Attorney General, including the provision of all necessary data.
44
Sources cited
“American Community Survey.” American FactFinder. U.S. Census Bureau, 2011. Web. Apr.-May 2013. http://factfinder2.census.gov/faces/nav/jsf/pages/index.xhtml.
Boros, Aron. Health Care Provider Price Variation in the Massachusetts Commercial Market. Commonwealth of Massachusetts. 2013. Results from 2011.
Bureau of Labor Statistics, May 2012. State Occupational Employment and Wage Estimates, Massachusetts, all occupations.
“Health Connector - Health Insurance for the Residents of Massachusetts.” Find Insurance, Health Connector. Web. 14 May 2013. https://www.mahealthconnector.org/portal/site/connector/find_insurance.
“How Safe Is Your Local Hospital?” Hospital Safety Scores. The Leapfrog Group, 2013. Web. 15 May 2013. http://www.hospitalsafetyscore.org.
Office of the Massachusetts Attorney General. “Interim Reports on Steward Health Care System Pursuant to 2010 and 2011 Assessment & Monitoring Agreements.” 13 Jan. 2013. Web.
Regional Input-Output Modeling System (RIMS II), Regional Product Division, Bureau of Economic Analysis. “RIMS II Multipliers (2010/2010) - Total Multipliers for Output, Earnings, Employment, and Value Added by Industry Aggregation.” https://www.bea.gov/regional/rims/rimsii/home.aspx.

45
08 Exhibit 1: Acquisition prices
10 Exhibit 2: Construction investment 2011 and 2012
11 Exhibit 3: Major capital expenditures by facility 2011 and 2012
13 Exhibit 4: Steward Health Care Network provider growths
13 Exhibit 5: Information technology investment 2011 and 2012
14 Exhibit 6: Classification of entities
17 Exhibit 7: Revenue in 2010, 2011, and 2012
17 Exhibit 8: Profitability in 2010, 2011, and 2012
19 Exhibit 9: Economic impact on total output in local economy
19 Exhibit 10: Economic impact on total employment in local economy
21 Exhibit 11: Massachusetts’ largest employers by number of employees
21 Exhibit 12: Steward employees by division
22 Exhibit 13: Summary of taxes paid
22 Exhibit 14: Summary of taxes by town
25 Exhibit 15: Total community benefit spending, 2011 and 2012
26 Exhibit 16: Unemployment statistics by community
29 Exhibit 17: Per capita income by community
29 Exhibit 18: Poverty levels by community
30 Exhibit 19: Commercial payment relative to peer grouping from Top 4 Insurers to Steward hospitals, CY2011
33 Exhibit 20: Leapfrog hospital safety scores
37 Exhibit 21: Hospital acquisition dates
38 Exhibit 22: Revenue growth
39 Exhibit 23: Output impact
40 Exhibit 24: Earnings impact
41 Exhibit 25: Spend on Massachusetts vendors
Index of Exhibits

46