Embed Size (px)
Citation preview

March 2004
The Socioeconomic Status of Black Males: The Increasing Importance of Incarceration
Steven Raphael
Goldman School of Public Policy University of California, Berkeley
E-mail: [email protected]
For Geno, my mentor and friend.

Abstract This paper assesses the increasing importance of incarceration in determining the average socioeconomic status of black males in the United States. I document national trends in the proportion of black males that are either currently institutionalized or who have served previous prison time. The paper also documents the extent to which serving time interrupts the potential early work careers of young offenders and reviews recent research on employer sentiment regarding ex-offenders and the likely stigma effects of prior incarceration. Finally, I assess whether increasing incarceration rates provide a possible explanation for the drastic declines in employment rates observed among non-institutionalized black males. Using data from the U.S. Census, I test for a correlation between the proportion of non-institutionalized men in a given age-race-education group that are employed and the proportion of all men in this grouping that are institutionalized. The proportion institutionalized has a strong negative effect on the proportion of the non-institutionalized that are employed. The relationship is strong enough to explain one-third to one-half of the relative decline in black male employment rates.

1. Introduction
Over the past three decades, the average socioeconomic status of African-American males
has deteriorated, absolutely and relative to men from other racial and ethnic groups. Despite
gains in relative earnings immediately following passage of the Civil Rights Act, the relative
earnings of black men have stagnated since the mid-1970s (Freeman 1992). In addition,
employment rates among non-institutionalized black men have declined markedly, with
pronounced declines for the relatively less educated (Holzer and Offner 2003).
Concurrent with these adverse labor market trends is a phenomenal increase in the proportion
of black men involved in one form or another with the criminal justice system. Between 1970
and 2000, the proportion of working age black males that are institutionalized increased from 3
to 8 percent. Over the same time period, the proportion of black males that have ever served a
prison sentence increased from approximately 7 to 17 percent (Bonczar 2003). For both
measures, these increases were considerably larger for certain subgroups of the black male
population, such as the relatively less educated and the young.
The increasing proportion of black men that are either currently incarcerated or have been
incarcerated in the past is likely to suppress their relative socioeconomic status. Having served a
prison sentence worsens one’s labor market prospects for a variety of reasons, and thus
aggravates stubborn racial differences in employment and pay. In addition, the interruption of a
prison sentence and the consequent lengthy absence of African-American males from their
spouses, partners, and children is likely to hamper family formation and hasten the dissolution of
existing, if not stable, family units. Given the high fraction of black men with felonious criminal
history records, these collateral consequences of incarceration are quickly becoming an
increasingly important source of racial inequality in the United States. In fact, one might argue

2
that in light of the potentially permanent consequences of an incarceration spell, the high
incarceration rate among black males is perhaps one of the chief barriers to their socioeconomic
progress.
This paper assesses the increasing importance of incarceration in determining the average
socioeconomic status of black males in the United States. I document national trends in the
proportion of black males that are institutionalized and how this proportion varies by age and
level of educational attainment. Using several decades of data from the U.S. Census of
Population and Housing, I demonstrate that the proportion of black men institutionalized has
increased markedly, while the comparable proportion of white men has not. I observe similar
trends for the fraction of men with current or previous prison experience. Combined, these
analyses demonstrate the high proportions of certain sub-groups of black men that are
incarcerated and the near universality of prior prison experience for some.
Next, I combine an analysis of California administrative data with a review of recent research
on employer demand for ex-offenders to explore the long-term employment consequences of
serving time. The California data reveal that many young offenders cycle in and out of prison
during a portion of the lifecycle when earnings tend to increase the most among the non-
institutionalized. Such cycling is likely to decrease the degree of attachment to the legitimate
labor market and impede the accumulation of valuable employment experience. In addition,
several recent surveys of employers reveal a strong reluctance to hire former prison inmates.
Combined, these findings indicate that serving time may permanently alter the age-earnings
profiles of prison inmates.
Finally, I assess whether increasing incarceration rates provide a possible explanation for the
drastic declines in employment rates observed among non-institutionalized black males. Using

3
data from the U.S. Census, I test for a correlation between the proportion of non-institutionalized
men in a given age-race-education group that are employed and the proportion of all men in this
grouping that are institutionalized. The proportion institutionalized has a strong negative effect
on the proportion of the non-institutionalized that are employed. The relationship is strong
enough to explain nearly half of the relative decline in employment rates of black men.
2. Changes in Incarceration Rates: 1970 to 2000
This section documents incarceration trends over the past three decades. I focus on two
measures of incarceration: the proportion of men institutionalized at a given point in time and the
proportion of men that are either currently incarcerated or have served time at some point in the
past. As we will see, the large fraction of currently incarcerated black men suggests that a much
larger fraction of this population is in a non-productive status than the traditional focus on the
employment rates of the non-institutionalized would suggest. In addition, the increasing
proportion of black men with previous prison experience indicates that many non-
institutionalized blacks face the employment barriers specific to ex-offenders.
Documenting Trends in Institutionalization from the U.S. Census
The decennial Census of Population and Housing enumerates both the institutionalized as
well as the non-institutionalized population. The Public Use Microdata Samples (PUMS) for
each census includes a flag for the institutionalized as well as micro-level information on age,
education, race and all other information available for non-institutionalized long-form
respondents. Within the institutionalized population, one can separately identify individuals
residing in non-military institutions. This category includes inmates of federal and state prisons,
local jail inmates, residents of inpatient mental hospitals, and residents of other non-aged

4
institutions. I use residence in a non-military institution as the principal indicator of
incarceration.1
To gauge the validity of using the census data in this manner, Figure 1 compares
estimates of the institutionalized population from the census to estimates of the incarcerated
populations from other sources. The figure presents a comparison of the number of
institutionalized adult black, white, and Hispanic males from the 2000 census to counts of the
number of prison and jail inmates at midyear 2001 calculated by the U.S. Bureau of Justice
Statistics (BJS) (Beck, Karberg, and Harrison 2002).2 Given the inclusive nature of the census
definition of institutionalization, the census estimates are slightly larger than the BJS numbers
for all groups. Nonetheless, the two sets of estimates correspond quite closely and the
differences are small.
Table 1 documents employment and incarceration trends by race and educational
attainment using data from the 1970, 1980, 1990, and 2000 one percent PUMS. The table
presents the proportion of non-Hispanic black and white males 18 to 65 years of age that are
employed, that are not working yet not institutionalized, that are in the armed forces, and that are
institutionalized. For all black men, the proportion employed declines markedly over this 30-
year period, from 0.73 in 1970 to 0.57 in the 2000. This decline occurs within all education
groups, although the drop is largest for black high school dropouts (from 0.71 to 0.34).
Employment rates decline slightly for white males overall, and decline substantially for white
high school dropouts. However, these changes are small in comparison to those observed for
blacks.
1 See Butcher and Piehl (1998) for an analysis of incarceration among immigrant men that also uses the group quarter variable to identify the incarcerated. 2 The BJS population estimates come from custody counts form the National Prisoner Statistics database and the 2001 Annual Survey of Jails. Thus, the census data and the BJS data come from entirely different sources.

5
Over the thirty year period, the proportion of black men that are institutionalized
increases considerably, especially for less educated black men. For all black males, the
proportion institutionalized increases nearly three-fold from 0.03 in 1970 to 0.08 in 2000. For
black high school dropouts, the institutionalization rate increases nearly five-fold. At the end of
the century, roughly one fifth of black men with less than a high school degree are
institutionalized. There is no increase in institutionalization among black males with at least a
college degree. Among whites, changes in institutionalization rates, overall and within
educational groups, are small by comparison.
Table 2 presents similar tabulations by age. For black men, the proportion
institutionalized increases within every age group, with the most pronounced increases for the
young. In 2000, roughly 11 percent of black men between 18 and 40 are institutionalized.
Again, while there are slight increases in the proportion institutionalized among young white
men, the changes are small in comparison to what we observe among African-Americans.
Tables 1 and 2 indicate that both age and educational attainment are strong predictors of
current incarceration. Table 3 explores the interaction between these two dimensions for black
men only. The table presents comparable tabulations for the subset of relatively young (under
40) and relatively less educated (dropouts and high school graduates) black men. For young high
school dropouts, the declines in the proportion employed are considerably more drastic than the
declines in employment for black male high school dropouts overall (presented in Table 1). For
dropouts between 18 and 25, the employment rate declines from 0.50 to 0.27. For those 26 to
30, the proportion employed declines from 0.76 to 0.30, while for 31 to 40 year olds,
employment rates decline from 0.81 to 0.35.

6
Similarly, increases in the proportions institutionalized are much larger than those
observed for dropouts overall. For dropouts between 18 and 25, the institutionalization rate
increases from 8 percent to 23 percent. For those between 26 and 40, the institutionalization
rates increases from approximately 5 percent to 30 percent. For all dropouts less than 40 years of
age, the institutionalized population is only slightly smaller than the population of employed men
from this demographic group. For black dropouts between 26 and 30, there are actually more
institutionalized than employed. Comparable, although somewhat muted, patterns are observed
for black high school graduates.
One factor that qualifies the figures presented in Tables 1 through 3 concerns the fact that
African-American men have historically been undercounted in the Census. While the 2000
enumeration made a concerted effort to improve coverage (and indeed, measured undercounting
was considerably lower than that observed for the 1990 census) disparities remain, with black
men again the most likely to be missed. The Accuracy and Coverage Evaluation (A.C.E.) results
released by Census Bureau (U.S. Census Bureau 2003) estimates that roughly 7 percent of non-
institutionalized black men were missed in the 2000 census. By age, the net undercount of non-
institutionalized black men is 6 percent for those 18 to 29, 10 percent for those 30 to 49, and 4
percent for those 50+.
To assess the effect of this undercount on my estimates of black male incarceration rates,
I calculate the following adjustment for the 2000 figures. Let Institution be the unadjusted
estimates of the proportion institutionalized, Non-institution be the comparable unadjusted
estimate for the household population, and Coverage be the proportion of the household
population measured in the census (one minus the net undercount rate). An adjusted
institutionalization rate can be calculated by the equation

7
./
*CoveragenInstitutioNonnInstitutio
nInstitutionInstitutio−+
=
For all black men, this adjustment decreases the estimate of the proportion institutionalized from
0.08 to 0.075. By age, the undercount adjustment reduced the proportion institutionalized from
0.11 to 0.105 for those 18 to 25, from 0.12 to 0.114 for those 26 to 30, from 0.11 to 0.10, for
those 31 to 40, from 0.06 to 0.54 for those 41 to 50, and from 0.03 to 0.029 for those 50 and
over. Thus, accounting for the undercount in the non-institutional population does not
appreciably affect the reported patterns.
The A.C.E. does not produce net undercount estimates by race, age, and level of
educational attainment. Thus it is difficult to present adjusted estimates for the results in Table 3
where we observe the starkest patterns. However, we can assume an arbitrarily high under-count
rate for this population and provide some lower-bound results. For example, if we assume that
one-fifth of black male high school dropouts are missed by the census (an undercount rate that is
twice the highest of the age-specific rates for black males), the estimate of the proportion
incarcerated among black high school dropouts declines from 0.23 to 0.19 for those 18 to 25,
from 0.34 to 0.29 for those 26 to 30, and from 0.28 to 0.24 for those 31 to 40. While these are
notable declines, these lower-bound estimates of the proportion incarcerated are still quite high.
Thus, institutionalization rates for black men have increased considerably since 1970.
These increases have been largest for the young and the relatively less educated. Interacting
these two dimensions reveals that the most dramatic increases in incarceration occurred among
black males with less than a high school education between the ages of 25 and 40.

8
Estimating the proportion with prior prison experience
While a sizable minority of black men is currently incarcerated, the fraction of this
population that has ever served time in state or federal prison is certainly larger. Turnover rates
in state and federal prisons are high and the median sentences fairly short. For example, the
median sentence for new prison admissions in the United States in 1999 was roughly three years
for the maximum sentence and 13 months for the minimum sentences. Moreover, many inmates
will serve considerably less time than their maximum sentences.
Consistent with the high degree of turnover among prisoners, the majority of inmates will
eventually be released. In 1997, 65 percent of surveyed inmates in state and federal prison
indicated that they had a definite release date. An additional 32 percent indicated that they
anticipated eventually leaving prison. Of the 97 percent of inmates that anticipated eventually
leaving, nearly 60 percent reported that they would be released within the next three calendar
years (Raphael and Stoll 2004). In conjunction, these figures suggest that the large increases in
the prison populations occurring over the last few decades have certainly left in their wake a
much larger population of former prisoners.
Gauging the population of former prison inmates is difficult due to the fact that none of
the major household surveys in the United States ask respondents whether they have served time.
Thus, estimating the size of this population requires indirect methods. The BJS estimates the
number of former inmates by combining population data, birth cohort estimates of the likelihood
of entering prison for the first time at each age (often separately by race and gender), and cohort
and age-specific mortality rates (Bonczar 2003).3 Based on this methodology, the BJS estimates
that in addition to the 1.3 million current inmates in 2001, an additional 4.3 million non-

9
institutionalized persons had served a prison term in the past. Combined, current and former
prison inmates account for 4.9 percent of the adult male population in 2001.
Of course, there are large differences by race and ethnicity. The same set of estimates
indicate that 2.6 percent of non-Hispanic white males, 16.6 percent of non-Hispanic black males,
and 7.7 percent of Hispanic males have served prison time (figures that are roughly double the
institutionalization rates listed in Table 1). The comparable figures for whites, blacks, and
Hispanics for 1974 were 1.4, 8.7, and 2.3 percent, respectively.
The BJS also uses this methodology to calculate lifetime probabilities of entering either
the state or federal prison system. Given that the risk of incarceration has increased over the past
three decades, lifetime probabilities should exceed the current proportion of a specific population
that is either currently incarcerated or formerly incarcerated.4 Figure 2 presents these estimates
for 1974 and 2001. For whites, the lifetime likelihood of going to prison for men born in 1974 is
estimated to be 2.2 percent. For those born in 2001, the risk increases to 5.9 percent. For black
males, this likelihood increases from 13.2 to 32.2 percent, while for Hispanics the likelihood
increases from 4 to 17.2 percent.
The analysis of institutionalization rates revealed large differences within racial groups
between less educated and more educated men and between groups of men stratified by age.
While the BJS does provide race-specific estimates of the proportion that has ever served time by
age, there are no estimates of how this proportion varies by level of educational attainment.
Moreover, the results presented above indicate that education is a stronger predictor of current
3 The likelihood of entering prison is estimated from annual surveys of recent prison admissions while mortality rates are based on mortality rates for the entire population adjusted upwards by a fixed factor to account for observed average differences in mortality rates between ex-offenders and the general population. 4 This is due to the fact that earlier cohorts faced lower risks of incarceration during the high-criminal-activity portion of their lifecycle.

10
incarceration than is age, and thus, education is also likely to be more strongly associated with
ever having served time.
I am able to fill this gap to a certain degree with administrative prison data from
California. Using administrative records on all prison terms served during the 1990s in a
California state prison, I first calculate an unduplicated count of prisoners entering the system
during the 1990s, by race and by how old each prisoner would be in the year 2000.5 I then use
the 1997 Survey of Inmates in State and Federal Correction Facilities to estimate the distribution
of inmates across age-education cells within racial and ethnic groups. These distribution
estimates are then used to allocate the number of unduplicated prisoners within each age-race
cell across educational attainment groups.6 Dividing these counts by the estimated 2000
California population (institutional plus non-institutional) within each age-race-educational
attainment cell yields estimates of the proportion of males in each cell serving a prison term
during the 1990s.
Table 4 presents these results. The first column presents national estimates of the
proportion ever serving time by race/ethnicity and age from the BJS. The second column
presents comparable estimates of the proportion serving time in California. The final four
columns present estimates by level of educational attainment that allot prisoner within race-age
cells across education groups according to the estimated educational distributions of inmates
during the late 1990s.
The tabulations by age indicate that the California estimates and the BJS estimates are
fairly similar for males between the ages of 18 and 54. For older males, the California estimates
5 Each record contains information on an internal California Department of Corrections id number that can be used to uniquely identify inmates. Thus, the administrative records can be purged of inmates that serve multiple prison spells. See Raphael and Weimer (2003) for a complete description of this administrative data set.

11
indicate a smaller proportion ever having served time. This is sensible considering that the
California administrative records only cover the 1990s, and that former prisoners over 54 in the
year 2000 are likely to have served time prior to the 1990s. Both sets of estimates indicate that
the proportion ever having served time increases with age through the late 30 and early 40s and
then declines. Black men between 25 and 44 have the highest rates of current or previous
incarceration (roughly one-fifth of this group using both the California and BJS estimates).
The estimates by race, age, and education reveal dramatic differences. For black high
school dropouts between the ages of 25 and 44, the number of unduplicated prisoners serving
time during the previous decade exceeds census population counts (--i.e., the ratio is greater than
one).7 For black high school dropouts between 45 and 54, 90 percent are estimated to have
served a prison term during the past decade. These figures suggest that for black high school
dropouts, serving time in prison is practically a certainty. The proportion of blacks with prison
time in the past decade is considerably lower for those with higher levels of educational
attainment, although the figures for black high school graduates are still quite high (between 0.12
and 0.16). By contract, the comparable fractions of whites as well as Latinos with prison time in
the previous 10 years are smaller for all comparisons.
6 The prisoner survey estimates of the joint age-education-race density is needed due to the fact that the California administrative records do not contain information on educational attainment. 7 To be sure, this does not mean that more than 100 percent of black men in this cell have served time in the past 10 years. There are a number of factors that are likely to bias upwards the count of unduplicated prisoners relative to the 2000 population. First, I calculated prisoner counts by age in 2000 without taking into account neither the likely mortality of many of the inmates serving time during the 1990s nor the likelihood that many of these inmates may have moved to another state after being released. In addition, a prisoner may be assigned additional internal CDC prisoner identification numbers for subsequent prison terms, thus artificially inflating the number of unduplicated spells. This however, is unlikely to be a substantial source of bias since tabulation based on prisoner SSN’s yield quite similar counts to the tabulations based on CDC identification codes. Finally, an undercount of black males in the census will suppress the denominator of this ratio below it’s actual level and inflate the rates reported above.

12
The effect of changing incarceration rates on estimates of black-white employment and earnings
trends
To summarize the patterns documented thus far, the current incarceration rates of black
men as well as the proportion of black men with prior prison experience have increased
considerably over the past three decades. These increases have been most pronounced for black
men who have not graduated from high school and who are between the ages of 25 and 40.
Moreover, while we observe increases in these rates for white men, the changes are minuscule by
comparison.
One interesting implication of these trends concerns the fact that traditional gauges of
black-white inequality, such as relative wages, unemployment rates, or employment-to-
population ratios are likely to suffer increasingly from selection bias. For example, the monthly
unemployment rate estimated by race and ethnicity by the Bureau of Labor Statistics and
reported widely in the press is calculated using data from the monthly Current Population Survey
(CPS). The sampling frame of the CPS is based on housing units, and thus pertains to the non-
institutionalized population. To the extent that incarcerated felons are highly likely to be
unemployed when not institutionalized, the increasing incarceration rate of blacks suggests that
monthly black unemployment rates are being calculated with an increasingly select sample.
Moreover, given the generally higher unemployment rate for blacks relative to other racial and
ethnic groups, estimates of the overall unemployment rate may be similarly biased downwards
relative to the counterfactual with lower incarceration rates.8 In general, use of non-
institutionalized samples to estimate labor market aggregates is likely to bias research findings
towards a greater degree of racial convergence.

13
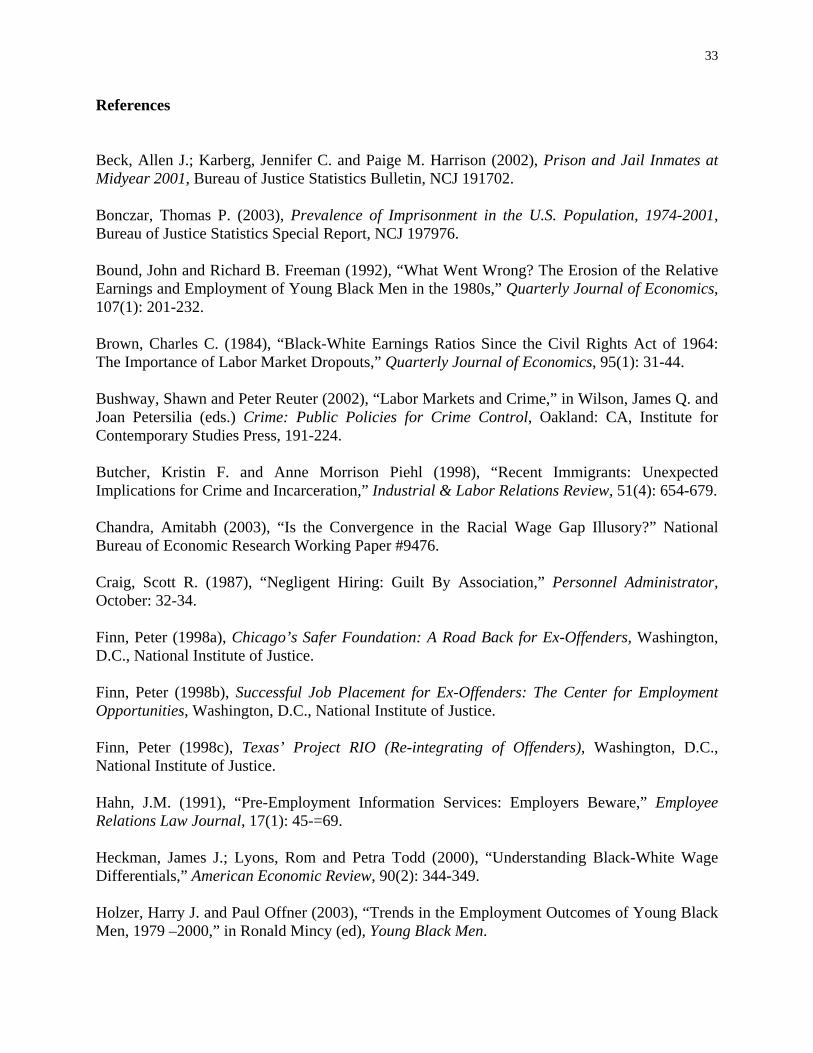
Perhaps the most glaring example of selection bias is observed when comparing the
relative employment-to-population ratios of blacks and whites. Western and Petit (2000)
demonstrate that by adding the incarcerated to the denominator of the employment-to-population
ratio, white-black employment rate differentials increase considerably, especially for the
relatively young and the relatively less educated. To illustrate this point, Figures 3 presents
estimates of the difference in employment-to-population ratios between white and black men
using two alternative base populations: the non-institutionalized and the non-institutionalized
plus the institutionalized (labeled “All” on the graphs).9 The difference between the two sets of
estimates increase in each decade: in 1970, including the institutionalized increases the white-
black difference in employment rates by one percentage point, in 1980 by two, by three points in
1990, and by five percentage points in 2000. In 2000, the white-black employment rate
differential is 30 percent larger when the institutionalized are accounted for.
Table 5 presents comparable estimates by level of educational attainment. As would be
expected, the differences between the estimates based on the non-institutionalized and estimates
based on the entire population are largest for the least educated and smallest for the most
educated. In 2000, including the institutionalized increases the white-black employment rate
differential by six percentage points for high school dropouts, four points for high school
graduates, three points, for those with some college education, and one points for those with at
least a college degree.
The effect of increased incarceration on estimates of black-white wage convergence is
likely to impart less of a selection bias than that created by the more general decline in black
8 Katz and Krueger (1999) estimate that the decline in the national unemployment rate of 2.6 percentage points between 1985 and 1998 would have been 0.1 to 0.5 points lower had incarceration rates not increased over this time period.

14
employment rates. That is to say, such a large fraction of non-institutionalized black men are
non-employed in any given week that incarceration is unlikely to select out a substantial fraction
of wage earners. Thus, researchers interested in black-white wage trends have focused more
generally on estimating the selection effect of declining relative employment rates on aggregate
black-white wage ratios (accounting for both the incarcerated and the non-incarcerated non-
employed).
To the extent that black labor market dropouts are disproportionately concentrated in the
lower tail of the wage-offer distribution, the declining relative employment rate of black men
will bias aggregate wage trends towards convergence. Assessing this selection bias requires
recovering the wage-offer distribution for labor market dropouts and recalculating measures of
the central tendency of wage offers taking into account the entire distribution (both observed
offers for the employed and the unobserved offer distribution for the non-employed) (Chandra
2003). Several authors have attempted to tackle this problem. Brown (1984) provides one of the
earliest examples. Brown assumes that the non-institutionalized, non-employed of each racial
group would earn wages below their group-specific median, and calculates hypothetical trends in
black-white median wage ratios based on this assumption.10 The author argues that the majority
of observed wage convergence during the 1970s is directly attributable to the declines in black
labor force participation rates.
9 Here, I classify as employed those who have a job and those who are in the armed forced. Excluding the armed forces from these calculations has little impact on the estimates in Figures 3 through 7. These calculations make use of the 1970, 1980, 1990, and 2000 one percent PUMS data. 10 This strategy is also employed by Neal and Johnson (1996) in their analysis of the effect of adjusting for scores on the Armed Forced Qualifying Test (AFQT) on estimates of residual racial wage differentials. Ignoring labor market dropouts, Neal and Johnson find that accounting for AFQT scores explains nearly all of the residual wage differential between black and white workers observed in the National Longitudinal Survey of Youth. However, in least-absolute-deviation regressions that assign wage values of zero to all non-participants, a substantial AFQT-adjusted racial wage differential reappears.

15
More recent efforts to account for both the non-institutionalized jobless as well as the
incarcerated are offered by Juhn (2003) and Chandra (2003). Juhn assigns the average wage of
similarly situated employed workers (of similar race, age, and education) to the non-employed
and recalculates relative black-white wage trends with and without this adjustment. Juhn finds
that while wage ratio estimates that are not adjusted for selection bias find convergence during
the 1960s and 1970s, and stagnation thereafter, adjusting for selection bias reveals a widening of
racial wage differentials during recent decades.
The most thorough research on this question is provided by Chandra (2003). Chandra
presents a series of alternative adjustments for selection bias, including:
• a matching estimator that assigns the mean earning for comparable workers to the non-
employed (a la Juhn),
• a matching estimator that assigns the median earnings for comparable workers to the non-
employed,
• calculating race-age-education cell-specific median earnings base on the assumption that
non-participants are negatively selected from the offer distribution within cells and then
calculating overall medians based on these tabulations, and
• modifying the selection specification in the previous bullet so that only the long-term non-
employed are negatively selected within group.
All four selection-corrections find that black-white wages diverged during the 1980s, with the
methods based on the assumptions that labor market dropouts are negatively selected within

16
group yielding the largest increases in racial wage differentials. Moreover, Chandra shows that
incarceration contributed significantly to the divergence during the 1980s.11
3. The Effect of Incarceration on Future Labor Market Prospects
Serving prison time is likely to adversely affect one’s labor market prospects for a number of
reasons. First, a prison term interrupts one’s work career. Incarcerated felons cannot accumulate
employment experience while serving time. In addition, the quality of one’s non-
institutionalized social network, a main source of employment information, is likely to erode
with time incarcerated.
Second, serving time in prison is stigmatizing. Employers consistently express reservations
about applicants with prior criminal history records. Many employers that offer low-skilled jobs
either ask about criminal history records or perform formal reviews of applicant criminal history
records. In some instances, employers are prohibited from hiring convicted felons.
Given the trends documented above, these adverse effects of incarceration are sure to be an
increasingly important determinant of black employment outcomes. This section explores these
factors in detail. I begin by documenting the extent to which a prison term interrupts the
potential legitimate work careers of young men. Using administrative data for California, I chart
the incarceration experience during the 1990s of young felons that began serving time on a
prison commitment at any point during the year 1990. Next, I review what is known about
employer sentiments with regards to ex-offenders and the extent to which employers formally
and informally screen-out felons from the applicant pool.
To what extent does prison interrupt one’s potential work career?
11 The study does not provide an analysis of wage trends during the 1990s. Additional attempts to assess the importance of selection bias to estimates of trends in black-white wage ratios is provided by Heckman, Lyons, and

17
The extent to which being sentenced to prison interrupts a felon’s potential work career
depends on both the expected amount of time served on a typical term as well as the likelihood
of serving subsequent terms. Newly admitted prisoners during the late 1990s were generally
serving time on commitments with a maximum sentence of three years and a minimum sentence
of one year (with many serving time closer to the minimum) (Raphael and Stoll 2003). If this
were the only time served for most felons, than the time interruption of prison would not be that
substantial for most.12
However, many felons serve multiple terms in prison, either due to the commission of
new felonies or due to violation of parole conditions after being released from the initial spell. A
large body of criminological research consistently finds that nearly two thirds of ex-inmates are
rearrested within a few years of release from prison (Petersilia 2003). Moreover, a sizable
majority of the re-arrested will serve subsequent prison terms. Thus, for many offenders, the
period of time between the ages of 18 and 30 is characterized by multiple short prison spells with
intermittent, and relatively short, spells outside of prison.
Here, I document the prison histories of young offenders entering the California state
prison system. While there are several reasons to suspect that California may not be
representative of the nation,13 there are also several reasons why such an exercise is instructive.
First, the state incarceration rate in California (453 per 100,000) is near the national average (422
per 100,000), and thus at least along this dimension, the state is comparable to the nation.
Second, the California state prison system is the largest in the nation (accounting for 13 percent
of the nation’s state prison population), and thus the experience of California inmates is an
Todd (2000) and Smith and Welch (1986). 12 Of course, we are not saying that a year in prison is not costly. However, a year absence from the labor market during the beginning of one’s career would have only a small effect on accumulated experience.

18
important contributor to the weighted-average experience. Finally, these detailed administrative
records permit linking subsequent spells and characterization of personal prison histories,
something that can’t be done with publicly available inmate surveys.
I focus on offenders between 18 and 25 that enter one of the state’s prisons on a new
court commitment (that is to say, not for a parole violation) during the year 1990, and
characterize several aspects of their prison experiences over the subsequent decade. The analysis
is based on administrative records obtained from the California Department of Corrections for all
prison terms served in the state with a start date during the 1990s. Figures 4 and 5 present the
relative frequency distributions for the number of separate prison terms served by our cohort,
inclusive of the initial term caused by the 1990s court commitment and any subsequent terms
due to either additional court commitments or parole revocations. Figure 4 presents the
distribution for all inmates while Figure 5 shows separate distributions by race and ethnicity.14
The majority of inmates serve more than one prison term. Only 32 percent of inmates entering
prison during the year 1990 serve one term during the subsequent decade. The median inmate
serves two terms over the decade, while a substantial fraction (approximately 48 percent) serves
three or more terms.
There are notable differences by race and ethnicity. Only 28 percent of white inmates
and 23 percent of black inmates serve one term during the decade, while the comparable figure
for Hispanic inmates is nearly 40 percent. The median white and black inmates serve three terms
while the median Hispanic inmate serves two terms. Again, substantial fractions of this 1990
13 In particular, California’s high rate of parole violation and the fact that nearly all released inmates are released to parole status is unique among the 50 states. 14 White, Hispanic, and Black inmates each account for approximately one third of the California state prison population. Asians and members of other racial groups account for a small proportion of inmates.

19
cohort serve three or more terms, with 54 percent of white inmates, 58 percent of black inmates,
and 39 percent of Hispanic inmates entering prison at least three times.
In California, the time served on each term tends to be relatively short. While there are
many California inmates serving long sentences and several thousand that are serving 25 years to
life under the state’s “three strikes” sentencing provision, the majority of inmates are sentenced
to relatively short terms that are often completed within a year or two. Table 6 shows the median
time served for inmates in our 1990 cohort. The table provides figures for all inmates, by
race/ethnicity, and by whether the term is the first, second, third, fourth, or fifth or higher term.
For the first term served (which, for our sample, also corresponds to the first term served on a
specific court commitment), the median time served for all inmates is approximately one year.
The median time for white inmates is somewhat lower (0.94 years), the median for black inmates
is somewhat higher (1.17 years), while the median for Hispanics is equal to the overall median.
Median time served declines uniformly with subsequent terms served, declining to 0.68
years for the second term, 0.62 years for third, and so one. This decline reflects the fact that
many of these subsequent prison terms are served for parole violations rather than new felony
court commitments, and thus represent time served on the remaining sentence from the initial
court commitment sending the offender to prison in the first place.
The figures in Table 6 suggest that for most felons committed to prison the actual amount
of time behind bars is fairly short, even accounting for the likelihood of serving multiple spells.
Panel A of Table 7 presents estimates of the total amount of time served accounting for multiple
terms (summing time served across all terms for each inmate) for the inmate at the 25th, 50th and
75th percentiles of this distribution. The median inmate spends 2.8 years during the 1990s in one
of California’s state prisons, with the median white inmate (3.09 years) and median black inmate

20
(3.53 years) serving more time and the median Hispanic inmate (2.23 years) serving less time.
Roughly 25 percent of inmates served at least 5 years during the 1990s while another 25 percent
served less than 1.5 years.
However, as a gauge of the extent to which incarceration potentially interrupts the
accumulation of legitimate labor market experience, these figures are misleading. Most
importantly, cumulative time served does not account for the short periods of time between
prison spells where inmates may find employment, yet are not able to solidify the employment
match with any measurable amount of job tenure. A more appropriate measure of the degree to
which incarceration impedes experience accumulation would be the time between the date of
admission to prison for the first term served and the date of release from the last term.
Panel B of Table 7 presents the quartile values from the distribution of this variable. For
the median inmate, five years elapses between the first date of admission and the last date of
release. For median white, black, and Hispanic inmates, the comparable figures are 6.2, 6.5, and
3.2 years, respectively. For approximately one quarter of inmates (and more than one quarter of
white and black inmates), nine years pass between their initial commission to prison and their
last release. In other words, one quarter of these inmates spends almost the entire decade cycling
in and out of prison.
Moreover, the estimates of the work life interruption in Panel B of Table 7 are likely to
be lower bound estimates. Our cohort is comprised of 18 to 25 years old inmates that enter the
state prison sentence on a new court commitment in 1990. Surely, many of the older offenders
in this group have served prior prisons sentences on previous commitments, a factor that would
add to our estimates if we had information on earlier time served. Moreover, many of the
younger offenders are likely to have juvenile records and may have been previously incarcerated

21
in the California Youth Authority system. In addition, we do not have data on time served for
commitments with start dates occurring after 1999 –i.e., our panel arbitrarily places a cap on the
amount of time one can be involved with the prison system. Finally, we cannot observe time
served in jail while awaiting trial or a parole revocation hearing. Accounting for the jail time
that usually accompanies the transition between being non-institutionalized and imprisonment
would surely increase these estimates.
Regardless, spending 5 years of one’s early life (6.5 years for the median black offender)
cycling in and out of prison must impact one’s earnings prospects. Clearly, being behind bars
and the short spans of time outside of prison prohibit the accumulation of job experiences during
a period of one’s life when the returns to experience are the greatest.
Does having been in prison stigmatize ex-offenders?
The potential impact of serving time on future labor market prospects extends beyond the
failure to accumulate work experience. There is considerable evidence that employers are averse
to hiring former prison inmates and often use formal and informal screening tools to weed ex-
offenders out of the applicant pool. Given the high proportion of low-skilled black men with
prison time on their criminal history records, such employer sentiments and screening practices
represent an increasingly important employment barrier for African-American males. Moreover,
as well we discuss below, this stigmatization of prisoners, coupled with the informal screening
methods used by employers, may also be adversely impacting the employment prospects of
young black men without criminal history records.
Employers consider criminal history records when screening job applicants for a number
of reasons. For starters, certain occupations are closed to felons under state, and in some
instances, federal law (Hahn 1991). Examples include jobs requiring contact with children,

22
certain health services occupations, public employment in some states and localities, and
employment in firms providing security services. In addition, in many states employers can be
held liable for the criminal actions of their employees. Under the theory of negligent hiring,
employers can be required to pay punitive damages as well as damages for loss, pain, and
suffering for acts committed by an employee on the job (Craig 1987). Finally, employers
looking to fill jobs where employee monitoring is imperfect may place a premium on
trustworthiness. To the extent that past criminal activity signals a lack of trustworthiness,
employers may take such information into account when screening applicants.
In all known employer surveys where employers are asked about their willingness to hire
ex-offenders, employer responses reveal a strong aversion to hiring applicants with criminal
history records (Holzer, Raphael, and Stoll 2002, 2003; Pager 2003). For example, Figure 6
present tabulations from the employer survey of the Multi-City Study of Urban Inequality
(MCSUI).15 The figure presents employer responses to questions inquiring about the likelihood
that the employer would hire various types of job applicants, including applicants with a criminal
history record. Over 60 percent indicated that they would “probably not” or “definitely not” hire
applicants with criminal history records, with “probably not” being the modal response. Since
these data pertain to employers that have recently hired low-skilled workers (employer who are
perhaps the most likely to employ an ex-offender), these results imply that a large majority of
employers are unwilling to hire former prison inmates.
Employer aversion to applicants with criminal history records is stronger than employer
aversion to hiring other groups of commonly stigmatized workers. Relative to those with
criminal history records, employers are considerably less averse to hiring the other types of

23
applicants displayed in Figure 6. For example, while 60 percent of employers indicate that they
are unlikely to hire an ex-offenders,16 the comparable figures are eight percent for welfare
recipients, three percent for applicants with a GED, 41 percent for applicants with spotty work
histories, and 18 percent for applicants unemployed for over a year. Interestingly, employers
exhibit the stronger reluctance to hiring applicants with spotty work histories, a characteristic
that one might interpret as signaling past incarceration. However, even for this group of
applicants, the proportion of employer unwilling to hire such workers is 75 percent of the
proportion unwilling to hire ex-offenders.17
The ability of employers to act on an aversion to ex-offenders, and the nature of the
action in terms of hiring and screening behavior, will depend on employer accessibility to
criminal history record information. To the extent that an employer can and does access criminal
history records, an employer may simply screen out applicants based on their actual arrest and
conviction records. Among the employers interviewed in the MCSUI sample, 32 percent
indicated that they always check the criminal history records of applicants, 17 percent indicate
that they sometime check, while 51 percent indicate that they never check. More recent
employer surveys (the MCSUI data are from the early 1990s) indicate that the use of formal
background check has increased. For example, a 2001 survey of employers in Los Angeles with
questions similar to those in the earlier MCSUI survey found that 46 percent of employers
indicates that they always perform criminal background checks, 18 percent indicated that they
15 These data where collected in 1993 and 1994 from establishments in the Atlanta, Boston, Detroit, and Los Angeles metropolitan statistics areas. See Holzer, Raphael, and Stoll (2002) for a complete description of this survey. 16 We define unlikely to hire as either responding that one would “probably not” or “definitely not” be willing to hire an applicant with the given characteristic. 17 Using a more detailed survey of employer preferences, Holzer, Raphael, and Stoll (2003) uncover a fair degree of nuance in employer sentiments with regards to ex-offenders. For example, employers are willing to consider such factors as specific offense and the amount of time lapsed since the offense committed in evaluating applicants with criminal history records.

24
sometimes checked, while 37 percent indicated that they never checked.18 The comparable
tabulations for Los Angeles from the earlier MCSUI data indicated that 32 percent always check,
16 percent sometimes check, while 52 percent never check.
In the absence of a formal background check, an employer may act on their aversion to
hiring ex-offenders using perceived correlates of previous incarceration, such as age, race, or
level of educational attainment to screen out those with criminal histories. In other words,
employers may engage in statistical discrimination against applicants that are thought to come
from demographic groups with high rates of involvement in the criminal justice system. Holzer,
Raphael, and Stoll (2002) find employer-hiring patterns consistent with such statistical
discrimination against black men. Specifically, the authors find that employers that check
criminal history records are more likely to hire blacks than employers that do not, and that this
positive effect of criminal background checks is strongest among those employers with the
strongest stated aversion to hiring ex-offenders.19 Via such statistical discrimination, even young
black men who have never been incarcerated or involved with the criminal justice system are
harmed by the rise in incarceration among young black men overall.
The study by Pager (2003) offers perhaps the clearest evidence of employer aversion to
ex-offenders and the stigma associated with having served time in prison. Pager conducted an
audit study of employer hiring activity in the year 2001 for employers located in the Milwaukee
metropolitan area. Using male auditors matched on observable characteristics including age,
education, general appearance, demeanor, and race, Pager assesses the effect of prior prison
experience on the likelihood that each auditor is called back for an interview. The auditor
18 See Holzer, Raphael, and Stoll (2003) for a description of this latter survey and the results. 19 In addition, the authors find that this relative effect for the hiring of black men, but not black women, and for employer willingness to hire applicants from other stigmatized groups, especially workers with gaps in their employment histories.

25
assigned the criminal history record signaled having served time by indicating six months of
prison work experience on his resume.
Figure 7 presents the main results from this study. For both black and white auditors, the
call back rate for the auditor with a criminal history record is less than half the call back rate for
the auditor without the criminal history record. Interestingly, the call back rate for blacks that do
not signal prior prison time is less than the call back rate for whites with a prior prison term.
Such a pattern is consistent with either taste-based discrimination or employers statistically
discriminating against black applicants without a signaled record in an attempt to avoid ex-
offenders. Regardless, the results presented by Pager are stark and indicative of the employment
barriers faced by ex-offenders.
4. Increasing Incarceration Rates and the Decline in Black Employment Rates
So far, we have documented several stylized facts. First, the rate of current incarceration
among black men has increased considerably over the past three decades, with particularly
pronounced increases among prime-age, less-educated black men. Second, the proportion of
black men with prison time on their criminal history records has increased by even greater
amounts. Third, serving time in prison substantially interrupts the potential work lives of young
offenders, leading to at least six years of lost labor market experience for the median black
offender in California, and more time for a sizable minority of offenders. Fourth, employers are
averse to hiring ex-inmates, and use formal and informal screening methods to weed such
individuals out of the applicant pool.
In addition to these criminal justice trends, we have also demonstrated that the
employment rate of non-institutionalized black men has declined over the same period. Between

26
1970 and 2000 the white-black employment rate differential widened from eight percentage
points to 17 percentage points among non-institutionalized men. For high school dropouts, this
differential increased from seven to 19 percentage points.
The preceding discussion suggests at least two avenues by which the increase in black
incarceration rates may be related to the relative decline in black employment rates. First, with
an increasing incarceration rate, the proportion of non-institutionalized black men with prior
prison time has increased. These men have less legitimate labor market experience than
otherwise similar men who have not been to prison and must contend with strong employer
reluctance to hire ex-offenders. Second, men without criminal histories who are members of
demographic groups where a large proportion has a criminal history record may face statistical
discrimination in the labor market and difficulty finding employment.
In this section, I test for a partial correlation between the proportion of a given sub-group
of men that are institutionalized and the proportion of comparable non-institutionalized men that
are employed. These estimates are then used to provide an estimate of the proportion of the
black-white employment rate differential among the non-institutionalized that may be
attributable to incarceration trends.
Using data from the 1970, 1980, 1990, and 2000 PUMS, I first estimate the proportion of
non-institutionalized men that are employed and the proportion of all men that are
institutionalized for 320 demographic sub-groups. The sub-groups are defined by interaction of
four mutually exclusive race/ethnic groups, five age groups, four education groups, and four
years. I use the five age groups and four education groups listed in Tables 1 and 2, and compute
separate figures for non-Hispanic whites, non-Hispanic blacks, non-Hispanic Asians, and
Hispanics. I then estimate a series of regression models where the key dependent variable is the

27
proportion of non-institutionalized men that are employed and the key explanatory variable is the
proportion of all men from the given demographic group that are institutionalized.
Table 8 presents these estimation results. Each model regresses the non-institutionalized
employment rate on dummy variables indicating the race/ethnicity of the group and interaction
terms between these dummies and a set of year dummies. The coefficients on these dummies
provide estimates of the employment rate differentials relative to whites in 1970 and how these
differentials change across decades. The first three regression models include a complete set of
dummy variables indicating the age/education cell. The last three regressions include a complete
set of dummies indicating the age/education/year cells (thus allowing the effect on employment
of being in a specific age/education group to change over time). Within these two groups of
regressions, the first specification omits the variable measuring the proportion institutionalized,
the second specification adds the institutionalization variables, while the final specifications adds
the institutionalization variable with a full set of interactions with the year dummies.20
Within both sets of regressions (those including and those omitting the
age/education/year interaction terms), adding the proportion institutionalized reduces the
coefficients on the interaction terms between black and the year dummies. In other words, the
proportion institutionalized explains part of the widening of the black-white employment rate
differential in all decades between 1970 and 2000. For example, the results in regression model
(1) indicate that after adjusting for age/education effects and year effects, the black-white
employment rate differential widened by 12 percentage points between 1970 and 2000. In
contrast, the comparable estimate from regression (2) indicates a widening of 6.4 percentage
20 Each regression is weighted by cell frequency. In addition, each regression includes a constant term and a set of base year effects.

28
points. The findings are similar in the models where the age/education dummies are interacted
with year.
The proportion institutionalized has a strong negative effect on the proportion of non-
institutionalized men that are employed. In the models where the institutionalization variable is
interacted with year, the proportion institutionalized has the largest effect on employment rates in
1980, followed by 1990, and 2000. Again, the regression results are comparable when the
age/education/year interaction terms are included.
Figure 8 summarizes the effect of controlling for the proportion institutionalized on the
white-black difference in employment rates among non-institutionalized men. The employment
rate differentials omitting controls for institutionalization come from the model (4) regression
results while the differentials adjusting for institutionalization comes from the model (6)
regression results. Adjusting for institutionalization reduces the residual employment rate
differential in all years, although the largest reductions occur in 1990 and 2000. In 1990,
adjusting for institutionalization reduces the residual difference from 12.7 percentage points to
5.3 percentage points. In 2000, adjusting for institutionalization reduces this differential from
15.5 percentage points to 10.1 percentage points.
Thus, this very simple exercise yields a quite high upper bound contribution of changes
in incarceration rates to recent employment trends. To be sure, there are problems with this
approach to the question. In particular, the proportion institutionalized within a given group is
likely to be correlated with unobservable characteristics of men that vary within age/education
cells and that determine their employability. Moreover, while the variation used to identify the
effect of the institutionalization variable accounts for cross-year changes in the employment rates
of the age/education sub-groups, these employment rate differentials may have changed within

29
racial and ethnic groups, and in manner correlated with changes in incarceration rates.21
Nonetheless, the results suggest that incarceration trends may explain a large portion of currently
observed racial employment rate differentials.
5. Conclusion
This paper has documented several trends in the incarceration of black men and highlighted
the potential lasting effects of high incarceration rates on their future employment prospects and
on their relative socioeconomic status. To summarize, the paper has demonstrated that
• the current incarceration rates of black men are extraordinarily high by historical comparison
especially for less-educated and relatively young black men,
• the proportion of black men ever having served time is even higher,
• prison time substantially interrupts the potential work careers in the legitimate labor market
of young felons, and
• employers are extremely reluctant to hire applicants who have served time in state or federal
prison.
In addition, I have presented simple estimates suggesting that a sizable portion of the black-white
employment rate differentials may be attributable to the high rate of involvement of blacks with
the criminal justice system. Across demographic groups defined by education, age, and race,
there is a strong inverse correlation between the proportion of the group currently
institutionalized and the employment rate of the non-institutionalized. Moreover, this partial
21 An alternative estimation strategy that may be used to address this issue would be to calculate the 320 sets of means for each state, and then include a full set of race/age/education/year fixed effects in the final specification. I experimented with this approach and found that the sample sizes using the one percent PUMS yielded extremely small cells for many states and thus, quite imprecise estimates. Revisiting this exercise with the 5 percent samples, however, may solve this problem.

30
correlation is strong enough to explain roughly one-third of the black-white employment rate
differential in 2000.
The continual increase in the lifetime likelihood of going to prison between 1970 and
2000 suggests that the proportion of blacks with prior prison time is likely to increase in the
coming years, even if current incarceration rates remain unchanged. This follows from the fact
that the risk of incarceration is highest early in one’s adult life, and that young men coming of
age today face higher incarceration rates than those faced by comparable young men during the
1980s and 1990s. Thus, the barriers faced by ex-offenders are likely to hamper the
socioeconomic progress of many black men for the foreseeable future.
Clearly, this is a topic that deserves future attention from both researchers and policy
makers. There are several potentially fruitful directions that researchers can pursue. While the
incarceration trends documented here are often attributable to changes in sentencing policy and
potential changes in offending among young men, there are few systematic evaluations of the
relative culpability of behavioral trends and key policy choices. For example, there is little
evidence on the relative impact of state vs. federal sentencing reforms on black incarceration
rates. At the state level, the shift from indeterminate to determinate sentencing, sentence
enhancements for drug-related crime such as those enacted under Governor Nelson Rockefeller
in New York, three-strikes laws, and state-level sentence enhancement for violent crimes and
crime committed with a firearm are all likely contributors. At the federal level, differential
sentences for crack vs. powder cocaine, systematic efforts to try felons in possession of firearm
in federal courts, and the federal sentencing reforms that limited judicial discretion are an
additional set of potential candidates. Assessing the extent to which these state and federal
sentencing changes are having a disparate impact on blacks would be most useful. Such research

31
may be of help in deciding how to deploy criminal justice resources more efficiently and in
assessing whether current sentencing policy is unnecessarily impacting the long-term
employment prospects of an already disadvantaged group.
In addition, while there are many qualitative evaluations of the effects of prisoner education
and in-prison treatment programs, careful empirical studies employing rigorous experimental or
quasi-experimental research designs are few and far between. Early non-experimental
evaluations of state employment programs tailored at paroled ex-offenders (reviewed in
Bushway and Reuter (2002)) arrived at quite pessimistic conclusions regarding the ability of
training and job search assistance to lower the recidivism of parolees. Evaluations of more
recent state programs, however, are uniformly more positive. In a review of recent research,
Petersilia (2002) cites several evaluations finding program effects on the likelihood that parolees
find employment on the order of 20 percentage points, and effects on the likelihood of re-arrest
and being returned to prison custody on the order of 10 percentage points. A review of 19 studies
by Wilson et. al. (2000) finds similar program effects.22
Careful reviews of the more recent evaluations tend to attribute the high estimates from the
latter research to flaws in methodological design. Bushway and Reuter (2002) as well as Wilson
et. al. (2000) note that few of the program evaluations are based on randomized designs where
program participation is determined by random assignment rather than self-selection. Moreover,
many of the evaluation do not control for differences in offender characteristics that may
simultaneously explain program participation and recidivism/parole violation rates. Thus, there
is much room for additional work.
22 For detailed descriptions of three state level job training and placement programs, see Finn (1998a, 1998b, and 1998c).

32
In general, prisoner reentry policy is and will be an important determinant of the relative
socioeconomic status of low-skilled black men. There is a great need for creative thinking on
how to combine existing services for the economically disadvantaged (such as workforce
development programs) with services targeted towards the needs of ex-offender in a manner that
will minimize the negative collateral consequences of prior prison time.
33
References
Beck, Allen J.; Karberg, Jennifer C. and Paige M. Harrison (2002), Prison and Jail Inmates at Midyear 2001, Bureau of Justice Statistics Bulletin, NCJ 191702. Bonczar, Thomas P. (2003), Prevalence of Imprisonment in the U.S. Population, 1974-2001, Bureau of Justice Statistics Special Report, NCJ 197976. Bound, John and Richard B. Freeman (1992), “What Went Wrong? The Erosion of the Relative Earnings and Employment of Young Black Men in the 1980s,” Quarterly Journal of Economics, 107(1): 201-232. Brown, Charles C. (1984), “Black-White Earnings Ratios Since the Civil Rights Act of 1964: The Importance of Labor Market Dropouts,” Quarterly Journal of Economics, 95(1): 31-44. Bushway, Shawn and Peter Reuter (2002), “Labor Markets and Crime,” in Wilson, James Q. and Joan Petersilia (eds.) Crime: Public Policies for Crime Control, Oakland: CA, Institute for Contemporary Studies Press, 191-224. Butcher, Kristin F. and Anne Morrison Piehl (1998), “Recent Immigrants: Unexpected Implications for Crime and Incarceration,” Industrial & Labor Relations Review, 51(4): 654-679. Chandra, Amitabh (2003), “Is the Convergence in the Racial Wage Gap Illusory?” National Bureau of Economic Research Working Paper #9476. Craig, Scott R. (1987), “Negligent Hiring: Guilt By Association,” Personnel Administrator, October: 32-34. Finn, Peter (1998a), Chicago’s Safer Foundation: A Road Back for Ex-Offenders, Washington, D.C., National Institute of Justice. Finn, Peter (1998b), Successful Job Placement for Ex-Offenders: The Center for Employment Opportunities, Washington, D.C., National Institute of Justice. Finn, Peter (1998c), Texas’ Project RIO (Re-integrating of Offenders), Washington, D.C., National Institute of Justice. Hahn, J.M. (1991), “Pre-Employment Information Services: Employers Beware,” Employee Relations Law Journal, 17(1): 45-=69. Heckman, James J.; Lyons, Rom and Petra Todd (2000), “Understanding Black-White Wage Differentials,” American Economic Review, 90(2): 344-349. Holzer, Harry J. and Paul Offner (2003), “Trends in the Employment Outcomes of Young Black Men, 1979 –2000,” in Ronald Mincy (ed), Young Black Men.

34
Holzer, Harry J.; Raphael, Steven and Michael A. Stoll (2002), “Perceived Criminality, Racial Background Checks, and the Racial Hiring Practices of Employers,” working paper. Holzer, Harry J.; Raphael, Steven and Michael A. Stoll (2003), “Employer Demand for Ex-Offenders: Recent Evidence from Los Angeles,” Working Paper. Juhn, Chinhui (2003), “Labor Market Dropouts and Trends in the Wages of Black and White Men,” Industrial & Labor Relations, 56(4): 643-662. Katz, Lawrence F. and Alan B. Krueger (1999), “The High-Pressure U.S. Labor Market of the 1990s,” Brookings Papers on Economic Activity 1999, 1-87. Neal, Derek and William Johnson (1996), “The Role of Pre-Market Factors in Black-White Wage Differences, Journal of Political Economy, 104(5): 869-895. Pager, Devah (2003), “The Mark of a Criminal Record,” American Journal of Sociology, 108(5): 937-975. Petersilia, Joan (2002), “Community Corrections,” in Wilson, James Q. and Joan Petersilia (eds.) Crime: Public Policies for Crime Control, Oakland: CA, Institute for Contemporary Studies Press, 483-508. Petersilia, Joan (2003), When Prisoners Come Home: Parole and Prisoner Reentry, Oxford University Press: Oxford. Raphael, Steven and Michael Stoll (2004), “The Effect of Prison Releases on Regional Crime Rates,” forthcoming in William G. Gale and Janet Rothenberg Pack (eds), The Brookings-Wharton Papers on Urban Economic Affairs, Volume 5, The Brookings Institution: Washington. Raphael, Steven and David Weiman (2003), “The Impact of Local Labor Market Conditions on the Likelihood That Parolees are Returned to Custody,” Working Paper. Smith, James P. and Finis Welch (1986), Closing the Gap: Forty Years of Economic Progress for Blacks, Rand Corporation: Santa Monica, CA. U.S. Census Bureau (2003), Technical Assessment of A.C.E. Revision II, Accessed on March 17, 2004, http://www.census.gov/dmd/www/ace2.html. Western, Bruce and Becky Petit (2000), “Incarceration and Racial Inequality in Men’s Employment,” Industrial & Labor Relations Review, 54(1): 3-16. Wilson, David B.; Gallagher, Catherine. A.; and Doris L. MacKenzie, (2000), “A Meta-Analysis of Corrections-Based Education, Vocation, and Work Programs for Adult Offenders, Journal on Research in Crime and Delinquency, 37: 347-368.

35
Figure 1: Comparison of BJS Estimates of the Number of Men in Federal Prison, State Prison, and Local Jails (2001) to Estimates from the 2000 One Percent Census Public Use Microdata Sample of the Number of Men Institutionalized by Race and Ethnicity
6 8 4 ,8 0 0
8 0 3 ,4 0 0
2 8 3 ,0 0 0
7 8 1 , 9 2 38 1 3 ,9 2 0
3 2 2 ,9 6 0
0
1 0 0 ,0 0 0
2 0 0 ,0 0 0
3 0 0 ,0 0 0
4 0 0 ,0 0 0
5 0 0 ,0 0 0
6 0 0 ,0 0 0
7 0 0 ,0 0 0
8 0 0 ,0 0 0
9 0 0 ,0 0 0
N o n -H is p a n ic W h it e N o n -H is p a n ic B la c k H is p a n ic
Num
ber o
f Men
B u re a u o f Ju s t ic e S ta t is t ic s2 0 0 0 1 % P u m s
Figure 2: Lifetime Likelihood of Serving a State or Federal Prison Sentence for Males Born in 1974 and 2001 by Race and Ethnicity
2.2%
13.4%
4.0%
5.9%
32.2%
17.2%
0.0%
5.0%
10.0%
15.0%
20.0%
25.0%
30.0%
35.0%
Non-Hispanic W hite Non-Hispanic B lack Hispanic
Life
time
Like
lihoo
d of
Goi
ng to
Pris
on
19742001

36
Figure 3: White-Black Employment Rate Differentials for the Non-Institutionalized and the Non-Institutionalized and Institutionalized Combined
0.08
0.130.14
0.17
0.09
0.15
0.17
0.22
0.00
0.05
0.10
0.15
0.20
0.25
0.30
1970 1980 1990 2000
Empl
oym
ent r
ate
diffe
renc
e, w
hite
-bla
ck
Non-Ins t itu t ionaliz edA ll
Figure 4: The Distribution of 18 to 25 Year Old Prisoners Entering the California State Prison System in 1990 by the Number of Terms Served over the Subsequent Decade
31.99%
19.79%
14.06%
10.22%
7.52%
5.42%
4.00%2.65%
4.34%
0.00%
5.00%
10.00%
15.00%
20.00%
25.00%
30.00%
35.00%
1 2 3 4 5 6 7 8 9+
Number of Terms Served
Perc
ent o
f 199
0 Pr
ison
er C
ohor
t

37
Figure 5: The Distribution of 18 to 25 Year Old Prisoners Entering the California State Prison System in 1990 by the Number of Terms Served over the Subsequent Decade, by Race and Ethnicity
0.00%
5.00%
10.00%
15.00%
20.00%
25.00%
30.00%
35.00%
40.00%
45.00%
Num be r of Te rm s S e rve d
Perc
ent o
f 199
0 Pr
ison
er C
ohor
t
W hitesB lacksHispanic
W hites 27.63% 16.26% 12.37% 11.51% 9.09% 7.61% 5.44% 3.58% 6.51%
B lacks 23.95% 18.90% 16.13% 11.61% 9.18% 6.45% 4.77% 3.67% 5.35%
Hispanic 39.25% 22.16% 13.41% 8.95% 5.55% 3.64% 2.88% 1.58% 2.57%
1 2 3 4 5 6 7 8 9+
Figure 6: Self-Reported Employer Willingness to Hire Applicants from Various Groups from the Establishment Survey of the Multi-City Study of Urban Inequality
13%
52%
57%
19%
29%
26%
40%39% 40%
54%
42%
7%
2%
35%
16%
20%
1% 1%
6%
2%
0%
10%
20%
30%
40%
50%
60%
70%
Crim inal Record W elfare Rec ipient GED no High SchoolDiploma
Spotty W ork His tory Unemployed for Morethan a Year
Perc
ent o
f Em
ploy
ers
Definitely W illP robably W illP robably NotDefinitely Not

38
Figure 7: Percent of Auditors Called Back for an Interview by Race and Whether the Auditor Was Assigned a Criminal History Record, as Reported in Pager (2003)
14%
34%
5%
17%
0%
5%
10%
15%
20%
25%
30%
35%
40%
Black W hite
Perc
ent R
ecei
ving
a C
all B
ack
W ithout RecordW ith Crim inal His tory Record
Figure 8: White-Black Difference in the Proportion Employed Among the Non-Institutionalized, With and Without Controlling for the Proportion of the Population Institutionalized
0.058
0.118
0.127
0.155
0.045
0.064
0.053
0.101
0
0.02
0.04
0.06
0.08
0.1
0.12
0.14
0.16
0.18
1970 1980 1990 2000
Empl
oym
ent R
ate
Diff
eren
tial
W ithout Controlling for the ProportionInstitutionalizedControlling for the Proportion Instituionalized

Table 1 Employment and Institutionalization Status for Non-Hispanic Black Males and Non-Hispanic White Males by Educational Attainment, 1970 to 2000 Black Males White Males Age 1970 1980 1990 2000 1970 1980 1990 2000All Employed NILF Armed Forces Institutionalized
0.73 0.20 0.04 0.03
0.64 0.29 0.04 0.03
0.63 0.30 0.03 0.04
0.57 0.33 0.02 0.08
0.82 0.13 0.04 0.01
0.80 0.17 0.02 0.01
0.80 0.17 0.02 0.01
0.79 0.18 0.01 0.01
Less than high school Employed NILF Armed Forced Institutionalized
0.71 0.23 0.01 0.04
0.57 0.38 0.01 0.05
0.46 0.44 0.00 0.10
0.34 0.47 0.00 0.19
0.80 0.17 0.01 0.02
0.69 0.28 0.01 0.02
0.63 0.34 0.00 0.03
0.59 0.37 0.00 0.04
High school graduate Employed NILF Armed Forced Institutionalized
0.75 0.15 0.08 0.02
0.66 0.25 0.06 0.03
0.63 0.28 0.04 0.05
0.56 0.35 0.02 0.08
0.85 0.10 0.05 0.01
0.81 0.15 0.03 0.01
0.80 0.17 0.02 0.01
0.77 0.20 0.01 0.02
Some College Employed NILF Armed Forced Institutionalized
0.71 0.22 0.06 0.01
0.69 0.25 0.04 0.02
0.68 0.23 0.05 0.05
0.66 0.26 0.03 0.05
0.77 0.18 0.04 0.00
0.81 0.17 0.02 0.00
0.81 0.16 0.02 0.01
0.80 0.17 0.02 0.01
College Plus Employed NILF Armed Forced Institutionalized
0.87 0.09 0.04 0.01
0.84 0.13 0.02 0.01
0.85 0.11 0.03 0.01
0.81 0.16 0.01 0.01
0.89 0.07 0.04 0.00
0.91 0.07 0.02 0.00
0.90 0.08 0.02 0.000
0.89 0.10 0.01 0.00
Figures are tabulated from the 1970, 1980, 1990, and 2000 public use micro data samples from the U.S. Census of Population and Housing.

Table 2 Employment and Institutionalization Status for Non-Hispanic Black Males and Non-Hispanic White Males by Age, 1970 to 2000 Black Males White Males Age 1970 1980 1990 2000 1970 1980 1990 200018 to 25 years Employed NILF Armed Forced Institutionalized
0.55 0.32 0.08 0.05
0.48 0.40 0.08 0.04
0.46 0.41 0.06 0.07
0.43 0.43 0.03 0.11
0.63 0.26 0.10 0.01
0.69 0.26 0.04 0.01
0.68 0.25 0.05 0.01
0.68 0.27 0.03 0.02
26 to 30 years Employed NILF Armed Forced Institutionalized
0.80 0.13 0.04 0.04
0.69 0.22 0.04 0.05
0.64 0.23 0.04 0.09
0.61 0.25 0.02 0.12
0.89 0.07 0.04 0.01
0.86 0.10 0.02 0.01
0.86 0.10 0.03 0.01
0.85 0.11 0.02 0.02
31 to 40 Employed NILF Armed Forced Institutionalized
0.82 0.11 0.04 0.03
0.76 0.18 0.03 0.03
0.70 0.21 0.03 0.06
0.64 0.23 0.02 0.11
0.91 0.05 0.03 0.01
0.90 0.07 0.02 0.01
0.89 0.08 0.02 0.01
0.87 0.10 0.01 0.02
41 to 50 Employed NILF Armed Forced Institutionalized
0.83 0.14 0.01 0.02
0.77 0.21 0.01 0.02
0.74 0.21 0.01 0.04
0.65 0.28 0.01 0.06
0.92 0.06 0.01 0.01
0.90 0.09 0.01 0.01
0.90 0.10 0.01 0.01
0.86 0.12 0.00 0.01
51 to 65 Employed NILF Armed Forced Institutionalized
0.72 0.26 0.00 0.02
0.61 0.37 0.00 0.01
0.58 0.40 0.00 0.02
0.53 0.44 0.00 0.03
0.81 0.18 0.00 0.01
0.72 0.27 0.00 0.01
0.69 0.31 0.00 0.01
0.70 0.29 0.00 0.01
Figures are tabulated from the 1970, 1980, 1990, and 2000 public use micro data samples from the U.S. Census of Population and Housing.

Table 3 Employment and Institutionalization Status for Non-Hispanic Black Males 40 and Under with a High School Education or Less , 1970 to 2000 High School Dropouts High School Graduates Age 1970 1980 1990 2000 1970 1980 1990 200018 to 25 years Employed NILF Armed Forced Institutionalized
0.50 0.38 0.04 0.08
0.38 0.51 0.04 0.08
0.30 0.55 0.00 0.15
0.27 0.50 0.00 0.23
0.62 0.23 0.13 0.02
0.52 0.32 0.13 0.03
0.49 0.36 0.10 0.06
0.44 0.44 0.04 0.09
26 to 30 years Employed NILF Armed Forced Institutionalized
0.76 0.16 0.01 0.06
0.58 0.32 0.01 0.10
0.40 0.38 0.00 0.22
0.30 0.36 0.00 0.34
0.83 0.09 0.06 0.02
0.70 0.21 0.05 0.04
0.64 0.24 0.04 0.08
0.58 0.29 0.02 0.12
31 to 40 Employed NILF Armed Forced Institutionalized
0.81 0.13 0.01 0.05
0.70 0.25 0.00 0.05
0.52 0.34 0.00 0.13
0.35 0.37 0.00 0.28
0.82 0.08 0.08 0.02
0.76 0.17 0.04 0.03
0.69 0.24 0.02 0.06
0.62 0.27 0.01 0.11
Figures are tabulated from the 1970, 1980, 1990, and 2000 public use micro data samples from the U.S. Census of Population and Housing.

Table 4 BJS Estimates of the Proportion of the Male Population Ever Having Served Time in a State or Federal Prison by Race/Ethnicity and Age and Estimates of the Proportion Serving Time in a California State Prison During the 1990s, by Race, Age and Educational Attainment Estimates for California from CDC Administrative Records
BJS estimates for the nationa
Allb
High school dropoutsc
High school graduatesc
Some collegec
College plusc
Non-Hispanic White Males 18 to 24 0.01 0.01 0.03 0.00 0.00 0.00 25 to 34 0.03 0.03 0.31 0.03 0.01 0.00 35 to 44 0.04 0.03 0.30 0.04 0.02 0.01 45 to 54 0.03 0.02 0.17 0.02 0.01 0.01 55 to 65 0.03 0.01 0.04 0.01 0.00 0.00 Non-Hispanic Black Males 18 to 24 0.09 0.04 0.19 0.02 0.01 0.00 25 to 34 0.20 0.19 1.14 0.15 0.05 0.03 35 to 44 0.22 0.19 1.23 0.16 0.07 0.04 45 to 54 0.18 0.15 0.90 0.12 0.06 0.05 55 to 65 0.13 0.05 0.18 0.04 0.01 0.02 Hispanic Males 18 to 24 0.04 0.01 0.02 0.00 0.00 0.00 25 to 34 0.09 0.05 0.08 0.03 0.02 0.02 35 to 44 0.10 0.05 0.07 0.04 0.02 0.03 45 to 54 0.10 0.03 0.04 0.03 0.02 0.03 55 to 65 0.07 0.01 0.02 0.02 0.01 0.01
a. Estimates drawn from Table 7 of Bonczar (2003) b. Estimates in this column are calculated as follows. The administrative term-records for all terms
served in California were sorted by a CDC internal id number. The first term for each unique id was selected out to construct a sample of unduplicated prisoners. For each prisoner, we calculate how old the prisoner would be in the year 2000. We then calculated counts of prisoners by age and race for 2000. Using the 2000 one percent PUMS, we then estimate the California population size for each age/race cell listed in the table. The figures in the table are the ratio of the prisoner counts to the 2000 census population estimate for each cell.
c. Estimates in this column are calculated as follows. We first calculate the counts of unduplicated prisoners by age and race following the procedures in note b. We then use data from the 1997 Survey of Inmates in State and Federal Corrections Facilities to estimate the educational attainment of prison inmates in the United States by race/ethnicity and age. We use these estimates to allocate the number of unduplicated prisoners within each age-race cell across the four educational groups (the CDC administrative data does not contain information on educational attainment). We then use the 2000 one percent PUMS to estimate the California population size of each age/race/education cell in the table. The figures in the table are the ratio of the prisoner counts hypothetically allocated across education groups to the 200 census population estimate for each cell.

Table 5 Comparisons of the White-Black Employment Rate Differentials, by Year and Level of Education Attainment, Using Alternative Base Populations to Calculate Employment Rates 1970 1980 1990 2000 High School Dropouts Non-Institutionalized Total Population
0.07 0.09
0.11 0.12
0.13 0.17
0.19 0.25
Difference 0.02 0.01 0.04 0.06 High School Non-Institutionalized Total Population
0.05 0.06
0.10 0.11
0.13 0.16
0.17 0.21
Difference 0.01 0.01 0.03 0.04 Some College Non-Institutionalized Total Population
0.04 0.04
0.08 0.10
0.08 0.10
0.10 0.13
Difference 0.00 0.02 0.02 0.03 College Graduates Non-Institutionalized Total Population
0.02 0.02
0.05 0.06
0.03 0.04
0.06 0.07
Difference 0.02 0.01 0.01 0.01 The figures in the table are the differences between the employment-to-population ratios for white males and black males by education group. In the rows labeled “Non-Institutionalized,” the non-institutionalized population is used as the base for calculating the underlying employment rates. In the rows labeled “Total Population,” the non-institutionalized plus the institutionalized are used as the base for calculating the underlying employment rates. These figures are tabulated from the 1970, 1980, 1990, and 2000 one percent PUMS files.

Table 6 Median Time Served (Years) in the California State Prison System by Term and by Race/Ethnicity for 1990 Prisoner Cohort, 18 to 25 Years of Age Term Served First Second Third Fourth Fifth or
higher All Inmates 1.02 0.68 0.62 0.53 0.49 White 0.94 0.62 0.58 0.53 0.48 Black 1.17 0.71 0.65 0.53 0.50 Hispanic 1.01 0.72 0.63 0.55 0.47 Tabulation are based on all individuals between the ages of 18 and 25 that entered the California state prison system during 1990 serving the first term of a commitment. The terms served column refer to the first and subsequent terms served by the 1990 cohort of inmates over the subsequent 10 years.

Table 7 Quartile Values of the Total Time Served During the 1990s and the Time Between the Date of First Admission and Date of Last Release for the 1990 Prison Cohort Between 18 and 25 Years of Age Panel A: Distribution of Total Time Served 25th Percentile 50th Percentile 75th Percentile All Inmates 1.44 2.79 4.81 White 1.43 3.09 5.12 Black 1.93 3.53 5.45 Hispanic 1.29 2.23 3.97 Panel B: Distribution of Time Between the Date of First Admission and the Date of Last Release 25th Percentile 50th Percentile 75th Percentile All Inmates 1.86 4.99 8.71 White 2.01 6.17 9.11 Black 2.88 6.42 9.16 Hispanic 1.44 3.65 7.62 Tabulation are based on all individuals between the ages of 18 and 25 that entered the California state prison system during 1990 serving the first term of a commitment. Tabulation of the percentiles of the two time distributions are based on all terms served over the subsequent 10 years.

Table 8 Regressions of the Proportion Employed Among the Non-Institutionalized on the Proportion Institutionalized (1) (2) (3) (4) (5) (6) Black
-0.045 (0.022)
-0.029 (0.021)
-0.073 (0.025)
-0.058 (0.013)
-0.038 (0.010)
-0.045 (0.015)
Black*1980
-0.073 (0.027)
-0.070 (0.027)
-0.010 (0.031)
-0.060 (0.016)
-0.057 (0.013)
-0.019 (0.019)
Black*1990
-0.085 (0.028)
-0.056 (0.027)
0.002 (0.032)
-0.069 (0.016)
-0.041 (0.013)
-0.008 (0.019)
Black*2000
-0.116 (0.027)
-0.064 (0.027)
-0.026 (0.030)
-0.097 (0.015)
-0.049 (0.013)
-0.056 (0.017)
Asian
-0.104 (0.054)
-0.099 (0.052)
-0.109 (0.051)
-0.096 (0.031)
-0.090 (0.025)
-0.092 (0.025)
Asian*1980
0.027 (0.064)
0.024 (0.061)
0.035 (0.060)
0.021 (0.036)
0.017 (0.029)
0.022 (0.029)
Asian*1990
0.038 (0.060)
0.035 (0.057)
0.045 (0.056)
0.027 (0.035)
0.023 (0.028)
0.025 (0.027)
Asian*2000
0.024 (0.0.57)
0.019 (0.055)
0.029 (0.054)
0.010 (0.033)
0.005 (0.027)
0.007 (0.025)
Hispanic
-0.025 (0.016)
-0.010 (0.016)
-0.048 (0.019)
-0.035 (0.009)
-0.017 (0.008)
-0.024 (0.012)
Hispanc* 1980
0.027 (0.027)
0.008 (0.026)
0.051 (0.028)
0.037 (0.016)
0.018 (0.013)
0.023 (0.015)
Hispanic* 1990
0.037 (0.024)
0.028 (0.023)
0.072 (0.026)
0.051 (0.014)
0.039 (0.011)
0.049 (0.015)
Hispanic* 2000
-0.035 (0.022)
-0.046 (0.020)
-0.007 (0.025)
-0.014 (0.013)
-0.035 (0.014)
-0.028 (0.014)
Institutionalized -
-1.007 (0.183)
0.938 (0.659)
- -1.076 (0.098)
-0.687 (0.602)
Institutionalized* 1980
- - -2.518 (0.710)
- - -1.851 (0.759)
Institutionalized* 1990
- - -2.220 (0.065)
- - -0.968 (0.639)
Institutionalized* 2000
- - -1.861 (0.637)
- - -0.167 (0.612)
Age/education dummies
Yes Yes Yes Yes Yes Yes
Age/education dummies*year
No No No Yes Yes Yes
R2 0.887 0.898 0.903 0.971 0.981 0.983 N 320 320 320 320 320 320 All models include a constant term and year dummy variables. The dependent variable is the proportion of the non-institutionalized age/race/education/year cell that is employed. The key explanatory variable is the proportion of each cell (including the institutionalized) that is institutionalized.