Embed Size (px)
Citation preview

Steve Blank
Jon Feiber
Jon Burke
http://i245.stanford.edu/
The Lean LaunchPad
Lecture 6: Revenue Streams
2images by JAM
customer segments
key partners
cost structure
revenue streams
channels
customer relationships
key activities
key resources
value proposition
REVENUE STREAMS
what are customers really willing to pay for? how? are you generating transactional or recurring
revenues?
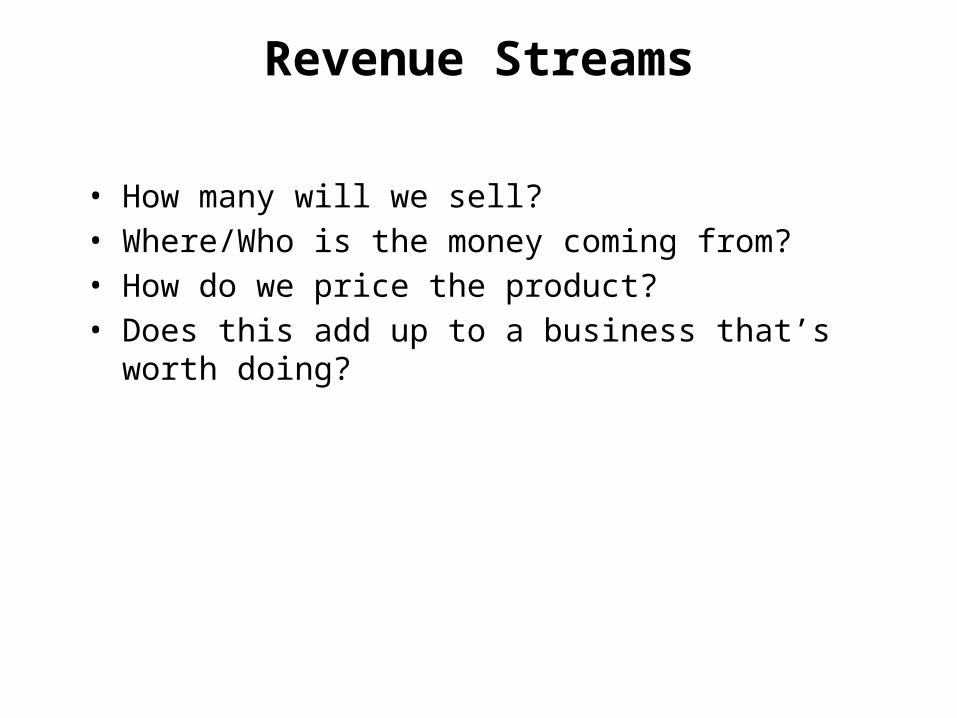
Revenue Streams
• How many will we sell?• Where/Who is the money coming from?• How do we price the product?• Does this add up to a business that’s worth doing?
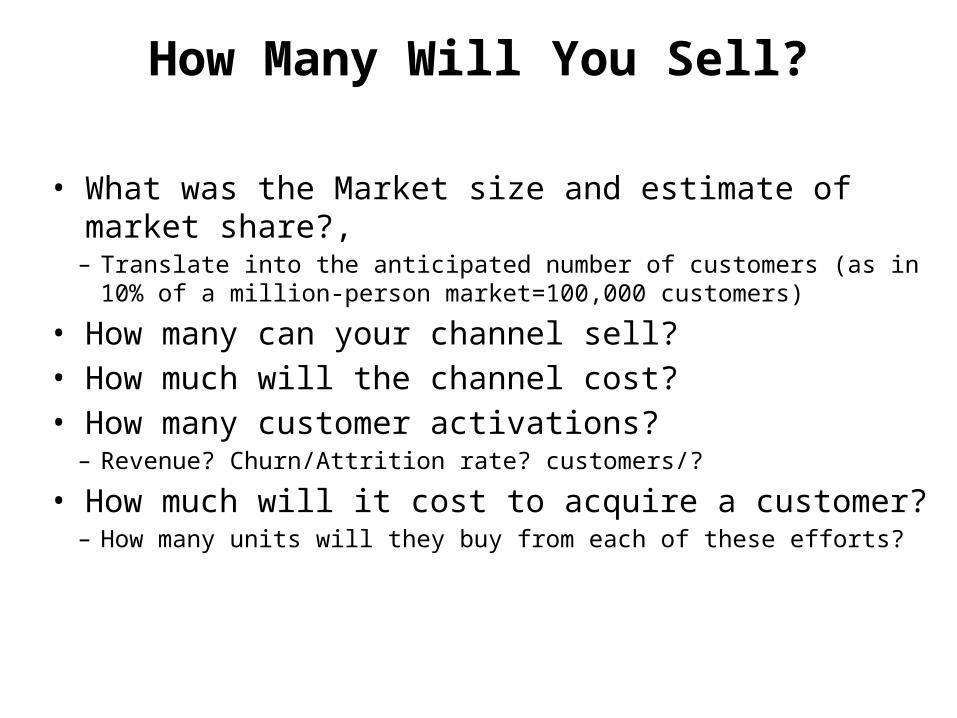
How Many Will You Sell?
• What was the Market size and estimate of market share?,– Translate into the anticipated number of customers (as in 10% of a million-
person market=100,000 customers)
• How many can your channel sell?• How much will the channel cost?• How many customer activations?
– Revenue? Churn/Attrition rate? customers/?
• How much will it cost to acquire a customer?– How many units will they buy from each of these efforts?
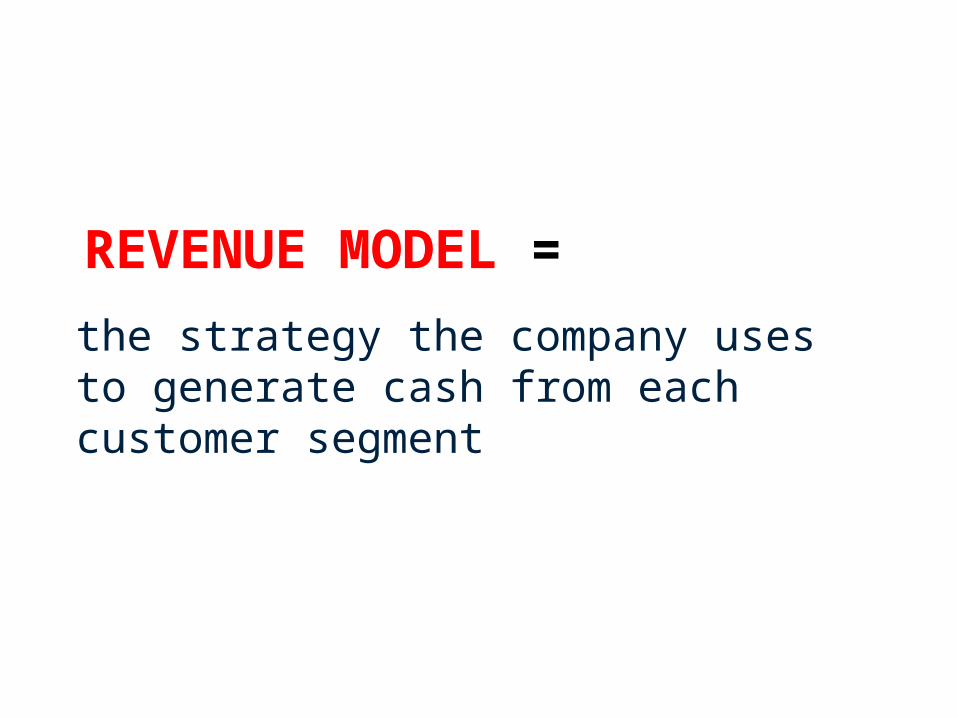
REVENUE MODEL =
the strategy the company uses to generate cash from each customer segment
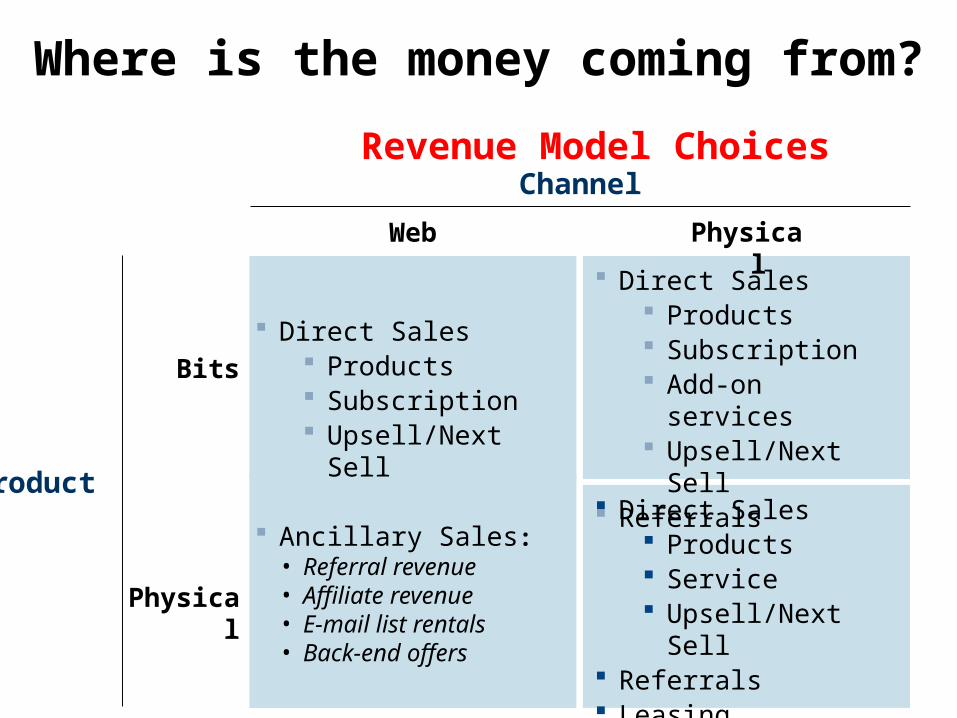
Where is the money coming from?
Revenue Model Choices
Bits
Physical
Product
Web Physical
Channel
Direct Sales Products Subscription Upsell/Next Sell
Ancillary Sales:• Referral revenue • Affiliate revenue• E-mail list rentals• Back-end offers
Direct Sales Products Service Upsell/Next Sell
Referrals Leasing
Direct Sales Products Subscription Add-on services Upsell/Next Sell
Referrals
PRICING MODEL =
the tactics you use to set the price in each customer segment
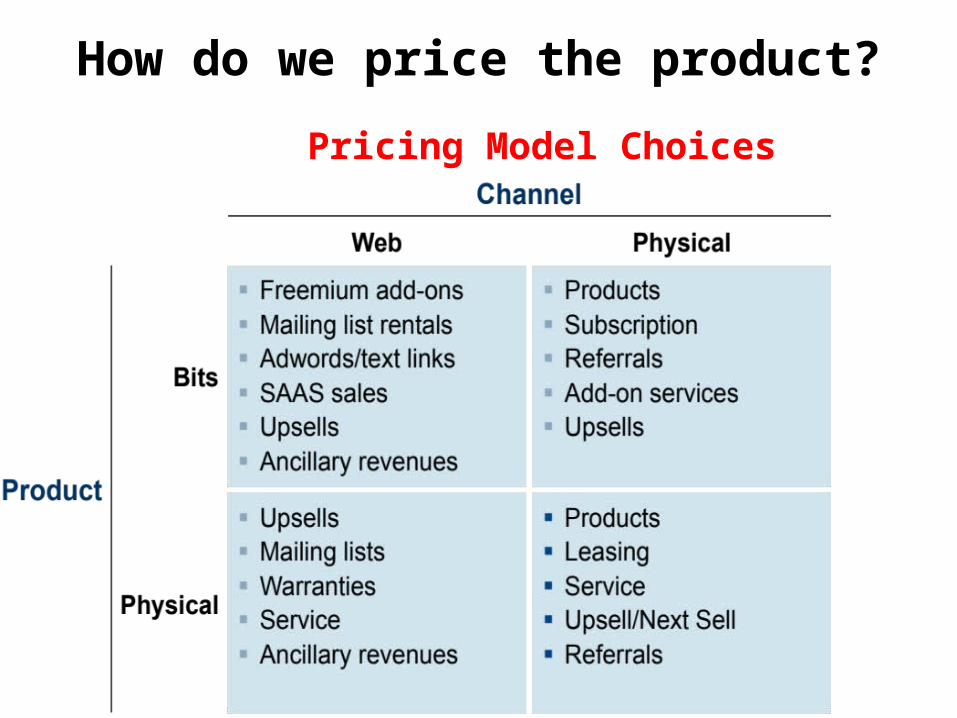
How do we price the product?
Pricing Model Choices
How do we price the product?
10
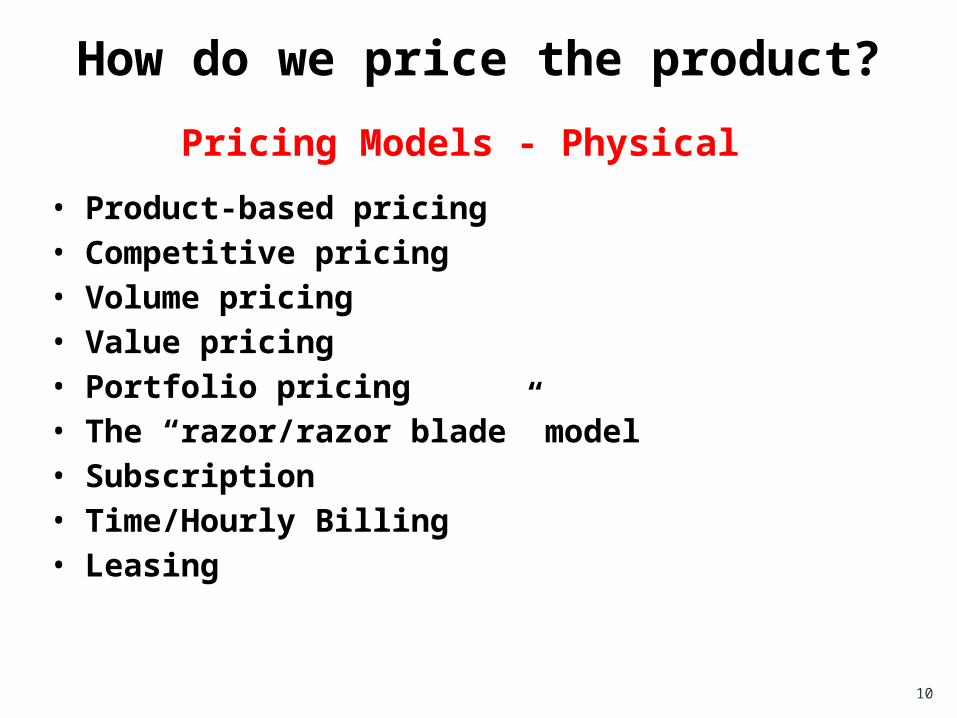
• Product-based pricing• Competitive pricing• Volume pricing• Value pricing• Portfolio pricing• The “razor/razor blade” model• Subscription• Time/Hourly Billing• Leasing
Pricing Models - Physical
11
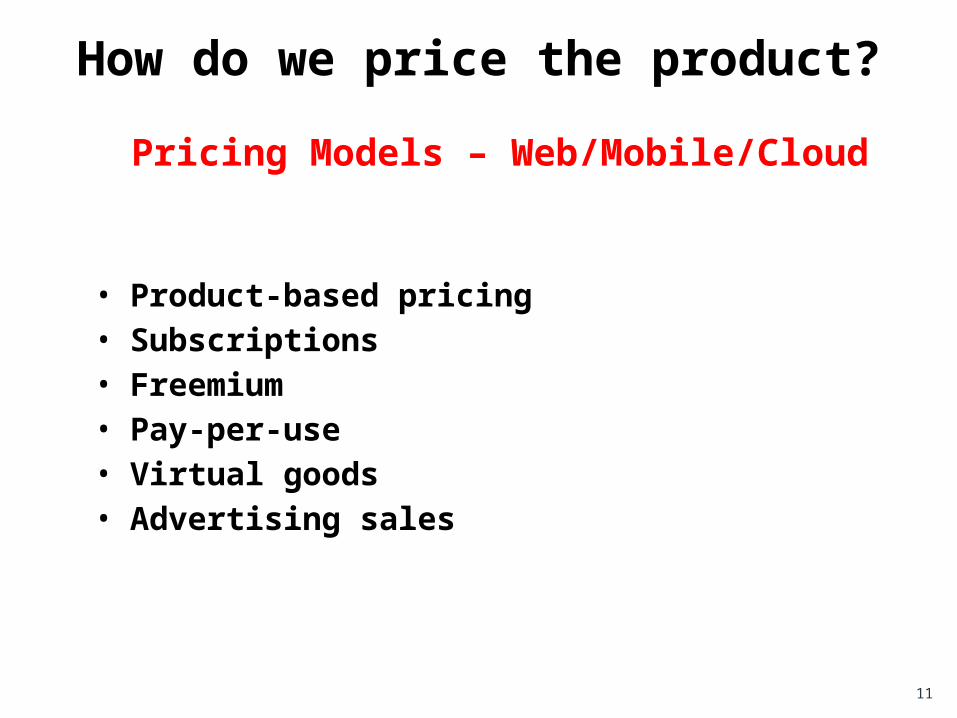
How do we price the product?
• Product-based pricing• Subscriptions• Freemium• Pay-per-use• Virtual goods• Advertising sales
Pricing Models – Web/Mobile/Cloud
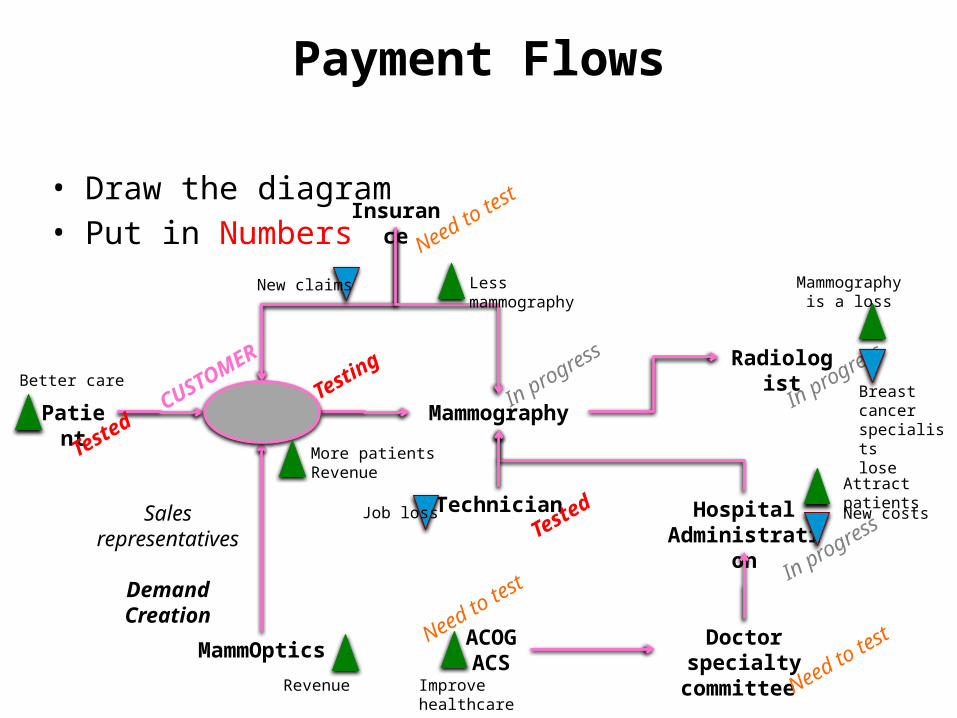
Payment Flows
• Draw the diagram• Put in Numbers
ACOG
ACS
Doctor specialty
committee
Hospital Administrati
on
Patient
Technician
Insurance
Radiologist
Mammography
PCPOB/GYN
MammOptics
Sales representatives
Demand Creation
CUSTOM
ER
Teste
dTe
sting
Need to
test
In progress
Teste
d
Need to
test
Need to
test
In progress
In progress
Less mammography
New claims Mammography is a loss
Breast cancer specialists lose
Job loss
Improve healthcare
Attract patients
New costs
Revenue
Better care
More patientsRevenue
Multi-side Markets and Revenue
• Single-sided markets that care about revenues
• Web-based Multi-sided markets may care about users first, revenues second
“Revenue First” Companies
• Time to doublings for monthly revenues• Key questions:
– When will I get to $100k/month in revenues?
– When will I get to $1M/month in revenues?– What assumptions about my business am I making when I
reach these milestones?
“Users First” Companies
If you say your business is advertising based:
• How do you get to 10M monthly users?• How do you become one of the top 5 websites visited?
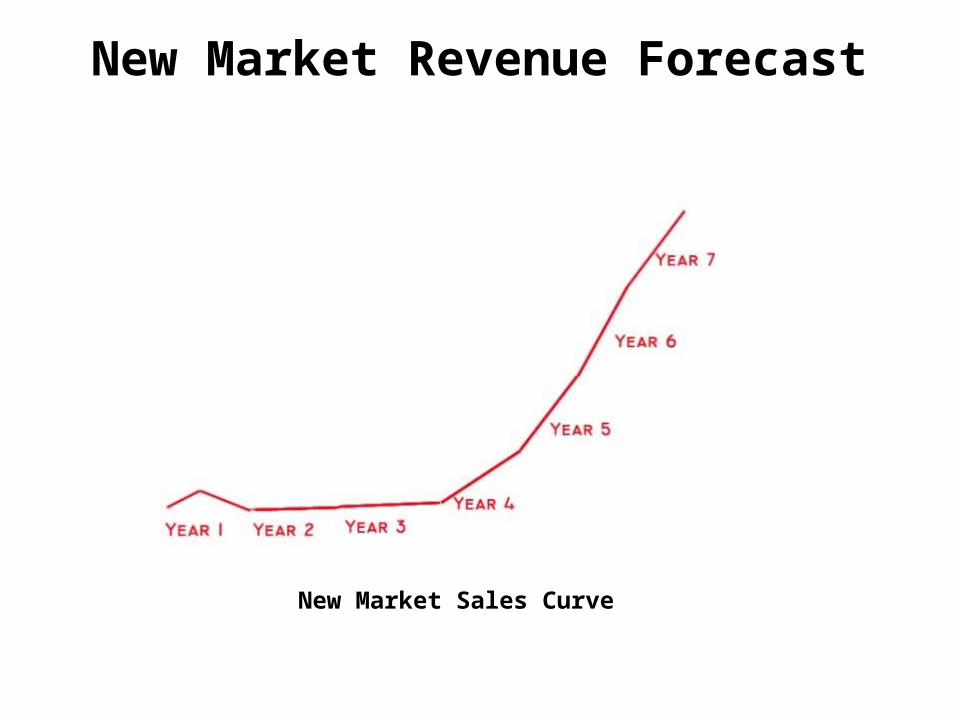
New Market Revenue Forecast
New Market Sales Curve
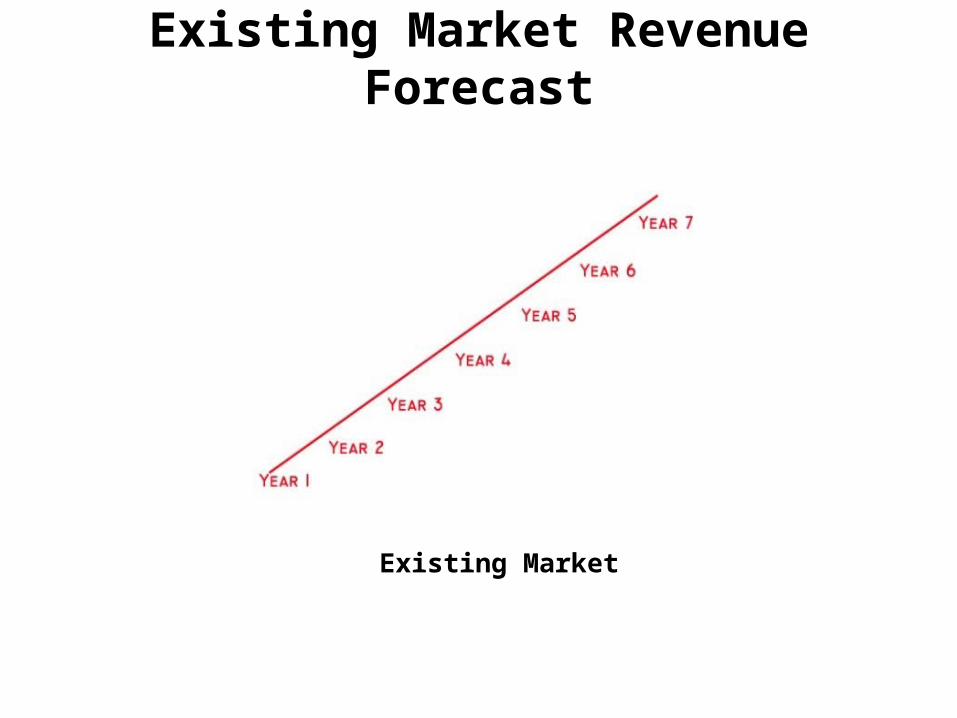
Existing Market Revenue Forecast
Existing Market
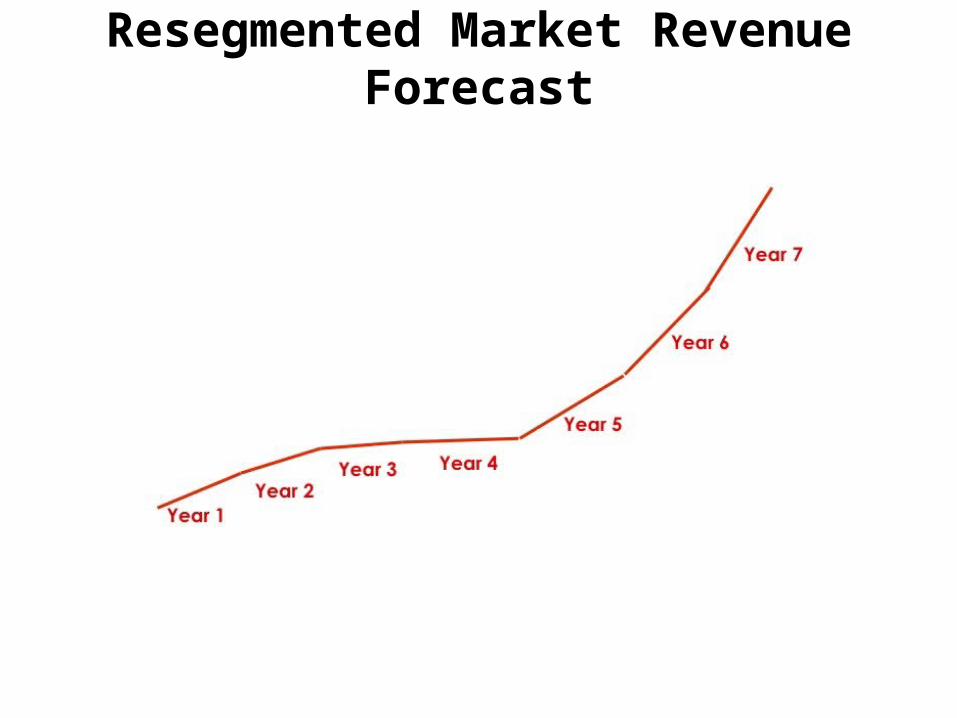
Resegmented Market Revenue Forecast
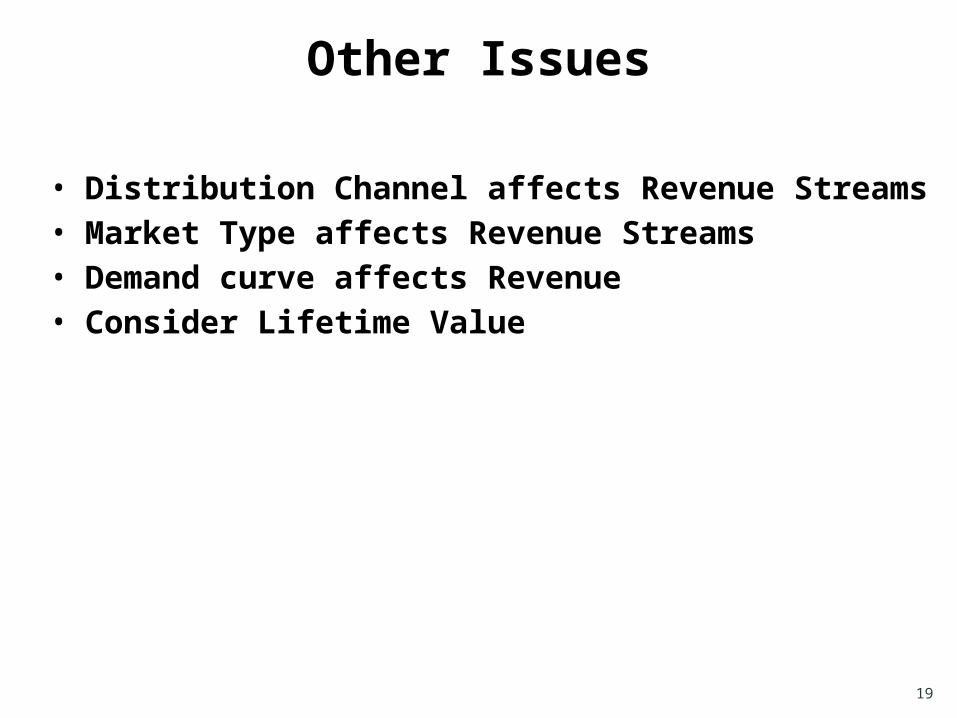
Other Issues
19
• Distribution Channel affects Revenue Streams • Market Type affects Revenue Streams • Demand curve affects Revenue • Consider Lifetime Value
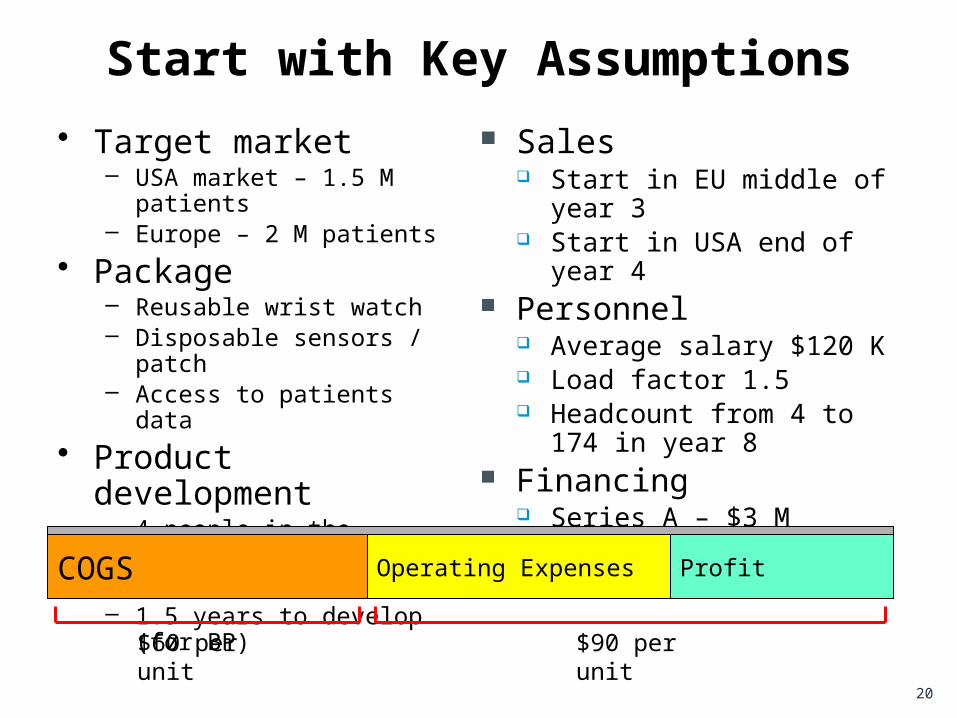
Start with Key Assumptions
20
• Target market– USA market – 1.5 M patients– Europe – 2 M patients
• Package– Reusable wrist watch– Disposable sensors / patch– Access to patients data
• Product development– 4 people in the beginning– $2 million– 1.5 years to develop (for BP)
Sales Start in EU middle of year 3 Start in USA end of year 4
Personnel Average salary $120 K Load factor 1.5 Headcount from 4 to 174 in
year 8 Financing
Series A – $3 M Series B – $10 M
Price per package: $150COGS Profit
$60 per unit $90 per unit
Operating Expenses
Does it add up?
21
• Is the revenue adequate to cover costs in the short term;• Are you confident the revenue will grow materially if not
dramatically over time; and• Does the profitability get better as the revenues get
bigger?
Team Deliverable for Next Week
• What’s your revenue model? • How will you price your products? • Draw the diagram of payment flows • What are your key financial metrics? • Test pricing 100 web customers 10/15 non web? • How do competitors price? • Assemble a rough income statement • Summarized in a 5 Minute PowerPoint Presentation


![Launchpad Mini [MK3]](https://img.pdfslide.us/doc/110x75/61bd4f1261276e740b117f87/launchpad-mini-mk3.jpg)