Embed Size (px)
Citation preview

S T A T E T O O L K I T F O R E X A M I N I N GP O S T - S C H O O L S U C C E S S
Facilitator’s Guide

2
ACKNOWLEDGEMENTS
The National Post-School Outcomes Center (NPSO), in collaboration with the National Secondary Transition Technical Assistance Center (NSTTAC) and the National Dropout Prevention Center for Students with Disabilities (NDPC-SD), developed the State Toolkit for Examining Post-School Success (STEPSS). We extend our appreciation to the many stakeholder groups (i.e., SEAs, LEAs, Technical Assistance Providers) for their generous ideas, support, and time in the development and piloting of STEPSS. Without their contributions, STEPSS would not have been possible. We also appreciate the work of Emberex, Inc., the software development company who brought our collective vision to fruition. Thank you.
STEPSS is a web-based, multi-phase process in which stakeholders: • Examine graduation, dropout, secondary transition components of the Individualized
Education Program (IEP), and post-school outcomes data; • Assess progress toward meeting targets in each outcome area listed above; • Select predictors of post-school success, and • Develop and implement an action plan designed to improve in-school, secondary
transition programs for students with disabilities. Purpose: STEPSS helps state and local educators, in partnership with other stakeholders, use secondary transition data (i.e., graduation, dropout, transition compliance of the IEP, and post-school outcomes) to improve in-school transition programs for youth with disabilities. Process: The State imports, to a secure web-based application, district aggregate level graduation (i.e., Indicator 1) and dropout (i.e., Indicator 2) data, de-identified case level transition component compliance (i.e., Indicator 13) data, and post-school outcome (i.e., Indicator 14) data for each district in the State. Through a secure log-in, State and District personnel are given access to the web-based application to download a slideshow of their district’s data. Using the slideshow, a facilitator guides stakeholders in a discussion about transition outcomes and post-school success of students with disabilities from the District. Procedure: Each phase of STEPSS can be stopped and started as needed. The time needed to implement a phase will depend on the pace of the stakeholder group, number of outcome areas identified for improvement, and details incorporated into the action plan. A facilitator develops a plan for conducting each phase within the context of the State or District. Once data are imported, the slideshow is viewed online via the Internet or downloaded for viewing offline; therefore, an Internet connection is not required to view the slideshow. For support using STEPSS, contact the National Post-School Outcomes Center at 541.346.8412.

3
Overview ……………………………………………………………………………………….. 4
Background Information …………..………………………………………………………….. 5
Conceptual Framework …..…………………………………………………………... 6
Data-Based Decision Making Model………………………………………………… 7
Understanding the STEPSS Process………………………………………………………... 8
Roles and Responsibilities of the Facilitator in STEPSS………………………………….. 10
Phase 1: Viewing and Discussing Data……………………………………………………... 14
Getting Started…………………………………………………………………………. 15
Leading the Stakeholder Discussion in Phase 1…………………………………… 17
Phase 2: Assessing Outcome Areas………………………………………………………… 23
Getting Started……………….………………………………………………………… 24
Leading the Stakeholder Discussion in Phase 2…………………………………… 28
Phase 3: Prioritizing Predictors………………………………………………………………. 30
Getting Started…………………………………………………………………………. 31
Leading the Stakeholder Discussion in Phase 3…………………………………… 37
Phase 4: Action Planning……………………………………………………………………... 39
Getting Started…………………………………………………………………………. 40
Leading the Stakeholder Discussion in Phase 4 …………………………………... 47
References …………………………………………………………………………………….. 49
Appendices……………………………………………………………………………………... 50
A- Sample Meeting Agendas…………………………………………………………. 51
B- Glossary of Terms …………………………………………..……………………... 56
C- Data Discussion Worksheet ……………………………………………………… 61
D- STEPSS Web Application Security………………………………………………. 64
E- STEPSS User License Agreement……………………………………………….. 66
F- Predictors of Post-School Success Aligned with Outcome Areas……….……. 69
G- Evidence-based Predictors of Post-School Success…………………………... 71
H- Evidence-based Practices in Secondary Transition …………………………… 84
TABLE OF CONTENTS

4
States’ accountability for implementation of the Individuals with Disabilities Education Improvement Act of 2004 is measured, in part, through Part B Indicators (see http://www2.ed.gov/policy/speced/guid/idea/bapr/index.html) reported in the State Performance Plan and updated yearly in the annual performance report. Collectively, the Indicators measure the extent to which states implement IDEA and achieve its purposes, one of which is “to ensure that all children with disabilities have available to them a free appropriate public education that emphasizes special education and related services designed to meet their unique needs and prepare them for further education, employment, and independent living…” (CFR §300.1(a)). Of the Part B Indicators, four relate specifically to secondary transition – graduation (Indicator 1), dropout (Indicator 2), transition focused compliant IEPs (Indicator 13), and post-school outcomes (Indicator 14). The interrelationship of these four Indicators suggest how transition-focused compliant IEPs help keep youth in school, get them to graduation, and ultimately lead to positive post-school outcomes (PSO). To help state and local education agencies use secondary transition data in a continuous improvement process, the National Post-School Outcomes Center (NPSO) in collaboration with the National Secondary Transition Technical Assistance Center (NSTTAC), and the National Dropout Prevention Center for Students with Disabilities (NDPC-SD) developed the State Toolkit for Examining Post-School Success (STEPSS). STEPSS is a web-based, multi-phase process enabling stakeholders to:
• Examine graduation, dropout, secondary transition components of the IEP, and post-school outcomes data;
• Assess progress toward meeting targets in each outcome area listed above; • Select predictors of post-school success, and • Develop and implement an action plan designed to improve in-school, secondary
transition programs for students with disabilities. The STEPSS Facilitator’s Guide prepares a state or district education leader to guide stakeholders through a discussion of their secondary transition data using STEPSS. The Facilitator’s Guide is organized into four sections: (a) Background Information – including conceptual frameworks underlying STEPSS, (b) Facilitation Strategies – including the role and responsibilities of the facilitator and preparing for meetings, (c) Phases of STEPSS – with detailed instructions for using STEPSS, and (d) Appendices with handouts.
OVERVIEW

5
BACKGROUND INFORMATION

6
Gather Data
Use Data
Improve Programs
Positive Post-‐School
Outcomes
ContinuousMonitoringPlan
Review & Interpret PPSS Data
Make Decisions & Plan Actions
Select & Implement EBP/PPSS
Use Data
Continuous Improvement
Planning
STEPSS’ Conceptual Frameworks is a Continuous Improvement Planning (CIP) process (Figure 1). The CIP process consists of gathering data and using data to improve in-school secondary transition programs that increase the likelihood of positive post-school outcomes for youth with disabilities. To verify if the changes made to improve programs actually resulted in positive post-school outcomes for youth, more data are collected and the process continues. Most states, and many local districts, have a CIP process in place; therefore, STEPSS should be a natural extension for these states and districts. Within STEPSS’ CIP process, gathering data refers to the secondary transition Indicator data – graduation (Indicator 1) and dropout rates (Indicator 2), compliance on transition component of the IEP (Indicator 13), and post-school outcomes (Indicator 14) – collected for reporting in the APR. Using data means viewing and interpreting secondary transition data by assessing the state or district progress toward meeting the targets; using data-based decision making to identify a local problem, and planning actions to alleviate or reduce the problem by selecting and implementing evidence-based predictors. Strategies for improving programs are identified through an action planning process to implement evidence-based practices (EBPs) and predictors of post-school success (PPSS).
CONCEPTUAL FRAMEWORKS
The four phases of STEPSS are designed to guide stakeholders through: (1) viewing data with stakeholders using the STEPSS slideshow, (2) assessing progress toward achieving targets in the outcome areas, (3) prioritizing predictors and essential program characteristics aligned with outcome areas, and (4) developing an action plan to implement the predictors. Throughout STEPSS, a data-based decision making (DBDM) model guides how decisions are made. That is, data and evidence – as opposed to instinct or how something feels – are used when making changes.
Figure 1: Continuous Improvement Planning

7
Figure 2: STEPSS DBDM Model Figure 2: STEPSS DBDM Model Figure 2: STEPSS DBDM Model Figure 2: STEPSS DBDM Model
DBDM consists of compiling, viewing, sharing, and using data to assist in improving schools and, particularly, student outcomes, whether in-school or post-school. DBDM grounds decisions in evidence. With evidence, educational professionals and stakeholders test assumptions, identify needs, and measure outcomes. Figure 2 shows the DBDM model for STEPSS and its fit within the context of the state, district, and school. STEPSS helps states and local district stakeholders transform the different types of data into information and actionable data, which in turn lead to decisions that drive program improvement for students with disabilities. Each element of the DBDM model is described briefly below. The types of data for decision-making are (a) input (student demographic data, specifically disability category, race/ethnicity, sex, and method of exit), (b) process (transition-focused component of the IEP), (c) outcome (graduation, dropout, and rates of post-school enrollment in postsecondary education and employment), and (d) satisfaction (student/teacher/parent). Not explicit to STEPSS, satisfaction data should be considered
when available. Data must be organized in a meaningful way to generate information. Within STEPSS, information means knowing the outcomes for different subgroups of youth with disabilities by viewing data graphically to identify patterns in youth’s in-school transition experiences and programs. Information becomes actionable knowledge when stakeholders synthesize information from various sources, apply judgment to prioritize it, and
consider the merits of different possible solutions. Using actionable knowledge, stakeholders make decisions based on data to drive program improvement. The types of decisions may vary based on the state, district, and school contexts, but may include: (a) addressing students’ access to transition programs and skill development, (b) prioritizing needs to improve post-school success, (c) setting goals and assessing progress, (d) developing a targeted action plan, (e) identifying and or reallocating resources, (f) enhancing processes to improve outcomes, (g) evaluating the effectiveness of a targeted action plan, and (h) assessing if needs are being met. STEPSS helps states and districts examine the various types of secondary transition data available, organize those data in a meaningful way to enable stakeholders to generate actionable data, and make decisions that improve in-school secondary transition programs for students with disabilities.
DATA-BASED DECISION MAKING
Adapted from: Marsh, Pane, & Hamilton (2006)
Figure 2. STEPSS DBDM Model
8
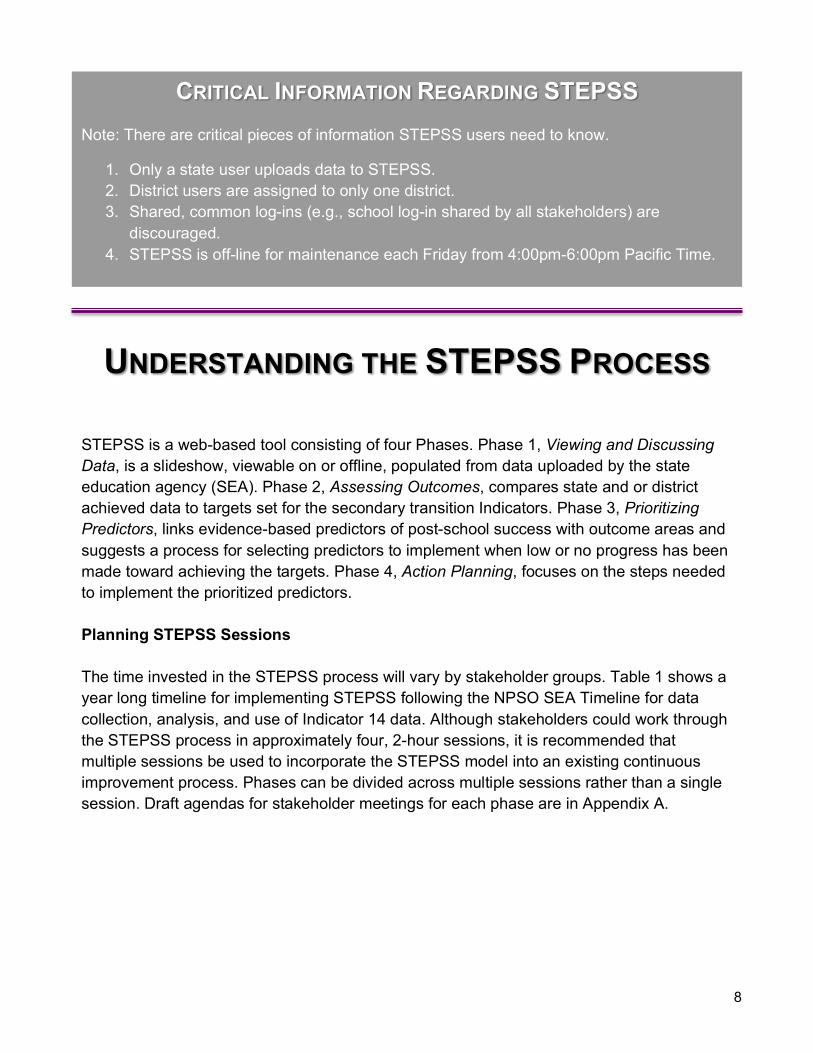
CRITICAL INFORMATION REGARDING STEPSS Note: There are critical pieces of information STEPSS users need to know.
1. Only a state user uploads data to STEPSS. 2. District users are assigned to only one district. 3. Shared, common log-ins (e.g., school log-in shared by all stakeholders) are
discouraged. 4. STEPSS is off-line for maintenance each Friday from 4:00pm-6:00pm Pacific Time.
UNDERSTANDING THE STEPSS PROCESS
STEPSS is a web-based tool consisting of four Phases. Phase 1, Viewing and Discussing Data, is a slideshow, viewable on or offline, populated from data uploaded by the state education agency (SEA). Phase 2, Assessing Outcomes, compares state and or district achieved data to targets set for the secondary transition Indicators. Phase 3, Prioritizing Predictors, links evidence-based predictors of post-school success with outcome areas and suggests a process for selecting predictors to implement when low or no progress has been made toward achieving the targets. Phase 4, Action Planning, focuses on the steps needed to implement the prioritized predictors. Planning STEPSS Sessions The time invested in the STEPSS process will vary by stakeholder groups. Table 1 shows a year long timeline for implementing STEPSS following the NPSO SEA Timeline for data collection, analysis, and use of Indicator 14 data. Although stakeholders could work through the STEPSS process in approximately four, 2-hour sessions, it is recommended that multiple sessions be used to incorporate the STEPSS model into an existing continuous improvement process. Phases can be divided across multiple sessions rather than a single session. Draft agendas for stakeholder meetings for each phase are in Appendix A.

9
Inviting Stakeholders
When deciding who to invite to a discussion about secondary transition data, consider who needs to hear about the outcomes of youth with disabilities and who can contribute to making improvements to in-school programs. Consider the following:
• Who can identify challenges to positive outcomes for youth? • Who can suggest solutions for overcoming challenges? • Who has the decision-making authority to change existing policies and procedures? • Who has a vested interest in the rates of graduation and dropout, compliance of the
transition component of the IEP, and employment and enrollment in further education of youth with disabilities?
Representatives from these groups are the people to invite to be part of the solution. Below are people to consider:
General and special educators Parents Personnel from support
agencies (e.g., Vocational Rehabilitation, Mental Health/Developmental Disabilities, community college or university representatives)
Young adults with disabilities School administrators (e.g., principals)
School guidance counselors Local labor/business leaders Support personnel (e.g., transition
specialists, job coaches)

10
Meeting Facilities and Equipment Select a location to comfortably accommodate the number of people invited to view the secondary transition data. A room with the following equipment is needed:
• Computer, Screen, and LCD projector [for optimal resolution, it is recommended the LCD projector be 1280 x 800 resolution]
• Internet connection or the STEPSS slideshow downloaded for viewing offline • Chart paper, markers, and blue painter’s tape • Refreshments (optional)
Note: Although STEPSS is a web-based tool and the slideshow can be viewed online using an Internet connection, it can also be downloaded and viewed offline. Other Phases of STEPSS require an Internet connection.
Meeting Handouts For each meeting, prepare necessary copies of STEPSS Handouts. Below is a general list of handouts with descriptions. Additional handouts may be necessary for each phase. o Meeting Agenda: helps to organize meeting and keep the team focused and moving
forward (Samples in Appendix A). o Glossary of Terms: defines key terminology related to the Indicators and terms used in
STEPSS. The SEA should add state-specific terms and definitions as appropriate (Appendix B).
o Data Discussion Worksheet: facilitates stakeholders recording observations while discussing data during the slideshow (Appendix C and as .pdf in Assessing Outcome Areas online).
o Data Slides Printed in Color: facilitates viewing data more easily when displays are not projected or difficult to view on a projected screen.
ROLES AND RESPONSIBILITIES OF THE
FACILITATOR IN STEPSS The role of the facilitator in STEPSS is one of visionary, conductor, problem solver, and historian. As a visionary, the facilitator sees the need to consider secondary transition indicator data holistically and the potential these data, and other data as appropriate, have for improving programs for youth with disabilities. As conductor, the facilitator organizes stakeholders and arranges the logistics of the meetings. Through experience with STEPSS, the facilitator becomes a problem solver, both when leading the stakeholders in discussion and helping others new to the STEPSS tool. Over time, the facilitator becomes the historian, relaying the discussions and decisions from one stakeholder to the next and ensuring the decisions are infused into the state or district’s continuous improvement model as appropriate.

11
Prior to the stakeholder meeting, the facilitator is responsible for, and/or contributes to, setting the timeline for STEPSS meetings, identifying stakeholders, and arranging the meetings. During the meeting, the facilitator makes important contributions to the group’s work and outcomes. The facilitator assists in defining the group’s purpose and moving seamlessly through the STEPSS’ process. The facilitator encourages full group participation, keeps the group on task, and manages any conflicts that arise. The facilitator guides the group to consensus related to (a) what the data reveal, (b) progress the state/district is or is not making, and (c) strategies to improve outcomes of youth with disabilities (Bowerman, Kohler, Coyle, Gothberg, & Shadrick, 2010; Nebraska Department of Education, 2012). To fulfill these roles and responsibilities, the facilitator needs to do some pre-meeting preparation. The information and suggestions that follow are designed to help a local leader prepare to facilitate STEPSS.
• Understand the objectives and intended outcomes for each phase of STEPSS and how each phase fits into the State’s or District’s continuous improvement model.
• Understand the STEPPS process holistically, how and why the phases build on each other, and the ultimate utility of STEPSS for improving secondary transition programs.
• Understand the potential each stakeholder has to contribute to the decision-making process, why each stakeholder’s participation is important, and communicate this information to the group so all stakeholders are valued and their input is heard during the meetings.
• Become comfortable navigating the STEPSS tool and using the materials in order to guide other users through the tool.
• Be prepared to answer questions about STEPSS security measures (Appendix D).
Facilitating a Stakeholder Group Facilitating any stakeholder meeting requires pre-meeting preparations and STEPSS is no different. Prior to a stakeholder meeting, the facilitator reviews the slideshow and each phase of STEPSS, as well as prepares and reviews materials. During the actual meeting, using specific strategies and activities, the facilitator leads stakeholders through the STEPSS process. Below are strategies to help lead the meeting.
Set Ground Rules. Ground rules help set the working context of the meeting. These could include, but are not limited to, the following:
o Ensure confidentiality of data especially when examining outcome areas with small numbers of youth.
o Decisions will be made by consensus. o Attend all meetings and be on time. o Respect others’ ideas and recommendations.
Remember: When facilitating a stakeholder group that is examining a small district, it is important to remind stakeholders to respect the confidentiality of data especially when examining outcome areas with small numbers of youth.

12
Use Flipcharts. The flipchart is an important facilitator tool for recording relevant information as it is generated during the discussion. Flipcharts facilitate group memory. Posting flipcharts around the meeting room allows participants to refer back to key points or decisions made during the meeting. Participants become more engaged, and there is greater group collaboration and interaction. Flip charts provide a visual record that captures the group’s thoughts so they are not lost, and it also lets people know their ideas have been heard. Flipcharts help consolidate the stakeholder group’s agreement on next steps and can be referred to in subsequent meetings to remind group members of previous discussions. Guide Teams to Make Decisions. The goal of stakeholder participation is to make a decision that best reflects the thinking of its members, thus forging consensus. Consensus is defined as “a decision in which everyone participates and with which everyone can live with and support” (Bowerman et al., 2010, p. 29). Building consensus takes time; ensure stakeholders have adequate time to discuss issues, work out any differences, and find areas of common agreement. This will be really important in Phases 1 and 2 of STEPSS, as stakeholder groups begin to define a focus area for improvement. For more information on consensus building see The Complete Toolkit for Building High-Performance Work Teams (Golden & Gall, 2000). Pre-Meeting Preparations for Facilitator
The preparations described below are consistent for each meeting. Additional preparations specific to a given meeting are provided in subsequent descriptions.
• Review the phase being presented at the meeting, anticipating where questions or concerns may arise as stakeholders review and discuss the information.
• Become knowledgeable about district or school specific secondary transition data (Indicators 1, 2, 13, & 14).
• Identify questions to ask during the stakeholder meeting to prompt discussion. • Prepare a roster and sign-in sheet, if needed. • Secure a projector and screen or monitor to display STEPPS for the group. • Prepare the agenda, modified to meet the group’s needs. Appendix A includes
sample agendas for each Phase. • Distribute the agenda to stakeholders at least one day prior to the meeting to inform
them of meeting expectations.
Sample Agenda for Stakeholder Meeting 1: Viewing and Discussing Data • Welcome and Introductions • Overview of STEPSS • Purpose and Materials • Establish ground rules • Identify official recorder to summarize notes on Data
Discussion Worksheet • View STEPSS slideshow • Review discussion notes and group decisions • Set next meeting

13
Begin the Stakeholder Meeting • Introduce yourself (if needed), providing background information. • Have participants introduce themselves. • Introduce the meeting:
o Explain the purpose of the meeting. o Review the meeting schedule. o Establish Ground Rules. o Review the agenda. o Distribute meeting materials, if applicable. o Present the objectives or intended outcomes of the meeting. o Provide an overview of the STEPSS process and upcoming activities.
The following sections will provide guidelines for facilitators to guide stakeholders through the STEPSS process. Accessing STEPSS Security The STEPSS web application housed at the University of Oregon implements several security features. Among these are a valid login and password for every user, a valid session for every user, password encryption, and all traffic between the web browser and the server is encrypted and sent over HTTPS. Additionally, a firewall restricts public access to encrypted web traffic only and server access to specific IPs. See Appendix D for details of the security features. Call NPSO staff with specific security questions.
Log-in A log-in and password are required. State users are associated with only one state. Each district user is associated with one state and one district. State users cannot see district plans, and district users cannot see other users’ plans, even those in the same district. State users should contact NSPO to obtain a state log-in and password. A state user must upload log-in information for district users. District users should contact their state transition contact or state director of special education to obtain a log-in and password. Log-in at https://stepss.uoregon.edu/. First time users must agree to the User License Agreement (Appendix E). The User License Agreement grants permission for STEPSS to be used for non-commercial education and research purposes only. It also grants permission to the University of Oregon and its designees to use information entered into STEPSS for secondary research purposes. The system records who accepted the User License Agreement and agreement is only required once.
The remainder of the STEPSS Facilitator’s Guide assumes the state education agency has uploaded data to STEPSS and disseminated login and password to district facilitators.

14
PHASE 1: VIEWING AND
DISCUSSING DATA
15
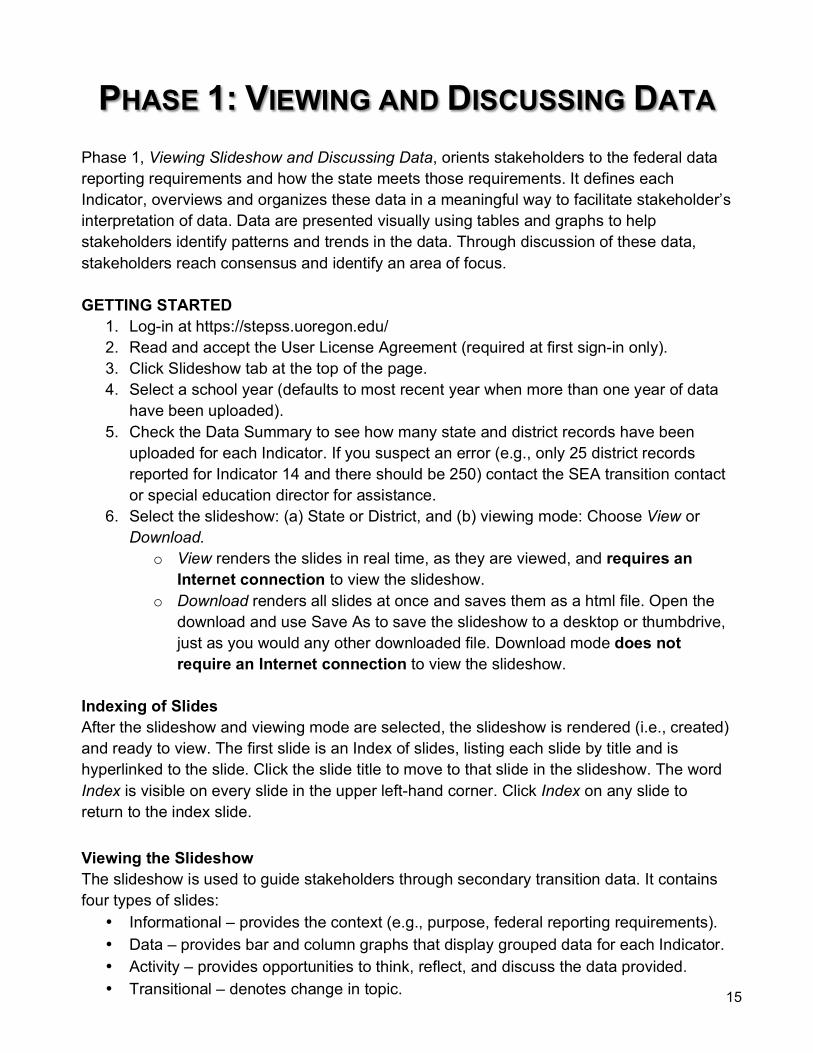
PHASE 1: VIEWING AND DISCUSSING DATA Phase 1, Viewing Slideshow and Discussing Data, orients stakeholders to the federal data reporting requirements and how the state meets those requirements. It defines each Indicator, overviews and organizes these data in a meaningful way to facilitate stakeholder’s interpretation of data. Data are presented visually using tables and graphs to help stakeholders identify patterns and trends in the data. Through discussion of these data, stakeholders reach consensus and identify an area of focus. GETTING STARTED
1. Log-in at https://stepss.uoregon.edu/ 2. Read and accept the User License Agreement (required at first sign-in only). 3. Click Slideshow tab at the top of the page. 4. Select a school year (defaults to most recent year when more than one year of data
have been uploaded). 5. Check the Data Summary to see how many state and district records have been
uploaded for each Indicator. If you suspect an error (e.g., only 25 district records reported for Indicator 14 and there should be 250) contact the SEA transition contact or special education director for assistance.
6. Select the slideshow: (a) State or District, and (b) viewing mode: Choose View or Download.
o View renders the slides in real time, as they are viewed, and requires an Internet connection to view the slideshow.
o Download renders all slides at once and saves them as a html file. Open the download and use Save As to save the slideshow to a desktop or thumbdrive, just as you would any other downloaded file. Download mode does not require an Internet connection to view the slideshow.
Indexing of Slides After the slideshow and viewing mode are selected, the slideshow is rendered (i.e., created) and ready to view. The first slide is an Index of slides, listing each slide by title and is hyperlinked to the slide. Click the slide title to move to that slide in the slideshow. The word Index is visible on every slide in the upper left-hand corner. Click Index on any slide to return to the index slide.
Viewing the Slideshow The slideshow is used to guide stakeholders through secondary transition data. It contains four types of slides:
• Informational – provides the context (e.g., purpose, federal reporting requirements). • Data – provides bar and column graphs that display grouped data for each Indicator. • Activity – provides opportunities to think, reflect, and discuss the data provided. • Transitional – denotes change in topic.

16
Navigating the Slideshow Clicking, or touching on a touch screen, advances slides. Right and left keyboard arrows move slides forward and back, respectively. Right clicking on a mouse does not move slides. Interpreting Data Displays Throughout STEPSS, data are displayed in graphs. Displaying data visually can facilitate accurate and efficient interpretations of data while minimizing the likelihood of misrepresenting data. Patterns are more easily visible when data are viewed in graphs than in data tables or narrative description. Many individuals learn better through pictures than words; graphs help people remember information. When leading discussions about data using the graphs, remind stakeholders what data are displayed by reading the vertical (Y) and horizontal (X) axes (e.g., this is the percent of IEPs with transition assessment results connected to each postsecondary goal area). Throughout Phase 1, graph titles follow this pattern. Encourage stakeholders to look for patterns across columns or graphs rather than trying to read individual percentages. To facilitate this, ask stakeholders to identify the category with the highest or lowest percentage. Ask whether the same pattern is seen across categories of students or postsecondary goal area. Encourage stakeholders to capture notes about patterns in the data on the Data Discussion Worksheet.
Important: Graphs for the Indicator 13 elements of a compliant IEP (e.g., measureable goals, updated annually) represent the percent of IEPs that were found to be compliant for each individual component. An IEP is determined to be compliant or not compliant for each component. If all eight components are compliant, then the IEP is deemed compliant. If one component is deemed not compliant, the IEP is deemed not compliant. The State or District overall compliance rate is determined by dividing the total number of compliant IEPs by the total number of IEPs reviewed and cannot be averaged. For example, a district reviews two IEPs for Indicator 13 using the NSTTAC Checklist A. IEP #1 is compliant on all eight questions of the Checklist, thus it is deemed a compliant IEP. IEP #2 is compliant on seven of the eight questions on the Checklist, thus it is deemed a non-compliant IEP. Therefore, the district’s overall compliance for these two IEPs is 50% (1 compliant IEP divided by total number of IEPs reviewed, 2).
Developing a Focus Statement The purpose of a focus area statement is to help identify the group/s of youth and/or outcomes that will be the focus of the action plan. Using notes captured on the chart paper for each outcome area (e.g., Indicator 1, 2, 13, 14), lead a discussion to identify a group of students, when possible, and/or the specific outcome area for the focus statement. Draft focus statements on chart paper with stakeholder input while viewing each outcome area in the slideshow. Use the questions on the Data Discussion Worksheet to prompt discussion. Specifically describing the problem area, and group of students experiencing the problem, will make it easier to identify solutions and strategies to improve practice.

17
LEADING THE STAKEHOLDER DISCUSSION IN PHASE 1 Begin the STEPSS slideshow. There are discussion points noted throughout the slideshow (e.g., slide number 32).
• Start the discussion by posing the question listed on each slide in the slideshow. • Wait for a response (e.g., 15 seconds). If no one comments, then rephrase the
question. • Ask more specific questions as the discussion evolves. • At the points noted in the slideshow, refer group to the Data Discussion Worksheet to
document patterns in data or other notes for each of the areas (i.e., graduation, dropout, transition components of the IEP, post-school outcomes).
• Engage all participants in the discussion. • Document discussion on flip charts for use in Phase 2 of STEPSS. • Record on the flipchart group consensus of documented patterns or trends in the
data that are generated during meeting. • Schedule the next meeting.
Table 2 contains the slide number, type of slide, and background information for each slide. Use this information, along with viewing the slideshow, to become familiar with STEPSS’ content.
Table 2. Description of each slide
SLIDE TYPE OF SLIDE Slide Content
1-6 Informational These slides set the context for viewing the slideshow. They describe the meeting purpose and materials and the federal reporting requirements that are the impetus for the Indicators and the STEPSS tool.
7 Activity Indicator specific language is not intuitive. A Glossary of Terms is in Appendix B. Provide the Glossary to stakeholders in advance of the meeting. During the meeting, spend a few minutes reviewing definitions for graduation, dropout, higher education, competitive employment, other post-secondary education, some other employment, and not engaged. Taking the time to ensure everyone understands these terms from the beginning will facilitate conversation and decision-making later.
8 Informational This is one purpose of IDEA. States’ implementation of IDEA 2004 is measured, in part, by data collected relevant to graduation, dropout, transition component, and post-school outcomes.

18
SLIDE TYPE OF SLIDE Slide Content
9 Activity Use a Think, Pair, Share activity with stakeholders to identify why secondary transition data are important. Ask participants to think of reasons why graduation, dropout, transition component of the IEP, and post-school outcomes (i.e., secondary transition) data are important to know. Ask participants to pair with a partner to compare their thoughts. Call on pairs to share, with the whole group, their thoughts. Record the share-out of pairs on chart paper and post around the room as a reminder during the discussion.
10 Informational This slide depicts the four Indicators as a logic model. A simple logic model illustrates the process by which change (i.e., increased graduation, decreased drop-out, and positive post-school outcomes) is expected to occur and the connection the quality transition IEP component has to producing this change.
11 Informational Introduces the Data Discussion Worksheet. Copy the labels of the Worksheet onto sheets of chart paper. As each section of data is reviewed, take time to capture the group’s collective thoughts on the chart paper to facilitate discussion later when identifying the focus group. Notes captured on the Data Discussion Worksheet may refer to additional data needed (e.g., “need more data on graduation rates by gender” or “need graduation and dropout rates disaggregated by individual schools”), or they may identify specific groups of leavers or specific outcomes that need attention (e.g., youth need to be invited to their IEP meetings).
12 Transitional Indicators 1 and 2: Graduation and Dropout 13 Data Review or remind stakeholders of the state definition of “Graduate”. The
term, “All students”, refers to students with and without disabilities in one combined group. The term, “Nondisabled students” refers only to students without disabilities.
14 Data Shows a comparison between the district and state median graduation rates. Medians, rather than averages, are used to equalize the extreme highs and lows in the rates.
15 Informational Review or remind stakeholders of the state definition of “Dropout”. The term, “All students” refers to students with and without disabilities. The term, “Nondisabled students” refers only to students without disabilities.
16 Data Shows a comparison between the district and state median dropout rates. Medians are displayed to equalize the extreme highs and lows in the rates.
17 Activity After discussion of state and district graduation and dropout rates, encourage stakeholders to record their observations on the Data Discussion Worksheet. Also, record group consensus decisions on designated chart paper.
18 Transitional Indicator 13: Compliant Transition Component of the IEP

19
SLIDE TYPE OF SLIDE Slide Content
19 Informational If necessary, explain that NSTTAC is the National Secondary Transition Technical Assistance Center funded by the Office of Special Education Programs. Provide a copy of the checklist used by the state to determine whether the IEP of students age 16 and older is compliant. If the state uses a checklist other than one of the NSTTAC Checklists, review it with stakeholders and explain how it is different from NSTTAC’s.
20 Data Shows the state and district compliance rates for the transition component of the IEP.
21 Data Displays a graph of the district’s compliance for each element on the NSTTAC Checklist A. The first bar on the graph shows the district’s overall compliance. With stakeholders, identify areas at 100% compliance and areas not at 100% compliance. Use the Data Discussion Worksheet to make notes of the most problematic elements of the component.
22, 23 Informational Explains the benefit of disaggregating the overall transition compliance percentage into the four postsecondary goal areas (education, training, employment, and independent living).
24-31 Data Displays a graph of District’s compliance on each element of the NSTTAC Checklist B disaggregated by the four postsecondary goal areas of education, training, employment, and independent living. *Note: The first column in the graph is the District’s overall average for that element of the transition component. The percentage shown in the first column should match what is displayed in corresponding column in the graph on slide 21. If it does not match, contact your state transition specialist. The four columns to the right of the first column show compliance by postsecondary goal area. The average of these columns will not equal the percentage in the first column. To illustrate, think of a compliant IEP coded as a 1 and non-compliant coded as a 0. For each component on the checklist, an IEP will be coded as a 1 or 0. To be coded as a 1, the IEP must be compliant in each goal area (all 4 columns to the right of the first). To be coded a 0, an IEP is non-compliant in one or more postsecondary goal areas (1 to 4 columns to the right). This method of coding precludes averaging across columns. Discuss with the group which element/s of the transition component meet compliance and which element/s are not at 100% compliance. Remember: Indicator 13 is a compliance Indicator. The expectation is that every IEP will be compliant with the requirements specified in IDEA; therefore, the target on each element of the transition component of the IEP is 100%.
Note: If the state uses NSTTAC Checklist A for Indicator 13 (eight questions only), these slides will show only the overall average (first column) and not the columns for the four postsecondary goal areas. As a facilitator, explain why the graphs are not visible and go to slide 32.
20
SLIDE TYPE OF SLIDE Slide Content
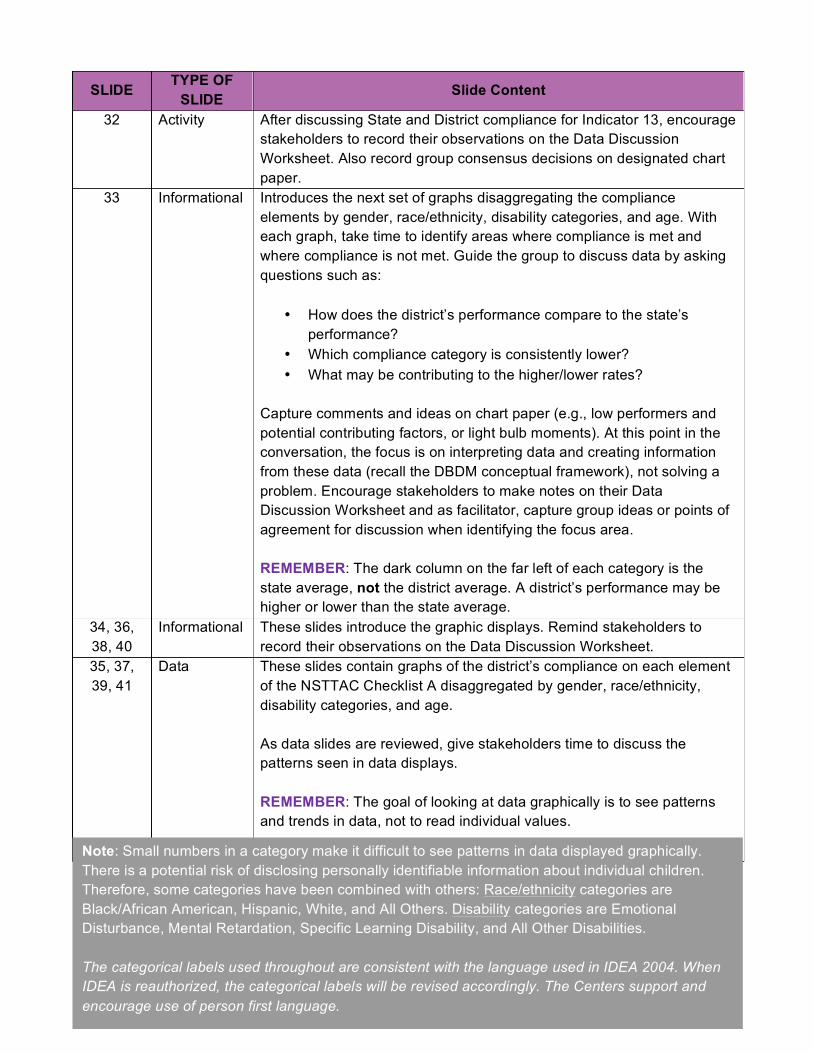
32 Activity After discussing State and District compliance for Indicator 13, encourage stakeholders to record their observations on the Data Discussion Worksheet. Also record group consensus decisions on designated chart paper.
33 Informational Introduces the next set of graphs disaggregating the compliance elements by gender, race/ethnicity, disability categories, and age. With each graph, take time to identify areas where compliance is met and where compliance is not met. Guide the group to discuss data by asking questions such as:
• How does the district’s performance compare to the state’s performance?
• Which compliance category is consistently lower? • What may be contributing to the higher/lower rates?
Capture comments and ideas on chart paper (e.g., low performers and potential contributing factors, or light bulb moments). At this point in the conversation, the focus is on interpreting data and creating information from these data (recall the DBDM conceptual framework), not solving a problem. Encourage stakeholders to make notes on their Data Discussion Worksheet and as facilitator, capture group ideas or points of agreement for discussion when identifying the focus area. REMEMBER: The dark column on the far left of each category is the state average, not the district average. A district’s performance may be higher or lower than the state average.
34, 36, 38, 40
Informational These slides introduce the graphic displays. Remind stakeholders to record their observations on the Data Discussion Worksheet.
35, 37, 39, 41
Data These slides contain graphs of the district’s compliance on each element of the NSTTAC Checklist A disaggregated by gender, race/ethnicity, disability categories, and age. As data slides are reviewed, give stakeholders time to discuss the patterns seen in data displays. REMEMBER: The goal of looking at data graphically is to see patterns and trends in data, not to read individual values.
Note: Small numbers in a category make it difficult to see patterns in data displayed graphically. There is a potential risk of disclosing personally identifiable information about individual children. Therefore, some categories have been combined with others: Race/ethnicity categories are Black/African American, Hispanic, White, and All Others. Disability categories are Emotional Disturbance, Mental Retardation, Specific Learning Disability, and All Other Disabilities. The categorical labels used throughout are consistent with the language used in IDEA 2004. When IDEA is reauthorized, the categorical labels will be revised accordingly. The Centers support and encourage use of person first language.

21
SLIDE TYPE OF SLIDE Slide Content
42 Activity A focus area statement helps identify the group/s of youth and outcome area/s that will be the focus of the action plan. Narrowing the focus enables resources to be used strategically. Guide stakeholders to identify collectively: (1) Which element/s of compliance needs attention, and (2) Which subgroup of students need further attention. Use consensus building strategies to reach a decision that everyone can support. Take time to discuss the patterns stakeholders observed in the data. If there has been a lot of discussion to this point, consider dividing the group into small groups of 3 or 5 to give them time to discuss and share their observations. Review thoughts and notes captured on chart paper.
43 Transitional Indicator 14: Post-School Outcomes 44 & 45
Informational Explains how post-school outcomes data are collected in the state and
what data are collected when. The state may collect more data than what is reflected on the slide. If that is the case, be sure to explain what data are collected in and out of school.
46 Data Describes the state’s overall engagement rate for PSO and percent of youth not engaged, number of total leavers, response rate, and method used to collect PSO data.
47, 49, 51, 53
Informational Reminds people to use the Data Discussion Worksheet.
48 Data Contains a graphic display of State and District overall engagement rates disaggregated by five PSO areas: higher education, competitive employment, other postsecondary education or training, some other employment, and not engaged.
50, 52, 54
Data Contains graphic display of District engagement rate of five post-school outcome areas by demographic categories: gender, race ethnicity, and disability categories. Explain that collapsing categories is needed when there is a small number of leavers in some categories. Obtain, or know where to obtain, the numbers in each category to discuss as needed.
55 Activity Review any decisions made during the discussion of data. Each stakeholder should have completed a Data Discussion Worksheet during the discussion. There may be multiple areas to address. Group dynamics will dictate whether to develop a collective focus area statement or take time to think about the information learned and/or gather additional data before starting Phase 2. If the group is ready and there is a clear direction evident from the data, help the group reach consensus and draft a focus area statement. Use group consensus-building strategies if needed. If the group needs time to think about the information and or gather additional information, take a few minutes to capture the group decisions on chart paper.

22
SLIDE TYPE OF SLIDE Slide Content
56 Informational Conclude the meeting by reviewing and summarizing what was accomplished in the meeting.
57 Informational Wrap-up: describe what was accomplished in the meeting. 58 Informational Set the stage for future meetings by briefly describing the remaining
phases of STEPSS. 59 END Thank each stakeholder for his time and contribution to the discussion.
Set or announce the next meeting date.
Navigating Remaining Phases
These navigation techniques are applicable for the REMAINDER of the STEPSS phases:
• Click Jump to another Indicator or Outcome Area to move forward and back between
Indicators or Outcome Areas.
• Click [+] Need help? button to reveal additional information about that particular Phase. A
second click hides the help text.
• Click Next> or <Previous to move forward or back one screen at a time. Any changes made
on the page are automatically saved.
Recall from the DBDM model, data must be organized in a meaningful way to generate information. Together, Viewing and Discussing Data and Assessing Outcome Areas set the stage and move secondary transition indicator data from simply data to data for making data-based decisions. Phase 2: Assessing Outcome Areas is described next.

23
PHASE 2: ASSESSING OUTCOME
AREAS
0
10
20
30
40
50
60
70
80
90
100
Year 1 Year 2 Year 3
% achieved
Target Outcome

24
Phase 2, Assessing Outcome Areas, helps stakeholders do three things: (1) identify any gap(s) between the achieved percentage and the desired (i.e., targeted) percentage for each secondary transition Indicator; (2) rate district progress toward reaching the target; and (3) develop a focus statement identifying a specific group of students and outcome area for the focus of district resources. State and district percentages and the state desired target are data entered by the SEA. The district’s desired target is determined and entered by district stakeholders. If the district has targets for each outcome area documented elsewhere, discuss the appropriateness of using those targets. The purpose of Assessing Outcome Areas is to prompt a discussion of the progress made toward achieving the desired percentage. GETTING STARTED
• Log-in at https://stepss.uoregon.edu/ • Select Action Plan tab at the top of the page • Select Assessing Outcome Areas
After reviewing the percentage and target for each Indicator, stakeholders rate the progress made toward achieving the target. An Outcome Assessment Summary page is created for each Indicator. Also located on this page is the .pdf of the Data Discussion Worksheet. Next, each step of Assessing Outcome Areas is described. It is assumed stakeholders will work through this Phase as a group, not individually; therefore, group meeting preparations are provided. Figure 1 shows a screenshot of the Assessing Outcome Areas layout. The page contains the language of each Indicator as set by the Office of Special Education Programs (OSEP). When Indicators have subcomponents, such as the eight elements of Indicator 13, and engagement areas for Indicator 14, progress on each subcomponent is rated separately. The phrases Indicator 1 of 4 and Indicator outcome category 1 of X serve as a map showing where users are in the Assessing Outcome Areas’ process.
PHASE 2: ASSESSING OUTCOME AREAS
Figure 1. Assessing Outcome Areas

25
STEPS TO ASSESSING OUTCOME AREAS Identifying any gaps. State and District Outcome Percentages are the achieved percentage on the most recent data collection for the state and district. State Percentage is an aggregate of all relevant districts (i.e., census or sample) for that year’s data collection and is entered by the State; a District cannot change State percentages. District Percentage is specific to the individual district. If the State uses a sampling of districts, meaning data are collected from some, not all, districts every year, ask when these data were obtained last from this District. These data may be the District’s data collected 2, 3, or more years prior. Alternately, these data may be aggregated data collected from districts with a common demographic characteristic, such as size of District, region of the State, and/or community size (e.g., rural/urban). Desired Percentage is the State’s target percentage as set for reporting to OSEP. Setting the District Desired percentage could happen in a variety of ways. The State Department of Education may set targets for the District, District Central Office staff may set targets, or a District level stakeholder group could set targets. Set an achievable, yet rigorous, target by calculating the number of youth needed in a particular category in order to make a difference in the category’s percentage. For example: if there are 200 students ages 16 and above with IEPs and the achieved percentage of youth invited to their IEP meeting is 93%, that is 186 of the 200, only 14 more students need to be invited to their IEP meeting to reach the desired target of 100%. By converting percentages to the number of students to target, DBDM becomes more manageable. It becomes easier to think about identifying 14 students for a specific intervention than all 200 students. REMEMBER: The target percentage for all elements of Indicator 13 is 100%; therefore, the percentage is defaulted to 100% for both State and District targets in Indicator 13. Similarly, the desired target for the percent of youth not engaged is defaulted to 0% in Indicator 14. The purpose of Accessing Outcome Areas is to prompt a discussion of the progress made toward achieving the desired percentage. STEPSS will display multiple years of data. If additional years of data are available in the District, include these data in the discussion. Rating District Progress. After comparing State and/or District percentages to the desired percentages, stakeholders rate the State or District’s progress (none, some, significant) toward achieving the desired rate for each outcome area (i.e., graduation, dropout, each transition component of the IEP, and each post-school outcomes area – higher education, competitive employment, other postsecondary education/training, and some other employment). Use the bulleted descriptors to help determine the appropriate progress rating. *Note: Stakeholders may choose to identify additional or different progress descriptors relevant to the State and/or District.

26
After all subcomponents of an Indicator are rated, an Outcome Assessment Summary shows the outcome areas sorted by progress rating for each Indicator. Figure 2 shows the summary for Indicator 13. Evidence-based predictors of post-school success aligned with the outcome areas rated as No Progress or Some Progress are pulled into Phase 3, Prioritizing Predictors.
Figure 2. Indicator 13 Outcome Assessment Summary
Scroll down the page to develop the Focus Area Statement (See Figure 3)
Developing a Focus Area Statement. A focus area statement helps stakeholders identify the groups of youth and/or outcomes that will be the focus of the action plan. Develop a focus area statement by identifying (a) a group of students, such as males or females, a specific disability group, or age group, and (b) an outcome area for the focus, such as graduating, inviting youth to their IEP meeting, or enrolling in higher education. Encourage stakeholders to review and share the notes and observations they recorded on the Data Discussion Worksheet, or flip charts, as they viewed the slideshow. If necessary, return to the slideshow to review relevant data. The more specifically the problem is described, the easier it will be to identify possible solutions, implement strategies for improvement, and evaluate success.
Note: When reviewing graduation and dropout data, it may be necessary to include additional data from district data sources to determine a particular group of students to target.

27
Figure 3. Focus Area Statement
Remember: Indicators can be discussed in any order. Use the Jump to another indicator or Outcome Area feature to move between Indicators and Outcome Areas.
Summary of Assessing Outcome Areas The last page in the Assessing Outcome Area phase (see Figure 4) is a summary page showing the desired state and actual percentages, desired district and actual percentages, and the progress rating for each Indicator. Changes can be made to the percentages or rating of an Indicator by clicking the underlined and hyperlinked Indicator descriptor.
Figure 4. Summary of Assessing Outcome Areas

28
Below is a task analysis of the process for preparing and conducting the stakeholder meeting for this phase of STEPSS. LEADING THE STAKEHOLDER DISCUSSION IN PHASE 2 Pre-Meeting Preparations for Facilitator
• Review notes from previous meeting. Be prepared to address any questions or concerns from the previous meeting.
• Review state targets and other information entered into STEPSS by the SEA. If there is an error, contact the state secondary transition contact before continuing.
Begin the stakeholder meeting: • Review and discuss information gathered from the Data Discussion Worksheet in
Phase 1.
LEADING THE STAKEHOLDER DISCUSSION:
• Lead stakeholder group in a discussion about the state and district actual percentages and desired percentages for each of the outcome areas (i.e., graduation, dropout, each transition component of the IEP, and each post-school outcomes area – higher education, competitive employment, other postsecondary education/training, and other employment).
• After comparing actual percentages to the desired percentages, lead stakeholders in rating the state or district’s progress toward achieving the desired percentage for each outcome area. Bulleted qualifiers for each progress code are provided to help determine the appropriate progress code. Stakeholders may identify additional or different progress qualifiers relevant to the state and/or district.
• Use stakeholders’ notes and observations recorded on the Data Discussion Worksheet and summarized on flip charts, while viewing the slideshow to write a focus area statement that identifies a group of students, and outcome area. Remind stakeholders the more specific the problem area, the easier it will be to identify solutions and strategies for improvement. Below are some examples:
o Students with disabilities have lower graduation rates than nondisabled students.
o Students with disabilities have higher dropout rates than nondisabled students.
o Former students, who are female, have lower outcomes in competitive employment.
o Male youth with an intellectual disability are not enrolling in higher education at the same rate as other youth.
• Remind stakeholders that outcome areas rated at “No Progress” or “Some Progress,” will be reviewed to improve practice in Phase 3.
• Schedule the next meeting.

29
By Assessing Outcome Areas, stakeholders are beginning to form information from the various types of secondary transition data available to them. Having reviewed their targets and achieved percentages, stakeholders are ready to synthesize information into actionable knowledge as they prioritize predictors for specific groups of students in Phase 3. A predictor of post-school success (i.e., predictor) is an in-school experience, typically a program, correlated with improved in-school or post-school outcomes. Phase 3, Prioritizing Predictors, is described next.
Remember: Only predictors aligned with outcome areas rated as “No Progress” or “Some Progress” when Assessing Outcome Areas are brought forward for prioritizing. The number of predictors brought forward for consideration is directly related to the in-school experiences shown, through high quality research, to be effective at increasing the likelihood of positive post-school outcomes. Currently, employment has the most evidence associating in-school experiences with post-school outcomes. Therefore, if “No Progress” or “Some Progress” was selected for employment outcomes, all 16 predictors will be included for prioritizing. See Appendix F for a table showing which predictors are aligned with each outcome area.

30
PHASE 3: PRIORITIZING PREDICTORS

31
Phase 3, Prioritizing Predictors, helps stakeholders narrow the focus of the action plan by systematically considering program characteristics of the predictors aligned with outcome areas rated as “No Progress” or “Some Progress” when Assessing Outcome Areas. In this Phase, stakeholders continue synthesizing from various sources and applying judgment to what is working in their school or district for students with disabilities. They begin developing actionable knowledge as they prioritize information and consider the merits of different possible solutions. A predictor of post-school success (i.e., predictor) is an in-school experience, typically a program, correlated with improved in-school or post-school outcomes. Each predictor has an operational definition and set of essential program characteristics that supports full implementation of the predictor in a school setting. The operational definitions and essential program characteristics were identified by experts in the field through a rigorous, consensus-building process (Rowe et al., 2013). See Appendix G for the list of predictors and essential program characteristics. Only predictors aligned with outcome areas rated as “No Progress” or “Some Progress” when Assessing Outcome Areas are brought forward for prioritizing. The number of predictors for consideration is directly related to the in-school experiences shown, through high quality research, to be effective at increasing the likelihood of positive post-school outcomes. GETTING STARTED:
• Log-in at https://stepss.uoregon.edu/ • Select Action Plan tab at the top of the page • Select Prioritizing Predictors
Prioritizing Process The first page of Prioritizing Predictors (see Figure 5) shows a preview of the predictors associated with each outcome area. Previewing the predictors gives stakeholders an idea of the number of predictors to be discussed. Some predictors are aligned with multiple outcome areas, hence the importance of prioritizing these predictors for inclusion in the action plan. Although a predictor may be listed with multiple outcome areas on the Preview webpage, it will be prioritized only once. Critical to this first webpage is the Purpose Statement, outlined in Figure 5. After reviewing and discussing data, stakeholders sometimes start generating solutions and lose sight of the ultimate goal and purpose of an intervention. To guide action planning and maintain focus based on data, a purpose statement is generated for each outcome area. The focus of the intervention, competitive employment in the example, is derived from the progress rating determinations when assessing outcome areas. The percentages, from 31% to 35% in the example, come from the achieved and target percentages set during Assessing Outcome Areas.
PHASE 3: PRIORITIZING PREDICTORS

32
Figure 5. Preview of Prioritizing Predictors
To decide which predictors to implement, three questions are posed for each program characteristic to determine what is already being implemented and what needs to be implemented. The three criterion questions are:
1. Is the characteristic currently being implemented? 2. Can implementation begin within 3 months or less? 3. Are resources available to support implementation?
On webpage 2 of Prioritizing Predictors, stakeholders start prioritizing the predictors for implementation by determining which essential program characteristics are currently being implemented and which are necessary for implementation. Only characteristics not currently being implemented and those necessary for implementation are considered for implementation. The assumption is that if a program characteristic is being implemented, then it already contributes to the achieved outcomes reflected in the data. If all program characteristics of a predictor are currently implemented and significant progress for achieving the target has not been made, stakeholders should determine whether implementation is occurring with fidelity for all students. That is, determine whether the predictor is implemented with the duration, frequency, intensity, and materials as intended.
Note: Fidelity of implementation is beyond the scope of this Facilitator’s Guide. Contact Center Staff to discuss fidelity of implementation concerns.

33
Implementation Status To prioritize predictors, the first criterion is Implementation Status. Notice the Rate Implementation Status bar in Figure 6. The number of prioritization steps (e.g., 1 of 3) corresponds to the three-prioritization criteria. Likewise, the number of predictors (e.g., 1 of 17) is located next to each predictor. This tracking system helps stakeholders monitor their progress when working in STEPSS. Determine if each program characteristic is:
Currently Being Implemented (i.e., there is evidence in the district or school that most or all students with disabilities participating in this predictor experience this program characteristic as described. Characteristics currently being implemented are not included in the action plan).
Not Currently Being Implemented (i.e., there is evidence in the district or school that most or all students with disabilities participating in this predictor do not experience this program characteristic. Those not currently implemented are considered for inclusion in the action plan).
Necessary Implementation (i.e., the program characteristic is viewed by stakeholders to be so critical to the predictor that it must be implemented for most or all students with disabilities participating in this predictor. Those necessary for implementation are automatically included in the action plan. Characteristics determined to be necessary for implementation have no action buttons in the remaining two prioritization criteria, but can be unselected and considered at that point in the prioritization progress).
Figure 6. Rate Implementation Status
Each essential characteristic selected as either “necessary implementation” or “not currently being implemented” is carried forward for prioritization criterion 2, Implementation Timeline (see Figure 7).

34
Implementation Timeline The second criterion for consideration is Implementation Timeline (see Figure 7). Implementation Timeline refers to the amount of time it takes to plan and implement a program characteristic (e.g., change a practice). As a starting point, three months or less is used for implementing the program characteristic with seniors. This timeline was chosen to give current seniors an opportunity to experience an in-school intervention with evidence supporting increased likelihood of achieving positive post-school outcomes. The timeline can be adjusted to meet the needs of the school or district. The relevance of the timeline to prioritizing predictors is that the focus should be on selecting predictors that can be implemented within a short time period. Time is a valuable resource; invest that resource in students receiving the benefit of the intervention, not on the design of the intervention. As with the program characteristic selected in Implementation Status, if a characteristic is selected, it will be carried forward for consideration in the next criterion. Characteristics not selected are dropped from prioritizing. Those characteristics marked “Necessary for Implementation” are carried forward for each prioritizing criterion and can be unselected at anytime. Once unselected, that characteristic is no longer automatically part of the action plan. From that point forward it appears for prioritizing as any other selected characteristic.
Figure 7. Implementation Timeline
Available Resources for Implementation The third criterion for consideration is Available Resources for Implementation (see Figure 8). The list of program characteristics for consideration in the third criterion is generated from those characteristics selected in the second criterion, Implementation Timeline. To change which program characteristics were selected, at any point in the process, use the <previous button or Jump to another predictor to go back and select, or unselect, a program characteristic.

35
Consider the following resources when answering the question: Do we have the resources to support implementation? Each resource may not be applicable to every program characteristic and there may be other resources not listed here. Check with stakeholders prior to beginning this portion of the prioritization to determine whether additional or different resources should be considered.
Time – can this characteristic be implemented, with fidelity, in the time the focus group of students has remaining in school? It may be necessary to specify an age or class group (e.g., seniors, juniors, sophomores, or freshmen) to experience this characteristic. Can the school calendar be reconfigured to accommodate nontraditional learning times (e.g., lunch groups, summer or Saturday school, or before or after-school hours)?
Faculty/staff knowledge – do faculty and staff have the knowledge and expertise necessary to implement the characteristic or is additional training needed? It may be necessary for faculty and staff to learn new skills or brush up on unused skills in order to implement a characteristic.
Materials – are curricula, supplies, and learning materials available to implement a program characteristic? Talk with teachers to determine what specific materials may be needed.
Policies and procedures – do School, District, and State policies and procedures support implementation of the characteristic? Talk with teachers and school administrators to determine if existing policies and procedures hinder implementation of the program characteristic.
Administrative support – do School, District, and State administrators understand and support the implementation of the program characteristic? Administrators should ask, and teachers should explain, the specific administrative support needed to implement a characteristic.
Community resources – does the community provide resources and supports needed to implement the predictor? Consider the role local businesses play when implementing the program characteristic (e.g., providing work-based learning opportunities for students). It may be necessary to cultivate community support prior to implementing a program characteristic.
Lastly, consider funds as an extension of each resource, not as a separate resource. For example, when discussing the resource of time, ask what funding is needed to create more time for students to engage in the program characteristic; or what funds are available to purchase curricula? This critical conversation may reveal availability of more resources than expected.

36
Figure 8. Available Resources for Implementation
STEPSS generates a message (see Figure 9) when no program characteristics were identified during prioritization. At this point, stakeholders should decide whether to return to the predictor and prioritize the program characteristics, or not prioritize the program characteristics for that predictor. Predictors with no program characteristics prioritized are excluded from action planning, but remain available for future prioritizing.
Figure 9. No Program Characteristics Selected Message

37
Below is a task analysis of the process for preparing and conducting the stakeholder meeting for this phase of STEPSS.
LEADING STAKEHOLDER DISCUSSION IN PHASE 3
Pre-meeting preparations for facilitator: • Review the notes from previous meetings. Take note of any questions or concerns
that may need to be addressed at this meeting. • Review areas defined as “no progress” or “some progress”.
Begin the stakeholder meeting:
• Review and discuss targets and achieved percentages identified by stakeholders identified by stakeholders in Phase 2.
• Review predictors associated with each outcome area identified as having “some progress” or “no progress” in Phase 2.
Lead the Stakeholder Meeting • Read and discuss with stakeholders each essential program characteristic to
determine (a) implementation status, (b) implementation timeline, and (c) available resources for implementation. The prioritizing process is designed to identify which steps are immediately actionable.
• Describe the process used to rate program characteristics for each predictor. o The first step for prioritizing predictors is Rate Implementation Status. Select
only the characteristics or predictors not currently in place that can be implemented. Selecting too many predictors or program characteristics will be overwhelming when making the action plan.
o Remember this process is ongoing. After completing identified areas for improvement, you can select other predictors and characteristics identified as needing improvement.
o Select Necessary Implementation if the program characteristic is critical in your district/school and must be implemented for most or all students with disabilities participating in this predictor. Characteristics necessary for implementation will be moved to the action plan. This option is available in the remaining two criteria.
o The second step for prioritizing predictors for the action plan is identifying the Implementation Timeline. Remind the group the prioritizing process is designed to help narrow the predictors and characteristics for the action plan.
o Select “This can be implemented in 3 months or less” if the program characteristic can be implemented quickly or if it can be implemented over a longer period of time for a different group of students. Only the characteristics selected for implementation in three months or less or those with an adjusted timeline will be included in the action plan.
o The third step for prioritizing predictors is Available Resources for Implementation. Select “We have resources to support implementation,” if sufficient resources are available or can be reallocated for this program characteristic.

38
Resources to consider include time, staff time, administrative support, funds, and curricular materials. Stakeholders may identify other resources needed for implementation.
o Based on decisions made in Assessing Outcome Areas and Prioritizing Predictors, STEPSS will generate a list of predictors and essential program characteristics for the action plan.
o Only the predictors and essential program characteristics meeting all three prioritizing criteria will be displayed in the Action Plan Preview webpage. Each predictor is listed only once, even when it is linked to multiple outcome areas.
• Schedule the next meeting.
By Prioritizing Predictors, stakeholders continue synthesizing from various sources and applying judgment to what is working in their school or district for students with disabilities. They begin developing actionable knowledge as they prioritize information, and consider the merits of different possible solutions. Phase 4: Action Planning is discussed next.

39
Gather Data
Use Data
Improve Programs
Positive Post-‐School
Outcomes
ContinuousMonitoringPlan
Review & Interpret PPSS Data
Make Decisions & Plan Actions
Select & Implement EBP/PPSS
Use Data
Continuous Improvement
Planning
PHASE 4: ACTION PLANNING

40
PHASE 4: ACTION PLANNING Phase 4, Action Planning, helps stakeholders develop a plan that promotes change at the classroom, school, district, community, or state-level to improve in-school and post-school outcomes of youth with disabilities. STEPSS’ action planning follows a model of action or participatory research meaning that the actions undertaken to create the desired change are determined and implemented by those participating in the review of relevant data, setting desired percentages, prioritizing predictors likely to improve in-school and post-school outcomes, and developing a plan of action. It is the underlying process of DBDM that occurs as data becomes information which becomes actionable and on which decisions are made. Keep in mind, this DBDM process occurs within the context of the local school, district, and state. The Action Planning phase of STEPSS brings together all the elements of the STEPSS DBDM model. Stakeholders move from having various types of data to having knowledge that is actionable for making decisions and determining solutions, based on the data reviewed, to improve secondary transition programs for youth with disabilities.
GETTING STARTED:
• Log-in at https://stepss.uoregon.edu/ • Select Action Plan tab at the top of the page • Select Action Planning
Predictor Preview
Once the final predictor has been prioritized, STEPSS generates an Action Plan Preview webpage (see Figure 10) including a research question, predictors that met the three prioritization criteria (i.e., not being implemented, can be implemented within three months, and resources available for implementation), and the corresponding prioritized characteristics.
In the Action Plan Preview, stakeholders see the totality of their prioritizing and decide whether to retain or exclude either a predictor or individual program characteristics. Excluding a predictor removes all of the associated program characteristics. Program characteristics can be excluded individually. Any excluded predictor or program characteristic can be reinstated at any time.
The research question is here to remind stakeholders of the reason for implementing the identified predictor and the intended relationship between the predictor and desired outcomes: if this predictor is implemented, then these outcomes are more likely to occur. It places the work that will be done to implement the predictors in context of the desired goal and marks the point at which information – obtained from various types of data – becomes actionable information.

41
In the Figure 10, Career Awareness was excluded and is noted by the line through the predictor followed by the message, “This Predictor has been excluded from your Action Plan.’ Undo will reinstate the predictor in the action plan. Notice when a predictor is excluded, all the essential program characteristics associated with it and meeting the prioritization criteria are also excluded. For Community Experiences, two of the three predictors were excluded, indicated by the strikethrough and the message “This Characteristic has been excluded from your Action Plan.” As with the predictor, Undo will reinstate the characteristic into the action plan.
Figure 10. Predictor Preview
Action Plan
After deciding which predictors and characteristics to include, action planning commences. The predictor and operational definition are displayed, followed by the purpose statement, focus area, research question, and examples of EBPs that could be used when implementing the predictor (see Figure 11).

42
Figure 11. Action Plan
The statement “(1 of 2 predictors)” following the predictor tells the action planners how many predictors are included in the action plan and which predictor is being addressed currently.
The Purpose comes from Assessing Outcome Areas and uses the District (or State) outcome percentage and the desired outcome percentage to set the “from” and “to” percentages.
The Focus Area statement comes from the focus area statement drafted by stakeholders when they completed the Assessing Outcome Areas.
The Research Question reflects the relationship between the predictor and desired outcomes and includes the measure and following year’s date as a point of reference for determining whether the outcome increased (e.g., employment) or decreased (e.g., dropout) as desired.
Examples of EBPs provide stakeholders with possible instructional strategies appropriate for most students engaging in the predictor. Appropriate EBPs can be determined at the class or individual student level, depending on the skills of students. Multiple EBPs can be used with multiple predictors and should be determined based on what strategies are effective for individual students. Appendix H includes a list of EBPs. For a current list of all identified EBPs in secondary transition see NSTTAC’s website at www.nsttac.org.

43
Steps for Action Planning
To develop an action plan promoting change to specific outcomes for specific students, stakeholders need to keep those targeted outcomes and students in mind as they develop the action plan. In Action Planning, each essential program characteristic that met all three prioritizing criteria and/or was determined to be so important that they are “necessary for implementation” is listed separately. Stakeholders should determine what steps are needed to implement the program characteristic. Use the seven questions, located on the left side of Figure 12, to guide the action planning process. Record responses to each question in the text box.
Ensure stakeholder groups provide sufficient detail to determine when the action has been implemented. The final plan should be complete and clear to any person who reads it (see Figure 12).
Figure 12. Steps to Action Planning

44
Note: STEPSS is aligned with the S.M.A.R.T. model of goal writing. Each element is defined below with specific examples.
• Specific refers to elements that clearly define what will be done. A specific goal answers the questions: who, what, when, where, and how. In STEPSS, the focus area statement helps target a specific group of students and outcome area. During Action Planning, stakeholders need to specify details for implementing the program characteristics.
• Measurable refers to the observable and countable evidence demonstrating the goal accomplished the intended outcome. In STEPSS, Accessing Outcome Areas leads to a research question and goal from X% to Y%. During Action Planning, stakeholders need to consider methods of evaluation when implementing the program characteristics.
• Achievable refers to the ability to implement the activity within the local constraints (e.g., political climate, resources, commitment of the LEA). In STEPSS, by Prioritizing Predictors, stakeholders determine which characteristics are achievable as they consider the three prioritizing criteria. In Action Planning, stakeholders need to consider whether the step can be achieved within their local context.
• Results-Focused refers to outcomes achieved from the goal as opposed to the process. Throughout STEPSS, State and District results are intended to drive stakeholders’ decisions. By generating the focus area, a purpose statement, and research question, STEPSS ensures the goal of the action plan is results focused. In Action Planning, stakeholders need to develop steps for implementation of the program characteristics that will lead to the intended results.
• Time-bound, refers to an established timeline in which progress can be measured. In STEPSS, stakeholders are encouraged to select program characteristics that can be implemented in three months or less. In Action Planning, stakeholders need to keep the three-month timeline in mind when developing the actionable steps for implementation of the program characteristics.
Click [+] Definitions to expand a window defining each element of an action planning step.
For each step in the action planning process, consider the following questions:
• What needs to happen to implement this program characteristic? Identify the steps necessary to achieve implementation of each program characteristic. For example: Create a district- wide, systematic, and structured process for assessing students' interests each year prior to the review of their IEP.
• Who needs to be involved in order for this step to be completed? Consider what negotiations need to take place and include people who need to give permission, be trained, or be informed (e.g., all high school and middle school guidance counselors, transition specialists, and special education teachers).

45
• What additional data, if any, are needed? It may be necessary to collect data on the process of implementing a particular step (e.g., After three months of using the district- wide, systematic, and structured process for assessing students’ interests, survey all high school and middle school guidance counselors, transition specialists, and special education teachers to determine how many have actually used the process and identify ways to increase the functionality of the process).
• Who is responsible for implementing this step? By listing specific people, by name and role, the responsibility of implementing the step is not lost when people change jobs (e.g., Dr. JoAnn Doe, Special Education Director).
• What is the timeline for completing this step? Remember: one criterion for selecting a program characteristic is if it can be implemented within three months or less for current seniors. Keep this in mind as you set the timeline for completing the step. If implementation of any one step takes longer than three months, consider re-evaluating whether the program characteristic should be implemented at this time. An exception to this guideline may be that the program characteristic is targeted for use with students other than the current seniors. In general, implementation of a step should be completed within 4 to 6 weeks.
• Progress Notes: Use the Progress Notes section to record when a step is completed or a reason for making a change in the step.
Multiple steps may be required to implement each program characteristic. Click the +Add another step link at the bottom to add steps. Each time a new step is added or a different section of the STEPSS tool is clicked, the page automatically saves.
Once the Steps for Action Planning have been completed, a CONGRATULATIONS webpage will be shown (see Figure 13). This screen will include an option to print your action plan.
Remember: Planning the action steps can be done in multiple sessions over time. STEPSS saves continually and can be resumed at any point in the process.
Figure 13. CONGRATULATIONS

46
Printing or Viewing the Action Plan
To print the action plan, click Print Action Plan or use the keyboard shortcut (CTRL-P) or (command P on a MAC) by holding down the control (CTRL) button and selecting the letter P. CTRL-P opens a print dialogue (see Figure 14).
Figure 14. Print Dialogue
Next Steps in STEPSS
With the STEPSS Action Plan drafted, the real work begins. It is now time to (a) implement the predictors and program characteristics, (b) monitor implementation to ensure consistency with the intended implementation plan, (c) evaluate the on-going implementation to address any problems as they develop or revise the implementation plan as needed, and finally, (d) evaluate the effectiveness of the predictor implementation, using the next year’s data.
Last step: Schedule regular meeting times to monitor the action plan and revise as needed. Like the IEP, the STEPSS Action Plan should be a living document that drives change; not a form filed away for review once a year.
By Action Planning, stakeholders improve secondary transition programs for youth with disabilities by moving knowledge into actionable data through making decisions and determining solutions based on the data reviewed (DBDM).
Following is a task analysis of the process for preparing and conducting the stakeholder meeting for this phase of STEPSS.

47
LEADING STAKEHOLDER DISCUSSION IN PHASE 4
Pre-meeting preparations for facilitator: • Review the notes from previous meetings. Take note of any questions or concerns
that may need to be addressed at this meeting. • Be prepared to address any questions or concerns from the previous meeting.
Begin the stakeholder meeting: • Review and discuss predictors and program characteristics identified in Phase 3 to
be included in action plan. Ensure group has included a reasonable number of predictors and program characteristics for implementation. It is better to start with a small number of predictors than to identify too many. Once various characteristics have been addressed, then you can move on to other ones.
• Remind stakeholder group an action plan should be: o a work in progress; o used to guide change, not filed and forgotten; o visible and continually monitored; o evaluated for progress toward goals.
• Remind stakeholder group the purpose of this phase of STEPPS is to develop an action plan. These are the action steps that need to occur to implement each program characteristic of each predictor.
Lead the Stakeholder Meeting: • Work with the stakeholder group to develop an action plan using the STEPSS tool. • Once Action Planning is complete, select Print Action Plan for a paper version of the
action plan. • Provide instructions for reviewing the action plan in the future (i.e., login to STEPPS
and click View Action Plan on the menu bar). • Remind stakeholders that an action plan should be:
o a work in progress; o used to guide change, not filed and forgotten; o visible and continually monitored; and o evaluated for progress toward goals (i.e., did you meet your desired targets for
each of the Indicators 1, 2, 13, & 14?). • Set regular meeting times with the people involved in developing, implementing, and
monitoring the action plan. Record notes as the action plan is implemented.
Note: If reviewing/revising previous plan, instruct stakeholder group to use the Progress Notes section in STEPSS to record such things as when a step was completed or a reason for making a change in the step.

48
Each year, as new Indicator data are loaded into STEPSS by the State department, stakeholder groups can assess if they have improved graduation rates, dropout rates, quality transition component, or post-school outcomes of youth. As part of the continuous monitoring cycle, stakeholders will repeat the process of (a) reviewing and interpreting secondary transition data (i.e., graduation and dropout rates, quality transition IEP compliance rate, and PSO engagement rates); (b) making decisions about a local problem revealed by the data (DBDM), (c) planning what actions to take to alleviate or reduce the problem by selecting and implementing EBPs and PPSS. Each year, as stakeholder groups use the STEPSS tool, the action plan will evolve as old activities are completed, new activities are added, state and/or district priorities change, staff change, or other factors impact program improvement at the state and local level.

49
REFERENCES Bowerman, R. L., Kohler, P. D., Coyle, J. L., Gothberg, J. & Shadrick, I. D. (2010).
Facilitator Preparation Manual. National Secondary Transition Technical Assistance Center. Western Michigan University.
Golden, N., & Gall, J.P. (2000). The complete toolkit for building high-performance work teams. Eugene, OR: Clearinghouse on Educational Management.
Nebraska Department of Education (2012). Using data to guide action for school improvement: Facilitator’s guide. Retrieved from http://www.education.ne.gov/APAC/SchoolImprovement.html
Rowe, D. A., Alverson, C. Y., Unruh, D., Fowler, C. H., Kellems, R., & Test, D. W. (2013). Operationalizing evidence-based predictors of post-school success: A Delphi study. Manuscript submitted.
Test, D. W., Fowler, C. H., Richter, S. M., White, J., Mazzotti, V., Walker, A. R., … Kortering, L. (2009). Evidence-based practices in secondary transition. Career Development for Exceptional Individuals, 32, 115-128
Test, D. W., Mazzotti, V. L., Mustian, A. L., Fowler, C. H., Kortering, L., & Kohler, P. (2009). Evidence-based secondary transition predictors for improving post-school outcomes for students with disabilities. Career Development for Exceptional Individuals, 32, 160-181

50
APPENDICES

51
APPENDIX A:
SAMPLE AGENDAS FOR
STAKEHOLDER GROUP
MEETINGS

52
Stakeholder Team Planning Meeting 1:
Viewing and Discussing Data
Agenda
• Welcome and Introductions
• Overview of STEPSS
• Purpose and Materials
• Establish ground rules
• Identify official recorder to summarize notes on Data Discussion Worksheet
• View STEPSS slideshow
• Review discussion notes and group decisions
• Set next meeting

53
Stakeholder Team Planning Meeting 2: Assessing Outcome Areas
Agenda
• Welcome, Introduction of New Stakeholders, Purpose and Materials
• Review information from Meeting 1 and notes made on Data Discussion Worksheet
• Identify official recorder to enter information into STEPSS
• Assessing Outcome Areas: Comparing state/and district percentages to the desired percentages for each outcome area and rate progress toward achieving targets by identifying areas where the district is making no progress, some progress or significant progress
• Write a focus area statement for each outcome area
• Review discussion notes and group decisions
• Set next meeting

54
Stakeholder Team Planning Meeting 3: Prioritizing Predictors
Agenda
• Welcome, Introduction of New Stakeholders, Purpose and Materials
• Review information from Meeting 2 and Focus Area Statements
• Review areas identified as having made “no progress” or “some progress”
• Identify official recorder to enter information into STEPSS
• Prioritize Predictors
• Set next meeting

55
Stakeholder Team Planning Meeting 4: Action Planning
Agenda
• Welcome, Introduction of New Stakeholders, Purpose and Materials
• Review information from Meeting 3 and group decisions made to this point
• Review predictors and program characteristics identified in the previous meeting to include in action plan.
• Identify official recorder to enter information into STEPSS
• Develop Action Plan by describing for each program characteristic:
• What needs to happen to implement that program characteristic
• Who needs to be involved
• What additional data, if any, are needed
• Who is responsible for implementing the step
• The timeline for completing the step
• Determine whether to meet regularly to review progress, problem solve, and evaluate efforts and set dates as needed

56
APPENDIX B: GLOSSARY OF TERMS

57
Glossary of Terms
The glossary defines key terminology relative to STEPSS. The SEA should add state-specific terms and definitions to the glossary as appropriate. State-specific definitions that may need revising are in bold and noted as “Defined by the State.”
Term Explanation Adjusted cohort graduation rate
Refers to the formula all states must use to report graduation rates in the February 2013 APR. Formula is shown below: # IEP youth who graduate in 4 years with a regular high school diploma ------------------------------------------------------------------------------------------ # IEP youth who entered HS 4 years earlier, adjusted for transfers in and out, emigrants, & death
Annual Performance Report (APR)
This report is submitted annually by states to the Office of Special Education Programs (OSEP) for the purpose of reporting to the public and to the Secretary of Education on the performance of each of its local educational agencies according to the targets in its State Performance Plan (SPP). The state reports on 20 Part B Indicators.
Competitive Employment
As used in Indicator 14 measures B and C means youth have worked for pay at or above the minimum wage in a setting with others who are nondisabled for a period of 20 hours a week for at least 90 days at any time in the year since leaving high school. This includes military employment.
Completer Refers to someone who receives a regular diploma, certificate, or alternate credential (the latter two are not counted as “graduates” in the graduation rate calculation).
Courses of Study Refers to “a multi-year description of coursework (necessary) to achieve the student’s desired post-school goals” (Storms, O’Leary, & Williams, 2000, Transition Requirements, p. 8). See Indicator 13 Checklist at I-13 Checklists and Examples and Nonexamples at www.nsttac.org.
Dropout The definition varies slightly from state to state. Generally, a student who was enrolled at some time during the school year and whose enrollment terminated. Excludes youth who: graduated/earned another state approved credential; transferred; are suspended, ill, or who have died.
Engagement Rate
Refers to the percent of youth who responded to the state’s data collection method (e.g., survey or interview). Engagement rate for Indicator 14 is calculated using the following formula: Higher Education + Competitively Employed + Other Postsecondary Education + Some other employment Divided by the total number of respondents to the survey or interview.

58
Term Explanation Extended cohort graduation rate
Refers to an adjusted cohort rate calculated to account for youth who take 5, 6, or more years to graduate. Note: Such a rate must be applied to ALL students—not just students with disabilities.
Event graduation rate
Refers to a 1-year snapshot of the graduation rate. Generally provides higher graduation rate than a cohort-based calculation.
Graduate Refers to someone who earns a regular diploma. Indicator 1, for SPP/ APR
Refers to the percent of youth with IEPs graduating from high school with a regular diploma. Data Source: Same data as used for reporting to the Department of Education under Title I of the Elementary and Secondary Education Act (ESEA). Measurement: States must report using the graduation rate calculation and timeline established by the Department under the ESEA.
Indicator 2, for SPP/ APR
Percent of youth (ages 14-21) with IEPs who exit high school by dropping out during the period between December 1 and November 30 of the calendar year. Data Source: Same data as used for reporting to the Department under IDEA section 618. Measurement: States must report a percentage using the number of youths with IEPs (ages 14-21) who exited special education due to dropping out in the numerator and the number of all youth with IEPs who left high school (ages 14-21) in the denominator, or they may report using the same calculation as was used last year.
Indicator 13, for SPP/APR
Refers to Percent of youth with IEPs aged 16 and above with an IEP that includes appropriate measurable postsecondary goals that are annually updated and based upon an age appropriate transition assessment, transition services, including courses of study, that will reasonably enable the student to meet those postsecondary goals, and annual IEP goals related to the student’s transition services needs. There also must be evidence that the student was invited to the IEP Team meeting where transition services are to be discussed and evidence that, if appropriate, a representative of any participating agency was invited to the IEP Team meeting with the prior consent of the parent or student who has reached the age of majority.
Note: When comparing graduation rates among states or from one year to another, it is important to know both the source of the data (e.g., Consolidated State Performance Report or 618 data) and the calculation used to arrive at each of the rates being compared. This is particularly significant, because many states are currently in the process of switching to the use of the adjusted cohort graduation rate formula. DIFFERENCES IN DATA SOURCES AND CALCUALTIONS will hinder comparison of current graduation rates to past rates and MAY necessitate setting new baselines AND/OR TARGETS. Additionally, there are multiple methods of calculating dropout rates. The methods used vary among states and may not even be the same within a state when comparing dropout rates for all students and students who receive special education services.

59
Term Explanation Indicator 14, for SPP/APR
Refers to Percent of youth who are no longer in secondary school, had Individualized Education Programs (IEPs) in effect at the time they left school, and were enrolled in:
A. higher education B. higher education or competitively employed C. Enrolled in higher education or in some other postsecondary education
or training program; or competitively employed or in some other employment within one year of leaving high school. (20 U.S.C. 1416(a)(3)(B))
Higher Education As used in Indicator 14 measures A, B and C means: Youth who have been enrolled on a full-‐ or part-‐time basis in a community college (2-‐year program) or college/university (4-‐ or more year program) for at least one complete term, at any time in the year since leaving high school.
Measurable Postsecondary Goals
Refers to an outcome that will occur after the student has left high school (not a process that occurs after a student leaves school) and is stated in a manner that can be counted as occurring or not occurring
Method of Exit (i.e., exit type)
Refers to the different ways a youth leaves the public high school. For example,
• Graduating with a regular or modified diploma • Dropping out of school • Reaching the maximum age (i.e., aging out) for which they are eligible to
receive special education services (e.g., 21 years old)
Moved, not known to be continuing
Refers to students who have left one school and not been accounted for as registering in another school. These youth are counted as dropouts.
National Center for Educational Statistics event rate
Refers to # dropouts ÷ # students enrolled * 100
Non-‐returners Refers to youth who were expected to return to high school, but did not.
Office of Special Education Programs (OSEP)
The Office of Special Education Programs (OSEP) is the agency at the U.S. Department of Education responsible for overseeing the Individuals with Disabilities Education Act (IDEA). OSEP supports a variety of programs and projects authorized by IDEA that improve results for infants, toddlers, children, and youth with disabilities.

60
Term Explanation OSEP dropout rate calculation
Refers to the # IEP dropouts (ages 14-‐12) ÷ # IEP students (ages 14-‐21) who left high school by any method (based on the §618 data) or calculation used in previous years.
Other postsecondary education or training
As used in Indicator 14 measures A, B and C means youth who have been enrolled on a full-‐ or part-‐time basis for at least one complete term at any time in the year since leaving high school in an education or training program (e.g., Job Corps, Adult Education, Vocational Technical School that is less than a 2-‐year program).
Some other employment
As used in Indicator 14 measures A, B and C means youth who have worked for pay or been self-‐employed for a period of at least 90 days at anytime in the year since leaving high school. This includes working in a family business (e.g., farm, store, fishing, ranching, catering services, etc.).
Transition Assessment
Refers to the “ongoing process of collecting data on the individual’s needs, preferences, and interests as they relate to the demands of current and future working, educational, living, and personal and social environments. Assessment data serve as the common thread in the transition process and form the basis for defining goals and services to be included in the Individualized Education Program,” (Sitlington, Neubert, & Leconte, Career Development for Exceptional Individuals, 1997, p. 70-‐71). Transition assessments may be formal or informal (e.g., observations, ecological assessments, interviews) measures.
Transition Services
Refers to services “designed to be within a results-‐oriented process, that is focused on improving the academic and functional achievement of the child with a disability to facilitate the child's movement from school to post-‐school activities” (IDEA 2004, Part B, 614, [d][1][A][i][VIII]; §300.43[a][1]).

61
APPENDIX C:
DATA DISCUSSION WORKSHEET

62
Data Discussion Worksheet
Directions: Use this worksheet to capture your thoughts and observations while viewing and discussing the outcome areas related to graduation, dropout, compliant transition component of the IEP, and post-school outcomes data in the STEPSS slideshow. Record specific data references. Your observations will be used for Assessing Outcome Areas, Prioritizing Predictors, and Action Planning to improve in-school and post-school outcomes for youth with disabilities. For each outcome area, consider what questions you have about the state and district data.
Graduation Rates: Indicator 1 How do graduation rates of students with disabilities compare to those of all students? • What questions do you have about graduation rates in the state and or district? Ø Make notes about your observations as you review these data. Ø What additional data need to be collected or reviewed (e.g., attendance records, discipline
referrals, and or grades)? Ø What data support your observations, questions, and thoughts?
Notes: Dropout Rates: Indicator 2 How do dropout rates of youth with disabilities compare to all youth? • What questions do you have about dropout rates in the state and or district? Ø Make notes about your observations as you review this data. Ø What additional data need to be collected or reviewed (e.g., attendance records, discipline
referrals and or grades)? Ø What data support your observations, questions, and thoughts?
Notes:

63
Quality Transition Component of the IEP: Indicator 13 • What questions do you have about compliance on the transition component of the IEP? Ø Make notes about your observations as you review these data. Which elements (e.g.,
agency representative, transition services) have highest and lowest compliance rates? Which subgroups of students (e.g., males, minorities) have the highest and lowest compliance rates?
Ø What additional data need to be collected or reviewed (e.g., quality of services provided)? Ø What data support your observations, questions, and thoughts?
Measurable post-school goals Goals updated annually Transition Assessments Transition Services
Course of study Annual goals related to services Student invited to IEP Agency representative
Disability Category Specific Learning Disability Emotional Disturbance Intellectual Disability All other Disabilities Unknown Disability Type
Gender Male Female
Race/Ethnicity White Hispanic/ Latino Black or African American All Other
Notes: Post-School Outcomes: Indicator 14 • What questions do you have about post-school outcomes in the state and or district? Ø Make notes about your observations as you review these data. Which outcome areas (e.g.
higher education) have the highest and lowest rates? Which subgroups of former students (males, minorities, disability categories) have the highest and lowest outcomes?
Ø What additional data need to be collected or reviewed (e.g., not-engaged)? Ø What data support your observations, questions, and thoughts?
Higher Education Competitive Employment
Other Postsecondary Education Other Employment Not Engaged
Disability Category Specific Learning Disability Emotional Disturbance Intellectual Disability All other Disabilities Unknown Disability Type
Gender Male Female
Race/Ethnicity White Hispanic/ Latino Black or African American All Other
Notes:

64
APPENDIX D: STEPSS WEB APPLICATION
SECURITY
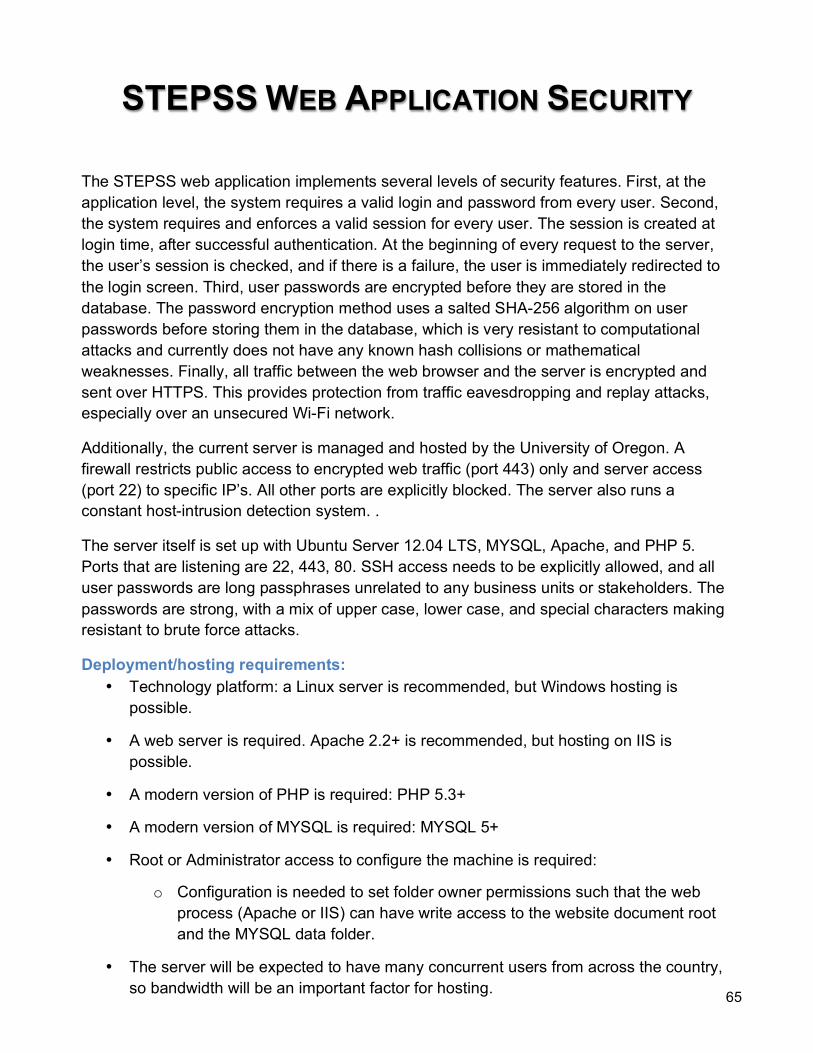
65
STEPSS WEB APPLICATION SECURITY
The STEPSS web application implements several levels of security features. First, at the application level, the system requires a valid login and password from every user. Second, the system requires and enforces a valid session for every user. The session is created at login time, after successful authentication. At the beginning of every request to the server, the user’s session is checked, and if there is a failure, the user is immediately redirected to the login screen. Third, user passwords are encrypted before they are stored in the database. The password encryption method uses a salted SHA-256 algorithm on user passwords before storing them in the database, which is very resistant to computational attacks and currently does not have any known hash collisions or mathematical weaknesses. Finally, all traffic between the web browser and the server is encrypted and sent over HTTPS. This provides protection from traffic eavesdropping and replay attacks, especially over an unsecured Wi-Fi network.
Additionally, the current server is managed and hosted by the University of Oregon. A firewall restricts public access to encrypted web traffic (port 443) only and server access (port 22) to specific IP’s. All other ports are explicitly blocked. The server also runs a constant host-intrusion detection system. .
The server itself is set up with Ubuntu Server 12.04 LTS, MYSQL, Apache, and PHP 5. Ports that are listening are 22, 443, 80. SSH access needs to be explicitly allowed, and all user passwords are long passphrases unrelated to any business units or stakeholders. The passwords are strong, with a mix of upper case, lower case, and special characters making resistant to brute force attacks.
Deployment/hosting requirements: • Technology platform: a Linux server is recommended, but Windows hosting is
possible.
• A web server is required. Apache 2.2+ is recommended, but hosting on IIS is possible.
• A modern version of PHP is required: PHP 5.3+
• A modern version of MYSQL is required: MYSQL 5+
• Root or Administrator access to configure the machine is required:
o Configuration is needed to set folder owner permissions such that the web process (Apache or IIS) can have write access to the website document root and the MYSQL data folder.
• The server will be expected to have many concurrent users from across the country, so bandwidth will be an important factor for hosting.

66
APPENDIX E:
STEPSS USER LICENSE
AGREEMENT

67
STEPSS USER LICENSE AGREEMENT
The University of Oregon (UO) owns or has been provided rights to the intellectual property included in STEPSS. UO and the National Post-School Outcomes Center (NPSO), the National Secondary Transition Technical Assistance Center (NSTTAC), and the National Drop-out prevention Center for Students with Disabilities (NDPC-SD) give permission for you (You), to use the STEPSS website (STEPSS) solely on the following conditions:
You acknowledge and agree that You will use STEPSS for non-commercial education and research purposes only. If You are an authorized state agency, You may make changes to the STEPSS code, however, it is solely Your responsibility to fix any resulting bugs that you introduce and You must cause the modified files to carry prominent notices stating the files that were changed and the date of the change. You agree that the privacy of your information and data are the sole responsibility of You and Your users. User names, user identification, passwords, and data are maintained by UO on a secure server. You acknowledge that prior to using STEPSS, You are obligated to obtain any written parental consent, or other consents, that may be required in accordance with Federal or state laws or school district policies, to enable You to enter data into STEPSS and to permit use of the data in accordance with the terms and conditions of this Agreement. If you are not a school, district, or state administrator, You may not use STEPSS. Nothing contained in this Agreement shall be construed as conferring any right to use in advertising, publicity or other promotional activities any name, trade name, trademark, or other designation of UO or the National Post-School Outcomes Center (NPSO), the National Secondary Transition Technical Assistance Center (NSTTAC), or the National Drop-out prevention Center for Students with Disabilities (NDPC-SD) without the express written permission of UO. You agree not to deep-link to the STEPSS website for any purpose, unless specifically authorized by UO and the National Post-School Outcomes Center, the National Secondary Transition Technical Assistance Center (NSTTAC), or the National Drop-out prevention Center for Students with Disabilities (NDPC-SD) to do so. STEPSS was developed by the National Post-School Outcomes Center, Eugene, Oregon, (funded by Cooperative Agreement Number H326U090001) with the U.S. Department of Education, Office of Special Education and Rehabilitative Services, The National Secondary Transition Technical Assistance Center, Charlotte, NC (funded by Cooperative Agreement Number H326J11001) with the U.S. Department of Education, and The National Drop-out prevention Center for Students with Disabilities, Clemson, SC (funded by Cooperative Agreement Number H326W080003) with the U.S. Department of Education.

68
However, UO makes no representations or warranty on the accuracy, validity, completeness, or availability of information or results obtained from STEPSS. UO reserves the right to conduct further research on STEPSS to inform and make modifications or improvements at any time without notice. You agree that, if you participate in research or provide feedback (including modifications of STEPSS code) to UO and the National Post-School Outcomes Center, the UO and the National Post-School Outcomes Center are permitted to use this information in making changes to STEPSS. You grant UO, and its authorized IT support, access to Your account on STEPSS, including data You have entered, in order for UO to perform routine maintenance tasks. You acknowledge that STEPSS is solely an education information resource and is made available 'AS IS,' without obligation by UO to provide accompanying services or support.
You acknowledge and agree as a condition of using STEPSS, that the information obtained from STEPSS is intended as a supplement to, and not a substitute for, Your knowledge, expertise, skill, and professional judgment in making decisions related to action plans for program improvement. UO AND NATIONAL POST-SCHOOL OUTCOMES CENTER (NPSO), THE NATIONAL SECONDARY TRANSITION TECHNICAL ASSISTANCE CENTER (NSTTAC), OR THE NATIONAL DROP-OUT PREVENTION CENTER FOR STUDENTS WITH DISABILITIES (NDPC-SD) EXPRESSLY DISCLAIM ANY AND ALL WARRANTIES REGARDING STEPSS, WHETHER EXPRESS OR IMPLIED, INCLUDING BUT NOT LIMITED TO WARRANTIES PERTAINING TO MERCHANTABILITY OR FITNESS FOR A PARTICULAR PURPOSE. UO WILL NOT BE LIABLE DIRECTLY OR INDIRECTLY FOR ANY PROPERTY DAMAGE, PERSONAL INJURY, LOSS OF USE, INTERRUPTION OF BUSINESS, LOSS OF PROFITS, OR OTHER SPECIAL, INCIDENTAL OR CONSEQUENTIAL DAMAGES, HOWEVER CAUSED, WHETHER FOR BREACH OF WARRANTY, CONTRACT, TORT (INCLUDING NEGLIGENCE), STRICT LIABILITY OR OTHERWISE.
Secondary Uses of Data. You hereby grant permission to UO and its designees to use the data you provide to STEPPS, for secondary uses. These secondary uses are restricted to activities designed to improve STEPPS resources and services, or research activities conducted by UO and its designees. UO designees are approved by UO's National Post-School Outcomes Center and must provide an Institutional Review Board (IRB) approval for specific research. Data for these secondary uses will be available only to UO and its designees, and no further distribution of data will be permitted, except as required by law. All individually-identifiable information will be kept private to the extent permitted by law, and whenever possible will not be included even within UO's or UO's designees valid secondary uses of data. No individual will be identifiable in any report or publication resulting from these secondary uses. UO will destroy all personally identifiable information, if any remains in data, 5 years after the project ends, in compliance with State of Oregon regulations on research records retention.

69
APPENDIX F:
PREDICTORS OF POST-SCHOOL
SUCCESS ALIGNED WITH
OUTCOME AREAS

PREDICTORS OF POST-SCHOOL SUCCESS ALIGNED WITH
OUTCOME AREAS
Predictor Indicators
Examples of evidence-based practices that can be used with a predictor I-1 I-2 I-13
I-14 Education Employment
Career Awareness X X X X • Computer Assisted Instruction Community Experiences X X X • Community Based Instruction Exit Exam Requirements /High School Diploma Status
X X X X • Computer Assisted Instruction
Inclusion in General Education X X X X • Mnemonics Interagency Collaboration X X X X X Occupational Courses X X X X X • Career Academies Paid Employment /Work Experience X X X X X • Simulations
• Self-Management Instruction Parental Involvement X X X • Training Modules Program of Study X X X • Career Academies Self-Advocacy /Self-Determination X X X X • Self-Advocacy Strategy
• Self-Determined Learning Model of Instruction Self-Care /Independent Living X X X X • Computer Assisted Instruction
• Forward Chaining, Backward Chaining Social Skills X X X X X • Video Modeling Student Support X X X X X • Talent Development High Schools
• Twelve Together Transition Program X X X X X • Self-Advocacy Strategy Vocational Education X X X X X • Self-Management Instruction Work Study X X X X X • Community Based Instruction Diagnostic Data System X X • Check and Connect
• Achievement for Latinos with Academic Success (ALAS)

APPENDIX G:
EVIDENCE-BASED PREDICTORS
OF POST-SCHOOL SUCCESS

Evidence-Based Predictors of Post-School Success A predictor of post-school success is an in-school experience, typically a program (e.g., work-based learning experience) correlated with improved post-school outcomes. Predictors are based on empirical research and apply to transition planning and instruction in the following ways: • Provide practitioners information about secondary transition program characteristics that are empirically linked to better post-school
success for students with disabilities • Help develop, expand, and or evaluate secondary transition programs • Help IEP teams develop IEP goals and transition services more likely to help students achieve their stated post-school goals The table below lists each predictor of post-school success (Test, Mazzotti, et al., 2009) and an operational definition and essential program characteristics (Rowe et al., 2013). Visit www.nsttac.org for a description of how the predictors were identified and www.npso.org for how the operational definitions and essential program characteristics were identified.
Predictor Category Operational Definition and Essential Program Characteristics
Career Awareness
Definition: Career Awareness is learning about opportunities, education, and skills needed in various occupational pathways to choose a career that matches one’s strengths and interests. Essential Program Characteristics: • Provide school-wide comprehensive and systematic opportunities to learn about various careers via job
shadowing, internships, guest speakers, industry tours, Career Technical Education classes, or career fairs. • Identify skills and qualifications required for occupations aligned with core content areas. • Embed career awareness in the general curriculum to teach about occupations related to the core content
areas. • Make explicit connections between academic skills and how those skills are used in various careers
throughout all general education classes. • Provide systematic, age appropriate student assessment of career awareness (e.g., interest inventories,
aptitude tests) for students to learn about their preferences and aptitudes for various types of career. • Provide instruction in how to obtain a job in chosen career path.
Occupational Courses
Definition: Occupational courses are individual courses that support career awareness, allow or enable students to explore various career pathways, develop occupational specific skills through instruction, and experiences focused on their desired employment goals. Essential Program Characteristics: • Embed career awareness activities, career planning, and vocational assessments in all occupational
courses. • Design curriculum for each course to include technology, 21st century skills, and employability skills for

73
Predictor Category Operational Definition and Essential Program Characteristics
specific career/career cluster content. • Provide hands-on and community-based opportunities to learn occupational specific skills within each
occupational course. • Incorporate Universal Design for Learning principles in CTE programs including cooperative education
programs to provide access to students with disabilities. • Provide course offerings throughout the school day so scheduling conflicts do not restrict student access to
occupational courses. • Provide occupational courses that represent a wide variety of occupational clusters to provide students
course choices that match their preferences, interests, needs, and strengths. Paid Employment/ Work Experience
Definition: Work experience is any activity that places the student in an authentic workplace, and could include: work sampling, job shadowing, internships, apprenticeships, and paid employment. Paid employment can include existing standard jobs in a company or organization or customized work assignments negotiated with the employer, but these activities always feature competitive pay (e.g., minimum wage) paid directly to the student by the employer. Essential Program Characteristics: • Provide opportunities to participate in job shadowing, work-study, apprenticeships, or internships.
**Consider work study, apprenticeships, and internship environments that are culturally sensitive to students from different cultural backgrounds.
• Provide instruction in soft skills (e.g., problem solving, communicating with authority figures, responding to feedback, promptness) and occupational specific skills (e.g., clerical, machine operation).
• Provide transportation training, including the use of public transportation and job-site and community safety. • Conduct job performance evaluations by student, school staff, and employer. • Provide instruction in obtaining (e.g., resume development) and maintaining a job. • Develop a process for community-based employment options in integrated settings with a majority of co-
workers without disabilities. • Conduct situational vocational assessments to determine appropriate job matches. • Develop a process to enable students to earn high school credit for paid employment work experience. • Link eligible students to appropriate adult services (e.g. Vocational Rehabilitation, Developmental Disabilities
Services) services prior to exiting school that will support student in work or further education. • Involve appropriate adult services (e.g., Vocational Rehabilitation or job coach when needed) in the provision
of community-based work experiences. • Use age-appropriate assessments to ensure jobs are based on students’ strengths, preferences, interest,
and needs. • Ensure employment training placements offer opportunities for (1) working 30+ hours/week, (2) making

74
Predictor Category Operational Definition and Essential Program Characteristics
minimum wage or higher, with benefits, and (3) utilizing individualized supports and reasonable accommodations.
Vocational Education
Definition: Vocational education is a sequence of courses that prepares students for a specific job or career at various levels from trade or craft positions to technical, business, or professional careers. Essential Program Characteristics: • Provide a sequence of entry level and advanced integrated academic and vocational courses designed to
improve students’ reasoning and problem-solving skills, academic knowledge, work attitudes, specific occupational and/or technical skills, and general skills needed for employment.
• Provide a combination of in-school and community-based academic, competency-based applied, and hands-on learning experiences in the career pathways based on the local labor market.
• Provide connection to postsecondary education and/or employment through site visits and connections with support services (e.g., vocational rehabilitation, disability support services).
• Provide opportunities to earn certificates in certain career areas (e.g., Certified Nursing Assistant, Welding, Food Handlers Certification).
• Develop business partnerships to ensure a relevant curriculum. • Provide career counseling and guidance to assist students in career planning and development aligned with
the students’ preferences, interests, needs, and skills. • Provide instruction in career development through volunteer work, job shadowing, work-study,
apprenticeships, or internships. • Provide accommodation and supports in Career Technical Education (CTE) courses to ensure student
access and mastery of content. • Provide instruction in soft skills (e.g., problem solving, communicating with authority figures, responding to
feedback, promptness) and occupational specific skills (e.g., clerical, machine operation). • Measure achievement in soft skills (e.g., problem solving, communicating with authority figures, responding
to feedback, promptness) and occupational specific skills (e.g., clerical, machine operation). Work Study
Definition: A work study program is a specified sequence of work skills instruction and experiences designed to develop students’ work attitudes and general work behaviors by providing students with mutually supportive and integrated academic and vocational instruction. Essential Program Characteristics: • Provide options for paid and nonpaid work experiences both on and off-campus with options for gaining high
school credit for completing program requirements in all 16 occupational clusters. • Develop a plan for earning academic credit on the job through an integrated curriculum focused on work-
related skills with school personnel, the student, and his/her parents.

75
Predictor Category Operational Definition and Essential Program Characteristics
• Provide supervision and guidance during the development of work behaviors and skills to address problems, concerns, insights, and learning. **Consider culturally responsive behaviors and skills that address cultural concerns of culturally and linguistically diverse (CLD) students Develop business/school partnerships, by educating employers about the resources of potential employees, to set up training sites. **Provide businesses with culturally responsive strategies to understand the cultural needs, behaviors, and practices of students from CLD backgrounds.
• Develop policies to address liability, including student insurance and other Department of Labor issues/concerns.
• Develop a process to match student interests with available sites both on and off campus. **Increase the number of available sites by recruiting site partners that reflect the cultural backgrounds of students.
• Provide experiences in applied real-work settings supported by instruction. • Place students in work settings that match their preferences, interests, needs, and skills.
**Consider partnerships with businesses owned by CLD communities • Provide transportation to vocational training sites. • Provide, or partner with adult services to provide, qualified trained staff to job coach as needed.
**Staff qualification should include some cultural competencies or training • Provide self-evaluation and monitoring instruction to students. • Provide students school-based opportunities to reflect, discuss, and share their work placement experiences. • Have school personnel and site employees assess and monitor students’ progress by using job duty forms
and task analysis for various sites. Community Experiences
Definition: Community experiences are activities occurring outside of the school setting, supported with in-class instruction, where students apply academic, social, and/or general work behaviors and skills. Essential Program Characteristics: • Allocate sufficient resources to support meaningful community-based experiences. • Conduct ecological assessments to determine skills needed for various community environments. • Provide instruction on skills needed to safely access community environments as identified via ecological
assessments. • Conduct transition assessments with students and families to determine appropriate community
environments for current and future activities. • Use community-based instruction to teach, assess, and monitor the obtainment of desired academic and/or
functional skills.

76
Predictor Category Operational Definition and Essential Program Characteristics
• Observe and document students’ attainment of desired behaviors and skills across diverse environments. • Instruct students to use public transportation. • Provide supervision during community experiences to guide and direct students in the development of
appropriate behaviors and skills needed for specific environments. • Involve parent and adult service providers to support student involvement in community experiences. • Cooperate with community partners (e.g., employers, recreation facilities) to develop community experience
sites. • Provide supports for parents to arrange community experiences after school hours. • Train teachers and paraprofessionals in necessary safety, health policies, and liability coverage necessary
for students to participate in community experiences. Exit Exam Requirements/ High School Diploma Status
Definition: Exit exams are standardized state tests, assessing single content area (e.g. Algebra, English) or multiple skill areas, with specified levels of proficiency that students must pass in order to obtain a high school diploma. Diploma status is achieved by completing the requirements of the state awarding the diploma including the completion of necessary core curriculum credits. Essential Program Characteristics: • Teach test-taking strategies and study skills instruction. • Assist students to plan for and use appropriate accommodations when taking the test. • Administer standardized practice tests periodically to monitor progress towards benchmarks. • Provide exit exams at the end of targeted courses designated by the state or at the end of a specific grade
level (e.g. 11th). • Offer students, meeting criteria, appropriate accommodations, alternate, or alternative assessment
procedures. • Provide student remediation assistance if they fail the test. • Provide students with multiple opportunities to take the test as allowed by the school/district for all students.
Inclusion in General Education
Definition: Inclusion in general education requires students with disabilities to have access to general education curriculum and be engaged in regular education classes with peers without disabilities. Essential Program Characteristics: • Provide administrative support (e.g., professional development for teachers and paraprofessionals, common
planning, providing paraprofessionals) to teachers for students with disabilities included in general education classrooms.
• Provide specific instruction to support students with disabilities who are included in general education (e.g., differentiate instruction, learning strategies, study skills, organizational skills, personal management skills).

77
Predictor Category Operational Definition and Essential Program Characteristics
• Evaluate the effectiveness of inclusive programming by using formative assessment to identify when adjustments are needed to accommodate all students’ learning differences (e.g., pace, communication skills).
• Develop a receptive school atmosphere for including students with disabilities in general education by educating administrators, teachers, other staff, and students about person-first language and disability rights.
• Observe and assess integrated environment to identify and provide interventions for needed academic, social, behavior, and communication skills to ensure a conducive learning environment for all students.
• Use diverse instructional strategies to meet the learning needs of all students including universal design for learning, technology, and linking instruction to student interests.
• Provide professional development for secondary personnel to ensure personnel are qualified to use universal design for learning and evidence-based instructional strategies.
• Engage students as active participants in general education instructional processes utilizing multiple models of inclusive learning.
Program of Study
Definition: A program of study is an individualized set of courses, experiences, and curriculum designed to develop students’ academic and functional achievement to support the attainment of students’ desired post-school goals. Essential Program Characteristics: • Ensure program of study is inclusive, academically rigorous, and supported by Universal Design for Learning
(UDL) principles. • Design multiple pathways in the general curriculum for satisfying standard diploma requirements. • Provide clearly defined graduation requirements leading to a state sanctioned exit document. • Establish planning process to assist students in developing their program of study. • Provide multiple opportunities (e.g., career technical education; community-based work, independent living,
and community access experiences; school-based enterprises; duel credit through a cooperative agreement) for students to acquire needed credits to achieve standard diploma and ensure a seamless transition to postsecondary education and employment settings.
Self-Determination/ Self-Advocacy
Definition: Self-Determination is the ability to make choices, solve problems, set goals, evaluate options, take initiative to reach one’s goals, and accept consequences of one's actions. Essential Program Characteristics: • Utilize a student driven IEP process to allow students to demonstrate self-awareness, goal setting, problem
solving, and self-advocacy.

78
Predictor Category Operational Definition and Essential Program Characteristics
• Collaborate with general education teachers to embed choices into the general curriculum and daily lessons and provide opportunities for students to practice self-determination skills.
• Teach students to self-monitor self-determination skills (e.g., accommodations and modifications) and provide opportunities for students to practice the self-monitoring strategy. **As you work with students, take into consideration the cultural nuances involved in teaching self-determination skills and providing opportunities to develop self-determination to students from CLD backgrounds.
• Ensure all students, including those with significant disabilities, have a functional communication system to engage in choice making, problem-solving, goal setting, taking initiative to reach goals, and accepting consequences for one’s actions.
• Conduct age-appropriate transition assessments in order for students to learn about themselves, set goals, solve problems, use information, make decisions, and to identify long-range goals.
• Provide opportunities for students to develop self-awareness by engaging in honest and respectful discussions with students about their self-determination assessment responses.
• Provide direct instruction in self-determination using a structured curriculum or evidence-based instructional strategy, with guided practice in natural school and community-based settings.
• Foster the development of students’ leadership skills. • Expect and support students to make many routine choices for themselves through the course of a school
day. • Work collaboratively with students to facilitate achievement of their goals by informing them of their options
and the potential consequences of their choices. Self-Care/ Independent Living Skills
Definition: Self-care/independent living skills are skills necessary for management of one’s personal self-care and daily independent living, including the personal management skills needed to interact with others, daily living skills, financial management skills, and the self-management of healthcare/wellness needs. Essential Program Characteristics: • Provide instruction, as needed based on assessment data, in (1) financial planning, (2) self-help, (3) cooking,
(4) housekeeping, (5) home maintenance, (6) using transportation, (7) clothing care, (8) accessing community services, (9) time/ organizational management, (10) self-determination, (11) social roles/ citizenship, (12) community/peer relationships, or (10) critical thinking and problem solving.
• Embed self-care/independent living skills instruction into academic coursework to help students connect academic skills to post-school goals.
• Provide instruction in self-care independent living skills in multiple settings including general education, special education, and community.
• Provide individual, small group, or whole class instruction in independent living and self-care skills, as
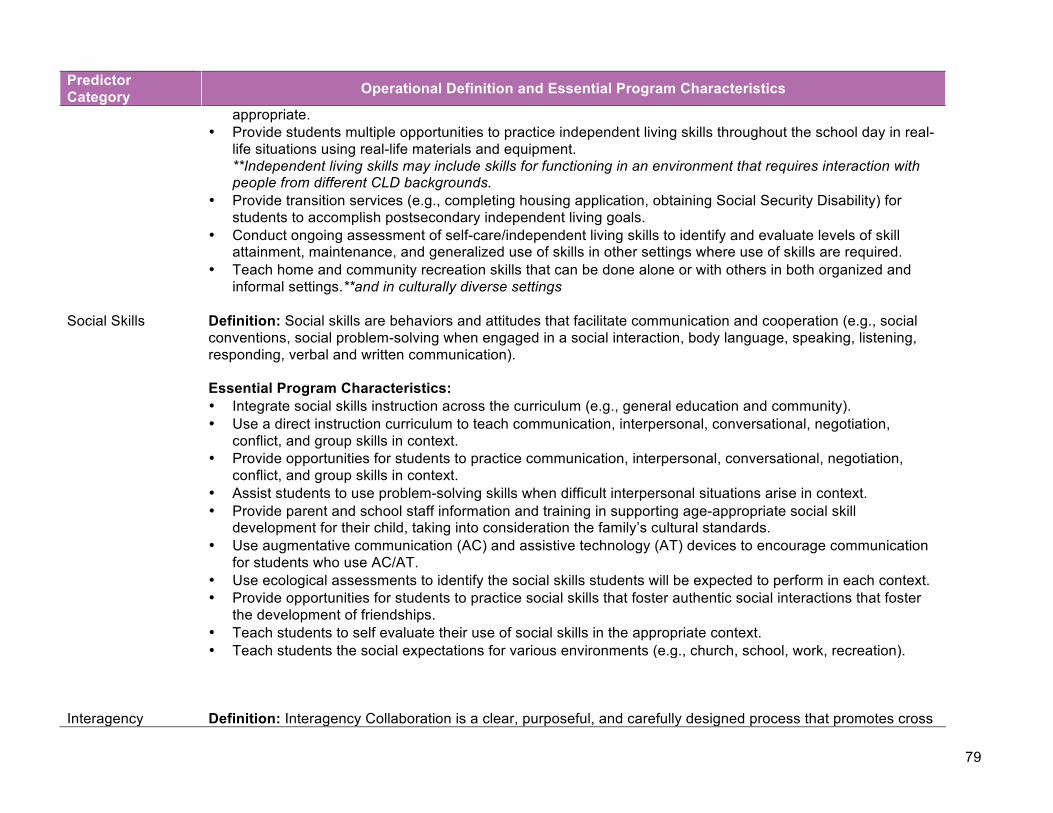
79
Predictor Category Operational Definition and Essential Program Characteristics
appropriate. • Provide students multiple opportunities to practice independent living skills throughout the school day in real-
life situations using real-life materials and equipment. **Independent living skills may include skills for functioning in an environment that requires interaction with people from different CLD backgrounds.
• Provide transition services (e.g., completing housing application, obtaining Social Security Disability) for students to accomplish postsecondary independent living goals.
• Conduct ongoing assessment of self-care/independent living skills to identify and evaluate levels of skill attainment, maintenance, and generalized use of skills in other settings where use of skills are required.
• Teach home and community recreation skills that can be done alone or with others in both organized and informal settings.**and in culturally diverse settings
Social Skills
Definition: Social skills are behaviors and attitudes that facilitate communication and cooperation (e.g., social conventions, social problem-solving when engaged in a social interaction, body language, speaking, listening, responding, verbal and written communication). Essential Program Characteristics: • Integrate social skills instruction across the curriculum (e.g., general education and community). • Use a direct instruction curriculum to teach communication, interpersonal, conversational, negotiation,
conflict, and group skills in context. • Provide opportunities for students to practice communication, interpersonal, conversational, negotiation,
conflict, and group skills in context. • Assist students to use problem-solving skills when difficult interpersonal situations arise in context. • Provide parent and school staff information and training in supporting age-appropriate social skill
development for their child, taking into consideration the family’s cultural standards. • Use augmentative communication (AC) and assistive technology (AT) devices to encourage communication
for students who use AC/AT. • Use ecological assessments to identify the social skills students will be expected to perform in each context. • Provide opportunities for students to practice social skills that foster authentic social interactions that foster
the development of friendships. • Teach students to self evaluate their use of social skills in the appropriate context. • Teach students the social expectations for various environments (e.g., church, school, work, recreation).
Interagency
Definition: Interagency Collaboration is a clear, purposeful, and carefully designed process that promotes cross

80
Predictor Category Operational Definition and Essential Program Characteristics
Collaboration
agency, cross program, and cross disciplinary collaborative efforts leading to tangible transition outcomes for youth. Essential Program Characteristics: • Develop wide reaching state interagency teams that includes disability related and non-disability related
agencies (e.g., Developmental Disabilities, Vocational Rehabilitation, Department of Labor, Social Security Administration) with a common interest in transition service delivery.
• Develop and implement formal and informal agreements between agencies responsible for the delivery of transition services.
• Develop an agreed upon vision and mission of transition services and programs. • Develop an organizational structure that includes a process for identifying membership (e.g., criteria for
membership), terms of services, procedures for replacing members, orientation for new members, and web-based and print membership directories.
• Coordinate the development of policies and procedures for service delivery and sharing of resources by both school and community agencies.
• Implement a state-wide plan that (1) addresses gaps, (2) includes strategies for blending and braiding funding of other resources, (3) streamlines the transition process, and (4) eradicates duplication of service delivery.
• Conduct asset/resource mapping to identify all community agencies that support youth with disabilities in the area as well as gaps in service delivery.
• Clearly define roles and responsibilities of each organization a part of the interagency agreement. • Schedule regular times for planning, developing, and measuring the progress and effectiveness of
implementing a shared transition service delivery system at all levels (e.g., individual student, school, local, region, state, and nation).
• Develop procedures for shared problem-solving to address needs of students with disabilities and the barriers they may face during the transition process.
• Develop procedures for school staff to have systematic way to include students, families, community members, and agencies at different levels of the transition process (e.g., when to invite to IEP meetings, when to refer families to meet with agency, when to provide information sheet to family)
• Establish multiple methods of communication and information sharing across agencies. • Provide cross-discipline professional development opportunities for all members of interagency council to
ensure members are knowledgeable about services and eligibility criteria. Parental
Definition: Parent Involvement means parents /families/guardian are active and knowledgeable participants in

81
Predictor Category Operational Definition and Essential Program Characteristics
Involvement
all aspects of transition planning (e.g., decision-making, providing support, attending meetings, and advocating for their child). Essential Program Characteristics: • Provide relevant information about transition planning to parents through a variety of means (e.g., written,
face-to-face, community-based trainings such as Autism Society) at each stage of the transition planning process, such as transition from middle to high school, age of majority, graduation.
• Link parents with support networks (e.g., networking opportunities with other parents, advocacy groups). • Provide multiple options for involvement (e.g., pre-IEP planning input, flexible IEP meeting times) and
alternate ways to obtain input in the transition planning process. **Consider parents’ perceptions in transition planning that may conflict with mainstream professional ideas. Some parents from CLD backgrounds may not be supportive of transition activities if they feel the plans are contrary to their expectations.
• Establish a welcoming atmosphere in the school by developing a system of ongoing communication and interaction (e.g., e-mail, notes home, home visits, and regularly scheduled meetings in addition to IEP meetings).**Consider the language and cultural needs of parents from CLD backgrounds
• Provide fairs, brochures, or workshops to educate parents about adult services and post-school supports in the community (e.g., vocational rehabilitation, mental health resources, postsecondary education institutions and supports). **Consider developing material in languages accessible to target communities.
• Provide staff training on culturally competent transition planning (e.g. recognizing and honoring differences such as ethnic, socioeconomic, and values of the family).
• Actively engage parents in interagency transition councils. • Collaborate with families to identify how the school and family/guardian can support the student in achieving
their desired post-school goals. • Share transition assessment results with parents so that parent can use the information to provide training for
their child in the home and the community and identify natural supports. Student Support
Definition: Student support is a network of people (e.g., family, friends, educators and adult service providers) who provide services and resources in multiple environments to prepare students to obtain their annual transition and post-secondary goals aligned with their preferences, interests, and needs.. Essential Program Characteristics: • Develop and implement procedures for cultivating and maintaining school and community networks to assist
students in obtaining their postsecondary goals. **Consider networks that are culturally, racially, and ethnically representative to accommodate the needs of CLD students.

82
Predictor Category Operational Definition and Essential Program Characteristics
• Provide students access to rigorous, differentiated academic instruction.**As well as teachers who use culturally responsive teaching strategies
• Link students to appropriate individuals who can assist student in obtaining access to assistive technology resources and teach students to use technology to enhance their academic and functional performance.
• Link students to appropriate individuals who can provide support for financial planning, navigating the health care system, adult services, or transportation.
• Link students to a community mentor and/or school based mentor/ graduation coach. • Provide opportunities for meaningful engagement in the community (e.g., clubs, friends, advocacy groups,
sports, etc.). • Ensure teachers and other service personnel provide ongoing transition assessment to assist in planning for
needed supports and resources in-school and beyond. Transition Program
Definition: A transition program prepares students to move from secondary settings (e.g., middle school/high school) to adult-life, utilizing comprehensive transition planning and education that creates individualized opportunities, services, and supports to help students achieve their post-school goals in education/training, employment, and independent living. Essential Program Characteristics: • Provide systems level infrastructure (e.g., highly qualified staff and administrators with defined roles
and responsibilities, sufficient budget) to monitor and guide students to obtain post-school goals. • Provide integrated instruction in all areas of independent living (e.g., community living, transportation,
recreation leisure, self-advocacy, goal setting, decision making) for all students with disabilities. • Provide individualized transition focused curriculum and instruction based on students’ postsecondary
goals in postsecondary education, employment, and independent living (e.g., self-determination, financial planning).
• Provide instruction and training in natural environments supported by classroom instruction. • Provide individualized transition services based on students’ postsecondary goals in postsecondary
education, employment, and independent living (e.g., self-determination and financial planning). • Provide opportunities for engagement with non-disabled peers in the school and community. • Use interagency collaboration with clearly defined roles and responsibilities to provide coordinated
transition services (e.g., Vocational Rehabilitation, Mental Health) at multiple levels (i.e., student, school, districts, region, state) to assist students in meeting their postsecondary goals.
• Monitor and assess students’ progress in the domains of academics, daily living, personal and social, and occupational.
• Use multiple strength-based assessments across multiple domains at different points in time to assist student and IEP teams in post-school planning.

83
Predictor Category Operational Definition and Essential Program Characteristics
• Provide training and resources to families to involvement them in transition planning and connect them to adult agencies and support and information networks.
• Conduct program evaluation to assess effectiveness of transition program. Diagnostic Data System
Definition: A Diagnostic Data System is a structure for schools to collect and use longitudinal data on the academic and behavior performance of youth while in-school to promote students’ engagement in learning and at school. Essential Program Characteristics: • Use longitudinal, student-level data to get an accurate read of graduation and dropout rates. • Use data to identify incoming students with histories of academic problems, truancy, behavioral
problems, and retentions. • Monitor the academic and social performance of all students continually. • Review student-level data to identify students at-risk of dropping out before key academic transitions. • Monitor students’ sense of engagement and belonging in-school. • Collect and document accurate information on student withdrawals
Note: Double asterisk (**) indicates a recommendation by the Equity Assistance Center (EAC) to address cultural relevance and competency.

APPENDIX H:
EVIDENCE-BASED PRACTICES IN
SECONDARY TRANSITION

EVIDENCE-BASED PRACTICES IN
SECONDARY TRANSITION An evidence-based practice (EBP) is a teaching method used to teach a specific skill that has been shown to be effective based on high-quality research (Cook, Tankersly, & Landrum, 2009; Odom, Brantlinger, Gersten, Horner, Thompson, & Harris, 2005). Evidence-based practices apply to secondary transition planning and instruction in the following ways:
v EBPs provide teachers information about what teaching methods in secondary transition have been effective in helping students with disabilities learn specific skills.
v EBPs can be used to support IEP goals and objectives as well as skill development. The table below lists each secondary transition EBP, the specific skill taught using the method, the description of the practice from empirical literature, and references used to establish the practice Test, Fowler, 2009). This list is current as of August 2013. New practices are identified each year. For the most recent list practices and information pertaining to how these practices were identified visit www.nsttac.org.
Evidence-Based Practices
Practice Description
Using Backward Chaining to teach Functional Life Skills
Backward chaining is defined by all behaviors identified in the task analysis initially completed by the trainer, except for the final behavior in the chain. When the learner performs the final behavior in the sequence at the predetermined criterion level, reinforcement is delivered and the next-to-last behavior is introduced (Cooper, Heron, & Heward, 2007).
Using Check and Connect to promote Student Participation in the IEP Meeting
Check and Connect is a structured intervention model designed to assist schools and organizations in identifying students who are at risk for dropping out of school, then pairing those students with mentors who address each student’s individual needs to help them progress toward school completion (http://checkandconnect.org/model/default.html; Christenson et al., 2008).

86
Evidence-Based Practices
Practice Description
Using Community Based Instruction to teach: • Banking Skills • Grocery Shopping • Integration Skills • Purchasing Skill • Safety Skills • Communication
Skills • Employment Skills • Community
Integration
Community based instruction is teaching functional skills that take place in the community where target skills would naturally occur (Brown et al., 1983).
Using Computer Assisted Instruction to teach: • Food Preparation
and Cooking Skills • Grocery Shopping
Skills • Job Specific Skills • Student
Participation in the IEP
Computer-assisted instruction (CAI) has been defined as “the use of a computer and other associated technology with the intention of improving students’ skills, knowledge, or academic performance” (Okolo, Bahr, & Rieth, 1993, p. 1) and is synonymous with terms such as computer-based instruction, computer-mediated instruction, interactive hyper-media instruction, and multimedia instruction. CAI offers an interactive format that can provide examples and feedback to students, while including multiple components, such as graphics, photographs, audio, text, and video (Hutcherson, Langone, Ayres, & Clees, 2004).
Using Constant Time Delay to teach: • Banking Skills • Functional Life
Skills • Leisure Skills • Job Specific Skills • Food Preparation
Skills
Constant time delay is a variation of time delay, a prompting procedure that uses variations in the time intervals between presentation of the natural stimulus and the response prompt. Time delay transfers stimulus control from a prompt to the natural stimulus by delaying the presentation of the prompt following the presentation of the natural stimulus. Constant time delay is implemented by presenting several trials using a 0-second delay between the presentation of the natural stimulus and the response prompt. The trials that follow the simultaneous prompt condition apply a fixed time delay (e.g., 3 seconds or 5 seconds; Cooper, Heron, & Heward, 2007).

87
Evidence-Based Practices
Practice Description
Using an Extension of Career Planning Services after Graduation to promote Increased Finance Skills
Services extended beyond graduation include any individualized services focused on postsecondary achievement provided after a student completes the secondary program. In the study used to establish the evidence base for extending services beyond high school to increase finance skills (Izzo, Cartledge, Miller, Growick, & Rutkowski, 2000) services included: • Vocational assessment • Agency contacts • IEP meetings • Vocational training • Employability counseling • Job club • Job interview assistance • Job development • Job coaching
Using Forward Chaining to teach Functional Life Skills
Behaviors identified in a forward chaining task analysis are taught in their naturally occurring order. Reinforcement is delivered when the predetermined criterion for the first behavior in the sequence is achieved then the next step in the task analysis is taught (Cooper, Heron, & Heward, 2007).
Using Least to Most Prompting to teach: • Food preparation
and Cooking • Communication
Skills • Functional Life
Skills • Grocery Shopping
Skills • Purchasing Skills • Safety Skills • Specific Job Skills
A system of least-to-most prompts is a method used to transfer stimulus control from response prompts to the natural stimulus whenever the participant does not respond to the natural stimulus or makes an incorrect response. Least-to-most prompts begin with the participant having the opportunity to perform the response with the least amount of assistance on each trial. Greater degrees of assistance are provided with each successive trial without a correct response (Cooper, Heron, & Heward, 2007).
Using Progressive Time Delay to teach: • Purchasing Skills • Safety Sills • Functional Life
Skills
Progressive time delay is a variation of time delay, a prompting procedure that uses variations in the time intervals between presentation of the natural stimulus and the response prompt. Time delay transfers stimulus control from a prompt to the natural stimulus by delaying the presentation of the prompt following the presentation of the natural stimulus. Progressive time delay is implemented by presenting a trial with a 0- second delay between the presentation of the natural stimulus and the response prompt and then gradually and systematically extending the time delay, often in one second intervals (e.g., 0 sec to 2 sec to 3 sec; Cooper, Heron, & Heward, 2007; Collins & Stinson, 1994-1995).

88
Evidence-Based Practices
Practice Description
Using Published Curricula to teach Student Involvement in the IEP
Published curricula to teach student involvement in the IEP meeting includes the following curricula: • The Self-Directed IEP (Martin et al., 2006) • Self-Advocacy Strategy (Test and Neale, 2004) • Whose Future is it Anyway? (Lee et al., 2010) • An adapted version of Personal Futures Planning model (Miner and
Bates, 1997)
Using the Self-Advocacy Strategy to teach Student participation in the IEP Meeting
The Self-Advocacy Strategy (SAS) is a motivation and self-determination strategy designed to prepare students to participate in education or transition planning conferences. The strategy consists of 5 steps, which are taught over a series of seven acquisition and generalization stages. The five steps are presented using the mnemonic “I PLAN” to help cue students to remember the steps for the strategy. I PLAN represents:
I - Inventory completed by students listing their strengths, weaknesses, learning needs, goals, and choices to prepare them for their upcoming IEP conference
P - Provide your inventory involves identifying appropriate time for individual to share information during the conference, speaking clearly and completely, and referring to inventory as needed
L - Listen & Respond addresses being an active listener and responding to statements made by others in a positive manner
A - Ask questions focuses on asking appropriate questions to gather needed information
N - Name your goals to communicate goals and ideas on actions to be Taken
Using the Self-Determined Learning Model of Instruction to teach Goal Attainment
The Self-Determined Learning Model of Instruction (SDLMI) is a curriculum that teaches students to engage in self-directed and self-regulated learning. The curriculum is comprised of three units:
1. Set a goal 2. Take action 3. Adjust goal or plan
Students are required to solve the problems through a series of four steps:
1. Identify the problem 2. Identify potential solutions to the problem 3. Identify barriers to solving the problem 4. Identify consequences of each solution
Each question is linked to a set of Teacher Objectives that describe the student outcomes for each question. Each phase includes a list of Educational Supports that teachers can implement to enable students to engage in self-directed learning.

89
Evidence-Based Practices
Practice Description
Using Response Prompting to teach • Preparation and
Cooking Skills • Grocery Shopping
Skills • Home Maintenance
Skills • Laundry Tasks • Leisure Skills • Purchasing Skills • Social Skills • Employment Skills
Response prompting is defined as stimuli that later functions as extra cues and reminders for desired behavior. Prompts can be visual, auditory, textual, or symbolic (Cooper, Heron, & Heward, 2007).
Using the Self-Directed IEP to teach Student Participation in the IEP
The Self-Directed IEP (SD IEP) lesson package is divided into four instructional units, including students leading meeting, reporting interests, reporting skills, and reporting options. It is a multimedia package designed to teach students the skills needed to manage their own IEP meetings. It includes a teacher manual, a student workbook, and two videos that present 11 steps necessary for students to lead their own IEP meetings:
• Begin meeting by stating purpose • Introduce everyone • Review past goals and performance • Ask for others’ feedback • State your school & transition goals • Ask questions • Deal with differences of opinion • State the support you’ll need • Summarize your goals • Close meeting • Work on IEP goals all year
Instruction follows a model-lead-test format.

90
Evidence-Based Practices
Practice Description
Using Technology to teach Academic Skills
Technology can be defined in many ways: • Computer-based instruction (CBI) is when computers or associated
technology are used to improve students’ skills, knowledge, or academic performance (Okolo et al., 1993)
• Computer-assisted instruction (CAI) includes software designed to provide instruction and practice for meeting specific learning objectives or goals with drill-and-practice or tutorial instruction (Kulik & Kulik, 1987; Posgrow, 1990)
• Computer-enriched instruction (CEI) is the utilization of computer technology to augment instruction and includes usage of the computer as a calculating tool, a programming tool, and to conduct simulations (Kulik & Kulik, 1987)
• Computer-managed instruction (CMI), also referred to as integrated learning system (ILS), is used to describe the application of computer technology and extensive software programs designed to present sequential instruction to students over extended periods of time while maintaining records of student progress (Kulik, 2003, May)
Using Total Task Chaining to teach Functional Life Skills
Total task chaining is defined as a variation of forward chaining in which the learner receives training on each step in the task analysis during each session (Cooper, Heron, & Heward, 2007). Total task chaining is also sometimes referred to as concurrent training (McDonnell & Laughlin, 1989).
Using Training Modules to promote Parent Involvement in the Transition Process
A training module is a unit of education or instruction with a relatively low student-to-teacher ratio, in which a single topic or a small section of a broad topic is studied for a given period of time. http://thefreedictionary.com/module.
Using Video Modeling to teach: • Food Preparation and
Cooking Skills • Home Maintenance
Skills
Video modeling is a form of video response prompting. Response prompting is defined as a stimuli that later functions as extra cues and reminders for desired behavior (Cooper, Heron, & Heward, 2007).
Using Visual Displays to teach Academic Skills
Visual displays are tools used to represent the complexity of the mental and physical world in which we live (Hyerle, 1996, 2000). Visual displays are used in several ways including: graphic organizers, cognitive organizers, cognitive maps, structured overviews, tree diagrams, concept maps, and Thinking Maps (Boyle, 2000; Horton, Lovitt, & Bergerud, 1990; Hyerle, 1996, 2000).

91
Evidence-Based Practices
Practice Description
Using “Whose Future Is It?” to teach: • Self-Determination • Student Knowledge of
Transition Planning Process
“Whose Future is it Anyway?” (WFA) is a student-directed transition planning curriculum designed to help students learn to be more involved in the IEP process. The curriculum is comprised of six sections and 36 sessions related to: • Having self-awareness and disability awareness • Decision making about transition-related outcomes identifying and
securing community resources to support transition services • Writing and evaluating goals and objectives • Communicating effectively in small groups • Developing skills to become and effective team member, leader, or
self-advocate
Using Self-Management Instruction to teach: • Academic Skills • Social Skills • Job Specific Skills
Defining characteristics of self-management interventions include “methods used by students to manage, monitor, record, and/or assess their behavior or academic achievement” (Reid, Trout, & Schartz, 2005, p. 362). Self-management has also been called: self-monitoring (n=5 studies), self-evaluation (n= 2 studies), self-instruction (n=2 studies), goal setting (n= 1 study), strategy instruction (n= 1 study). In addition, components can be combined (n=7 studies). • “Self-monitoring is a multi-stage process of observing and recording
one’s behavior” (Mooney et al., 2005, p. 204). • “Self-evaluation is a process wherein a student compares her/his
performance to a previously established criterion set by student or a teacher and is awarded reinforcement based on achieving the criterion” (Mooney et al., 2005, p. 207).
• “Self-instruction refers to techniques that involve the use of self-statements to direct behavior” (Mooney et al., 2005, p. 204).
“Goal setting generally refers to a process of a student self-selecting behavioral targets, which serve to structure student effort, provide information on progress, and motivate performance” (Mooney et al., 2005, p. 204). “Strategy instruction refers to teaching students a series of steps to follow independently in solving a problem or achieving and outcome” (Mooney et al., 2005)
Using Self-Monitoring Instruction to teach Functional Life Skills
Self-monitoring is defined as a procedure whereby a person observes his behavior systematically and records the occurrence or nonoccurrence of a target behavior (Cooper, Heron, & Heward, 2007). The procedure is also called self-recording and self-observation.

92
Evidence-Based Practices
Practice Description
Using Simulations to teach: • Banking Skills • Purchasing Skills • Social Skills
Simulation is defined as using materials and situations in the classroom that approximate the natural stimulus conditions and response topographies associated with the performance of functional skills in community settings (Bates et al., 2001).
Using Mnemonics to teach: • Job Application Skills • Academic Skills
Mnemonics is defined as using keywords that provide acoustic reconstructions of unfamiliar information such as symbolic pictures of abstract concepts or descriptive pictures of concrete information (Scruggs & Mastropieri, 1989).
Using Most to Least Prompting to teach Functional Life Skills
A system of most-to-least prompts is a method used to transfer stimulus control from response prompts to the natural stimulus whenever the participant does not respond to the natural stimulus or makes an incorrect response. Most-to-least prompting starts with physically guiding the participant through the performance sequence, then gradually reducing the amount of physical assistance provided as training progresses from session to session (Cooper, Heron, & Heward, 2007).
Using the “One-More- Than” Strategy to teach: • Counting Money • Purchasing Skills
The One-More-Than Strategy is a rounding up strategy that teaches individuals to give “one more” dollar than the amount requested (e.g., if the requested amount is $3.29, the individual gives $4.00 and waits to receive change; Denny & Test, 1995). The strategy is also referred to as “next dollar”, “counting on”, or “dollar more”.
Using Peer Assisted Instruction to teach Academic Skills
Teaching using peer assistance may include the following: Peer tutoring as the delivery of instruction by another student, either older or the same age as the tutee (Scruggs et al., 1985). Cooperative learning is when groups of students of different ability, sex, or ethnicity work together to achieve mutual goals (Tateyama-Sniezek, 1990). Peer instruction is when students are given specific roles to assist other students in completing an activity or teaching of a lesson (Hughes, Carter, Hughes, Bradford, & Copeland, 2002).

93
For help using STEPSS or other tools to support secondary transition for students with disabilities, contact the national
technical assistance centers:
This document was developed by the National Post-School Outcomes Center, Eugene, Oregon, (funded by Cooperative Agreement Number H326U090001) with the U.S. Department of Education, Office of Special Education and Rehabilitative Services, The National Secondary Transition Technical Assistance Center, Charlotte, NC (funded by Cooperative Agreement Number H326J11001) with the U.S. Department of Education, and The National Drop-out prevention Center for Students with Disabilities, Clemson, SC (funded by Cooperative Agreement Number H326W080003) with the U. S. Department of Education. This document has been reviewed and approved by the Office of Special Education Programs. Opinions expressed herein do not necessarily reflect the position or policy of the U.S. Department of Education nor does mention of trade names, commercial products, or organizations imply endorsement by the U.S. Department of Education. OSEP Project Officers: Drs. Selete Avoke and Marlene Simon-Burroughs.
The National Post-School Outcomes Center www.psocenter.org
The National Secondary Transition Technical Assistance Center www.nsttac.org
The National Dropout Prevention Center for Students with Disabilties www.ndpc-sd.org


![[Facilitator’s Name] [Date]](https://img.pdfslide.us/doc/110x75/56815d4a550346895dcb5375/facilitators-name-date.jpg)