Embed Size (px)
Citation preview

Steps to Excellence Project Pilot Process Evaluation
Participant experiences and feedback regarding the pilot of the Steps to Excellence Project—STEP—Los Angeles County’s first child care Quality Rating and Improvement System.
Prepared by Wold and Associates
for the
Office of Child Care, Services Integration Branch
and the
Los Angeles County Policy Roundtable
for Child Care
November 29, 2011

Contents
STEP Pilot Process Evaluation Wold and Associates | i
Contents Executive Summary ........................................................................... ii Key Findings ...................................................................................... ii Provider Characteristics .................................................................... ii Experience with STEP ....................................................................... iii Impact of STEP ................................................................................. iii Opportunities for Improvement ....................................................... v Recommendations ........................................................................... vi Introduction ...................................................................................... 8 Steps to Excellence Project ............................................................... 8 Quality Rating and Improvement Systems ....................................... 8
Evaluation Objectives and Methods .................................................. 9 Objectives ......................................................................................... 9 Methods ............................................................................................ 9 Survey of STEP Participants .............................................................. 9 Group Interviews ............................................................................ 11 Findings ........................................................................................... 12 Survey of STEP Participants ............................................................ 12 Response Rate ................................................................................ 12 Sample Characteristics: Respondents vs. Non-respondents .......... 12 Provider and Program Characteristics ............................................ 12 Funding Subsidies and Sources ....................................................... 13 Use of Educational Incentives and Stipends ................................... 13 Overall Experience with STEP ......................................................... 14 Community Building ....................................................................... 15 Time Required and Difficulty of the STEP Components ................. 15 Technical Assistance and Training .................................................. 17 Progress by STEP Quality Domain ................................................... 18 Findings from Focus Groups ........................................................... 24 Conclusions and Recommendations ................................................ 29 Conclusions ..................................................................................... 29
Recommendations .......................................................................... 29 Bibliography .................................................................................... 31

Executive Summary
STEP Pilot Process Evaluation Wold and Associates |ii
Executive Summary Quality Rating and Improvement Systems (QRIS) are of growing importance nationwide. Serving multiple purposes, these systems help families evaluate their child care services options, guide policies to incentivize best practices, and can provide a “hub” for connecting many disparate parts of the early care and education system in support of improved quality and accountability.
In 2007, the first QRIS in Los Angeles County launched the Steps to Excellence Project (STEP) as a pilot program with the following goals:
• Provide parents with clear, concise information on the quality of child care centers and family child care homes.
• Distinguish programs that are meeting higher program standards. • Create an incentive for programs to achieve and maintain higher quality program
standards. • Provide benchmarks to determine if the quality of care in individual programs or
communities is improving over time.
The present evaluation was designed to obtain provider input about the implementation of the STEP pilot program, and to use that input to inform a set of recommendations directed toward further improvements in STEP’s outreach, quality improvement, and quality rating program. To accomplish these aims, the evaluator conducted a survey with family and center-based childcare providers who had completed the STEP program AND received their rating prior to the end of 2010. The evaluation also obtained input from focus group discussions held with approximately 80 stakeholders, and linked the survey results with program administrative data.
Key Findings Provider Characteristics
The survey had a 31% response rate and represented a range of STEP levels, three languages (English, Spanish, and Cambodian), and all of the ten STEP pilot communities. Most (80%) of center-based child care providers (Center CC) and 18% of family providers (Family CC) reported having children on their waiting lists. One fifth of Family CC reported that their enrollment was larger now than before completing STEP.
STEP-rated providers reported participating in public programs—subsidy as well as workforce development programs. For example, 80% of Center CC providers contract with the California Department of Education (CDE); 60% of Family CC participate in the Alternative Payment program and 45% in the California Work Opportunity and Responsibility to Kids (CalWORKs) voucher program. Further, 43% of all STEP-rated

Executive Summary
STEP Pilot Process Evaluation Wold and Associates | iii
providers were assisted by the Child Development Training Consortium, 31% used the LA County Investing in Early Education stipends, 12% used the Los Angeles Universal Preschool (LAUP) stipends, and 8% used Head Start stipends.
Experience with STEP
The focus groups praised the importance of STEP and the value of quality rating and improvement to the Early Childhood Education (ECE) field. (Note: Focus group comments are presented as written with minor corrections for spelling.)
It is so important “to have tools to show we’re accountable and to define what quality is.” The plans for a statewide quality rating system also factored in. “That recognition of the importance of having a dependable, reliable, well-oiled quality rating system…it’s going to benefit us—help us with funding and a lot of other things.”
Providers overwhelmingly reported positive experiences with STEP. The survey found that 54% had a “very positive” and 44% a “mostly positive” experience with STEP. Further, 94% agreed that STEP helped them prioritize their program improvement goals; 88% said that STEP participation helped them improve the quality of services provided to children and families; 84% considered the STEP criteria to be clearly presented; and 87% understood how to progress to the next STEP level.
Over half of providers indicated that they wanted to be re-rated, and most thought their rating would be higher now. Over half felt that their initial STEP rating accurately reflected their programs’ strengths and areas for improvement, 32% felt that their initial rating “mostly” reflected same, and 14% felt the rating “did not” reflect the same. Although over 60% received the ratings they expected, 39% did not, and many thought some of the recommended changes were outside their program’s control. The focus group feedback confirmed the need for some adjustments to the STEP rating scale and STEP program, some of which have already occurred, and the desire by several providers to be re-rated.
For most respondents (approximately two-thirds on average), the time required and difficulty of the STEP process was about what they expected. However, selected components (for example, the Portfolio) appeared to be more time consuming and difficult as compared to the other program components.
Impact of STEP
Participation in STEP appeared to positively impact community building as seen in the survey and focus group findings. Survey respondents reported that STEP participation facilitated a variety of interactions with other child care providers, such as attending events and meeting with directors of other programs. Focus group participants shared stories of collaboration between providers and expressed that such

Executive Summary
STEP Pilot Process Evaluation Wold and Associates | iv
collaboration—for example, pairing STEP-rated providers with those new to the program—could be an asset for boosting recruitment and retention. Consistently, the survey found that 55% of providers (60% of Family CC and 42% of Center CC providers) would be willing to mentor other child care providers going through the STEP process.
“We worked with [another site in the area] and did a lot of the activities together, shared information, identified different strengths, and I thought that was a good strategy – maybe if a program has already gone through it, to maybe be buddied up with [so as to mentor] a new program just starting to go through it.”
Providers attended and valued training and technical assistance provided through STEP. STEP trainings were roundly praised in all three focus groups, and many expressed that such trainings provided a resource that they could never afford otherwise, such as those on infant toddler care, assessing and working with children with special needs, and adult-child interactions. Multiple comments specifically praised the quality of the presenters and usefulness of the material. The survey found that the technical assistance and support provided by STEP staff were highly valued; after training, the technical assistance and mini-grants were frequently cited as valuable for progress made within the STEP quality domains. Over three-fourths of survey respondents attended Building Positive Relationships with Children, Developmental Screening Tools, Inclusion of Children with Special Needs, Quality Learning Environments, and the STEP Orientation and Portfolio trainings. Training attendance was more frequent among Family CC providers as compared to Center CC providers. Survey respondents suggested many topics for future trainings related to business processes (computer technology, finance, management) and child development.
“The trainings are excellent. Not one that wasn’t good.”
“STEP brought us a lot of resources that we would not have had otherwise…[For example]… the PEDS training [using Parent's Evaluation of Developmental Status, or PEDS, tool to identify developmental delays and disabilities] for us through STEP program was very cost effective. If we would have gone out on the market that training would have cost thousands of dollars. That gave us a big jump start.”
Providers assessed their own progress within the five STEP quality domains, with Family CC providers citing higher levels of progress as compared to Center CC providers, which is no doubt reflective of different starting places overall, but nonetheless reflects increases in specific knowledge and skills within each domain. On average, 69% of respondents reported “major progress” in the Quality Learning Environments; 59% in Identification and Inclusion of Children with Special Needs, 53%

Executive Summary
STEP Pilot Process Evaluation Wold and Associates | v
in Community and Family Connections, 52% reported “major progress” in Teacher-Child Relationships; and 38% in Staff Qualifications and Working Conditions.
Opportunities for Improvement
The results of the survey and focus groups suggested opportunities to improve communication with providers. Providers expressed interest in learning about STEP’s future, and its relationship to other quality rating and improvement programs, such as LAUP. In addition, they suggested a need to return to some of the objectives expressed during the initial excitement of the roll-out, including communication materials about the rating scale itself for parents and providers.
“[There was] a lot of excitement [when STEP came out]….many of us were opting out of NAEYC because the costs had gone up, paperwork was difficult. Even if we could not be part of the original process [outside of the pilot communities] we were excited because it was presented as a viable alternative [to NAEYC accreditation]…it would go statewide, and there would be a lot of publicity—explanations to parents about the ratings (e.g., that a ‘3’ was actually a very good school, and that there would not be a lot of fives…but parents would understand that attaining a “5” may require a financial commitment that some schools could not make [even schools providing excellent quality].“
Providers who went through the STEP process when the program was new would benefit from hearing about the results from the pilot—descriptive results and program changes and plans—and being offered a re-rating. Comments from providers who had gone through STEP in its early stages suggested a need to hear about (and more strongly, suggested that there may be serious misperceptions about), for example, the validity and reliability of the rating scales and raters, and rationale for STEP criteria.
A major theme was the perception (and possible misperception) that a provider would get “stuck” with a rating. Comments strongly suggested that stories had circulated about low ratings, and this was likely to have contributed to non-participation or non-retention, especially among Family CC providers.
“When some of the initial scores came out there was concern [about] the level of work that went into it and the scores that came out. Programs are fearful to participate. We were [initially interested] because of the resources, trainings, all the positive things.” [Did not participate in STEP]
For some of the providers in the very early cohort, there seemed to be heightened confusion and frustration around the follow up:
“For a long time now we have not heard anything from STEP. We’ve wanted to appeal some of the initial assessment and don’t really know how to do that; wanted some TA on some of the areas of weakness where we want to improve. A “big hole” was left with [STEP staff’s] departure.

Executive Summary
STEP Pilot Process Evaluation Wold and Associates | vi
“What’s next in terms of the STEP process–we started process and are interested in progressing. Now what?”
“One of my sites participated—we have two—there was a strong start to the process, then somewhere mid-point there was a change in personnel and after that nothing happened. We were [initially] enthused and engaged…have not had any momentum since.”
“So we were waiting to hear information about the ‘what next’. When would there be another round? Could you buy in? And then there was a sort of silence, other than hearing that some of the schools were starting to get scores, and hearing [rumors] that there wasn’t a way that you could improve.”
Recommendations The evaluation identified a number of STEP strengths, including positive experiences, beneficial training and support, and program improvements for a majority of child care providers. These assets could be built upon to address those STEP areas needing improvement, including communication, provider recruitment, and program retention.
Identify providers who had positive experience and incentivize them to serve as mentors to new participants; consider providing incentives for referrals. Providers expressed a high value for collaboration and reported increased and varied interactions with other providers as a result of STEP. Providers who collaborated seemed to have positive experiences with the process. Further, many expressed a willingness to mentor other programs. Word of mouth is an important recruitment tool and potentially effective strategy for reaching out to new participants. Mentoring may also help to stretch program resources by encouraging peer support and sharing of expertise.
Clarify the process of self-assessment, rating, and appeal and explain the information about the validity of the rating scales (and norms). Providers are very interested in hearing more about the pilot—lessons learned and any changes to the rating scale and program adjustments—and the future of STEP. Such communication would go a long way toward building the necessary community buy in and clarifying the opportunities for improvement, including being re-rated, possibly countering the perception that once rated “you are stuck.”
Explore approaches to achieving greater progress in the area of staff qualifications overall and at the intersection of special needs qualifications. In response to such feedback, consider aligning STEP with staff qualifications for the CDE and school districts, and with educational requirements at community colleges (for AA) and universities (for BA). Consider allowing equivalent training in special needs to replace unit bearing coursework where appropriate.
Executive Summary
STEP Pilot Process Evaluation Wold and Associates | vii
Follow up with the early cohort of STEP participants; share evaluation findings and review program changes (to date and pending) in response to the expressed negative experiences or delays in appeals.
Collect timely feedback about rating experience and receipt of results. Such feedback would likely be more accurate information and would provide a basis for taking action. Perhaps the raters could revisit their assessments in a more timely way to correct any misperceptions or misunderstandings generated on the part of observers or providers.
Generate materials for parents and families to explain and interpret the rating scale. For example, consider on-line, interactive tools as well as print materials to address provider feedback. In addition, update the STEP website to acknowledge participating programs and their commitment to quality and to market the program. For example, consider designating any participating provider as “quality rated” so as to credit them appropriately for going through the program. Consider playing down a level of 4 or 5 in favor of level 3s.
Engage in advanced planning with other organizations, such as the Child Care Resource and Referral agencies, around training and mentoring and funding. Collaboration with other agencies may help to identify “places” to target in the future, e.g., Best Start or Promise Neighborhoods, as well provide more stability of support to sustain efforts in the current funding climate.
Introduction
STEP Pilot Process Evaluation Wold and Associates | 8
Introduction Steps to Excellence Project In 2007, the Los Angeles County launched the Steps to Excellence Project (STEP) as a pilot program with the following goals:
• Provide parents with clear, concise information on the quality of child care centers and family child care homes.
• Distinguish programs that are meeting higher program standards. • Create an incentive for programs to achieve and maintain higher quality program
standards. • Provide benchmarks to determine if the quality of care in individual programs or
communities is improving over time.
Administered by the Los Angeles County Office of Child Care, STEP resulted from the collaborative expertise of the Policy Roundtable for Child Care, with support from First 5 Los Angeles, the California Department of Education, the County’s Department of Children and Family Services, Los Angeles Unified School District, and The California Endowment. The UCLA Center for Improving Child Care Quality—in association with the Child Care Resource and Referral agencies and the Community Care Licensing Division of the Department of Social Services—provided critical program design and implementation support.
In 2010, STEP received the National Association of Counties Achievement Award, the California State Association of Counties Merit Award, and the Los Angeles County Quality and Productivity Commission Merit Award.
Quality Rating and Improvement Systems Quality Rating and Improvement Systems (QRISs) are used across the nation to assess child care quality. QRSs serve multiple purposes, such as helping families evaluate their child care services options and guiding policies to incentivize best practices. QRSs have the potential to serve as a “hub” for connecting many disparate parts of the early care and education system that together work to support a vital and accountable enterprise for children and families. An April 2010 compendium of 26 leading child care QRISs across the nation, including STEP, affirmed the growing importance of such systems on the landscape of early child care services.

Evaluation Objectives and Methods
STEP Pilot Process Evaluation Wold and Associates | 9
Evaluation Objectives and Methods Objectives Provider feedback is a critical component of STEP’s strategy for evaluating the pilot implementation. The Los Angeles County Office of Child Care contracted with Wold and Associates to survey and interview child care providers to obtain provider input about the implementation of the STEP program, and to use that input to inform a set of recommendations that will lead to further improvements in STEP’s outreach, quality improvement, and quality rating programs.
More specifically, the evaluation sought to:
Assess participant’s experiences with the STEP quality rating process. 1. Assess the impact of STEP activities—training, technical assistance (TA), mini 2.
grants—on the program’s goals. Obtain feedback from child care providers about the effectiveness of STEP’s 3.
outreach and recruitment activities as well as barriers to participating in (or completing) the STEP process.
Methods The data collection methods included a survey of child care providers, group discussions with key informants, and linked analysis of administrative data.
Survey of STEP Participants
Approach
Approximately 175 providers were identified to participate in a standardized, self-administered survey. Providers were eligible for inclusion based upon the following criteria:
The provider had completed the STEP program and had received their rating on or 1.before December 31, 2010 (n=96 center-based and n=82 family child care providers).
The provider was still in operation or associated with the same. 2. The provider spoke English or Spanish, or was interested in conducting an 3.
interview in Cambodian with an interviewer/translator.
The goal of the STEP evaluation was to obtain provider input… to inform a set of recommendations that will
lead to further improvements in STEP’s outreach, quality
improvement, and quality rating program.

Evaluation Objectives and Methods
STEP Pilot Process Evaluation Wold and Associates | 10
The survey used the online Survey Monkey tool. All survey data were entered into Survey Monkey, exported into Microsoft Excel tables, and analyzed using SAS (Statistical Analysis Software, Inc.). Open-ended responses were summarized, where appropriate. Each provider without an e-mail address received a hard copy of the same survey along with a return envelope pre-addressed to the evaluator. The contractor made reminder e-mails and phone calls; the Office of Child Care also made reminder calls to providers who had received the hard copies in addition to those who had been contacted by e-mail but had not responded after several weeks and several reminders.
Survey Topics
The self-administered survey contained approximately 50 questions in the following topics and required an estimated 15–20 minutes to complete.
Administrative/General 1. Overall STEP experience 2. Use and assessment of training and TA 3. Progress within each quality domain 4. Impact of training and TA by quality domain 5. Unique issues by STEP quality domain 6. Interactions with other providers 7. Future plans 8.
Survey Limitations
The survey’s limitations included potential barriers to completion due to limited access to the internet, language skills, and/or literacy, and may have resulted in low response rates and potential non-representativeness and/or response bias due to differential participation. Attempts to improve the representativeness of the sample—i.e., maximize participation and minimize any systematic source of bias—included making the survey accessible through multiple formats (e.g., e-mail and hard copies) and languages, and providing reminders and incentives ($20 Lakeshore gift cards). In addition, the Office of Child Care and a subcontractor with expertise working with child care providers reviewed the survey and edited it to use language accessible by child care providers. This same subcontractor also translated the survey into Spanish. Cambodian translation was offered to providers from the Cambodian community in Long Beach through a local service provider.

Evaluation Objectives and Methods
STEP Pilot Process Evaluation Wold and Associates | 11
Group Interviews
Approach
Supplemental key informant group discussions were conducted in person on three dates in September 2011 with approximately 80 child care providers—STEP participants and non-participants—and arranged through the appropriate local Early Childhood Education (ECE) coordinating groups in Long Beach, Santa Monica, and Pasadena.1 These discussions took place during their regularly scheduled meetings; the STEP discussion was included on the agenda and circulated in advance to encouraged attendance and sharing of feedback.
Interview Topics
Discussion guides were developed and included questions to elicit feedback in the following topics:
Barriers and incentives regarding STEP participation. 1. Recommendations for improving outreach, recruitment and retention. 2. Other feedback about their experiences with STEP. 3.
Interview Limitations
Limitations to the group interview approach may include a reluctance on the part of some participants to make public comments. The contractor did not observe a reluctance to speak from providers familiar with the program, and addressed this potential limitation by offering to follow up and speak privately with interested participants as well as by distributing a written survey with space for comments, which some participants did use. In addition, while these groups have child care providers participating, they are also attended by people who are in the Early Care and Education field but who are not directly providing services. Therefore, in some cases not all attendees were familiar with STEP.
1 Long Beach ECE Committee (September 9, 2011), Santa Monica ECE Task Force (September 21, 2011), and Pasadena Child Care Directors meeting (September 27, 2011).

Findings
STEP Pilot Process Evaluation Wold and Associates | 12
Findings Survey of STEP Participants Response Rate Among the 175 total providers on lists compiled by the Office of Child Care, 54 responded, for an overall response rate of 31%.2 Of the 54 responses, 6 were completed in Spanish and 48 in English (including 2 Cambodian interviews translated into English). A total of 2 observations were excluded from the analysis for the following reasons: One provider completed surveys in both English and Spanish. (The latter was more complete, so the contractor used the Spanish survey and disregarded the survey in English.) One respondent received their rating after December 2010 and was therefore not eligible.
Sample Characteristics: Respondents vs. Non-respondents
Respondents represented a spectrum of STEP levels and communities, and were similar as compared to non-respondents on both characteristics. Table 1 shows how these groups compared based on the most recent overall STEP level based upon information from the administrative data file. The distribution of STEP survey respondents to non-respondents was similar across the ten pilot communities, with Long Beach, Florence Firestone, and Palmdale/Lancaster slightly overrepresented among the respondents.
Table 1. Respondents vs. Non-respondents by STEP Level
STEP Level Respondents (n=49) Non-respondents (n=126)
STEP 1 2.0% (9) 7.1%
STEP 2 (22) 44.9% (47) 37.3%
STEP 3 (18) 36.7% (46) 36.5%
STEP 4 (8) 16.3% (23) 18.3%
STEP 5 – (1) 0.8%
Please note that some respondents could not be identified from their surveys and so it was not possible to match them with their STEP rating.
Provider and Program Characteristics Among respondents, 59% were family child care providers (Family CC) and 41% were center-based child care providers (Center CC). (Participation in the STEP pilot was approximately 60% Center CC and 40% Family CC.)
2 Note: the estimated response rate is conservative—contact information for several providers was out-of-date (e.g., no longer there, invalid e-mail) and are included in the denominator. However, attempts were made to reach all providers (e.g., sending hard copies of the survey via mail for those without valid e-mails), or to survey the new employees, if available.

Findings
STEP Pilot Process Evaluation Wold and Associates | 13
Overall, approximately half of all providers reported having children on their waiting lists; the number of families on the waiting lists varied widely, ranging from 3 to 363 children. Among Center CC providers, most (80%) reported having children currently on their waiting list and most (85%) reported that their enrollment was “about the same” as it was before going through the STEP program.
Among Family CC providers, few (18%) reported that they currently have children on their waiting list, although 20% reported having a larger enrollment than before going through STEP. Sixty-one percent reported that enrollment was “about the same” as it was before going through STEP.
Funding Subsidies and Sources Figure 1 shows the types and sources of funding subsidies reported by the providers. Center CC providers were much more likely than Family CC providers to be California Department of Education (CDE) contractors and less likely to receive subsidies via the Alternative Payment Program and the California Work Opportunity and Responsibility to Kids (CalWORKs) program. Center CCs were more likely to receive Los Angeles Universal Preschool (LAUP) subsidies.
Use of Educational Incentives and Stipends Providers reported the types of support offered to staff seeking to develop skills of complete coursework: While 52% of providers reported that their business provided flexible scheduling, few reported offering increased pay (27%) or stipends (17%); support varied by provider type (Figure 2).
Many reported using the following incentive programs, which also varied by provider type (shown in parentheses for Family CC and Center CC, respectively):
• 43% of providers reported using the Child Development Training Consortium assistance (39% Family CC and 55% Center CC).
• 31% used the Los Angeles County Investing in Early Educators stipends (21% and 50%).
Figure 1. Funding Subsidies and Sources
0.0%
10.0%
20.0%
30.0%
40.0%
50.0%
60.0%
70.0%
80.0%
90.0%
Contractwith CA
Dept. of Ed.
Vouchersfrom
CalWorks
AlternativePaymentProgram
LAUP Head Start
Family CC
Center CC
Total

Findings
STEP Pilot Process Evaluation Wold and Associates | 14
• 12% used the LAUP stipend (7% and 15%).
• 14% of Family CC used Head Start stipends; none were reported among Center CC.
Overall Experience with STEP
The reported overall experience with STEP was positive. Most providers reported that STEP participation helped them improve the quality of their services for children and families. Among those providers who wanted to be re-rated, most thought their rating would be higher now. In addition, providers were highly aligned with most of STEP’s goals.
• Overall, 54% of providers reported that their experience with STEP was “very positive” and 44% reported that it was “mostly positive.” Similar proportions were noted by provider type.
• 54% felt that their initial STEP rating accurately reflected their program’s strengths and areas for improvement; 32% felt that their initial rating “mostly” reflected same. 14% felt that the rating did not reflect same.
• 88% of providers reported that participation in STEP helped them improve the quality of services provided to children and families.
• Over half (53%) would like to be rated again, and nearly 60% believed that, if/when reassessed, their program would receive a higher rating.
To further understand the alignment of the provider’s experiences with STEP goals, providers were asked how strongly they agreed or disagreed with statements about their participation in the STEP program. Differences by provider type are noted.
Statements where the vast majority of providers agreed:
• Participation in STEP helped a majority of respondents (94%) prioritize program improvement goals. This statement was not as strongly endorsed by Family CC providers, 11% of whom disagreed.
• Nearly all (98%) providers reported that they were prepared for the observation of their program; similarly, this statement was more weakly endorsed among Family CC as compared to Center CC.
Figure 2. Percentage Offering Staff Development Support by Provider Type
66
2114
3431
40
3025
20
30
0
10
20
30
40
50
60
70
Flexiblescheduling
Paid time off Stipends Increasedpay
Increasedresponsibility
Family CCCenter CC

Findings
STEP Pilot Process Evaluation Wold and Associates | 15
Statements that received strong, but lower levels, of endorsement, and with which 15% to 20% of providers disagreed:
• 84% of providers felt that the criteria for each quality area were clearly presented. • 87% understood how to progress to the next STEP level.
By contrast, two different statements revealed areas of weaker alignment in one case and discouragement in another:
• 61% agreed and 39% disagreed that their STEP rating was what they expected to receive.
• Most (over 85%) of providers felt that some changes [recommended improvements from the STEP rating] were beyond the program’s control.
Community Building Participation in STEP appeared to have some additional community building benefit as measured by the following reports about interactions with other child care providers (Figure 3):
• 44% reported attending events with other child care providers.
• 25% met with directors of other child care programs.
• 22% observed other classrooms. • 8% toured other child care facilities. • 55% of providers (60% of Family CC and 42% of Center CC providers) said that
they would be willing to mentor other child care providers going through the STEP process.
• 33% replied that they did not know if they were interested in mentoring other providers/programs new to the STEP process.
Time Required and Difficulty of the STEP Components For most respondents (approximately two-thirds on average), the time required and difficulty of the STEP process was about what they expected. However, selected components appeared to be more time consuming, more difficult, or both.
• The portfolio was more often viewed as time consuming and difficult as compared to the other program components. For example, 67% of providers reported that time spent on the portfolio was “more than expected” and 45% said it was “more difficult than expected.”
55% of providers (60% of Family CC and 42% of Center CC providers)
said that they would be willing to mentor other child care providers going through the STEP process.
The portfolio was more often viewed as time consuming and
difficult as compared to the other program components. For example, 67% of providers reported that time
spent on the portfolio was “more than expected” and 45% said it was

Findings
STEP Pilot Process Evaluation Wold and Associates | 16
Figure 3. How else has STEP impacted your interactions with other providers?
The majority of comments were positive concerning the impact of STEP (presented as written with minor corrections for spelling):
1. Help us to learn from one another. 2. Made it easier to meet the children's need and to help me to with my kindergarten readiness
program. 3. Cell group meeting - getting to know. 4. Very helpful. 5. It has been positive. Many providers from other cities are waiting for STEP to branch out to
other communities in LA County. 6. Allowed for a resource to parents about my program. 7. Working together and implementing new ideas. 8. More communication with other providers. 9. We have director's meeting at AV (Antelope Valley) college, this event give us a chance to meet
the other director in the areas. 10. Improved interactions with others providers. 11. It caused us to meet to discuss what a quality program looks like. 12. Able to network with other agencies and directors. 13. Make me confident with communication with others, for the knowledge I have acquired
through steps programs. [sic] 14. Training classes only. 15. It gives me the opportunity to discuss other issues. 16. By networking with each other. 17. A lot of questions about the program. 18. The difference was the help that was given with the mini grant and types of information [or
informational classes]. 19. I very much like how the other providers are willing to share information.
By contrast, relatively few (4) people said, basically, that they do not (or STEP did not help them) interact with other providers: (“It has not impacted my interactions, I have not interacted with other provider [due] to STEP.” Other responses were “very little,” “n/a,” and “not much.”
• The rating process and mini grant application by comparison was reported by 38% (Family CC) and 33% (Center CC) of respondents to take “more time than expected,” though few (20%) found those two components more difficult than expected.
• The only pronounced difference of note between Family CC and Center CC on these measures was with the rating process, which was disproportionately reported as taking “more time than expected” and to be “more difficult than expected” for Family CC vs. Center CC providers.

Findings
STEP Pilot Process Evaluation Wold and Associates | 17
Technical Assistance and Training Providers indicated which of the trainings offered or promoted through STEP they had attended and rated the value of those trainings. It is important to note that some of these trainings had not been offered until later in the pilot and some not as often as others. Those who attended gave the trainings consistently high ratings.
Most frequently attended trainings (greater than 75% reporting that they attended):
• Building Positive Relationships with Children • Developmental Screening Tools (lower among Center CC) • STEP Portfolio • Inclusion of Children with Special Needs (72% attended; lower among Center CC) • STEP Orientation (lower among Center CC) • Quality Learning Environments (69%; lower among Center CC)
Less frequently attended trainings (>50 % reported that they did not attend [DNA]):
• Going Back to School to Obtain Your Teaching Permit (73% DNA) • Desired Results Developmental Profile (DRDP-R) (56% DNA) • Creating a Quality Improvement Plan (63%
DNA) • How to Use Computer Technology (73%
DNA) • Supporting Dual Language Learners (70%
DNA) • Preventing Child Abuse and Neglect (70%
DNA)
Half of participants (50%) reported receiving assistance at their site from a contracted ECE specialist or STEP coach. Among this group, 48% were “very” and 44% were “mostly” satisfied with the assistance received.
The responses to various questions regarding the training and technical assistance offered and promoted by STEP reflected that participation in STEP had greatly assisted progress in the domains. (Additional information about the value of trainings and technical assistance are reported in the following section, Progress by STEP Quality Domain.) In addition, half of respondents suggested topics for future trainings, suggesting an interest in future continuing education opportunities. Suggestions for training and technical assistance topics were obtained in the survey from optional open-ended items, as shown in Figure 4.
Half of participants (50%) reported receiving assistance at their site
from a contracted ECE specialist or STEP coach. Among this group, 48% were “very” and 44% were “mostly”
satisfied with the assistance received.

Findings
STEP Pilot Process Evaluation Wold and Associates | 18
Figure 4. Optional: What technical assistance would be most helpful to your program now?
1. Working with Children with Challenging Behaviors. 2. All of them. 3. How to manage time. 4. Nothing really just time to prepare program and staff. 5. Mac computer, Overhead projector. 6. Current practice. 7. Infant toddler care. 8. Creating a budget for my business. 9. Creating a Quality Improvement Plan; How To Use Computer Technology; Dual Language
Learners; Inclusion of Children with Special Needs; Building Positive Relation with Children. 10. Financial, on site coaching, education staff. 11. Environment enrichment; Curriculum Planning for Various Age Groups; Bookkeeping Tools and
Techniques. 12. Administrative. 13. More classes related to child development; Help to continue with more training such as in
college. 14. More staff training on Adult Involvement Scale, Training on ECHERS and ITERS when all staff can
attend; Communicating with Families. 15. Going back to school to obtain teacher permit. 16. Computer tech; child abuse, special needs, developmental screening. 17. CLASS; Infant toddler care giving PITC [Program for Infant/Toddler Care]; Mentor Program / Peer
Cohorts; parent involvement/advocacy. 18. A Reggio class. 19. A workshop that helps us reap the benefits that having a STEP rating gave us. 20. Having conferences to help the parents.
Progress by STEP Quality Domain
Respondents assessed the extent of progress made within each STEP quality domain, including the Learning Environment, Teacher-Child Relationships, Identification and Inclusion of Children with Special Needs, Family and Community Connections, and Staff Qualifications and Working Conditions.
Findings for progress are ordered starting with the domain showing the strongest self-assessed progress and continuing in order to the domain showing the least, as measured by the percentage of providers reporting that they had made “major progress” in a given sub-domain. (Other answer options included “some progress,” “little or no progress,” or “not a priority,”)
Providers also assessed the impact of the following resources on their areas of “major progress”: Attending trainings offered or promoted through STEP, mini grants,

Findings
STEP Pilot Process Evaluation Wold and Associates | 19
coaching from STEP, and coaching from any of the four resource and referral (R&R) agencies. In addition, space was available to fill in other resources.
Please note: For each domain, the percentages reporting “major progress” were higher for Family CC as compared to Center CC. It is worth noting that lower reported levels of “major progress” may be related to a number of factors, such as starting from different baselines in each sub-domain, or that a particular sub-domain was not a priority. Therefore, lower reported percentages of major progress should not be interpreted as the provider being further behind!
1. Learning Environment
The Learning Environment domain showed the greatest self-reported progress, as shown by the percentage reporting “major progress” in the sub-domains (Table 2).
Table 2. Progress Assessed by Learning Environment Domain
Learning Environment Domain Percentage of Providers Reporting “Major Progress”
Sub-domains Assessed Family CC Center CC Combined
Improving indoor/outdoor spaces for learning, play, and care
69 47 60
Personal care routines (nap, meals/snacks, toileting/diapering, health and safety)
79 40 64
Program structure (schedule, free play, group time)
79 47 67
Listening and talking skills 79 56 71
Offering special activities for child development (fine motor, art, music/movement etc.)
71 53 65
Parent–Teacher interactions 79 44 67
Seventy percent of providers considered attending trainings offered or promoted through STEP as “very valuable” to their reported progress in this domain. Next was the mini grants, rated by 59% (76% Family CC and 27% Center CC) and coaching from STEP, rated by 52% (66% Family CC and 27% Center CC) as “very valuable.” Open-ended items identified other resources, such as funding from Service Planning Area (SPA) 8 and Center For Community & Family Services (CCAFS). In addition, one provider wanted more resources appropriate to a Reggio school.
2. Teacher–Child Relationships
The domain showing the second greatest progress, as assessed by providers, was Teacher–Child Relationships (Table 3).
Findings
STEP Pilot Process Evaluation Wold and Associates | 20
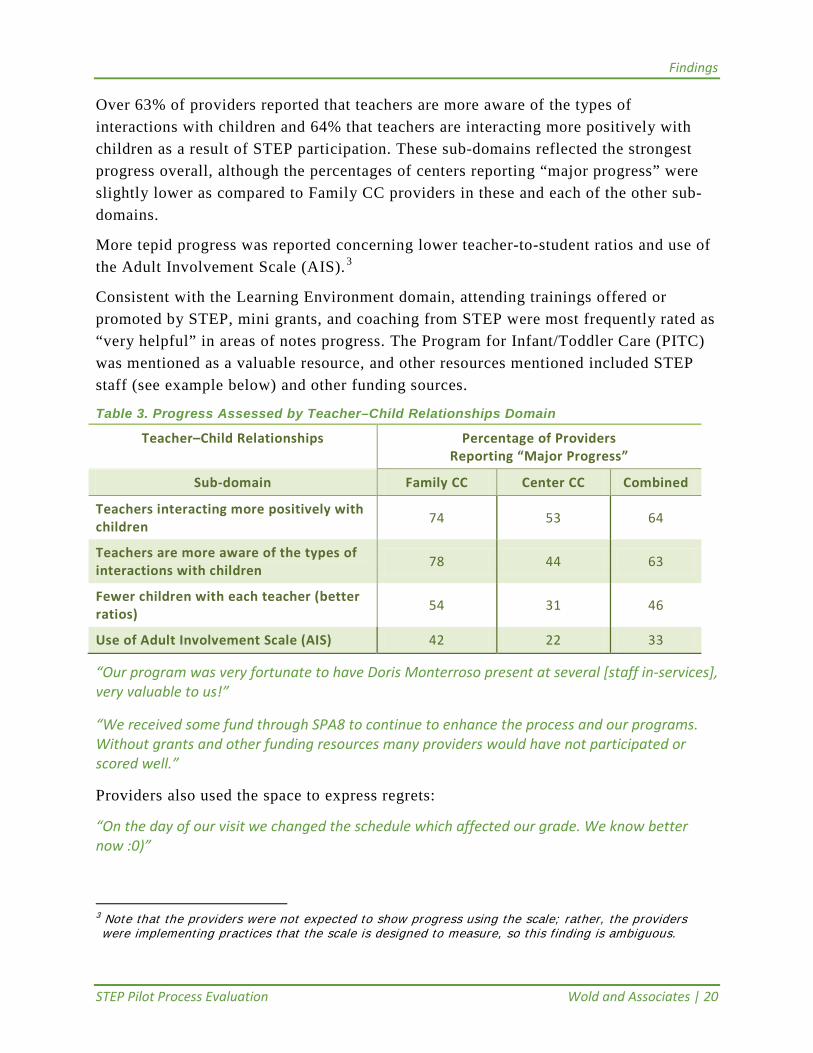
Over 63% of providers reported that teachers are more aware of the types of interactions with children and 64% that teachers are interacting more positively with children as a result of STEP participation. These sub-domains reflected the strongest progress overall, although the percentages of centers reporting “major progress” were slightly lower as compared to Family CC providers in these and each of the other sub-domains.
More tepid progress was reported concerning lower teacher-to-student ratios and use of the Adult Involvement Scale (AIS). 3
Consistent with the Learning Environment domain, attending trainings offered or promoted by STEP, mini grants, and coaching from STEP were most frequently rated as “very helpful” in areas of notes progress. The Program for Infant/Toddler Care (PITC) was mentioned as a valuable resource, and other resources mentioned included STEP staff (see example below) and other funding sources.
Table 3. Progress Assessed by Teacher–Child Relationships Domain
Teacher–Child Relationships Percentage of Providers Reporting “Major Progress”
Sub-domain Family CC Center CC Combined
Teachers interacting more positively with children 74 53 64
Teachers are more aware of the types of interactions with children 78 44 63
Fewer children with each teacher (better ratios) 54 31 46
Use of Adult Involvement Scale (AIS) 42 22 33
“Our program was very fortunate to have Doris Monterroso present at several [staff in-services], very valuable to us!”
“We received some fund through SPA8 to continue to enhance the process and our programs. Without grants and other funding resources many providers would have not participated or scored well.”
Providers also used the space to express regrets:
“On the day of our visit we changed the schedule which affected our grade. We know better now :0)”
3 Note that the providers were not expected to show progress using the scale; rather, the providers were implementing practices that the scale is designed to measure, so this finding is ambiguous.

Findings
STEP Pilot Process Evaluation Wold and Associates | 21
3. Identification and Inclusion of Children with Special Needs
In the Identification and Inclusion of Children with Special Needs domain, family engagement and knowledge about (and making) appropriate referrals were the sub-domains showing the greatest self-assessed progress. Progress in this domain was slightly more consistent between Family CC and Center CC providers than in other domains.
Training and mini grants overwhelmingly showed up as the most valuable resource for the progress made. Open-ended comments included the following:
“Our staff has since gone back to school and taken training in working with children that have special needs. We have also had behaviorist join our program to shadow students and we are learning a lot from them.”
Some comments are indicative that programs with higher standards may report less “major progress”:
“Our program has been using the ASQ [Ages and Stages Questionnaire] since the early 2000's! All families always required to participate in ASQ screening process.”
Table 4. Progress Assessed by Identification and Inclusion of Children with Special Needs Domain
Identification and Inclusion of Children with Special Needs
Percentage of Providers Reporting “Major Progress”
Sub-domain Family CC Center CC Combined
Engaging families in the screening process 73 50 64
Awareness of referral sources/making referrals to appropriate agencies for further assessment
73 50 64
Intervening /adapting for a child based on screening results
65 50 60
Screening within 90 days of enrollment 62 50 57
Use of a high-quality developmental screening tool
65 38 56
Coursework/training by teachers about working with children with special needs
60 36 51
4. Family andCommunity Connections
All sub-domains had over 50% of providers reporting major progress (Table 5).

Findings
STEP Pilot Process Evaluation Wold and Associates | 22
Table 5. Progress Assessed by Family and Community Connections Domain
Family and Community Connections Percentage of Providers Reporting “Major Progress”
Sub-domain Family CC Center CC Combined
Initiating discussions about kindergarten 61 50 57
Opportunities for families to contribute to the program (volunteering, donating, etc.)
68 38 57
Connecting families with community resources and events
63 44 56
Ways for families to participate (orientation, parent handbook, annual group events with families, newsletters)
68 31 56
Information and coaching about child growth, development, parenting, etc.
61 38 51
Communication with families (discussing daily occurrences, child’s progress, providing written progress reports, posting calendars and schedules)
61 38 51
Cultivating relationships with public and community-based services (health, education, social services)
56 38 48
Visible recognition of cultural traditions, languages, practices, etc.
47 54 38
Sizable proportions of providers reported making referrals to Child Guidance (46%), Food Stamps (37%), and/or Mental Health (35%) for the families they serve.
In addition, 22 providers listed examples of other community resources with which they had connected their families. These were open-ended items, and approximately 61 types of resources (88 mentions total) were identified, including public agencies (school districts, regional centers, County services), nonprofits (food banks, job programs, colleges). See Figure 4 for further details.
Providers were asked for examples of some of the other unmet needs on the part of families in their program. Providers identified 20 types of unmet needs as shown in Figure 4.
Last, providers cited 32 examples of local agencies they had contacted on behalf of families with unmet needs, including regional centers, resource centers, doctors, 211, food banks, WIC [Women, Infants, Children], Urban League, various preschool/Head Start programs, school districts, public agencies, and charitable organizations (Urban League, Brotherhood Crusade).

Findings
STEP Pilot Process Evaluation Wold and Associates | 23
5. Staff Qualifications and Working Conditions
The domain with the least overall self-assessed progress was Staff Qualifications and Working Conditions. The sub-domain with more than 50% reporting major progress was assistants getting paid minimum wage (53%). 4 This was also the domain with the lowest STEP levels, so it is important to assess the progress accordingly.
Table 6. Progress Assessed by Staff Qualifications and Working Conditions Domain
Staff Qualifications and Working Conditions Percentage of Providers Reporting “Major Progress”
Sub-domain: Family CC Center CC Combined
Assistants getting paid minimum wage 61 39 53
Assistants have job descriptions and written confirmation of job, salary, and hours
52 40 47
Stability of staffing – increases in the average length of employment
42 40 42
Completion of ECE training by Assistants 39 33 38
Completion of coursework toward Associate in Arts (AA) or Bachelor of Arts (BA) by licensed provider
45 21 37
Annual written evaluation of Assistants 30 40 36
Paid professional growth opportunities by Assistants
25 23 24
Completion of coursework toward AA or BA by Assistants
21 27 23
Related to this domain (as shown in the Use of Educational Incentives and Stipends section), many providers reported using educational incentives and stipends for staff development:
• 43% reported that they/staff used the Child Development Training Consortium assistance.
• 31% used the Los Angeles County Investing in Early Educators stipends. • 12% used the LAUP stipend. • 8% used Head Start stipends.
4 It is difficult to interpret this finding given that all employees should receive minimum wage. Contributing factors could be low compliance, having assistance work as contractors, or misinterpretation of the question.

Findings
STEP Pilot Process Evaluation Wold and Associates | 24
In addition, respondents reported providing multiple supports to staff seeking to develop skills or complete coursework (e.g., 52% provided flexible scheduling); however, few (27%) provided increased pay or stipends (17%).
Findings from Focus Groups As described in the Methods section, three group discussions were conducted—one each in Long Beach, Santa Monica, and Pasadena. The main purpose of the group discussions was to supplement the survey information and elicit feedback about STEP outreach, recruitment, and retention for the purposes of improving all of those activities. To do this, the discussions explored the motivations and barriers associated with STEP participation.
First, all groups reiterated the importance and value of quality rating and improvement. Groups praised the importance of STEP to the ECE field and specifically mentioned the excitement and promise generated in the roll-out of STEP:
It is so important “to have tools to show we’re accountable and to define what quality is.” The plans for a statewide quality rating system also factored in. “That recognition of the importance of having a dependable, reliable, well-oiled quality rating system…it’s going to benefit us—help us with funding and a lot of other things.”
All groups valued the training and support provided through STEP:
“STEP brought us a lot of resources that we would not have had otherwise…[for example]… the training [using Parent's Evaluation of Developmental Status, or PEDS, tool to identify developmental delays and disabilities] for us through STEP program which was very cost effective.”
“If we would have gone out on the market that training would have cost thousands of dollars. Gave us a big jump start.”
“The trainings are excellent. Not one that wasn’t good.”
This was echoed in every conversation. Special mention was made about STEP staff with respect to training as well as overall support. (Helen Chavez and Doris Monterroso were mentioned in several statements.) The groups felt that STEP staff went out of their way to organize trainings and provide support:
“Actually, we have not had our site evaluation – keeps getting pushed by the budget [still waiting to hear]. Training has been excellent – Doris has done a significant amount of training and has been fabulous. For example, we just did one on teacher-child interactions, and we just did one recently on special education. [STEP staff] have always been very responsive, always there for questions, very responsive to us… always let us know if things were going to be pushed back. I preferred this to NAEYC–I went through the new vs. original [NAEYC or National

Findings
STEP Pilot Process Evaluation Wold and Associates | 25
Association for the Education of Young Children]–and found this one much more doable when operating a program with no one assisting in the process.”
The content also seemed to be very well received. Special mention was made about several specific trainings, including AIS and special needs trainings, and the PITC training.
Family providers in Palmdale were on an accelerated track for rating and praised the training (e.g., infant-toddler and special needs) that was organized very quickly, on weekends, and over a short amount of time to respond to the need of the providers in that area.
A contributing factor to a positive experience seemed to be working in collaboration:
“[We are] a cohort of 14 providers…did trainings together and brought in professionals. Some were STEP providers and some less experienced. [STEP staff] went above and beyond—came to our location, did trainings…came to us with the understanding that this was a pilot and they would work to get the bugs out.” This provider said her group would be very willing to sit and talk about Family CC provider needs and follow up steps.
The value of working in collaboration was mentioned many times in all of the groups suggesting the importance of mentoring:
“We worked with [another site in the area] and did a lot of the activities together, shared information, identified different strengths, and I thought that was a good strategy – maybe if a program has already gone through it, to maybe be buddied up with [so as to mentor] a new program just starting to go through it.”
Returning to themes expressed about the initial roll-out also points out some opportunities to improve follow-up communication.
One provider who operates outside the initial pilot communities spoke of the initial excitement:
“[There was] a lot of excitement [when STEP came out]….many of us were opting out of NAEYC because the costs had gone up, paperwork was difficult. Even if we could not be part of the original process we were excited because it was presented as a viable alternative (to NAEYC accreditation)…it would go statewide, and there would be a lot of publicity—explanations to parents about the ratings (e.g., that a ‘3’ was actually a very good school, and that there would not be a lot of fives…but parents would understand that attaining a “5” may require a financial commitment that some schools could not make (even schools providing excellent quality).“
Building upon this, a major theme was the perception (and possible misperception) that you would get “stuck” with a rating. Comments strongly suggested that stories had circulated about low ratings, and this was likely to have contributed to non-participation or non-retention especially among Family CC providers.

Findings
STEP Pilot Process Evaluation Wold and Associates | 26
“When some of the initial scores came out there was concern [about] the level of work that went into it and the scores that came out. Programs are fearful to participate. We were [initially interested] because of the resources, trainings, all the positive things.” [Did not participate in STEP]
“Should be tested again to see if there is improvement. Feeling among directors and FCC [Family CC] was “why should I do this?” if I’m going to put the program through this and then be stuck with a rating that might not reflect where (program is now). How do we know if it’s even effective? [Did not participate in STEP]
For some of the providers in the very early cohort, there seemed to be heightened confusion and frustration around the follow up communication:
“For a long time now we have not heard anything from STEP. We’ve wanted to appeal some of the initial assessment and don’t really know how to do that; wanted some TA on some of the areas of weakness where we want to improve. A “big hole” was left with Helen’s departure.
And they are not sure about what is next. What’s next in terms of the STEP process–started process and interested in progressing. Now what?”
“One of my sites participated—we have two—Strong start to the process, somewhere mid-point there was a change in personnel and after that nothing happened. We were [initially] enthused and engaged…have not had any momentum since.”
“So we were waiting to hear information about the ‘what next’. When would there be another round? Could you buy in? And then there was a sort of silence, other than hearing that some of the schools were starting to get scores, and hearing [rumors] that there wasn’t a way that you could improve.”
Some expressed that the scores from the pilot should not have been published before having broad community buy in that the ratings were credible:
“Have to have buy in from community to say ‘this is a valid instrument’. [As a community], I’m not sure if we felt that all the indicators were the most appropriate.”
There was strong interest expressed by many providers to hear what is happening with STEP, including the results of the pilot—what worked well and not so well—more about the validity of the rating system, and the plans for the future.
Themes that came up specific to the rating scale:
• Scale too high: 4-5 is unattainable for most providers. • Staff qualifications should be better aligned with staffing qualifications required by
school districts, community colleges (Head Start), and California Department of Education (“matrix” mentioned several times). Providers will not pursue formal education if not required for job duties; however, providers will attend continuing education programs.

Findings
STEP Pilot Process Evaluation Wold and Associates | 27
• Some providers would like to better understand how STEP scales are aligned with other rating systems and accreditation programs—NAEYC, LAUP—and how scales, e.g., CLASS [Classroom Assessment Scoring System], differ.
• Providers see STEP as an alternative to NAEYC, which is expensive and paperwork intensive.
Some very specific comments came up concerning the reliability of the assessment—either the reviewers themselves or the tools, as well as the appeal process:
• For example, one provider got very different ratings for similar centers (Title 5 designated) and stated that there was “no communication after the rating” and no perceived opportunity for appeal. One participant had multiple Head Start centers. They were well prepared with the documentation (had gone through several other reviews, e.g., Title 5). Received “completely” different scores by different raters. Should have been the same. No explanation was given.
“It was disheartening…we had documentation…”
• Another example (mentioned by others) was the special needs domain—all centers serve 10% special needs. One of their centers received a “0” for special needs, which should not happen.
• Another example given was the Early Childhood Environment Rating Scale (ECERS), which was done in two different classrooms with very different results. LAUP reviewed the same two classrooms and got comparable results. Another example was the AIS, which they thought was missing (not counting) interactions between children and teachers assistants in classrooms.
“If [one looks only] at the lead teacher, you’re missing half of the positive interactions”.
Finally, many comments were at the intersection of two related domains—inclusion of children with special needs and staff qualifications:
• Among FCC, ASQ or other high-quality developmental screenings, but often not within 30 days of entry into program.
• BA-level providers will not go back to community college to take unit bearing courses on developmental disability.
• Suggestion to recognize continuing education trainings on developmental disability, delay, screening, etc., for example, the 12 hours of training a Pasadena center did with the Frostig School, as an equivalent to the unit bearing coursework.
• Suggestion to work with community colleges and teacher training to include special needs courses in curriculum. At present the degree requirements are inconsistent. Providers with AA are unlikely to return to take unit-/credit-bearing classes, unless pursuing further degree, but will enroll in training.
• Trainings in on children with special needs and developmental screening tools (e.g., ASQ) have been excellent.

Findings
STEP Pilot Process Evaluation Wold and Associates | 28
• Different centers with identical (and federally mandated) classrooms for children with special needs received different ratings, and the providers expressed the opinion that the documentation for these classrooms should have been exactly the same.
• This can work the opposite way: One provider said that preschool program in school district was unfairly advantaged because they have special education – did not think that always related to quality programming.
Potential contributors to non-participation in STEP identified in the discussions:
• Already NAEYC accredited or LAUP Star rated. • Provider will not get good rating without a BA degree—according to several people,
this is a major discouraging factor for Family CC providers. • Low scores in the initial cohorts contributed to fear among providers that they
would be “stuck” with a low grade without recourse. One participant went so far as to suggest that early participants almost seemed “penalized” for having been rated and received lower scores as compared to those who decided not to go through rating.
Last, several raised concerns about limited marketing and communication about what the scale means—providers thought parents might not ask for the rating, nor would they know what a “3,”for example, means.

Conclusions and Recommendations
STEP Pilot Process Evaluation Wold and Associates | 29
Conclusions and Recommendations Conclusions Providers perceived STEP to be beneficial for improving the quality of services to children and families. The findings from the survey, including numerous positive comments, and comments made in the group discussions indicated that most providers had very positive experiences with STEP based on. In addition, findings suggest that the process of going through STEP had resulted in significant progress within each of the quality domains, as assessed by the providers themselves. This was reinforced by the high value expressed for the trainings, mini grants, and technical assistance provided through STEP. A majority expressed desire to be re-rated and the optimism that a higher rating would result.
At the same time, several providers expressed concerns about the process and the opportunity to be re-rated in a timely manner, and the low ratings observed among participants overall. Some suggested modifications to the scales to make them more realistic to their situation and to provide encouragement, especially given the high proportion of providers thinking that achieving the suggested improvements was “beyond their program’s control.” Some comments suggested possible problems with the assessments they received and delays in getting these resolved through the appeal process or a re-rating. Last, several providers expressed the need to communicate the STEP scores to parents (and providers) in an appropriate manner to ensure the fair interpretation of the results.
Recommendations Building upon the many program strengths identified in the evaluation, including positive provider experiences, beneficial training and support, and program improvements for a majority of child care providers, could be built upon to address those areas needing improvement, including communication, provider recruitment, and program retention.
Identify providers who had positive experience and incentivize them to serve as mentors to new participants; consider providing incentives for referrals. Providers expressed a high value for collaboration and reported increased and varied interactions with other providers as a result of STEP. Providers that collaborated seemed to have positive experiences with the process. Further, many expressed a willingness to mentor other programs. Word of mouth is an important recruitment tool and potentially
Findings suggest that the process of going through STEP had resulted in significant progress within each of
the quality domains, as assessed by the providers themselves.

Conclusions and Recommendations
STEP Pilot Process Evaluation Wold and Associates | 30
effective strategy for reaching out to new participants. Mentoring may also help to stretch program resources by encouraging peer support and sharing of expertise.
Clarify the process of self-assessment, rating, and appeal and explain the information about the validity of the rating scales (and norms). Providers are very interested in hearing more about the pilot—lessons learned and any changes to the rating scale and program adjustments—and the future of STEP. Such communication would go a long way toward building the necessary community buy in and clarifying the opportunities for improvement, including being re-rated, possibly countering the perception that once rated “you are stuck.”
Explore approaches to achieving greater progress in the area of staff qualifications, overall and at the intersection of special needs qualifications. In response to feedback, consider aligning STEP with staff qualifications for the CDE and school districts, and with educational requirements at community colleges (for AA) and universities (for BA).
In addition, given the increasingly limited accessibility of associates degree programs and barriers to pursuing for credit coursework, consider waiving such requirements in exchange for high-quality continuing education and trainings, as appropriate. This may encourage ongoing education and perhaps even serve as a gateway to greater educational attainment over the long run.
Some of the early cohort expressed negative experiences or delays in appeals. Follow up with the early cohort of STEP participants; share evaluation findings and review program changes (to date and pending). Offer a fast track re-rating to early participants.
Collect timely feedback about rating experience and receipt of results. Such feedback would likely be more accurate information and would provide a basis for taking action.
Consider revising scales /subscales to simplify where appropriate, such as aligning staffing qualifications with CDE.
Flag appeal requests. Perhaps the raters could revisit their assessments in a more timely way to correct any misperceptions or misunderstandings generated on the part of observers or providers.
Several recommendations to address provider feedback fall under the category of communications and public relations. Generate materials for parents and families to explain and interpret the rating scale. Consider on-line, interactive tools as well as print materials.
In addition, update the STEP website to acknowledge participating programs and their commitment to quality.

Conclusions and Recommendations
STEP Pilot Process Evaluation Wold and Associates | 31
Consider designating any participating provider as “quality rated” so as to credit them appropriately for going through the program. Consider playing down a level of 4 or 5 in favor of level 3s. Could 3 be “best” with a ++ for additional standards met?
Develop communication materials that reinforce that STEP is geared toward quality improvement and that address the concerns (and oftentimes misperceptions) about the rating scale. Study/disseminate inter-rater reliability to nurture trust in rating process.
Engage in advanced planning with the Child Care Resource and Referral agencies around training and mentoring, and applying jointly for funding. Collaboration with the R&Rs may also help to identify “places” to target in the future, e.g., Best Start or Promise Neighborhoods.
Bibliography Child Development Permits. California Commission on Teacher Credentialing, Accessed on November 20, 2011, at http://www.ctc.ca.gov/credentials/leaflets/cl797.pdf
The Child Care Quality Rating System (QRS) Assessment: Compendium of quality rating systems and evaluations. U.S. Administration for Children and Families, Office of Planning, Research and Evaluation. April 2010. Accessed on November 20, 2011, at http://www.childcareresearch.org/childcare/resources/18554
STEP/Los Angeles County Office of Child Care Accomplishment Report 2007–2010 (draft)