Embed Size (px)
Citation preview

Stephens Inc.Spring Investment Conference June 3, 2009
2
Forward Looking Statements
• This presentation may contain forward-looking statements that involve a number of risks and uncertainties. Statements that are not historical facts, including statements about our beliefs and expectations, are forward-looking statements. Forward-looking statements are based on management's beliefs, as well as assumptions made by, and information currently available to, management. Because such statements are based on expectations as to future economic performance and are not statements of fact, actual results may differ materially from those projected. We undertake no obligation to update any forward-looking statements, whether as a result of new information, future events or otherwise. The risks and uncertainties which forward-looking statements are subject to include, but are not limited to: the possibility that the increased volume of open orders will not continue; the possibility that the acquisition of Commonwealth Land Title, Lawyers Title and United Capital Title will have unforeseen negative effects, including if those companies have undisclosed liabilities or if we are not successful in retaining key producers; changes in general economic, business and political conditions, including changes in the financial markets; weakness or adverse changes in the level of real estate activity, which may be caused by, among other things, high or increasing interest rates, a limited supply of mortgage funding or a weak U. S. economy; our potential inability to find suitable acquisition candidates, acquisitions in lines of business that will not necessarily be limited to our traditional areas of focus, or difficulties in integrating acquisitions; our dependence on operating subsidiaries as a source of cash flow; significant competition that our operating subsidiaries face; compliance with extensive government regulation of our operating subsidiaries; and other risks detailed in the “Statement Regarding Forward-Looking Information,” “Risk Factors” and other sections of the Company’s Form 10-K and other filings with the Securities and Exchange Commission.
3
Operating Strategy
• Fidelity National Title Group– The nation’s largest title insurance company– Remain the most profitable title insurance company
through superior execution– Return to 10%+ pre-tax margins quickly
• Specialty Insurance– Profitably grow our book in all three areas (flood,
personal lines and home warranty)– Continue to improve margins through strict underwriting
and strong cost controls
4
Operating Strategy
• Sedgwick CMS– Continue to produce strong organic revenue growth– Evaluate potential acquisition opportunities– Opportunistically seek to monetize the value of this
asset for our shareholders
• Ceridian– Capitalize on leading market positions in large and
growing markets– Reduce the expense structure in light of the current
economic environment
5
Operating Strategy
• Other value creation opportunities– Cascade Timberlands– Remy – American Blue Ribbon Holdings
6
Fidelity National Title Group – Overview
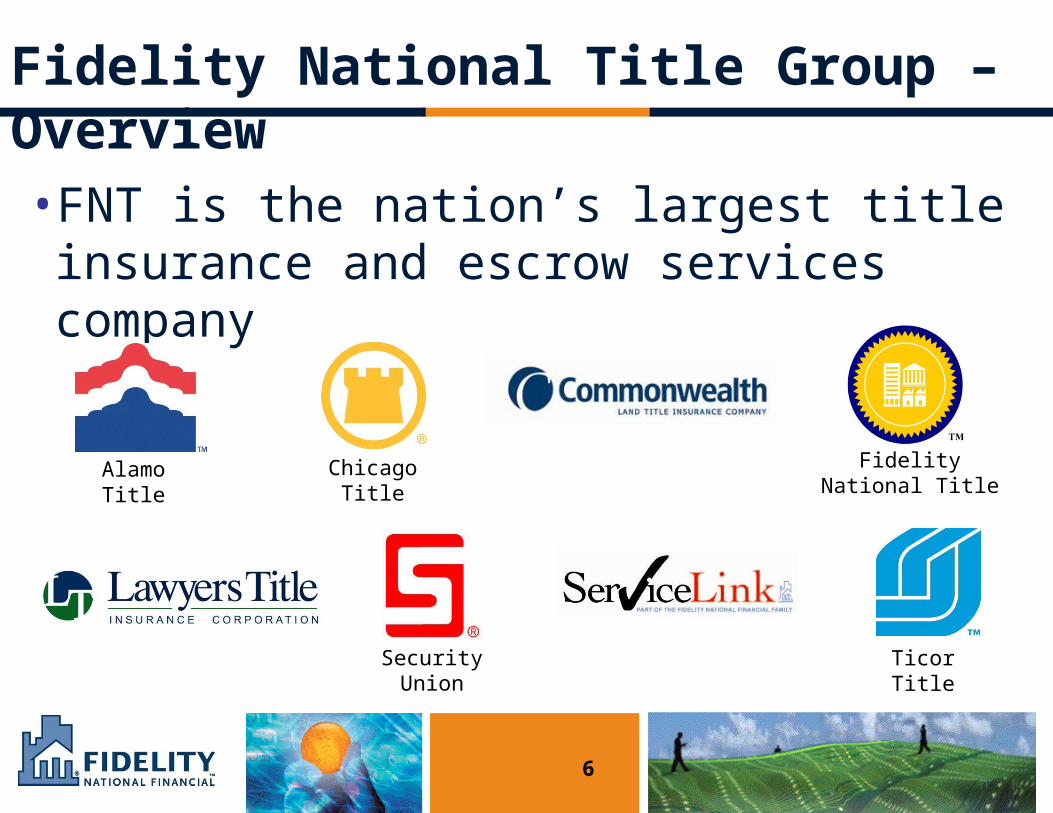
• FNT is the nation’s largest title insurance and escrow services company
Alamo Title Chicago Title Fidelity National Title
Security Union Ticor Title
7
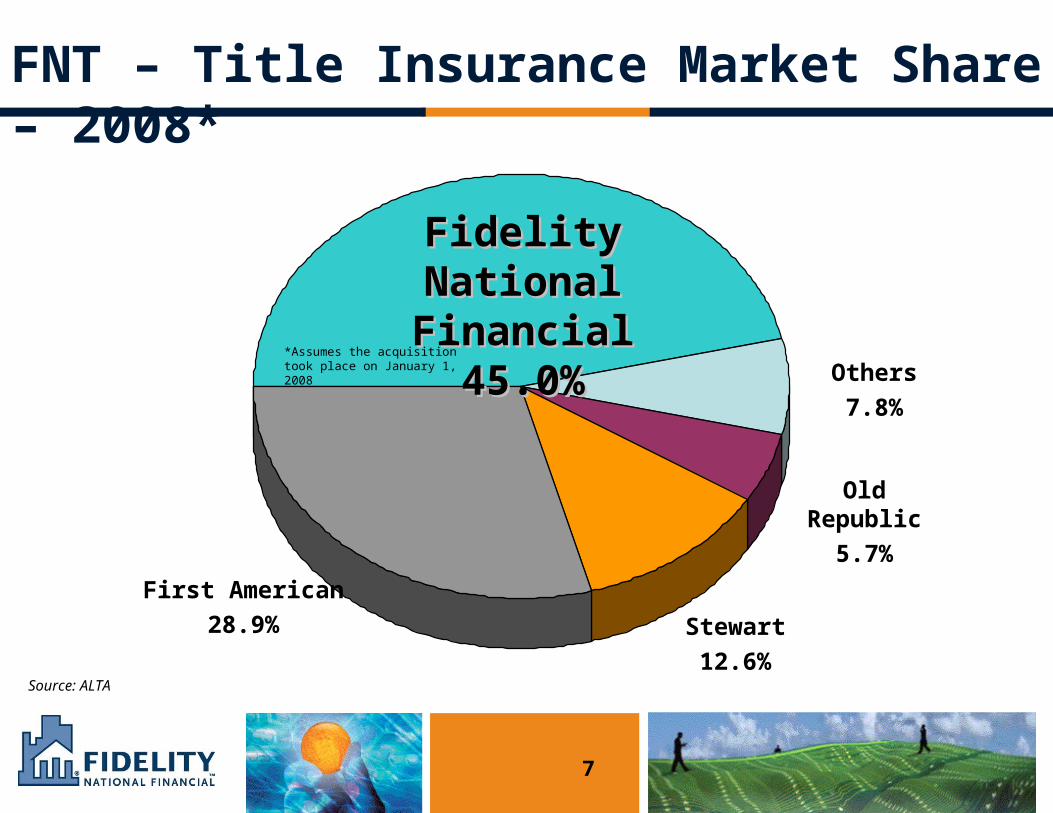
FNT – Title Insurance Market Share – 2008*
Fidelity National Fidelity National FinancialFinancial
45.0%45.0%Others
7.8%
Old Republic
5.7%
Stewart
12.6%
First American
28.9%
Source: ALTA
*Assumes the acquisition took place on January 1, 2008
8
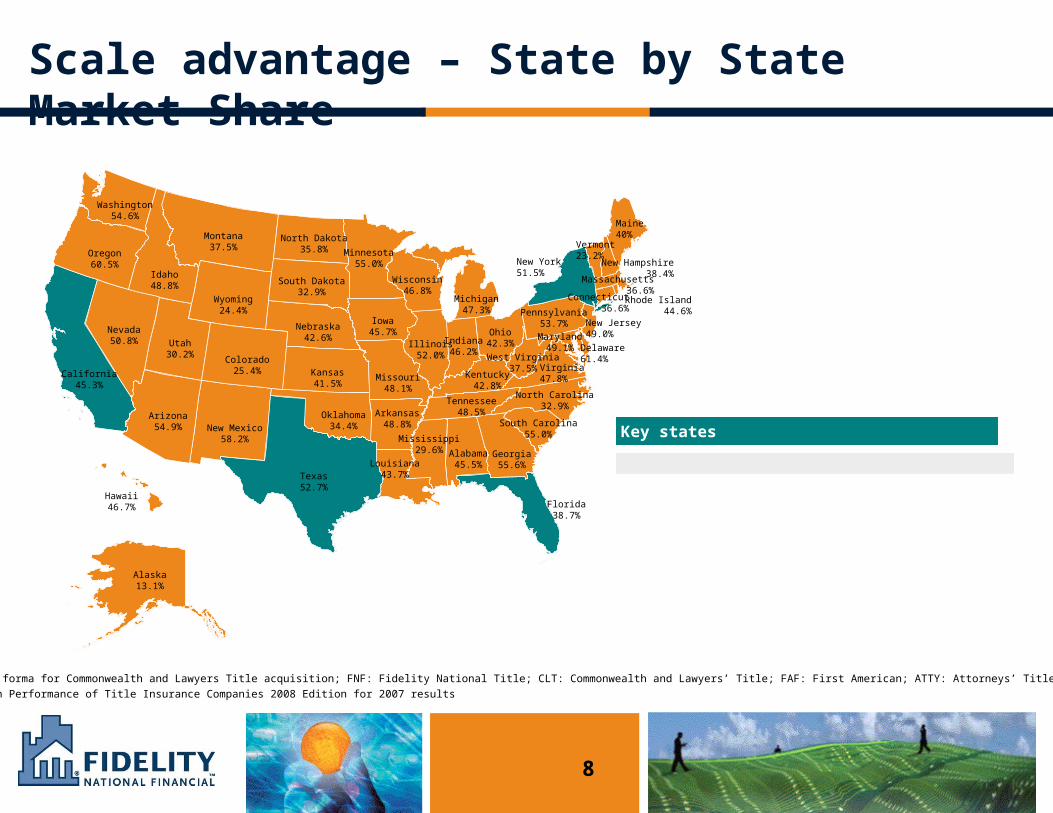
Vermont23.2%
Alabama45.5%
Arizona54.9%
Arkansas48.8%
California45.3%
Colorado25.4%
Connecticut36.6%
Delaware61.4%
Florida38.7%
Georgia55.6%
Idaho48.8%
Illinois52.0%
Indiana46.2%
Iowa45.7%
Kansas41.5%
Kentucky42.8%
Louisiana43.7%
Maine40%
Maryland49.1%
Massachusetts36.6%
Michigan47.3%
Minnesota55.0%
Mississippi29.6%
Missouri48.1%
Montana37.5%
Nebraska42.6%
Nevada50.8%
New Hampshire38.4%
New Jersey49.0%
New Mexico58.2%
New York51.5%
North Carolina32.9%
North Dakota35.8%
Ohio42.3%
Oklahoma34.4%
Oregon60.5%
Pennsylvania53.7%
Rhode Island44.6%
South Carolina55.0%
South Dakota32.9%
Tennessee48.5%
Texas52.7%
Utah30.2%
Virginia47.8%
Washington54.6%
West Virginia37.5%
Wisconsin46.8%
Wyoming24.4%
Hawaii46.7%
Alaska13.1%
Note: Map is pro forma for Commonwealth and Lawyers Title acquisition; FNF: Fidelity National Title; CLT: Commonwealth and Lawyers’ Title; FAF: First American; ATTY: Attorneys’ Title
Source: Demotech Performance of Title Insurance Companies 2008 Edition for 2007 results
Key statesKey states
Scale advantage – State by State Market Share
9
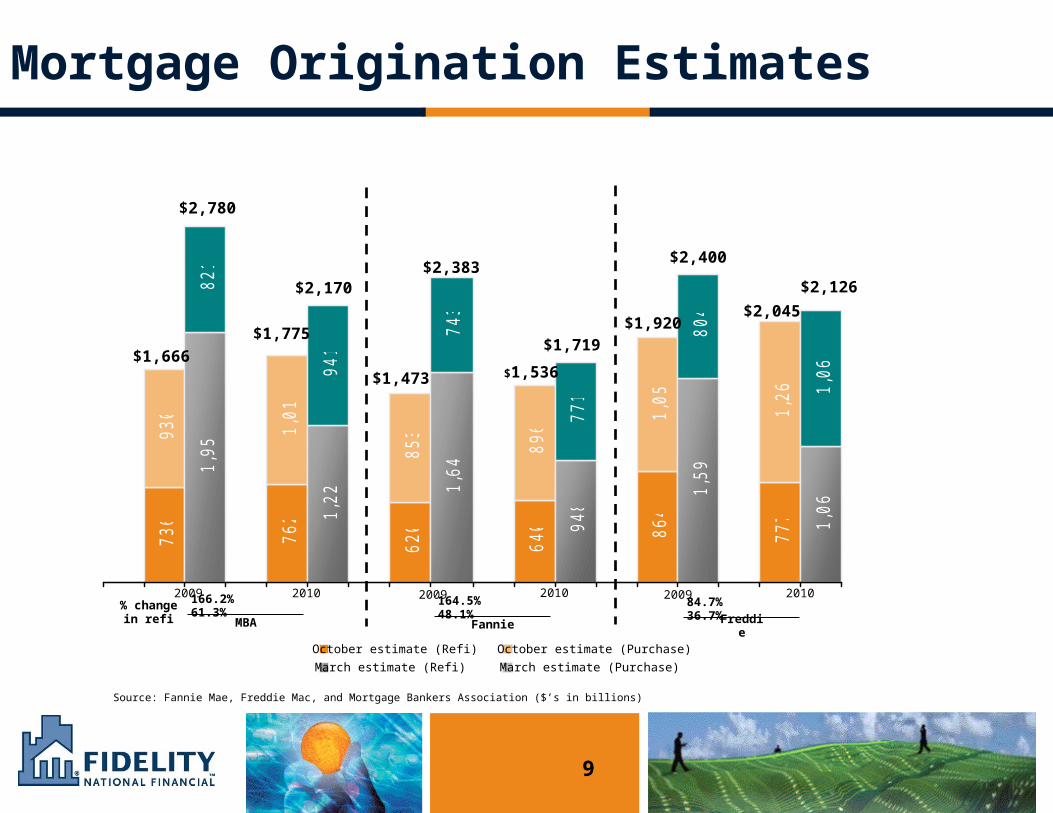
Mortgage Origination Estimates
Source: Fannie Mae, Freddie Mac, and Mortgage Bankers Association ($’s in billions)
736
762
620
640 864
777
930
1,0
13
853
896
1,0
56
1,2
68
1,9
59
1,2
29
1,6
40
948
1,5
96
1,0
63
821
941
743
771
804
1,0
63
% change in refi
October estimate (Refi) October estimate (Purchase)
March estimate (Refi) March estimate (Purchase)
166.2% 61.3%
MBA
2009 20102009 2009 20102010164.5% 48.1%
Fannie84.7% 36.7%
Freddie
$1,666
$2,780
$1,775
$2,170
$1,473
$2,383
$1,536
$1,719$1,920
$2,400
$2,045
$2,126
10
Managing The Title Business• Monitor operating metrics every week
– Open and closed order counts, headcount, efficiency metrics
• React quickly – utilize the “order lag” to our advantage
• Aggressively reduce headcount as order volumes decline; slow to add headcount when volumes improve
• Heavily weighted to variable incentive compensation; bonus and commissions are a large part of compensation
• Minimum goal of an 8%-10% pre-tax margin over a twelve-month period
11
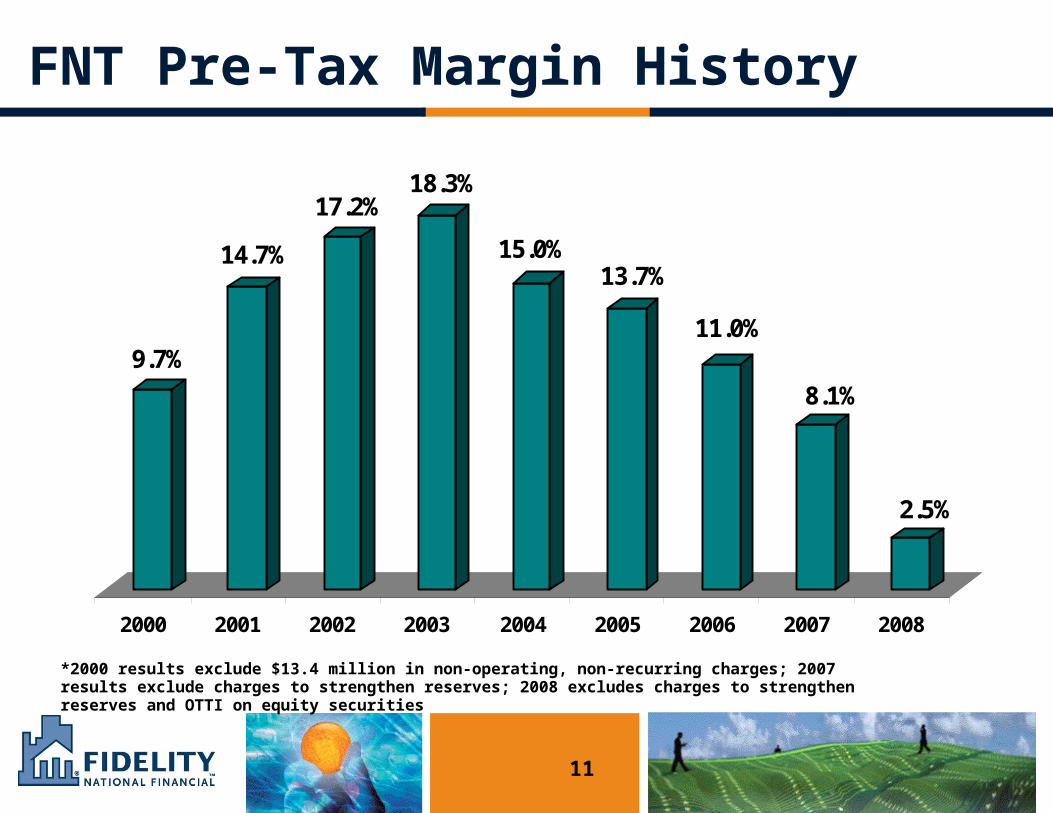
FNT Pre-Tax Margin History
9.7%
14.7%
17.2%18.3%
15.0%13.7%
11.0%
8.1%
2.5%
2000 2001 2002 2003 2004 2005 2006 2007 2008
*2000 results exclude $13.4 million in non-operating, non-recurring charges; 2007 results exclude charges to strengthen reserves; 2008 excludes charges to strengthen reserves and OTTI on equity securities
12
• Flood Insurance
– $150 million in annual revenue
– One of the largest writers of flood insurance in the U.S. with more than 650,000 policies in force
– Underwriting risk is assumed by the Federal Government through the National Flood Insurance Program
– Receive approximately $0.30 for new and renewal policies and a 3.3% override for claims processing
– Recurring revenue stream; upside comes from processing significant flood insurance claims
Specialty Insurance - Overview
13
• Personal Lines Insurance– $150 million in annual revenue– Primarily homeowners insurance, sourced through leads from
the FNT title insurance operations and an independent agent network
– More than 185,000 policies in force at March 31, 2009– Recurring revenue stream; loss ratio of 59% in the
homeowner’s business in the first quarter
• Home Warranty Insurance – $75 million in annual revenue– One-year, renewable policy that covers major mechanical
household systems and appliances (electric, central heating, interior plumbing, dishwasher, etc)
Specialty Insurance - Overview
14
• Industry leading provider of outsourced insurance claims management services to large corporate and public sector entities
• Designs, implements and manages innovative, outsourced third party administration (TPA) programs for workers’ compensation claims management, liability claims management and disability claims management
• More than 1,200 clients under multi-year contracts in a wide range of industries, including 28 of the Fortune 100 and 86 of the Fortune 500
• $700 million annual revenue base; primarily a recurring, cost plus revenue model
• 15%+ EBITDA margins
Sedgwick - Overview
15
Ceridian - Overview• Ceridian is a leading provider of human resources,
transportation and retail information management services in the U. S., Canada and Europe
Human Resource Solutions (HRS) offers a broad range of human resources outsourcing solutions, including payroll processing, tax filing, benefits administration, work-life and employee advisory programs and other human resource related services
Comdata is a major payment processor and issuer of credit cards, debit cards and stored value cards, primarily for the trucking and retail industries
• $1.6 billion in annual revenue; 20%+EBITDA margin• Focus on reducing the expense structure in light of the
current economic environment
16
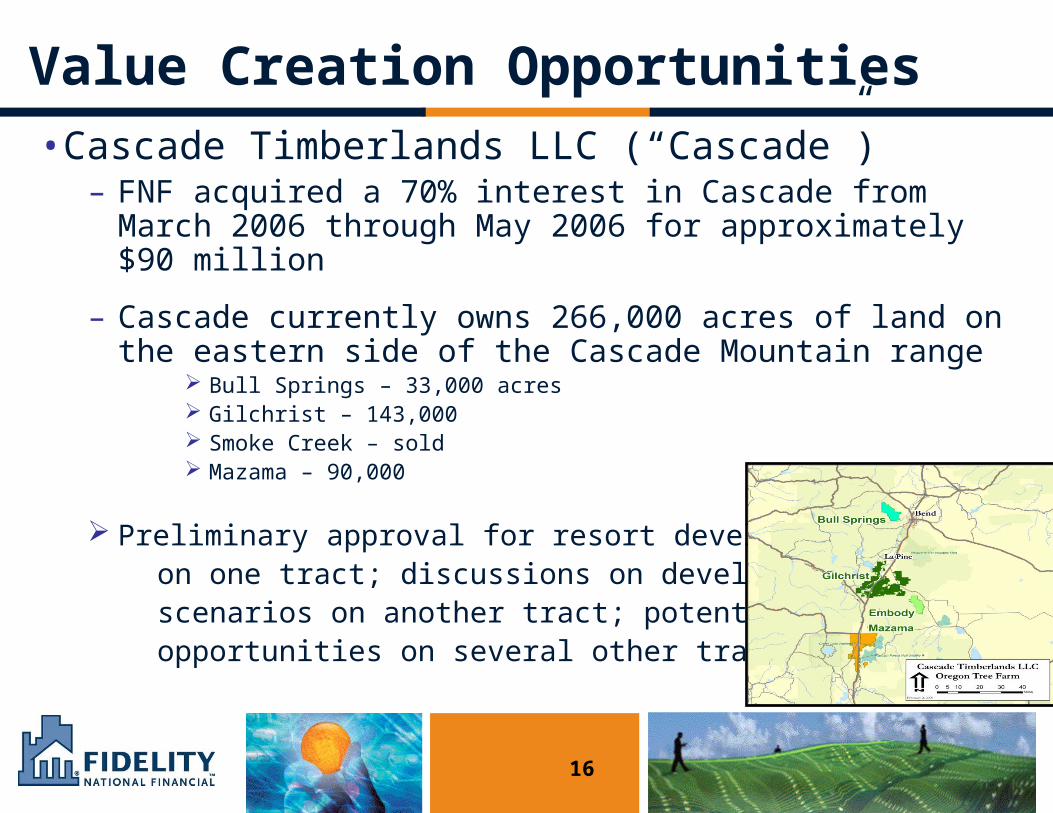
• Cascade Timberlands LLC (“Cascade”)– FNF acquired a 70% interest in Cascade from March
2006 through May 2006 for approximately $90 million
– Cascade currently owns 266,000 acres of land on the eastern side of the Cascade Mountain range
Bull Springs – 33,000 acres Gilchrist – 143,000 Smoke Creek – sold Mazama – 90,000
Preliminary approval for resort development on one tract; discussions on development scenarios on another tract; potential sale opportunities on several other tracts
Value Creation Opportunities
17
• Fidelity National Special Opportunities– Seeks to purchase control positions in securities of distressed
companies at a significant discount to the underlying fundamental long-term value of the enterprise
– Our strategy dictates that the securities are then converted into equity of a newly reorganized, de-leveraged balance sheet, with FNF realizing long-term value as an equity holder
– $80 million equity position (47% ownership) in Remy, an auto parts supplier
– $11 million equity position (45% ownership) in American Blue Ribbon Holdings, owner of Village Inn and Bakers Square restaurant brands
Value Creation Opportunities
18
1st Quarter 2009 Summary Results
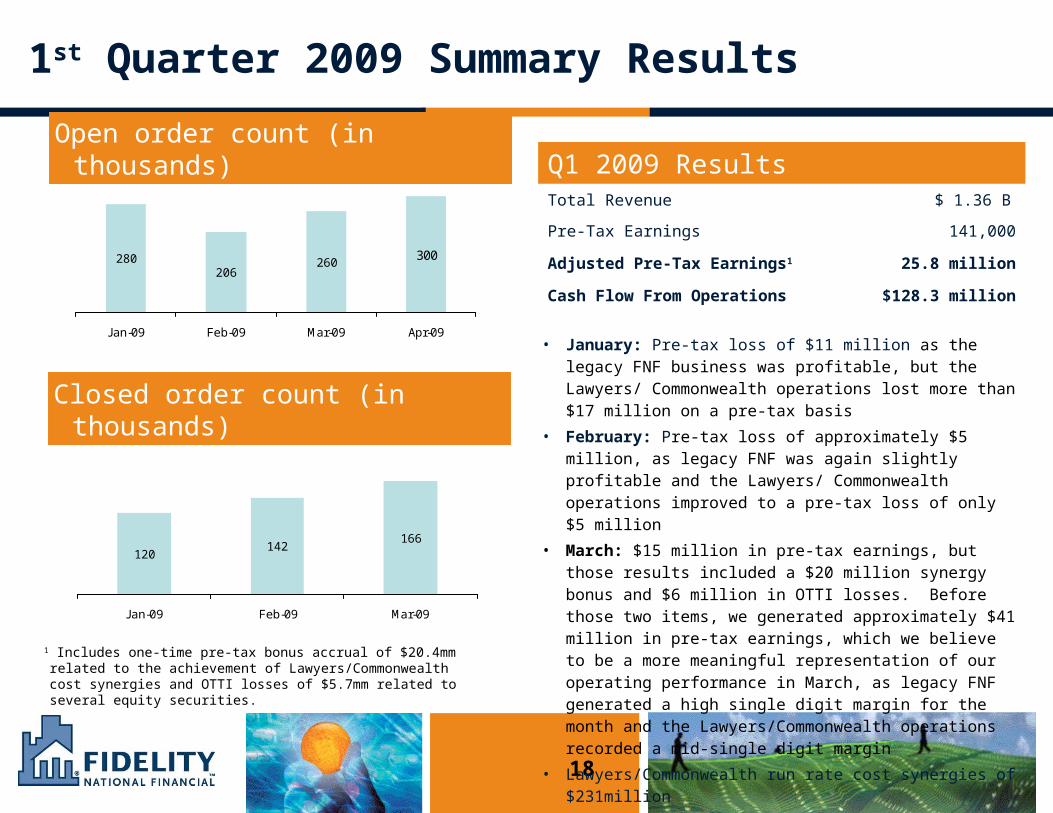
120142
166
Jan-09 Feb-09 Mar-09
300260
206280
Jan-09 Feb-09 Mar-09 Apr-09
Open order count (in thousands)Open order count (in thousands)
Closed order count (in thousands)Closed order count (in thousands)
• January: Pre-tax loss of $11 million as the legacy FNF business was profitable, but the Lawyers/ Commonwealth operations lost more than $17 million on a pre-tax basis
• February: Pre-tax loss of approximately $5 million, as legacy FNF was again slightly profitable and the Lawyers/ Commonwealth operations improved to a pre-tax loss of only $5 million
• March: $15 million in pre-tax earnings, but those results included a $20 million synergy bonus and $6 million in OTTI losses. Before those two items, we generated approximately $41 million in pre-tax earnings, which we believe to be a more meaningful representation of our operating performance in March, as legacy FNF generated a high single digit margin for the month and the Lawyers/Commonwealth operations recorded a mid-single digit margin
• Lawyers/Commonwealth run rate cost synergies of $231million
Q1 2009 ResultsTotal Revenue $ 1.36 B
Pre-Tax Earnings 141,000
Adjusted Pre-Tax Earnings1 25.8 million
Cash Flow From Operations $128.3 million
1 Includes one-time pre-tax bonus accrual of $20.4mm related to the achievement of Lawyers/Commonwealth cost synergies and OTTI losses of $5.7mm related to several equity securities.
19
FNF Financial Overview
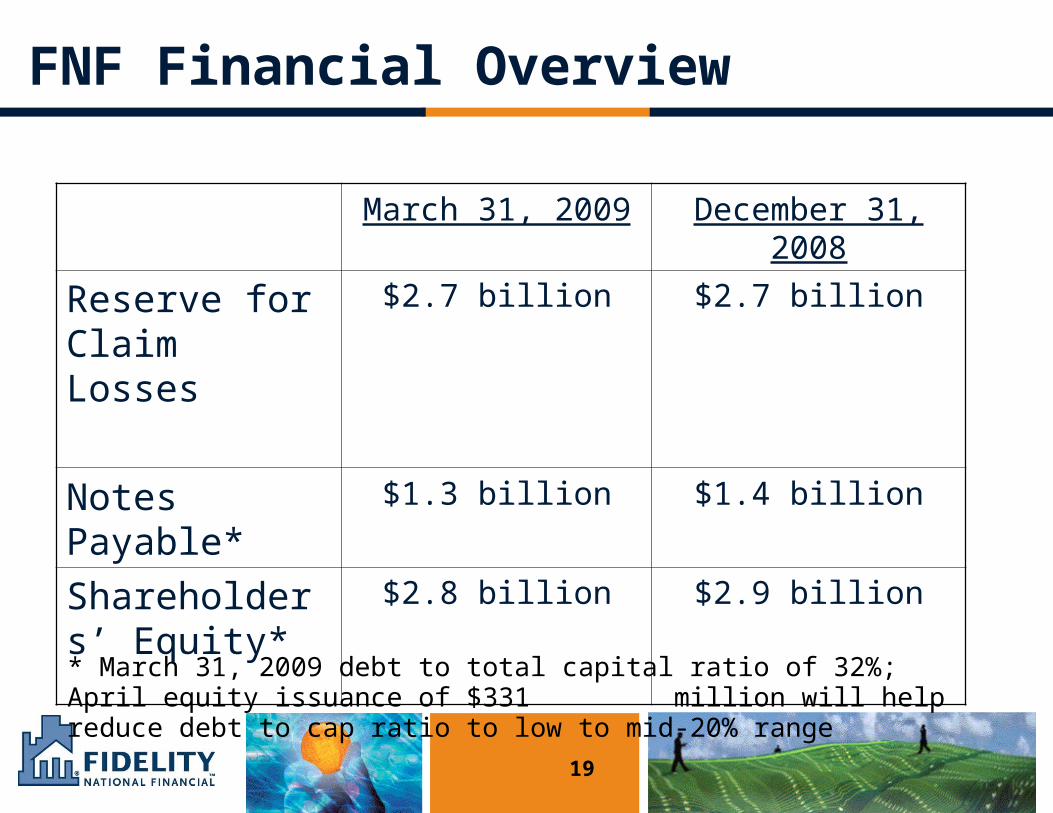
March 31, 2009 December 31, 2008
Reserve for Claim Losses
$2.7 billion $2.7 billion
Notes Payable* $1.3 billion $1.4 billion
Shareholders’ Equity*
$2.8 billion $2.9 billion
* March 31, 2009 debt to total capital ratio of 32%; April equity issuance of $331 million will help reduce debt to cap ratio to low to mid-20% range
20
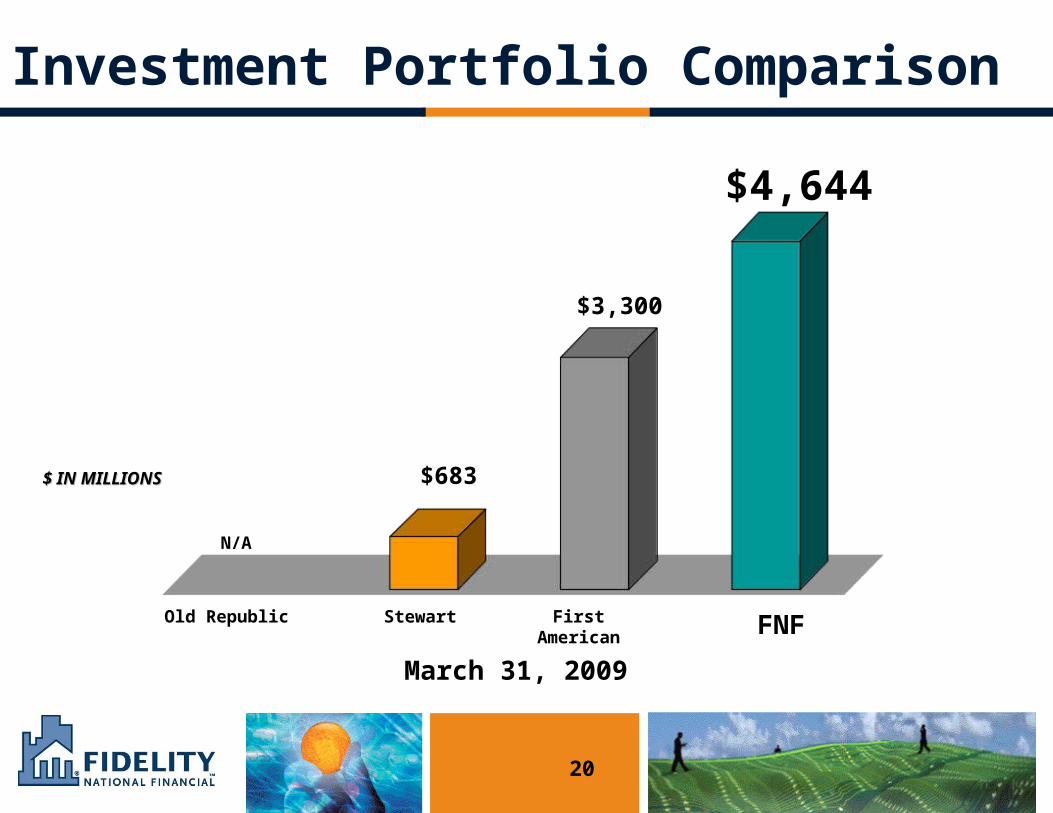
$683
N/A
$4,644
Old Republic Stewart First American FNF
March 31, 2009
$ IN MILLIONS$ IN MILLIONS
Investment Portfolio Comparison
$3,300
21
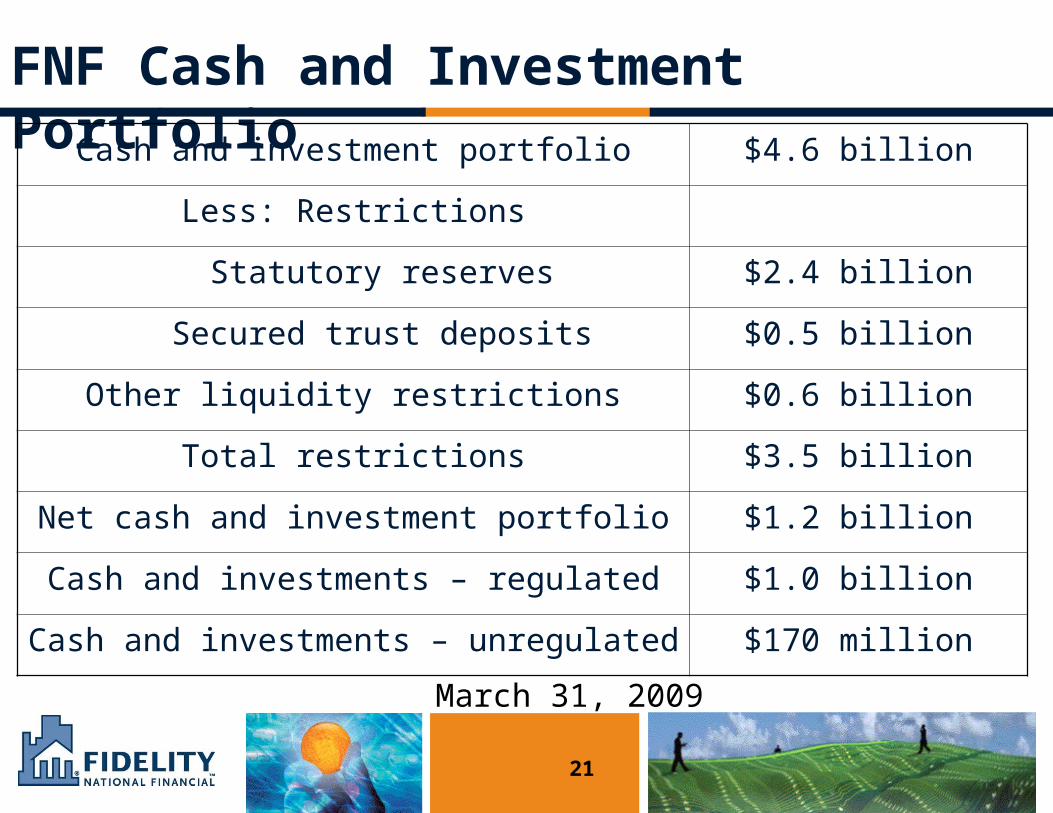
FNF Cash and Investment Portfolio
Cash and investment portfolio $4.6 billion
Less: Restrictions
Statutory reserves $2.4 billion
Secured trust deposits $0.5 billion
Other liquidity restrictions $0.6 billion
Total restrictions $3.5 billion
Net cash and investment portfolio $1.2 billion
Cash and investments – regulated $1.0 billion
Cash and investments – unregulated $170 million
March 31, 2009
Stephens Inc.Spring Investment Conference June 3, 2009