Embed Size (px)
Citation preview

Copyright © UNU-WIDER 2005 1 United Nations Economic Commission for Africa (UNECA), Addis Ababa, email: uneca.org; 2 Kenya Institute for Public Policy Research and Analysis (KIPPRA), Nairobi.
This study has been prepared within the UNU-WIDER project on Tax Policy Reform in Developing Countries.
UNU-WIDER gratefully acknowledges the financial contribution to the project by the Royal Danish Ministry of Foreign Affairs, Danida.
UNU-WIDER also acknowledges the financial contributions to the research programme by the governments of Denmark (Royal Ministry of Foreign Affairs), Finland (Ministry for Foreign Affairs), Norway (Royal Ministry of Foreign Affairs), Sweden (Swedish International Development Cooperation Agency—Sida) and the United Kingdom (Department for International Development).
ISSN 1810-2611 ISBN 92-9190-755-3 (internet version)
Research Paper No. 2005/67
The Tax Reform Experience of Kenya
Stephen Njuguna Karingi1 and Bernadette Wanjala2 December 2005
Abstract
In evaluating tax reform in the developing countries, one first needs to determine what is the unique role of the tax system in each particular country. One of the key reasons for undertaking tax reforms in Kenya was to address issues of inequality and to create a sustainable tax system that could generate adequate revenue to finance public expenditures. In this respect, the tax modernization programme introduced in the country was to achieve a tax system that was sustainable in the face of changing conditions domestically and internationally. Policy was shifted towards greater reliance on indirect taxes as opposed to direct taxes. Consumption taxes were seen to be more favourable to investments and hence growth. Trade taxes, instead of being used for protection or revenue-maximization purposes, were viewed more as instruments to foster export-led industrialization. Trade taxes were therefore used to create a competitive exports sector rather than protect the import-competing manufacturing sector, as had been done in the past.
This study examines the reform efforts of the country, and reviews the strengths and weakness of the tax system as it has evolved over the past decades.
Keywords: tax reform, Kenya, inequality, trade
JEL classification: H21, H22, H23, H24, H27
The World Institute for Development Economics Research (WIDER) was established by the United Nations University (UNU) as its first research and training centre and started work in Helsinki, Finland in 1985. The Institute undertakes applied research and policy analysis on structural changes affecting the developing and transitional economies, provides a forum for the advocacy of policies leading to robust, equitable and environmentally sustainable growth, and promotes capacity strengthening and training in the field of economic and social policy making. Work is carried out by staff researchers and visiting scholars in Helsinki and through networks of collaborating scholars and institutions around the world.
www.wider.unu.edu [email protected]
UNU World Institute for Development Economics Research (UNU-WIDER) Katajanokanlaituri 6 B, 00160 Helsinki, Finland Camera-ready typescript prepared by T:mi LHR Editorial and Secretarial Assistance The views expressed in this publication are those of the author(s). Publication does not imply endorsement by the Institute or the United Nations University, nor by the programme/project sponsors, of any of the views expressed.
Author’s note
This paper was written when Stephen Njuguna Karingi was at the Kenya Institute for Public Policy Research and Analysis, Nairobi.

1
1 Introduction
In understanding the tax reform experience in Kenya, one of the questions that must be answered is what is the role of the tax system? In practice, there are three common objectives of a tax system: (i) to raise revenue to fund government operations; (ii) to assist in the redistribution of wealth or income; and (iii) to encourage or discourage certain activities through the use of tax provisions. While all tax systems share these objectives, what differs is the weight placed in a given country to each of these objectives. The capacities of different countries’ tax systems to achieve these objectives also differ. In Kenya, raising revenue can be said to have been the overriding concern. Moreover, with a limited degree of success, the tax system is also used to address issues of inequality as can be deduced from the nominal progressivity of the income tax structure.
Kenya has witnessed significant changes in many aspects of its economy over the last four decades. One of the striking characteristics of Kenya is that unlike many other Sub-Saharan countries today, it is a high tax-yield country with a tax-to-GDP ratio of over 20 per cent. Kenya is able to finance a large share of its budget, while external donor finances are used to cover a much smaller share than in other countries of the region. This striking feature, however, does not mean that the country is not without its problems with the tax system. Like most developing countries, it has had to contend and still contends with the common problems that plague tax systems of developing countries. These problems are the existence of tax systems (i) with rates and structures that are difficult to administer and comply with; (ii) that are unresponsiveness both to growth and discretionary tax measures hence offering low tax productivity; (iii) that raise little revenue but introduce serious economic distortions; (iv) that provide opportunities for differential treatment of individuals and businesses in similar circumstances, and (v) that are selective with regard to tax administration and enforcement, and skewed in favour of those with the ability to defeat the system.
What criteria should one then use to evaluate Kenya’s tax system in general and its specific tax instruments in particular, given the tax reform initiatives to date? Theory offers criteria of efficiency, fairness and administrative feasibility both for the specific tax instruments and for the entire tax regime. Looking at how far Kenya’s tax system goes to meet these criteria and how the weight accorded to each of these goals has differed over time given the country’s tax reform process would be a useful way of evaluating its progress.
After this brief introduction, the next step is to explore the history of Kenya’s tax reform. The following section of this paper provides a chronological review of the main tax reforms in Kenya.
2 What has been Kenya’s history of tax reform?
Before the advent of the adjustment programmes that many developing countries initiated in the 1980s, most nations in Sub-Saharan Africa had never undertaken initiatives that could pass for major tax reforms. Kenya is no exception. The main tax reform in Kenya occurred under the tax modernization programme (TMP) that started in the late 1980s. This paper focuses on the reforms introduced under the TMP, but
2
first we highlight the changes that took place prior to the TMP. Therefore, the chronology of the tax reforms is divided into two periods: 1963/4-1983/4 and 1984/5-2003/4. The paper focuses on the major changes in terms of policy and administration during these two periods. A tax-by-tax review is adopted in order to demonstrate how these changes have influenced the composition of Kenya’s tax revenue today. With this tax-by-tax review, the strengths and weaknesses of the evolving tax system can be highlighted and explained.
2.1 The piecemeal changes: 1963/4 to 1983/4
The country inherited a tax system with features and characteristics similar in many ways to the British tax system of that time. During the period under review, although there were no major reform initiatives on the scale seen later under the TMP, there were nevertheless certain changes that continued to influence the country’s tax system.
Indirect taxes: from consumption to sales tax
Until the early 1970s, the country had very few fiscal problems associated with the mobilization of tax revenue. The economy was growing at a very high rate, averaging over 6 per cent. In the beginning of the 1970s, however, the country started to experience its first major fiscal dilemma occasioned by the international energy crisis that had very severe consequences for an oil-importing country like Kenya. In an attempt to address the fiscal crisis, Kenya replaced the existing consumption taxes with a sales tax in the 1972/3 fiscal year. This system was favourable not only for targeting specific types of goods to raise additional revenue, but more importantly for complementing the inward-looking industrialization policy being pursued at that time. Sales tax was also used by the government to set the stage in the early 1980s for the policy change of relying more on indirect taxes as a major source of development finance in order to increase savings and investment and reduce the reliance on direct taxes.
Trade taxes: the inward-looking policy regime
Trade taxes in Kenya have been used to achieve two main objectives: to support the domestic manufacturing sector through protection from import competition and to raise revenue for the government. The weights attached to each of these objectives have varied over time. Initially, protection of the domestic manufacturing sector carried more weight. As import substitution came under criticism, trade taxes started to be used more as an instrument to generate revenue rather than promote industrialization. Thus, as early as 1974/5, in the face of the balance-of-payments crises that resulted from the first oil shock, there were signs of a policy shift towards promoting the exports of manufactured goods in order to reduce the soaring deficit in the current account. Import duties on raw materials for some of the domestic manufactures were gradually reduced. In addition to the reduction of duty for imported raw materials, a subsidy of 10 per cent on the value of exports of manufactured goods was introduced at the same time.
These measures, while being only temporary, were the starting point of a radical shift in policy from import substitution to export-led industrialization. But it is clear that there was still a degree of protectionism towards domestic manufactures because

3
import duties were increased in 1980/1 by 10 per cent on certain commodities competing with domestic goods. These increases, while meeting the government objective of protecting domestic industries, were also seen as the starting point towards a slightly more significant policy shift. The country changed its policy, placing greater reliance on indirect taxes as the major source of development finance and a deliberate decision was made to reduce the income taxation burden to promote savings and investments. Fiscal year 1983/4 witnessed a more definitive shift towards export-led industrialization as duty rates on commodities used for intermediate inputs in local industries were reduced in order to grant relief to local export manufacturers. This shift was also the initial phase of the more long-term objective of trying to make the industry more competitive. Import-substituting industrialization was under-performing because of an inefficient local manufacturing subsector. With reduced duties on intermediate inputs, the domestic sector was expected not only to benefit from lower average costs resulting from high import intensity but also to restructure as domestic manufacturers of the same imported intermediates faced import competition.
Income taxes: search for a policy position
Income tax policies in Kenya in the period prior to the major reforms of the TMP are indicative of a country in search of a policy position. The country appears to have come face-to-face with two dilemmas: the savings (hence growth)-equity dilemma and the efficiency-equity dilemma. With regard to the growth-equity dilemma, one observes an attempt in the early period to use income tax for redistribution purposes. For instance, corporate taxes were high: these were increased in 1973/4 from 40 to 45 per cent for local companies and from 47.5 to 52 per cent for foreign companies. While it can be argued that this increase was a response to the emerging fiscal crisis caused by the oil predicament of the time, the prevailing tax rates were quite significant. The differential treatment of local and foreign owned companies clearly highlights the equity objective that was included in the policy for corporate taxation at the time. It was felt that domestic manufacturing industries, unlike the foreign owned companies, needed support, i.e. equity.
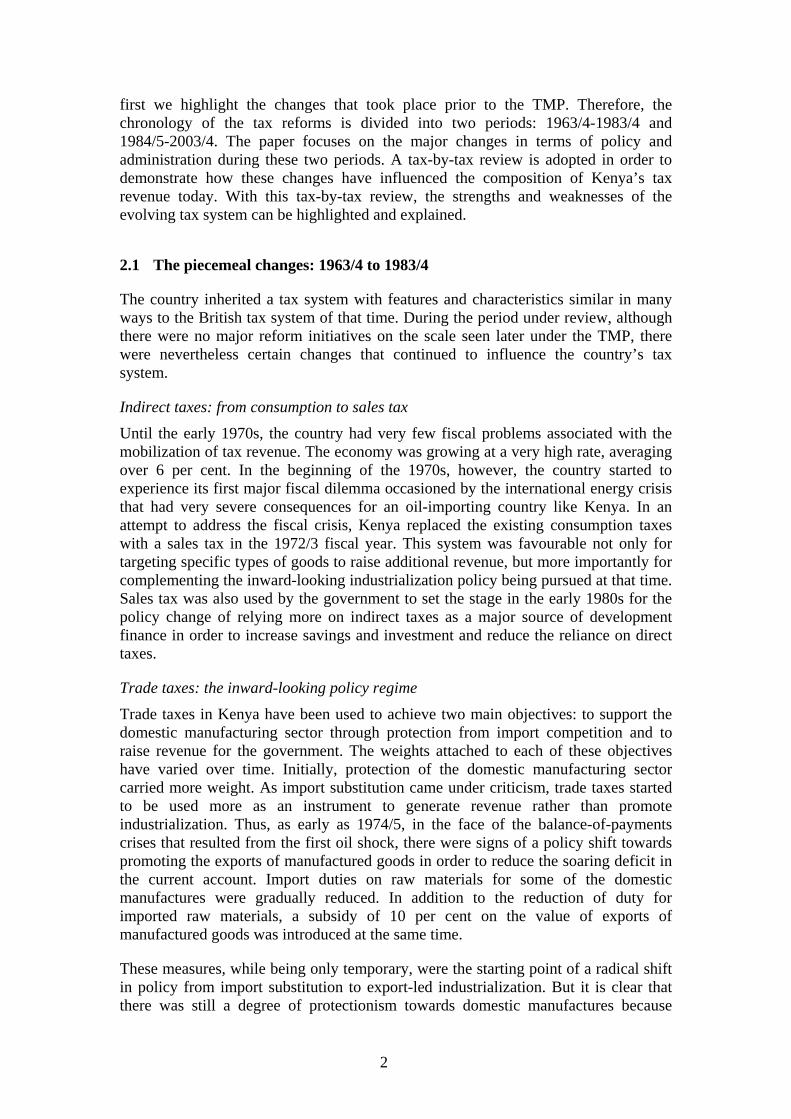
The early attempt to use income taxation to address equity objectives is more pronounced with personal income taxes. Kenya fell into the same trap as many other countries that had hoped to use income taxation for redistributing purposes. Many governments—including Kenya—considered personal income taxation (PIT) the most convenient and visible instrument to show concern for inequality issues. In this respect, Kenya introduced many tax brackets as an indication of the progressivity of PIT, and between 1974 and 1986 there were eight tax brackets in effect. Table 1 shows the country’s PIT system with a very high top marginal tax rate. In 1982, the range between the highest and lowest tax brackets was widened, indicating a move towards protecting the real incomes of households from inflation.
The important point to note is that the government hoped to maintain some degree of nominal PIT rate progressivity with numerous rate brackets. The government may have wanted to appear to be concerned with social justice, and consequently there may have been certain reluctance to undertake any PIT reform that would suggest a wavering of these commitments. The effectiveness of this nominal-rate progressivity in delivering effective-rate progressivity was underpinned by the lack of a sufficiently
4
Table 1 PIT progressivity in Kenya
1974–81 1982-85
Annual taxable income (Kshs) Rate (%) Annual taxable income (Kshs) Rate (%)
1–24,000 10 1–30,000 10 24,001–48,000 15 30,001–60,000 15 48,001–72,000 25 60,001–90,000 25 72,001–96,000 35 90,001–120,000 35
96,001–120,000 45 120,001–150,000 45 120,001–144,000 50 150,001–180,000 50 144,001–192,000 60 180,000–240,000 60
Over 192,000 65 Over 240,000 65
Source: GoK (various years).
high level of personal exemption (the minimum taxable income, say in multiples of per capita income, was as high as four) that still exists today. But it can be argued that during this period the government failed to recognize that effective-rate progressivity could still have been improved by reducing the degree of nominal-rate progressivity and the number of rate brackets. Moreover, the country failed to recognize that the effectiveness of the high 65 per cent marginal tax rate was eroded by the fact that it applied to high levels of income/GDP ratio so that little income was actually subjected to the maximum rate. Furthermore, the maximum level of the personal income tax rate was greater than the corresponding corporate income tax (CIT) rate. This must have affected taxpayers, as it had the potential of encouraging taxpayers to adopt the corporate form of business dealings. In these cases, professionals could easily siphon off profits through expense deductions as well as escape the higher PIT rate. It would have been good tax policy to have a system in which the top marginal PIT rate does not greatly deviate from the CIT rate.
2.2 Tax reforms: the tax modernization programme, 1984/5 to date
Excise taxes: shifting between specific and ad valorem tax regimes
Excise taxes have been an important component of total tax revenue in Kenya. In theory, excise taxes have several advantages over other types of taxes, such as administrative ease of collection. These taxes also tend to be levied on specific types of commodities, and different countries levy them for different reasons. They can be applied to compel the users of excised commodities to internalize the externalities that excisable commodities such as tobacco, alcohol and petroleum products tend to have. Excise taxes may also be used merely to generate revenue. In developed countries, excise taxes are sometimes levied to steer the industry concerned towards a desired strategic direction. In the case of Kenya, one can discern that excise taxes have been levied specifically for meeting the revenue requirements of the government. This being the overriding objective, one can then see the weakness that prevailed but which the continuously discretionary excise measures failed to recognize. A review of the excise tax policy indicates that at the time of implementing the tax modernization programme, Kenya maintained a specific excise tax regime. This is evident from the discretionary changes that were made in every budget speech from 1984/5 to 1988/9, when excise taxes on tobacco and beer were changed annually but the objective was

5
always the same: to ensure that prices were kept in line with domestic inflation and to maintain the level of revenue in real terms. In fact, excise taxes on cigarettes and tobacco products were raised annually until 1988/9 by an overall weighted average of 10 per cent. This clearly illustrates the challenge faced by the country in pursuing a specific tax regime at a time when the economy was experiencing moderate inflation.
As long as the country used excise taxes for revenue maximization, maintaining a specific tax regime during a period of moderate inflation was going to be a challenge. Uncertainty in investment and consumption decisions regarding excised commodities was an issue: action was contingent on policy pronouncements of whether rates, depending on the inflation outcome, were going up or down. As part of the TMP and to support the still valid objective of revenue maximization, there was a change in the excise tax regime in 1991/2. A number of excise tax rates were converted from specific to ad valorem to help the government achieve its multiple objectives of:
i) Ensuring that excise tax revenue increased in parallel with inflation, thus eliminating the need for discretionary measures. This automatic inflation adjustment was intended to offset the anticipated revenue loss from reduced import duty rates;
ii) Allowing for the rationalization of VAT rates and increasing control over high tax rate goods; and
iii) Giving equal tax treatment to all types of beer and closing the gap between malt and non-malt beer.
The regime switch to ad valorem excise taxes in 1991/2 did not eliminate discretion as had been expected. During the following year, for instance, in order to take advantage of increased beer consumption, rates for alcoholic products were raised for revenue generation purposes. Another issue with Kenya’s excise tax policy was the persistent continuation of multiple tax rates. But there were moves to rationalize the number of rates. In 1993/4 excise duty on cigarettes, which had been linked to three different price-based brackets, was changed to two length-based bands; furthermore, this amendment also improved the ease of administration. In 1997/8, excise duty on cigarettes was rationalized to a uniform 135 per cent rate in order to simplify the collection of domestic excises and prevent mis-declaration of imported cigarettes. Similar measures were implemented for alcoholic products but multiple rates continued to be applied for malt, non-malt and other locally made alcoholic products.
In 2003/4, the country abandoned the ad valorem regime and reverted back to specific taxation for tobacco and alcoholic products. However, it is important to mention that the country’s excise tax policy has recently been influenced by the regional integration initiatives that Kenya is party to. Harmonization of policies has been one of the key issues in the treaty of the East African Community (EAC), comprising Kenya, Uganda and Tanzania. Thus, in 1999/2000, the excise tax measures reducing the ad valorem rates for malt beers from 95 to 90 per cent were prompted by the country’s desire to bridge the taxation gap with its neighbours. Duties on beer and cigarettes were further reduced in 2000/1 with the key objective of continuing with the rationalization of duty rates within the EAC. It was hoped that the rationalization would strengthen control over the smuggled or untaxed commodities on the market. It is noteworthy that while excise taxes for cigarettes and alcohol were converted from

6
specific to ad valorem, petroleum products continued to remain within the specific tax regime. After the introduction of excise tax for petroleum products, the value of this particular tax group had fallen 12 per cent by 2001, an indication of the effect of inflation.
When the ad valorem regime was abandoned in favour of the specific regime for cigarettes and beer in fiscal year 2002/3, a hybrid excise duty of a minimum specific tax and an additional ad valorem rate were introduced on both domestic and imported cigarettes. The key objective was to deal with the tobacco industry’s increased smuggling, tax evasion and under-declaration of taxable values. By 2003/4, excise taxation of cigarettes and beer had been reverted back to a specific regime based on four bands, equivalent to an effective rate of 110 per cent. A specific excise regime was introduced on beer with three bands in an effort to reduce tax evasion, to simplify and improve the effective tax rate and the subsequent revenue yield while encouraging investment in quality cigarette and beer products for export. There is empirical evidence that specific excise tax regimes in low-inflation countries are more favourable to investments in high quality products than ad valorem regimes.
Customs duties: towards export-led industrialization
The contribution from customs duties to the country’s total revenue is mainly driven by the trade policy Kenya has pursued since 1984/5. There have been changes in the number of tariffs and in the rates ever since the country started implementing structural adjustment policies. The objectives underpinning tariff changes have been attempts towards greater openness, but there have also been episodes of protectionism for specific sectors or subsectors of the economy. These are summarized below. We also examine how this has influenced tariff rates, their structure and ultimately the contribution of customs duty to total tax revenue. It is clear, however, that unlike many developing countries, Kenya has not relied to any great extent on import duties for revenue mobilization.
Economic restructuring
The country adopted a trade policy in 1984/5 that clearly refrained from protectionism as its overriding objective. There were distinct efforts at introducing restructuring incentives and reducing the cost of production. During this period, most duties exceeding 25 per cent were cut for the express purpose of restructuring the economy towards export production, and away from the highly protected and inefficient pattern of industrialization that had been based on import substitution. Zero rating for agricultural inputs was also introduced during this period to improve production. Import tariffs on raw materials, intermediate inputs for industry and capital goods were decreased in the efforts to restructure.
Enhancing efficiency
The economy had suffered significantly from an inefficient production system that had resulted from the country’s protectionist trade policy. During trade liberalization, tariff rates were reduced in favour of intermediate and capital goods in order to trim prevailing economic distortions and to encourage local production. Duties on agricultural inputs continued to be removed in hopes that the country could boost agricultural productivity.
7
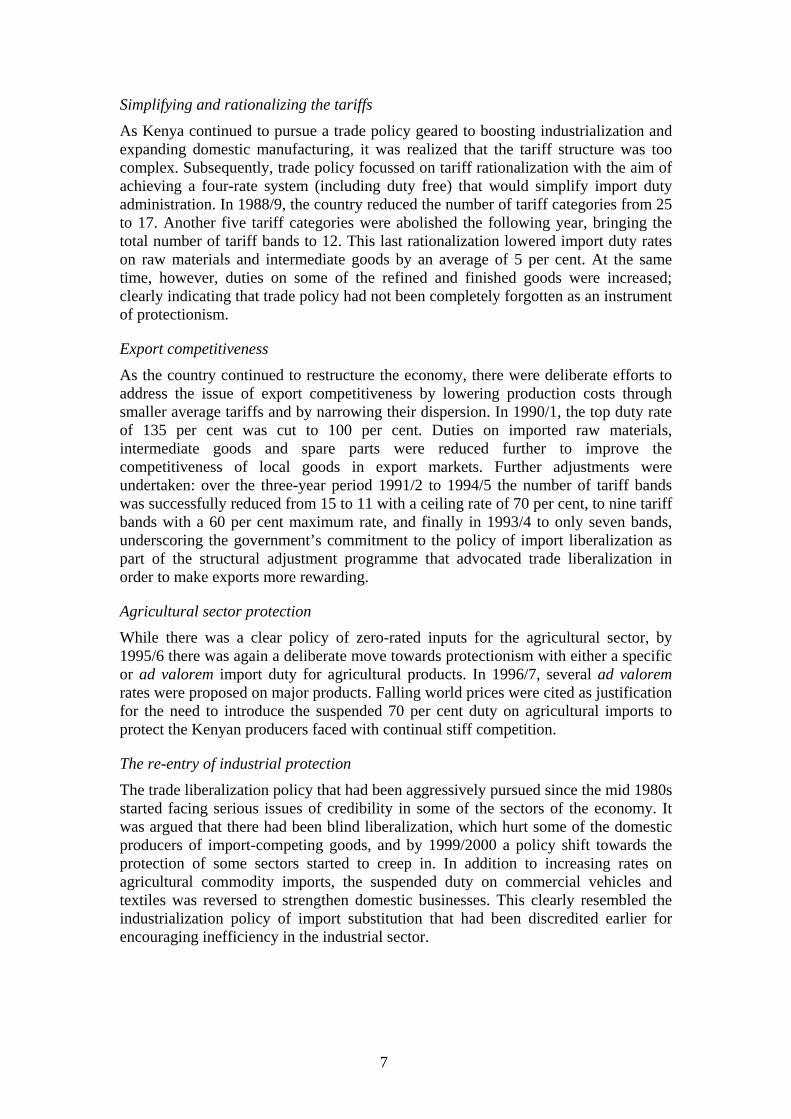
Simplifying and rationalizing the tariffs
As Kenya continued to pursue a trade policy geared to boosting industrialization and expanding domestic manufacturing, it was realized that the tariff structure was too complex. Subsequently, trade policy focussed on tariff rationalization with the aim of achieving a four-rate system (including duty free) that would simplify import duty administration. In 1988/9, the country reduced the number of tariff categories from 25 to 17. Another five tariff categories were abolished the following year, bringing the total number of tariff bands to 12. This last rationalization lowered import duty rates on raw materials and intermediate goods by an average of 5 per cent. At the same time, however, duties on some of the refined and finished goods were increased; clearly indicating that trade policy had not been completely forgotten as an instrument of protectionism.
Export competitiveness
As the country continued to restructure the economy, there were deliberate efforts to address the issue of export competitiveness by lowering production costs through smaller average tariffs and by narrowing their dispersion. In 1990/1, the top duty rate of 135 per cent was cut to 100 per cent. Duties on imported raw materials, intermediate goods and spare parts were reduced further to improve the competitiveness of local goods in export markets. Further adjustments were undertaken: over the three-year period 1991/2 to 1994/5 the number of tariff bands was successfully reduced from 15 to 11 with a ceiling rate of 70 per cent, to nine tariff bands with a 60 per cent maximum rate, and finally in 1993/4 to only seven bands, underscoring the government’s commitment to the policy of import liberalization as part of the structural adjustment programme that advocated trade liberalization in order to make exports more rewarding.
Agricultural sector protection While there was a clear policy of zero-rated inputs for the agricultural sector, by 1995/6 there was again a deliberate move towards protectionism with either a specific or ad valorem import duty for agricultural products. In 1996/7, several ad valorem rates were proposed on major products. Falling world prices were cited as justification for the need to introduce the suspended 70 per cent duty on agricultural imports to protect the Kenyan producers faced with continual stiff competition.
The re-entry of industrial protection
The trade liberalization policy that had been aggressively pursued since the mid 1980s started facing serious issues of credibility in some of the sectors of the economy. It was argued that there had been blind liberalization, which hurt some of the domestic producers of import-competing goods, and by 1999/2000 a policy shift towards the protection of some sectors started to creep in. In addition to increasing rates on agricultural commodity imports, the suspended duty on commercial vehicles and textiles was reversed to strengthen domestic businesses. This clearly resembled the industrialization policy of import substitution that had been discredited earlier for encouraging inefficiency in the industrial sector.
8
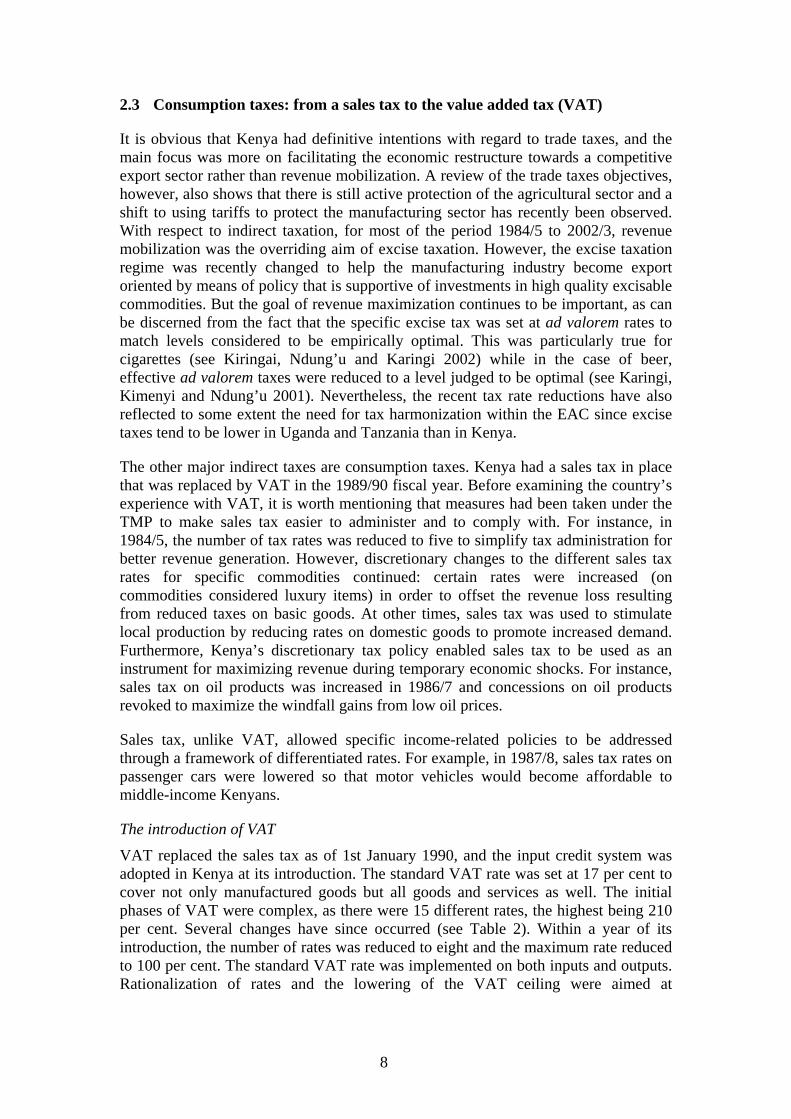
2.3 Consumption taxes: from a sales tax to the value added tax (VAT)
It is obvious that Kenya had definitive intentions with regard to trade taxes, and the main focus was more on facilitating the economic restructure towards a competitive export sector rather than revenue mobilization. A review of the trade taxes objectives, however, also shows that there is still active protection of the agricultural sector and a shift to using tariffs to protect the manufacturing sector has recently been observed. With respect to indirect taxation, for most of the period 1984/5 to 2002/3, revenue mobilization was the overriding aim of excise taxation. However, the excise taxation regime was recently changed to help the manufacturing industry become export oriented by means of policy that is supportive of investments in high quality excisable commodities. But the goal of revenue maximization continues to be important, as can be discerned from the fact that the specific excise tax was set at ad valorem rates to match levels considered to be empirically optimal. This was particularly true for cigarettes (see Kiringai, Ndung’u and Karingi 2002) while in the case of beer, effective ad valorem taxes were reduced to a level judged to be optimal (see Karingi, Kimenyi and Ndung’u 2001). Nevertheless, the recent tax rate reductions have also reflected to some extent the need for tax harmonization within the EAC since excise taxes tend to be lower in Uganda and Tanzania than in Kenya.
The other major indirect taxes are consumption taxes. Kenya had a sales tax in place that was replaced by VAT in the 1989/90 fiscal year. Before examining the country’s experience with VAT, it is worth mentioning that measures had been taken under the TMP to make sales tax easier to administer and to comply with. For instance, in 1984/5, the number of tax rates was reduced to five to simplify tax administration for better revenue generation. However, discretionary changes to the different sales tax rates for specific commodities continued: certain rates were increased (on commodities considered luxury items) in order to offset the revenue loss resulting from reduced taxes on basic goods. At other times, sales tax was used to stimulate local production by reducing rates on domestic goods to promote increased demand. Furthermore, Kenya’s discretionary tax policy enabled sales tax to be used as an instrument for maximizing revenue during temporary economic shocks. For instance, sales tax on oil products was increased in 1986/7 and concessions on oil products revoked to maximize the windfall gains from low oil prices.
Sales tax, unlike VAT, allowed specific income-related policies to be addressed through a framework of differentiated rates. For example, in 1987/8, sales tax rates on passenger cars were lowered so that motor vehicles would become affordable to middle-income Kenyans.
The introduction of VAT
VAT replaced the sales tax as of 1st January 1990, and the input credit system was adopted in Kenya at its introduction. The standard VAT rate was set at 17 per cent to cover not only manufactured goods but all goods and services as well. The initial phases of VAT were complex, as there were 15 different rates, the highest being 210 per cent. Several changes have since occurred (see Table 2). Within a year of its introduction, the number of rates was reduced to eight and the maximum rate reduced to 100 per cent. The standard VAT rate was implemented on both inputs and outputs. Rationalization of rates and the lowering of the VAT ceiling were aimed at

9
Table 2 Rationalization process for VAT rates in Kenya
Year No. of rates Rates (%) Standard rate (%)
1989/90 15 17 1990/1 9 0, 5, 18, 30, 45, 50, 80, 100, 150 18 1991/2 8 0, 5, 18, 25, 35, 50, 75, 100 18 1992/3 6 0, 3, 5, 18, 30 and 50 18 1993/4 4 0, 5, 18 and 40 18 1994/5 4 0, 5, 18 and 30 18 1995/6 4 0, 6, 15 and 25 15 1996/7 3 0, 8, and 15 15 1997/8 3 0, 10, and 17 17 1998/9 4 0, 10, 12 and 16 16 1999/00 4 0, 10, 13 and 15 15 2000/1 4 0, 10, 16 and 18 18 2001/2 4 0, 10, 16 and 18 18 2002/3 4 0, 10, 16 and 18 18 2003/4 3 0, 10, and 16 16
Source: GoK (various years).
minimizing tax evasion and making local products more competitive. Further rationalizations in VAT rates were to follow, although this process took some time; for instance, in 1992/3 there were still six rates, with a 75 per cent ceiling, but only four in 1993/4. Rationalization was considered necessary in order to eliminate misclassification, simplify tax administration, improve compliance, control smuggling and minimize exemption requests. There were continual cuts to the top rate so that by 1994/5 when there were four VAT levels, the highest rate was reduced from 40 to 30 per cent and the standard rate maintained at 18 per cent.
In order to encourage voluntary compliance the standard rate was reduced in 1995/6 to 15 per cent and the highest rate cut to 25 per cent. By now, the structure of VAT was moving towards a single rate, which was to simplify its administration significantly. Thus, the year 1996/7 saw the top rate of 25 per cent being slashed to the standard rate while the lower rate was increased from 6 to 8 per cent and further to 10 per cent in the following year.
A distinct feature of VAT in Kenya is that it has been the choice instrument for dealing with exceptional circumstances, and unexpected expenditures have been financed with increased VAT rates. The tax has also been used as part of the industrial strategy. In order to revamp Kenyan industries, stimulate economic activities and to encourage local production within specific sectors, a zero-rated VAT was applied to the relevant subsectors. Surprisingly, it was not until 2003/4 that VAT was recognized as an important instrument that could be used to boost consumption demand in the country.
The TMP has introduced major changes in income taxes in Kenya, particularly with regard to personal income taxes, as we will see later.
10
2.4 Corporate income taxes (CIT): the competition for foreign investments in a globalized world
The most important reforms in CIT have focused mainly on lowering rates in efforts to combat stiff global competition for investment funds. Rates have been decreased from the 45 per cent peak in 1989/90 to 30 per cent today. These measures have enabled the country to respond not only to competition from other countries for investment finance but also to present itself as a feasible destination for investment. There are three important issues worth highlighting with regard to the corporate income tax system in Kenya.
Equalizing the CIT rate to match the top marginal PIT rate
When tax reforms were initiated in Kenya, the top marginal PIT rates were generally higher than the CIT rates. This encouraged individuals to turn to business taxation and in the process to claim deductions that reduced their tax liability even further at the lower CIT rates. To eliminate this anomaly, the top marginal PIT rate and the CIT rate were equated.
Differentiated CIT rates for foreign owned and domestic companies
CIT rates for foreign incorporated companies have generally been higher than for resident companies. The differentiated rates were continued even after the tax reform period, and were used to encourage local registration and incorporation of companies.
Tax incentives via the CIT system as export-led industrialization strategy
As was discussed earlier in connection with trade and excise taxes, Kenya has re-oriented its development strategy towards export-led industrialization. In this respect, fiscal policy, particularly taxation, has been a critical instrument in realizing this goal. Subsequent trade policies have been targeted towards making Kenya’s exports competitive; import duties have been zero-rated and raw materials tax-exempted. On the other hand, the present excise tax regime is geared to promoting investment in high quality commodities so that the country becomes competitive in the export market for these products. The tax system in terms of the CIT has been reformed towards using tax incentives to encourage investments in Kenya. Tax holidays, repatriation of dividends and extending favourable investment deduction allowances have been critical lynchpins of the income tax system for companies wishing to invest in Kenya.
2.5 Personal income tax: trading progressivity for efficiency—the quest for growth over equity
Before the tax reforms, nominal progressivity and high marginal tax rates were common, but tax rationalization introduced a reduction in the number of tax brackets and a 50 per cent cut in the top marginal rates. Most of the criticism that was directed at personal income taxation in the pre-reform period has been addressed, particularly with regard to nominal progressivity as compared to effective progressivity. In addition, the top marginal tax rates—affecting only a small proportion of the taxpaying population in a country like Kenya—have also been reduced and matched to the CIT rate. In this section, we review the issues and improvements that have taken place under the personal income tax regime.

11
Regular adjustments to counter the inflation creep
One clear observation is that the personal income rates have been adjusted almost annually to keep pace with inflation and to provide inflation relief (Table 3).
Reducing the top marginal tax rates
As noted earlier, Kenya attempted to use the PIT structure for redistribution purposes. This has been common practice in many countries, both developed and developing, but as the competition for foreign direct investments increased and the level of foreign aid dwindled, it became necessary for countries to mobilize savings at the domestic level. High personal income taxes, especially the top marginal rates, have a negative effect on savings. Households that would otherwise postpone consumption in favour of savings reconsider when PIT rates are high. By lowering the top marginal tax rate, the PIT system can be used to remove the disincentive to save. As Table 3 clearly shows, Kenya gradually decreased its top marginal tax rate from 65 per cent to the current 30 per cent to provide personal incentive to save and to stimulate enterprises by creating a savings pool. This, it was hoped, would improve the performance of the economy and enhance job creation.
Reducing the number of tax brackets
Kenya’s tax modernization programme perceived personal income tax to be an essential instrument in achieving not only equity objectives but also economic growth. The reduction in the number of tax brackets helped to eliminate the nominal progressivity of the tax system that had limited its effectiveness, and at the same time simplified the many tax brackets that had created the complex system.
Regular increases and unifying family relief
Income tax deductions are in practice major instruments used by governments all over the world to achieve redistribution objectives. Such deductions tend to be means-tested with the income level as the main determinant of relief. In Kenya, the income tax system has been set up so that tax relief is provided to every registered income taxpayer irrespective of their income level. Thus, tax relief cannot be said to play any significant role in terms of income redistribution. However, it has been a useful instrument in providing income tax exemptions for low-income earners. Although relief over time has been increased to its current annual level of Kshs 12,672, the most significant reform has been the unification of the single tax and the married (family) relief into one. The differentiated relief level based to one’s marital status was discriminatory. In addition, relief was available only to males who claimed to be married but not to women. This showed gender insensitivity in addition to gender-based discrimination. But the most significant negative effect of the differentiated relief was probably the impact it had on the decision of taxpayers with respect to marriage.
Differential taxation of dividend and interest income
Kenya’s personal income tax is derived almost entirely from the salaries and wages of formal sector employees. There is some limited contribution from other individual income taxes. However, a substantial proportion of Kenyan households derive part of their income from interest earnings and from dividends. During the reform period, there were various adjustments to the treatment of the two types of income. They are,

12
however, still treated separately and attracted different rates for most of the period under review. This contributes to an inefficient allocation of investments, favouring assets with the lowest withholding tax and whether the tax is final or not. In theory, taxation of interest income is argued to be a disincentive to attracting foreign capital as well as encouraging capital flight. This argument is apt for Kenya as it has an open capital account which makes it easy to invest locally derived savings in foreign capital markets such as the United States where the tax rate on interest income is zero.
Table 3 PIT brackets in Kenya, 1986-2003
Year Annual taxable income (Kshs) Rate (%) Year Annual taxable income (Kshs) Rate (%)
1986-87 1–36,000 10 1988-89 1–39,600 10 36,001–72,000 15 39,601–79,200 15 72,001–180,000 25 79,201–118,800 25 108,001–144,000 35 118,801–158,400 35 144,001–180,000 45 158,401–198,000 45 180,001–216,000 50 Over 198,000 65 216,001–252,000 60 Over 252,000 65
1990-91 1–42,000 10 1992 1–46,000 10 42,001–84,000 15 46,001–92,000 15 84,001–126,000 25 92,001–138,000 25 126,001–168,000 35 138,001–184,000 35 Over 168,000 45 Over 184,000 45
1993 1–52,800 10 1994 1–60,000 10 52,801–105,600 15 60,001–120,000 15 105,601–158,400 20 120,001–180,000 20 158,401–211,200 25 180,001–240,000 25 211,201–264,000 35 240,001–300,000 35 Over 264,000 40 Over 300,000 40
1995 1–78,000 10 1996 1–78,000 10 78,001–156,000 15 78,001–156,000 15 156,001–234,000 20 156,001–234,000 20 234,001–312,000 25 234,001–312,000 25 312,001–390,000 35 Over 312,000 35 Over 390,000 37.5
1997 1–82,080 10 1998 1 90,240 10 82,081–164,160 15 90,241 -180,480 15 164,161–246,240 20 180,481–270,720 20 246,241–328,320 25 270,721–360,960 25 328,321–410,400 30 360,961–451,200 30 Over 410,400 35 Over 451,200 32.5
1999 1–94,800 10 2000 1–104,400 10 94,801–189,600 15 104,401–208,800 15 189,601–284,400 20 208,801–313,200 20 284,401–379,200 25 313,201–417,600 25 379,201–474,000 30 Over 417,600 30 Over 474,000 32.5
2001 1–109,440 10 2002-03 1–116,160 10 109,441–218,880 15 116,161–225,600 15 218,881–328,320 20 225,601–335,040 20 328,321–437,760 25 335,041–444,480 25 Over 437,760 30 Over 444,480 30
Source: GoK (various years).

13
Challenges in taxing agriculture and the informal sector—the presumptive income tax
Like many other developing countries, Kenya faces challenges in taxing income derived from agriculture and the informal sector. The tax policy has attempted at different times to introduce a presumptive income tax for agriculture, but this has been vexing and has been introduced and abolished in cycles. This means that a good part of agricultural income is untaxed. The same applies to the informal sector. Attempts to introduce a workable presumptive tax system for the informal section failed even during the reform era.
3 The structure of Kenya’s tax system: pre- and post reform
One of the key reasons for undertaking tax reforms in Kenya was to create a sustainable tax system that could generate adequate revenue to finance public expenditures. In this respect, the tax modernization programme endeavoured to achieve a tax system that was sustainable in the face of changing conditions domestically and internationally. Policy was shifted towards greater reliance on indirect taxes as opposed to direct taxes. Consumption taxes were seen to be more favourable to investments and hence growth. Trade taxes, instead of being used for protection or revenue-maximization purposes, were viewed more as instruments to foster export-led industrialization. Trade taxes were therefore used to create a competitive exports sector rather than protect the import-competing manufacturing sector. In this section, we address the question of how the structure of Kenya’s tax system has changed in post-reform period. To answer this question, we evaluate the effect of tax reforms on tax revenue and its composition in the pre- and post adjustment period, as measured by the tax/GDP ratios and the share of specific taxes in total tax revenue. In analysing the resultant tax structure, reference is made to the reforms already discussed, with a view of mapping the outcome to the actual reform initiatives and objectives.
3.1 Aggregate level of taxes in Kenya
What factors should be considered in determining the aggregate level of taxes? Economic theory provides little guidance on optimal aggregate tax levels at given levels of economic development. The focus therefore tends to be on the structure of a tax system with regard to a particular tax revenue requirement. However, it is not possible to separate the question of the appropriate aggregate level of taxes from the appropriate level of government expenditures. Kenya has moved from being a low tax-yield country to a high tax yield. Forty years ago, total tax revenue to GDP averaged 10.6 per cent (see Table 4). This tax yield rose successfully even before the major tax reform programme to peak on average at 19.7 per cent of GDP by the early 1980s. But this level of tax yield compared to the expenditure-to-GDP ratio was nonetheless insufficient. Consequently, one of the main objectives of the TMP was to raise tax yield on a zero deficit strategy to match expenditures which were on average 28 per cent of GDP. This objective was never achieved and the best performance in terms of tax yield was during the years 1993/4-97/8, when it climbed to 24.4 per cent of GDP. But how does Kenya compare internationally? The often-cited study by Tanzi and Zee (2000) finds that taxes for the period 1985-87 constituted 36.6 per cent

14
Table 4 Tax structure in Kenya as a percentage of GDP
Pre-tax modernization programme
period Post-tax modernization programme
period
Type of tax 1963/4-
67/8 1968/9-
72/3 1973/4-
77/8 1978/9-
82/3 1983/4-
87/8 1988/9-
92/3 1993/4-
97/8 1998/9-00/01
Total revenue 10.6 13.6 16.9 19.7 19.3 21.4 24.4 22.8 Import duty 4.2 4.2 4.0 4.8 3.9 3.2 4.1 3.8 Excise duty 1.8 2.3 1.9 2.1 1.7 2.4 4.1 3.8 Income tax 4.1 6.1 6.6 6.5 6.3 7.3 9.3 7.4 Sales tax/VAT1 0.0 0.4 4.1 5.6 6.2 7.4 5.9 5.7 Others 0.5 0.5 0.5 0.6 1.1 1.0 0.9 2.0
Note: 1 Sales tax was introduced during fiscal year 1971/2 and replaced by VAT in 1989/90. Source: Authors’ computations.
of GDP in developed countries and 19.6 per cent in Africa. Kenya at this time had an aggregate tax revenue of 19.3 per cent of GDP, indicating a tax yield consistent with Africa’s average. In the same study, the aggregate tax revenue for the period 1995-97 for developed countries was about 38 per cent of GDP. In contrast, for the same time period the average level of tax revenue for developing countries was only about 18 per cent and 19.8 per cent for Africa. Kenya at this time had managed to improve its tax-yield ratio to about 24 per cent of GDP. Thus, while other African countries’ aggregate revenue stagnated, Kenya has been able to raise its ratio by more than five percentage points. During the tax reform process, the country’s fiscal strategy was revised and the revenue target is currently 22 per cent of GDP. In terms of revenue adequacy, the TMP can be said to have been successful, as there was a clear improvement in tax yield before the revision of the fiscal strategy.
The relative use of different tax instruments in Kenya
Optimal tax theories provide some guidance on the choice and design of tax instruments in a given tax system. The theory of optimal taxation attempts to achieve Pareto optimality by achieving Pareto efficiency in the design of a tax structure. In practice however, because of the restrictive assumptions of optimal tax theory, there is a gap between optimal theory and practical guidance in designing tax systems. Given these restrictive assumptions, this study does not attempt to evaluate Kenya’s tax system before and after reforms or its use of different instruments on the basis of optimal taxation issues. Instead, it examines the relative use of different tax instruments regardless of whether or not they are optimal.
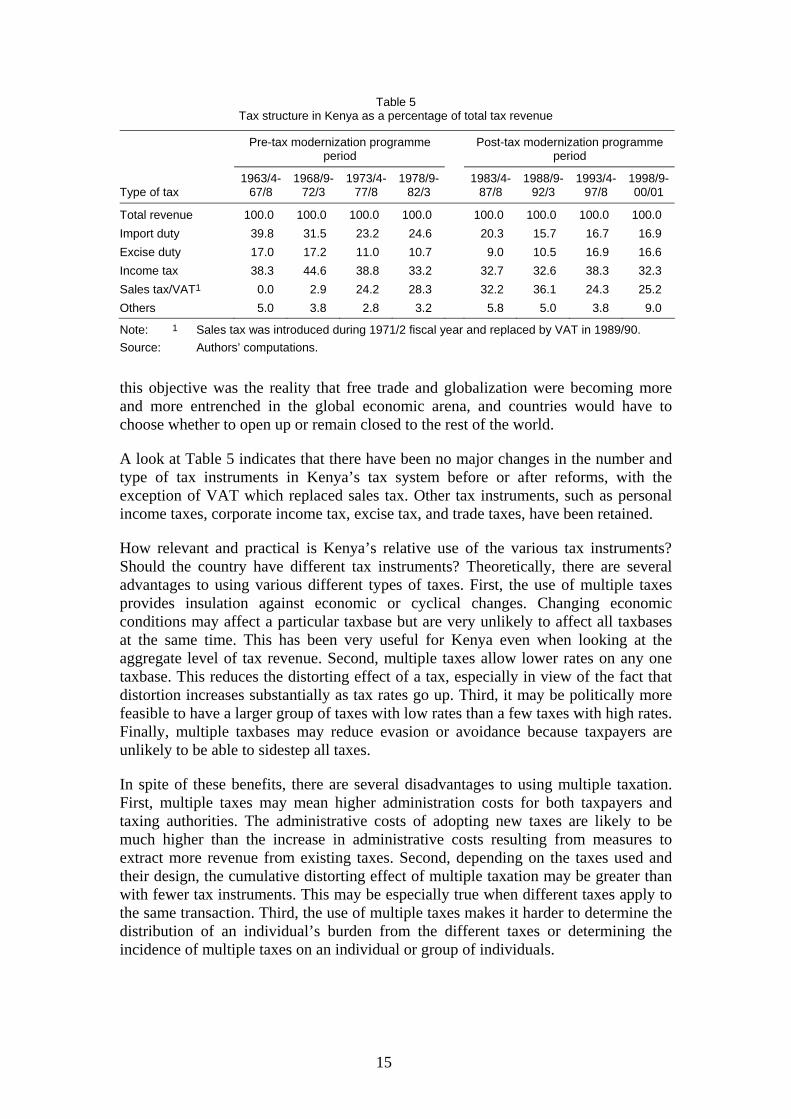
Table 5 provides a clear picture of how Kenya’s tax structure has changed over time. In addition to seeking to raise the tax yield of the economy to a level that would allow the country to pursue a sustainable deficit policy, the TMP sought to address the constraints in the existing tax structure that could have deterred achieving this goal. These included the reliance on direct taxes in spite of the negative effects such taxes have on the sustainability of economic growth. Another constraint was the significance of trade taxes in total tax revenue despite emerging evidence that import substitution is less than successful as an industrialization policy and hence there was need for a trade policy that would create a vibrant export-oriented economy. Linked to
15
Table 5 Tax structure in Kenya as a percentage of total tax revenue
Pre-tax modernization programme
period Post-tax modernization programme
period
Type of tax 1963/4-
67/8 1968/9-
72/3 1973/4-
77/8 1978/9-
82/3 1983/4-
87/8 1988/9-
92/3 1993/4-
97/8 1998/9-00/01
Total revenue 100.0 100.0 100.0 100.0 100.0 100.0 100.0 100.0 Import duty 39.8 31.5 23.2 24.6 20.3 15.7 16.7 16.9 Excise duty 17.0 17.2 11.0 10.7 9.0 10.5 16.9 16.6 Income tax 38.3 44.6 38.8 33.2 32.7 32.6 38.3 32.3 Sales tax/VAT1 0.0 2.9 24.2 28.3 32.2 36.1 24.3 25.2 Others 5.0 3.8 2.8 3.2 5.8 5.0 3.8 9.0
Note: 1 Sales tax was introduced during 1971/2 fiscal year and replaced by VAT in 1989/90. Source: Authors’ computations.
this objective was the reality that free trade and globalization were becoming more and more entrenched in the global economic arena, and countries would have to choose whether to open up or remain closed to the rest of the world.
A look at Table 5 indicates that there have been no major changes in the number and type of tax instruments in Kenya’s tax system before or after reforms, with the exception of VAT which replaced sales tax. Other tax instruments, such as personal income taxes, corporate income tax, excise tax, and trade taxes, have been retained.
How relevant and practical is Kenya’s relative use of the various tax instruments? Should the country have different tax instruments? Theoretically, there are several advantages to using various different types of taxes. First, the use of multiple taxes provides insulation against economic or cyclical changes. Changing economic conditions may affect a particular taxbase but are very unlikely to affect all taxbases at the same time. This has been very useful for Kenya even when looking at the aggregate level of tax revenue. Second, multiple taxes allow lower rates on any one taxbase. This reduces the distorting effect of a tax, especially in view of the fact that distortion increases substantially as tax rates go up. Third, it may be politically more feasible to have a larger group of taxes with low rates than a few taxes with high rates. Finally, multiple taxbases may reduce evasion or avoidance because taxpayers are unlikely to be able to sidestep all taxes.
In spite of these benefits, there are several disadvantages to using multiple taxation. First, multiple taxes may mean higher administration costs for both taxpayers and taxing authorities. The administrative costs of adopting new taxes are likely to be much higher than the increase in administrative costs resulting from measures to extract more revenue from existing taxes. Second, depending on the taxes used and their design, the cumulative distorting effect of multiple taxation may be greater than with fewer tax instruments. This may be especially true when different taxes apply to the same transaction. Third, the use of multiple taxes makes it harder to determine the distribution of an individual’s burden from the different taxes or determining the incidence of multiple taxes on an individual or group of individuals.
16
4 The outcome of Kenya’s tax reforms
It is clear that the multiple tax instruments Kenya has adopted in its tax system have both advantages and disadvantages. As noted above, the number of tax instruments has not changed in any major way following reforms but based on the evidence in Tables 4 and 5, certain specific results can be distilled from Kenya’s tax reform efforts.
4.1 Diminishing role of trade taxes
The significance of trade taxes in Kenya’s total tax revenue has diminished considerably. In the early 1960s, trade taxes constituted 40 per cent of total tax revenue or 4.2 per cent of GDP. This ratio continued to fall and was around 25 per cent of total revenue before the modernization programme, TMP. The TMP led to a further drop in the ratio of trade taxes to roughly 17 per cent of total tax revenue. Tanzi and Zee (2000) note that trade taxes are a relatively insignificant source of revenue for developed countries (less than 0.3 per cent of GDP) but that they constitute between 20-40 per cent of total tax revenue for developing countries. These authors also note that in general, the percentage of trade taxes in total tax revenue for developing countries is higher in low tax-yield countries (where tax revenue as a percentage of GDP ranges between 5-10 per cent) than in medium tax-yield (10-20 per cent of GDP) or high tax-yield countries (greater than 20 per cent of GDP). As Kenya developed from a low to a high tax-yield country, also trade taxes became less important. But probably what could be hidden in this inverse relationship is that trade taxes in terms of a proportion of GDP still constitute roughly 4 per cent.1 Another possible explanation is that Kenya has adjusted its trade policy paradigm with regard to export competitiveness to embrace free trade and the challenges of globalization as opposed to relying on the protection of import competing sectors.
4.2 The importance of excise taxes
Initially, excise taxes were important, as they constituted 17 per cent of total revenue, but declined to only 11 per cent by fiscal year 1982/3 (see Table 5). During this period, Kenya’s economy experienced a moderate level of inflation, but a specific excise tax regime prevailed at the same time. One of the measures implemented under the TMP was the switch from an excise tax regime to ad valorem at least in the case of tobacco and alcohol products. This seems to have been quite successful as the excise tax contribution improved from 9-10 per cent to about 17 per cent of total tax revenue. But augmented by theoretical and empirical evidence that specific taxes are more favourable in terms of investments in high quality products for competitive export markets, the country reverted back to a specific tax regime. An important observation related to excise taxes is that their automatic up-rating may be necessary unless inflation can be contained at a very low level.
1 The constancy of the trade taxes-to-GDP ratio at roughly 4 per cent could be misleading given that
Kenya’s economic growth has been declining and has exhibited over the last decade an average growth path of 2 per cent per annum (see Njuguna, Karingi and Kimenyi 2003).

17
4.3 Reduced role for income taxes but still the most significant group
One of the objectives of tax reform was to reduce Kenya’s reliance on direct taxes, and subsequently there were measures to support greater reliance on indirect taxes, specifically consumption taxes. Theoretical justification for using consumption rather than income taxes to raise government revenue is evident in the pro-growth environment. To fully understand the outcome of the tax reforms, it is necessary to consider these with regard to their international context. The Tanzi and Zee study (2000) indicates that reliance on consumption taxes rather than income taxes is much greater in developing countries than in the developed, where income tax revenue generally exceeds revenue from consumption taxes by a substantial margin (14.2 per cent of GDP for income taxes compared to 11.4 per cent of GDP for consumption taxes). In contrast, developing countries receive twice as much tax receipts from consumption taxes (10.5 per cent of GDP as compared to 5.2 per cent of GDP on the part of income taxes). Kenya is no exception, as can be seen from Table 3. Prior to reform, income taxes averaged 6 per cent of GDP and consumption taxes (excise plus sales tax) stood at 7.7 per cent of GDP. After tax reforms, consumption taxes have become more significant, constituting approximately 10 per cent of GDP while income taxes account for slightly over 7 per cent. Thus, some success was achieved by the shift to consumption taxes, if not in comparison to the ratios of the developed countries but at least versus the developing countries.
Another important point should be highlighted with respect to income taxes: the relative proportion of revenue accruing from individual or corporate taxes differs between developed and developing countries. In the developed countries, individual income taxes exceed corporate income taxes by 3 to 1. In contrast, in the developing countries, revenue from corporate taxation exceeds individual income taxes by a substantial margin. In Kenya, however, both individual and corporate income taxes had contributed almost equal shares but individual income taxes have recently overtaken corporate income taxes. This may be one explanation why Kenya continues to perform better than other African countries in terms of tax yield.
VAT productivity: a continual challenge
Since VAT was adopted by the countries of the European Union, it has gained popularity globally and has become one of the components of major tax reform initiatives in many countries. Indeed, in Kenya, VAT was perceived as the tax of the future in line with the country’s objective of reducing reliance on direct taxes as well as diminishing the role of trade taxes. In this respect, the performance of VAT becomes an important issue for study.
Figure 1 shows the productivity2 of VAT since its introduction. As is clear from the figure, productivity improved slightly for the first few years before peaking at around 44 per cent in 1993/4 fiscal year. Then there was a drastic fall to about 31 per cent in 1994/5 before recovery to around 38 per cent in the following year, but this recovery could not be sustained. There have been some years of falling productivity and even though the decline has been reversed, productivity has not returned to the levels of its
2 VAT productivity is derived by dividing the ratio of VAT to GDP with VAT’s standard rate.

18
initial phase. Low productivity does seem to indicate the possibility of structural problems that the tax reforms may have failed to address.
Figure 1 VAT productivity in Kenya
0.0 5.0
10.0 15.0 20.0 25.0 30.0 35.0 40.0 45.0 50.0
89/90 90/91 91/92 92/93 93/94 94/95 95/96 96/97 97/98 98/99 99/00 00/01 Fiscal year
VAT
Prod
uctiv
ity (%
)
Source: Authors’ computations.
Evidence of distributional impact: have the reforms been pro-poor?
Having an equitable tax system was one of the objectives of Kenya’s tax modernization programme. Therefore, an important question in assessing the outcomes of the tax reform is, how effective have the different tax instruments been in redistributing wealth or income in the country? In both theory and practice, tax instruments vary greatly in their ability to redistribute wealth or income. Individual income taxes and wealth taxes are the primary instruments to achieve redistribution. Whether and to what degree corporate income taxes support the redistribution of wealth depends on whether shareholders—as opposed to labour or consumers—bear the corporate tax burden. Taxes on consumption are generally assumed to be regressive, given that lower-income groups tend to spend a higher percentage of their income than the more affluent income groups. But the regressivity of consumption taxes is not as severe when considered over a lifetime perspective as espoused in theories covering intergenerational equity issues. Whether taxes in Kenya, particularly during and after reforms, have aided in the redistribution of income or in providing targeted relief is a difficult question. This issue notwithstanding, unless personal income taxes play a greater role in the country, redistribution through taxation will be very difficult. Moreover, income tax competition from other countries and the limitations of tax administration restrict the possibilities of using the tax system to redistribute income and wealth.
Addressing poverty concerns through the design of specific tax instruments looks sometimes promising but this has not been a key feature of Kenya’s taxation. Tax instruments differ in their effectiveness in reducing the tax burden of the poor. Countries use their individual income tax systems to address poverty issues in one of
19
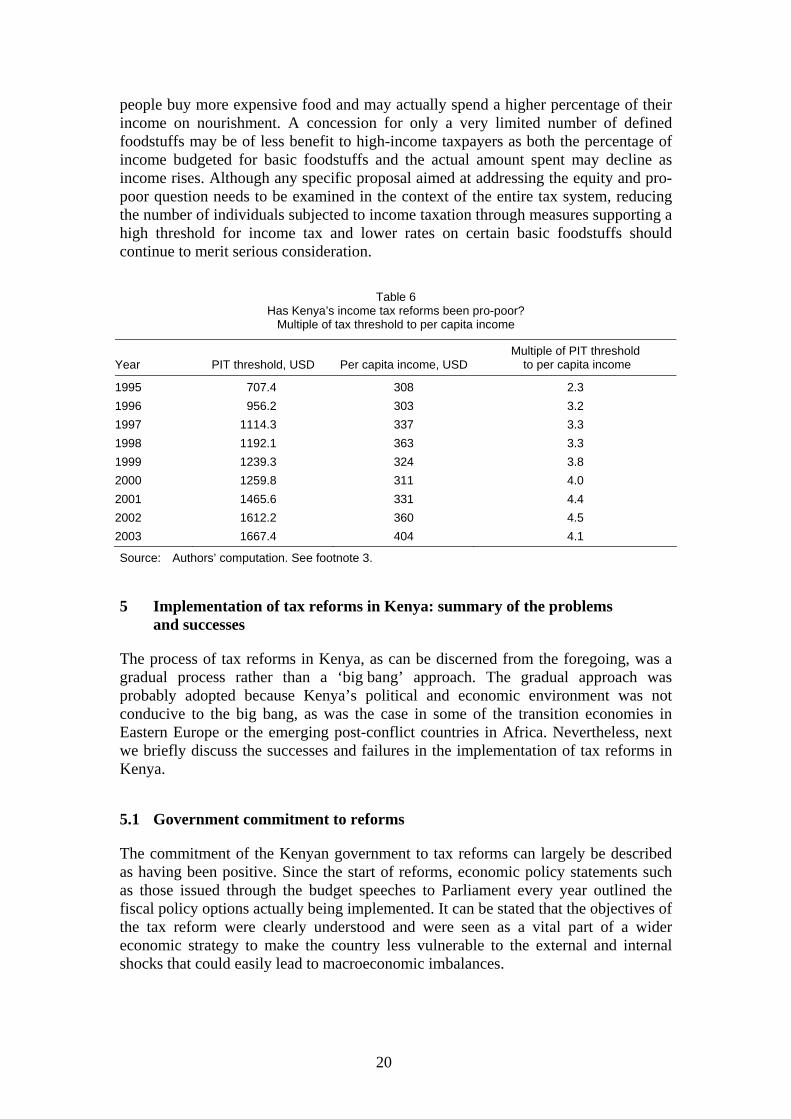
three ways: (i) use the system as part of the social welfare programme to provide cash transfers to low-income individuals; (ii) adopt a high taxable threshold to exempt certain low-income individuals from income tax; and (iii) adopt provisions that seek to reduce the tax burden of low-income individuals. Of these three measures, the first option has not been a part of Kenya’s tax reforms. Nor has the third option been utilized for income redistribution purposes; if anything, the provisions already in place in Kenya such as tax deductibility of individual pension schemes, life insurance premium payments, mortgage interest costs and education policies are more beneficial to the middle- to high-income groups. The equity issue and support for the poor have mainly been addressed through the second option in conjunction with an expansion of the income tax brackets. The income tax threshold,3 currently four times Kenya’s per capita income, has been increased gradually over the reform period. From Table 6 one can see that there have been efforts at protecting the poor via personal income taxation, as the PIT threshold over the tax reform period has been consistently raised in comparison to per capita income. Although Table 6 does not tell us much about the progressivity4 of income tax, it is obvious that it takes the lower-income groups longer today to reach a positive net PIT paying position than it did, for instance, in 1995.
The other equity-related taxation question concerns VAT. A single rate VAT may be regressive in comparison to income, because low-income groups spend a higher percentage of their income than high-income individuals. As part of its tax reforms, Kenya, like many other countries, sought to offset the regressivity of VAT by reducing the tax burden on the basic goods and services believed to constitute a higher proportion of total spending of the poor as compared to more affluent groups. However, it is possible that different income groups purchase many of the same goods and services. It is also possible that high-income groups are buying more expensive products compared to the less well-off. If this is the case, lower VAT rates on basic goods may be ineffective in achieving distributional goals, and it may be necessary to address redistribution concerns with measures outside the VAT system. Using multiple VAT rates, which were a part of Kenya’s tax reforms initially, imposed significant administrative costs because of the difficulty of defining items eligible for lower or zero rates. A feasible alternative that was eventually adopted was to have only a limited number of basic food commodities at zero rate. This approach has had two advantages. First, it avoids many of the demarcation problems found in all tax systems characterized with generous concessions. And second, this approach alleviates the regressivity of the exemption. The benefit of a broad exemption for ‘food’ would have been greater for higher-income groups than for the poor, as richer
3 The multiple of the income tax threshold to per capita income has been computed by taking the
country’s annual tax relief and determining, on the basis of the lowest income tax rate, how much an individual would have to earn in order to reach a net income tax paying position. Currently, an individual earning Kshs 126,720 would be liable at 10 per cent to an income tax of Kshs 12,672. Given that the tax relief is Kshs 1,056 per month, then the tax threshold is approximately Kshs 126,720 (around US$1,690 at the average exchange rate for 2003), or four times the current per capita income of about US$404.
4 One cannot ascertain the level of progressivity simply by looking at the statutory tax schedule. As explained in this paper, the income tax reforms in Kenya introduced reductions in the nominal marginal rates as well as reductions and rationalization to the tax brackets, but concurrently taxbases were expanded to bring untaxed income sources within the tax net.
20
people buy more expensive food and may actually spend a higher percentage of their income on nourishment. A concession for only a very limited number of defined foodstuffs may be of less benefit to high-income taxpayers as both the percentage of income budgeted for basic foodstuffs and the actual amount spent may decline as income rises. Although any specific proposal aimed at addressing the equity and pro-poor question needs to be examined in the context of the entire tax system, reducing the number of individuals subjected to income taxation through measures supporting a high threshold for income tax and lower rates on certain basic foodstuffs should continue to merit serious consideration.
Table 6
Has Kenya’s income tax reforms been pro-poor? Multiple of tax threshold to per capita income
Year PIT threshold, USD Per capita income, USDMultiple of PIT threshold
to per capita income
1995 707.4 308 2.3 1996 956.2 303 3.2 1997 1114.3 337 3.3 1998 1192.1 363 3.3 1999 1239.3 324 3.8 2000 1259.8 311 4.0 2001 1465.6 331 4.4 2002 1612.2 360 4.5 2003 1667.4 404 4.1
Source: Authors’ computation. See footnote 3.
5 Implementation of tax reforms in Kenya: summary of the problems and successes
The process of tax reforms in Kenya, as can be discerned from the foregoing, was a gradual process rather than a ‘big bang’ approach. The gradual approach was probably adopted because Kenya’s political and economic environment was not conducive to the big bang, as was the case in some of the transition economies in Eastern Europe or the emerging post-conflict countries in Africa. Nevertheless, next we briefly discuss the successes and failures in the implementation of tax reforms in Kenya.
5.1 Government commitment to reforms
The commitment of the Kenyan government to tax reforms can largely be described as having been positive. Since the start of reforms, economic policy statements such as those issued through the budget speeches to Parliament every year outlined the fiscal policy options actually being implemented. It can be stated that the objectives of the tax reform were clearly understood and were seen as a vital part of a wider economic strategy to make the country less vulnerable to the external and internal shocks that could easily lead to macroeconomic imbalances.
21
5.2 Political opposition/support to reforms
Apart from the trade policy component, which advocated the rationalization and reduction of import tariffs as well as the liberalization of trade, there was very limited opposition to tax reforms in Kenya. One could even state that there was a broad consensus in the country on the necessity of reform. Even contentious taxes like VAT which had precipitated social unrest in some countries, encountered virtually no opposition. This may have been due to a disorganized consumers lobby constituency, but all in all tax policy measures received very little opposition, even at the political level. But as noted earlier, trade liberalization reforms were viewed with hostility by the domestic manufacturing subsector who felt threatened by the imports. At the political level, however, there was no organized opposition from the manufacturing sector. On the other hand, the trade policy supporting Kenya’s commitments to the COMESA and EAC Treaties has recently raised some concern both at industry and political levels, as these have greatly impacted on the agricultural sector. A good case in point is the question of opening up the sugar subsector to COMESA imports and the liberalization of the cereals subsector under the Free Trade Area arrangements that allow maize from Kenya’s neighbouring countries into the local market. In both instances, there has been strong political opposition that has caused the government to resort to the safeguard measures included in regional trading arrangements, such the COMESA Treaty.
5.3 Institutional constraints
One issue not covered in this study is the question of tax administration reforms. Instead, our focus has been more on tax policy reforms. But then again, one could also argue that tax administration is the same as tax policy. One of the key aspects of tax reform was the establishment of the Kenya Revenue Authority (KRA) as an independent tax administration organization with autonomy from the Treasury. The Ministry of Finance is responsible for setting tax policy while KRA ensures that policy with respect to revenue mobilization is implemented. KRA, established in 1994, has been operational since 1995. In terms of addressing the institutional constraints in reforming taxation, one cannot overlook tax administration. KRA was meant to address the institutional constraints that were believed to hinder implementation of the tax reforms. But given the fact that KRA became operational in 1995, the issue of sequencing should be raised because some reform measures such as VAT had already been initiated in the pre-KRA era. Hence, it may not be easy to conclude that there were institutional constraints which hindered the success of the tax reforms. Furthermore, revenue adequacy as measured by the tax revenue-to-GDP ratio has not been much of an issue. Therefore, in order to adequately examine the question of institutional constraints, one is forced to look beyond the issues of revenue adequacy and the tax structure.
Research shows that compliance to VAT and income tax is 55 per cent and 30 per cent, respectively (see Karingi et al. 2005). This implies that it should be possible to reduce the current taxpayers’ burden by raising the compliance rate. In other words, it is possible to reduce the VAT rate from its current level of 16 per cent without any government revenue shortfall by increasing compliance. The same applies to CIT: even if the rate is reduced from 30 per cent to 25, a revenue-neutral position can be achieved by raising income taxation compliance. Taxpayers face significant

22
compliance costs and these interfere with their willingness to pay. Thus, it is evident that low compliance is mainly an administrative issue related to KRA, and their costly administrative structure itself contributes to the problem. For instance, a taxpayer in Kenya can be audited three times (for VAT, income tax, excise tax) but yet still be dealing with KRA only. Furthermore, if liable to a levy, the taxpayer may also be audited by government ministries. The tax-by-tax organization of KRA needs to be revisited. Best international practices suggest that revenue administration be organized according to function, so that audits are conducted as a single operation, and not by the type of tax. For example, one auditing section should undertake tax audit in a firm for CIT, VAT, excise tax and any other taxes collected by the government.
There are other problems related to KRA performance, such as the failure to utilize the personal identification number (PIN) assigned to each taxpayer. It certainly does not help the taxpayer to have so many numbers and codes, even though taxes and other payments are made to the same government agency. This could be associated to the lack of computerization. Computerization would enable KRA to interact with taxpayers through an integrated computer interface, saving not only time but also increasing compliance, as the PIN facilitates follow-up. With computerization, it would also become easier to consolidate payment of all taxes and levies.
6 Recommendations for Kenya
6.1 Improving tax mobilization
As indicated in the introduction of this paper, revenue adequacy is not an issue of concern in Kenya, as maintaining a 22 per cent revenue-to-GDP ratio is the official policy. Consequently, the key issues concerned with the improvement of tax mobilization are related more to administration than policy. The appropriate recommendations in this respect have already been identified by the government and are outlined in a study entitled Economic Recovery Strategy for Wealth and Employment Creation (GoK 1993). Essentially, the key recommendation is to address the need to reform tax administration by broadening the taxbase in order to reduce taxation, particularly of the businesses and individuals currently carrying the burden of achieving the 22 per cent of GDP target. Critical to the reform of tax administration will be the consolidation of government revenue collection through KRA; optimal utilization of the PIN; and computerization of the KRA systems. Such tax administration improvements will enable the government to reduce the rates of most of the taxes, with the result that their distortionary effect of taxes will be minimized.
6.2 Distributional impacts of taxes
So far, very little work has been undertaken on the distributional impact of taxes in Kenya. Even in this paper the evidence on the progressivity of the tax system is more anecdotal than empirical. Therefore, a more thorough incidence analysis of the different taxes would be useful. The main challenge to this objective is the limitations imposed by data availability. An incidence analysis of taxes requires disaggregated data, also at the household level, if possible. Well structured database of the labour
23
market is also essential. Without such data, it is difficult to conduct a reasonable study of the distributional impacts of taxes. Two methodologies—microsimulation modelling augmented with general equilibrium models—are amenable to distributional impacts analysis and are recommended by this study
References
Government of Kenya (GoK) (1993). Economic Recovery Strategy for Wealth and Employment Creation. Nairobi: Ministry of Planning and National Development.
Government of Kenya (GoK) (2003). ‘Economic Recovery Strategy for Wealth and Employment Creation, 2003–2007’. Nairobi: Ministry of Planning and National Development.
Government of Kenya (GoK) (various years). ‘Budget Statements’. Nairobi: Ministry of Finance.
Karingi, S. N., M. S. Kimenyi, and N. S. Ndung’u (2001). ‘Beer Taxation in Kenya: an Assessment’. KIPPRA Discussion Paper Series DP/4/2001. Nairobi: KIPPRA.
Karingi, S. N., B. Wanjala, A. Kamau, E. Nyakang’o, A. Mwangi, M. Muhoro, and J. B. Nyamunga (2005). ‘Fiscal Architecture and Revenue Capacity in Kenya’. KIPPRA Discussion Paper Series DP/45/2005. Nairobi: KIPPRA.
Kiringai, J., N. S. Ndung’u, and S. N. Karingi (2002). ‘Tobacco Excise Tax in Kenya: an Appraisal’. KIPPRA Discussion Paper Series DP/21/2002. Nairobi: KIPPRA.
Njuguna, A. E., S. N. Karingi, and M. S Kimenyi (2003). ‘Alternative Methodologies for Measuring Kenya’s Potential Output and Output Gap’. KIPPRA Discussion Paper Series DP/28/2003. Nairobi: KIPPRA.
Tanzi, V., and H. H. Zee (2000). ‘Tax Policy for Emerging Markets: Developing Countries’. IMF Working Papers WP/00/35. Washington, DC: International Monetary Fund.