Embed Size (px)
Citation preview
““Stephen F. Austin State Stephen F. Austin State University’s attempts to University’s attempts to bring National Attention bring National Attention to the Needs of Children to the Needs of Children and Families Living in and Families Living in
Rural Areas”Rural Areas”NRCRES Conference
University of North Carolina-Chapel Hill
November 6, 2009
Dr. John E. Jacobson

Setting the ContextSetting the Context
In the poorest 800 rural school districts, there are almost 1,000,000 students—24% African American; 20% Hispanic; 10% Native American. More than 70% qualify for free and reduced meals, more than in Philadelphia or Detroit. Ninety percent of these students live south of the Mason Dixon Line from North Carolina to California.
Tompkins, Rachel, B. (February/March 2009), Rural Policy Matters, Volume 11, No. 2, page 1.
The highest priority rural education regions are the Southwest, Southeast, Mid-South Delta, and Appalachia.Poverty, fiscal incapacity, low levels of adult education, and low levels of student achievement run in the same mutually reinforcing circles in states in these regions, many of which are as fiscally challenged as their citizens and schools.

In low achieving states, policies are making things worse, not better.Research suggests that states serving higher percentages of students who are poor or have limited English language skills will have to invest additional resources to enable their students to reach the same level of achievement as other states. Research also demonstrates that poor and minority students derive substantial achievement benefits from attending smaller schools and districts. But the actual patterns we find in rural America are exactly the opposite. As expected, the states where the educational outcomes in rural schools require the most urgent attention are the states with the most impoverished, minority, and ELL rural students. They are also the states where schools receive the fewest resources and where students attend the largest schools and districts.
Many states have seen a dramatic change in the demographic makeup of their student population in the past decade.Nationally, the percent increase is about 55%, and states such as Texas, California, and North Carolina-each ranking near the top in terms of number and/or percent rural minority enrollment-show increases of more than 50%.
Rural schools are most racially and ethnically diverse in the Southeast and Southwest.Mississippi, South Carolina, Texas, Oklahoma, Louisiana, North Carolina, Georgia, Delaware, Florida, Alabama, and Virginia serve 80% of all rural minority students in the U.S. The most diverse rural student populations are concentrated in states where rural education is not likely to be a primary policy focus.
The poorer and more diverse the rural student population, the lower the rural NAEP scores.Twelve states have the lowest average scores on both the math and reading NAEP test for rural schools. They are located primarily in the Southwest, the Southeast, and Central Appalachia (Alabama, Arizona, Arkansas, Georgia, Hawaii, Louisiana, Mississippi, Nevada, New Mexico, Oklahoma, Tennessee, and West Virginia). These states also have high socioeconomic challenges and student diversity, showing a strong correlation between these factors and low rural NAEP scores.
As rural America grows increasingly diverse, the need for adequate resources and supportive policy environments to meet the needs of English Language Learner (ELL) students grows ever more important.Nearly one-half of all ELL students live in rural communities, and the rate of growth of this population is very high. But the growth in ELL student populations is rural areas is not spread uniformly across states, within states, or even within school districts. Regionally, the fastest growth (in terms of both actual growth and percentage growth) occurred in the southeastern U.S. Rural schools serving proportionally larger ELL student populations, on average, face higher concentrations of traditional barriers to educational achievement than do their counterparts serving fewer ELL students. In many states, higher percentages of ELL students are associated with higher levels of poverty among all students.

Texas StatisticsTexas Statistics
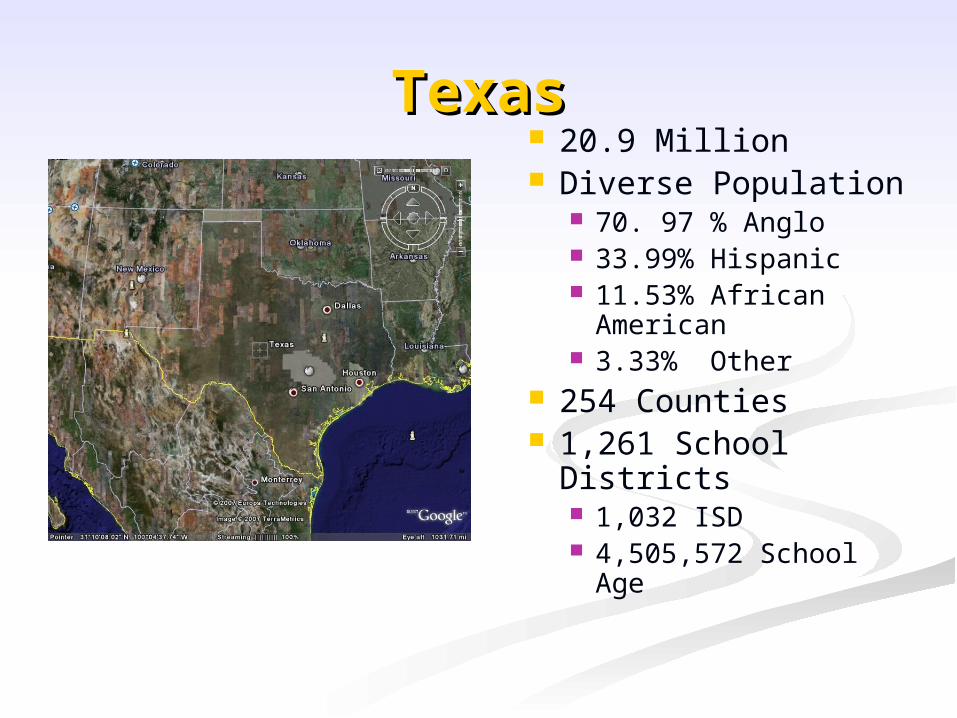
TexasTexas 20.9 Million Diverse Population
70. 97 % Anglo 33.99% Hispanic 11.53% African
American 3.33% Other
254 Counties 1,261 School
Districts 1,032 ISD 4,505,572 School
Age
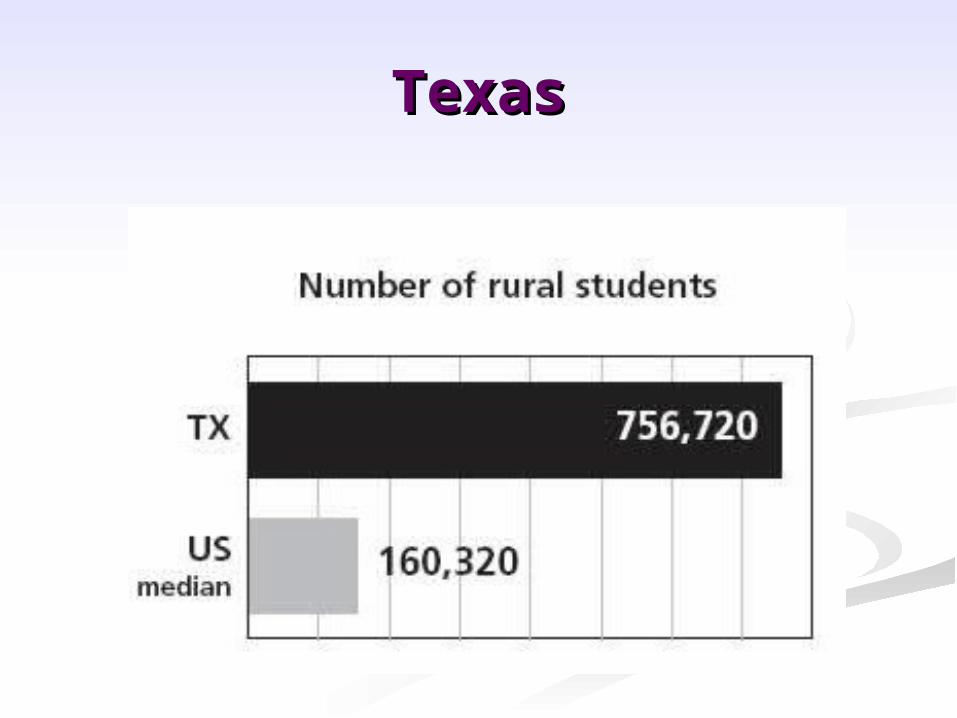
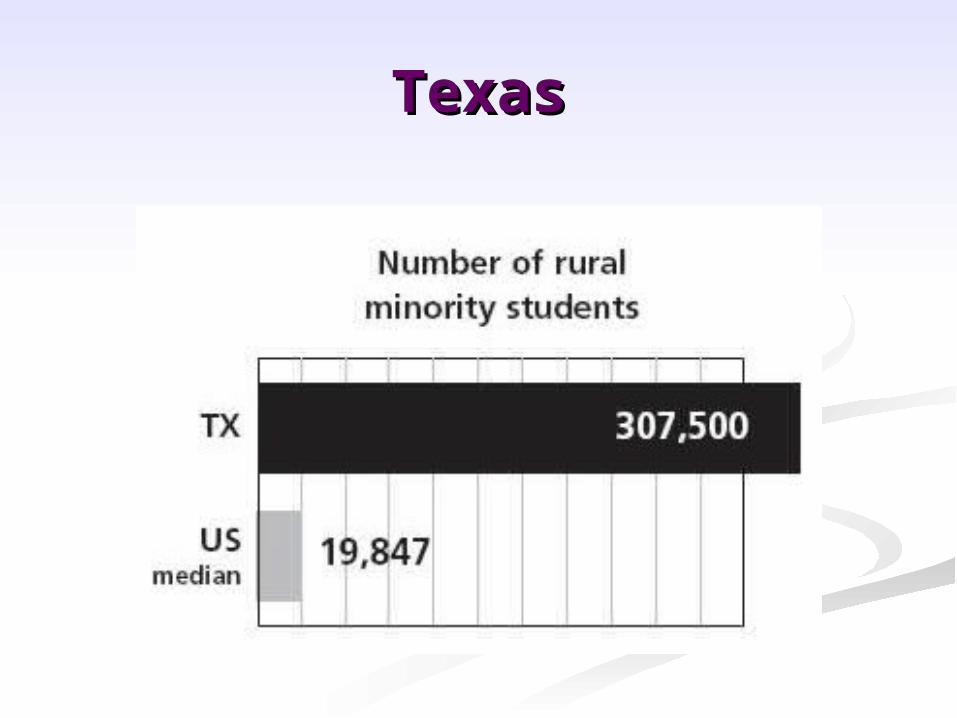
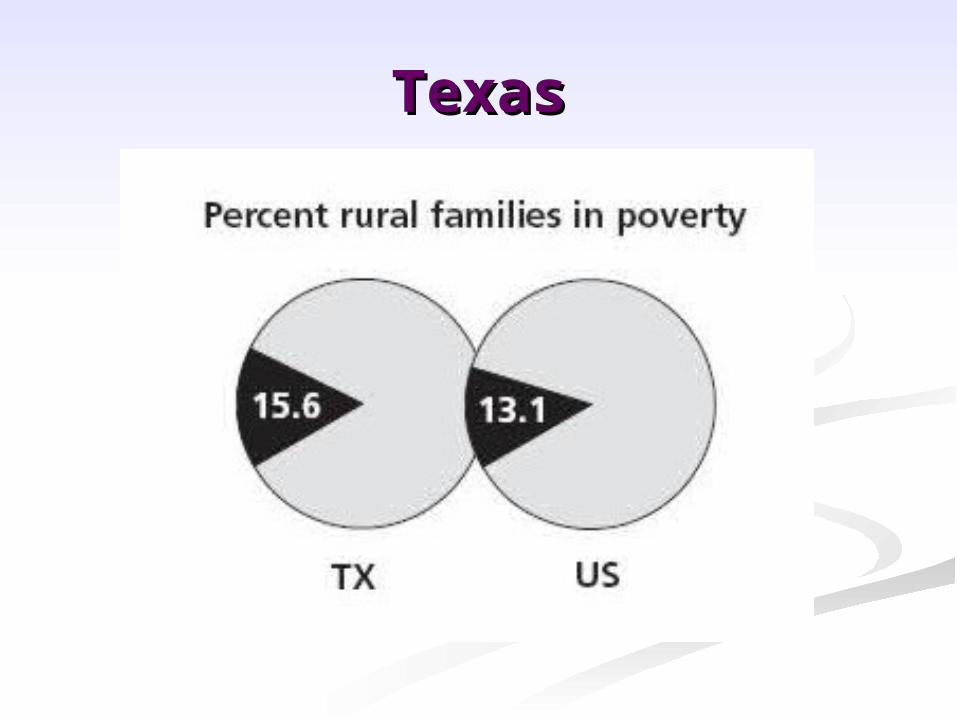
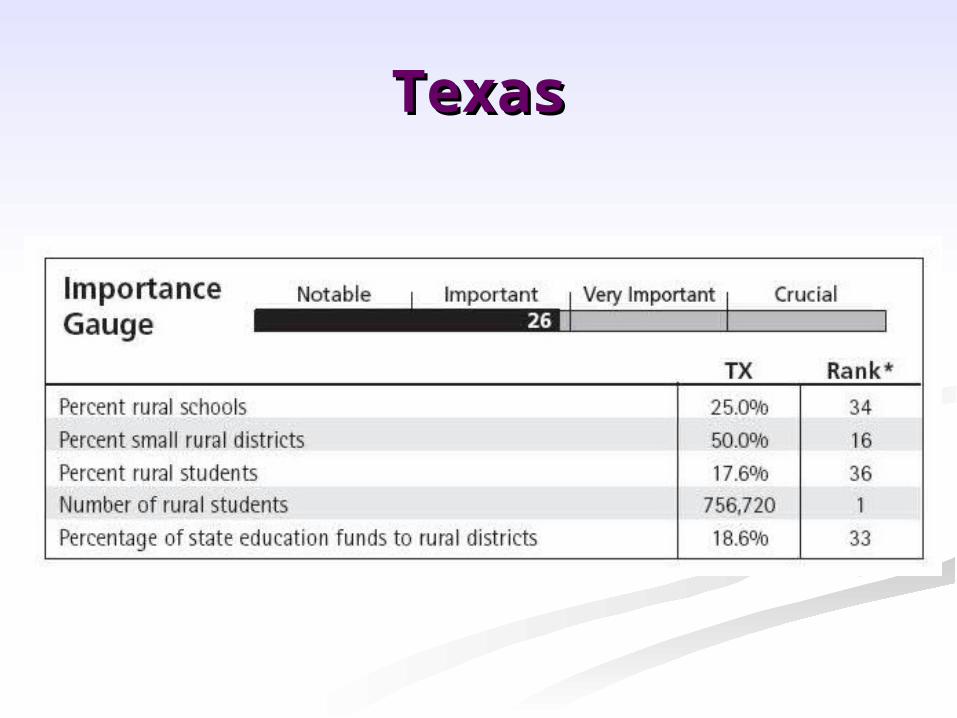
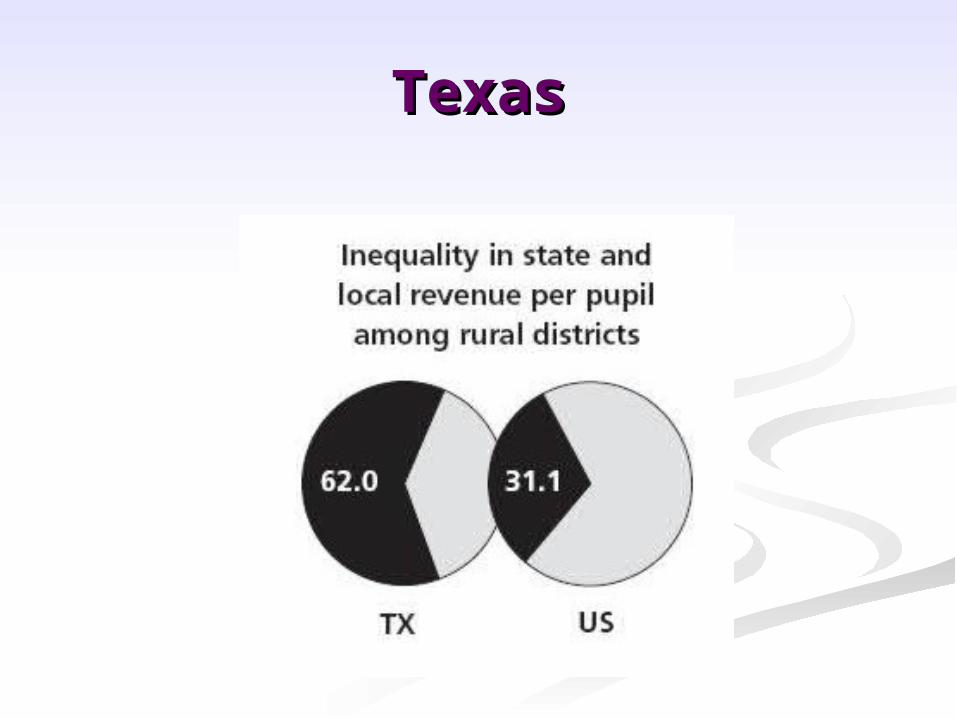
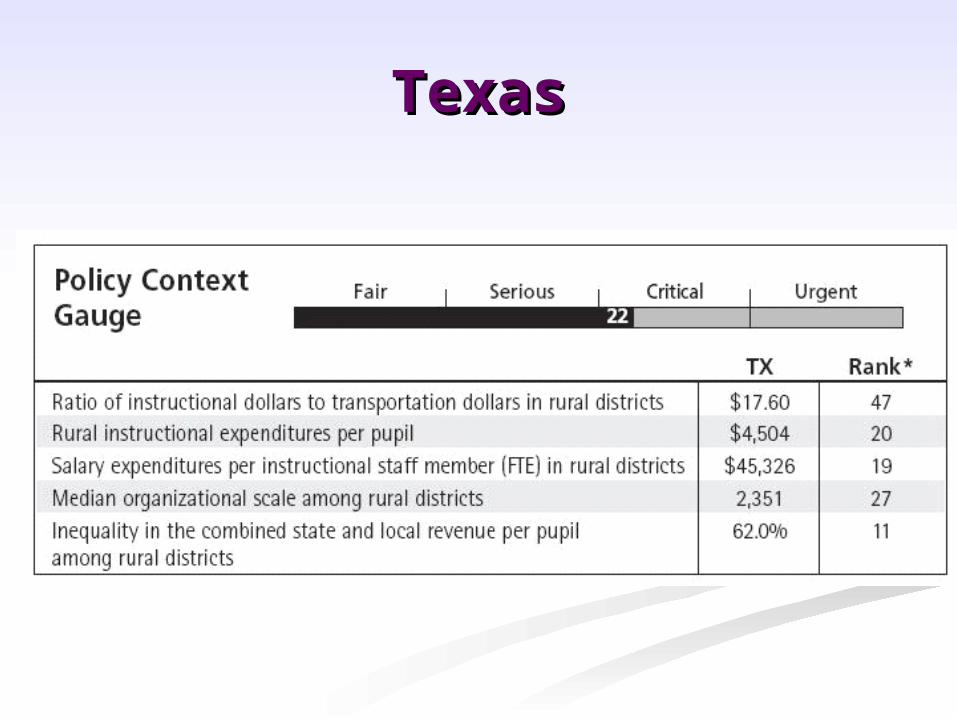
TEXAS – More children attend rural schools in Texas than in any other state (more than three quarters of a million), yet its rural enrollment comprises less than 18% of the total student population. Socioeconomic challenges are critical concerns for rural education in Texas, as are large numbers of English Language Learners and the nation’s largest minority enrollment. Transportation costs are proportionally low compared to instructional spending, and school and district size is slightly below average, but revenue distribution is relatively inequitable and instructional salaries are low.
TexasTexas
TexasTexas
TexasTexas
TexasTexas
TexasTexas
TexasTexas
TexasTexas
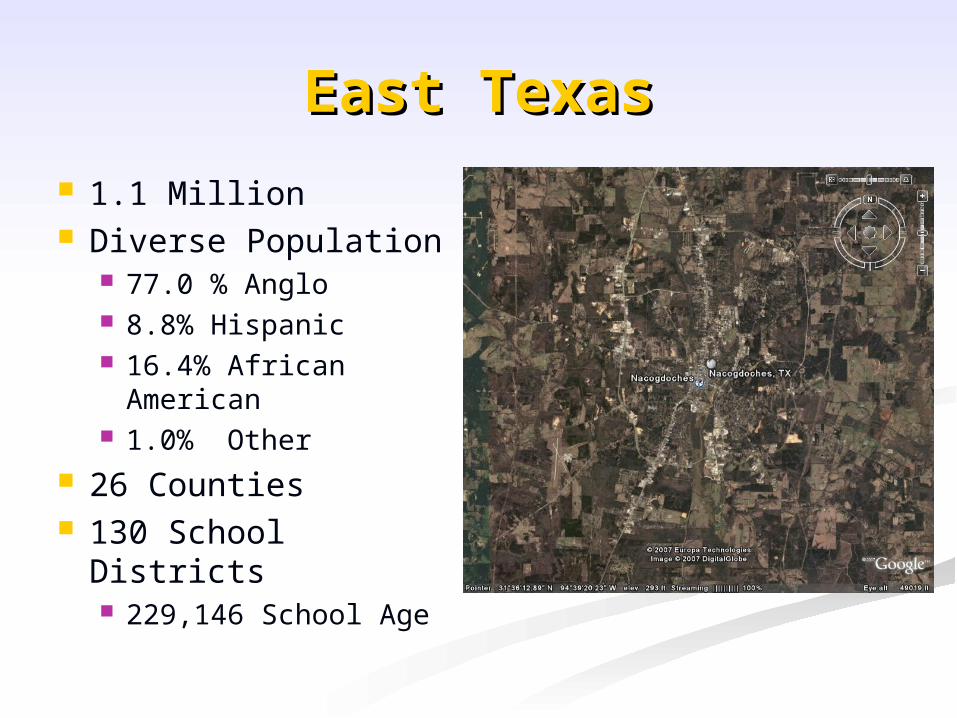
East TexasEast Texas
1.1 Million Diverse Population
77.0 % Anglo 8.8% Hispanic 16.4% African
American 1.0% Other
26 Counties 130 School Districts
229,146 School Age
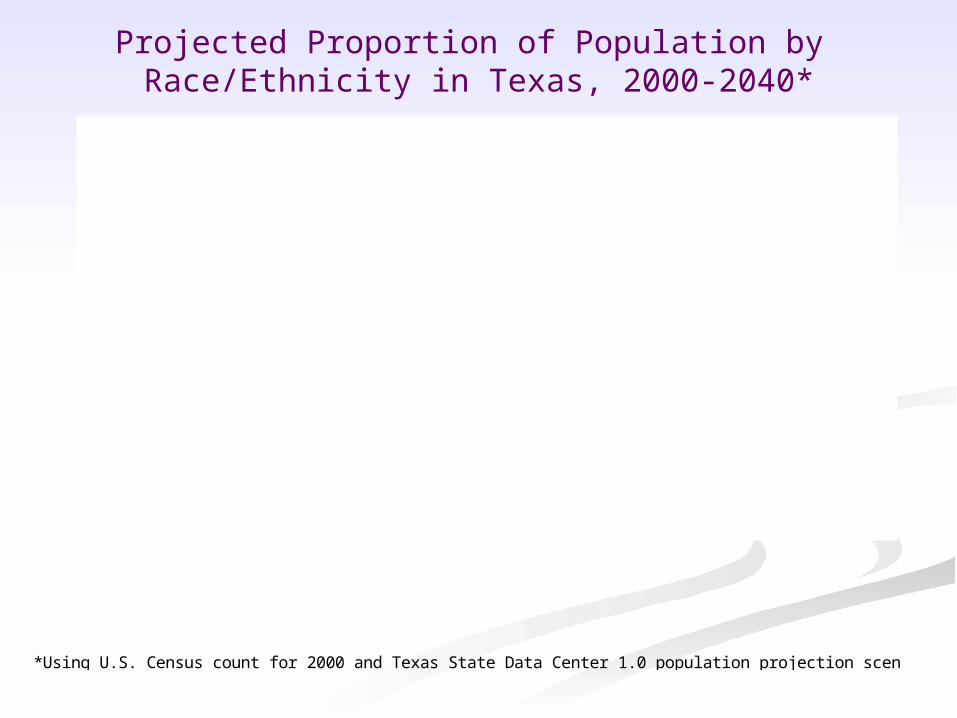
Projected Proportion of Population by Race/Ethnicity in Texas, 2000-2040*
*Using U.S. Census count for 2000 and Texas State Data Center 1.0 population projection scenario for 2010-2040.
53.1
45.1
37.3
30.3
23.9
11.6 11.1 10.39.2
8.0
32.0
39.3
46.5
53.2
59.2
3.34.5
5.97.3
8.9
2000 2010 2020 2030 20400.0
10.0
20.0
30.0
40.0
50.0
60.0
70.0Percent
Anglo Black Hispanic Other
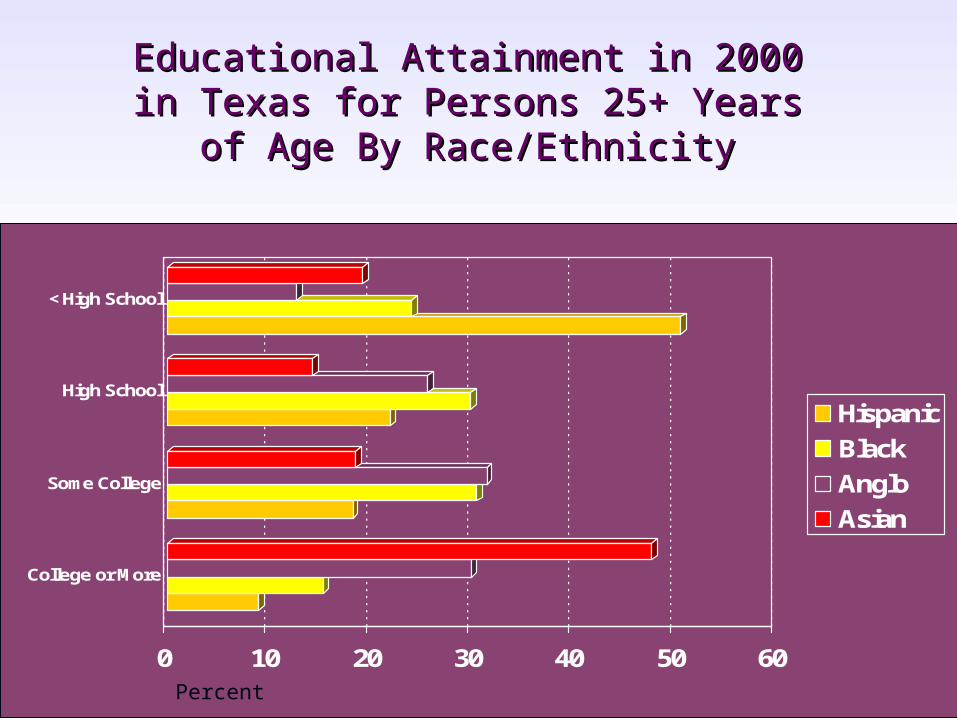
Educational Attainment in 2000 Educational Attainment in 2000 in Texas for Persons 25+ Years in Texas for Persons 25+ Years
of Age By Race/Ethnicity of Age By Race/Ethnicity
0 10 20 30 40 50 60
< High School
High School
Some College
College or More
Hispanic
Black
Anglo
Asian
Percent
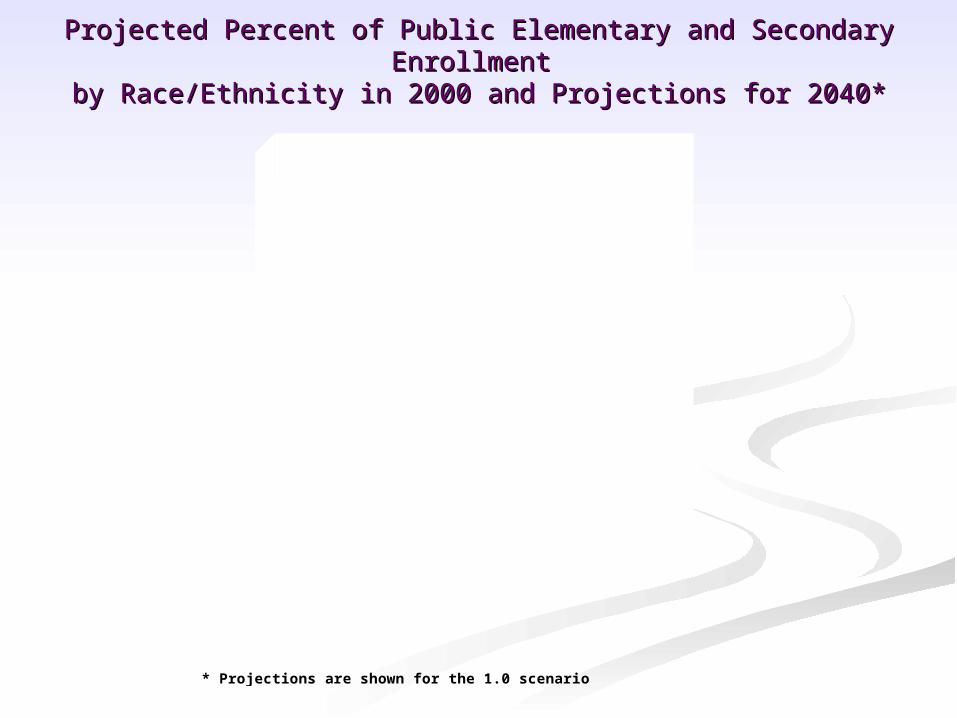
Projected Percent of Public Elementary and Secondary Enrollment Projected Percent of Public Elementary and Secondary Enrollment by Race/Ethnicity in 2000 and Projections for 2040*by Race/Ethnicity in 2000 and Projections for 2040*
* Projections are shown for the 1.0 scenario
43.2
19.9
14.4
8.3
39.5
66.3
2.95.5
2000 2040
Projection Year
0.0
10.0
20.0
30.0
40.0
50.0
60.0
70.0
Percent
Anglo Black Hispanic Other

186.8
119.9
48.5
183.0
188.1
64.7
101.9
69.9
Bilingual/ESL
Economically Disadvantaged
Gifted and Talented
Immigrants
Limited English Proficiency (LEP)
Special Education
Title I
Career and Technology Education
0.0 50.0 100.0 150.0 200.0 250.0
Percent Change in Enrollment in Selected Percent Change in Enrollment in Selected Elementary and Secondary School Programs Elementary and Secondary School Programs
in Texas, 2000 to 2040* in Texas, 2000 to 2040*
Percent Change
*Projections are for the 1.0 Scenario

The SFA StoryThe SFA Story
United States’ focus has been mainly on Urban Issues
Most professional organizations have focused on Urban Literacy i.e. IRA established an Urban Literacy
Commission and a Standing Committee on Diversity
Only recently did the U.S. Department of Education establish a Center for Rural Education
The U.S. Department of Education funds only one major grant to research rural education issues.
Connected with The National Center for Rural Education Support

Joined with them in piloting early reading intervention program and conducting experimental research
Starting visiting with rural school districts surrounding the university about their needs
Visited with Professional organizations, senators and congressman about issues
Started writing/receiving grants (gear up, transition to teaching, FIPSE, ELL) all targeted in preparing and in-servicing teachers in rural areas
Decided we needed to host a National Summit on Rural Education in an attempt to raise national attention to rural education issues

2008 National Summit on 2008 National Summit on Rural EducationRural Education
www.PerkinsCollgeSummit.net
March 28, 2008March 28, 2008Summit GoalsSummit Goals
Brought broad U.S. attention to rural education
Defined the unique needs of children and families living in rural areas
Highlighted rural successes that may be applied to urban/suburban settings
Examined local, state and national policies related to rural education
Explored solutions to the challenges of education in rural settings
PresentersPresenters President George W. Bush, Comments on “The
Importance of Education in America” (video) Representative Louie Gohmert, Texas Congressman
from District One, “The Role of Congress in Rural Education”
Secretary Margaret Spellings, U.S. Department of Education, “Summit Vision: A National Rural Education Dialogue” (video)
Dr. Michele Chin from Senator John Cornyn, Texas, “Rural Education, Job Creation and Competitiveness”
Dr. Rachel Tompkins, President of The Rural School and Community Trust, “Why Rural Matters”
Senator Kay Bailey Hutchison, Texas, “Meeting the Education Needs of Children and Families in Rural America” (video)

Mary Kusler, Director of Government Relations, American Association of School Administrators
Larry Bradley, President, National Association of Secondary School Principals
Seth Adams, President of the National Rural Education Association
Susan Luinstra, Teacher of the Year, National Rural Education Association
Frank Cantu, Director, Division of Border Health, U.S. Department of Health and Human Services
Dr. Christine Ormsbee, American Association of Colleges for Teacher Education
Dr. Lynn Vernon-Feagans, Co-Director of The National Research Center on Rural Education Support, University of North Carolina at Chapel Hill
Dr. Robert Hall, Chair of Education Leadership, Western Illinois University
Dr. John E. Jacobson, Dean of the James I. Perkins College of Education, Stephen F. Austin State University
What are the Rural What are the Rural Factors?Factors?
Location Student Diversity Poverty Immigration Health and Human Services
Access to Medical Access to Community Services Broadband Internet
Access to Specialized and AP Courses in High School NCLB
Highly Qualified Teachers School Choice Title I resources
High Educator Attrition Rates that mirror Urban rates
Blog TopicsBlog Topics Educational policy needs for rural school districts. The role of professional organizations and the
need to sponsor research in the area of rural education.
Rural school district partnerships with higher education and other agencies.
Consolidation of rural school districts. Changing demographics in rural school districts. Parental and community involvement in rural
school districts. Recruiting and retaining highly qualified and
quality teachers to rural school districts. How to offer a full curriculum in an efficient
manner Financial issues confronting rural school districts
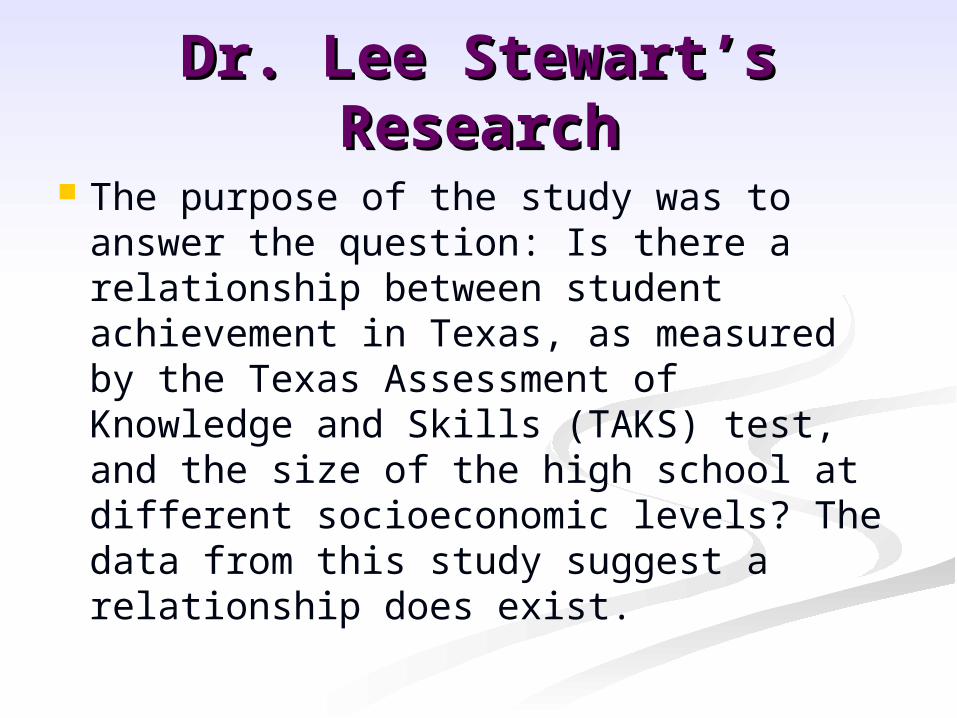
Dr. Lee Stewart’s Dr. Lee Stewart’s ResearchResearch
The purpose of the study was to answer the question: Is there a relationship between student achievement in Texas, as measured by the Texas Assessment of Knowledge and Skills (TAKS) test, and the size of the high school at different socioeconomic levels? The data from this study suggest a relationship does exist.
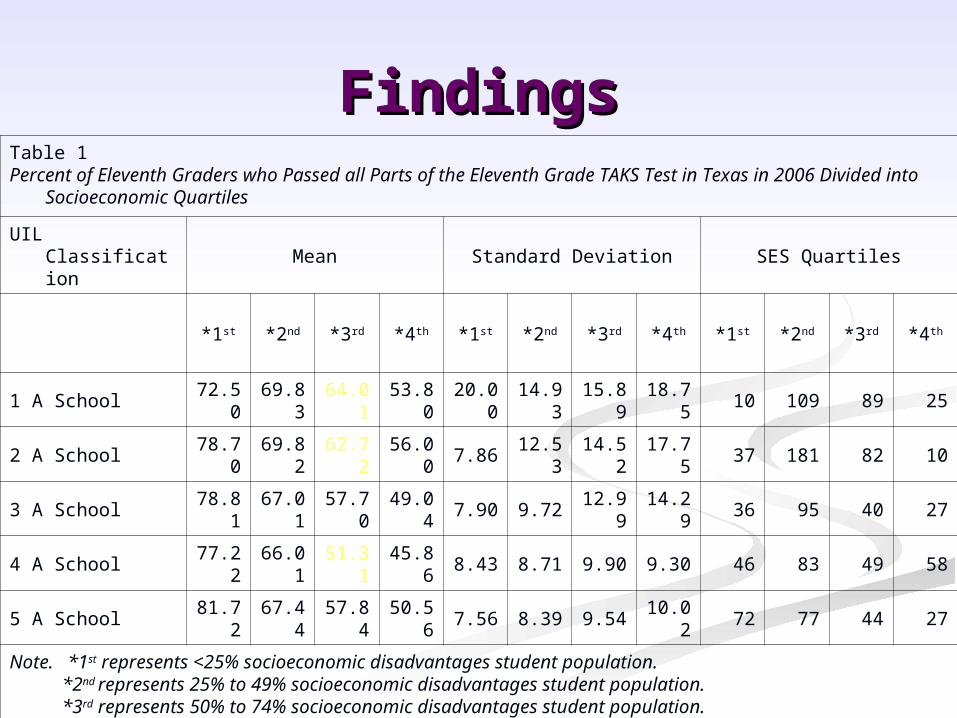
FindingsFindingsTable 1Percent of Eleventh Graders who Passed all Parts of the Eleventh Grade TAKS Test in Texas in 2006 Divided into
Socioeconomic Quartiles
UIL Classification Mean Standard Deviation SES Quartiles
*1st *2nd *3rd *4th *1st *2nd *3rd *4th *1st *2nd *3rd *4th
1 A School 72.50 69.83 64.01 53.80 20.00 14.93 15.89 18.75 10 109 89 25
2 A School 78.70 69.82 62.72 56.00 7.86 12.53 14.52 17.75 37 181 82 10
3 A School 78.81 67.01 57.70 49.04 7.90 9.72 12.99 14.29 36 95 40 27
4 A School 77.22 66.01 51.31 45.86 8.43 8.71 9.90 9.30 46 83 49 58
5 A School 81.72 67.44 57.84 50.56 7.56 8.39 9.54 10.02 72 77 44 27
Note. *1st represents <25% socioeconomic disadvantages student population. *2nd represents 25% to 49% socioeconomic disadvantages student population. *3rd represents 50% to 74% socioeconomic disadvantages student population. *4th represents 75% to 100% socioeconomic disadvantages student population.
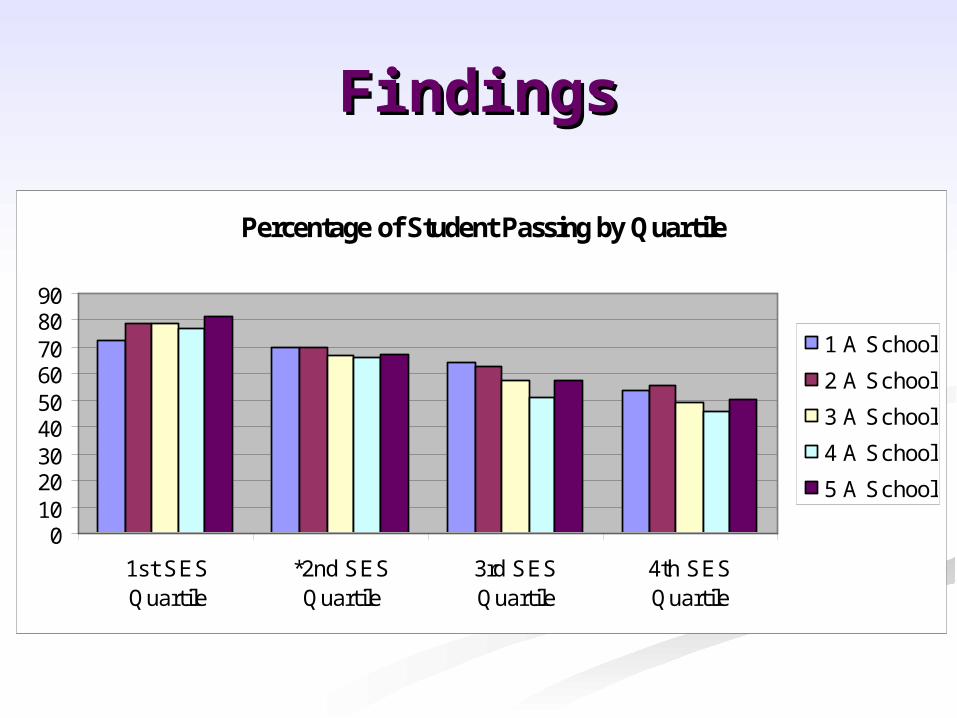
FindingsFindings
Percentage of Student Passing by Quartile
0102030405060708090
1st SESQuartile
*2nd SESQuartile
3rd SESQuartile
4th SESQuartile
1 A School
2 A School
3 A School
4 A School
5 A School
FindingsFindings
Data reveals that in all but the 1st SES quartile, smaller schools experience higher percentages of students passing all four parts of the eleventh grade TAKS test in Texas than the larger schools.
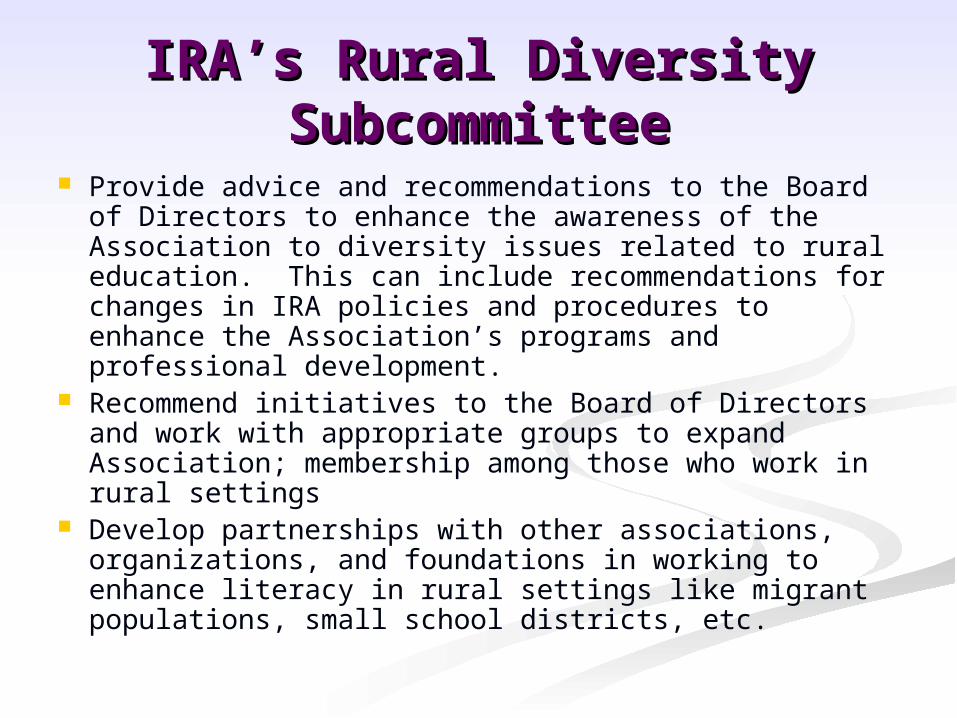
IRA’s Rural Diversity IRA’s Rural Diversity SubcommitteeSubcommittee
Provide advice and recommendations to the Board of Directors to enhance the awareness of the Association to diversity issues related to rural education. This can include recommendations for changes in IRA policies and procedures to enhance the Association’s programs and professional development.
Recommend initiatives to the Board of Directors and work with appropriate groups to expand Association; membership among those who work in rural settings
Develop partnerships with other associations, organizations, and foundations in working to enhance literacy in rural settings like migrant populations, small school districts, etc.

EpilogueEpilogue
Rural Community Rural Community AcademyAcademy
Rural Rural MustMust
Matter!Matter!