Embed Size (px)
Citation preview
The Emerald Research Register for this journal is available at The current issue and full text archive of this journal is available at www.emeraldinsight.com/researchregister www.emeraldinsight.com/0263-2772.htm
Step-by-step process analysis f or hospital f acility management
An insight into the OPIK research project 164 Kunibert Lennerts, Jochen Abel and Uwe Pfmnder
University of Ka~lsruhe, Karlsruhe, Ge~many
Vishal Sharma Hole Sclzool of Coizstruction, University of Albe~ta, Edmonton, Canada
Abstract Purpose -- Healthcare systems are very costly and the inpatient treatment in hospitals is a major part of these costs. The question is, how can greater efficiency be effected without influencing the core busiiless of a Iiospital - the cure of patients. Through improving the process flow of facility management (FM) processes, savings within these processes and less disturbance of primary prccesses should be accomplishable. Design/methodologylapproach - In order to help introducing professional FM methods in hospitals the OPIK research project has designed standard processes for typical FM services. Processes have been field tested and evaluated in terms of interference with the core process as well as cost and quality factors have been determined. Findings - The research has shown that standard processes can be defined and the performance can be improved through resiructuring the process flow by having detailed knowledge of the process chancteristics. The analysis of data throiigh linear regression sllou~s a significant correlation between product costs and possible clearing units. These results encourage to look for reasonable methods of cost allocation. Research limitations/implications - In terms of statistical significance the good results can be up valued through increasing the arnount of data by applying the method in other hospitals. Future activities should concentrate on this room for improvement. Originalitylvalue - For the first time a reasonable basis for comparing FM processes in hospitals has been defined. Keywords Hospitals, Buildings, Resource efficiency
Paper type Research paper
Introduction The following introduction and the description of the research projects structure and methodology are comparable to a previous publication by Lennerts et al. (2003).
What makes a hospital a special facility? Firstly, it is a 24 hours a day, 7 days a week facility and furthermore, a mistake in a hospital can cost the life of a human being. These charactenstics represent unique operating conditions and a bottom-line that involves much greater stakes than the profit-only vision of most business ventures. Hospitals also must constantly update their equipment to meet
Facilities Vol. 23 No. 3!4. 2005
state-of-the-art standards and if possible to go beyond this service level and offer PP. 161-175 cutting-edge technologies at exorbitant prices. All these costs are reflected in the price 8Emmua~dCroupPub~ishingLimi1~ of health care in Germany where the increasing costs of health care reduce the net 0763-2772 DOI io.iio8102~~~77n5105~~39 income of citizens, since health insurance contributions are deducted from gross
income. Currently the rate of contribution is approximately 14 per cent (BMG, 2002) of Step-by-step - - gross income.
What ~ossibiiities does the field of facilitv mananement 0 offer to helr, in solvinn process analysis
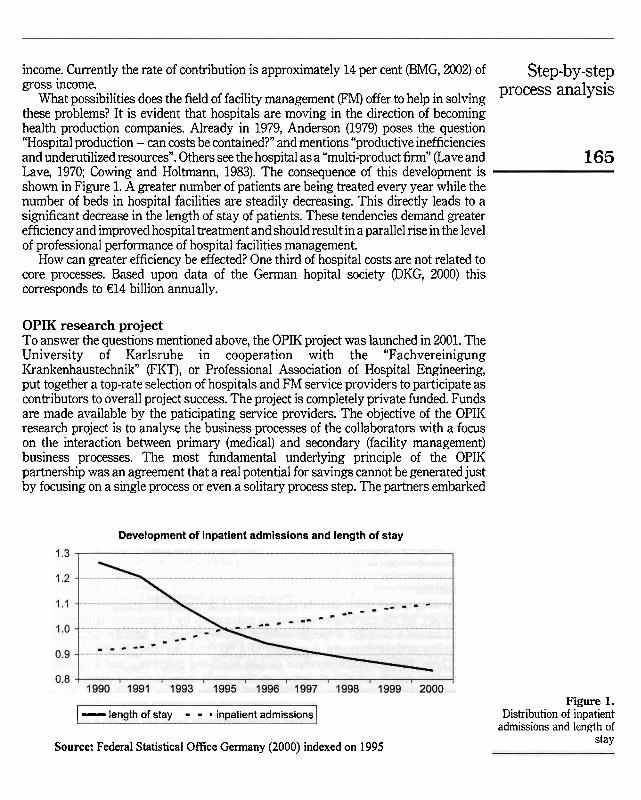
these problems? It is evident that hospital; are moving in the direction of becoming health production companies. ~ l r e a d ~ in 1979, ~ n d e r i o n (1979) poses the question "Hospital production - can costs be contained?" and mentions "productive inefficiencies and underutilized resources". Others see the hospital as a "multi-product firm" (Lave and 165 Lave, 1970; Cowing and Holtmann, 1983). The consequence of this development is shown in Figure 1. A greater number of patients are being treated every year while the number of beds in hospital facilities are steadily decreasing. This directly leads to a significant decrease in the length of stay of patients. These tendencies demand greater efficiency and improved hospital treatment and should result in a parallel rise in the level of professional performance of hospital facilities management.
How can greater efficiency be effected? One third of hospital cmts are not related to core processes. Based upon data of the German hopital society @KG, 2000) this corresponds to €14 billion annually.
OPIK research project To answer the questions mentioned above, the OPIK project was launched in 2001. The University of Karlsruhe in cooperation with the "Fachvereinigung Krankenhaustechnik" (FKT), or Professional Association of Hospital Engineering, put together a top-rate selection of hospitals and FM service providers to participate as contributors to overall project success. The project is completely private funded. Funds are made available by the paticipating service providers. The objective of the OPIK research project is to analyse the business processes of the collaborators with a focus on the interaction between primary (medical) and secondary (facility management) business processes. The most fundamental underlying principle of the OPIK partnership was an agreement that a real potential for savings cannot be generated just by focusing on a single process or even a solitary process step. The partners embarked
Development of inpatient admissions and length of stay
I - lenath of stav - - in~atient adrnissions 1
Source: Federal Statistical Office Germany (2000) indexed on 1995
Figure 1. Distribution of inpatient
admissions and length of stay
F on a strategy emphasising a more holistic approach and a comprehensive framework
23,314 for analysing business processes. This unique research project and its varied partners make the extensive analysis of processes in hospitals and the generation of a detailed process matrix possible. These, in turn, will enable far-reaching standards for the performance of FM services to be Set. Effective benchrnarlting, an accumulation of synergy effects, and organisational optimisation will be enabled with the help of this
166 precedent-setting standard. In principle, the research project will create a basis for the introduction of efficient, holistic FM structures and processes for German hospitals.
A conscious decision was made to involve service providers and hospitals in the CO-operative framework of the project in order to ensure a practical (real world) orientation and satisfy the needs of industry and the clinical complexes. Care was taken to select service providers from all the vanous areas dealing with the operation of clinics. In reference to the selection of the clinic partners, attention was paid to assure a broad and diversified cross-section of the clinical landscape in Gemany. Different carriers and various hospital sizes can be found in the sample group chosen by judgement sampling. Thereby, the results of the project have validity in all types of hospitals.
Methodology The analysis of the business processes was camed out in seven steps. Scientific research preliminary to the visualisation of processes required necessary information about general conditions, visualisation methods and specific process knowledge to be gathered. Knowledge sources included university libraries, databases as well as the intemet and data were collected and structured in the form of mind maps. The advantage that mind maps represented was the dynamic growth of knowledge generation and structural outlines that could be easily developed to support research activities.
The delineation of each process took place in expert round tables. The partners to each round table named their experts. This knowledge pool was used to create process models capable of reflecting real world situations and illurninating the features of emergent standard processes.
The standard processes that were developed were evaluated in case studies. In selected hospitals, the processes were tested in regard to their ability to adequately reflect and respond to actual conditions. The standard processes were evaluated and modified on site to optimise their applicability.
Subsequent expert round tables focused on the process information flow and other process factors. In order to ensure acrosc-the-board results, the interfaces and factors were defined by using standard questions on every process-step.
The information flow for each process-step was investigated to determine what kind of information was being transferred, and who delivered and received this information.
Processes were categorised according to cost and quality factors. The cost factors were identified by asking the experts, what is the cost generating factor and which value can be used as a reference. The quality factors were determined by asking the experts, which quantitative result reflec?s divergence from the expected quality?
The most labor-intensive worli package included extensive data collection in all participating hospitals. A matrix of all existing data points as result of the process definition was generated as preparation for finalising data entry forms. Data that were
rated with high impact for the individual process was selected in order to produce clear Step-by-step and manageable data collection forms. The forms were then implemented to document prOCeSS analySiS and accompany the execution of each individual process. There were two groups of processes. For example the "energy management" and "construction on existing building sites" processes were accompanied by a form to be filled out at the end of each day, detailing the tasks and process steps canied out. In contrast, processes like, "maintenance of medial equipment" and "waste management" were each assigned a 167 reprecentative form to be filled out while the service was being performed in order to provide measurement assessments.
The paper-based data collection forms were entered into a pre-programmed database. The database was also used for data preparation and the final analysis. Linear regression was used to analyse data in terms of correlation with cost drivers. Process flow data were collected and compared in order to identifi different practices between hospitals.
Results Detailing all the results is not within the scope of this Paper. The curnulative results of the project are instead the focus. Therefore, a comprehensive insight into two selected processes will follow.
Maintenance of medical equip~nent According to Williams (2000) "any activity which does not directly contribute to income should be considered as 'non core'". Although the medial equipment is being used in the core process, the maintenance of this equipment is not directly related to the cure of a patient and therefore a "non-core" process. A speciality of this process is the information flow between core and non-core process and the differing responsibilities for single parts of the overall process.
Even if the presented results are hospital specific, they are representative for similar circumstances in other FM processes.
Scope of tlz process The process "maintenance of medical equipment" serves the flawless provision of necessary medial equipment. The process is to be used for all technical equipment falling under the "Medizinproduktegesetz" (Medial Devices Act, MPG, 2003). The MPG regulates the trade with medical devices in order to ensure secunty, suitability and performance so that patient, User and others are not endangered (MF'G, 2003).
De$nition of t h customer Especially for FM processes an accurate check-up on who is and may be customer of the process is necessary. By definition the customer is an "organication or Person that receives a product" (EN ISO 9000, 2000). For the hospital the customer is the patient and the product is healthcare. Therefore, sometimes the patient is a direct customer of FM processes and sometimes only indirect. Especially when analysing processes very detailed, many sub-processes with different customers might be revealed.
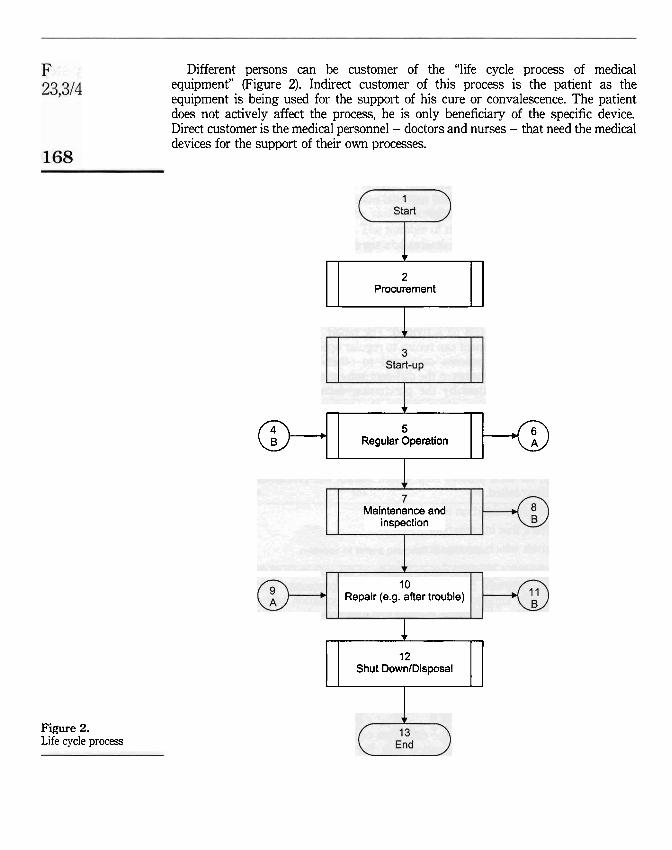
Different persons can be customer of the "life cycle process of medical equipment" (Figure 2). Indirect customer of this process is the patient as the equipment is being used for the support of his cure or convalescence. The patient does not actively affect the process, he is only beneficiary of the specific device. Direct customer is the medical personnel - doctors and nurses - that need the medical devices for the support of their own processes.
Figure 2. Life cycle process
Procurernent I Regular Operation @+qq-o Maintenance and
inspection
10 Repair (e.9. after trouble)
Shut DownlDisposal 1
Goals of tlze process Step-by-step Goal from the customcrs' mkwpoint. The patient as being indirect customer of the prOCeSS analySiS process needs the guaranty of the perfect support of the medial process through the necessary equipment. The medical personnel needs the fully functional medial equipment as needed to support the healing process.
Goals from tlze viewpoint of tlze organisation. By implementing this process it is ensured that the medial equipment is maintained as required by the medial devices 169 act. Therefore liability risks a n be minimised.
Goals from tlze workers viewpoi~zt The process is an assistance for the worker to easily maintain the equipment in the required manner.
Process f i w The life cycle process of medical devices has six distinct sub-processes. The overall process flow a n be Seen in Figure 2. The loops within the process are represented by on Page references, e.g. the return into regular operation after the repair process through shapes 11 and 4. After a primary phase of procurement and initial operation (Start Up), the main cycle begins. Out of the regular operation the medical device passes through the maintenance and inspection sub-process. Either out of the maintenance or the operation process the repair process a n be activated. The repair process is also the point of decision, whether the equipment a n retum to regular operation or not.
The speciality of this process compared to other FM processes is that the responsibilities are varying between the different sub-processes. The initial part of the process is often lead-managed by the purchasing department. The main cycle is segmented into the operation phase where the customer is responsible and the maintenance and repair phases where the medial department is responsible. Owing to the fact of altemating responsibilities, it was necessary to concentrate on the proper analysis of the information flow. As already mentioned the information flow was investigated in expert round tables. In order to create a homogeneous picture of the information flow, for each process step within the six sub-processes the sarne three questions have been asked.
(1) What kind of information is transmitted? (2) Who delivers this information? (3) Who receives which information?
This approach created a comprehensive picture of the information flow. Information being exchanged between the core and non-core processes then was visually emphasised. Thus the important points in terms of information exchange can be Seen at a glance. Using this visualisation method has also tumed out to be very helpful in finding optimisation potential within the process flow. Through modifying the process model by shifting process steps or combining multiple queries into one step the information flow a n be compacted without affecting the process quality or elongation of the process duration. This means that unnecessary cornmuniation is avoided and thereby interference with the core process is reduced.
Analysis The data entry form created for the collection of real life data on the process also reflects the importance of the information flow. For each process step the labour time
F was recorded separately for work-time, time for information exchange and travel-time.
23,314 In Table I, an overview of the analysed data is given. The differentiation shows whether the process step is more characterised by its
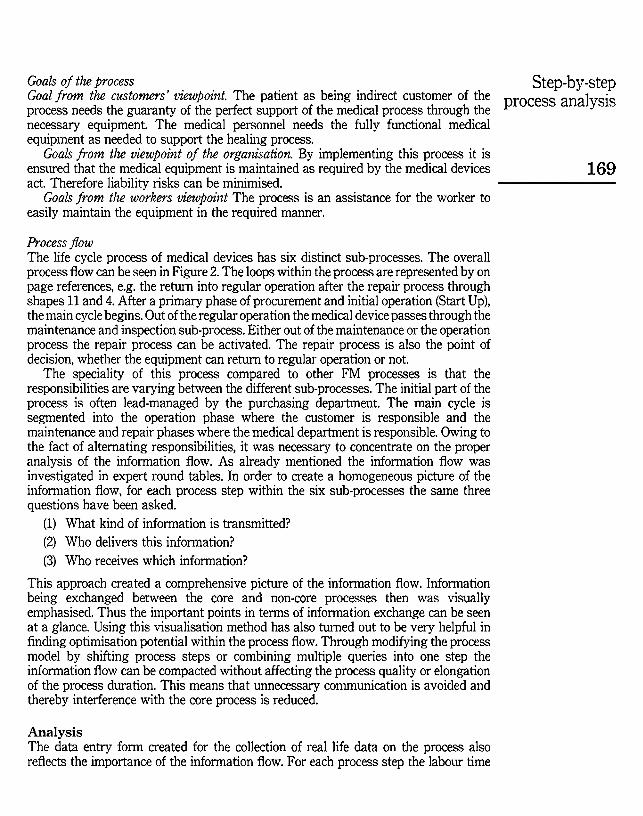
information-, work- or travel-time. Time for information exchange is more often spent on the process-steps "damage examination" and "repair". The accumulation of
170 information flow activities must be Seen as very critical during the repair process-step. The data showed that over 10 per Cent of all process cycles caused information exchange activities during repair. Information exchange during the repair itself means an uncontrolled interruption of the repair process and a disturbance of the core process. Therefore these activities should be shifted towards "damage examination", "cause analysis" or "restarting operation". The number of times each single process step has been activated in the sub-process "repair" can be Seen in Figure 3.
This method has turned out to be very helpful in comparing the performance in different hospitals and directly give suggestions to irnprove the process flow.
Besides the intensive analysis of the process flow and information exchange the determining factors characterising the process were defined. Most interesting is the definition of a correct basis to compare different hospitals.
Total labour time in Nurnber of Average duration minutes activations in minutes
Damage exarnination 1343 246 5,5 Report generation 516 115 4,5 Cause analysis 142 29 4,9 Cause triage 25 6 4 2
Table I. Cause elimination 136 15 9.1 Process characteristics Repair 2422 212 11,4 regarding labour time Restarting operation 454 90 5,o
number of times process is activated
Figure 3. Distribution of process activities
1
13 work ...... . . . . . . ... .. ......... . ...... . . .. . . .. .... .... .. .. . . . . .. . . . . . . . . . . . . .. . . ..... . .. . . . . . . ... . ....... . . .. . .. . . .. . . .. .. ............. n .. . ... Ci information
travel-time I
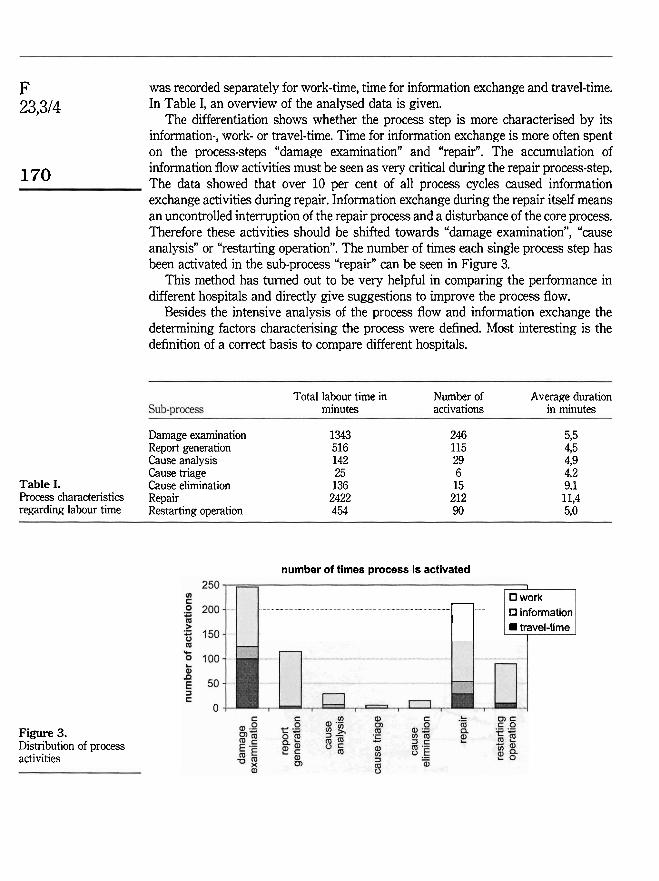
In the Figures 4-7, the maintenance costs for medial equipment is evaluated according Step-by-step to different comparison values. The maintenance costs have been anonymised by using analySiS arbitrary units due to data protection reasons. The values used for comparison are the number of operating rooms (ORs), surface area, the replacement value and the nurnber of beds. In contrast to the other analysed processes the costs do not correlate to the surface area. The strongest correlation can be found between the maintenance costs and the number of beds (Figure 7). 171
Maiizte~uz~zce of tech~zical equipment The life cycle process and process flow for the maintenance of technical equipment is very similar to the maintenance of medial equipment. Even though technial
number of OR's
surface area [mrj
replacement value (arbitrary u n k )
Figure 4. Maintenance costs to
number of ORs
Figure 5. Maintenance costs to
surface area
Figure 6. Maintenance cost to
replacement value
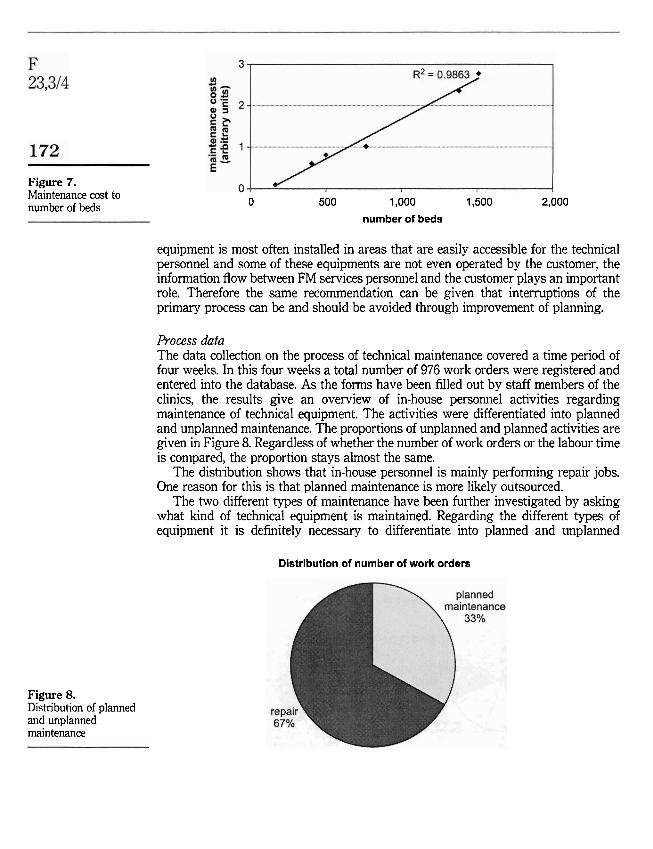
Figure 7. Maintenance cost to number of beds
Figure 8. Distribution of planned and unplanned maintenance
0 500 1,000 1,500 2,000
number of beds
equipment is most often installed in areas that are easily accessible for the technical personnel and some of these equipments are not even operated by the customer, the information flow between FM services personnel and the customer plays an important role. Therefore the Same recornmendation can be given that interruptions of the primary process can be and should be avoided through improvement of planning.
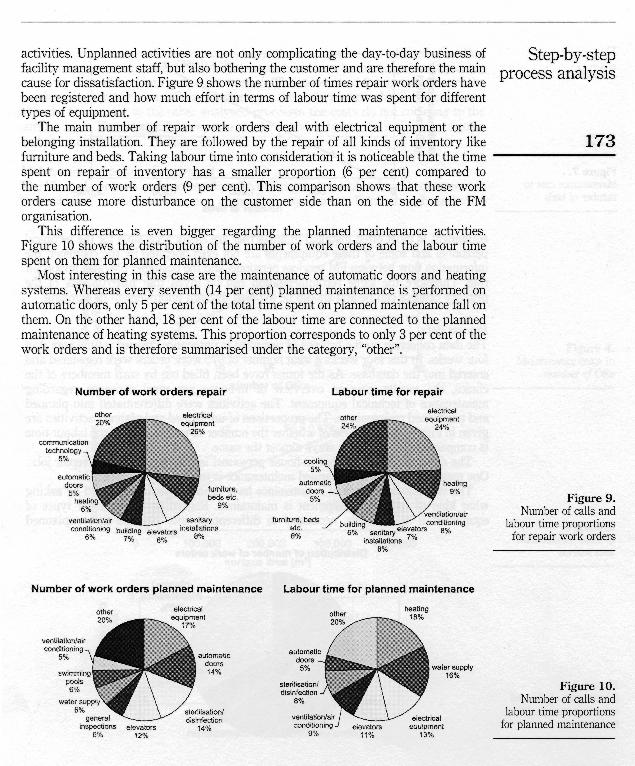
Process dafa The data collection on the process of technical maintenance covered a time period of four weeks. In this four weeks a total number of 976 work orders were registered and entered into the database. As the forms have been filled out by staff members of the clinics, the results give an overview of in-house personnel activities regarding maintenance of technical equipment. The activities were differentiated into planned and unplanned maintenance. The proportions of unplanned and planned activities are given in Figure 8. Regardless of whether the number of work orders or the labour time is compared, the proportion stays almost the Same.
The distribution shows that in-house personnel is mainly performing repair jobs. One reason for this is that planned maintenance is more likely outsourced.
The two different Spes of maintenance have been further investigated by asking what kind of technical equipment is maintained. Regarding the different type of equipment it is definitely necessary to differentiate into planned and unplanned
Distribution of number of work orders
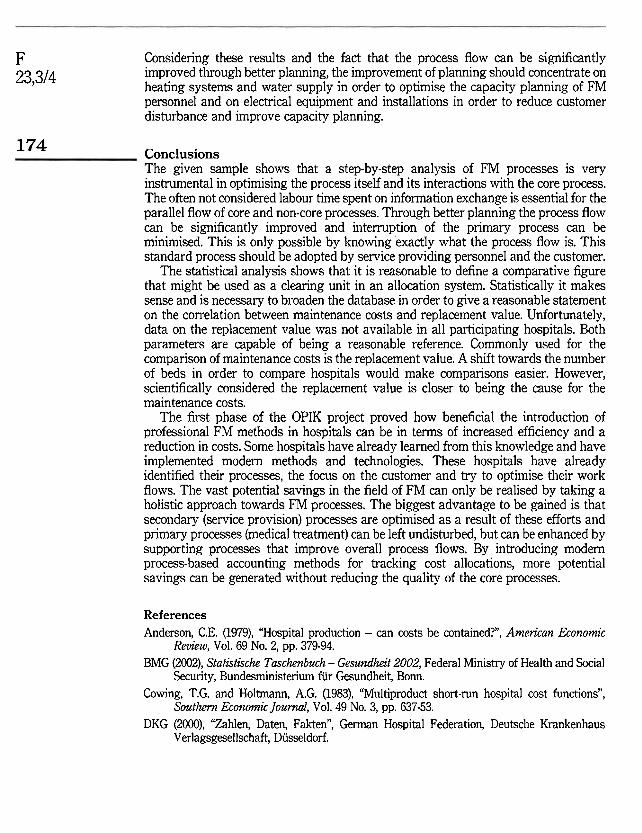
activities. Unplanned activities are not only complicating the day-to-day business of Step-by-step facility management staff, but also bothenng the customer and are therefore the main prOCeSS analySiS cause for dissatisfadion. Figure 9 shows the number of times repair work orders have been registered and how much effort in terms of labour time was spent for different types of equipment.
The main number of repair work orders deal with electrical equipment or the belonging installation. They are followed by the repair of all kinds of inventory like 173 furniture and beds. Taking labour time into consideration it is noticeable that the time spent on repair of inventory has a smaller proportion (6 per cent) compared to the number of work orders (9 per cent). This comparison shows that these work orders cause more disturbance on the customer side than on the side of the FM organisation.
This difference is even bigger regarding the planned maintenance activities. Figure 10 shows the distribution of the number of work orders and the labour time spent on them for planned maintenance.
Most interesting in this case are the maintenance of automatic doors and heating systems. Whereas every seventh (14 per cent) planned maintenance is performed on automatic doors, only 5 per cent of the total time spent on planned maintenance fall on them. On the other hand, 18 per cent of the labour time are connected to the planned maintenance of heating systems. This proportion corresponds to only 3 per cent of the work orders and is therefore sumrnarised under the category, "other".
Number of work orders repair Labour time for repair
aher electrical ebctncal
Figure 9. Number of calls and
labour time proportions for repair work orders
Number of work orders planned maintenance Labour time for planned rnaintenance
Figure 10. Number of calls and
labour time proportions for planned maintenance
F Considering these results and the fact that the process flow can be significantly
23,314 improved through better planning, the improvement of planning should concentrate on heating Systems and water supply in order to optimise the capacity planning of FM personnel and on electrical equipment and installations in order to reduce customer disturbance and improve capacity planning.
174 Conclusions The given sample shows that a step-by-step analysis of FM processes is very instrumental in optimising the process itself and its interactions with the core process. The often not considered labour time spent on information exchange is essential for the parallel flow of core and non-core processes. Through better planning the process flow can be significantly improved and intenuption of the primary process can be minimised. This is only possible by knowing exactly what the process flow is. This standard process should be adopted by service providing personnel and the customer.
The statistical analysis shows that it is reasonable to define a comparative figure that might be used as a clearing unit in an allocation system. Statistically it malm sense and is necessary to broaden the database in order to give a reasonable Statement on the correlation between maintenance costs and replacement value. Unfortunately, data on the replacement value was not available in all participating hospitals. Both parameters are capable of being a reasonable reference. Commonly used for the comparison of maintenance costs is the replacement value. A shift towards the number of beds in order to compare hospitals would make comparisons easier. However, scientifically considered the replacement value is closer to being the cause for the maintenance costs.
The first phase of the OPIK project proved how beneficial the introduction of professional FM methods in hospitals can be in terms of increased efficiency and a reduction in costs. Some hospitals have already leamed from this knowledge and have implemented modern methods and technologies. These hospitals have already identified their processes, the focus on the customer and try to optimise their worli flows. The vast potential savings in the field of FM can only be realised by taking a holistic approach towards FM processes. The biggest advantage to be gained is that secondary (service provision) processes are optimised as a result of these efforts and primary processes (medial treatment) can be left undisturbed, but can be enhanced by supporting processes that improve overall process flows. By introducing modern process-based accounting methods for tracking cost allocations, more potential savings can be generated without reducing the quality of the core processes.
References Anderson, C.E. (1979), "Hospital production - can costs be contained?", American Economic
Review, Vol. 69 No. 2, pp. 379-94. BMG (2002), Statistische Tmchnbuch - Gesundheit 2002, Federal Ministry of Health and Cocial
Security, Bundesministerium für Gesundheit, Bonn. Cowing, T.G. and Holtmann, A.G. (1983), '?Vlultiproduct short-run hospital cost functions",
Southwn Ecmtomic Journal, Vol. 49 No. 3, pp. 637-53. DKG (2000), "Zahlen, Daten, Fakten", German Hospital Federation, Deutsche Krankenhaus
Verlagsgesellschaft, Düsseldorf.

EN ISO 9000 (2000), "Quality management Systems - fundamentals and vocabulary", European Comrnittee for Standardization, Brussels.
Step-by-step
Lave, J.R. and Lave, L.B. (1970), "Hospital cost functions", A~nerican Economic Retiew, Vol. 60 process analysis
No. 3, pp. 379-95. Lennerts, K., Abel, J., Pkünder, U. and Sharma, V. (2003), "Reducing health-care costs through
optimised facility management-related processes", J o u d o f Fadties Management, Vol. 2 No. 2, pp. 192-206. 175
MPG (2003), "Gesetz über Medizinprodukte", Federal Law on Biomedical Equipment, BGBL 1994, 1963, Bundesanzeiger Verlag, Köln.
Williams, B. (2000). "Facilities economics", Building Economics Bureau, Kent.