Embed Size (px)
Citation preview
1/28/2016
1
DOE OFFICE OF INDIAN ENERGY
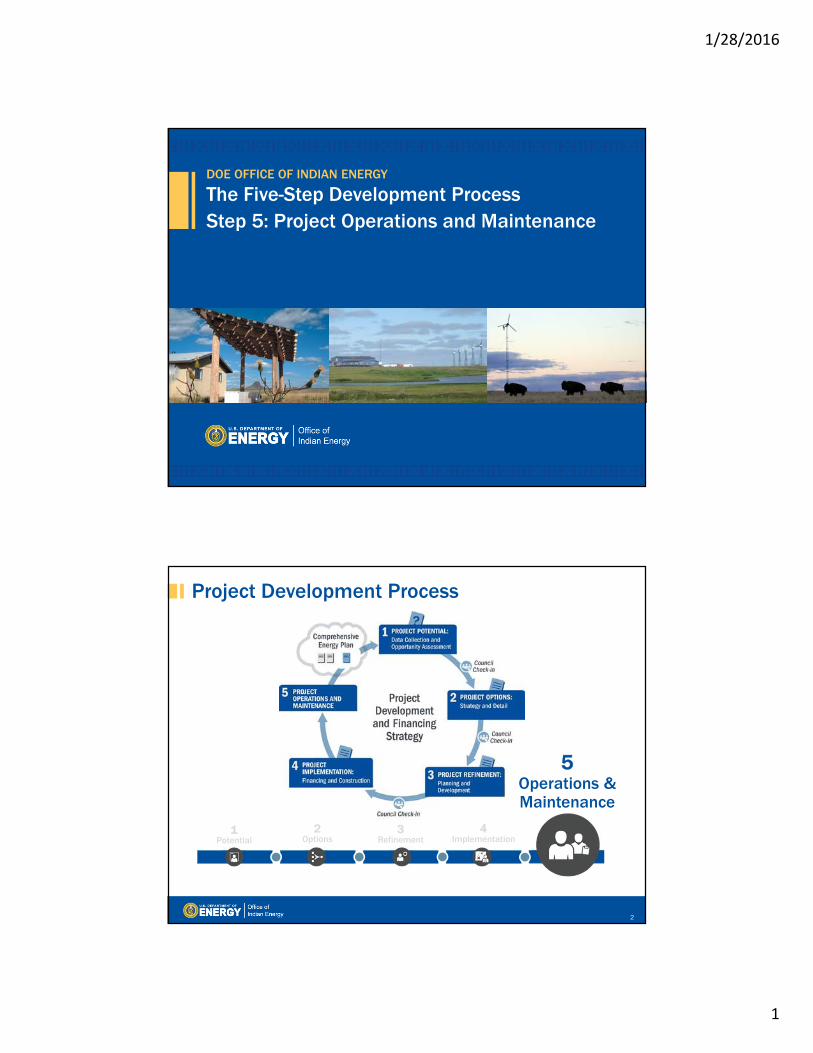
The Five-Step Development Process Step 5: Project Operations and Maintenance
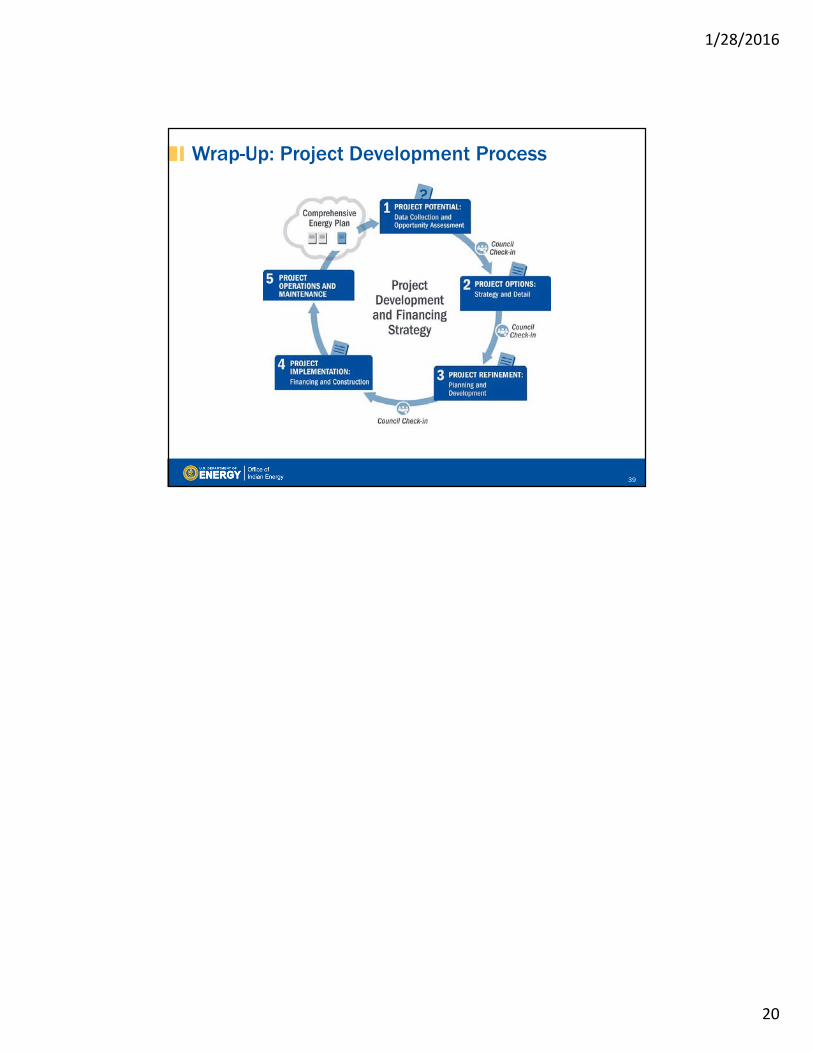
Project Development Process
1Potential
5Operations & Maintenance
3Refinement
2Options
4Implementation
2
1/28/2016
2
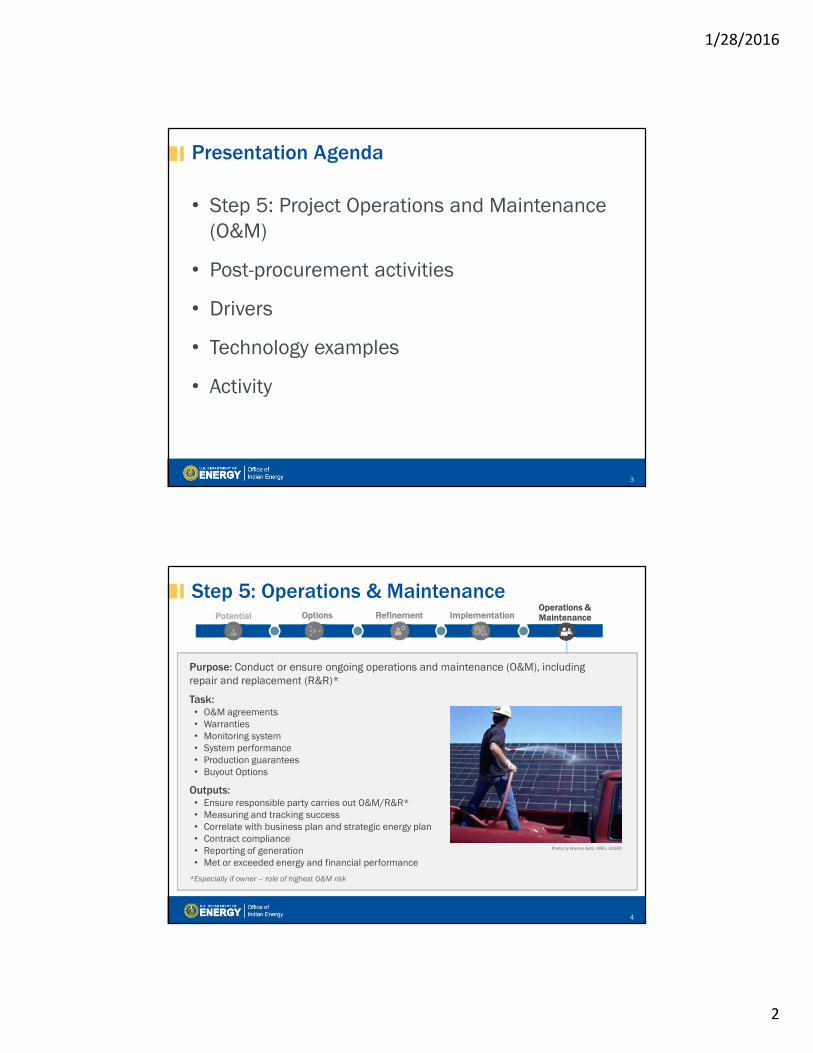
Presentation Agenda
• Step 5: Project Operations and Maintenance (O&M)
• Post-procurement activities
• Drivers
• Technology examples
• Activity
3
Potential Options Refinement ImplementationOperations & Maintenance
Step 5: Operations & Maintenance
4
Photo by Warren Getz, NREL 00180
Purpose: Conduct or ensure ongoing operations and maintenance (O&M), including repair and replacement (R&R)*
Task:• O&M agreements• Warranties• Monitoring system• System performance• Production guarantees• Buyout Options
Outputs:• Ensure responsible party carries out O&M/R&R*• Measuring and tracking success• Correlate with business plan and strategic energy plan• Contract compliance• Reporting of generation• Met or exceeded energy and financial performance
*Especially if owner – role of highest O&M risk
1/28/2016
3
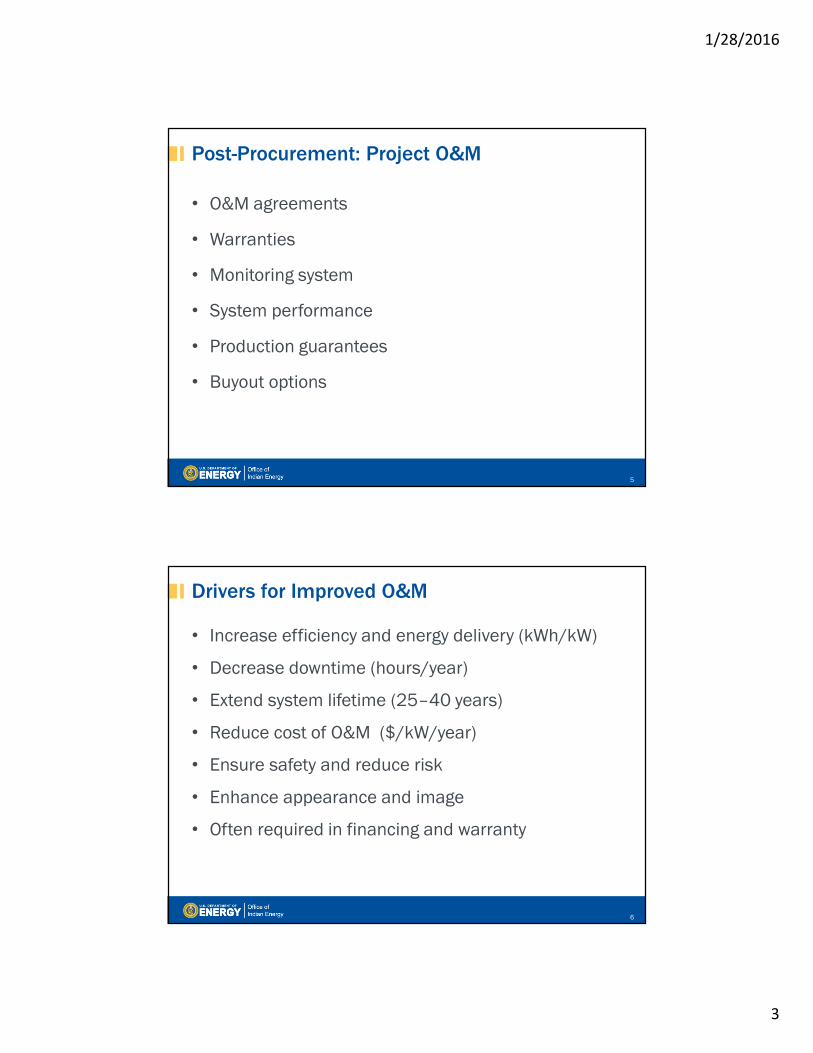
Post-Procurement: Project O&M
• O&M agreements
• Warranties
• Monitoring system
• System performance
• Production guarantees
• Buyout options
5
Drivers for Improved O&M
• Increase efficiency and energy delivery (kWh/kW)
• Decrease downtime (hours/year)
• Extend system lifetime (25–40 years)
• Reduce cost of O&M ($/kW/year)
• Ensure safety and reduce risk
• Enhance appearance and image
• Often required in financing and warranty
6
1/28/2016
4
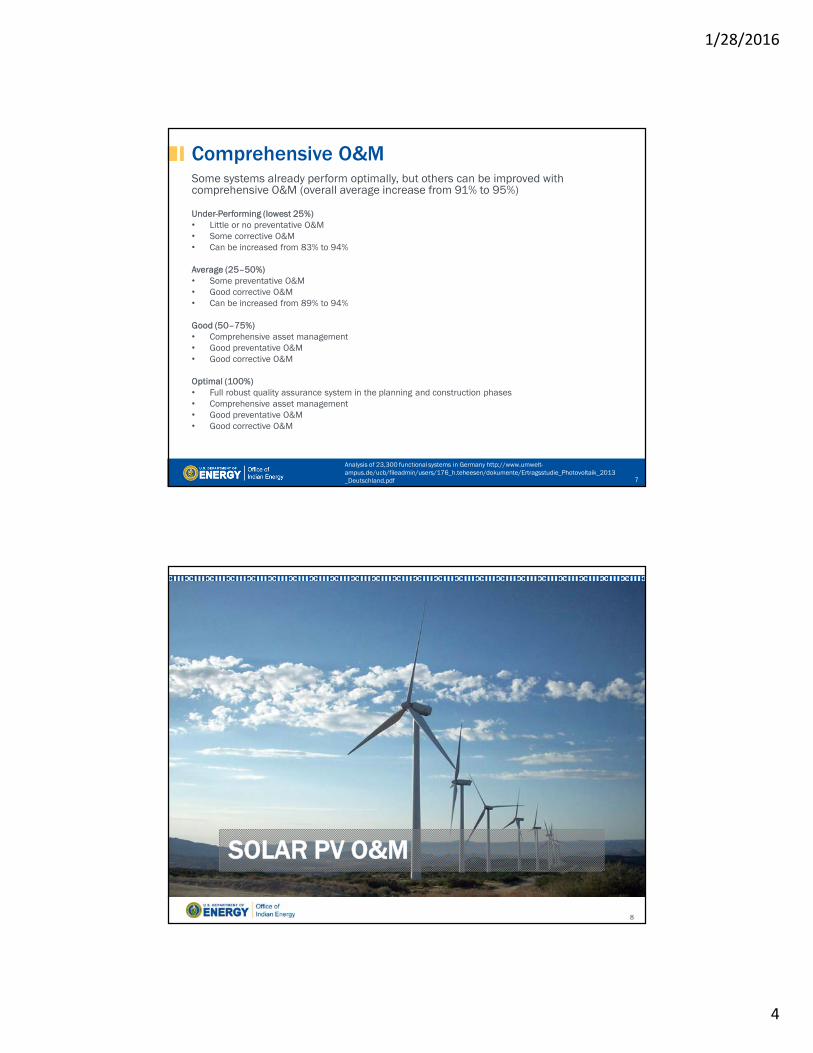
Comprehensive O&MSome systems already perform optimally, but others can be improved with comprehensive O&M (overall average increase from 91% to 95%)
Under-Performing (lowest 25%)• Little or no preventative O&M• Some corrective O&M• Can be increased from 83% to 94%
Average (25–50%)• Some preventative O&M• Good corrective O&M• Can be increased from 89% to 94%
Good (50–75%)• Comprehensive asset management• Good preventative O&M• Good corrective O&M
Optimal (100%)• Full robust quality assurance system in the planning and construction phases• Comprehensive asset management• Good preventative O&M• Good corrective O&M
7
Analysis of 23,300 functional systems in Germany http://www.umwelt-ampus.de/ucb/fileadmin/users/176_h.teheesen/dokumente/Ertragsstudie_Photovoltaik_2013_Deutschland.pdf
SOLAR PV O&M
8
1/28/2016
5
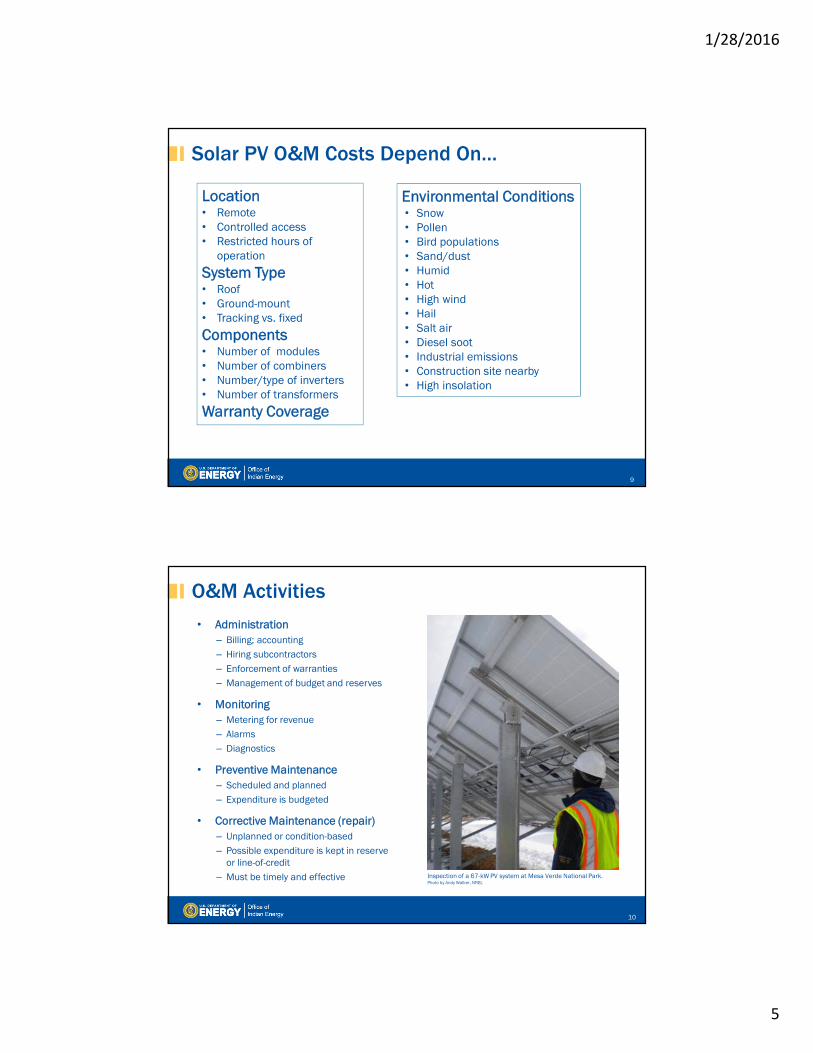
Solar PV O&M Costs Depend On…
Location• Remote • Controlled access• Restricted hours of
operation
System Type• Roof• Ground-mount• Tracking vs. fixed
Components• Number of modules• Number of combiners• Number/type of inverters• Number of transformers
Warranty Coverage
Environmental Conditions• Snow• Pollen• Bird populations• Sand/dust• Humid• Hot • High wind• Hail• Salt air• Diesel soot • Industrial emissions• Construction site nearby • High insolation
9
O&M Activities
• Administration– Billing; accounting – Hiring subcontractors – Enforcement of warranties– Management of budget and reserves
• Monitoring– Metering for revenue– Alarms – Diagnostics
• Preventive Maintenance– Scheduled and planned– Expenditure is budgeted
• Corrective Maintenance (repair)– Unplanned or condition-based– Possible expenditure is kept in reserve
or line-of-credit– Must be timely and effective
10
Inspection of a 67-kW PV system at Mesa Verde National Park. Photo by Andy Walker, NREL
1/28/2016
6
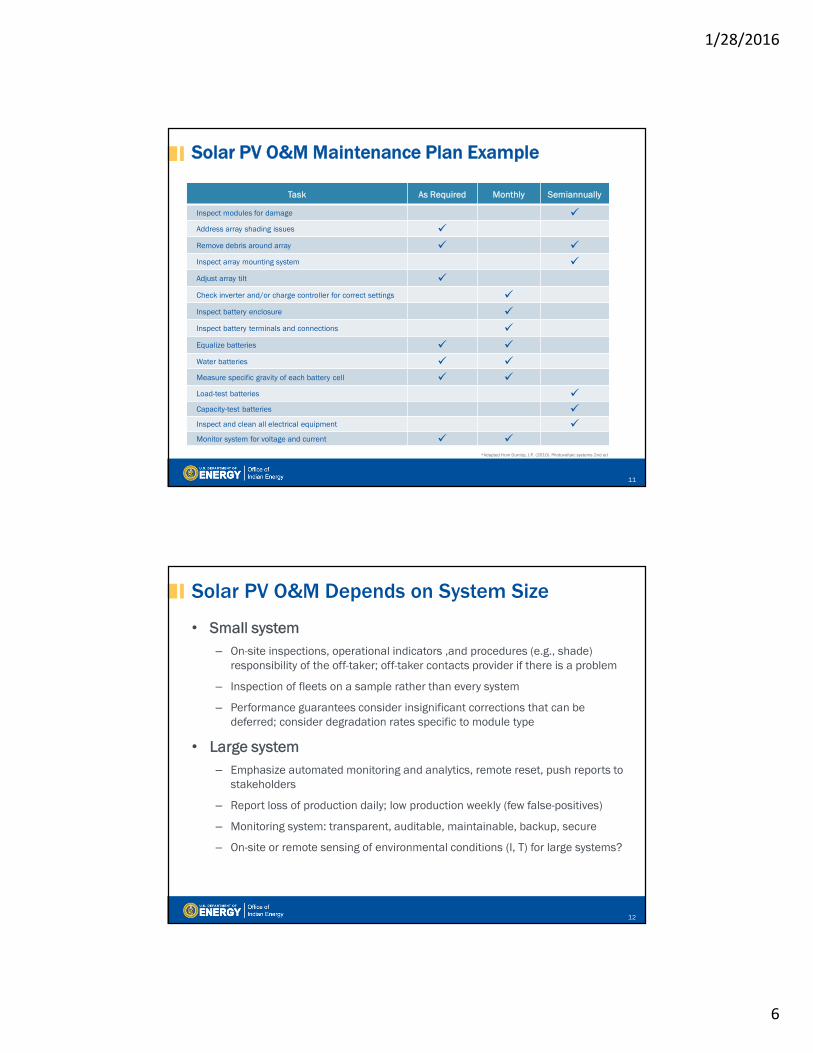
Solar PV O&M Maintenance Plan Example
Task As Required Monthly Semiannually
Inspect modules for damage Address array shading issues Remove debris around array Inspect array mounting system Adjust array tilt Check inverter and/or charge controller for correct settings Inspect battery enclosure Inspect battery terminals and connections Equalize batteries Water batteries Measure specific gravity of each battery cell Load-test batteries Capacity-test batteries Inspect and clean all electrical equipment Monitor system for voltage and current
*Adapted from Dunlop, J.P. (2010). Photovoltaic systems 2nd ed
11
• Small system – On-site inspections, operational indicators ,and procedures (e.g., shade)
responsibility of the off-taker; off-taker contacts provider if there is a problem
– Inspection of fleets on a sample rather than every system
– Performance guarantees consider insignificant corrections that can be deferred; consider degradation rates specific to module type
• Large system – Emphasize automated monitoring and analytics, remote reset, push reports to
stakeholders
– Report loss of production daily; low production weekly (few false-positives)
– Monitoring system: transparent, auditable, maintainable, backup, secure
– On-site or remote sensing of environmental conditions (I, T) for large systems?
Solar PV O&M Depends on System Size
12
1/28/2016
7
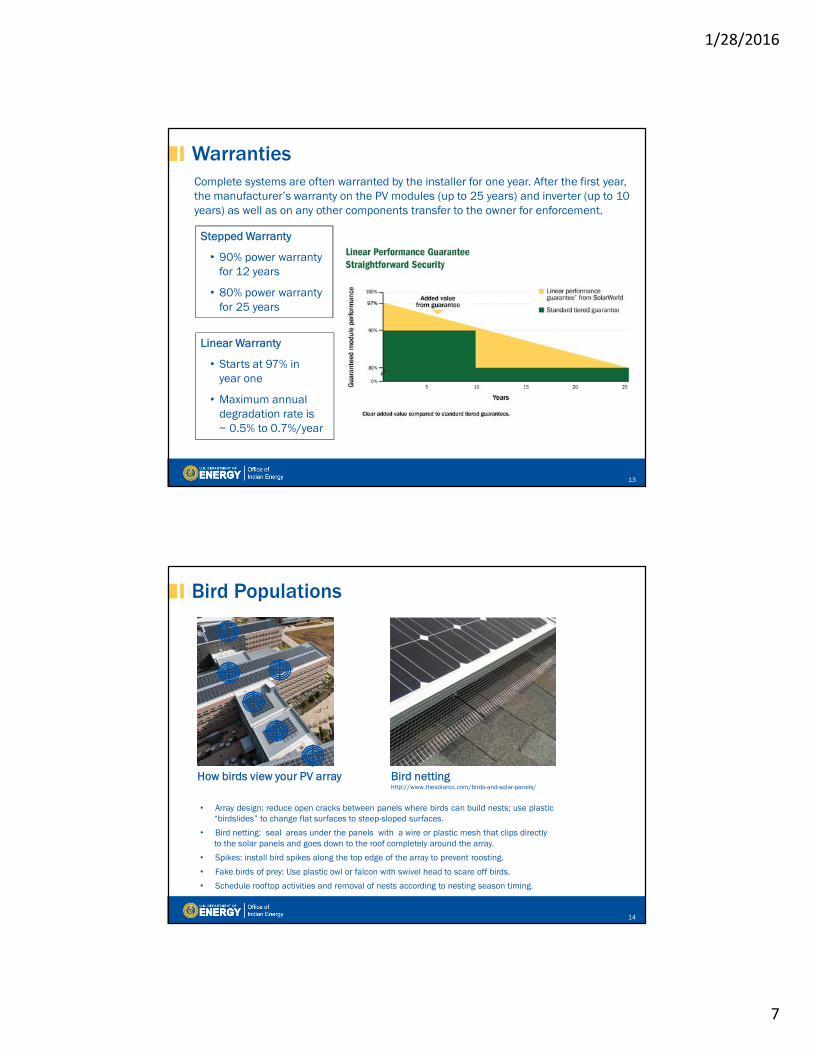
WarrantiesComplete systems are often warranted by the installer for one year. After the first year, the manufacturer’s warranty on the PV modules (up to 25 years) and inverter (up to 10 years) as well as on any other components transfer to the owner for enforcement.
Stepped Warranty
• 90% power warranty for 12 years
• 80% power warranty for 25 years
Linear Warranty
• Starts at 97% inyear one
• Maximum annual degradation rate is~ 0.5% to 0.7%/year
13
Bird Populations
• Array design: reduce open cracks between panels where birds can build nests; use plastic “birdslides” to change flat surfaces to steep-sloped surfaces.
• Bird netting: seal areas under the panels with a wire or plastic mesh that clips directly to the solar panels and goes down to the roof completely around the array.
• Spikes: install bird spikes along the top edge of the array to prevent roosting.
• Fake birds of prey: Use plastic owl or falcon with swivel head to scare off birds.
• Schedule rooftop activities and removal of nests according to nesting season timing.
Bird nettinghttp://www.thesolarco.com/birds-and-solar-panels/
How birds view your PV array
14
1/28/2016
8
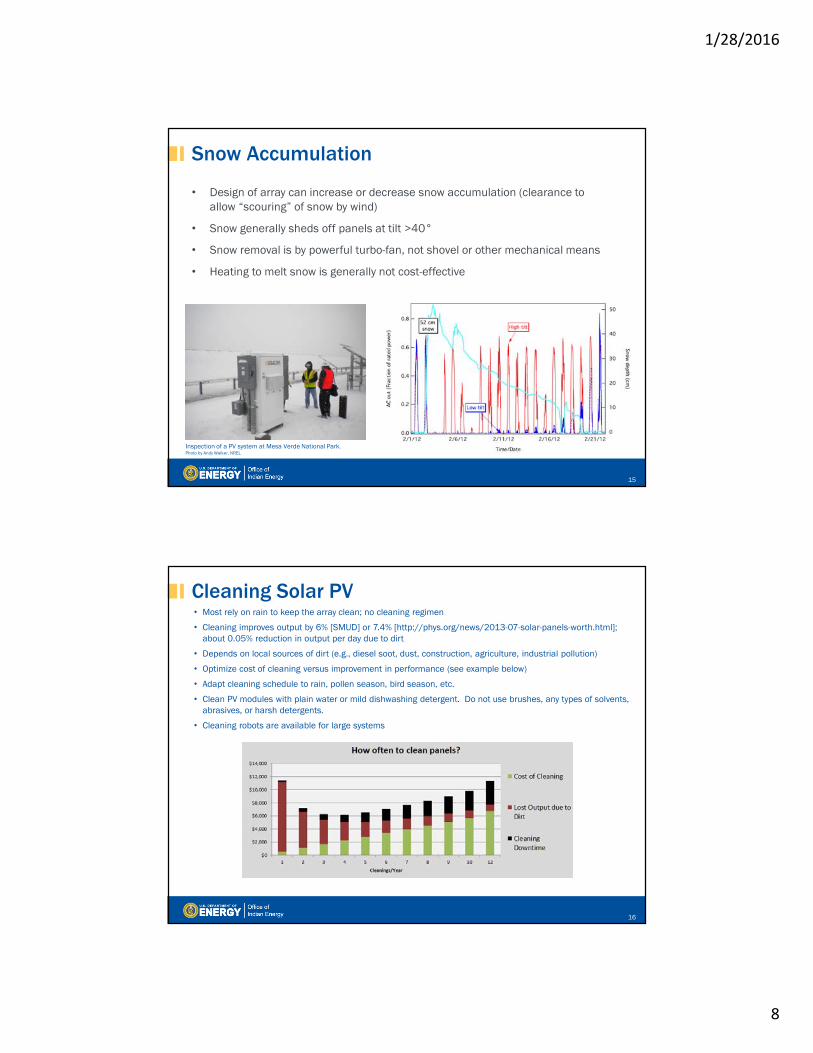
Snow Accumulation
• Design of array can increase or decrease snow accumulation (clearance to allow “scouring” of snow by wind)
• Snow generally sheds off panels at tilt >40°
• Snow removal is by powerful turbo-fan, not shovel or other mechanical means
• Heating to melt snow is generally not cost-effective
15
Inspection of a PV system at Mesa Verde National Park. Photo by Andy Walker, NREL
Cleaning Solar PV• Most rely on rain to keep the array clean; no cleaning regimen
• Cleaning improves output by 6% [SMUD] or 7.4% [http://phys.org/news/2013-07-solar-panels-worth.html]; about 0.05% reduction in output per day due to dirt
• Depends on local sources of dirt (e.g., diesel soot, dust, construction, agriculture, industrial pollution)
• Optimize cost of cleaning versus improvement in performance (see example below)
• Adapt cleaning schedule to rain, pollen season, bird season, etc.
• Clean PV modules with plain water or mild dishwashing detergent. Do not use brushes, any types of solvents, abrasives, or harsh detergents.
• Cleaning robots are available for large systems
16
1/28/2016
9
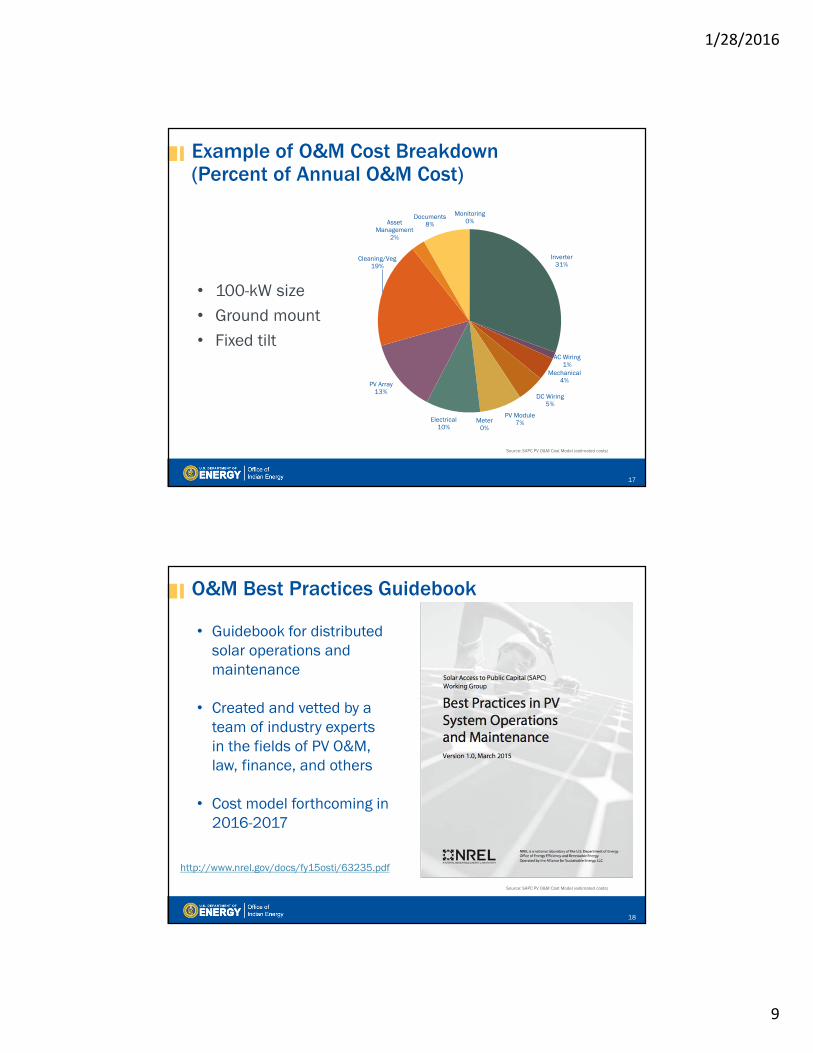
Example of O&M Cost Breakdown (Percent of Annual O&M Cost)
Source: SAPC PV O&M Cost Model (estimated costs)
• 100-kW size• Ground mount • Fixed tilt
Monitoring0%
Inverter31%
AC Wiring1%
Mechanical4%
DC Wiring5%
PV Module7%Meter
0%Electrical
10%
PV Array13%
Cleaning/Veg19%
Asset Management
2%
Documents8%
17
O&M Best Practices Guidebook
Source: SAPC PV O&M Cost Model (estimated costs)
18
http://www.nrel.gov/docs/fy15osti/63235.pdf
• Guidebook for distributed solar operations and maintenance
• Created and vetted by a team of industry experts in the fields of PV O&M, law, finance, and others
• Cost model forthcoming in 2016-2017
1/28/2016
10
19
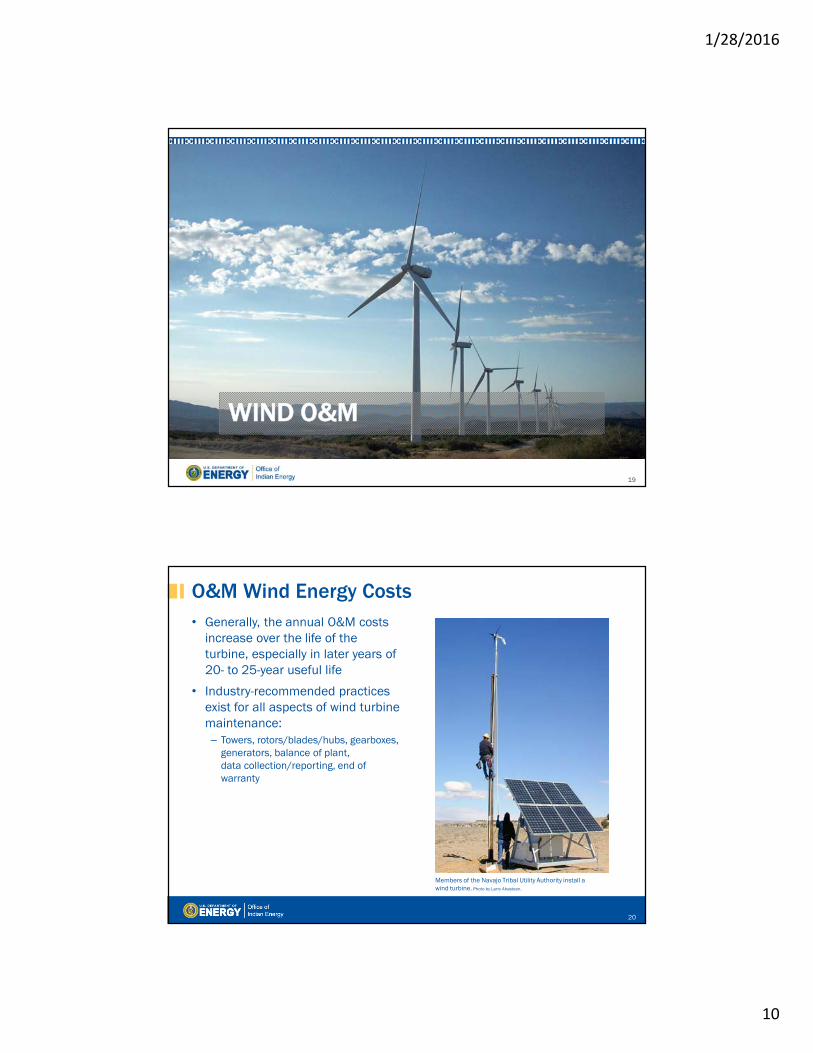
WIND O&M
O&M Wind Energy Costs • Generally, the annual O&M costs
increase over the life of the turbine, especially in later years of 20- to 25-year useful life
• Industry-recommended practices exist for all aspects of wind turbine maintenance:– Towers, rotors/blades/hubs, gearboxes,
generators, balance of plant,data collection/reporting, end of warranty
20
Members of the Navajo Tribal Utility Authority install a wind turbine. Photo by Larry Ahasteen.
1/28/2016
11
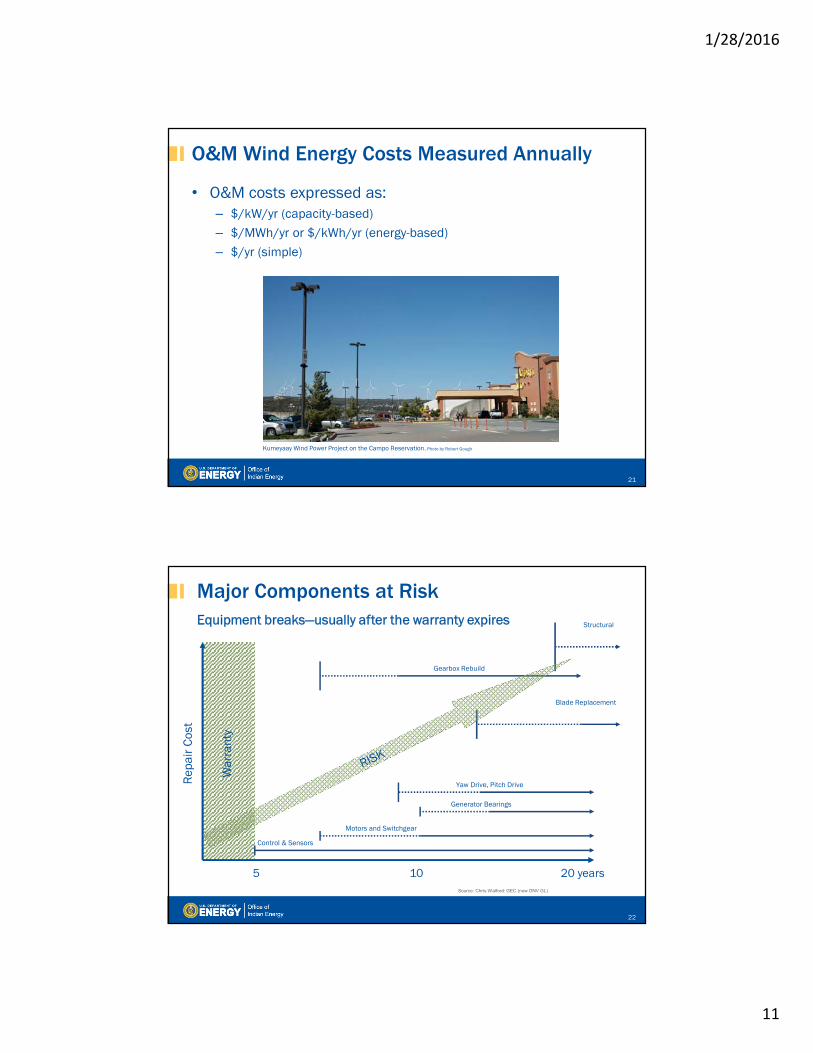
O&M Wind Energy Costs Measured Annually
• O&M costs expressed as:– $/kW/yr (capacity-based)– $/MWh/yr or $/kWh/yr (energy-based) – $/yr (simple)
21
Kumeyaay Wind Power Project on the Campo Reservation. Photo by Robert Gough
5 10 20 years
Rep
air
Cost
Gearbox Rebuild
Blade Replacement
Generator Bearings
Yaw Drive, Pitch Drive
Control & Sensors
Motors and Switchgear
War
rant
y
Structural
Source: Chris Walford: GEC (now DNV GL)
Major Components at RiskEquipment breaks—usually after the warranty expires
22
1/28/2016
12
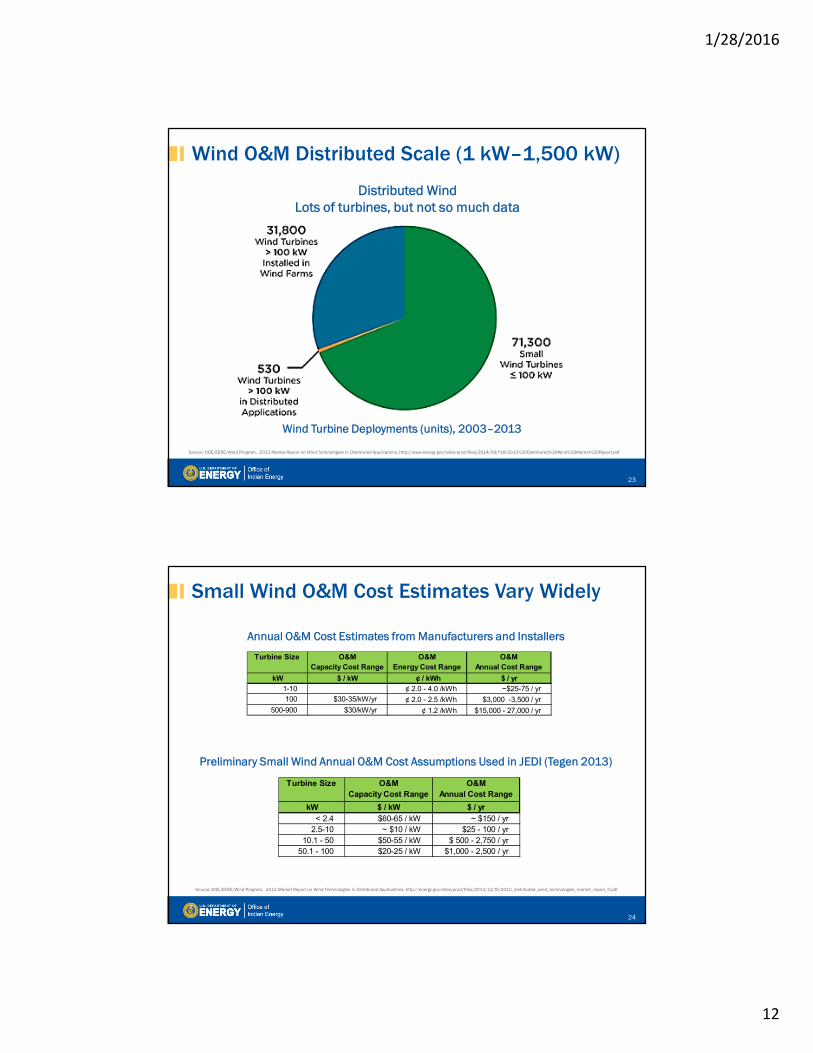
Wind O&M Distributed Scale (1 kW–1,500 kW)
Distributed WindLots of turbines, but not so much data
Wind Turbine Deployments (units), 2003–2013
Source: DOE/EERE/Wind Program, 2013 Market Report on Wind Technologies in Distributed Applications, http://www.energy.gov/sites/prod/files/2014/09/f18/2013%20Distributed%20Wind%20Market%20Report.pdf
23
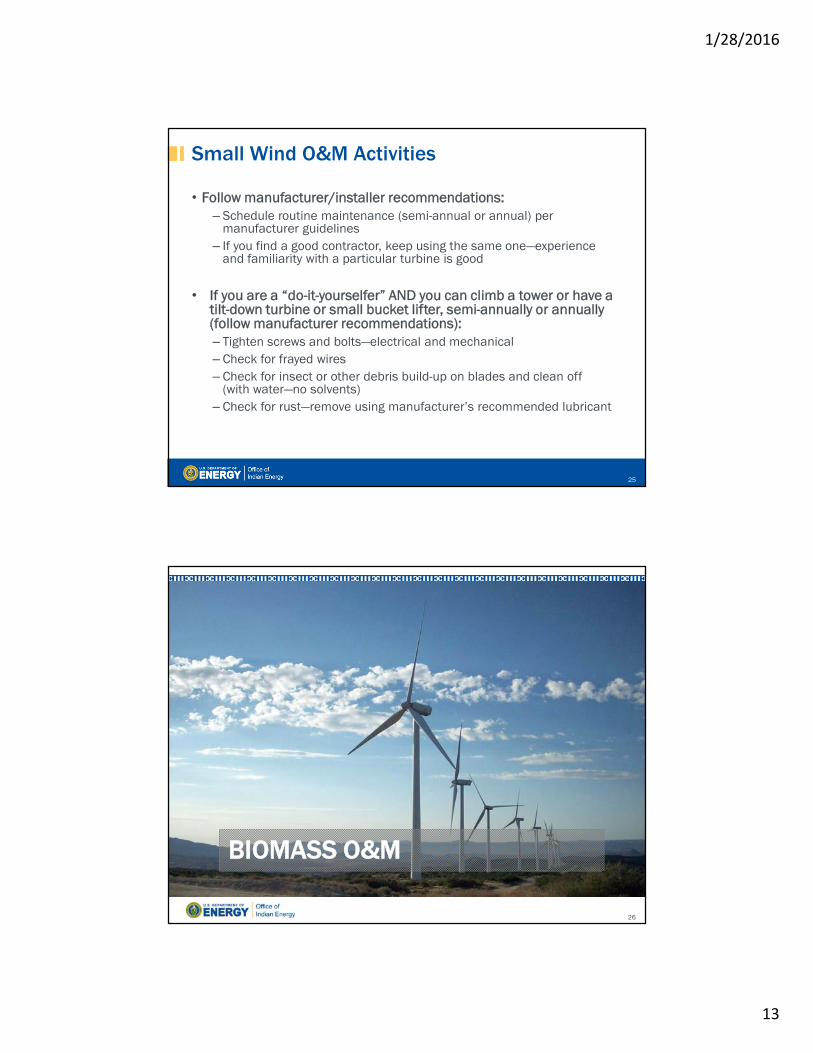
Small Wind O&M Cost Estimates Vary Widely
Preliminary Small Wind Annual O&M Cost Assumptions Used in JEDI (Tegen 2013)
Source: DOE/EERE/Wind Program, 2012 Market Report on Wind Technologies in Distributed Applications, http://energy.gov/sites/prod/files/2013/12/f5/2012_distributed_wind_technologies_market_report_0.pdf
Annual O&M Cost Estimates from Manufacturers and Installers
Turbine Size O&M Capacity Cost Range
O&M Energy Cost Range
O&M Annual Cost Range
kW $ / kW ¢ / kWh $ / yr1-10 ¢ 2.0 - 4.0 /kWh ~$25-75 / yr100 $30-35/kW/yr ¢ 2.0 - 2.5 /kWh $3,000 -3,500 / yr
500-900 $30/kW/yr ¢ 1.2 /kWh $15,000 - 27,000 / yr
Turbine Size O&M Capacity Cost Range
O&M Annual Cost Range
kW $ / kW $ / yr< 2.4 $60-65 / kW ~ $150 / yr
2.5-10 ~ $10 / kW $25 - 100 / yr10.1 - 50 $50-55 / kW $ 500 - 2,750 / yr
50.1 - 100 $20-25 / kW $1,000 - 2,500 / yr
24
1/28/2016
13
Small Wind O&M Activities
• Follow manufacturer/installer recommendations:– Schedule routine maintenance (semi-annual or annual) per
manufacturer guidelines– If you find a good contractor, keep using the same one—experience
and familiarity with a particular turbine is good
• If you are a “do-it-yourselfer” AND you can climb a tower or have a tilt-down turbine or small bucket lifter, semi-annually or annually (follow manufacturer recommendations):– Tighten screws and bolts—electrical and mechanical– Check for frayed wires– Check for insect or other debris build-up on blades and clean off
(with water—no solvents)– Check for rust—remove using manufacturer’s recommended lubricant
25
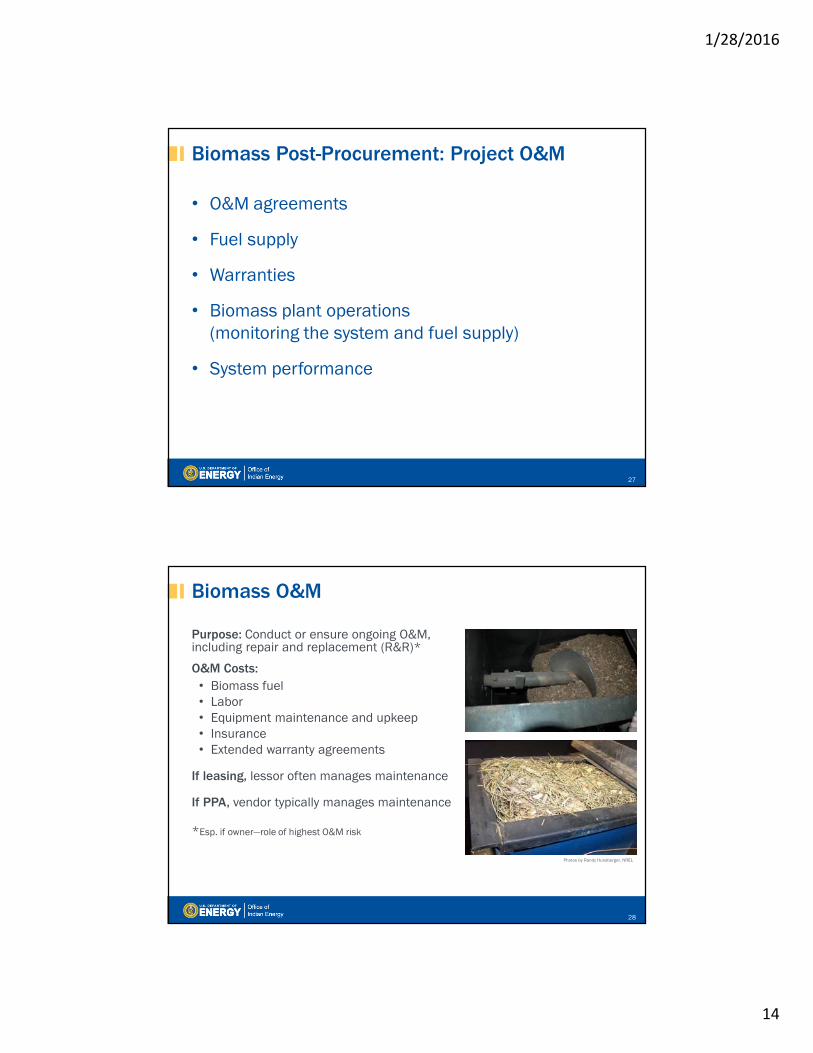
26
BIOMASS O&M
1/28/2016
14
Biomass Post-Procurement: Project O&M
• O&M agreements
• Fuel supply
• Warranties
• Biomass plant operations(monitoring the system and fuel supply)
• System performance
27
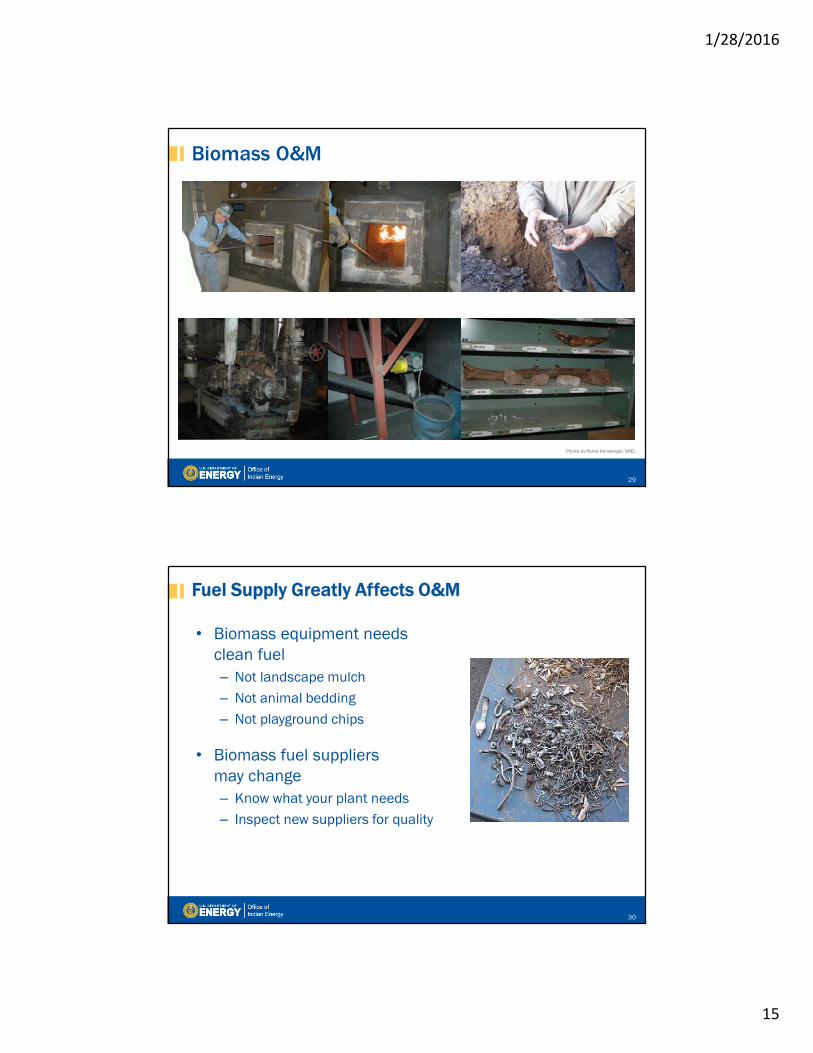
Biomass O&M
Purpose: Conduct or ensure ongoing O&M, including repair and replacement (R&R)*
O&M Costs:• Biomass fuel • Labor • Equipment maintenance and upkeep• Insurance• Extended warranty agreements
If leasing, lessor often manages maintenance
If PPA, vendor typically manages maintenance
*Esp. if owner—role of highest O&M risk
Photos by Randy Hunsberger, NREL
28
1/28/2016
15
Biomass O&M
Photos by Randy Hunsberger, NREL
29
Fuel Supply Greatly Affects O&M
• Biomass equipment needs clean fuel– Not landscape mulch– Not animal bedding– Not playground chips
• Biomass fuel suppliersmay change– Know what your plant needs– Inspect new suppliers for quality
30
1/28/2016
16
Biomass Operators
• Skilled plant operating staff
• Operators monitor a clean fuel supply chain – Harvesting biomass– Processing into fuel – Storage– Consistent delivery– Plan for a backup fuel source
• Maintain machinery
31
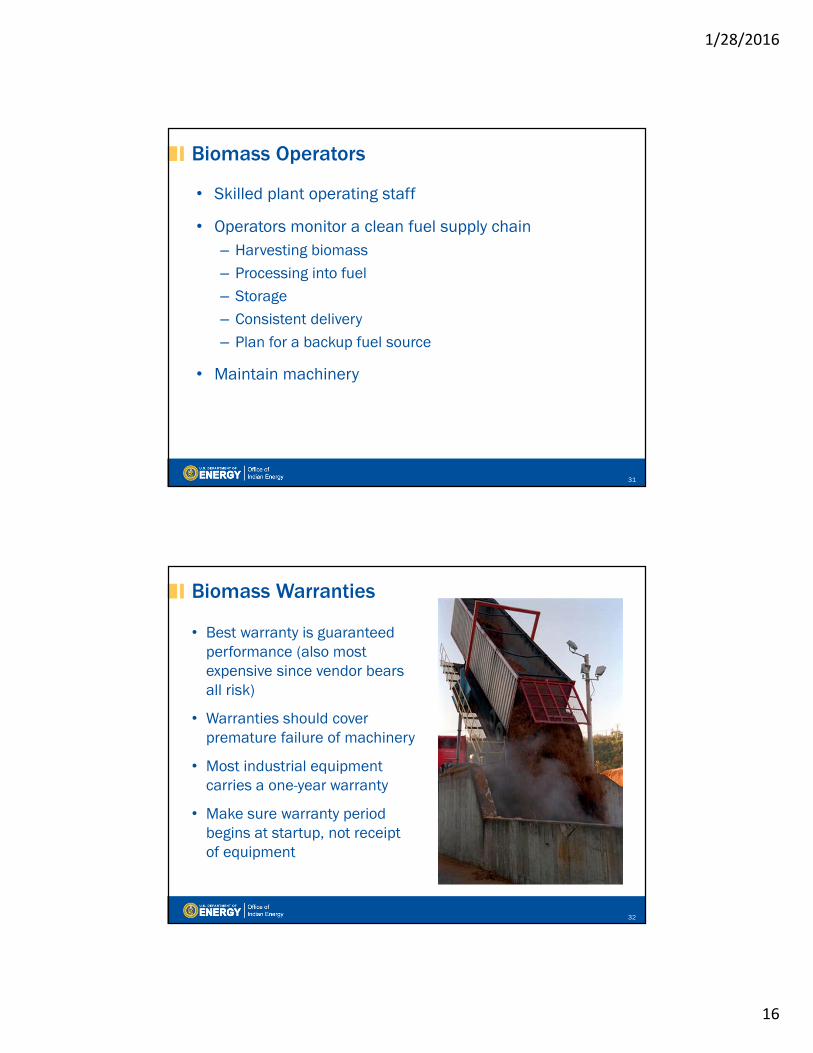
Biomass Warranties
• Best warranty is guaranteed performance (also most expensive since vendor bears all risk)
• Warranties should cover premature failure of machinery
• Most industrial equipment carries a one-year warranty
• Make sure warranty period begins at startup, not receiptof equipment
32
1/28/2016
17
Biomass Maintenance
Machinery maintenance:
• Build a maintenance plan with equipment sales team
• Verify O&M plan fulfills all warranty obligations
• Schedule regular maintenance according to your biomass equipment needs
• Contract a maintenance plan for multiple years if possible
• Budget annually for scheduled maintenance
33
Biomass O&M Case Study on Fuel Supply Failure
• Business plan assumed $38/ton biomass fuel
• Boiler could not tolerate low-grade fuel
• Cost to upgrade fuel exceeded budget at $75 to $100 per ton
• Locate biomass fuel you can afford first!– Key question: Is it available for life of project?
• Then choose combustion equipment
34
1/28/2016
18
Biomass O&M Key Takeaways
• Include O&M budgets and schedules early in the planning process
• Be realistic about fuel costs
• Fuel supply quality should be closely monitored by plant operators with authority to reject loads
• Warranties should cover motors, drivers, controllers, and as many moving parts as possible, regardless of multiple vendors
• Clean fuel and machinery maintenance will determine system performance
35
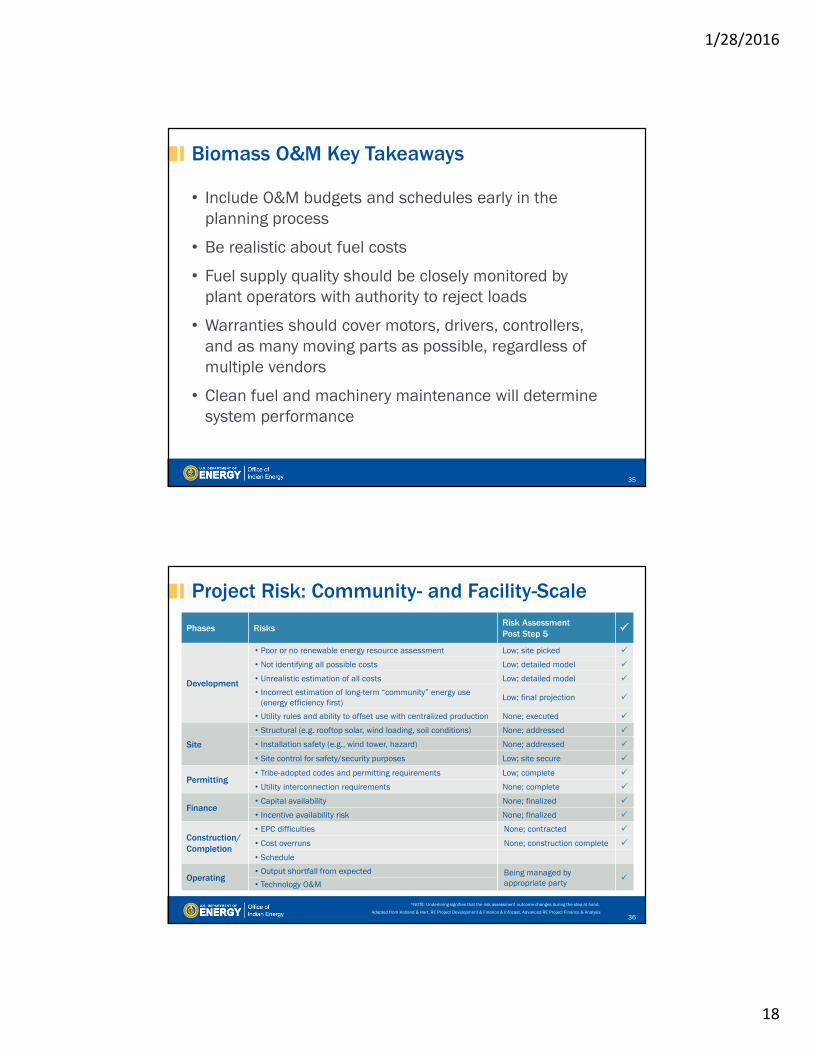
Project Risk: Community- and Facility-Scale
Adapted from Holland & Hart, RE Project Development & Finance & Infocast, Advanced RE Project Finance & Analysis 36
*NOTE: Underlining signifies that the risk assessment outcome changes during the step at hand.
Phases RisksRisk AssessmentPost Step 5
Development
• Poor or no renewable energy resource assessment Low; site picked
• Not identifying all possible costs Low; detailed model
• Unrealistic estimation of all costs Low; detailed model
• Incorrect estimation of long-term “community” energy use (energy efficiency first)
Low; final projection
• Utility rules and ability to offset use with centralized production None; executed
Site
• Structural (e.g. rooftop solar, wind loading, soil conditions) None; addressed
• Installation safety (e.g., wind tower, hazard) None; addressed
• Site control for safety/security purposes Low; site secure
Permitting• Tribe-adopted codes and permitting requirements Low; complete
• Utility interconnection requirements None; complete
Finance• Capital availability None; finalized
• Incentive availability risk None; finalized
Construction/Completion
• EPC difficulties None; contracted
• Cost overruns None; construction complete
• Schedule
Operating • Output shortfall from expected Being managed by
appropriate party • Technology O&M
1/28/2016
19
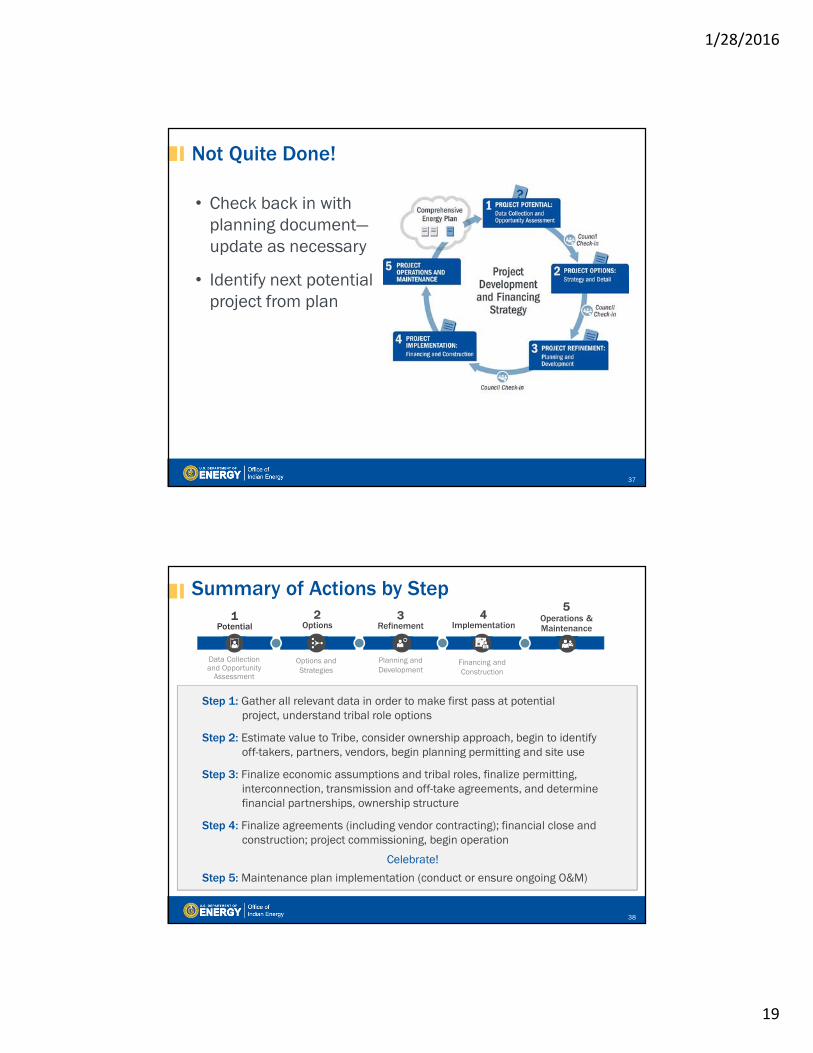
Not Quite Done!
• Check back in with planning document—update as necessary
• Identify next potential project from plan
37
Summary of Actions by Step 1
Potential3
Refinement
5Operations & Maintenance
Data Collection and Opportunity
Assessment
Options and Strategies
Planning and Development
Financing and Construction
2Options
4Implementation
Step 1: Gather all relevant data in order to make first pass at potentialproject, understand tribal role options
Step 2: Estimate value to Tribe, consider ownership approach, begin to identifyoff-takers, partners, vendors, begin planning permitting and site use
Step 3: Finalize economic assumptions and tribal roles, finalize permitting, interconnection, transmission and off-take agreements, and determine financial partnerships, ownership structure
Step 4: Finalize agreements (including vendor contracting); financial close and construction; project commissioning, begin operation
Celebrate!
Step 5: Maintenance plan implementation (conduct or ensure ongoing O&M)
38
1/28/2016
20
Wrap-Up: Project Development Process
39
www.energy.gov/indianenergy
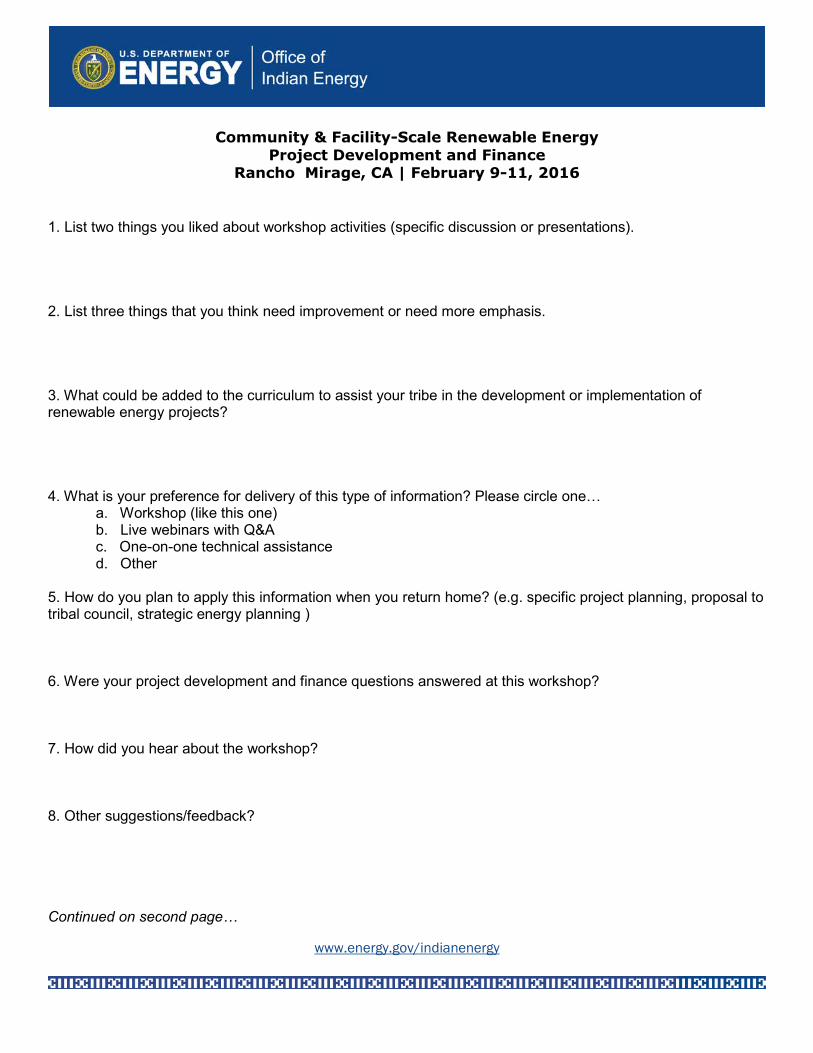
Community & Facility-Scale Renewable Energy Project Development and Finance
Rancho Mirage, CA | February 9-11, 2016
1. List two things you liked about workshop activities (specific discussion or presentations). 2. List three things that you think need improvement or need more emphasis. 3. What could be added to the curriculum to assist your tribe in the development or implementation of renewable energy projects? 4. What is your preference for delivery of this type of information? Please circle one…
a. Workshop (like this one) b. Live webinars with Q&A c. One-on-one technical assistance d. Other
5. How do you plan to apply this information when you return home? (e.g. specific project planning, proposal to tribal council, strategic energy planning ) 6. Were your project development and finance questions answered at this workshop? 7. How did you hear about the workshop? 8. Other suggestions/feedback? Continued on second page…
www.energy.gov/indianenergy
2
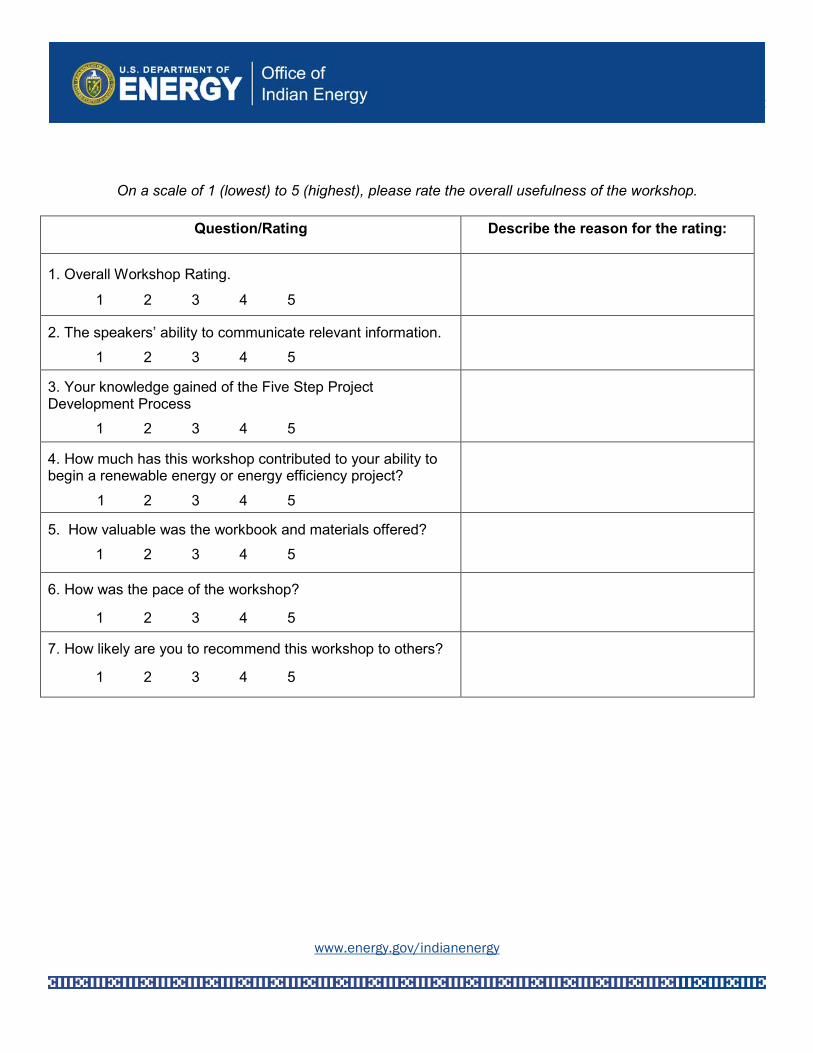
On a scale of 1 (lowest) to 5 (highest), please rate the overall usefulness of the workshop.
Question/Rating Describe the reason for the rating:
1. Overall Workshop Rating.
1 2 3 4 5
2. The speakers’ ability to communicate relevant information.
1 2 3 4 5
3. Your knowledge gained of the Five Step Project Development Process
1 2 3 4 5
4. How much has this workshop contributed to your ability to begin a renewable energy or energy efficiency project?
1 2 3 4 5
5. How valuable was the workbook and materials offered?
1 2 3 4 5
6. How was the pace of the workshop?
1 2 3 4 5
7. How likely are you to recommend this workshop to others?
1 2 3 4 5

Notes

Notes