Embed Size (px)
Citation preview
STEM Starter Academy
Annual Evaluation Report – Year 2
January 2016
Prepared for the Massachusetts Department of Higher Education
Final: 4/21/16
STEM Starter Academy Annual Evaluation Report, Year 2, January 2016 Acknowledgements
UMass Donahue Institute Applied Research & Program Evaluation
i
Acknowledgements
The UMass Donahue Institute extends its sincere appreciation to the many people who supported and
collaborated with us on this evaluation. In particular, we want to thank personnel from the Massachusetts
Department of Higher Education and all fifteen community colleges from around the state who have
supported this project.
STEM Starter Academy Annual Evaluation Report, January 2016
Project Staff
Jeremiah Johnson, Research Manager and Quantitative Specialist, Project Manager
Jacklyn Stein, Graduate Research Assistant
Kate Szczerbacki, Senior Research Analyst
Steven Ellis, Director, Applied Research and Program Evaluation
Report Information
This report was prepared by the UMass Donahue Institute, the project evaluator, under contract with the
Massachusetts Department of Higher Education.
About the Donahue Institute
The University of Massachusetts Donahue Institute (UMDI) is the public service, outreach, and economic
development unit of the University of Massachusetts President’s Office. Established in 1971, the Institute
strives to connect the Commonwealth with the resources of the University through services that combine
theory and innovation with public and private sector applications.
UMDI’s Applied Research and Program Evaluation group specializes in applied social science research,
including program evaluation, survey research, policy research, and needs assessment. The group has
designed and implemented research and evaluation projects for diverse programs and clients in the areas
of education, human services, economic development, and organizational development.
University of Massachusetts Donahue Institute 413-587-2400 (phone)
Applied Research and Program Evaluation Group 413-587-2410 (fax)
100 Venture Way Suite 5 www.donahue.umassp.edu
Hadley, MA 01035-9462
STEM Starter Academy Annual Evaluation Report, Year 2, January 2016 Contents
UMass Donahue Institute Applied Research & Program Evaluation
ii
Contents
Tables and Figures ...................................................................................................................................... iii Executive Summary .................................................................................................................................... iv Introduction................................................................................................................................................. 1 SSA Model Overview ................................................................................................................................... 3 Participation ................................................................................................................................................ 4
Participation Patterns ...................................................................................................................... 4 Participating Populations ................................................................................................................. 5 Primary Participant Service Descriptions ......................................................................................... 7
Outcomes .................................................................................................................................................... 8 Completion and Retention Metrics ................................................................................................. 9 Recruitment and Readiness Metrics .............................................................................................. 12
Program Practices ..................................................................................................................................... 16 Recruitment and Readiness Strategies .......................................................................................... 17 Retention and Completion Strategies ............................................................................................ 20
Formative Feedback on SSA ...................................................................................................................... 26 Promising Practices ........................................................................................................................ 26 Site Reflections on SSA................................................................................................................... 27 DHE Reflections on Year 2.............................................................................................................. 33 Looking Ahead: Year 3 ................................................................................................................... 36
Methods .................................................................................................................................................... 37 Technical Assistance .................................................................................................................................. 41 Strategic Considerations ........................................................................................................................... 43 Appendices ................................................................................................................................................ 45
Appendix A: Year 2 Site Report Survey Appendix B: Year 2 Site Report Narrative Template Appendix C: Year 2 Site Report Survey Data Appendix D: Primary and Secondary Participant Data Appendix E: SSA Summer 2015 DHE Interview Protocol Appendix F: SSA Winter 2016 DHE Interview Protocol Appendix G: Year 2 Evaluation Plan Appendix H: Data Dictionary STEM Starter Academy Primary Collection Appendix I: STEM Starter Academy Secondary Participant Collection Appendix J: SSA Fall 2014 Phone or Site Visit Administrator Interview Protocol Appendix K: SSA Fall 2014 Site Visit Observation Protocol Appendix L: SSA Fall 2014 Site Visit Student Focus Group Questions Appendix M: Fall 2014 Site Visit Summary Appendix N: SSA Summer 2015 Site Visit Administrator Interview Protocol Appendix O: SSA Summer 2015 Site Visit Student Focus Group Questions Appendix P: SSA Summer 2015 Site Visit Observation Protocol Appendix Q: SSA Summer 2015 Activity Schedules Appendix R: Summer 2015 Site Visit Summary Appendix S: March 30 Event Evaluation Feedback Survey Results Appendix T: SSA Grantee Phone and Working Group Meetings Summary
STEM Starter Academy Annual Evaluation Report, Year 2, January 2016 Tables and Figures
UMass Donahue Institute Applied Research & Program Evaluation
iii
Tables and Figures
Figure 1: Common SSA-Funded Strategies Across Campuses, Year 2 ......................................................... vi
Figure 2: Summary of SSA Model Goals, Metrics, and Strategies ................................................................ 3
Table 1: SSA Participants by Term and Year ................................................................................................. 5
Table 2: Student Status at Point of Entry to SSA, Fall 2014 and Fall 2015 .................................................... 6
Table 3: Primary Participants’ Service Descriptions by Term and Year ........................................................ 7
Table 4 : Fall 2015 Progress and Completion Rates for SSA Primary Participants, by Starting Term ......... 11
Table 5: Number of SSA Students Earning Degrees and Certificates by Year ............................................. 11
Table 6: Fall 2014 to Fall 2015 Retention of SSA Students and Community College Students .................. 11
Table 7: Secondary Participant and Event Count by Term and Year .......................................................... 13
Table 8: SSA Primary Participants’ Mathematics Participation and Outcomes, 2015 ................................ 14
Table 9: Students’ Developmental Mathematics Progress, Fall 2014 ........................................................ 15
Figure 3: Common SSA-Funded Strategies Across Campuses, Year 2 ........................................................ 16
STEM Starter Academy Annual Evaluation Report, Year 2, January 2016 Executive Summary
UMass Donahue Institute Applied Research & Program Evaluation
iv
Executive Summary
The Massachusetts Department of Higher Education (DHE) awarded STEM Starter Academy (SSA)
grants to each of the 15 community colleges in Massachusetts during FY14 and renewed those awards for
FY15 and FY16.1 The SSA initiative is intended to support community colleges’ efforts to inform,
engage, recruit, retain, and graduate significantly more students and enhance their success in STEM
pathway programs leading to job placements or 4-year college transfer. SSA sites have worked to address
support service and activity gaps through extension of current programs, capacity building, or
collaboration across campuses and to articulate these practices with current systems of student support.
The UMass Donahue Institute (UMDI) is working with DHE to evaluate the SSA initiative, and this
report presents findings from Year 2.2
An important Year 2 development was the specification of a program model for SSA, developed by DHE
in collaboration with SSA sites. UMDI and DHE have collaborated to align measurement activities with
the key outcomes and metrics outlined in the model. The model’s goals and metrics were used to guide
planning for Year 3 and also frame the reflections on Year 2 in this report.
Year 2 of SSA saw substantial participation in SSA programs across sites and the emergence of
promising practices related to recruitment, readiness, retention, and completion. This report presents
preliminary indicators of SSA initiative impacts, promising practices at SSA sites, and key lessons
learned during Year 2. At the time of this report, no cohort of SSA participants (who joined as first-time,
full-time freshman) has had the opportunity to complete (at least) two full years of courses. Thus, we do
not yet have the data needed to address many questions regarding the impact of the SSA initiative on
student outcomes. The executive summary provides a synopsis of Year 2 participation, outcomes, SSA
strategies, and strategic considerations.
Participation
Key Finding: SSA programs have served a diverse population of over 15,000 people during Year 2,
and over 30,000 people since the inception of the initiative.
SSA-supported activities served 6,600 primary participants and 8,501 secondary
participants in Year 2.3 To date, SSA has served 10,071 primary participants and 20,900
secondary participants.4 SSA programs were subject to 9c funding cuts in Year 2, and these cuts
may have impacted participation. Funding cuts appeared to primarily impact the number of
secondary participants reached, which, over three terms in Year 2, was similar to the number
reached over two terms in Year 1. Early data from Year 3 indicate that more than twice as many
secondary participants were reached in Fall 2015 than had been reached in Fall 2014.
SSA programs continued to attract new participants in Year 2. Over the course of the year,
5,161 primary participants were supported by SSA for the first time, about half of whom were
new to their institutions and half who were continuing students. While the count of secondary
participants is very high, preliminary evidence suggests that relatively few of them (4.2%) later
1 Statewide 9c budget cuts reduced awards to colleges by half in FY15. 2 For the purposes of this report, Year 1 includes Spring and Summer 2014 and Year 2 includes Fall 2014, Spring 2015, and
Summer 2015. 3 Primary participants are community college students who participate in STEM Starter Academy grant funded
programs/events/activities (i.e., participants who have an ID number assigned by their college). Secondary participants are
individuals who are not currently enrolled at a community college and participate in STEM Starter Academy grant funded
programs/events/activities (i.e., participants who do not have an ID number assigned by their college). 4 These are counts of total participants across terms, which include duplicates.
STEM Starter Academy Annual Evaluation Report, Year 2, January 2016 Executive Summary
UMass Donahue Institute Applied Research & Program Evaluation
v
become primary participants. This may present an opportunity to enhance recruitment efforts, and
may also be a function of sites’ limited ability to track recruitment efforts.
Primary participants reflect the diversity of the overall population of community college
students. For example, 12% of primary participants are Black or African American and 14% are
Latino, while 12% of community college students are Black or African American and 16% are
Latino. Similarly, 51% of SSA participants and 59% of community college students are female.
Outcomes
Key Finding: SSA has supported retention, full-time enrollment, and engagement with STEM –
with 70% of SSA participants’ degrees and certificates being completed in STEM fields.
The majority of SSA primary participants who have—to date—earned degrees and
certificates did so in STEM fields. Overall, 70% of degrees and certificates completed by SSA
participants were in STEM fields. This is much higher than the statewide total of 45% of below-
bachelor’s certificates and degrees granted in STEM fields.5
Fall 2014 to Fall 2015 retention rates for SSA participants are similar to—but slightly
higher than—the overall retention rate for all Massachusetts community college students (60% vs 58% for full-time, first-time degree seeking students). This is the first cohort of SSA
participants for whom this data is available and this indicator will be one to watch in the future.
Across all SSA primary participants in Year 1 and Year 2, 67.7% had completed a degree or
certificate by July 2015, been retained to Fall 2015, or transferred to another Massachusetts
public higher education institution. Directly comparable figures at the statewide level were not
available for this report..
Full-time enrollment was 13 percentage points higher among SSA primary participants
than among the general community college student population. This is a positive initial
indicator, as students enrolled full-time are more likely to retain and complete than their part-time
peers.6
Key Finding: SSA is accelerating engagement in and completion of developmental math, leading to
participation in college level math.
SSA participants who complete developmental math move on to college-level math classes.
Of the 197 SSA primary participants who engaged in a developmental math intervention (e.g.,
courses, workshops, and bootcamps) in Summer 2015, 80 (40%) fulfilled all developmental math
requirements for their institution by the end of that term and 60 (75%) of those subsequently
enrolled in a college-level math class for Fall 2015. Statewide, only 20% of community college
students who complete developmental math coursework go on to complete a college level math
course within two years, so the high rate of college-level math enrollment among SSA
participants is a positive initial indicator.7
SSA Strategies
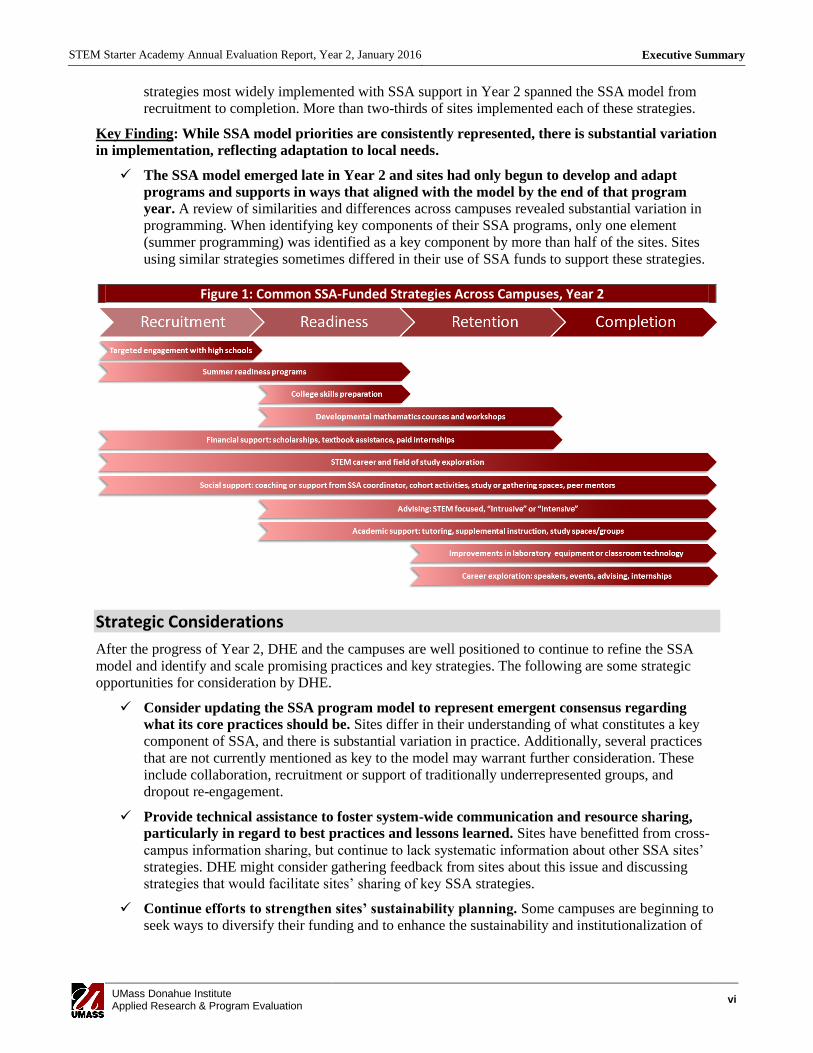
Key Finding: The array of strategies most widely implemented in Year 2 (summarized in Figure 1)
reflects the SSA model’s focus on recruitment, readiness, retention, and completion.
Year 2 strategies reflected the SSA model; sites refined their recruitment and readiness
strategies, and began to develop and implement retention and completion strategies. The
5 This figure includes both public and private schools in 2013. 2015 Massachusetts STEM Data Dashboard, http://www.mass.edu/stem/documents/2015%20STEM%20Data%20Dashboard%20FINAL.pdf 6 Complete College America, Time is the Enemy, 2011, http://completecollege.org/docs/Time_Is_the_Enemy.pdf 7 Vision Project, Final Report from the Task Force on Transforming Developmental Math Education, October 2013
STEM Starter Academy Annual Evaluation Report, Year 2, January 2016 Executive Summary
UMass Donahue Institute Applied Research & Program Evaluation
vi
strategies most widely implemented with SSA support in Year 2 spanned the SSA model from
recruitment to completion. More than two-thirds of sites implemented each of these strategies.
Key Finding: While SSA model priorities are consistently represented, there is substantial variation
in implementation, reflecting adaptation to local needs.
The SSA model emerged late in Year 2 and sites had only begun to develop and adapt
programs and supports in ways that aligned with the model by the end of that program
year. A review of similarities and differences across campuses revealed substantial variation in
programming. When identifying key components of their SSA programs, only one element
(summer programming) was identified as a key component by more than half of the sites. Sites
using similar strategies sometimes differed in their use of SSA funds to support these strategies.
Figure 1: Common SSA-Funded Strategies Across Campuses, Year 2
Strategic Considerations
After the progress of Year 2, DHE and the campuses are well positioned to continue to refine the SSA
model and identify and scale promising practices and key strategies. The following are some strategic
opportunities for consideration by DHE.
Consider updating the SSA program model to represent emergent consensus regarding
what its core practices should be. Sites differ in their understanding of what constitutes a key
component of SSA, and there is substantial variation in practice. Additionally, several practices
that are not currently mentioned as key to the model may warrant further consideration. These
include collaboration, recruitment or support of traditionally underrepresented groups, and
dropout re-engagement.
Provide technical assistance to foster system-wide communication and resource sharing,
particularly in regard to best practices and lessons learned. Sites have benefitted from cross-
campus information sharing, but continue to lack systematic information about other SSA sites’
strategies. DHE might consider gathering feedback from sites about this issue and discussing
strategies that would facilitate sites’ sharing of key SSA strategies.
Continue efforts to strengthen sites’ sustainability planning. Some campuses are beginning to
seek ways to diversify their funding and to enhance the sustainability and institutionalization of
STEM Starter Academy Annual Evaluation Report, Year 2, January 2016 Executive Summary
UMass Donahue Institute Applied Research & Program Evaluation
vii
SSA programs. This may be an area in which continued technical assistance and sharing is
particularly important.
Engage campuses in aligning evaluation activities with what they locally identify as key
indicators of participant progress and outcomes. During Year 2, grantees discussed several
potentially important metrics (e.g., those relevant to credit attainment or the impact of awareness
and recruiting efforts) that might warrant further consideration.
Consider strategies for promoting connections between SSA programs and other STEM
initiatives at each campus. Campuses offer an array of programs to promote engagement and
success in STEM, and SSA is an important part of that support structure. Moving toward a
thoughtful integration of these initiatives may yield substantial efficiencies and positive results.
STEM Starter Academy Annual Evaluation Report, Year 2, January 2016 Introduction
UMass Donahue Institute Applied Research & Program Evaluation
1
Introduction
The Massachusetts Department of Higher Education (DHE) awarded STEM Starter Academy (SSA)
grants to each of the 15 community colleges in Massachusetts during FY14 and renewed those awards for
FY15 and FY16.8 The SSA initiative is intended to support community colleges’ efforts to inform,
engage, recruit, retain, and graduate significantly more students and enhance their success in STEM
pathway programs leading to job placements or 4-year college transfer.9Additional priorities of the
initiative include campus identification of student support service and activity gaps that can be addressed
through extension of current programs, capacity building, or collaboration across campuses and to
articulate these practices with current systems of student support.
The UMass Donahue Institute (UMDI) has worked with DHE to evaluate the SSA initiative since the
inception of the program, and this report presents findings from Year 2.10
The evaluation—and this
report—addresses multiple purposes: (1) to provide preliminary summative feedback about SSA student
progress and outcomes relevant to the program model developed in Year 2, (2) to provide formative
feedback to DHE and to the community colleges relevant to grant activities, and (3) to provide technical
assistance to support DHE’s efforts to implement the initiative.
This report presents preliminary indicators of SSA initiative impacts, promising practices at SSA sites,
and key lessons learned in Year 2.
Evaluation Questions
Programs and activities at SSA sites are diverse, and UMDI’s primary role is to evaluate the SSA
initiative as a whole. To that end, the process and outcome evaluation questions below offer a framework
for understanding the line of inquiry that guided UMDI’s evaluation of SSA activities during Year 2.
These evaluation questions were developed during fall 2014. The evaluation questions established in this
document reflect our current understanding of program implementation and available data, as well as our
continued responsive development of the evaluation design.
Process Evaluation Questions
P1. What are the major challenges to and facilitators of successful program implementation
encountered by grantees? What midcourse corrections and attempts to overcome challenges have
been undertaken? What additional steps are planned?
P2. What are the major challenges to and facilitators of providing program support and facilitation
encountered by DHE? How have challenges been overcome and midcourse corrections
undertaken? What additional steps are planned?
P3. How do key project stakeholders rate and explain the quality, relevance, and effectiveness of
major program components and services?
8 Statewide 9c budget cuts reduced awards to colleges by half in FY15. 9 SSA uses the STEM subject/employment areas that are used for the Data Dashboard: (1) Agriculture, Conservation, and Natural
Resources, (2) Architecture, (3) Biological and Biomedical Sciences, (4) Computer and Information Sciences, (5) Engineering
and Engineering Technologies/Technicians, (6) Health Professions and Clinical Sciences, (7) Mathematics and Statistics, (8)
Mechanic and Repair Technologies/Technicians, (9) Military Technologies/Technicians, (10) Physical Sciences, (11) Precision
Production, and (12) Science Technologies/Technicians. 10 For the purposes of this report, Year 1 includes Spring and Summer 2014 and Year 2 includes Fall 2014, Spring 2015, and
Summer 2015.
STEM Starter Academy Annual Evaluation Report, Year 2, January 2016 Introduction
UMass Donahue Institute Applied Research & Program Evaluation
2
P4. What infrastructure, systems, and processes were put in place to aid program sustainability during
and beyond the award period? What are the greatest challenges and barriers to creating
sustainability? In what ways have STEM Starter Academy grantees integrated their programs
with other STEM pipeline development and support efforts? How have grantees shared lessons
learned and emerging best practices with others?
Outcome Evaluation Questions
O1. What progress is being made toward the goals of informing, recruiting, retaining, and
graduating/completing more students from STEM pathway programs?
O2. Who is participating in SSA activities? Do observed changes differ across student characteristics
such as gender and race/ethnicity?
O3. To what extent are observed changes in student outcomes attributable to program activities
(including combinations of program activities) versus contextual variables or non-SSA
interventions?
O4. What differences in program features, implementation, and contextual variables can be identified
across programs whose progress or outcomes differ substantially?
STEM Starter Academy Annual Evaluation Report, Year 2, January 2016 SSA Model Overview
UMass Donahue Institute Applied Research & Program Evaluation
3
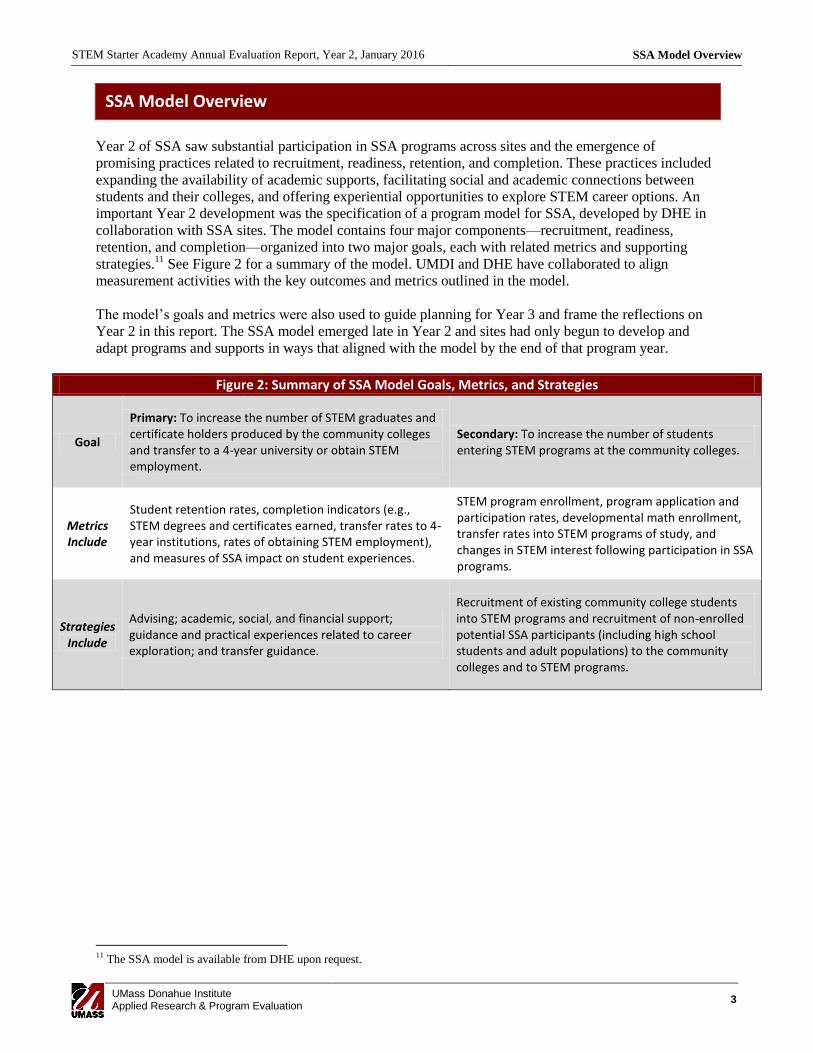
SSA Model Overview
Year 2 of SSA saw substantial participation in SSA programs across sites and the emergence of
promising practices related to recruitment, readiness, retention, and completion. These practices included
expanding the availability of academic supports, facilitating social and academic connections between
students and their colleges, and offering experiential opportunities to explore STEM career options. An
important Year 2 development was the specification of a program model for SSA, developed by DHE in
collaboration with SSA sites. The model contains four major components—recruitment, readiness,
retention, and completion—organized into two major goals, each with related metrics and supporting
strategies.11
See Figure 2 for a summary of the model. UMDI and DHE have collaborated to align
measurement activities with the key outcomes and metrics outlined in the model.
The model’s goals and metrics were also used to guide planning for Year 3 and frame the reflections on
Year 2 in this report. The SSA model emerged late in Year 2 and sites had only begun to develop and
adapt programs and supports in ways that aligned with the model by the end of that program year.
Figure 2: Summary of SSA Model Goals, Metrics, and Strategies
Goal
Primary: To increase the number of STEM graduates and certificate holders produced by the community colleges and transfer to a 4-year university or obtain STEM employment.
Secondary: To increase the number of students entering STEM programs at the community colleges.
Metrics Include
Student retention rates, completion indicators (e.g., STEM degrees and certificates earned, transfer rates to 4-year institutions, rates of obtaining STEM employment), and measures of SSA impact on student experiences.
STEM program enrollment, program application and participation rates, developmental math enrollment, transfer rates into STEM programs of study, and changes in STEM interest following participation in SSA programs.
Strategies Include
Advising; academic, social, and financial support; guidance and practical experiences related to career exploration; and transfer guidance.
Recruitment of existing community college students into STEM programs and recruitment of non-enrolled potential SSA participants (including high school students and adult populations) to the community colleges and to STEM programs.
11 The SSA model is available from DHE upon request.
STEM Starter Academy Annual Evaluation Report, Year 2, January 2016 Participation
UMass Donahue Institute Applied Research & Program Evaluation
4
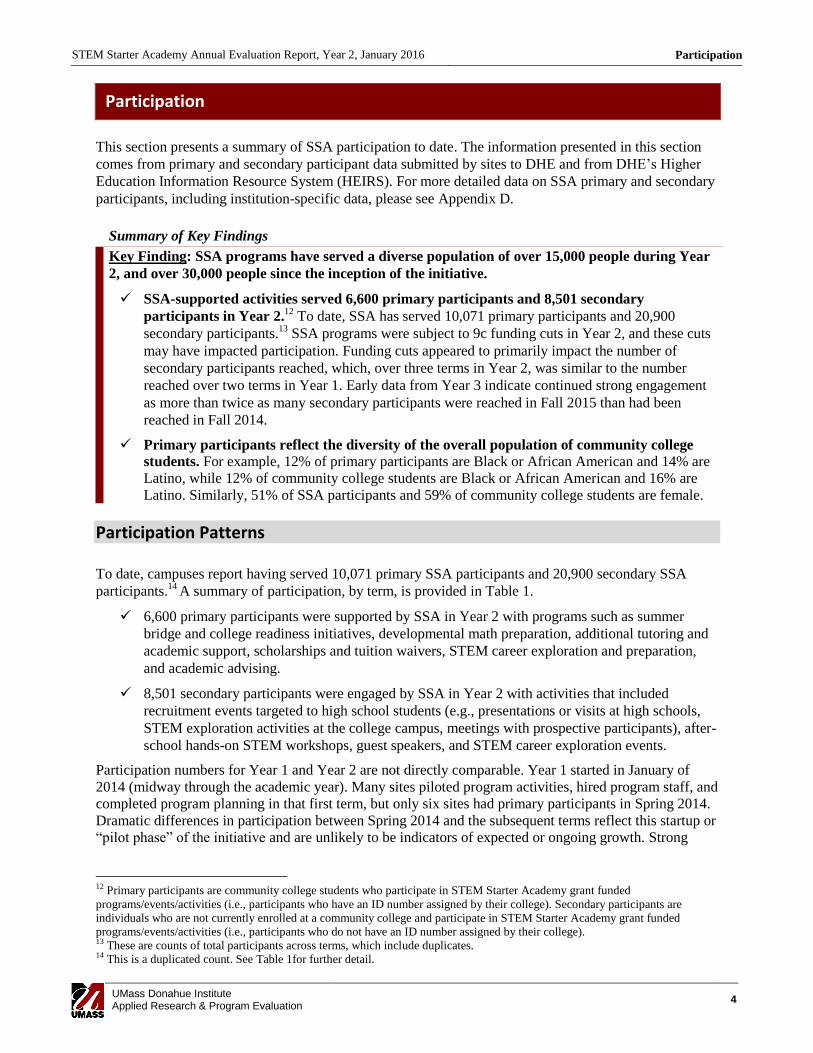
Participation
This section presents a summary of SSA participation to date. The information presented in this section
comes from primary and secondary participant data submitted by sites to DHE and from DHE’s Higher
Education Information Resource System (HEIRS). For more detailed data on SSA primary and secondary
participants, including institution-specific data, please see Appendix D.
Summary of Key Findings
Key Finding: SSA programs have served a diverse population of over 15,000 people during Year
2, and over 30,000 people since the inception of the initiative.
SSA-supported activities served 6,600 primary participants and 8,501 secondary
participants in Year 2.12
To date, SSA has served 10,071 primary participants and 20,900
secondary participants.13
SSA programs were subject to 9c funding cuts in Year 2, and these cuts
may have impacted participation. Funding cuts appeared to primarily impact the number of
secondary participants reached, which, over three terms in Year 2, was similar to the number
reached over two terms in Year 1. Early data from Year 3 indicate continued strong engagement
as more than twice as many secondary participants were reached in Fall 2015 than had been
reached in Fall 2014.
Primary participants reflect the diversity of the overall population of community college
students. For example, 12% of primary participants are Black or African American and 14% are
Latino, while 12% of community college students are Black or African American and 16% are
Latino. Similarly, 51% of SSA participants and 59% of community college students are female.
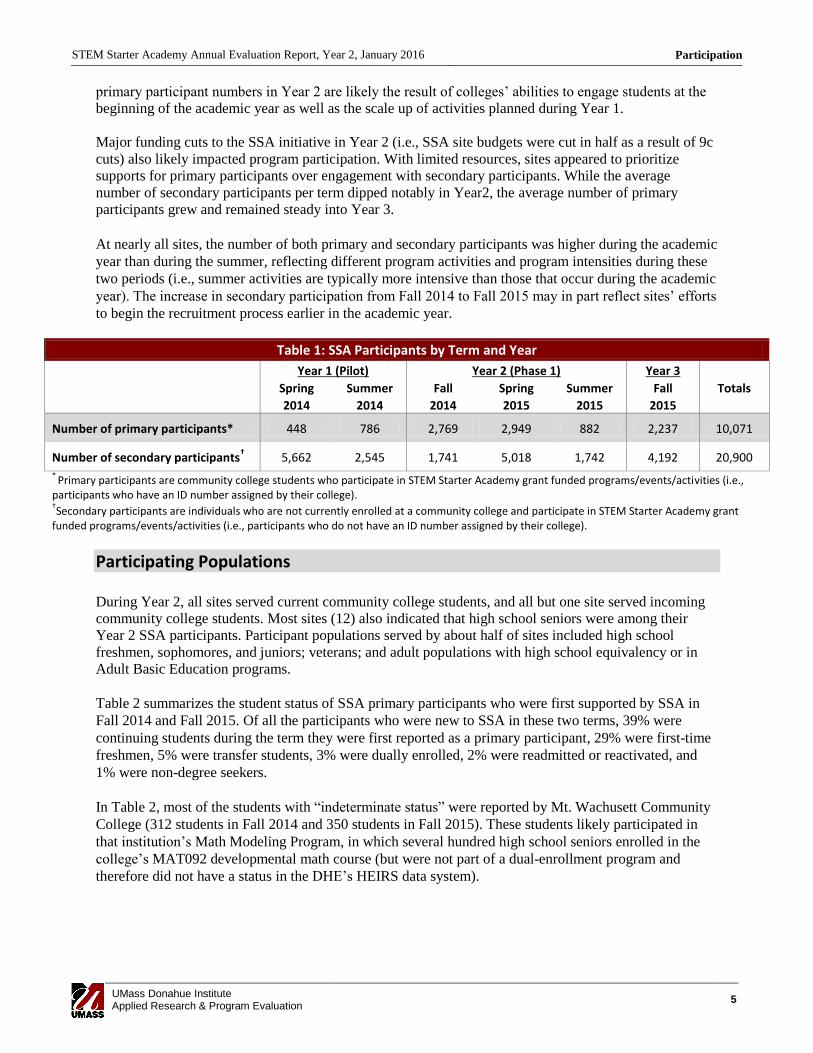
Participation Patterns
To date, campuses report having served 10,071 primary SSA participants and 20,900 secondary SSA
participants.14
A summary of participation, by term, is provided in Table 1.
6,600 primary participants were supported by SSA in Year 2 with programs such as summer
bridge and college readiness initiatives, developmental math preparation, additional tutoring and
academic support, scholarships and tuition waivers, STEM career exploration and preparation,
and academic advising.
8,501 secondary participants were engaged by SSA in Year 2 with activities that included
recruitment events targeted to high school students (e.g., presentations or visits at high schools,
STEM exploration activities at the college campus, meetings with prospective participants), after-
school hands-on STEM workshops, guest speakers, and STEM career exploration events.
Participation numbers for Year 1 and Year 2 are not directly comparable. Year 1 started in January of
2014 (midway through the academic year). Many sites piloted program activities, hired program staff, and
completed program planning in that first term, but only six sites had primary participants in Spring 2014.
Dramatic differences in participation between Spring 2014 and the subsequent terms reflect this startup or
―pilot phase‖ of the initiative and are unlikely to be indicators of expected or ongoing growth. Strong
12 Primary participants are community college students who participate in STEM Starter Academy grant funded
programs/events/activities (i.e., participants who have an ID number assigned by their college). Secondary participants are
individuals who are not currently enrolled at a community college and participate in STEM Starter Academy grant funded
programs/events/activities (i.e., participants who do not have an ID number assigned by their college). 13 These are counts of total participants across terms, which include duplicates. 14 This is a duplicated count. See Table 1for further detail.
STEM Starter Academy Annual Evaluation Report, Year 2, January 2016 Participation
UMass Donahue Institute Applied Research & Program Evaluation
5
primary participant numbers in Year 2 are likely the result of colleges’ abilities to engage students at the
beginning of the academic year as well as the scale up of activities planned during Year 1.
Major funding cuts to the SSA initiative in Year 2 (i.e., SSA site budgets were cut in half as a result of 9c
cuts) also likely impacted program participation. With limited resources, sites appeared to prioritize
supports for primary participants over engagement with secondary participants. While the average
number of secondary participants per term dipped notably in Year2, the average number of primary
participants grew and remained steady into Year 3.
At nearly all sites, the number of both primary and secondary participants was higher during the academic
year than during the summer, reflecting different program activities and program intensities during these
two periods (i.e., summer activities are typically more intensive than those that occur during the academic
year). The increase in secondary participation from Fall 2014 to Fall 2015 may in part reflect sites’ efforts
to begin the recruitment process earlier in the academic year.
Table 1: SSA Participants by Term and Year
Year 1 (Pilot) Year 2 (Phase 1) Year 3
Totals Spring
2014
Summer
2014
Fall
2014
Spring
2015
Summer
2015
Fall
2015
Number of primary participants* 448 786 2,769 2,949 882 2,237 10,071
Number of secondary participants† 5,662 2,545 1,741 5,018 1,742 4,192 20,900
* Primary participants are community college students who participate in STEM Starter Academy grant funded programs/events/activities (i.e.,
participants who have an ID number assigned by their college). †Secondary participants are individuals who are not currently enrolled at a community college and participate in STEM Starter Academy grant
funded programs/events/activities (i.e., participants who do not have an ID number assigned by their college).
Participating Populations
During Year 2, all sites served current community college students, and all but one site served incoming
community college students. Most sites (12) also indicated that high school seniors were among their
Year 2 SSA participants. Participant populations served by about half of sites included high school
freshmen, sophomores, and juniors; veterans; and adult populations with high school equivalency or in
Adult Basic Education programs.
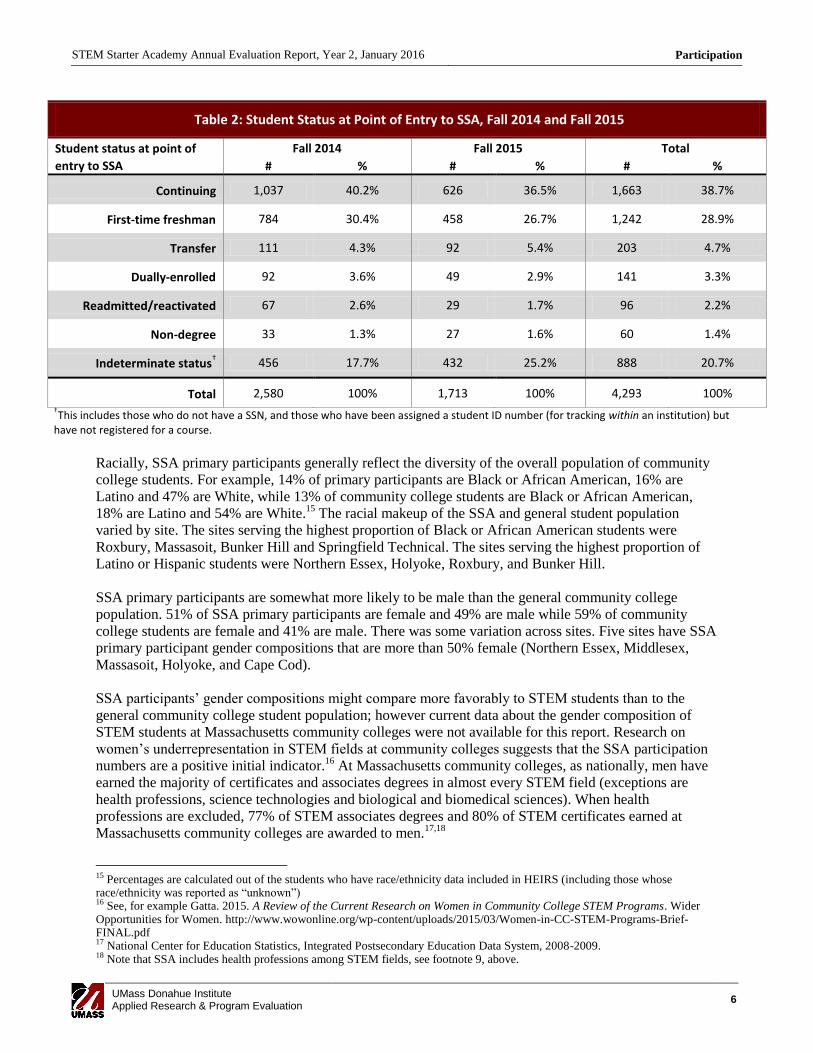
Table 2 summarizes the student status of SSA primary participants who were first supported by SSA in
Fall 2014 and Fall 2015. Of all the participants who were new to SSA in these two terms, 39% were
continuing students during the term they were first reported as a primary participant, 29% were first-time
freshmen, 5% were transfer students, 3% were dually enrolled, 2% were readmitted or reactivated, and
1% were non-degree seekers.
In Table 2, most of the students with ―indeterminate status‖ were reported by Mt. Wachusett Community
College (312 students in Fall 2014 and 350 students in Fall 2015). These students likely participated in
that institution’s Math Modeling Program, in which several hundred high school seniors enrolled in the
college’s MAT092 developmental math course (but were not part of a dual-enrollment program and
therefore did not have a status in the DHE’s HEIRS data system).
STEM Starter Academy Annual Evaluation Report, Year 2, January 2016 Participation
UMass Donahue Institute Applied Research & Program Evaluation
6
Table 2: Student Status at Point of Entry to SSA, Fall 2014 and Fall 2015
Student status at point of
entry to SSA
Fall 2014 Fall 2015 Total
# % # % # %
Continuing 1,037 40.2% 626 36.5% 1,663 38.7%
First-time freshman 784 30.4% 458 26.7% 1,242 28.9%
Transfer 111 4.3% 92 5.4% 203 4.7%
Dually-enrolled 92 3.6% 49 2.9% 141 3.3%
Readmitted/reactivated 67 2.6% 29 1.7% 96 2.2%
Non-degree 33 1.3% 27 1.6% 60 1.4%
Indeterminate status† 456 17.7% 432 25.2% 888 20.7%
Total 2,580 100% 1,713 100% 4,293 100% †This includes those who do not have a SSN, and those who have been assigned a student ID number (for tracking within an institution) but
have not registered for a course.
Racially, SSA primary participants generally reflect the diversity of the overall population of community
college students. For example, 14% of primary participants are Black or African American, 16% are
Latino and 47% are White, while 13% of community college students are Black or African American,
18% are Latino and 54% are White.15
The racial makeup of the SSA and general student population
varied by site. The sites serving the highest proportion of Black or African American students were
Roxbury, Massasoit, Bunker Hill and Springfield Technical. The sites serving the highest proportion of
Latino or Hispanic students were Northern Essex, Holyoke, Roxbury, and Bunker Hill.
SSA primary participants are somewhat more likely to be male than the general community college
population. 51% of SSA primary participants are female and 49% are male while 59% of community
college students are female and 41% are male. There was some variation across sites. Five sites have SSA
primary participant gender compositions that are more than 50% female (Northern Essex, Middlesex,
Massasoit, Holyoke, and Cape Cod).
SSA participants’ gender compositions might compare more favorably to STEM students than to the
general community college student population; however current data about the gender composition of
STEM students at Massachusetts community colleges were not available for this report. Research on
women’s underrepresentation in STEM fields at community colleges suggests that the SSA participation
numbers are a positive initial indicator.16
At Massachusetts community colleges, as nationally, men have
earned the majority of certificates and associates degrees in almost every STEM field (exceptions are
health professions, science technologies and biological and biomedical sciences). When health
professions are excluded, 77% of STEM associates degrees and 80% of STEM certificates earned at
Massachusetts community colleges are awarded to men.17,18
15 Percentages are calculated out of the students who have race/ethnicity data included in HEIRS (including those whose race/ethnicity was reported as ―unknown‖) 16 See, for example Gatta. 2015. A Review of the Current Research on Women in Community College STEM Programs. Wider Opportunities for Women. http://www.wowonline.org/wp-content/uploads/2015/03/Women-in-CC-STEM-Programs-Brief-FINAL.pdf 17 National Center for Education Statistics, Integrated Postsecondary Education Data System, 2008-2009. 18 Note that SSA includes health professions among STEM fields, see footnote 9, above.
STEM Starter Academy Annual Evaluation Report, Year 2, January 2016 Participation
UMass Donahue Institute Applied Research & Program Evaluation
7
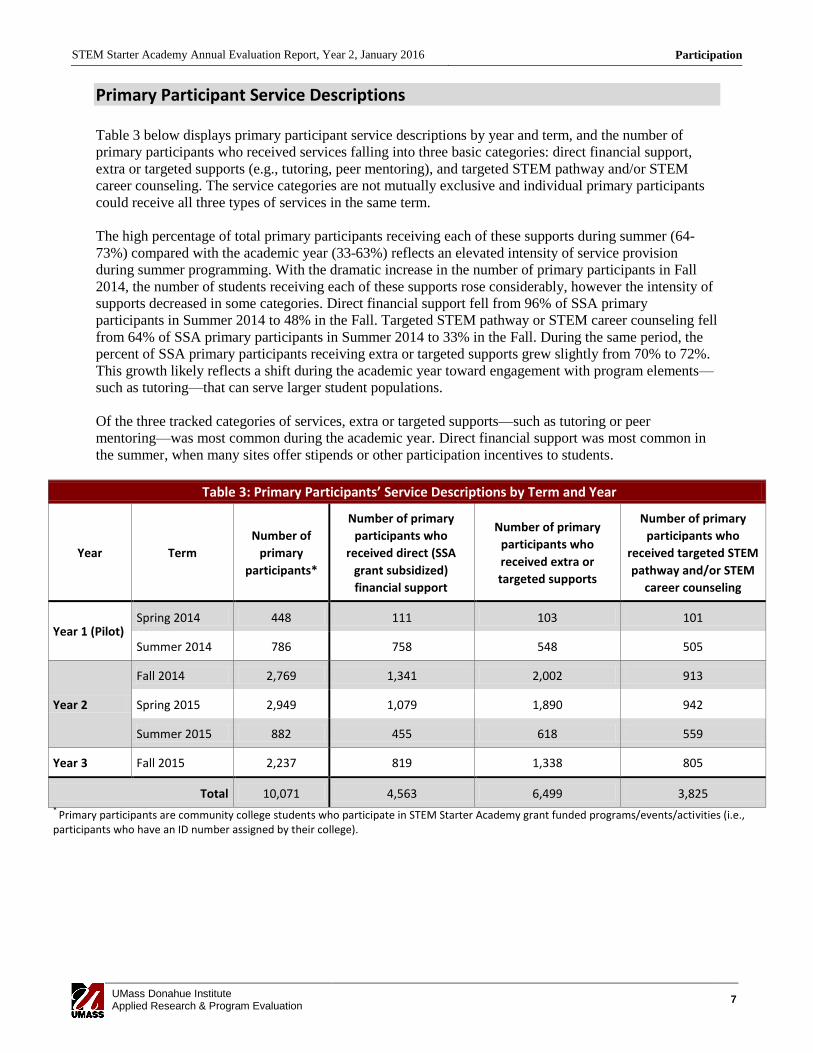
Primary Participant Service Descriptions
Table 3 below displays primary participant service descriptions by year and term, and the number of
primary participants who received services falling into three basic categories: direct financial support,
extra or targeted supports (e.g., tutoring, peer mentoring), and targeted STEM pathway and/or STEM
career counseling. The service categories are not mutually exclusive and individual primary participants
could receive all three types of services in the same term.
The high percentage of total primary participants receiving each of these supports during summer (64-
73%) compared with the academic year (33-63%) reflects an elevated intensity of service provision
during summer programming. With the dramatic increase in the number of primary participants in Fall
2014, the number of students receiving each of these supports rose considerably, however the intensity of
supports decreased in some categories. Direct financial support fell from 96% of SSA primary
participants in Summer 2014 to 48% in the Fall. Targeted STEM pathway or STEM career counseling fell
from 64% of SSA primary participants in Summer 2014 to 33% in the Fall. During the same period, the
percent of SSA primary participants receiving extra or targeted supports grew slightly from 70% to 72%.
This growth likely reflects a shift during the academic year toward engagement with program elements—
such as tutoring—that can serve larger student populations.
Of the three tracked categories of services, extra or targeted supports—such as tutoring or peer
mentoring—was most common during the academic year. Direct financial support was most common in
the summer, when many sites offer stipends or other participation incentives to students.
Table 3: Primary Participants’ Service Descriptions by Term and Year
Year Term
Number of
primary
participants*
Number of primary
participants who
received direct (SSA
grant subsidized)
financial support
Number of primary
participants who
received extra or
targeted supports
Number of primary
participants who
received targeted STEM
pathway and/or STEM
career counseling
Year 1 (Pilot) Spring 2014 448 111 103 101
Summer 2014 786 758 548 505
Year 2
Fall 2014 2,769 1,341 2,002 913
Spring 2015 2,949 1,079 1,890 942
Summer 2015 882 455 618 559
Year 3 Fall 2015 2,237 819 1,338 805
Total 10,071 4,563 6,499 3,825 *
Primary participants are community college students who participate in STEM Starter Academy grant funded programs/events/activities (i.e., participants who have an ID number assigned by their college).
STEM Starter Academy Annual Evaluation Report, Year 2, January 2016 Outcomes
UMass Donahue Institute Applied Research & Program Evaluation
8
Outcomes
This section presents data relevant to the metrics under each of the model’s two goals. The first section
summarizes findings relevant to completion and retention metrics (SSA model primary goal) and the
second section focuses on recruitment and readiness metrics (SSA model secondary goal).
Data for this section come predominantly from primary and secondary participant data submitted by sites
to DHE and combined with campus-level data from DHE’s Higher Education Information Resource
System (HEIRS). For more detailed data on SSA primary and secondary participants, including
institution-specific data, please see Appendix D.
The results presented here are preliminary. To date, no cohort of SSA participants (who are first-time,
full-time freshman in the Fall) has had the opportunity to complete (at least) two full years of courses. In
other words, we would not expect many SSA participants to have graduated at this point and thus, further
assessment of the program completion rates than what is presented here would be premature at this time.
Many of the indicators suggest positive trends, but are not directly comparable to figures available at the
statewide level and are thus presented as baseline measures to be used to track change over time. Where
direct comparisons are available to indicate outcomes for SSA participants compared to other
Massachusetts community college students, these are noted. In other cases, the most relevant state-level
data are presented, however it is important to note that these data are often not directly comparable to the
metrics presented. Finally, the results presented here show trends in the data, but do not reflect the
application of experimental or quasi-experimental design (i.e., we are not making claims about causality,
significance, or effect size). More rigorous designs will be applied during Year 3 to examine the effect of
SSA on relevant student outcomes.
STEM Starter Academy Annual Evaluation Report, Year 2, January 2016 Outcomes
UMass Donahue Institute Applied Research & Program Evaluation
9
Completion and Retention Metrics
SSA Model Goal: To increase the number of STEM graduates and certificate holders produced by the
community colleges and transfer to a 4-year university or obtain STEM employment.
Summary of Key Findings
Key Finding: SSA has supported retention, full-time enrollment, and engagement with STEM;
70% of SSA participants’ degrees and certificates were completed in STEM fields.
The majority of SSA primary participants who have—to date—earned degrees and
certificates did so in STEM fields. Overall, 70% of degrees and certificates completed by
SSA participants were in STEM fields. This is much higher than the statewide total of 45% of
below-bachelor’s certificates and degrees granted in STEM fields.19
Fall 2014 to Fall 2015 retention rates for SSA participants are similar to—but slightly
higher than—the overall retention rate for all Massachusetts community college students (60% vs 58% for full-time, first-time degree seeking students). This is the first cohort of SSA
participants for whom this data is available and this indicator will be one to watch in the future.
Across all SSA primary participants in Year 1 and Year 2, 67.7% had completed a degree or
certificate by July 2015, been retained to Fall 2015, or transferred to another Massachusetts
public higher education institution. Directly comparable figures at the statewide level were not
available for this report.
Full-time enrollment was 13 percentage points higher among SSA primary participants
than among the general community college student population. This is a positive initial
indication of SSA impact, as students enrolled full-time are more likely to retain and complete
than their part-time peers.
Data from Year 2 indicate that SSA has supported retention, full-time enrollment, and engagement with
STEM. The indicators presented below reflect metrics outlined in the SSA model for student success
outcomes. They highlight findings that are detailed in Tables 4-6.
Completion (Degree, Certificate, or Transfer)
The observed trends in program completion, transfer, and indeterminate status rates (which are
higher for older cohorts and lower for newer cohorts) were as anticipated, as was the trend for
rates of student retention (which was lower for older cohorts and higher for newer cohorts). See
Table 4.
As of Fall 2015, 425 degrees and certificates had been awarded to SSA students, and of these
70% were in STEM fields (see Table 5). According to the Massachusetts STEM Data Dashboard,
45% of below-bachelor’s certificates and degrees are granted in STEM fields statewide.20
In total, 61% of primary participants from Year 1 and 69% of primary participants from Year 2
have completed a degree or certificate, been retained to Fall 2015, or transferred to another
Massachusetts public higher education institution (see Table 4).
19 This figure includes both public and private schools in 2013. 2015 Massachusetts STEM Data Dashboard, http://www.mass.edu/stem/documents/2015%20STEM%20Data%20Dashboard%20FINAL.pdf 20 This figure includes both public and private schools in 2013. 2015 Massachusetts STEM Data Dashboard, http://www.mass.edu/stem/documents/2015%20STEM%20Data%20Dashboard%20FINAL.pdf
STEM Starter Academy Annual Evaluation Report, Year 2, January 2016 Outcomes
UMass Donahue Institute Applied Research & Program Evaluation
10
By Summer 2015, 5.8% of SSA primary participants across the 15 community colleges had
completed a degree or certificate (see Table 4). These numbers are not directly comparable to
state-level data. However, the most relevant data include typical on-time (2-year) completion
rates for degree-seeking community college students in Massachusetts: 4.4% for full-time
students and 1% for part-time students.21
As of Fall 2015, 4.7% of SSA primary participants had transferred to a public 4-year school (see
Table 4). These numbers are not directly comparable to state-level data. Transfer rates to private
and out-of-state colleges and universities are not yet available. However, the most relevant data
include the percent of Massachusetts community college students who enroll in a 4-year college
within three years of their starting term: 12.8% for full-time students and 4.1% for part-time
students.
Transfer rates of SSA students who had full-time, first-time degree seeking status in Fall 2014
were slightly lower than for all community college students (3.6% vs. 4.6%). See Table 6.
Retention
80.5% of SSA primary participants who were new to SSA in Summer 2015 continued at their
community college in Fall 2015 (see Table 4). Directly comparable figures at the statewide level
were not available for this report.
52% of SSA primary participants who were new to SSA in Fall 2014 remained enrolled at their
college in Fall 2015 (see Table 4). Directly comparable numbers are only available for full-time,
first-time degree seeking students – see next bullet.
When considering full-time, first-time degree seeking students, Fall 2014 to Fall 2015 retention
rates for SSA participants are similar to—but slightly higher than—the overall retention rate for
all Massachusetts community college students (60% vs 58%). See Table 6.
Insight: What is not known at this time is how similar or dissimilar SSA students are from the
general student population. Further analyses are needed to determine if—and to what extent—
SSA programs are impacting rates of student retention. These analyses (e.g., mixed-effect logistic
regression) are planned for the next phase of analysis, and results will be included in the Year 3
evaluation report.
21 Complete College America, Time is the Enemy, 2011, http://completecollege.org/docs/Time_Is_the_Enemy.pdf
STEM Starter Academy Annual Evaluation Report, Year 2, January 2016 Outcomes
UMass Donahue Institute Applied Research & Program Evaluation
11
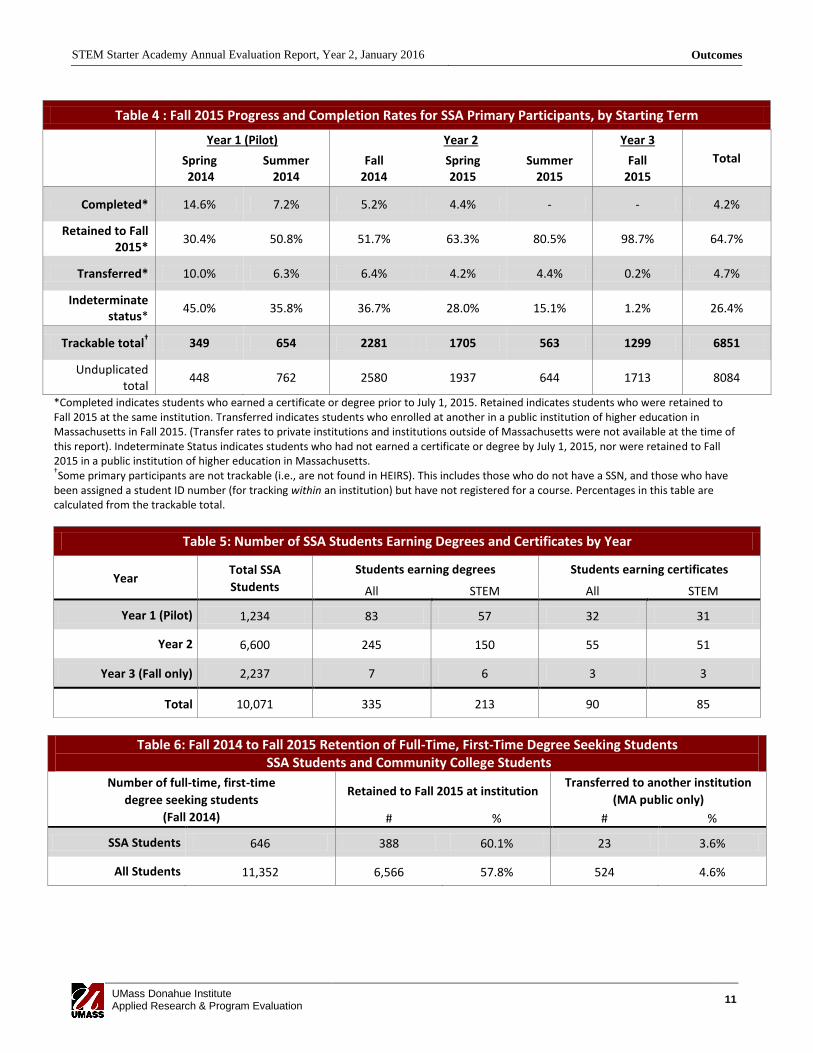
Table 4 : Fall 2015 Progress and Completion Rates for SSA Primary Participants, by Starting Term
Year 1 (Pilot) Year 2 Year 3
Total Spring 2014
Summer 2014
Fall 2014
Spring 2015
Summer 2015
Fall 2015
Completed* 14.6% 7.2% 5.2% 4.4% - - 4.2%
Retained to Fall 2015*
30.4% 50.8% 51.7% 63.3% 80.5% 98.7% 64.7%
Transferred* 10.0% 6.3% 6.4% 4.2% 4.4% 0.2% 4.7%
Indeterminate status*
45.0% 35.8% 36.7% 28.0% 15.1% 1.2% 26.4%
Trackable total† 349 654 2281 1705 563 1299 6851
Unduplicated total
448 762 2580 1937 644 1713 8084
*Completed indicates students who earned a certificate or degree prior to July 1, 2015. Retained indicates students who were retained to Fall 2015 at the same institution. Transferred indicates students who enrolled at another in a public institution of higher education in Massachusetts in Fall 2015. (Transfer rates to private institutions and institutions outside of Massachusetts were not available at the time of this report). Indeterminate Status indicates students who had not earned a certificate or degree by July 1, 2015, nor were retained to Fall 2015 in a public institution of higher education in Massachusetts. †Some primary participants are not trackable (i.e., are not found in HEIRS). This includes those who do not have a SSN, and those who have
been assigned a student ID number (for tracking within an institution) but have not registered for a course. Percentages in this table are calculated from the trackable total.
Table 5: Number of SSA Students Earning Degrees and Certificates by Year
Year Total SSA
Students
Students earning degrees Students earning certificates
All STEM All STEM
Year 1 (Pilot) 1,234 83 57 32 31
Year 2 6,600 245 150 55 51
Year 3 (Fall only) 2,237 7 6 3 3
Total 10,071 335 213 90 85
Table 6: Fall 2014 to Fall 2015 Retention of Full-Time, First-Time Degree Seeking Students SSA Students and Community College Students
Number of full-time, first-time
degree seeking students
(Fall 2014)
Retained to Fall 2015 at institution Transferred to another institution
(MA public only)
# % # %
SSA Students 646 388 60.1% 23 3.6%
All Students 11,352 6,566 57.8% 524 4.6%
STEM Starter Academy Annual Evaluation Report, Year 2, January 2016 Outcomes
UMass Donahue Institute Applied Research & Program Evaluation
12
Recruitment and Readiness Metrics
SSA Model Goal: To increase the number of students entering STEM programs at the community
colleges.
Summary of Key Findings
Key Finding: SSA continues to attract new participants.
SSA programs continued to attract new participants in Year 2. Over the course of the year,
5,161 primary participants were supported by SSA for the first time, about half of whom were
new to their institutions and half who were continuing students. While the count of secondary
participants is high, preliminary evidence suggests that relatively few of them (4.2%) later
become primary participants. This may present an opportunity to enhance recruitment efforts,
and may also be a function of sites’ limited ability to track recruitment efforts.
Key Finding: SSA is accelerating engagement in and completion of developmental math, leading
to participation in college level math.
SSA participants who complete developmental math move on to college-level math classes.
Of the 197 SSA primary participants who engaged in a developmental math intervention (e.g.,
courses, workshops, and bootcamps) in Summer 2015, 80 (40%) fulfilled all developmental math
requirements for their institution by the end of that term and 60 (75%) of those subsequently
enrolled in a college-level math class for Fall 2015. Statewide, only 20% of community college
students who complete developmental math coursework go on to complete a college level math
course within two years, so the high rate of college-level math enrollment among SSA
participants is a positive initial indicator.22
The indicators presented below reflect metrics outlined in the SSA model. They summarize findings that
are detailed in Tables 7-9. For more detailed data, including institution-specific findings, please see
Appendix D.
Recruitment
Each term 65-93% of SSA primary participants were new to the intervention and 5,161 primary
participants were supported by SSA for the first time in Year 2.
8,501 secondary participants were reached in Year 2 through activities and events such as open
houses, STEM career and college events, visits to high schools, and hands-on career exploration
days. 252 total events were held in Year 2. The average number of participants per event was
similar in Year2 to Year 1 (33.7 in Year2 and 37.0 in Year 1). See Table 7.
Insight: 9c funding cuts likely impacted recruitment efforts in Year 2. The number of secondary
participants, averaged across terms, is distinctly lower in Year 2 than in Year1 and also lower
than preliminarily indicated by one term of Year 3.
Across all sites and terms, 699 primary participants were reported as former secondary
participants. These represent 4.2% of all secondary participants (through Summer 2015) and 7%
of all primary participants.
Insight: These low yields, despite the relatively high rates of new participation cited above,
suggest issues with measurement in addition to or instead of issues with recruitment. Sites
commented on the difficulty of identifying former secondary participants (about whom individual
22 Vision Project, Final Report from the Task Force on Transforming Developmental Math Education, October 2013
STEM Starter Academy Annual Evaluation Report, Year 2, January 2016 Outcomes
UMass Donahue Institute Applied Research & Program Evaluation
13
data is often impractical to collect) when they first receive SSA supports as primary participants.
The low proportions reported here might be an indication of low recruitment effectiveness, but
might also suggest that sites are struggling to measure and track their recruitment yields. Future
evaluation efforts will provide more information about these issues.
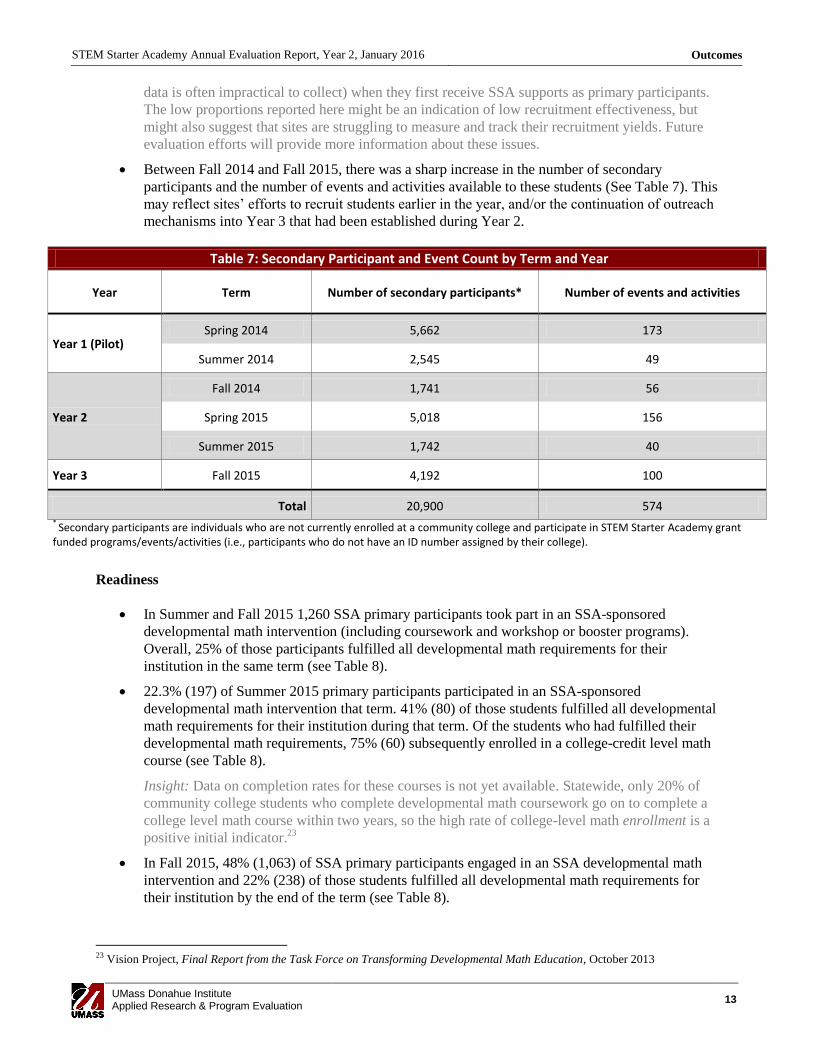
Between Fall 2014 and Fall 2015, there was a sharp increase in the number of secondary
participants and the number of events and activities available to these students (See Table 7). This
may reflect sites’ efforts to recruit students earlier in the year, and/or the continuation of outreach
mechanisms into Year 3 that had been established during Year 2.
Table 7: Secondary Participant and Event Count by Term and Year
Year Term Number of secondary participants* Number of events and activities
Year 1 (Pilot) Spring 2014 5,662 173
Summer 2014 2,545 49
Year 2
Fall 2014 1,741 56
Spring 2015 5,018 156
Summer 2015 1,742 40
Year 3 Fall 2015 4,192 100
Total 20,900 574 *
Secondary participants are individuals who are not currently enrolled at a community college and participate in STEM Starter Academy grant funded programs/events/activities (i.e., participants who do not have an ID number assigned by their college).
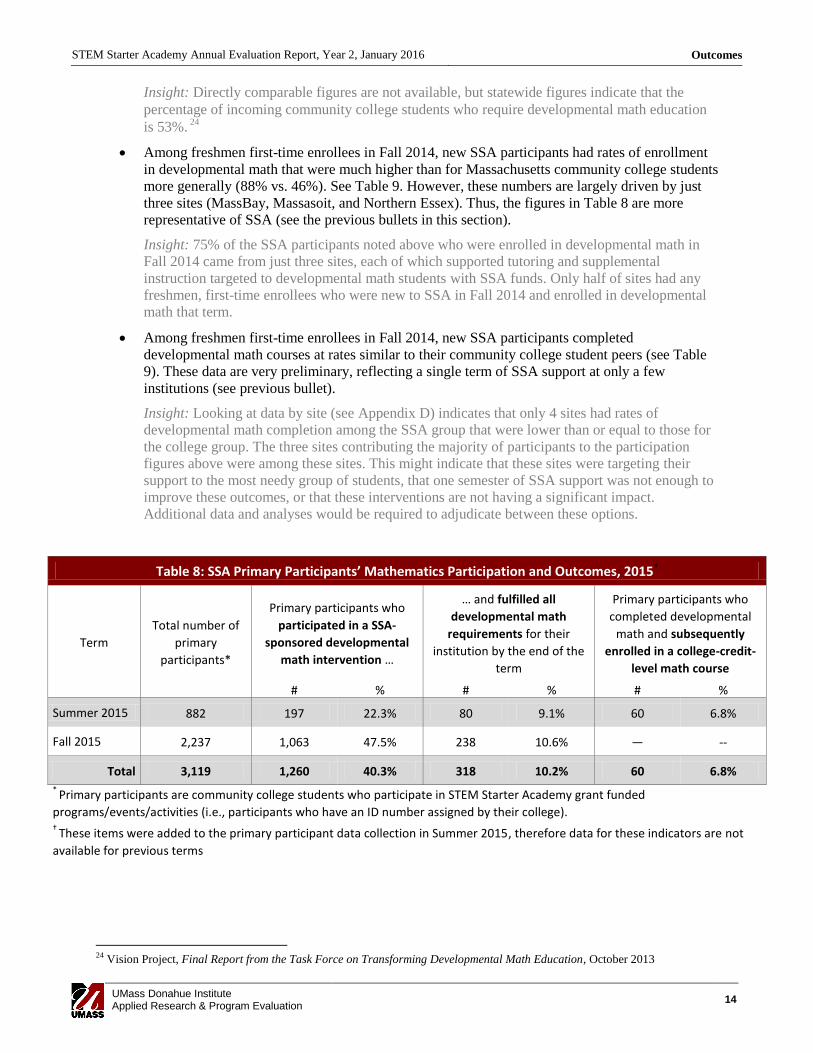
Readiness
In Summer and Fall 2015 1,260 SSA primary participants took part in an SSA-sponsored
developmental math intervention (including coursework and workshop or booster programs).
Overall, 25% of those participants fulfilled all developmental math requirements for their
institution in the same term (see Table 8).
22.3% (197) of Summer 2015 primary participants participated in an SSA-sponsored
developmental math intervention that term. 41% (80) of those students fulfilled all developmental
math requirements for their institution during that term. Of the students who had fulfilled their
developmental math requirements, 75% (60) subsequently enrolled in a college-credit level math
course (see Table 8).
Insight: Data on completion rates for these courses is not yet available. Statewide, only 20% of
community college students who complete developmental math coursework go on to complete a
college level math course within two years, so the high rate of college-level math enrollment is a
positive initial indicator.23
In Fall 2015, 48% (1,063) of SSA primary participants engaged in an SSA developmental math
intervention and 22% (238) of those students fulfilled all developmental math requirements for
their institution by the end of the term (see Table 8).
23 Vision Project, Final Report from the Task Force on Transforming Developmental Math Education, October 2013
STEM Starter Academy Annual Evaluation Report, Year 2, January 2016 Outcomes
UMass Donahue Institute Applied Research & Program Evaluation
14
Insight: Directly comparable figures are not available, but statewide figures indicate that the
percentage of incoming community college students who require developmental math education
is 53%. 24
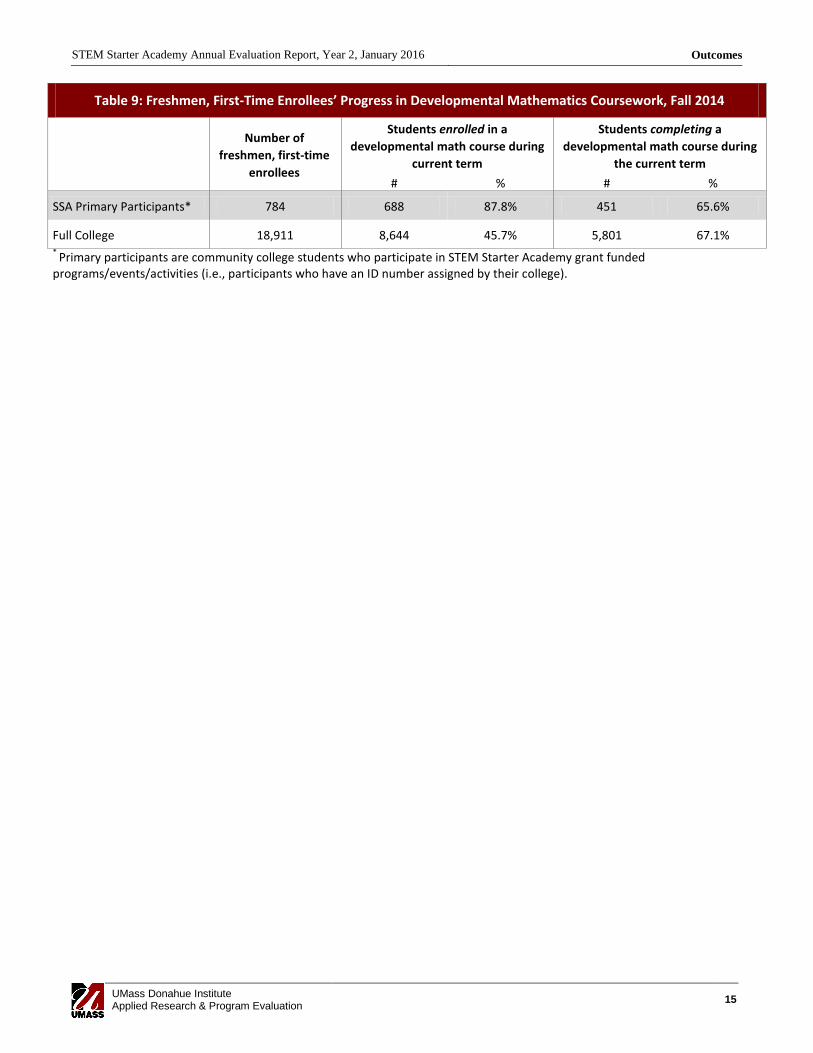
Among freshmen first-time enrollees in Fall 2014, new SSA participants had rates of enrollment
in developmental math that were much higher than for Massachusetts community college students
more generally (88% vs. 46%). See Table 9. However, these numbers are largely driven by just
three sites (MassBay, Massasoit, and Northern Essex). Thus, the figures in Table 8 are more
representative of SSA (see the previous bullets in this section).
Insight: 75% of the SSA participants noted above who were enrolled in developmental math in
Fall 2014 came from just three sites, each of which supported tutoring and supplemental
instruction targeted to developmental math students with SSA funds. Only half of sites had any
freshmen, first-time enrollees who were new to SSA in Fall 2014 and enrolled in developmental
math that term.
Among freshmen first-time enrollees in Fall 2014, new SSA participants completed
developmental math courses at rates similar to their community college student peers (see Table
9). These data are very preliminary, reflecting a single term of SSA support at only a few
institutions (see previous bullet).
Insight: Looking at data by site (see Appendix D) indicates that only 4 sites had rates of
developmental math completion among the SSA group that were lower than or equal to those for
the college group. The three sites contributing the majority of participants to the participation
figures above were among these sites. This might indicate that these sites were targeting their
support to the most needy group of students, that one semester of SSA support was not enough to
improve these outcomes, or that these interventions are not having a significant impact.
Additional data and analyses would be required to adjudicate between these options.
Table 8: SSA Primary Participants’ Mathematics Participation and Outcomes, 2015†
Term
Total number of
primary
participants*
Primary participants who
participated in a SSA-
sponsored developmental
math intervention …
… and fulfilled all
developmental math
requirements for their
institution by the end of the
term
Primary participants who
completed developmental
math and subsequently
enrolled in a college-credit-
level math course
# % # % # %
Summer 2015 882 197 22.3% 80 9.1% 60 6.8%
Fall 2015 2,237 1,063 47.5% 238 10.6% — --
Total 3,119 1,260 40.3% 318 10.2% 60 6.8%
* Primary participants are community college students who participate in STEM Starter Academy grant funded
programs/events/activities (i.e., participants who have an ID number assigned by their college). †
These items were added to the primary participant data collection in Summer 2015, therefore data for these indicators are not
available for previous terms
24 Vision Project, Final Report from the Task Force on Transforming Developmental Math Education, October 2013
STEM Starter Academy Annual Evaluation Report, Year 2, January 2016 Outcomes
UMass Donahue Institute Applied Research & Program Evaluation
15
Table 9: Freshmen, First-Time Enrollees’ Progress in Developmental Mathematics Coursework, Fall 2014
Number of
freshmen, first-time
enrollees
Students enrolled in a
developmental math course during
current term
Students completing a
developmental math course during
the current term
# % # %
SSA Primary Participants* 784 688 87.8% 451 65.6%
Full College 18,911 8,644 45.7% 5,801 67.1% *
Primary participants are community college students who participate in STEM Starter Academy grant funded programs/events/activities (i.e., participants who have an ID number assigned by their college).
STEM Starter Academy Annual Evaluation Report, Year 2, January 2016 Program Practices
UMass Donahue Institute Applied Research & Program Evaluation
16
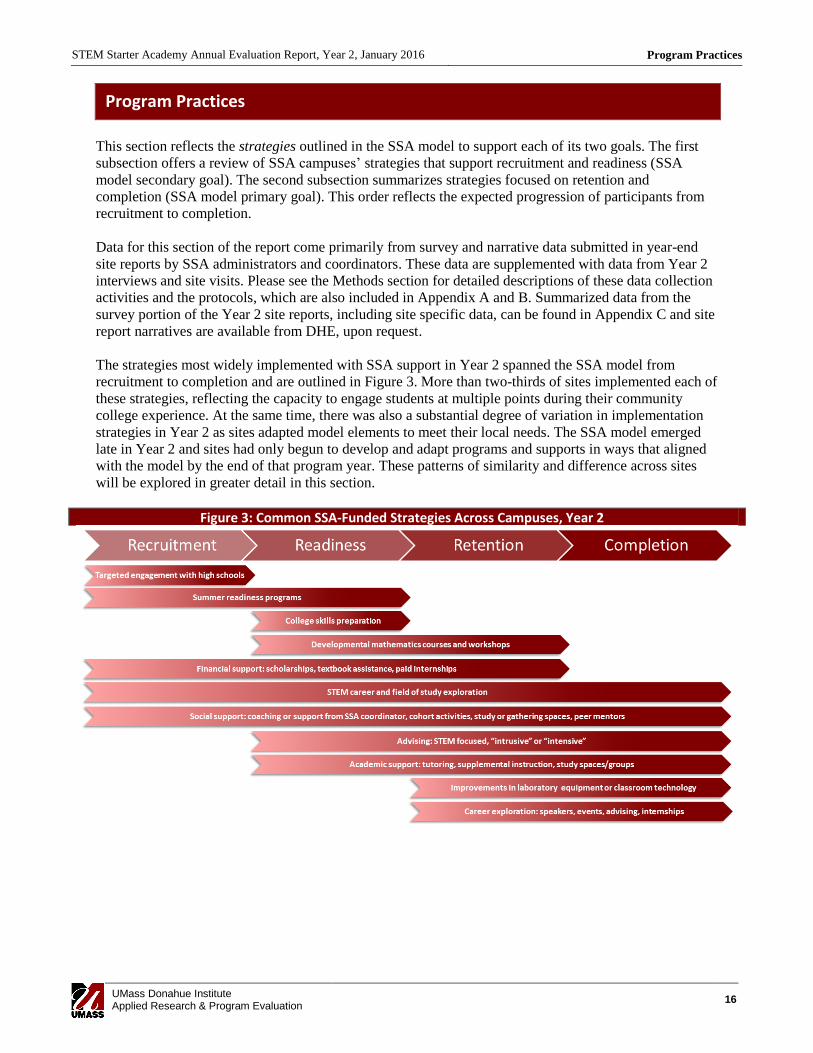
Program Practices
This section reflects the strategies outlined in the SSA model to support each of its two goals. The first
subsection offers a review of SSA campuses’ strategies that support recruitment and readiness (SSA
model secondary goal). The second subsection summarizes strategies focused on retention and
completion (SSA model primary goal). This order reflects the expected progression of participants from
recruitment to completion.
Data for this section of the report come primarily from survey and narrative data submitted in year-end
site reports by SSA administrators and coordinators. These data are supplemented with data from Year 2
interviews and site visits. Please see the Methods section for detailed descriptions of these data collection
activities and the protocols, which are also included in Appendix A and B. Summarized data from the
survey portion of the Year 2 site reports, including site specific data, can be found in Appendix C and site
report narratives are available from DHE, upon request.
The strategies most widely implemented with SSA support in Year 2 spanned the SSA model from
recruitment to completion and are outlined in Figure 3. More than two-thirds of sites implemented each of
these strategies, reflecting the capacity to engage students at multiple points during their community
college experience. At the same time, there was also a substantial degree of variation in implementation
strategies in Year 2 as sites adapted model elements to meet their local needs. The SSA model emerged
late in Year 2 and sites had only begun to develop and adapt programs and supports in ways that aligned
with the model by the end of that program year. These patterns of similarity and difference across sites
will be explored in greater detail in this section.
Figure 3: Common SSA-Funded Strategies Across Campuses, Year 2
STEM Starter Academy Annual Evaluation Report, Year 2, January 2016 Program Practices
UMass Donahue Institute Applied Research & Program Evaluation
17
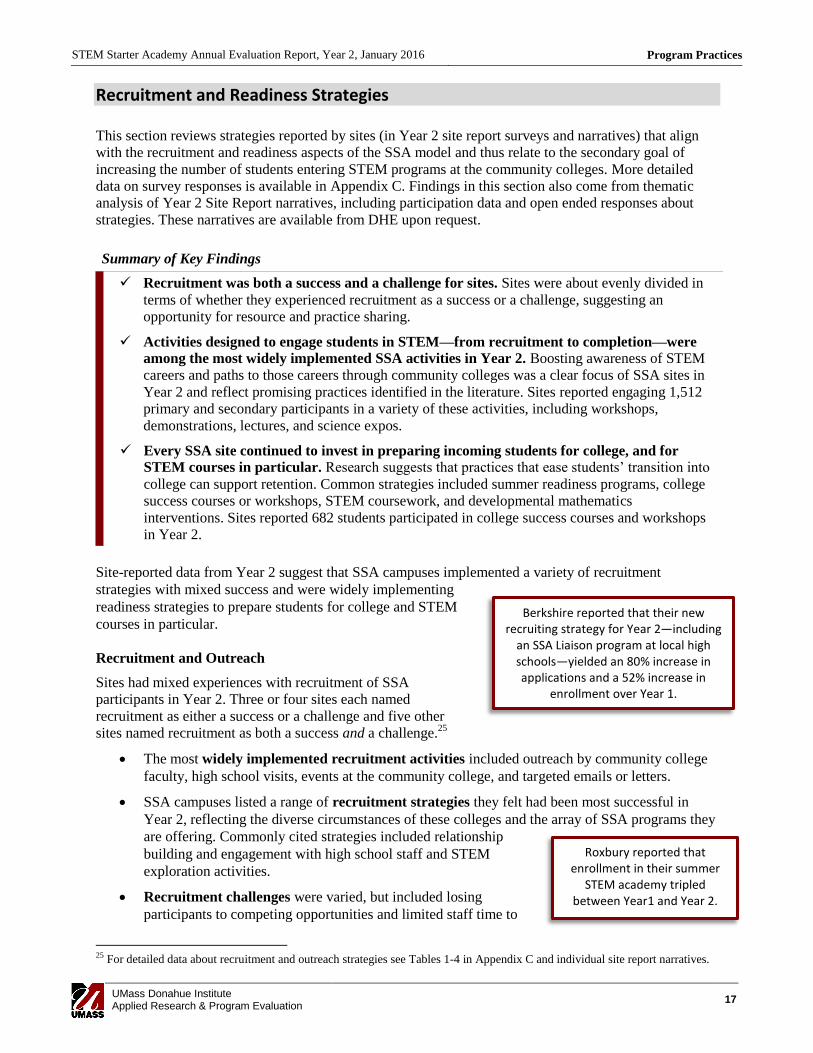
Berkshire reported that their new recruiting strategy for Year 2—including
an SSA Liaison program at local high schools—yielded an 80% increase in applications and a 52% increase in
enrollment over Year 1.
Roxbury reported that enrollment in their summer
STEM academy tripled between Year1 and Year 2.
Recruitment and Readiness Strategies
This section reviews strategies reported by sites (in Year 2 site report surveys and narratives) that align
with the recruitment and readiness aspects of the SSA model and thus relate to the secondary goal of
increasing the number of students entering STEM programs at the community colleges. More detailed
data on survey responses is available in Appendix C. Findings in this section also come from thematic
analysis of Year 2 Site Report narratives, including participation data and open ended responses about
strategies. These narratives are available from DHE upon request.
Summary of Key Findings
Recruitment was both a success and a challenge for sites. Sites were about evenly divided in
terms of whether they experienced recruitment as a success or a challenge, suggesting an
opportunity for resource and practice sharing.
Activities designed to engage students in STEM—from recruitment to completion—were
among the most widely implemented SSA activities in Year 2. Boosting awareness of STEM
careers and paths to those careers through community colleges was a clear focus of SSA sites in
Year 2 and reflect promising practices identified in the literature. Sites reported engaging 1,512
primary and secondary participants in a variety of these activities, including workshops,
demonstrations, lectures, and science expos.
Every SSA site continued to invest in preparing incoming students for college, and for
STEM courses in particular. Research suggests that practices that ease students’ transition into
college can support retention. Common strategies included summer readiness programs, college
success courses or workshops, STEM coursework, and developmental mathematics
interventions. Sites reported 682 students participated in college success courses and workshops
in Year 2.
Site-reported data from Year 2 suggest that SSA campuses implemented a variety of recruitment
strategies with mixed success and were widely implementing
readiness strategies to prepare students for college and STEM
courses in particular.
Recruitment and Outreach
Sites had mixed experiences with recruitment of SSA
participants in Year 2. Three or four sites each named
recruitment as either a success or a challenge and five other
sites named recruitment as both a success and a challenge.25
The most widely implemented recruitment activities included outreach by community college
faculty, high school visits, events at the community college, and targeted emails or letters.
SSA campuses listed a range of recruitment strategies they felt had been most successful in
Year 2, reflecting the diverse circumstances of these colleges and the array of SSA programs they
are offering. Commonly cited strategies included relationship
building and engagement with high school staff and STEM
exploration activities.
Recruitment challenges were varied, but included losing
participants to competing opportunities and limited staff time to
25 For detailed data about recruitment and outreach strategies see Tables 1-4 in Appendix C and individual site report narratives.
STEM Starter Academy Annual Evaluation Report, Year 2, January 2016 Program Practices
UMass Donahue Institute Applied Research & Program Evaluation
18
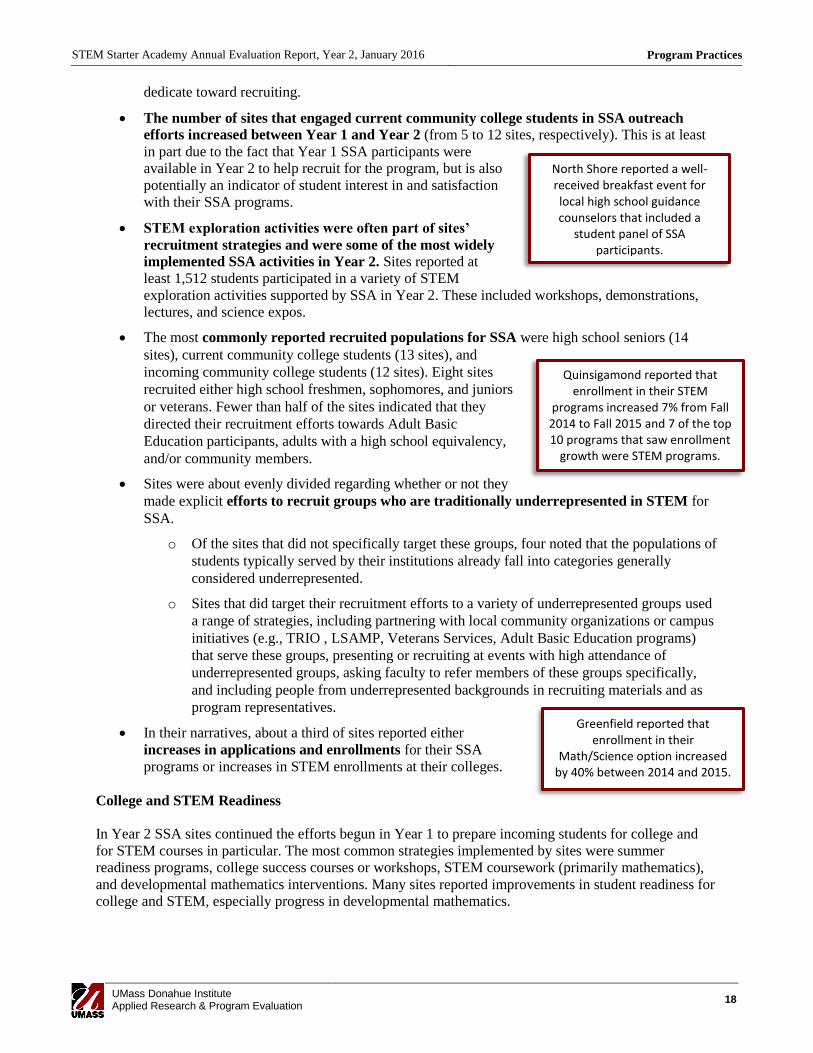
Greenfield reported that enrollment in their
Math/Science option increased by 40% between 2014 and 2015.
North Shore reported a well-received breakfast event for local high school guidance counselors that included a
student panel of SSA participants.
Quinsigamond reported that enrollment in their STEM
programs increased 7% from Fall 2014 to Fall 2015 and 7 of the top 10 programs that saw enrollment
growth were STEM programs.
dedicate toward recruiting.
The number of sites that engaged current community college students in SSA outreach
efforts increased between Year 1 and Year 2 (from 5 to 12 sites, respectively). This is at least
in part due to the fact that Year 1 SSA participants were
available in Year 2 to help recruit for the program, but is also
potentially an indicator of student interest in and satisfaction
with their SSA programs.
STEM exploration activities were often part of sites’
recruitment strategies and were some of the most widely
implemented SSA activities in Year 2. Sites reported at
least 1,512 students participated in a variety of STEM
exploration activities supported by SSA in Year 2. These included workshops, demonstrations,
lectures, and science expos.
The most commonly reported recruited populations for SSA were high school seniors (14
sites), current community college students (13 sites), and
incoming community college students (12 sites). Eight sites
recruited either high school freshmen, sophomores, and juniors
or veterans. Fewer than half of the sites indicated that they
directed their recruitment efforts towards Adult Basic
Education participants, adults with a high school equivalency,
and/or community members.
Sites were about evenly divided regarding whether or not they
made explicit efforts to recruit groups who are traditionally underrepresented in STEM for
SSA.
o Of the sites that did not specifically target these groups, four noted that the populations of
students typically served by their institutions already fall into categories generally
considered underrepresented.
o Sites that did target their recruitment efforts to a variety of underrepresented groups used
a range of strategies, including partnering with local community organizations or campus
initiatives (e.g., TRIO , LSAMP, Veterans Services, Adult Basic Education programs)
that serve these groups, presenting or recruiting at events with high attendance of
underrepresented groups, asking faculty to refer members of these groups specifically,
and including people from underrepresented backgrounds in recruiting materials and as
program representatives.
In their narratives, about a third of sites reported either
increases in applications and enrollments for their SSA
programs or increases in STEM enrollments at their colleges.
College and STEM Readiness
In Year 2 SSA sites continued the efforts begun in Year 1 to prepare incoming students for college and
for STEM courses in particular. The most common strategies implemented by sites were summer
readiness programs, college success courses or workshops, STEM coursework (primarily mathematics),
and developmental mathematics interventions. Many sites reported improvements in student readiness for
college and STEM, especially progress in developmental mathematics.
STEM Starter Academy Annual Evaluation Report, Year 2, January 2016 Program Practices
UMass Donahue Institute Applied Research & Program Evaluation
19
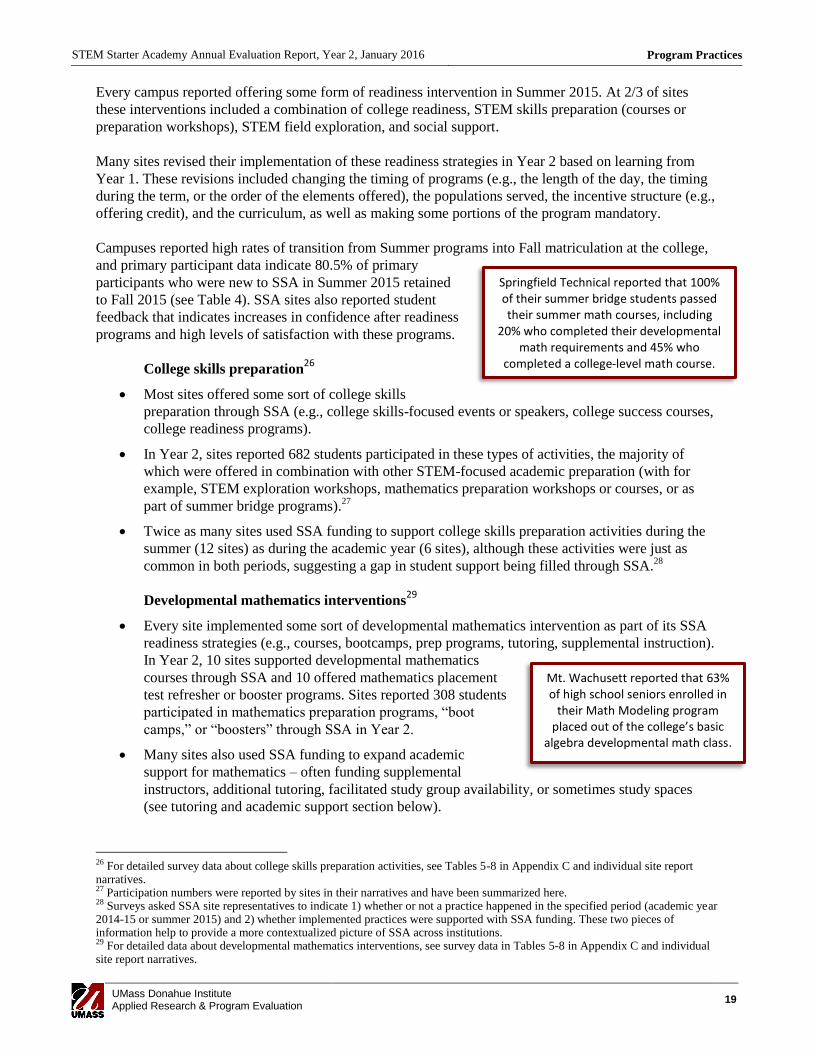
Mt. Wachusett reported that 63% of high school seniors enrolled in
their Math Modeling program placed out of the college’s basic
algebra developmental math class.
Springfield Technical reported that 100% of their summer bridge students passed their summer math courses, including
20% who completed their developmental math requirements and 45% who
completed a college-level math course.
Every campus reported offering some form of readiness intervention in Summer 2015. At 2/3 of sites
these interventions included a combination of college readiness, STEM skills preparation (courses or
preparation workshops), STEM field exploration, and social support.
Many sites revised their implementation of these readiness strategies in Year 2 based on learning from
Year 1. These revisions included changing the timing of programs (e.g., the length of the day, the timing
during the term, or the order of the elements offered), the populations served, the incentive structure (e.g.,
offering credit), and the curriculum, as well as making some portions of the program mandatory.
Campuses reported high rates of transition from Summer programs into Fall matriculation at the college,
and primary participant data indicate 80.5% of primary
participants who were new to SSA in Summer 2015 retained
to Fall 2015 (see Table 4). SSA sites also reported student
feedback that indicates increases in confidence after readiness
programs and high levels of satisfaction with these programs.
College skills preparation26
Most sites offered some sort of college skills
preparation through SSA (e.g., college skills-focused events or speakers, college success courses,
college readiness programs).
In Year 2, sites reported 682 students participated in these types of activities, the majority of
which were offered in combination with other STEM-focused academic preparation (with for
example, STEM exploration workshops, mathematics preparation workshops or courses, or as
part of summer bridge programs).27
Twice as many sites used SSA funding to support college skills preparation activities during the
summer (12 sites) as during the academic year (6 sites), although these activities were just as
common in both periods, suggesting a gap in student support being filled through SSA.28
Developmental mathematics interventions29
Every site implemented some sort of developmental mathematics intervention as part of its SSA
readiness strategies (e.g., courses, bootcamps, prep programs, tutoring, supplemental instruction).
In Year 2, 10 sites supported developmental mathematics
courses through SSA and 10 offered mathematics placement
test refresher or booster programs. Sites reported 308 students
participated in mathematics preparation programs, ―boot
camps,‖ or ―boosters‖ through SSA in Year 2.
Many sites also used SSA funding to expand academic
support for mathematics – often funding supplemental
instructors, additional tutoring, facilitated study group availability, or sometimes study spaces
(see tutoring and academic support section below).
26 For detailed survey data about college skills preparation activities, see Tables 5-8 in Appendix C and individual site report narratives. 27 Participation numbers were reported by sites in their narratives and have been summarized here. 28 Surveys asked SSA site representatives to indicate 1) whether or not a practice happened in the specified period (academic year 2014-15 or summer 2015) and 2) whether implemented practices were supported with SSA funding. These two pieces of information help to provide a more contextualized picture of SSA across institutions. 29 For detailed data about developmental mathematics interventions, see survey data in Tables 5-8 in Appendix C and individual site report narratives.
STEM Starter Academy Annual Evaluation Report, Year 2, January 2016 Program Practices
UMass Donahue Institute Applied Research & Program Evaluation
20
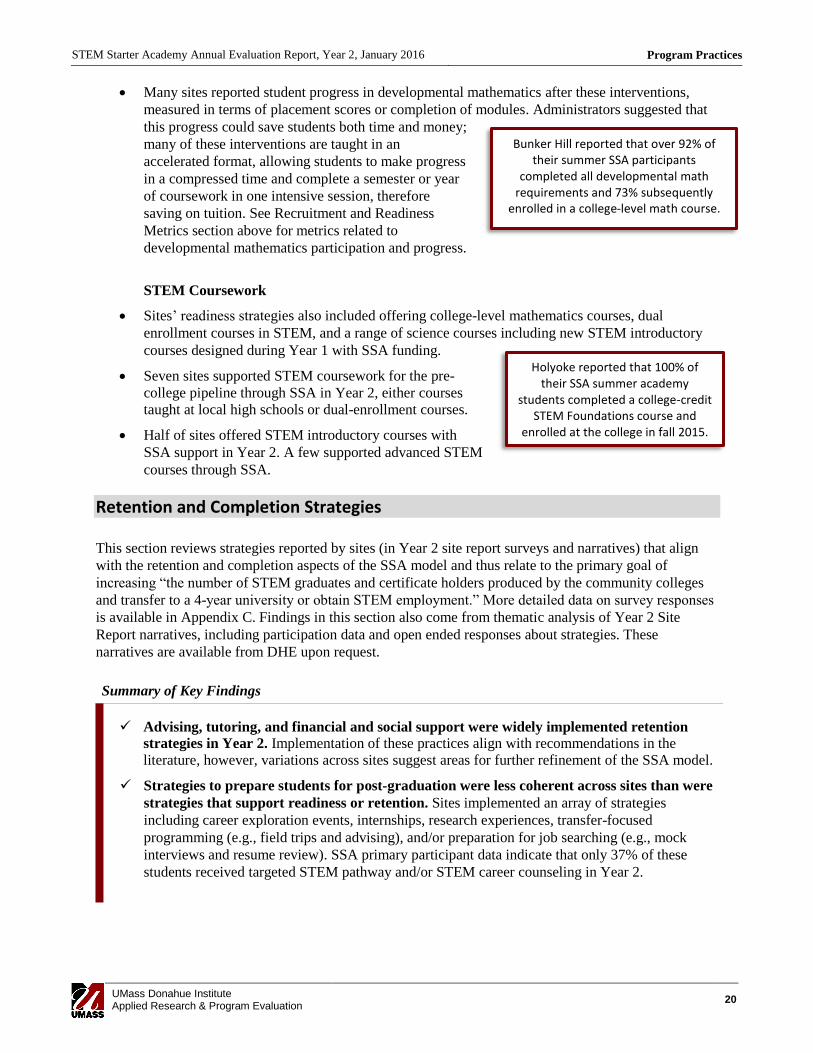
Bunker Hill reported that over 92% of their summer SSA participants
completed all developmental math requirements and 73% subsequently
enrolled in a college-level math course.
Holyoke reported that 100% of their SSA summer academy
students completed a college-credit STEM Foundations course and
enrolled at the college in fall 2015.
Many sites reported student progress in developmental mathematics after these interventions,
measured in terms of placement scores or completion of modules. Administrators suggested that
this progress could save students both time and money;
many of these interventions are taught in an
accelerated format, allowing students to make progress
in a compressed time and complete a semester or year
of coursework in one intensive session, therefore
saving on tuition. See Recruitment and Readiness
Metrics section above for metrics related to
developmental mathematics participation and progress.
STEM Coursework
Sites’ readiness strategies also included offering college-level mathematics courses, dual
enrollment courses in STEM, and a range of science courses including new STEM introductory
courses designed during Year 1 with SSA funding.
Seven sites supported STEM coursework for the pre-
college pipeline through SSA in Year 2, either courses
taught at local high schools or dual-enrollment courses.
Half of sites offered STEM introductory courses with
SSA support in Year 2. A few supported advanced STEM
courses through SSA.
Retention and Completion Strategies
This section reviews strategies reported by sites (in Year 2 site report surveys and narratives) that align
with the retention and completion aspects of the SSA model and thus relate to the primary goal of
increasing ―the number of STEM graduates and certificate holders produced by the community colleges
and transfer to a 4-year university or obtain STEM employment.‖ More detailed data on survey responses
is available in Appendix C. Findings in this section also come from thematic analysis of Year 2 Site
Report narratives, including participation data and open ended responses about strategies. These
narratives are available from DHE upon request.
Summary of Key Findings
Advising, tutoring, and financial and social support were widely implemented retention
strategies in Year 2. Implementation of these practices align with recommendations in the
literature, however, variations across sites suggest areas for further refinement of the SSA model.
Strategies to prepare students for post-graduation were less coherent across sites than were
strategies that support readiness or retention. Sites implemented an array of strategies
including career exploration events, internships, research experiences, transfer-focused
programming (e.g., field trips and advising), and/or preparation for job searching (e.g., mock
interviews and resume review). SSA primary participant data indicate that only 37% of these
students received targeted STEM pathway and/or STEM career counseling in Year 2.
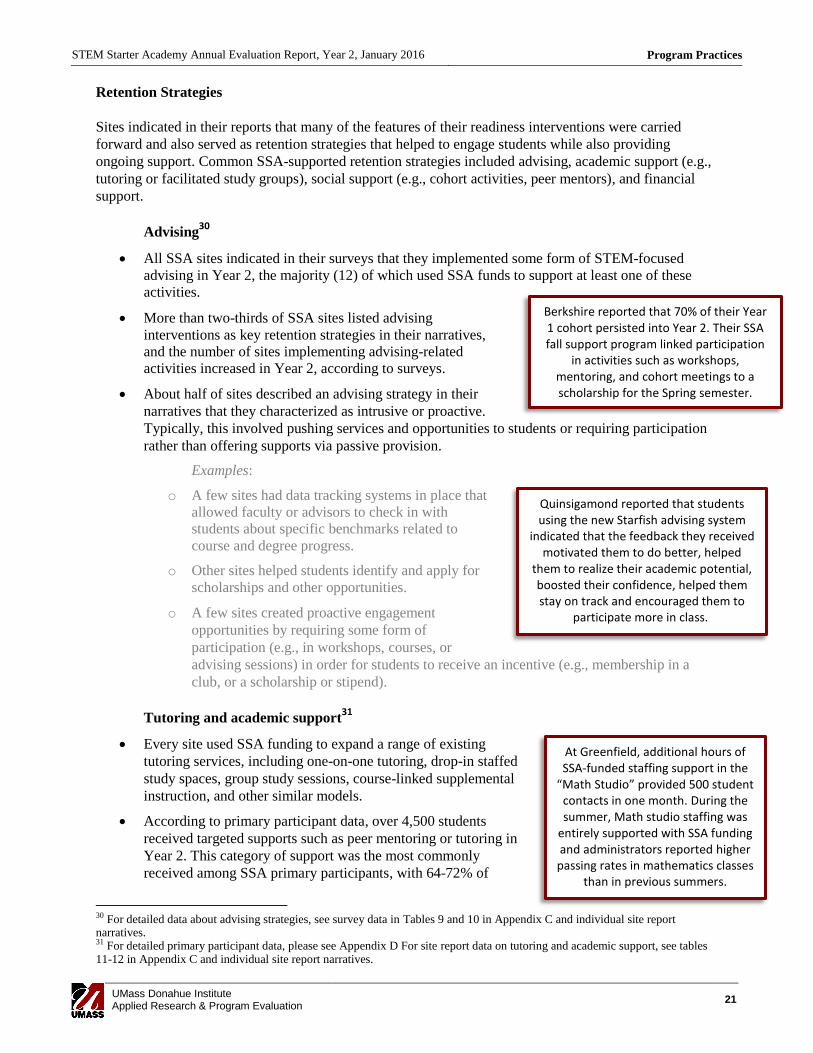
STEM Starter Academy Annual Evaluation Report, Year 2, January 2016 Program Practices
UMass Donahue Institute Applied Research & Program Evaluation
21
Quinsigamond reported that students using the new Starfish advising system
indicated that the feedback they received motivated them to do better, helped
them to realize their academic potential, boosted their confidence, helped them stay on track and encouraged them to
participate more in class.
At Greenfield, additional hours of SSA-funded staffing support in the
“Math Studio” provided 500 student contacts in one month. During the summer, Math studio staffing was
entirely supported with SSA funding and administrators reported higher
passing rates in mathematics classes than in previous summers.
Berkshire reported that 70% of their Year 1 cohort persisted into Year 2. Their SSA fall support program linked participation
in activities such as workshops, mentoring, and cohort meetings to a scholarship for the Spring semester.
Retention Strategies
Sites indicated in their reports that many of the features of their readiness interventions were carried
forward and also served as retention strategies that helped to engage students while also providing
ongoing support. Common SSA-supported retention strategies included advising, academic support (e.g.,
tutoring or facilitated study groups), social support (e.g., cohort activities, peer mentors), and financial
support.
Advising30
All SSA sites indicated in their surveys that they implemented some form of STEM-focused
advising in Year 2, the majority (12) of which used SSA funds to support at least one of these
activities.
More than two-thirds of SSA sites listed advising
interventions as key retention strategies in their narratives,
and the number of sites implementing advising-related
activities increased in Year 2, according to surveys.
About half of sites described an advising strategy in their
narratives that they characterized as intrusive or proactive.
Typically, this involved pushing services and opportunities to students or requiring participation
rather than offering supports via passive provision.
Examples:
o A few sites had data tracking systems in place that
allowed faculty or advisors to check in with
students about specific benchmarks related to
course and degree progress.
o Other sites helped students identify and apply for
scholarships and other opportunities.
o A few sites created proactive engagement
opportunities by requiring some form of
participation (e.g., in workshops, courses, or
advising sessions) in order for students to receive an incentive (e.g., membership in a
club, or a scholarship or stipend).
Tutoring and academic support31
Every site used SSA funding to expand a range of existing
tutoring services, including one-on-one tutoring, drop-in staffed
study spaces, group study sessions, course-linked supplemental
instruction, and other similar models.
According to primary participant data, over 4,500 students
received targeted supports such as peer mentoring or tutoring in
Year 2. This category of support was the most commonly
received among SSA primary participants, with 64-72% of
30 For detailed data about advising strategies, see survey data in Tables 9 and 10 in Appendix C and individual site report narratives. 31 For detailed primary participant data, please see Appendix D For site report data on tutoring and academic support, see tables 11-12 in Appendix C and individual site report narratives.
STEM Starter Academy Annual Evaluation Report, Year 2, January 2016 Program Practices
UMass Donahue Institute Applied Research & Program Evaluation
22
North Shore developed and expanded their peer mentoring
program in Year 2—offering over 350 students both social and
academic support.
The peer mentor program at Middlesex continued to receive praise in Year 2,
with college staff commenting on students’ “transformation” as a result
of the program.
Northern Essex offered retention scholarships and lending library
support to students through SSA. The college reported 87.5% of students
who were awarded retention scholarships either graduated or re-
enrolled for another semester.
Mt. Wachusett reported trying to make college as affordable as possible
by providing the credit-bearing summer academy courses at no-cost
and offering a sizable stipend.
primary participants receiving such supports through SSA each term (see Table 3).
Almost 2/3 of sites used SSA funding to support supplemental instruction or facilitated study
groups in Year 2.
Social support.32
Every site offered some form of social
support through SSA during Year 2, including cohort-based meetings
and activities, peer mentors, coaching or support from SSA
coordinators, and providing studying or gathering space for SSA or
STEM students. Unlike other aspects of SSA programs, which were
often more common during the summer, many of these strategies were
almost equally as common in the academic year and the summer of
Year 2. This suggests that sites might have used social support elements as a way of creating continuity
between summer and the academic year in the connections students had to their colleges and SSA
programs.
Coaching or support from SSA coordinators was the most common SSA-funded activity in this
category (implemented at 13 sites). Many sites commented that funding these coordinator
positions was central to their SSA programs, but also
difficult to sustain beyond grant funding.
Cohort-related supports were also common in Year 2 with
12 sites offering cohort meetings or cohort-based activities
with SSA funding.
Twice as many SSA sites were able to provide studying or
gathering space to SSA or STEM students in Year 2 as in Year 1. Nine sites used SSA funds to
provide this kind of space during Year 2.
More than a third of SSA sites supported peer mentor programs with SSA funding, using a
variety of models.
Financial support.33
Every SSA site offered some form of financial support in Year 2, but the
percentage of primary participants receiving direct financial support
has declined over the course of SSA. This shift is likely the result of
sites’ concerns about sustainability, and an increased focus on the
consistent application of all components of the SSA model. Nearly
all primary participants received direct financial support in Summer
2014 (96.4%), but only about half (51.6%) received such support in
Summer 2015 (see Table 3 above).
Book vouchers or textbook lending were the most widely offered type of financial support in
Year 2, supported with SSA funds at 11 sites.
Scholarships or participation stipends were about equally
common in Year 2, offered with SSA funding by eight or
nine sites. Six sites offered both scholarships and
participation stipends with SSA funding.
Paid internships funded through SSA were uncommon,
offered by four sites in Year 2.
32 For detailed data about social support, see survey data in Tables 13-14 in Appendix C and individual site report narratives. 33 For detailed primary participant data, please see Appendix D. For site report data on financial support, see Tables 15-16 in Appendix C and individual site report narratives.
STEM Starter Academy Annual Evaluation Report, Year 2, January 2016 Program Practices
UMass Donahue Institute Applied Research & Program Evaluation
23
Middlesex offered hands-on research-focused workshops and
paid summer STEM research internships where students worked with faculty and graduate students
at local 4-year universities.
Supporting and improving coursework34
About a third of sites used SSA funding in Year 2 to revise STEM curriculum or pedagogy, the
same as in Year 1. These efforts often aimed to create more engaging and better-aligned courses
to prepare, retain, and transition students into STEM careers.
In Year 2, a few sites (3–4) provided professional development to STEM faculty through SSA (a
marginal decrease from the 6 sites that supported this kind of professional development in the
summer of Year 1).
Infrastructure investments35
Most sites (13) used SSA funding to purchase equipment or build infrastructure during Year 2,
largely focusing on lab equipment and classroom technology. A third of SSA sites named
improvements in infrastructure, equipment, or staff capacity as primary successes of Year 2 in
their site report narratives.
A third of the campuses used SSA funds to make software-related investments in Year 2,
including self-paced mathematics, engineering, and statistical software packages.
Other investments included a solar panel array at Berkshire, graphing calculators at Bunker Hill,
WebEx video conferencing capability at Cape Cod, and a renovation of the STEM student
support center at Middlesex.
Completion Strategies
Strategies to prepare students for post-graduation were less coherent across sites than were strategies that
support readiness or retention. Many sites indicated that these strategies would be the subject of
increased attention in Year 3. Sites implemented an array of strategies including career exploration
events, internships, research experiences, transfer-focused programming (e.g., field trips and advising),
and/or preparation for job searching (e.g., mock interviews and resume review). SSA primary participant
data indicate that only 37% of these students received targeted STEM pathway and/or STEM career
counseling in Year 2.
Career exploration.36
Career exploration activities were
widely implemented in Year 2, with some form of these activities
offered with SSA funding at every site.
According to site report narratives, 1,977 students
participated in a variety of career exploration activities
through SSA in Year 2, including talks by industry
professionals, field trips, career fairs, career exploration
workshops, job application support and preparation, and opportunities to network or interview
and present work. About 200 students engaged in these activities as part of a summer bridge
program.
The most common career exploration activities implemented with SSA funding were career-
exploration oriented speakers or event. Over the course of Year 2, these types of events were
offered to current students at 14 sites, to high school students at 10 sites, and to incoming students
at 7 sites, all using SSA funding.
34 For detailed data on coursework, see tables 5-6 in Appendix C and individual site report narratives. 35 For detailed data on equipment and infrastructure investments, see tables 17-18 in Appendix C and individual site report narratives. 36 For detailed data about career exploration, see tables 19-20 in Appendix C and individual site report narratives.
STEM Starter Academy Annual Evaluation Report, Year 2, January 2016 Program Practices
UMass Donahue Institute Applied Research & Program Evaluation
24
SSA at Cape Cod built strong relationships with industry – including
designing academic programs with industry input, placing students in
industry internships, and hiring faculty with industry experience.
Massasoit reported that 100% of research internship program
participants were either retained or transferred to 4-year colleges.
Berkshire’s collaboration in the 413 STEM Ready program provided both an
aspirational next step for SSA participants (the program targets second year STEM
students) and peer mentorship (provided by 413 STEM Ready participants).
2/3 of sites offered career-specific advising through
SSA, although such advising was implemented without
SSA support at nearly every site.
Eight sites offered research opportunities or internships
with SSA funding in Year 2.
Eight sites offered professional development for
STEM students with SSA funding during Year 2,
including professional mentorship, trips to professional
conferences, opportunities to present work, networking events, and mock interviews.
Transfer exploration
37
All sites offered some form of transfer-focused events, activities (including field trips), or
speakers and about half used SSA funding to support these activities.
Every site offered transfer-specific advising during Year 2,
although most sites (9) did not use SSA funding to support
these activities. The prevalence of these practices despite the
relatively low proportion of sites using SSA funding suggests
the possibility of this as a potentially sustainable practice.
Industry Engagement.38
Engagement with industry was fairly widespread among SSA sites, but
largely carried out without SSA funding. Thirteen sites implemented at least one form of industry
engagement (e.g., speakers, curriculum development, advisory boards, and internships).
In interviews and site report narratives, sites emphasized the importance of SSA support in
building relationships with employers from STEM industries, which included inviting
representatives to participate in career fairs or as guest
speakers; involving industry representatives in shaping
curriculum, often through advisory boards; and facilitating
field trips and internship or job shadowing placements at
industry sites.
Eleven sites used SSA funding to host industry speakers or
instructors over the course of Year 2, an increase from nine
sites in Year 1.
In the survey, two sites reported that they used other types of industry engagement as part of their
SSA programming—a career fair (Middlesex) and an industry-based STEM mentorship program
(Mass Bay), both supported with SSA funding.
Three types of activities were commonly implemented without SSA funding. Industry-aligned
curriculum development and industry advisory boards were fairly widespread, carried out by 10
sites each over the course of Year 2 (but supported with SSA at only one site). Also, the majority
of sites (12) offered industry-based internships during Year 2, but two used SSA funding.
Developing a workforce pipeline. Although the STEM-field proportion of degrees and
certificates awarded to SSA students is notably higher than statewide averages (see Table 5 and
Completion and Retention Metrics section above), across SSA sites, there did not appear to be a
37 For detailed data on transfer exploration, see tables 21-22 in Appendix C and individual site report narratives. 38 For detailed data about industry engagement, see tables 23-24 in Appendix C and individual site report narratives.
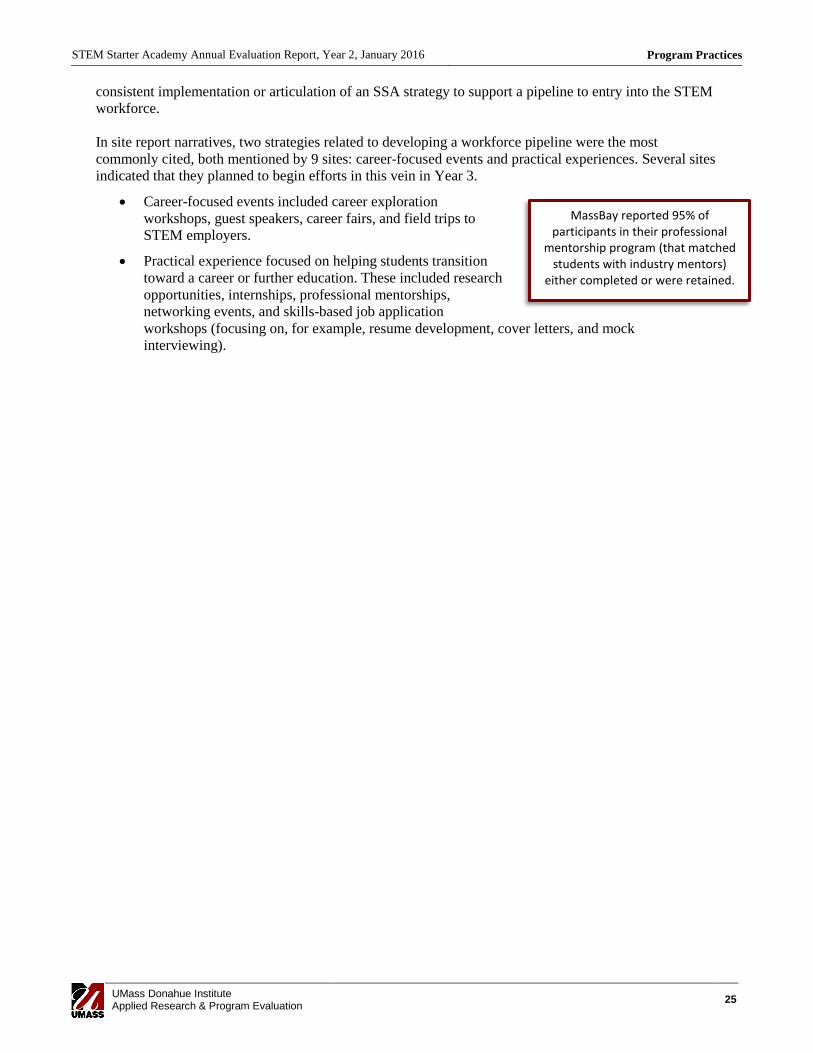
STEM Starter Academy Annual Evaluation Report, Year 2, January 2016 Program Practices
UMass Donahue Institute Applied Research & Program Evaluation
25
MassBay reported 95% of participants in their professional
mentorship program (that matched students with industry mentors)
either completed or were retained.
consistent implementation or articulation of an SSA strategy to support a pipeline to entry into the STEM
workforce.
In site report narratives, two strategies related to developing a workforce pipeline were the most
commonly cited, both mentioned by 9 sites: career-focused events and practical experiences. Several sites
indicated that they planned to begin efforts in this vein in Year 3.
Career-focused events included career exploration
workshops, guest speakers, career fairs, and field trips to
STEM employers.
Practical experience focused on helping students transition
toward a career or further education. These included research
opportunities, internships, professional mentorships,
networking events, and skills-based job application
workshops (focusing on, for example, resume development, cover letters, and mock
interviewing).
STEM Starter Academy Annual Evaluation Report, Year 2, January 2016 Formative Feedback on SSA
UMass Donahue Institute Applied Research & Program Evaluation
26
Formative Feedback on SSA
A major purpose of this report is to provide formative feedback to DHE and to community colleges
relevant to SSA grant activities. This section summarizes feedback about the process of SSA
implementation and grant activities based on site reflections in their Year 2 reports and UMDI’s
interviews with DHE representatives. The first section summarizes promising practices, identified in the
literature, that are reflected in SSA activities. The second section summarizes sites’ reflections on SSA
from their Year 2 reports including successes, challenges, messaging, sustainability and measurement. A
third section captures findings from UMDI’s interviews with DHE representatives regarding Year 2 of
SSA. The final section offers a brief glance ahead to what might be learned about SSA in Year 3.
Summary of Key Findings
Key Finding: The array of strategies most widely implemented in Year 2 (summarized in Figure
3) reflect the SSA model’s focus on recruitment, readiness, retention, and completion.
Year 2 strategies reflected the SSA model; sites refined their recruitment and readiness
strategies, and implemented and further developed retention and completion strategies. The
strategies most widely implemented with SSA support in Year 2 are captured in Figure 3 and
spanned the SSA model from recruitment to completion. More than two-thirds of sites
implemented each of these strategies.
Key Finding: While SSA model priorities are consistently represented, there is substantial
variation in implementation, reflecting adaptation to local needs.
The SSA model emerged late in Year 2 and sites had only begun to develop and adapt
programs and supports in ways that aligned with the model by the end of that program
year. A review of similarities and differences across campuses revealed substantial variation in
programming. When identifying key components of their SSA programs, only one element
(summer programming) was identified as a key component by more than half of the sites. Sites
using similar strategies sometimes differed in their use of SSA funds to support these strategies.
Promising Practices The following list summarizes strategies noted by sites or observed by evaluators that reflect promising
practices suggested by the literature to support student recruitment, readiness, retention, and completion.39
This list is meant to provide preliminary feedback and is not meant to be prescriptive. Promising practices
included:
Building relationships with high schools and high school students and engaging current
community college students in outreach efforts.
Easing students’ transition into college by teaching college navigation skills, and supporting
students’ completion of developmental coursework.
Increasing students’ sense of socio-academic integration by routing academic and social support
through a central person; creating opportunities for cohort-based meetings and activities;
supporting relationships with peer mentors; and providing studying and gathering spaces for
STEM students.
39 For a selected summary of these practices, please see STEM Starter Academy: Promising Practices for STEM Program in Community Colleges (http://www.mass.edu/stem/documents/STEM%20Starter%20Academy/SSAPromisingPractices4-29-14UMDI.pdf)
STEM Starter Academy Annual Evaluation Report, Year 2, January 2016 Formative Feedback on SSA
UMass Donahue Institute Applied Research & Program Evaluation
27
Bolstering academic success through the expansion of supports such as tutoring, supplemental
instruction, and learning specialists, and providing collaborative and non-stigmatizing options
such as group study spaces, peer tutors and facilitated study groups.
Reducing financial barriers by offering tuition-free STEM courses (most often mathematics
classes), scholarships, or other financial supports (e.g., textbook lending or book vouchers).
Supporting students’ persistence in STEM through STEM-specific, sustained, and proactive or
―intrusive‖ advising strategies.
Boosting STEM engagement and career awareness by offering STEM-themed activities and
events including clubs, speakers, career fairs, and workshops focused on career and program
exploration and readiness.
Encouraging student engagement and success in STEM coursework through revised and
contextualized curriculum, improved classroom technology, and professional development for
STEM faculty.
Smoothing transfer pathways for students by aligning STEM curriculum, creating articulation
agreements, fostering collaboration with 4-year institutions, and offering transfer-specific
advising and events.
Facilitating student professionalization by offering research experiences and internships, aligning
STEM curriculum to industry standards, linking students to professional mentors, teaching soft
skills, and supporting student participation in professional organizations and attendance at
disciplinary conferences.
Site Reflections on SSA
Year 2 of SSA saw a refinement of recruitment and readiness strategies that were a primary focus in Year
1, and a growing engagement with retention and completion strategies. This broadened focus is reflected
in sites’ messages to stakeholders about their programs, where support for retention and completion was
the most common theme, followed by building interest, awareness, or confidence in STEM fields and
support for career or transfer preparedness. The strategies most widely implemented with SSA support are
illustrated in Figure 3.
Looking at the key components of SSA programs, as named by sites in their reports, it is evident that sites
continue to adapt the broader SSA program model to meet their local needs. A review of similarities and
differences across campuses revealed substantial variation in programming. For example, only one
element was identified as a key component by more than half of the sites: summer programming (named
by 9 sites), and these types of programs differed considerably from site to site. About half of the sites
identified academic support (e.g., tutoring), advising, and career-related initiatives as key components.
Four sites identified one or more of the following as key components: outreach or recruitment activities,
developmental mathematics initiatives, and STEM exploration activities. While some sites used similar
strategies, their use of SSA funds to support these strategies sometimes differed.
Successes
Compared to Year 1, when increased capacity and building internal collaborative structures were top
themes among successes named by campuses, Year 2 successes were more implementation focused. In
particular, sites emphasized their increased ability to deliver services to students through the capacity and
structures built out in Year 1. This shift reflects an expected progression the development of the SSA
initiative from recruitment to readiness to retention.
STEM Starter Academy Annual Evaluation Report, Year 2, January 2016 Formative Feedback on SSA
UMass Donahue Institute Applied Research & Program Evaluation
28
Site report narratives and interviews indicated that sites felt they were able to attract students to their
colleges, interest them in STEM fields, engage them in coursework, and promote their academic progress
with supports such as tutoring, supplemental instruction, and study centers. Recruitment was cited as one
of the primary challenges in Year 1. In Year 2, SSA colleges indicated that the increased lead time,
practical experience from the first year, and increased awareness of SSA programs helped them to build
more successful recruiting systems.
Benefits
Site report and interview responses revealed patterns of agreement across college campuses about the
benefits of SSA for their institutions. Increased capacity and improved visibility were the most commonly
named benefits, each referenced by two-thirds of sites in their reports.
According to campuses, SSA funds created capacity to:
Coordinate on- and off-campus efforts to recruit and support students, and develop STEM
programs (including leveraging SSA dollars to obtain additional grants);
Improve classroom experiences with technological tools, updated equipment, and curricular
innovation;
Provide students with improved study spaces, financial access, and support programs; and
Provide experiential opportunities for students such as internships, professional mentorships, or
research experiences.
SSA sites’ comments on the benefits of the initiative also included the role of SSA in raising the visibility
of STEM fields both on and off campus, and in enhancing the profile of community colleges and their
STEM programs with local communities and external partners. Other benefits cited included improved
student performance and a more diverse STEM student population.
Challenges
In site report narratives, campuses reported fewer challenges in Year 2 than they did in Year 1. The
challenges most frequently cited by campuses included recruitment, 9c budget cuts, and campus resource
limitations. A summary of common challenges is presented below.
More than half of the campuses cited recruiting challenges. Some sites found that students chose
competing opportunities, some sites struggled with limited staff time (due to budget limitations)
to engage in recruiting, and a small number of campuses’ recruiting efforts were affected by
winter weather.
Half of the campuses commented that the 9c budget cuts were a challenge, necessitating the
elimination, modification, or scaling back of some planned interventions. Many sites scaled back
funding for staff, reduced the size of their supported populations, or reduced the number of
planned support services.
Lack of resources—particularly human resources in the form of staff time—was a challenge cited
by about half of the SSA campuses in their narratives. These limitations circumscribed sites’
abilities to secure internships and other opportunities for SSA students, actively engage with
struggling students, track and report data, and coordinate program components.
Other reported challenges included learning and implementing new systems of data collection,
managing reporting for the grant, responding to changes in curriculum or staffing, coming to
agreement about the definition of STEM fields, helping students transition from one area of
STEM Starter Academy Annual Evaluation Report, Year 2, January 2016 Formative Feedback on SSA
UMass Donahue Institute Applied Research & Program Evaluation
29
guidance and support to another, helping college staff understand and detangle the role of SSA
compared to other STEM-focused initiatives, and adapting campus plans to the SSA model that
emerged during Year 2.
Messaging to Stakeholders
A thematic analysis of survey responses and site report narratives showed that sites typically
communicated messages that would be expected, largely aligned with the SSA model. Analysis shows,
however, less consistency of messaging about SSA across sites than was expected. The most common
themes are summarized here, in decreasing order of inclusion by sites in their reported messages to
stakeholders.
Expanding campus supports for retention and completion (11 sites). Among these supports
were a wide range of specifically named strategies, including tutoring or facilitated study groups,
advising, stipends and scholarships, revised or new curriculum and teaching strategies,
mentorship, and skills-based workshops. A few sites characterized these supports as ―intensive,‖
―high touch,‖ or ―high impact.‖
Building awareness of or interest in STEM fields of study and increasing students’ confidence
in pursuing those fields (8 sites).
Preparing students for transfer to 4-year schools or careers by focusing on professional
education or development, transfer and career specific advising, or training on current industry
technologies (7 sites).
Supporting students’ readiness for college and STEM by providing support for mathematics
remediation, a ―head start‖ of free coursework, or simply confidence in mathematics and science
(6 sites).
Recruiting students to the community college’s STEM programs (6 sites). .
Sustainability
Sites’ took more concrete steps to sustain SSA programming in Year 2 than they did in Year 1. The two
most common strategies reported in narratives (each mentioned by about two-thirds of sites) were (1)
seeking external funding for parts of SSA programming and (2) plans to integrate SSA programs or staff
into other campus campus-wide initiatives.
Seeking external funding. At least five of the sites that explicitly mentioned searching for
external funding had already received some funding. Several of these sites had leveraged SSA programs
to apply for external funding. Some of them had received funding from organizations with which SSA
coordinators had built or strengthened relationships.
Integrating SSA into other campus initiatives. Plans to integrate SSA programs or staff into
other campus-wide initiatives varied.
At some sites, SSA roles were reorganized to be absorbed into institutionalized positions or
programs. For example, some sites integrated their STEM advising, recruiting, or even
coordination—efforts started with SSA funds—into the larger college-supported structure.
At other sites, collaborations with college offices, programs, or other grants were used to embed
SSA strategies at the campus. For example, one site developed an employer outreach program in
collaboration with various programs and offices on campus that will help to sustain the kinds of
STEM Starter Academy Annual Evaluation Report, Year 2, January 2016 Formative Feedback on SSA
UMass Donahue Institute Applied Research & Program Evaluation
30
career-focused activities that are part of the SSA model. Some sites were working with their
college foundations to sustain elements such as scholarships.
Overlap between SSA and other initiatives. In addition to what sites reported regarding their
general sustainability strategies for SSA, they were also asked specifically to address the ways their SSA
programs overlapped with other college- or grant-funded initiatives at their institution. Collaborations and
cross-referrals were the most common means by which SSA overlapped with other initiatives.
For example, SSA program staff might collaborate with another initiative to develop a program
(e.g., a STEM Career Days event or a STEM foundations course) or a program might be
supported by several different streams of funding, including SSA.
In other instances, students participating in SSA might be referred to a non-SSA initiative (e.g., a
TAACCCT 4–supported mathematics placement refresher workshop) or receive referrals from
those initiatives (e.g., advising and career services).
About half of sites mentioned some sort of overlap at an administrative or staffing level, in some
cases where staff from multiple initiatives, including SSA, report to the same administrator,
some cases where an SSA staff member has responsibilities on multiple initiatives, and some
cases where SSA staff are part of committees or serve in advisory capacities for related
initiatives at the campus.
Building sustainable capacity. About a third of campuses indicated that they built sustainable
capacity through SSA by investing in infrastructure, program and curriculum development, and
relationship building that would continue to serve SSA and STEM programs in the future. Sites upgraded
labs, built or expanded study and support spaces, and designed and redesigned curriculum. SSA program
staff also built relationships with industry partners and other organizations that would continue to serve as
sources of career and internship opportunities.
Reducing services and supports offered to SSA students. About a third of sites described
reductions in student supports as a sustainability strategy. This included offering a limited stipend, no
stipend, or switching to in-kind incentives as an alternative. Sites also discussed suspending or scaling
back resource intensive programs and services such as summer bridge programs.
No sustainability strategy. About a third of sites responded that they did not have a strategy to
sustain at least certain elements of their SSA programs. These sites commented that staff and programs
would not be sustainable without outside funding or that they would need to look for or are still exploring
sources of outside funding. Staff positions were noted as one of the more difficult pieces to sustain.
Measurement
In their narratives, sites reported on their strategies for tracking student data relevant to SSA. These
reports revealed a range of strategies that varied in complexity and detail, suggesting that measurement
might be an area where sites would benefit from practice or resource sharing. For example, access to
student-level data varied by site. Program manager or coordinator access seemed to depend both on the
types of data management systems being used at the site and also the organization of SSA within the
larger institutional administrative structure.
Sites were primarily concerned with collecting data about student performance and outcomes (likely
influenced by UMDI and DHE data reporting requirements) and secondarily about student experiences.
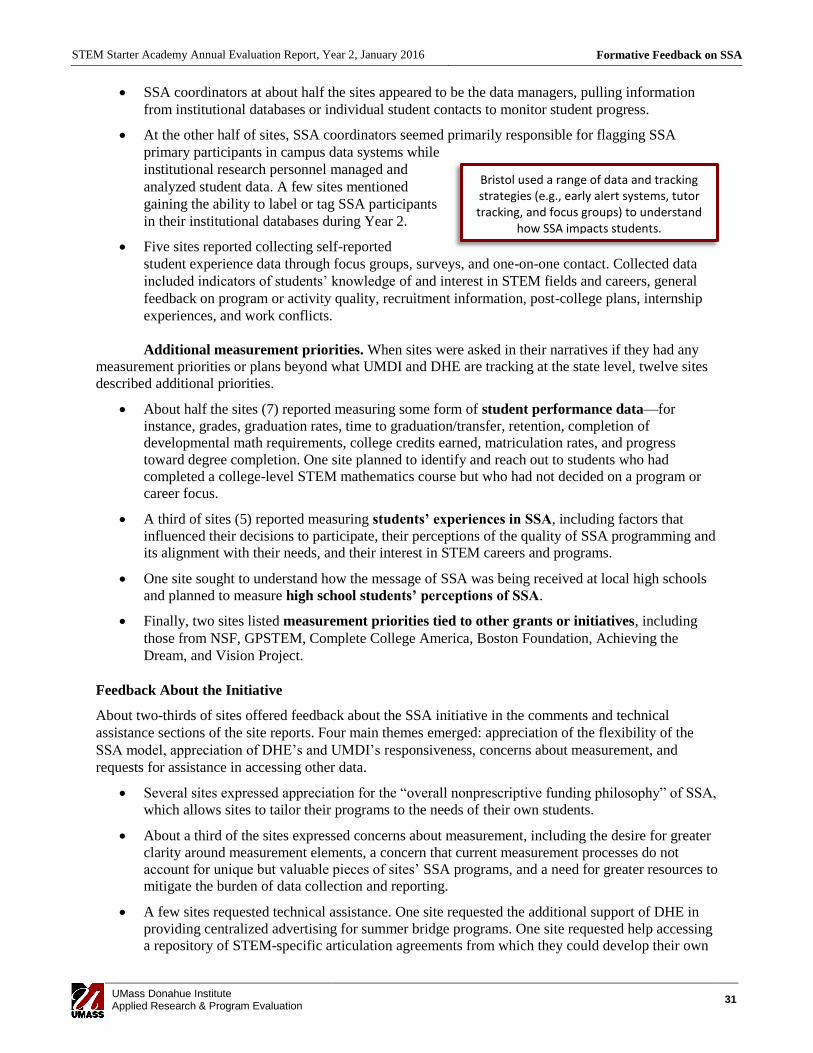
STEM Starter Academy Annual Evaluation Report, Year 2, January 2016 Formative Feedback on SSA
UMass Donahue Institute Applied Research & Program Evaluation
31
Bristol used a range of data and tracking strategies (e.g., early alert systems, tutor tracking, and focus groups) to understand
how SSA impacts students.
SSA coordinators at about half the sites appeared to be the data managers, pulling information
from institutional databases or individual student contacts to monitor student progress.
At the other half of sites, SSA coordinators seemed primarily responsible for flagging SSA
primary participants in campus data systems while
institutional research personnel managed and
analyzed student data. A few sites mentioned
gaining the ability to label or tag SSA participants
in their institutional databases during Year 2.
Five sites reported collecting self-reported
student experience data through focus groups, surveys, and one-on-one contact. Collected data
included indicators of students’ knowledge of and interest in STEM fields and careers, general
feedback on program or activity quality, recruitment information, post-college plans, internship
experiences, and work conflicts.
Additional measurement priorities. When sites were asked in their narratives if they had any
measurement priorities or plans beyond what UMDI and DHE are tracking at the state level, twelve sites
described additional priorities.
About half the sites (7) reported measuring some form of student performance data—for
instance, grades, graduation rates, time to graduation/transfer, retention, completion of
developmental math requirements, college credits earned, matriculation rates, and progress
toward degree completion. One site planned to identify and reach out to students who had
completed a college-level STEM mathematics course but who had not decided on a program or
career focus.
A third of sites (5) reported measuring students’ experiences in SSA, including factors that
influenced their decisions to participate, their perceptions of the quality of SSA programming and
its alignment with their needs, and their interest in STEM careers and programs.
One site sought to understand how the message of SSA was being received at local high schools
and planned to measure high school students’ perceptions of SSA.
Finally, two sites listed measurement priorities tied to other grants or initiatives, including
those from NSF, GPSTEM, Complete College America, Boston Foundation, Achieving the
Dream, and Vision Project.
Feedback About the Initiative
About two-thirds of sites offered feedback about the SSA initiative in the comments and technical
assistance sections of the site reports. Four main themes emerged: appreciation of the flexibility of the
SSA model, appreciation of DHE’s and UMDI’s responsiveness, concerns about measurement, and
requests for assistance in accessing other data.
Several sites expressed appreciation for the ―overall nonprescriptive funding philosophy‖ of SSA,
which allows sites to tailor their programs to the needs of their own students.
About a third of the sites expressed concerns about measurement, including the desire for greater
clarity around measurement elements, a concern that current measurement processes do not
account for unique but valuable pieces of sites’ SSA programs, and a need for greater resources to
mitigate the burden of data collection and reporting.
A few sites requested technical assistance. One site requested the additional support of DHE in
providing centralized advertising for summer bridge programs. One site requested help accessing
a repository of STEM-specific articulation agreements from which they could develop their own
STEM Starter Academy Annual Evaluation Report, Year 2, January 2016 Formative Feedback on SSA
UMass Donahue Institute Applied Research & Program Evaluation
32
or a statewide agreement. One site requested assistance accessing state and national data to better
track students as they leave the community college.
A few sites expressed appreciation for the support and responsiveness from DHE and UMDI.
STEM Starter Academy Annual Evaluation Report, Year 2, January 2016 Formative Feedback on SSA
UMass Donahue Institute Applied Research & Program Evaluation
33
DHE Reflections on Year 2
On September 16, 2015, the UMDI project manager conducted an hour-long telephone interview with the
two DHE personnel who guide the STEM Starter Academy Initiative at the statewide level: the DHE
Associate Commissioner for Economic and Workforce Development (hereafter, ―the Associate
Commissioner‖) and the DHE Executive Director of STEM (hereafter, ―the Director‖). The purpose of
the interview was to explore the Associate Commissioner and Director’s perspectives on the successes
and challenges of Year 2. On January 19, 2016, the UMDI project manager conducted another interview
with the same parties, which primarily focused on Year 3, but included additional reflections on Year 2
that have been incorporated here. See complete interview protocols in Appendix E and F. Key findings
from these interviews are summarized below.
Successes
DHE representatives’ reflections on the major successes of the second full year of program
implementation included the formalization of the SSA program model, improved understanding of
measurement strategies, sites’ flexibility and commitment, working group collaboration, and the
formalization of the Director’s role.
Formalization of the SSA program model. The collaborative work in Year 2 to establish a more
consistent set of definitions and practices for the SSA initiative was seen as a key success. DHE
representatives felt that this model provided greater clarity to sites and other stakeholders regarding the
parameters and goals of the program, allowing campuses to align their strategies with overall model goals
while also allowing for local latitude and adaptation. The Director felt that the agreement around a
program model facilitated communication and advocacy with stakeholders. At the same time, DHE
representatives viewed local variations that enabled adaptation to diverse environments as contributing to
the initiative’s success.
Improved understanding of measurement strategies. The development of a program model
that codifies goals and metrics facilitated DHE personnel and campuses’ understandings and engagement
with the design of measurement strategies. Common definitions of program components allowed DHE to
better align measurements and outcomes with program design.
Sites’ flexibility and commitment. The Director observed that a key facilitating factor in the
successful formalization of a program model was sites’ willingness to engage in collaboration and to
―stick with it‖ over the course of the Year 2. She noted that instead of being resistant, sites were
thoroughly engaged in creating a common understanding across the campuses and were accommodating
as the program model evolved. The Associate Commissioner said that the high level of engagement was
evident in monthly conference calls, in collaboration with UMDI on evaluation issues, and during the
annual convening.
Working group collaboration. Collaboration within and between campus representatives in the
Measurement Working Group and the Model Working Group was seen as essential to refining the
structure, goals, metrics, and supporting strategies for the SSA model. The process resulted in the
identification of key program components as well as the identification of strategies for measuring those
components.
Formalization of the Director’s role. The expansion and formalization of the Director’s role in
SSA was credited with bringing a greater level of leadership and time investment that has had many
benefits for the initiative. The Associate Commissioner noted that the Director’s expanded role facilitated
STEM Starter Academy Annual Evaluation Report, Year 2, January 2016 Formative Feedback on SSA
UMass Donahue Institute Applied Research & Program Evaluation
34
the sharing of best practices between campuses and promoted other campus connections. The Director
played a leadership role in engaging sites around model development and pushing for increased
consideration of measurement and outcomes. The Director noted that her role allowed DHE to be a
partner to sites in their implementations of their programs while maintaining a sense of campus ownership
of the initiative.
Challenges
The primary challenges encountered in Year 2, according to the DHE interviewees, included the
preparation of the first legislative report, state budgetary issues impeding scale-up, understanding SSA’s
connection to other campus programs and systems, and defining STEM majors.
Preparation of the first annual legislative report. The synthesis of an extensive amount of
information into a legislative report was a notable challenge for DHE interviewees. Particularly
challenging was the task of balancing the importance of providing rich detail and depth that can inform
future practice with the importance of succinctly communicating the successes of the program to different
audiences.
State budgetary challenges impeded scale-up efforts. Massachusetts’ 9c cuts resulted in a need
for sites’ to reconfigure their plans to expand student participation in Year 2. In addition to reducing the
ability to reach more students, the cuts also affected DHE’s understanding of the scale-up process—
including potential barriers and mitigating factors. Understanding SSA’s connections to other campus programs and systems. DHE
representatives were uncertain about the degree to which SSA has become part of the ―fabric‖ of the
community college campuses. More specifically, they sought a clearer understanding of 1) how sites are
communicating what SSA is to students, 2) if sites view SSA as an ―integral part of the way that they do
business,‖ 3) whether and what stakeholders—besides primary SSA program administrators—know about
the program, and 4) if students, staff, and faculty come to learn about SSA through different, non-SSA
avenues, departments, or offices.
Defining STEM majors. DHE observed that there was inconsistency in the way in which sites
defined STEM majors. DHE said that some sites considered healthcare fields to be a part of STEM, and
some did not. The Director noted that it is important to establish common definitions in order to allow for
consistent measurement across campuses.
Emerging Best Practices
When asked to reflect on promising or best practices that emerged during Year 2 SSA implementation,
DHE representatives cited fostering opportunities for sites to share information and facilitating the
reporting process as positive practices.
Facilitation of collaboration. The Director noted that sites were often able to grow and improve
effectively when they could build on other sites’ successes. Providing opportunities for sites to share ―in a
rich way‖ and to ―explore what [they] can do to have a similar experience‖ is critical to improvement.
Current means of sharing have included conference calls, but most effectively take the form of one-on-
one connections between stakeholders at different sites facilitated by the Director. She notes that sites
often make these individual connections on their own as well.
Development of common reporting structures and systems. The refinement of a common
reporting structure in Year 2 improved DHE’s understanding of individual sites’ program components,
STEM Starter Academy Annual Evaluation Report, Year 2, January 2016 Formative Feedback on SSA
UMass Donahue Institute Applied Research & Program Evaluation
35
challenges, and successes. In addition to the Director’s deeper engagement with SSA sites (including
participating in Year 2 site visits) this understanding put DHE in a better position to facilitate information
sharing across sites. However, both DHE interviewees noted that they had not yet created a structure that
would facilitate cross-campus sharing of the best practices identified through the reports, but had plans to
do so in Year 3.
Engaging in data-driven decision making. The Director was pleased with SSA institutions’
level of engagement with initiative-level data through the model-building process. She expressed
confidence that cross-site collaboration would be enhanced by the availability of more substantial
outcome data, which will become available as the initiative progresses. She expected that campuses
would be motivated to collaborate around particular strategies once the success of those strategies is more
established..
Other Reflections
DHE interviewees’ general reflections on the Year 2 implementation process at the site and program
levels included a consideration of the tension between infusing SSA into campus systems while also
maintaining program boundaries, the current shift toward clarity and measurement in Year 3 planning,
sustainability concerns, and the integration of SSA with other state-level STEM pipeline programs.
Embedding SSA in campus systems while maintaining program boundaries. As previously
mentioned, DHE representatives are interested in learning the extent to which SSA is integrated into the
larger community college campuses. While they want SSA to be interwoven into the campus
environment, they realize that is in tension with their need to delineate clear boundaries around SSA in
order to understand the unique contributions of the initiative.
Requiring clearer and more measurable Year 3 plans. As part of DHE’s shift to a greater
focus on measurement and communicating successes, the Director developed common systems for sites to
report on their Year 3 plans. Sites were asked to summarize their institution’s SSA program, delineate
measureable objectives, outline their sustainability plans, and clarify how they might use data to refine
their strategies. The increased clarity reflects the maturation of the program, as well as DHE’s priorities of
gauging outcomes and conveying successes and best practices.
Sustainability. Sustainability has continued to be an important topic for DHE and the sites. DHE
identified a few program components that are at risk, including site coordinators or other staff whose
positions are supported by SSA funds, UMDI’s program evaluation services, and stipends for
participants. The Associate Commissioner noted that sites are aware of that the prospect of continuing to
issue stipends is untenable and that he believes that many are already pulling away from that component.
Need for greater clarity around integration of SSA with other STEM pipeline programs. At
the end of Year 2, DHE representatives indicated that they did not have a clear understanding of the
extent to which SSA was integrated into sites’ broader college environment. Additionally, the Associate
Commissioner felt that the department had not made targeted efforts to ―deeply‖ incorporate SSA into
other STEM pipeline initiatives.
Next Steps
DHE representatives’ vision for next steps in program implementation included a focus on the need to
increase cross-site communication and collaboration, including sharing of best practices and
dissemination of program successes.
STEM Starter Academy Annual Evaluation Report, Year 2, January 2016 Formative Feedback on SSA
UMass Donahue Institute Applied Research & Program Evaluation
36
Improve sharing across sites. In Year 3, DHE would like to increase and enhance the sharing of
best practices across the sites and among stakeholders. The Associate Commissioner noted that DHE has
not really connected similar sites for collaboration opportunities. Sites could potentially benefit from such
activities if they are similar in terms of size and scope, not just location or region. There is no current
forum or structure that allows sites to share their reports, and DHE could create a structure for this kind of
communication. Sites reportedly want more face-to-face events, and DHE intends to provide them with
additional opportunities—for example, by having two annual program-wide convenings. DHE would also
like to facilitate regional site visits among campuses. The Director also intended to support cross-campus
discussions of best practices based on program data.
Looking Ahead: Year 3
Developments in the SSA initiative during Year 2 shaped plans for evaluation of the initiative in Year 3.
The establishment of the SSA model was a guiding development, and will allow the evaluation team to
continue our efforts to align measurement activities with key outcomes and metrics outlined in the model.
Informed by the priorities of DHE and SSA sites, data collection activities have been revised to include
measures of developmental math participation and completion. Through this data collection activity we
will improve our understanding of whether and to what extent SSA interventions increase the rate at
which students complete developmental mathematics and move on to the college-level mathematics
coursework that is often a prerequisite for STEM programs.
Sites’ interest in students’ experiences in SSA programs led to the development of a new instrument to
collect these data in Year 3. This instrument will facilitate the gathering of student-level perspectives on
how SSA interventions impact their college experiences, including their interest and self-efficacy in
STEM fields. Likewise, another new instrument developed for Year 3, an exit survey, reflects sites’ and
DHE’s interest in understanding students’ trajectories after they exit SSA programs. This instrument will
facilitate systemic learning about how student experiences in SSA programs impact career and
educational trajectories after students leave the community college.
The measurement strategies used throughout the life of the grant will also yield increasingly relevant data
in Year 3, as students who began their participation with SSA during the pilot phase enter the mid-points
of their programs. Evaluation strategies will continue to be focused on initiative-level measurement while
also responding to campus feedback about the local relevance of various evaluation activities. This
reflects DHE and sites’ interest in using data both to guide understanding of the initiative-wide impacts on
students and the STEM pipeline and also to refine program models and reflect unique successes.
STEM Starter Academy Annual Evaluation Report, Year 2, January 2016 Methods
UMass Donahue Institute Applied Research & Program Evaluation
37
Methods
This report includes information collected through the following eight data collection and technical
assistance activities.40
Supplemental Participant Data Requests
At the conclusion of each term (Fall 2014, Spring 2015, Summer 2015), UMDI collected additional data
about SSA participants from all grantees through a supplemental student data request, submitted through
DHE. Each collection was in two parts: one for primary participants and one for secondary participants.
Primary participants were defined as community college students who participated in programs, events, or
activities funded by the STEM Starter Academy grant (i.e., participants who have an ID number assigned
by the college). Secondary participants were defined as individuals who were not enrolled at a community
college and participated in SSA-funded programs, events, or activities (i.e., participants who do not have
an ID number assigned by the college).
Primary and Secondary data collection instruments were designed in consultation with DHE and can be
found in Appendix H and Appendix I. Data about secondary participants were collected in the aggregate.
The instrument collected a count of SSA events and event participants. For primary participants, the
collection included student identification number, campus, and term; an indicator of whether or not the
participant had been previously reported as a secondary participant; and indicators of each participant’s
receipt of SSA-funded financial support, targeted support (such as tutoring or peer mentoring), and
counseling about STEM pathways and careers.
Based on the activities and metrics included in the SSA model (developed during Year 2), two additional
fields related to developmental mathematics were included in the primary participant collections
beginning with Summer 2015. These fields were designed in consultation with DHE and grantees. One
field indicates whether or not the student participated in an SSA-sponsored developmental mathematics
intervention (e.g., developmental mathematics course, non-credit workshop) during the current reporting
period. A second field indicates whether or not the student was a developmental mathematics intervention
participant during the current reporting period and also fulfilled all developmental mathematics
requirements for the institution by the end of the current reporting period.
Primary participant data were submitted by grantees directly to DHE. UMDI worked with DHE to access
de-identified primary participant data that had been aligned with the outcome and enrollment data that are
regularly submitted to DHE by each college through HEIRS (Higher Education Information Resource
System).
Phone Interviews – Fall 2014 and Winter 2015
UMDI conducted one-hour telephone interviews with one or two individuals at each of 11 sites in fall
2014 and winter 2015. The remaining sites were visited (see below). Interviews were typically conducted
with both the primary SSA administrator and an SSA coordinator (where such a position existed). The
interview protocol was developed in collaboration with DHE and focused on fall 2014 SSA activities,
reflections on SSA implementation to date, plans for program sustainability, and next steps in program
implementation (see Appendix J for the complete protocol). At the time of the interviews, most sites were
focused on implementing retention strategies for students who participated in SSA during Summer 2014
40
For reference, the Year 2 SSA evaluation plan is included in Appendix G.
STEM Starter Academy Annual Evaluation Report, Year 2, January 2016 Methods
UMass Donahue Institute Applied Research & Program Evaluation
38
while also recruiting and planning for Summer 2015 programs. Interviews were digitally recorded with
permission, summarized, and analyzed in NVivo.
Selected Site Visits – Fall 2014
UMDI team members conducted site visits at four SSA grantee sites in November and December 2014:
Berkshire, Bunker Hill, Massasoit, and MassBay. Site visit data collection instruments (interview, focus
group, and observation protocols) were developed in collaboration with DHE and focused on strategies
for transitioning students from Summer to Fall, Fall retention activities, and plans for the Spring and
Summer of 2015 (see Appendix J, Appendix K, and Appendix L for protocols). Site visitors interviewed
program staff using the same interview protocol as was used with the fall and winter phone interviews.
In order to minimize the evaluation burden on grantees, UMDI did not revisit sites that had been visited
during Summer 2014. UMDI used data from the Spring 2014 interviews and Fall 2014 surveys to
identify—from among the ten remaining sites—five that would reflect diverse program features,
especially with regard to Fall activities. Geographic variation was used as a tie-breaker criterion.
Originally, Berkshire, Bunker Hill, Massasoit, MassBay, and Roxbury Community Colleges were
selected for site visits, but a lack of response precluded UMDI from visiting Roxbury in the established
timeframe.
UMDI evaluators visited each campus for up to four hours and invited sites to propose an agenda for the
visit. UMDI requested that the visit include a focus group with SSA students (who were 18-years-old or
older), an interview with key SSA program staff, and an opportunity to observe SSA activities. At each of
the four sites, the UMDI evaluator interviewed the primary SSA administrator and SSA coordinator. All
but one visit included a student focus group. Observed SSA activities included courses, cohort / STEM
club activities, and one SSA open house event.
Evaluators drafted field notes from the observations following each visit. Interviews and focus groups
were digitally recorded, with permission, and these recordings were later transcribed. Observation notes
were added to interview data to create site summary files, which were then analyzed in NVivo. For a
summary of the Fall 2014 site visits and ―snapshots‖ of individual sites that were visited, please see
Appendix M.
Selected Site Visits – Summer 2015
UMDI team members conducted site visits at five SSA grantee sites in July and August 2015 (Cape Cod,
Mount Wachusett, North Shore, Northern Essex, and Roxbury). Site visit data collection instruments
(interview, focus group, and observation protocols) were developed in collaboration with DHE and
focused on summer 2015 implementation and reflections on the past academic year (see Appendices N,O,
and P for protocols). As part of the process of preparing for site visits, UMDI collected summer
programming schedules from all fifteen sites (see Appendix Q for a summary of these schedules).
The five sites that were visited in Summer 2015 were selected from among the six sites that had not yet
received an evaluation visit. In discussions about resource allocation, DHE and UMDI decided to limit
the number of sites visited in favor of allocating greater evaluation resources to other priorities.
As with the previously conducted site visits, UMDI evaluators visited each campus for up to four hours
and invited sites to propose an agenda for the visit. UMDI requested that the visit include a focus group
with SSA students (who were 18-years-old or older), an interview with key SSA program staff, and an
opportunity to observe SSA activities. At four of the five sites, UMDI evaluators interviewed the primary
SSA administrator. SSA coordinators were interviewed at every site. Student focus groups were
conducted at all five sites, but students in the focus group at one site were minors, so data from that
STEM Starter Academy Annual Evaluation Report, Year 2, January 2016 Methods
UMass Donahue Institute Applied Research & Program Evaluation
39
activity are not included in this analysis. Observed SSA activities included courses, leadership activities,
and workshops. Evaluators drafted field notes from the observations following each visit. Interviews and
focus groups were digitally recorded, with permission, and these recordings were later transcribed.
Observation notes were added to interview data to create site summary files, which were then analyzed in
NVivo. For a summary of the Summer 2015site visits and ―snapshots‖ of individual sites that were
visited, please see Appendix R.
Year 2 Site Reports
In Fall 2015, all participating sites completed Year 2 Site Reports, which included two components: an
online survey and a narrative template. These instruments were developed by UMDI in collaboration with
DHE and are included in Appendices A and B. Summarized data from the survey are available in
Appendix C. Compiled narrative portions of the reports submitted by sites are available from DHE upon
request.
Both instruments were distributed in October 2015 and were due in November 2015. Representatives
from each site received a link to a single campus copy of the online survey. PDF copies were provided for
ease of collaboration and sharing. The narrative template was distributed as a Word document.
Online survey – The purpose of the online survey was to catalog and assess site-specific components of
SSA implementation as they relate to the core elements of the SSA model. The survey focused on topics
that were of greatest interest to DHE and was comprised of close-ended items.
Narrative – The purpose of the narrative template was to succinctly gather qualitative details from each
site about SSA activities, successes and challenges, and student experiences. It gave sites the opportunity
to describe their programs, explain the details of activities contained in the closed-ended survey
responses, and provide descriptive elements that add depth to programmatic and evaluative reporting.
Narratives were thematically analyzed in NVivo.
Interviews with DHE
On September 16, 2015, UMDI conducted a one-hour telephone interview with the DHE administrators
of the STEM Starter Academy Initiative. The purpose of the interview was to explore the administrators’
perspectives on the second year of SSA implementation and implications for Year 3 (complete protocol in
Appendix E). The interview was digitally recorded with the administrators’ permission. The recording
was transcribed, analyzed, and summarized.
The UMDI project manager conducted another interview with the same parties on January 19, 2016,
which primarily focused on Year 3, but included additional reflections on Year 2 that have been
incorporated into this report. See complete interview protocol in Appendix F. Key findings from the Year
3 portion of the interview will be summarized in the interim Year 3 report.
Participation in Technical Assistance Meeting
DHE convened a technical assistance meeting for SSA grantees on March 30, 2015. At that meeting,
UMDI presented a summary of key data elements from the Year 1 Evaluation Report and facilitated a
conversation around measurement and evaluation. UMDI evaluators also drafted a brief survey
instrument to gather feedback on the meeting and took notes during the meeting. After the meeting,
UMDI shared detailed meeting notes and a summary of the feedback data with DHE and the grantees
(Appendix S).
STEM Starter Academy Annual Evaluation Report, Year 2, January 2016 Methods
UMass Donahue Institute Applied Research & Program Evaluation
40
Participation in Monthly Grantee Phone Meetings and Working Group Meetings
DHE hosted approximately-monthly phone meetings with SSA grantee representatives. UMDI evaluators
attended each call as observers and generated notes from each meeting for DHE to share with grantees.
See Appendix T for a list of topics from each call.
UMDI evaluators also participated in the meetings of the Measurement Working Group, contributing
technical assistance and taking notes. UMDI observed the Model and Sustainability Working Groups’
meetings.
STEM Starter Academy Annual Evaluation Report, Year 2, January 2016 Technical Assistance
UMass Donahue Institute Applied Research & Program Evaluation
41
Technical Assistance
In Year 2, UMDI provided technical assistance to DHE and SSA sites including instrument development,
assistance to sites with data collection efforts, participation in DHE planning and review meetings,
participation and note taking at SSA grantee and working group meetings, and evaluation and feedback of
the March 2015 grantee gathering.
Instrument Development
Over the course of Year 2, UMDI worked with DHE to refine evaluation strategies in ways that align with
the SSA model and meet grantee needs. This refinement was often reflected in changes to existing data
collection instruments or development of new instruments.
UMDI worked with DHE to adapt site report instruments to better reflect understandings of SSA
implementations in Year 2. These Year 2 Site Report instruments included an online survey and narrative
template (see Methods section for details). Likewise informed by the priorities of DHE and SSA sites, the
supplemental student data request was revised to include measures of developmental math participation
and completion in summer 2015.
Based on sites’ interest in students’ experiences in SSA programs, UMDI initiated development of a new
instrument, a student experience survey, to collect these data in Year 3. Another new instrument that
UMDI began to develop in Year 2 for implementation in Year 3 was an exit survey that reflects sites’ and
DHE’s interest in understanding students’ trajectories after SSA. UMDI worked with grantees and with
DHE to develop these instruments.
Where feasible, UMDI also provided document review for instruments developed and disseminated by
DHE (e.g., Year 3 planning documents).
Grantee Phone Meetings and Working Group Meetings
SSA grantees participated in seven, hour-long conference calls between January and September 2015.
The purpose of these calls was to share learning across sites, to begin to outline a more uniform ―model‖
of SSA implementation across sites, and disseminate information about budgeting and other
implementation logistics. SSA coordinators or administrators joined the calls, which were facilitated by
the Associate Commissioner through April and by the Director thereafter. The primary topics of these
calls were FY16 budget information, SSA Year 3 planning, and discussions around SSA model elements
and measurement. See Appendix T for a list of topics by meeting. Grantees also met in person once, on
March 30, for an all-day ―technical assistance‖ gathering (see SSA Grantee Gathering section, below).
In addition to these eight all-site meetings, three SSA working groups (Measurement, Model, and
Sustainability) began phone meetings in May 2015, facilitated by the Director. The Sustainability
Working Group, which met first, discussed the sustainability of various elements of currently
implemented SSA programs but decided to reconvene after a set of cross-campus model elements had
been developed by the other two working groups. The Measurement and Model Working Groups focused
on refining definitions, flagging elements as candidates for a cross-campus SSA model, and strategies for
measuring those elements. At a joint, in-person meeting in July 2015, the Measurement and Model
Working Groups, along with some campus representatives from offices of institutional research, reviewed
STEM Starter Academy Annual Evaluation Report, Year 2, January 2016 Technical Assistance
UMass Donahue Institute Applied Research & Program Evaluation
42
and refined the emerging model elements and strategies for measuring them. Based on these various
discussions, the Director drafted a preliminary version of the SSA model that was sent to all sites for
review and comment in early August.
UMDI evaluators participated in the Measurement Working Group meetings and observed the Model and
Sustainability Working Group meetings. Our observations resulted in a few notable findings. First, we
noted the value of the Director’s strategic facilitation of the Model Working Group in helping that group
make decisions. A key issue hindering the identification of model elements at the initial meeting was a
lack of clarity around the level of specificity of those elements. A focus on specific practices led site
representatives to worry about how much flexibility they would have in implementation. At the second
meeting, as the group discussed SSA activities included in the UMDI Year 1 Evaluation Report, the
Director decided which activities were model elements and which were ―promising practices‖ (to be
nested below model elements). Although these distinctions were not well defined, this form of facilitation
allowed the group to move forward by keeping the discussion at a more general level, which created
space for differentiation between sites.
UMDI’s analysis of these meetings revealed that sites are not consistently defining the idea of a student
―cohort.‖ SSA grantees seem to use the term ―cohort‖ to refer to both a socially connected group and to
any group of students who started their participation in SSA at the same time, regardless of whether they
have any social connection.
SSA Grantee Gathering
DHE convened a day-long meeting of SSA grantees in Southbridge on March 30, 2015. Representatives
from 14 of the 15 community colleges attended. The agenda included whole-group morning and
afternoon discussions of ―cross-cutting topics,‖ including recruitment, developmental mathematics,
financial supports, and curriculum. UMDI provided a summary of key data elements from the Year 1
Evaluation Report and facilitated a conversation around measurement and evaluation. UMDI evaluators
drafted a brief survey instrument to gather feedback on the meeting and took notes during the meeting.
After the meeting, UMDI shared detailed meeting notes and a summary of the feedback data with DHE
and the grantees.
The main topics covered in the day’s discussion were recruiting methods and populations, approaches to
mathematics, evaluation and measurement, sustainability, career preparation, financial supports,
curriculum, and faculty professional development. The most extensive discussions focused on target
populations for recruitment, measuring and defining a common SSA approach to mathematics
interventions, and appropriate measures for evaluating and presenting a narrative about the initiative more
broadly.
Participants’ perceptions of the meeting were generally positive. Most respondents indicated that the
meeting gave them valuable ideas and insights and provided an effective venue to share lessons learned
and promising practices. Common concerns among respondents included uncertainty about FY16 funding
and some unease around how the group would negotiate a more consistent framework across programs. A
summary of feedback data is included in Appendix S.
STEM Starter Academy Annual Evaluation Report, Year 2, January 2016 Strategic Considerations
UMass Donahue Institute Applied Research & Program Evaluation
43
Strategic Considerations
After the progress of Year 2, DHE and the campuses are in a strong position to continue to refine the SSA
model and identify and scale promising practices and key strategies that are emerging. The following are
some strategic opportunities for consideration by DHE.
1. Consider updating the SSA program model to represent emergent consensus regarding what
its core practices should be. Sites differ in their understanding of what constitutes a key
component of SSA, and there is substantial variation in practice. The initiative might benefit from
more uniform definitions of some key elements, such as summer bridge or summer readiness
programs. Additionally, several practices that are not currently mentioned as key to the model may
warrant further consideration. These include:
Collaboration. Collaboration across institutions was a key goal of STEM Starter Academy as
it was originally proposed by DHE and by the community colleges. However, collaboration
does not currently appear in the SSA model.
Recruitment or support of groups who are traditionally underrepresented in STEM
fields. Eight sites reported that they explicitly recruited groups underrepresented in STEM,
and another four sites said that the populations of students they typically serve already fall
into categories generally considered underrepresented with their SSA recruitment efforts.
However, seven sites did not specifically target these groups.
Dropout re-engagement. Approximately 2% of primary participants who were new to the
intervention in Fall 2014 and Fall 2015 were re-admitted or re-activated students. Neither
sites nor DHE have prioritized the issue of re-engaging dropouts, and this issue may warrant
closer consideration.
2. Provide technical assistance to foster system-wide communication and resource sharing,
particularly in regard to best practices and lessons learned. Sites have benefitted from cross-
campus information sharing, but continue to lack systematic information about other SSA sites’
strategies. DHE might consider gathering feedback from sites about this issue and discussing
strategies that would facilitate sites’ sharing of key SSA practices.
Feedback from grantees suggests some sites have had difficulty in learning about other
grantees’ SSA programs. Current methods to facilitate this sharing among sites have
resulted in unsystematic and uneven information sharing.
Facilitate opportunities for sites to learn from others’ efforts to collect, manage, and
summarize data relevant to their SSA activities. Site reporting on their strategies for
tracking student data relevant to SSA revealed a range of practices that varied in complexity
and detail, suggesting that measurement might be an area where sites would benefit from
practice or resource sharing.
DHE might also consider making space for a conversation across sites about the evaluation
burden they experience and their strategies for mitigating this burden. Differing perceptions
of the difficulty of data collection might be due to sites’ different institutional capacities or to
different systems used by sites for collecting, tracking, processing and understanding data.
There may be an opportunity for strategic practice sharing between sites that have been
able to extensively engage industry with minimal SSA funding and those that have not. The vast majority of industry engagement work happening at SSA sites was not supported by
STEM Starter Academy Annual Evaluation Report, Year 2, January 2016 Strategic Considerations
UMass Donahue Institute Applied Research & Program Evaluation
44
SSA funding in Year 2. Industry engagement is also an area for growth in the initiative
moving forward, as the focus shifts to completion and transfer or job placement.
3. Continue efforts to strengthen sites’ sustainability planning. Some campuses are beginning to
seek ways to diversify their funding and to enhance the sustainability and institutionalization of
SSA programs. This may be an area in which continued technical assistance and sharing is
particularly important.
In site report narratives, about a third of sites responded that they did not have a
strategy to sustain at least certain elements of their SSA programs. In interviews, DHE
representatives indicated that staffing was one of the pieces of SSA that might be more
readily absorbed by institutions. However, one-third of sites noted in their annual reports that
staff positions would be difficult to sustain. Further discussion is warranted.
4. Engage campuses in aligning evaluation activities with what they locally identify as key
indicators of participant progress and outcomes. During Year 2, grantees discussed several
potentially important metrics (e.g., those relevant to credit attainment or the impact of awareness
and recruiting efforts) that might warrant further consideration.
5. Consider strategies for promoting connections between SSA programs and other STEM
initiatives at each campus. Campuses offer an array of programs to promote engagement and
success in STEM, and SSA is an important part of that support structure. Moving toward a
thoughtful integration of these initiatives may yield substantial efficiencies and positive results.
Cross-grant and cross-program collaboration at each site seemed to foster the identification of
gaps, overlaps, and efficiencies in serving STEM/SSA students. DHE is well positioned to
offer guidance and foster deliberation about the extent to which SSA can and should be
integrated with other initiatives at each site.
STEM Starter Academy Annual Evaluation Report, Year 2, January 2016 Appendices
UMass Donahue Institute Applied Research & Program Evaluation
45
Appendices


![STEM community BLUEPRINT · [STEM COMMUNITY BLUEPRINT] ... Technology, Engineering, ... scale STEM education at the middle grades. The EYE on STEM Leadership Academy](https://img.pdfslide.us/doc/110x75/5ada1bd77f8b9add658c327e/stem-community-stem-community-blueprint-technology-engineering-scale.jpg)