Embed Size (px)
Citation preview

http://www.diva-portal.org
This is the published version of a paper published in Stem Cell Reports.
Citation for the original published paper (version of record):
Aguilo, F., Zakirova, Z., Nolan, K., Wagner, R., Sharma, R. et al. (2017)THAP1: Role in Mouse Embryonic Stem Cell Survival and Differentiation.Stem Cell Reports, 9(1): 92-107https://doi.org/10.1016/j.stemcr.2017.04.032
Access to the published version may require subscription.
N.B. When citing this work, cite the original published paper.
Permanent link to this version:http://urn.kb.se/resolve?urn=urn:nbn:se:umu:diva-137943
Stem Cell Reports
ArticleTHAP1: Role in Mouse Embryonic Stem Cell Survival and Differentiation
Francesca Aguilo,1,2,10,* Zuchra Zakirova,3 Katie Nolan,3 Ryan Wagner,4,5 Rajal Sharma,1 Megan Hogan,4,5
Chengguo Wei,6 Yifei Sun,1,2 Martin J. Walsh,1,7 Kevin Kelley,4 Weijia Zhang,6 Laurie J. Ozelius,8
Pedro Gonzalez-Alegre,9 Thomas P. Zwaka,4,5 and Michelle E. Ehrlich2,3,7,*1Department of Pharmacological Sciences2Department of Pediatrics3Department of Neurology4Department of Cell, Developmental and Regenerative Biology5Black Family Stem Cell Institute6Department of Medicine Bioinformatics Core7Department of Genetics and Genomic Sciences
Icahn School of Medicine at Mount Sinai, New York, NY 10029, USA8Department of Neurology, Harvard Medical School, Massachusetts General Hospital, Charlestown, MA 02129, USA9Perelman Center for Cellular &Molecular Therapeutics, Department of Neurology, The Children’s Hospital of Philadelphia, Perelman School of Medicine,
University of Pennsylvania, Philadelphia, PA 19104, USA10Present Address: Department of Medical Biosciences, Wallenberg Center for Molecular Medicine, Umea University, 901 85 Umea, Sweden
*Correspondence: [email protected] (F.A.), [email protected] (M.E.E.)
http://dx.doi.org/10.1016/j.stemcr.2017.04.032
SUMMARY
THAP1 (THAP [Thanatos-associated protein] domain-containing, apoptosis-associated protein 1) is a ubiquitously expressedmember of a
family of transcription factors with highly conserved DNA-binding and protein-interacting regions.Mutations in THAP1 cause dystonia,
DYT6, a neurologic movement disorder. THAP1 downstream targets and the mechanism via which it causes dystonia are largely un-
known. Here, we show that wild-type THAP1 regulates embryonic stem cell (ESC) potential, survival, and proliferation. Our findings
identify THAP1 as an essential factor underlying mouse ESC survival and to some extent, differentiation, particularly neuroectodermal.
Loss of THAP1 or replacement with a disease-causingmutation results in an enhanced rate of cell death, prolongsNanog, Prdm14, and/or
Rex1 expression upondifferentiation, and results in failure to upregulate ectodermal genes. ChIP-Seq reveals that these activities are likely
due in part to indirect regulation of gene expression.
INTRODUCTION
THAP1 (THAP [Thanatos-associated protein] domain-con-
taining, apoptosis-associated protein 1) is a member of a
large family of proteins which are primarily transcription
factors (Gervais et al., 2013; Roussigne et al., 2003). The
THAP domain, an atypical zinc finger (CysX2-4CysX35-53
CysX2His), is highly conserved and is part of the DNA-
binding domain (DBD) with homology to P-transposable
elements (Majumdar and Rio, 2015). THAP1 mutations
cause DYT6 dystonia (Fuchs et al., 2009), and mutations
are located throughout the protein, with about 50%
in the DNA-binding domain. Importantly, recessive mu-
tations have been identified (Houlden et al., 2010;
Schneider et al., 2011; Xiromerisiou et al., 2012). THAP1
functions, targets, and the mechanisms by which its muta-
tions lead to dystonia are largely unknown, including the
effects of mutations on DNA binding (Campagne et al.,
2012).
Functional studies of THAP1 in human umbilical vein
endothelial cells (HUVECs) show a role in the S phase of
mitosis via modulation of pRb-E2F cell-cycle target genes,
including RRM1 (Clouaire et al., 2005). In vitro, a coiled-
coil domain is required for dimerization (Sengel et al.,
2011). Other interactors include prostate apoptosis
92 Stem Cell Reports j Vol. 9 j 92–107 j July 11, 2017 j ª 2017 The Author(sThis is an open access article under the CC BY-NC-ND license (http://creativ
response-4 protein (Par-4), an effector of cell death linked
to prostate cancer and neurodegenerative diseases (Rous-
signe et al., 2003); HCF-1, a transcriptional co-activator
involved in cell-cycle regulation; andO-GlcNAc transferase
(OGT), which catalyzes the addition of O-GlcNAc and
thereby also participates in epigenetic regulation of gene
expression with an essential function in dividing cells
(Mazars et al., 2010).
In mouse models of DYT6 which harbor either a dis-
ease-causing C54Y mutation in the DBD or a null allele
(DExon2) (Ruiz et al., 2015), rare homozygous embryos
survived to day 14. They were small with defects in periph-
eral organs and brain, which showed deficits in the number
and morphology of neurons. To study the impact of the
mutant alleles on stem cell maintenance and differentia-
tion, we generated mouse embryonic stem cells (mESCs)
homozygous for either the C54Y (Thap1C54Y) or DExon2
(Thap1DExon2) alleles. Herein, we characterize both ESCs,
which are viable with intact stem cell characteristics, but
with abnormalities in cell death, cell cycle, and prolifera-
tion rate, that are more severe in the DExon2 than in
the C54Y homozygote. Furthermore, we show that during
differentiation of embryoid bodies (EBs), wild-type THAP1
is required for repression of a cohort of core pluripo-
tency-associated genes and survival in DExon2 cells, and
).ecommons.org/licenses/by-nc-nd/4.0/).

Exon 2 Exon 1-30
2
4
6
8
mR
NA
expr
essi
on(re
lativ
e to
WT
Exo
n2)
Comparison Thap1 isoforms
WTKIKO
WT KI KO0
2
4
6
8
10
Rel
ativ
em
RN
Aex
pres
sion
Thap1 Ex 1-3 E F
Ex 1 Ex 3
********
D
HDAC1
PGK1/2
THAP1
WT KI KO
nuclear cytoplasmic
WT KI KO
*
* non specific
75 50 37
25
KDa
WT KO0
2
4
6
8
Rel
ativ
em
RN
Aex
pres
sion
Thap1 Ex 2C
KI
Ex 1 Ex 2 Ex 3
**** *****
B
3,0002,000
1,000900800700600450500400350
250 300200
WT KI KO WT WT/
KI
WT/
KO
ESC mice
bp
THAP1 protein
THAP1 gene
Ex 1
Ex 1
Ex 2
Ex 2
Ex 3
Ex 3
1 44 91 110 146 162 213
A
Figure 1. Generation of Thap1-Recombinant ESCs(A) Structure of Thap1 gene and its encoded protein.(B) Genotyping of wild-type (WT), Thap1C54Y/C54Y (KI), and Thap1DExon2 (KO) ESCs by PCR and comparison with the pattern of WT,Thap1C54Y/+ (WT/KI), and Thap1DExon2/+ (WT/KO) heterozygote mice.(C) Thap1 exon 2 (Thap1 Ex 2) transcript level measured by qRT-PCR in wild-type (WT), Thap1C54Y/C54Y (KI), and Thap1DExon2 (KO) ESCs. AnANOVA was performed which revealed a significant difference among the genotypes (F(2,23) = 91.69, p < 0.001). The Holm-Sidak multiplecomparisons test was performed post hoc, revealing significant differences between the genotypes. Data are presented as mean ± SEM ofthree independent experiments. *p < 0.05; ****p < 0.001.(D) Distribution of THAP1 protein in nuclear and cytoplasmic fraction of wild-type (WT), Thap1C54Y/C54Y (KI) and Thap1DExon2 ESCs (KO).Histone deacetylase 1 (HDAC1) and phosphoglycerate kinase 1/2 (PGK1/2) were used as a control of nuclear and cytoplasmic extractpurity, respectively.(E) Level of Thap1 transcript spanning exon 1 and exon 3 (Thap1 Ex 1–3) measured by qRT-PCR in wild-type (WT), Thap1C54Y/C54Y (KI), andThap1DExon2 (KO) ESCs. ANOVA revealed a significant difference among the genotypes (F(2,21) = 73.85, p < 0.0001). The Holm-Sidak
(legend continued on next page)
Stem Cell Reports j Vol. 9 j 92–107 j July 11, 2017 93

apparently for terminal neuronal differentiation in C54Y
homozygote surviving cells.
RESULTS
Generation of Thap1-Recombinant Embryonic Stem
Cells
To explore the function of THAP1 in ESCs, we derived
ESCs from two mouse alleles, (1) Thap1C54Y, a constitutive
knockin (KI) of the C54Y causative mutation in the DBD of
THAP1, and (2) Thap1DExon2, a constitutive knockout (KO),
allele lacking exon2 (Ruiz et al., 2015; Figure 1A).Genotypes
of wild-type (WT), Thap1C54Y/C54Y, and Thap1 DExon2/DExon2
ESCs were analyzed by PCR and compared with WT,
Thap1C54Y/+, and Thap1 DExon2/+ heterozygote mice (Fig-
ure 1B). Consistent with THAP1 autorepression (Erogullari
et al., 2014) and failure of THAP1C54Y to bind at the Tor1a
promoter (Gavarini et al., 2010), Thap1C54Y cells exhibited
higher levels of Thap1 mRNA than WT ESCs, whereas full-
length Thap1 mRNA was undetectable in Thap1DExon2 ESCs
(Figure 1C). THAP1 antibodies recognize several THAP1-
like immunoreactive (THAP1-LIR) species (Ortiz-Virum-
brales et al., 2014). Subcellular fractionation followed
by western blot analysis revealed the presence of
three distinct THAP1-LIR species in the nuclear fraction
at�29kDa,�50kDa, and�75kDa (Figure 1D,upperpanel).
Only the�75-kDa specieswas inducedordrastically reduced
inThap1C54YorThap1DExon2ESCs, respectively, following the
samepatternof the correspondingmRNAasassessedbyqRT-
PCR (Figure 1C). Thus, the�29- and�50-kDa species appear
to be largely composed of cross-reacting proteins in ESCs. In
murine brain, the �29-kDa species was also non-specific,
whereas the 50- and 75-kDa THAP1-LIR specieswere nuclear
and neuron specific, and virtually undetectable in DExon2
embryos (Ortiz-Virumbrales et al., 2014). Primers span-
ning exon 1 and exon 3 of Thap1 mRNA amplified a
de-repressed transcript, i.e., its expression was induced, in
Thap1C54Y/C54Yand Thap1DExon2 ESCs (Figure 1E). This natu-
rally occurring THAP1DExon2 represents less than 1% relative
to the major isoform (containing exon 2) (Figure 1F) and
in vivo does not substitute for the loss of the full-length
isoform.
Loss of THAP1 Alters ESC Viability
To investigate THAP1 function in self-renewal, we analyzed
the expression of stage-specific embryonic antigen 1
(SSEA1) and POU5F1 (Palmqvist et al., 2005) in all three
multiple comparisons test was performed post hoc, revealing significanSEM of at least three independent experiments. ****p < 0.001.(F) Comparison of Thap1 isoforms by qRT-PCR in wild-type (WT), Thamean ± SEM.
94 Stem Cell Reports j Vol. 9 j 92–107 j July 11, 2017
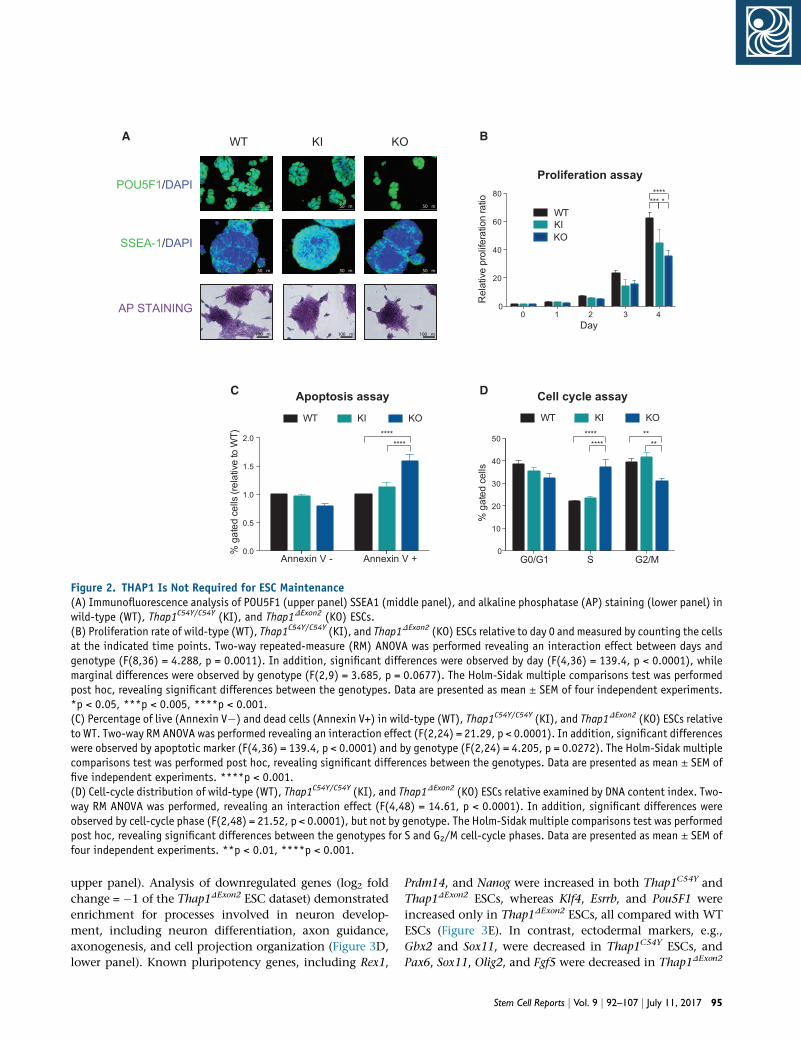
genotypes (Figure 2A, top and middle panels). There were
no detectable differences. The level of alkaline phosphatase
(AP) staining (Figure 2A, bottom panels), characteristic of
undifferentiated ESCs, was also genotype independent.
These data suggest that THAP1 is not required to maintain
the pluripotency state of ESCs.
To assess the proliferation rates of WT, Thap1C54Y, and
Thap1DExon2 ESCs, we counted the cells at predetermined
times after plating. Thap1C54Y ESC proliferation rate was
slightly slower than in WT cells, whereas deletion of
THAP1 Exon2 severely compromised proliferation (Fig-
ure 2B). Viability was not affected in Thap1C54Y ESCs as
indicated by annexin V, whereas the number of viable cells
was reduced�25% in Thap1DExon2 ESCs compared withWT
(Figure 2C). Propidium iodide (PI) staining followed by
DNA flow cytometry revealed a significant reduction in
G2/M-phase cell populations and a corresponding increase
in the number of cells in S phase (Figure 2D) in the
Thap1DExon2 ESCs. Again, Thap1C54Y showed no significant
differences compared with WT ESCs. Thus, loss of full-
length THAP1, but not the C54Y mutation, affects cell
viability by increasing the rate of cell death and arresting
the cell cycle at the S phase.
Global Expression Profile of Thap1C54Y and
Thap1DExon2 ESCs
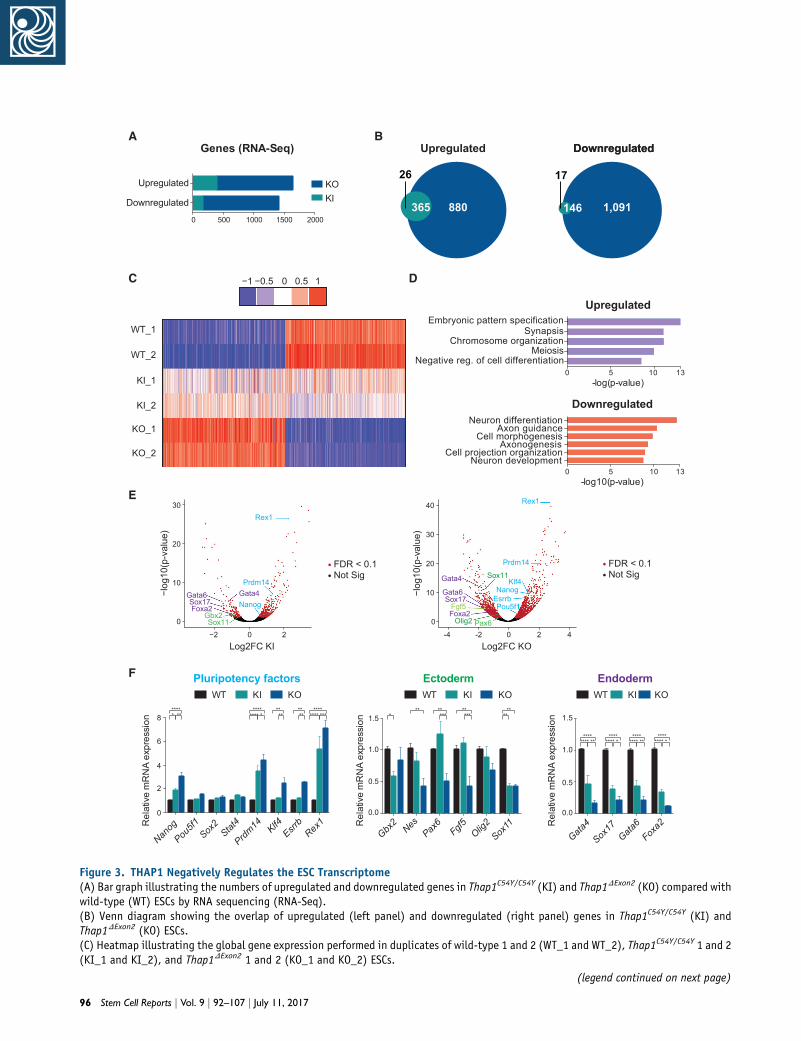
We studied the global transcriptional response in both ESC
lines via high-throughput RNA sequencing (RNA-Seq), and
identified a larger number of differentially regulated genes
in Thap1DExon2 than in Thap1C54Y ESCs (Figure 3A and Table
S1). Specifically, comparing Thap1C54Y withWT ESCs, there
were 391 upregulated and 163 downregulated genes,
whereas comparing Thap1DExon2 with WT we identified
1,245 upregulated and 1,237 downregulated genes (Fig-
ure 3A). Notably, 93% of the upregulated and 89.5% of the
downregulated Thap1C54Y genes were common to both
genotypes (Figure 3B), but a heatmap illustrated that
Thap1C54Y and Thap1DExon2 alleles have distinct effects on
the transcriptional ESCprofile (Figure 3C). These differences
were also reflected by gene ontology (GO) analyses of biolo-
gical processes of uniquely differentially expressed genes
(Figure S1), and could not be attributed to metabolic or
apoptotic gene expression dysregulation. Interestingly,
GO analyses of biological processes of upregulated genes
(log2 fold change = +1 of the Thap1DExon2 ESC dataset)
revealed categories related to embryonic pattern specifica-
tion, synapsis, chromosome organization, meiosis, and
negative regulation of cell differentiation (Figure 3D,
t differences between the genotypes. Data are presented as mean ±
p1C54Y/C54Y (KI), and Thap1DExon2 (KO) ESCs. Data are presented as
A B
C D
Figure 2. THAP1 Is Not Required for ESC Maintenance(A) Immunofluorescence analysis of POU5F1 (upper panel) SSEA1 (middle panel), and alkaline phosphatase (AP) staining (lower panel) inwild-type (WT), Thap1C54Y/C54Y (KI), and Thap1DExon2 (KO) ESCs.(B) Proliferation rate of wild-type (WT), Thap1C54Y/C54Y (KI), and Thap1DExon2 (KO) ESCs relative to day 0 and measured by counting the cellsat the indicated time points. Two-way repeated-measure (RM) ANOVA was performed revealing an interaction effect between days andgenotype (F(8,36) = 4.288, p = 0.0011). In addition, significant differences were observed by day (F(4,36) = 139.4, p < 0.0001), whilemarginal differences were observed by genotype (F(2,9) = 3.685, p = 0.0677). The Holm-Sidak multiple comparisons test was performedpost hoc, revealing significant differences between the genotypes. Data are presented as mean ± SEM of four independent experiments.*p < 0.05, ***p < 0.005, ****p < 0.001.(C) Percentage of live (Annexin V�) and dead cells (Annexin V+) in wild-type (WT), Thap1C54Y/C54Y (KI), and Thap1DExon2 (KO) ESCs relativeto WT. Two-way RM ANOVA was performed revealing an interaction effect (F(2,24) = 21.29, p < 0.0001). In addition, significant differenceswere observed by apoptotic marker (F(4,36) = 139.4, p < 0.0001) and by genotype (F(2,24) = 4.205, p = 0.0272). The Holm-Sidak multiplecomparisons test was performed post hoc, revealing significant differences between the genotypes. Data are presented as mean ± SEM offive independent experiments. ****p < 0.001.(D) Cell-cycle distribution of wild-type (WT), Thap1C54Y/C54Y (KI), and Thap1DExon2 (KO) ESCs relative examined by DNA content index. Two-way RM ANOVA was performed, revealing an interaction effect (F(4,48) = 14.61, p < 0.0001). In addition, significant differences wereobserved by cell-cycle phase (F(2,48) = 21.52, p < 0.0001), but not by genotype. The Holm-Sidak multiple comparisons test was performedpost hoc, revealing significant differences between the genotypes for S and G2/M cell-cycle phases. Data are presented as mean ± SEM offour independent experiments. **p < 0.01, ****p < 0.001.
upper panel). Analysis of downregulated genes (log2 fold
change = �1 of the Thap1DExon2 ESC dataset) demonstrated
enrichment for processes involved in neuron develop-
ment, including neuron differentiation, axon guidance,
axonogenesis, and cell projection organization (Figure 3D,
lower panel). Known pluripotency genes, including Rex1,
Prdm14, and Nanog were increased in both Thap1C54Y and
Thap1DExon2 ESCs, whereas Klf4, Esrrb, and Pou5F1 were
increased only in Thap1DExon2 ESCs, all compared with WT
ESCs (Figure 3E). In contrast, ectodermal markers, e.g.,
Gbx2 and Sox11, were decreased in Thap1C54Y ESCs, and
Pax6, Sox11, Olig2, and Fgf5 were decreased in Thap1DExon2
Stem Cell Reports j Vol. 9 j 92–107 j July 11, 2017 95
Gbx2
NesPax
6Fgf5 Olig
2Sox
110.0
0.5
1.0
1.5
Ectoderm
Re l
ativ
e m
RN
A ex
pres
s io n
WT KI KO** **
* ********
****
Gata4
Sox17
Gata6
Foxa2
0.0
0.5
1.0
1.5
Endoderm
Rel
ativ
e m
RN
A ex
pres
sion
WT KI KO
******** **
******** *
******** **
******** *
Nanog
Pou5f1
Sox2
Stat4
Prdm14 Klf4
Esrrb
Rex1
0
2
4
6
8
Rel
ativ
e m
RN
A ex
pres
sion
Pluripotency factorsF
WT KI KO
* ******
********
*****
****
******** ***
Pax6
Sox11
Olig2
Fgf5 Pou5f1
Klf4
Esrrb
Gata4
Gata6Sox17
Foxa2
Nanog
Prdm14
0
10
20
30
40
420-2-4Log2FC KO
−log
10(p
-val
ue)
Rex1
FDR < 0.1Not Sig
Gbx2Sox11
Gata4Gata6Sox17Foxa2 Nanog
Prdm14
Rex1
0
10
20
30
−2 0 2Log2FC KI
−log
10(p
-val
ue)
FDR < 0.1Not Sig
E
0 5 10 13Negative reg. of cell differentiation
Meiosis Chromosome organization
SynapsisEmbryonic pattern specification
-log(p-value)
Upregulated
D
0 5 10 13Neuron development
Cell projection organizationAxonogenesis
Cell morphogenesis Axon guidance
Neuron differentiation
-log10(p-value)
Downregulated
WT_1
WT_2
KI_1
KI_2
KO_1
KO_2
C −1 −0.5 0 10.5
DownregulatedDownregulatedUpregulated
1,091880365 146
1726
B
0 500 1000 1500 2000
Downregulated
Upregulated
Genes (RNA-Seq)
KIKO
A
Figure 3. THAP1 Negatively Regulates the ESC Transcriptome(A) Bar graph illustrating the numbers of upregulated and downregulated genes in Thap1C54Y/C54Y (KI) and Thap1DExon2 (KO) compared withwild-type (WT) ESCs by RNA sequencing (RNA-Seq).(B) Venn diagram showing the overlap of upregulated (left panel) and downregulated (right panel) genes in Thap1C54Y/C54Y (KI) andThap1DExon2 (KO) ESCs.(C) Heatmap illustrating the global gene expression performed in duplicates of wild-type 1 and 2 (WT_1 and WT_2), Thap1C54Y/C54Y 1 and 2(KI_1 and KI_2), and Thap1DExon2 1 and 2 (KO_1 and KO_2) ESCs.
(legend continued on next page)
96 Stem Cell Reports j Vol. 9 j 92–107 j July 11, 2017
ESCs, all comparedwithWT. Endoderm specification genes,
including Gata4, Gata6, Sox17, and Foxa2, were also signifi-
cantly decreased in both genotypes compared with WT
ESCs (Figure 3E), whereas no differences in mesoderm
markers were detected (data not shown). The RNA-Seq re-
sults were confirmed by qRT-PCR for selected genes (Fig-
ure 3F). Altogether, these results provide initial evidence
that pluripotency factors and developmental regulators are
differentially, andoppositely, regulated afterC54Ymutation
of Thap1, and that such changes in the ESC transcriptome
are even more apparent after loss of full-length THAP1.
THAP1 Genomic Binding Analysis
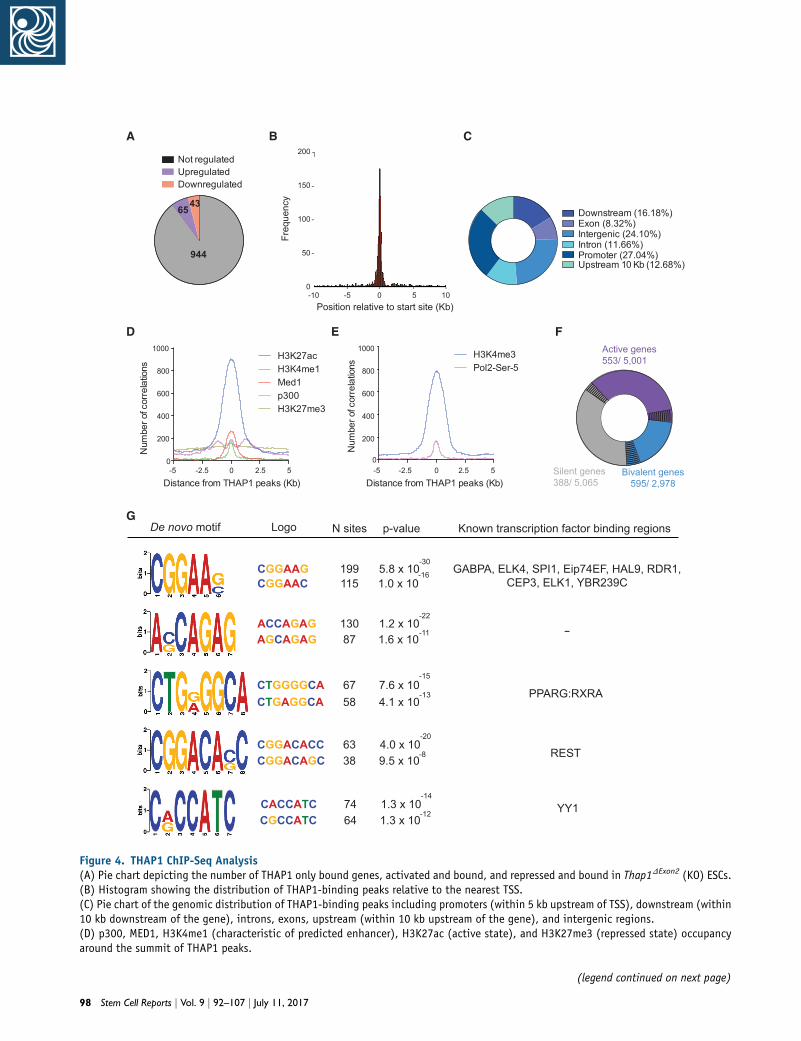
To gain an overview of the global role of THAP1 in ESCs,
we performed chromatin immunoprecipitation followed
by massively parallel sequencing (ChIP-Seq). We iden-
tified 1,731 high-confidence peaks bound by THAP1, corre-
sponding to 1,052 target genes (Table S2), 65 of which were
upregulated and 43 were downregulated in Thap1DExon2
ESCs (Figure 4A). THAP1 binding was enriched at the tran-
scription start site (TSS), extending over a 2-kb interval (Fig-
ure 4B). THAP1 bound only slightly more at promoters
(27.04%) than in intergenic regions (24.10%) (Figure 4C).
We used public ESC ChIP-Seq datasets for p300, Med1,
and monomethylated histone H3 Lys4 (H3K4me1), acetyl
histone H3 Lys27 (H3K27ac), and trimethylated histone
H3 Lys27 (H3K27me3) (Arnold et al., 2013; Heintzman
et al., 2007, 2009; Rada-Iglesias et al., 2011; Visel et al.,
2009) to determine that THAP1 occupation was detected
at activated enhancers but not with the H3K27me3 silent
mark (Figure 4D). By clustering the ChIP-Seq enrichment
profiles of RNA polymerase II Ser-5 phosphorylated (Pol II
Ser-5P) and the histonemodification trimethylated histone
H3 Lys4 (H3K4me3) with high-confidence THAP1 peaks,
we found that THAP1 occupancy occurred at promoter
regions of activated genes (Figure 4E) associated with
GO categories related to metabolic processes, including
(D) Gene ontology (GO) analyses of biological processes of the top ((lower panel) genes of the Thap1DExon2 ESCs dataset.(E) Volcano plots demonstrated differentially expressed genes in Thapversus WT ESCs. Significant and not significant hits are shown in redtency-associated transcripts are shown in blue. Selected ectoderm an(F) qRT-PCR analysis of selected pluripotency factors (left panel), ecmarkers in WT, Thap1C54Y/C54Y (KI), and Thap1DExon2 (KO) ESCs. For pinteraction effect (F(14,170) = 10.92, p < 0.0001). In addition, signifi38.54, p < 0.0001) and by genotype (F(2,170) = 85.22, p < 0.0001). Fointeraction effect (F(10,107) = 3.178, p = 0.0013). In addition, mar2.144, p = 0.0657), and significant differences were observed by genoway ANOVA was performed, revealing significant differences by genotywere observed by endodermal gene(s), and there was no interaction efhoc, revealing significant differences between the genotypes for theFgf5, Sox11, Gata4, Sox17, and Foxa2. Data are presented as mean ± S0.005, ****p < 0.001.
nucleobase-containing compound and RNA metabolic,
and neurologic system process (Figures 4F and S2A).
THAP1 also occupied bivalent or poised genes that are asso-
ciatedwith developmental processes, systemdevelopment,
cell communication, and nervous system and ectoderm
development, among others (Figures 4F and S2B). Occu-
pancy of THAP1 at silent genes was related to diverse func-
tions, including developmental and immune system pro-
cess (Figures 4F and S2C). We identified the top DNA
motifs enriched at the THAP-domain-binding sequence
(THABS) and de novo motifs using the top 1,000 THAP1
peaks and the algorithmMEME (Figure 4G, left panel). Mo-
tifs #1 and #3 overlapped with the THABS identified by
ENCODE in the human K562 cell line (Kheradpour and
Kellis, 2014). Motif #3 contained the core GGCA sequence,
essential for recognition by the THAP domain (Clouaire
et al., 2005). Secondary motifs overrepresented in THABS
overlapped with the binding sequence for RE-silencing
transcription factor (REST), which represses the expression
of neuronal genes in differentiated non-neuronal cells (Bal-
las et al., 2005), and Yin Yang 1 (YY1), which playsmultiple
roles in the development of the central and peripheral ner-
vous systems (He and Casaccia-Bonnefil, 2008; Figure 4G,
right panel). Consistent with previous reports, inspection
of individual gene tracks showed THAP1 binding at the
core promoter of Thap1 and Tor1A (Erogullari et al., 2014;
Gavarini et al., 2010; Kaiser et al., 2010), thus validating
our approach (Figures 5A and 5B, left panel). ChIP-qPCR
using anti-THAP1 antibody confirmed THAP1 occupancy
at these sites in WT but not in Thap1C54Y and Thap1DExon2
ESCs (Figures 5A and 5B, right panel), and at promoters
of the cell-cycle genes Aurora A kinase (Aurka) and tumor
protein p53 (Trp53), at the apoptosis genes Bcl-2-associated
death promoter (Bad) and DNA fragmentation factor sub-
unit beta (Dffb), and at the splicing factor 3a subunit 2
(Sf3a2). Despite this occupancy, the expression of these
genes is not altered in Thap1C54Y and Thap1DExon2 ESCs
log2 fold change 1) upregulated (upper panel) and downregulated
1C54Y/C54Y (KI) (left panel) and Thap1DExon2 (KO) (right panel) ESCsand black, respectively (false discovery rate [FDR] < 0.1). Pluripo-d mesoderm RNAs are depicted in green and purple, respectively.toderm (middle panel), and endoderm (right panel) specificationluripotency factors, two-way ANOVA was performed, revealing ancant differences were observed by pluripotency gene(s) (F(7,170) =r ectodermal markers, two-way ANOVA was performed, revealing anginal differences were observed by ectodermal gene(s) (F(5,107) =type (F(2,170) = 22.47, p < 0.0001). For endodermal markers, two-pe (F(2,81) = 194.2, p < 0.0001); however, no significant differencesfect. The Holm-Sidak multiple comparisons test was performed postfollowing genes: Nanog, Prdm14, Klf4, Esrrb, Rex1, Gbx2, Nes, Pax6,EM of four independent experiments. *p < 0.05, **p < 0.01, ***p <
Stem Cell Reports j Vol. 9 j 92–107 j July 11, 2017 97
De novo motif Logo N sites p-value Known transcription factor binding regions
5.8 x 10⁻³⁰
199
G
GABPA, ELK4, SPI1, Eip74EF, HAL9, RDR1,CEP3, ELK1, YBR239C
CGGAAGCGGAAC 115
130
1.0 x 10⁻¹⁶
-
PPARG:RXRA
REST
1.2 x 10⁻²²
87 ACCAGAG
1.6 x 10⁻¹¹
AGCAGAG
7.6 x 10⁻¹⁵
67 CTGGGGCA58
63 38
4.1 x 10
4.0 x 109.5 x 10
-13
-20
-8
CTGAGGCA
CGGACACCCGGACAGC
74 64
1.3 x 101.3 x 10
-14
-12CACCATCCGCCATC
YY1
Active genes553/ 5,001
Silent genes388/ 5,065
Bivalent genes595/ 2,978
F
-5 -2.5 0 2.5 5
200
400
600
800
Distance from THAP1 peaks (Kb)
Num
bero
fcor
rela
tions
H3K4me3Pol2-Ser-5
E
0
1000
-5 -2.5 0 2.5 50
200
400
600
800
1000
Num
bero
fcor
rela
tions
H3K27aH3K4mMed1p300H3K27
D
Distance from THAP1 peaks (Kb)
ce1
me3
Downstream (16.18%)Exon (8.32%)Intergenic (24.10%)Intron (11.66%)Promoter (27.04%)Upstream 10 Kb (12.68%)
C200
150
100
50
0
Position relative to start site (Kb)
Freq
uenc
y-10 -5 0 5 10
B
Not regulatedUpregulatedDownregulated
944
6543
A
Figure 4. THAP1 ChIP-Seq Analysis(A) Pie chart depicting the number of THAP1 only bound genes, activated and bound, and repressed and bound in Thap1DExon2 (KO) ESCs.(B) Histogram showing the distribution of THAP1-binding peaks relative to the nearest TSS.(C) Pie chart of the genomic distribution of THAP1-binding peaks including promoters (within 5 kb upstream of TSS), downstream (within10 kb downstream of the gene), introns, exons, upstream (within 10 kb upstream of the gene), and intergenic regions.(D) p300, MED1, H3K4me1 (characteristic of predicted enhancer), H3K27ac (active state), and H3K27me3 (repressed state) occupancyaround the summit of THAP1 peaks.
(legend continued on next page)
98 Stem Cell Reports j Vol. 9 j 92–107 j July 11, 2017

compared withWT (Table S1), suggesting that THAP is pre-
sent on specific promoters as part of an inactive complex
poised to respond to defined developmental stimuli yet
to be elucidated. Binding of THAP1 at the non-specific re-
gion of chromosome 8 was not detected (Figure 5C).
Thap1C54Y and Thap1DExon2 EBs Show Increased Cell
Death and Fail to Properly Differentiate
To study lineage specification,we assayed EB formation and
differentiation (Hopfl et al., 2004). The absence of leukemia
inhibitory factor (LIF), replacement of fetal calf serum (FCS)
with KnockOut serum replacement, and growth in suspen-
sion triggered cell differentiation. WT, Thap1C54Y, and
Thap1DExon2 ESCs formed EB aggregates (Figure S3A). It
was immediately apparent that Thap1DExon2 EBs were
smaller and all died between days 12 and 16. We assayed
mRNA levels of markers that either promote or inhibit cell
death (Youle and Strasser, 2008). Compared with WT, the
expression of Baxwas higher in Thap1C54Yand Thap1DExon2
EBs, and Puma also increased in the latter, with a peak at day
8observed inbothgenotypes (Figure S3B, upper panel). The
expression of the anti-apoptoticmarkersXiap and Bcl-2was
also higher in Thap1DExon2 EBs compared with Thap1C54Y
and WT EBs, with a striking 50- to 75-fold upregulation of
Bcl-2 in Thap1DExon2 EBs (Figure S3B, lower panel). Cell
viability in EBs was actually decreased in both Thap1C54Y
andThap1DExon2 ESCs comparedwithWTESCs as indicated
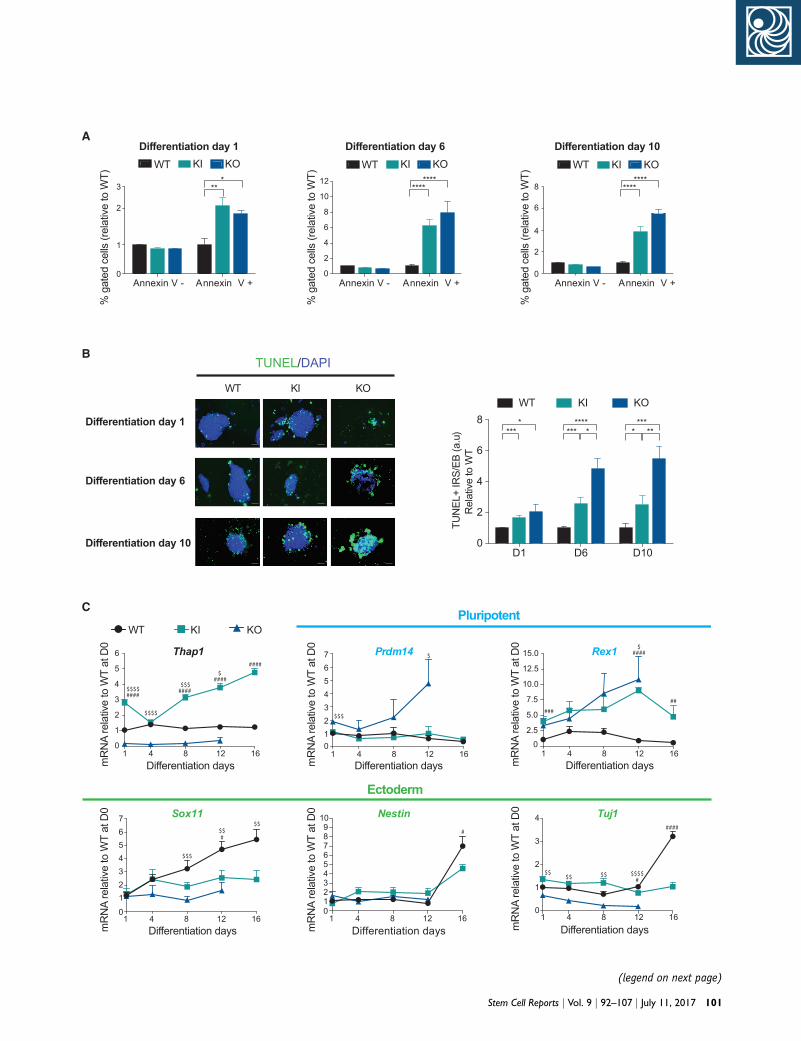
by annexin V (Figure 6A) and TUNEL staining (Figure 6B),
and cleaved caspase-3 staining (Figure S4A), more so in
the DExon2 EBs. Cell death was not diminished in either
genotype when EBs were grown in 40 mM Z-VAD-FMK, a
pan-caspase inhibitor (Figure S4B).Thap1DExon2 EBs demon-
strated the highest percentage of cell death whereas an
intermediate level was observed in Thap1C54Y EBs,
comparedwithWT, over the 4-day period (Figure S4B). Fail-
ure of Z-VAD-FMK to preserve survival is consistent with
literature showing that cellular commitment to apoptosis
occurs at the level of BCL-2 family-regulatedmitochondrial
outer membrane permeabilization (i.e., cytochrome c
release), and that subsequent death phenotypes occur
whether or not caspases activate (Chipuk andGreen, 2005).
We also used qRT-PCR to assay the expression of differen-
tiation markers in EBs, representing the three germ layers,
many of which were already dysregulated in the ESCs.
Thap1 mRNA levels were constant in WT EBs up to day 16,
(E) Pol II Ser-5P and H3K4me3 (characteristic of promoters) occupan(F) Pie chart depicting THAP1 binding sites (black lines) at active (pmental Procedures).(G) The top 1,000 TF ChIP-Seq peaks were used to identify THAP1 de noverlapping of THAP1 binding with the indicated transcription factorare indicated.
the last day examined. In Thap1C54Y ESCs, Thap1 mRNA
was higher than in WT, and increased steadily up to day
16. Thap1 mRNA was undetectable in Thap1DExon2 EBs (Fig-
ure 6C, top left panel). The expression of ESC genes
Prdm14 and Rex1 increased progressively between day 1
and day 12 in Thap1DExon EBs, and the latter also progres-
sively increased in Thap1C54Y EBs (Figure 6C, top right
panel), suggesting that failure to silence pluripotency genes
during differentiation may contribute to restriction of
developmental potential.Thap1C54YandThap1DExon2EBs ex-
pressed markers of endodermal lineage (Figure S3C, upper
panel) following a pattern similar to that of WT EBs. How-
ever, the expression of the mesodermal markers T (i.e.,
Brachyury) and Flk1 was abnormal in the Thap1C54Y and
Thap1DExon2 EBs (Figure S3C, lower right panel). Consistent
with the GO analysis, the expression of the ectodermal
markers Sox11,Nestin, andTuj1were decreased inThap1C54Y
and Thap1DExon2 EBs, whereas the marker of primitive ecto-
derm Fgf5 was normally expressed in Thap1C54Y/C54Y and
Thap1DExon2 EBs compared with WT EBs (Figure S3C, lower
panel). Failure of Thap1C54Y to increase expression of Tuj1
suggests a stall at early ectodermal differentiation.
THAP1 Is Essential for Neural Differentiation of
Mouse ESCs
To further investigate the role of THAP1 during neural dif-
ferentiation of mESCs from EBs, we used one protocol
based on retinoic acid (RA)-dependent neural differentia-
tion (Figure 7A, protocol #1; Okada et al., 2004), and a
second protocol without RA but with the addition of N2
supplemented with epidermal growth factor b and insulin
(Figure S5A, protocol #2; Okabe et al., 1996). Survival of
mutant cells, particularly DExon2, was improved in proto-
col #2 relative to #1. Using protocol #1, undifferentiated,
neural progenitor Nestin-positive cells were detected in
Thap1C54Y EBs, but at a lower expression level than in pro-
tocol #2, which has a longer culture period. Using protocol
#2, Nestin was detected in both WT and Thap1C54Y differ-
entiated cells, but TuJ1-positive neuronal projections,
indicative of more mature neurons, were detected almost
exclusively in WT ESCs and were abnormally restricted to
the internal portion of cell mass in Thap1C54Y ESCs, again
consistent with a stall at early ectodermal differentiation
(Figure S5B). Thap1DExon2 EBs failed to develop Nestin- or
TuJ1-immunopositive neuronal projections with either
cy around the summit of THAP1 peaks.urple), bivalent (blue), and silent (gray) genes (defined in Experi-
ovo motif (left panel showing the five most significant motifs) ands (right panel). Number (N) of sites and the corresponding p values
Stem Cell Reports j Vol. 9 j 92–107 j July 11, 2017 99

Aurka TSS0.0
0.5
1.0
1.5
% In
put (
rela
tive
to W
T)
WT KI KO
Trp53 TSS
Cell cycleC
******** ***
****
WT KI KO0
1
2
3
4
% In
put (
rela
tive
to W
T)
Chrs 8
Bad TSS0.0
0.5
1.0
1.5
% In
put (
rela
tive
to W
T)
Dffb TSS
ApoptosisWT KI KO
********
********
WT KI KO0.0
0.5
1.0
1.5
% In
put (
rela
tive
to W
T)Sf3a2 TSS
********
3,000
3,000
Rep 1
Rep 2
WT KI KO0.0
0.5
1.0
1.5
% In
put (
rela
tive
to W
T)
Tor1A TSS8,300 bp
****
B
Tor1A
****
6,700 bp
1,500
1,500
Rep 1
Rep 2
WT KI KO0.0
0.5
1.0
1.5
% In
put (
rela
tive
to W
T)
Thap1 TSSA
Thap1
********
Figure 5. ChIP and qRT-PCR Validation of THAP1 Target Genes(A) ChIP-Seq binding profiles for THAP1 replicates (Rep) 1 and 2 at the Thap1 locus (left panel). ChIP qRT-PCR analysis of THAP1 at Thap1TSS in WT, Thap1C54Y/C54Y (KI), and Thap1DExon2 (KO) ESCs (right panel). Data are normalized to percent input and relative to WT. An ANOVAwas performed, which revealed a significant difference among the genotypes when examining THAP1 binding (F(2,8) = 1544, p < 0.0001).Holm-Sidak’s multiple comparisons test was performed post hoc, revealing significant differences between the genotypes. Data arepresented as mean ± SEM of four independent experiments. ****p < 0.001.(B) ChIP-Seq binding profiles for THAP1 replicates (Rep) 1 and 2 at the Tor1A locus (left panel). ChIP qRT-PCR analysis of THAP1 at Tor1ATSS in WT, Thap1C54Y/C54Y (KI), and Thap1DExon2 (KO) ESCs (right panel). Data are normalized to percent input and relative to WT. An ANOVAwas performed, which revealed a significant difference among the genotypes when examining THAP1 binding (F(2,0) = 1854, p < 0.0001).The Holm-Sidak multiple comparisons test was performed post hoc, revealing significant differences between the genotypes. Data arepresented as mean ± SEM of four independent experiments. ****p < 0.001.(C) ChIP-qPCR analysis of THAP1 at cell-cycle genes (Aurka and Trp53), apoptosis (Bad and Dffb), and Sf3a2 TSS in WT, Thap1C54Y/C54Y (KI),and Thap1DExon2 (KO) ESCs. Chromosome 8 was used as a negative control. Data are normalized to percent input and relative to WT.Significant differences were observed among the genotypes when examining the binding of THAP1 at the cell-cycle genes Aurka (F(2,7) =118.2, p < 0.0001) and Trp53 (F(2,9) = 37.43, p < 0.0001). Significant differences were observed among the genotypes when examining theTHAP1 binding at apoptosis related genes Bad (F(2,9) = 74.64, p < 0.0001) and Dffb (F(2,9) = 39.21, p < 0.0001). Significant differenceswere observed among the genotypes when examining the THAP1 binding at the RNA splicing related gene, Sf3a2 (F(2,9) = 39.21, p <0.0001). No differences were observed among the genotypes with ANOVA when examining the THAP1 binding at Chrs8. The Holm-Sidakmultiple comparisons test was performed post hoc, revealing significant differences between the genotypes. Data are presented as mean ±SEM of four independent experiments. ***p < 0.005, ****p < 0.001.
100 Stem Cell Reports j Vol. 9 j 92–107 j July 11, 2017
0
1
2
3
%ga
ted
cells
(rel
ativ
e to
WT)
WT KI KO
0
2
4
6
8
10
12
%ga
ted
cells
(rel
ativ
e to
WT)
0
2
4
6
8
%ga
ted
cells
(rel
ativ
e to
WT)
Differentiation day 1 Differentiation day 6 Differentiation day 10
Annexin V - Annexin V + Annexin V - Annexin V + Annexin V - Annexin V +
WT KI KOWT KI KO
A
***
********
********
1 4 8 12 16
1
2
3
4
Differentiation daysmR
NA
rela
tive
toW
Tat
D0
0
Tuj1
1 4 8 12 16
123456789
10
mR
NA
rela
tive
toW
Tat
D0 Nestin
Differentiation days
01 4 8 12 16
1234567
Differentiation daysmR
NA
rela
tive
toW
Tat
D0 Sox11
0
Ectoderm
1 4 8 12 16
1
2
3
4
5
6
Differentiation daysmR
NA
rela
tive
toW
Tat
D0 Thap1
WT KI KO
C
0
TUNEL/DAPI
WT KI KO
Differentiation day 1
B
Differentiation day 6
Differentiation day
04 8 12 16
1234567
Differentiation daysmR
NA
rela
tive
toW
Tat
D0
1
Pluripotent
Prdm14
1 4 8 12 16
2.5
5.0
7.5
10.0
12.5
15.0
Differentiation days
NR
mA
Wot
evitalerT
Dta0 Rex1
0
D1 D6 D100
2
4
6
8
TUN
EL+
IRS/
EB (a
.u)
Rel
ativ
e to
WT
WT KI KO
**** ****
*** ****
***
####$$$$
$$$$
####$$$
####$
####
$$$
$
###
####$
##
$$$
#$$
$$#
$$$$ $$ $$$$
#
####
10
(legend on next page)
Stem Cell Reports j Vol. 9 j 92–107 j July 11, 2017 101
protocol (Figures 7B and S5B). The quantification of
neuronal projections in the three genotypes is illustrated
in the bar graphs (Figures 7C and S5C). Expression of the
ESC genes Prdm14,Nanog, and Rex1 in samples from proto-
col #1 (Figure 6) was abnormally enhanced in Thap1C54Y
and Thap1DExon2 EBs, even at the later stages of neuronal
differentiation (Figure 7D, upper panel). We also moni-
tored progression of ESC differentiation toward neural fates
by analysis of Pax6, Sox11,Nestin, and Tuj1 expression with
qRT-PCR. Thap1C54Y and Thap1DExon2 failed to activate the
expression of these ectodermal markers, suggesting a role
for THAP1 in multiple stages of neuronal differentiation
(Figure 7D, lower panel). Similar results were obtained by
expression analysis in protocol #2 (Figure S5D). Collec-
tively, our results show that THAP1 is required to silence
the expression of the pluripotency factors and to activate
the expression of the neural factors (Figure 7E).
DISCUSSION
We have identified THAP1 as a major regulator of ESC sur-
vival and, to a lesser degree, proliferation and differentia-
tion. As THAP1 mutations result in a neurologic disease,
we were particularly interested in the effects of a causative
mutation, C54Y, on neuronal differentiation. We had
previously posited, based on observations of homozygote
mutant embryos, that THAP1 is required in multiple stages
and layers during embryogenesis, organogenesis, and
maturation of the nervous system, including neurogenesis
and neuritogenesis, and that the C54Yvariant is frequently
unable to substitute for the WT (Ruiz et al., 2015).
In all assays, the homozygous DExon2 phenotype was
more severe than that of the homozygous C54Y pheno-
Figure 6. Thap1C54Y/C54Y and Thap1DExon2 ESCs Show Abnormal EB(A) Percentage of live (Annexin V�) and apoptotic cells (Annexin V+)(WT), Thap1C54Y/C54Y (KI), and Thap1DExon2 (KO) EBs. On each day, dataresults for the annexin V assay during EB differentiation days 1, 6, atest was performed post hoc, revealing significant differences betweemean ± SEM of three independent experiments. *p < 0.05; **p < 0.0(B) Wild-type (WT), Thap1C54Y/C54Y (KI), and Thap1DExon2 (KO) EBs wepanel; scale bar, 50 mm). Quantification of TUNEL+ EBs (right panel)reactive species [IRS+]) as a function of total EB area, normalized to WIRS+/EB quantifications during EB differentiation days 1, 6, and 10 caperformed post hoc, revealing significant differences between the geSEM; n = 10 per group for each day, with data pooled from three indep0.001.(C) qRT-PCR analysis of Thap1, pluripotency markers, and ectodermThap1DExon2 (KO) ESCs at the indicated time points. Data are normalpluripotency markers (Prdm14 and Rex1), and ectodermal markers (Sofound in Table S3. Bonferroni multiple comparisons test was performedData are presented as mean ± SEM of three independent experiments, rdenotes differences between KI versus WT; $ denotes differences bet
102 Stem Cell Reports j Vol. 9 j 92–107 j July 11, 2017
type, confirming that C54Y does not confer a complete
loss of function. Both genotypes showed a decreased rate
of proliferation, more so in the DExon2, consistent with
regulation of the cell cycle by THAP1 in HUVECs and lym-
phoblasts (Cayrol et al., 2007; Vemula et al., 2014). Only
the DExon2 homozygote showed a decrease in viability in
the ESC stage. Thus, a loss of WT THAP1 promotes cell
death even though THAP1 is reportedly a pro-apoptotic
factor (Roussigne et al., 2003). The lack of a requirement
for THAP1 for pluripotency is in marked contrast to
RONIN/THAP11, another member of the THAP family to
have been characterized in this manner (Dejosez et al.,
2008).
We compared this study of the global transcriptome in
ESCs harboring a mutation of THAP1 with previous micro-
array assays of HUVECs with up- or downregulation of
THAP1 and of human lymphoblasts harboring a disease-
causing intronic variant of THAP1, both of which revealed
that the main pathway regulated by THAP1 is the cell
cycle. The cell-cycle abnormalities and cell death described
herein bear a strong resemblance to these HUVECs and
lymphoblasts. Similar to the Thap1DExon2 ESCs, the mutant
human lymphoblastoid cells had decreased viability and
showed a reduced number of cells in the G2 phase (Vemula
et al., 2014). In HUVECs, knockdown of THAP1 resulted in
an impaired G1/S phase (Cayrol et al., 2007). Despite the
presence of cell-cycle abnormalities in theTHAP1null cells,
cell-cycle genes were not a highly ranked GO category,
but genes pertaining to meiosis and X chromosome inacti-
vation categories were also differentially expressed in
Thap1C54Y/C54Y and Thap1DExon2 compared with WT ESCs.
We examined the role of THAP1 in ESC differentiation by
performing EB formation assays. EB formation and growth
were highly compromised in THAP1DExon2 cells. Indeed, we
Viability and Differentiationwere measured over EB differentiation days 1, 6, and 10 in wild-type(mean ± SEM) are presented relative to WT = 1. The two-way ANOVAnd 10 can be found in Table S3. Bonferroni’s multiple comparisonsn the genotypes for each differentiation day. Data are presented as1, ****p < 0.001.re examined with TUNEL on differentiation days 1, 6, and 10 (leftwas performed by scoring TUNEL-immunopositive cells (immuno-T for each differentiation day. The two-way ANOVA results for TUNELn be found in Table S3. Bonferroni’s multiple comparisons test wasnotypes for each differentiation day. Data are presented as mean ±endent experiments. *p < 0.05; **p < 0.01, ***p < 0.005, ****p <
al markers during EB differentiation of Thap1C54Y/C54Y (KI) andized to WT, relative to D1. The two-way ANOVA results for Thap1,x11, Nestin, and Tuj1) for differentiation days 1, 6, and 10 can bepost hoc, revealing significant differences between the genotypes.elative to WT. *p < 0.05; **p < 0.01, ***p < 0.005, ****p < 0.001. #ween KO versus WT.

ESC
Neural Differentiation
Neuronal Cell
THAP1Rex1
Prdm14Nanog
Pax6Sox11NestinTuj1
E
cell death
041 8 10
1
2
3
4 Tuj1
Differentiation days
****
01 4 8 10
5
10
15
20
25
30 Nestin
Differentiation days
***
01 4 8 10
2.5
5.0
7.5
10.0
12.5
15.0
Differentiation days
Sox11
****
1 4 8 10
10
23
456
7
Differentiation days
mR
NA
rela
tive
to W
T at
D0 Pax6
****
Ectoderm
01 4 8 10
5
10
15
Differentiation days
Rex1
****
04 8 10
1
2
3
4
Differentiation days
Nanog
1
****
04 8 10
1
2
3
4
5
Differentiation days
Prdm14
1
****
1 4 8 10
12345678
Differentiation daysmR
NA
rela
tive
to W
T at
D0 Thap1
0
D
WT KI KO
*
Pluripotent
0 20 40 60 80 100
WT
KI
KO
% of colonies with neuronal projections
WTKIKO
C
NES/DAPI TUJ1/DAPI
day 10; Protocol # 1B
BF
100 μm
100 μm 100 μm
100 μm
100 μm
100 μm
100 μm100 μm100 μm
EB Monolayerd0 d2 d6 d10
DMEM N2/B27 + 1 μM RA
Protocol # 1
A
WT
KI
KO
(legend on next page)
Stem Cell Reports j Vol. 9 j 92–107 j July 11, 2017 103
showed that cell viability was compromised in both
Thap1C54Y and Thap1DExon2 EBs, with a greater cell death
phenotype after loss of full-length THAP1. The extent of
cell death in the DExon2 EBs precludes a conclusion
regarding an effect on differentiation. Our investigations
into the mechanism of cell death implicate the mitochon-
drial pathway of apoptosis as responsible for cell death
commitment and caspase activation. Cell death execution,
however, apparently can proceed independently of caspase
activation. Delineation of a definitive sequence of events
leading to cell death requires further characterization.
Although there is increased cell death in the Thap1C54Y
EBs, their survival is sufficient to enable some conclusions
regarding differentiation. Specifically, mesoderm specifica-
tion may be delayed, but, more strikingly for a mutation
that leads to a neurologic disease, neuronal differentiation
appears to stall at an early stage.
The mechanism(s) via which the Thap1 mutations pre-
vent repression of pluripotency markers is not entirely
obvious, but there are leads, particularly in the categories
of dysregulated genes. An in silico search for THABS motifs
in mouse Nanog, Prdm14, Pou5f1, Esrrb, and Klf4 was
negative, and ChIP-Seq did not uncover binding sites
in these genes. Regulation of the pluripotency network
requires cooperation between multiple transcription fac-
tors, including the pluripotency factors themselves, signal
transduction pathways, and epigenetic modifications.
Notably, of the DEGs detected by RNA-Seq, many genes
in these categories are altered, e.g., Bmp4, Dnmt3a and
Dnmt3b, Satb1,Klf10, Sirt6, and Sox17, with a greater degree
of dysregulation in the Thap1DExon2 relative to the
Thap1C54Y ESCs. Interestingly, Dnmt3a and 3b, Satb1, and
Sox17 KO ESCs display phenotypes that are similar in
many ways to those of the Thap1 mESCs. Specifically,
upon exposure to differentiation factors, they simulta-
neously fail to downregulate pluripotency genes and upre-
gulate lineage-specific genes, some of which are already
decreased prior to differentiation (Bergsland et al., 2011;
Chen et al., 2003; Savarese et al., 2009). Thus, the mecha-
nism via which THAP1 regulates these genes requires
Figure 7. Characterization of Neural Differentiation(A) Schematic representation of cell-culture strategy of neural differe(B) Immunofluorescence analysis of Nestin (green; middle panel) and(KO) differentiated cells at day 10 of differentiation. Bright field (lef(C) Bar graph depicting percentage of colonies with neuronal project(D) qRT-PCR analysis of Thap1, pluripotent, and ectoderm marker genand Thap1DExon2 (KO) ESCs at the indicated time points. Data are presepluripotent, and ectoderm marker genes during RA-induced differentiatest was performed post hoc for each gene of interest by day, revealingas mean ± SEM of at least three independent experiments. *p < 0.05(E) Schema illustrating that THAP1 is required to silence the expressioneural factors, as well as mediate ESC survival.
104 Stem Cell Reports j Vol. 9 j 92–107 j July 11, 2017
further examination but may represent a pathway for in-
verse regulation of pluripotency and differentiation genes.
The low percentage (10%) of overlap between RNA-Seq
and ChIP-Seq datasets suggests an alternative role of
THAP1 in regulating gene expression other than direct
binding at DNA, as exists with other zinc-finger factors
(Aguilo et al., 2015). This conclusionmay also be supported
by the relatively low log2 fold changes observed in the
Thap1C54Y ESCs, as much greater changes are seen in
Thap1DExon2 ESCs, where the full-length transcription fac-
tor is eliminated. It is possible that the mutant THAP1 pro-
teins are able to bind to some, but not all, targets of WT
THAP1, and in addition, may bind to sequences that are
normally not bound by WT THAP1 (Campagne et al.,
2012). Also, these mutant proteins may participate in
THAP1 protein interactions. For example, THAP1 interacts
with HCF-1 via amotif that does not include amino acid 54
(Mazars et al., 2010). Therefore, the C54Y formmay still be
able to interact with HCF-1, Par-4, and partners as yet to be
identified, thereby recruiting such transcription factors to
the target DNA. This hypothesis would be consistent with
the fact that there are individuals with dystonia with ho-
mozygote THAP1 mutations. In the case where THAP1
binding is decreased or eliminated, there may be increased
binding of transcription factors with an affinity for similar
motifs. As noted, these include YY1 and REST, thereby
altering levels of their direct and indirect targets, which
include many of the RNA-Seq DEGs. In fact, there is a
very strong super-shift with anti-YY1 in electrophoretic
mobility shift assays using theTor1a THABS and embryonic
brain nuclear extract (data not shown).
In summary, we have identified THAP1 as an essential
regulator of mESC potential, including viability and likely
neuronal differentiation, the latter particularly for the
naturally occurring C54Y mutation. These activities are
likely due in part to direct regulation of gene expression
but to a large extent to indirect regulation, themechanisms
of which are important to identify. Notably, dysregulated
pathways in ESCs with mutations of THAP1 overlap with
those seen in mouse models of DYT6, and the ESC system
ntiation using protocol #1.TuJ1 (red; right panel) of WT, Thap1C54Y/C54Y (KI), and Thap1DExon2
t panel) and DAPI stain (blue) are shown. Scale bars, 100 mm.ion.es during neural differentiation (protocol #1) of Thap1C54Y/C54Y (KI)nted relative to WT at day 0. The two-way ANOVA results for Thap1,tion can be found in Table S3. The Holm-Sidak multiple comparisonssignificant differences between the genotypes. Data are presented
, ***p < 0.005, ****p < 0.001.n of the pluripotency factors and to activate the expression of the

may potentially be exploited to discover how following
differentiation, mutations of the ubiquitously expressed
THAP1 protein can lead to a strictly neurologic disease.
EXPERIMENTAL PROCEDURES
Preparation of nuclear extracts and qRT-PCR gene expression
analysis were performed as previously described (Ruiz et al.,
2015).
Further experimental details and lists of antibodies, public
datasets, and primer sets utilized in this study may be found in
Supplemental Experimental Procedures and other Supplemental
Information.
Cell Culture and EB FormationWild-type (WT), Thap1C54Y, and Thap1DExon2 ESCs were main-
tained on 0.1% gelatin-coated tissue culture plates on irradi-
ated mouse embryonic fibroblasts (MEFs) in DMEM containing
15% FCS, 0.1 mM 2-mercaptoethanol, L-glutamine, non-essen-
tial amino acids, and LIF (1,000 units/mL) and penicillin-
streptomycin (Thermo Fisher). Cells were passaged once onto
gelatin-coated dishes and then aggregated to form EBs in
10-cm Petri dishes at 5 3 106/plate in the absence of LIF. Cells
were harvested for extraction of total RNA at the indicated
time points. All cell cultures were maintained at 37�C with
5% CO2.
Differentiation AssaysInduction of neural differentiation was performed based on gener-
ation of EBs, using two different approaches (Okabe et al., 1996;
Okada et al., 2004), with and without addition of RA as indicated
in Supplemental Experimental Procedures.
Cellular Proliferation, Apoptosis Assay, and Cell-Cycle
AnalysesCellular proliferation, apoptosis assay, and cell-cycle analysis were
performed using a Muse Cell Analyzer (Millipore) following the
manufacturer’s instructions.
Alkaline Phosphatase ActivityAP activity was measured using the Stemgent Alkaline Phospha-
tase Staining kit (Stemgent) following the manufacturer’s
recommendations.
Chromatin Immunoprecipitation with High-
Throughput SequencingTHAP1 ChIP-Seq was performed as described in Supplemental
Experimental Procedures.
RNA-Seq and AnalysisRNA-Seq library preparation was performed at the Weill-Cornell
Medical College Genomic Core Facility using the TrueSeq RNA
sample preparation kit (Illumina RS-122-2001) and sequenced
by the Illumina HiSeq 2,500 platform as 100-bp pair-ended
reads.
Gene Ontology AnalysisFor functional profiling of THAP1 binding regions identified by
ChIP-Seq, GO analysis was performed using Panther software
(http://pantherdb.org) (Mi et al., 2016). GO analysis from RNA-
Seq datasets was performed using the web tool The Database
for Annotation, Visualization and Integrated Discovery (DAVID)
(http://david.abcc.ncifcrf.gov/) (Huang et al., 2009a, 2009b).
Statistical AnalysisAll values are expressed as mean ± SD. Statistical analysis was per-
formed by two-way ANOVA followed by Bonferroni’s multiple
testing corrections usingGraphPad Prism 5 Software. A probability
value of p < 0.05 was considered statistically significant.
ACCESSION NUMBERS
All next-generation sequencing data are deposited in NCBI
GEO database under accession numbers GEO: GSE86947 and
GSE86911.
SUPPLEMENTAL INFORMATION
Supplemental Information includes Supplemental Experimental
Procedures, five figures, and four tables and can be found with this
article online at http://dx.doi.org/10.1016/j.stemcr.2017.04.032.
AUTHOR CONTRIBUTIONS
Conceptualization, F.A., Z.Z., M.J.W., L.J.O., P.G.-A., T.P.Z., and
M.E.E.; Methodology, K.K.; Formal analysis, F.A., Z.Z., R.S., C.W,
and W.Z.; Investigation, F.A., Z.Z., K.N., R.W., M.H., and Y.S.;
Writing – Original Draft, F.A. and M.E.E.; Writing – Review & Edit-
ing, Z.Z., P.G.-A., L.J.O., M.J.W., T.P.Z., and M.E.E.; Funding Acqui-
sition, M.E.E.; Supervision and Project Administration, F.A. and
M.E.E.
ACKNOWLEDGMENTS
We thank Dr. A. Alonso of the Weill-Cornell College of Medicine’s
Epigenomic Sequencing Core for expert advice for sequencing and
library preparation. This work was funded by NIH R01NS081282
(to M.E.E. and L.J.O.) New York State Stem Cell Science (NYSTEM
C029553 to M.E.E.), and the Huffington Foundation (T.P.Z.).
Received: October 11, 2016
Revised: April 26, 2017
Accepted: April 27, 2017
Published: June 1, 2017
REFERENCES
Aguilo, F., Zhang, F., Sancho, A., Fidalgo, M., Di Cecilia, S., Va-
shisht, A., Lee, D.-F., Chen, C.-H., Rengasamy, M., Andino, B.,
et al. (2015). Coordination of m(6)A mRNA methylation and
gene transcription by ZFP217 regulates pluripotency and reprog-
ramming. Cell Stem Cell 17, 689–704.
Arnold, C.D., Gerlach, D., Stelzer, C., Bory�n, q.M., Rath, M., and
Stark, A. (2013). Genome-wide quantitative enhancer activity
maps identified by STARR-seq. Science 339, 1074–1077.
Stem Cell Reports j Vol. 9 j 92–107 j July 11, 2017 105

Ballas, N., Grunseich, C., Lu, D.D., Speh, J.C., and Mandel, G.
(2005). REST and its corepressors mediate plasticity of neuronal
gene chromatin throughout neurogenesis. Cell 121, 645–657.
Bergsland, M., Ramskold, D., Zaouter, C., Klum, S., Sandberg, R.,
and Muhr, J. (2011). Sequentially acting Sox transcription factors
in neural lineage development. Genes Dev. 25, 2453–2464.
Campagne, S.,Muller, I.,Milon, A., andGervais, V. (2012). Towards
the classification of DYT6 dystonia mutants in the DNA-binding
domain of THAP1. Nucleic Acids Res. 40, 9927–9940.
Cayrol, C., Lacroix, C., Mathe, C., Ecochard, V., Ceribelli, M., Lor-
eau, E., Lazar, V., Dessen, P.,Mantovani, R., Aguilar, L., et al. (2007).
The THAP-zinc finger protein THAP1 regulates endothelial cell
proliferation through modulation of pRB/E2F cell-cycle target
genes. Blood 109, 584–594.
Chen, Y., He, Z.X., Liu, A., Wang, K., Mao, W.W., Chu, J.X., Lu, Y.,
Fang, Z.F., Shi, Y.T., Yang, Q.Z., et al. (2003). Embryonic stem cells
generated by nuclear transfer of human somatic nuclei into rabbit
oocytes. Cell Res. 13, 251–263.
Chipuk, J.E., and Green, D.R. (2005). Do inducers of apoptosis
trigger caspase-independent cell death? Nat. Rev. Mol. Cell Biol.
6, 268–275.
Clouaire, T., Roussigne, M., Ecochard, V., Mathe, C., Amalric, F.,
and Girard, J.-P. (2005). The THAP domain of THAP1 is a large
C2CH module with zinc-dependent sequence-specific DNA-bind-
ing activity. Proc. Natl. Acad. Sci. USA 102, 6907–6912.
Dejosez, M., Krumenacker, J.S., Zitur, L.J., Passeri, M., Chu, L.-F.,
Songyang, Z., Thomson, J.A., and Zwaka, T.P. (2008). Ronin is
essential for embryogenesis and the pluripotency ofmouse embry-
onic stem cells. Cell 133, 1162–1174.
Erogullari, A., Hollstein, R., Seibler, P., Braunholz, D., Koschmidder,
E., Depping, R., Eckhold, J., Lohnau, T., Gillessen-Kaesbach, G.,
Grunewald, A., et al. (2014). THAP1, the gene mutated in DYT6
dystonia, autoregulates its own expression. Biochim. Biophys.
Acta 1839, 1196–1204.
Fuchs, T., Gavarini, S., Saunders-Pullman, R., Raymond, D., Ehr-
lich, M.E., Bressman, S.B., and Ozelius, L.J. (2009). Mutations in
the THAP1 gene are responsible for DYT6 primary torsion dysto-
nia. Nat. Genet. 41, 286–288.
Gavarini, S., Cayrol, C., Fuchs, T., Lyons, N., Ehrlich, M.E., Gir-
ard, J.-P., and Ozelius, L.J. (2010). Direct interaction between
causative genes of DYT1 and DYT6 primary dystonia. Ann. Neu-
rol. 68, 549–553.
Gervais, V., Campagne, S., Durand, J., Muller, I., and Milon, A.
(2013). NMR studies of a new family of DNA binding proteins:
the THAP proteins. J. Biomol. NMR 56, 3–15.
He, Y., andCasaccia-Bonnefil, P. (2008). The Yin andYang of YY1 in
the nervous system. J. Neurochem. 106, 1493–1502.
Heintzman, N.D., Stuart, R.K., Hon, G., Fu, Y., Ching, C.W., Haw-
kins, R.D., Barrera, L.O., Van Calcar, S., Qu, C., Ching, K.A., et al.
(2007). Distinct and predictive chromatin signatures of transcrip-
tional promoters and enhancers in the human genome. Nat.
Genet. 39, 311–318.
Heintzman, N.D., Hon, G.C., Hawkins, R.D., Kheradpour, P., Stark,
A., Harp, L.F., Ye, Z., Lee, L.K., Stuart, R.K., Ching, C.W., et al.
106 Stem Cell Reports j Vol. 9 j 92–107 j July 11, 2017
(2009). Histone modifications at human enhancers reflect global
cell-type-specific gene expression. Nature 459, 108–112.
Hopfl, G., Gassmann,M., andDesbaillets, I. (2004). Differentiating
embryonic stem cells into embryoid bodies. Methods Mol. Biol.
254, 79–98.
Houlden, H., Schneider, S.A., Paudel, R., Melchers, A., Schwingen-
schuh, P., Edwards, M., Hardy, J., and Bhatia, K.P. (2010). THAP1
mutations (DYT6) are an additional cause of early-onset dystonia.
Neurology 74, 846–850.
Huang, D.W., Sherman, B.T., and Lempicki, R.A. (2009a). System-
atic and integrative analysis of large gene lists using DAVID bioin-
formatics resources. Nat. Protoc. 4, 44–57.
Huang, D.W., Sherman, B.T., and Lempicki, R.A. (2009b). Bioinfor-
matics enrichment tools: paths toward the comprehensive func-
tional analysis of large gene lists. Nucleic Acids Res. 37, 1–13.
Kaiser, F.J., Osmanoric, A., Rakovic, A., Erogullari, A., Uflacker, N.,
Braunholz, D., Lohnau, T., Orolicki, S., Albrecht, M., Gillessen-
Kaesbach, G., et al. (2010). The dystonia gene DYT1 is repressed
by the transcription factor THAP1 (DYT6). Ann. Neurol. 68,
554–559.
Kheradpour, P., and Kellis, M. (2014). Systematic discovery and
characterization of regulatory motifs in ENCODE TF binding ex-
periments. Nucleic Acids Res. 42, 2976–2987.
Majumdar, S., and Rio, D.C. (2015). P transposable elements in
Drosophila and other eukaryotic organisms. Microbiol. Spectr. 3,
MDNA3-0004-2014.
Mazars, R., Gonzalez-de-Peredo, A., Cayrol, C., Lavigne, A.-C., Vo-
gel, J.L., Ortega, N., Lacroix, C., Gautier, V., Huet, G., Ray, A., et al.
(2010). The THAP-zinc finger protein THAP1 associates with coac-
tivator HCF-1 and O-GlcNAc transferase: a link between DYT6 and
DYT3 dystonias. J. Biol. Chem. 285, 13364–13371.
Mi, H., Poudel, S., Muruganujan, A., Casagrande, J.T., and Thomas,
P.D. (2016). PANTHER version 10: expanded protein families and
functions, and analysis tools. Nucleic Acids Res. 44, D336–D342.
Okabe, S., Forsberg-Nilsson, K., Spiro, A.C., Segal, M., and McKay,
R.D. (1996). Development of neuronal precursor cells and func-
tional postmitotic neurons from embryonic stem cells in vitro.
Mech. Dev. 59, 89–102.
Okada, Y., Shimazaki, T., Sobue, G., and Okano, H. (2004). Reti-
noic-acid-concentration-dependent acquisition of neural cell
identity during in vitro differentiation of mouse embryonic stem
cells. Dev. Biol. 275, 124–142.
Ortiz-Virumbrales, M., Ruiz, M., Hone, E., Dolios, G., Wang, R.,
Morant, A., Kottwitz, J., Ozelius, L.J., Gandy, S., and Ehrlich,
M.E. (2014). Dystonia type 6 gene product Thap1: identification
of a 50 kDa DNA-binding species in neuronal nuclear fractions.
Acta Neuropathol. Commun. 2, 139.
Palmqvist, L., Glover, C.H., Hsu, L., Lu, M., Bossen, B., Piret, J.M.,
Humphries, R.K., and Helgason, C.D. (2005). Correlation of mu-
rine embryonic stem cell gene expression profiles with functional
measures of pluripotency. Stem Cells 23, 663–680.
Rada-Iglesias, A., Bajpai, R., Swigut, T., Brugmann, S.A., Flynn, R.A.,
and Wysocka, J. (2011). A unique chromatin signature uncovers
early developmental enhancers in humans. Nature 470, 279–283.

Roussigne, M., Cayrol, C., Clouaire, T., Amalric, F., and Girard, J.-P.
(2003). THAP1 is a nuclear proapoptotic factor that links prostate-
apoptosis-response-4 (Par-4) to PML nuclear bodies. Oncogene 22,
2432–2442.
Ruiz, M., Perez-Garcia, G., Ortiz-Virumbrales, M., Meneret, A.,
Morant, A., Kottwitz, J., Fuchs, T., Bonet, J., Gonzalez-Alegre, P.,
Hof, P.R., et al. (2015). Abnormalities of motor function, transcrip-
tion and cerebellar structure in mouse models of THAP1 dystonia.
Hum. Mol. Genet. 24, 7159–7170.
Savarese, F., Davila, A., Nechanitzky, R., De La Rosa-Velazquez, I.,
Pereira, C.F., Engelke, R., Takahashi, K., Jenuwein, T., Kohwi-Shige-
matsu, T., Fisher, A.G., et al. (2009). Satb1 and Satb2 regulate em-
bryonic stem cell differentiation and Nanog expression. Genes
Dev. 23, 2625–2638.
Schneider, S.A., Ramirez, A., Shafiee, K., Kaiser, F.J., Erogullari, A.,
Bruggemann, N., Winkler, S., Bahman, I., Osmanovic, A., Shafa,
M.A., et al. (2011). Homozygous THAP1 mutations as cause of
early-onset generalized dystonia. Mov. Disord. 26, 858–861.
Sengel, C., Gavarini, S., Sharma, N., Ozelius, L.J., and Bragg, D.C.
(2011). Dimerization of the DYT6 dystonia protein, THAP1, re-
quires residues within the coiled-coil domain. J. Neurochem.
118, 1087–1100.
Vemula, S.R., Xiao, J., Zhao, Y., Bastian, R.W., Perlmutter, J.S., Race-
tte, B.A., Paniello, R.C., Wszolek, Z.K., Uitti, R.J., Van Gerpen, J.A.,
et al. (2014). A rare sequence variant in intron 1 of THAP1 is
associated with primary dystonia. Mol. Genet. Genomic Med. 2,
261–272.
Visel, A., Blow, M.J., Li, Z., Zhang, T., Akiyama, J.A., Holt, A.,
Plajzer-Frick, I., Shoukry, M., Wright, C., Chen, F., et al. (2009).
ChIP-seq accurately predicts tissue-specific activity of enhancers.
Nature 457, 854–858.
Xiromerisiou, G., Houlden, H., Scarmeas, N., Stamelou, M., Kara,
E., Hardy, J., Lees, A.J., Korlipara, P., Limousin, P., Paudel, R.,
et al. (2012). THAP1 mutations and dystonia phenotypes: geno-
type phenotype correlations. Mov. Disord. 27, 1290–1294.
Youle, R.J., and Strasser, A. (2008). The BCL-2 protein family:
opposing activities that mediate cell death. Nat. Rev. Mol. Cell
Biol. 9, 47–59.
Stem Cell Reports j Vol. 9 j 92–107 j July 11, 2017 107


![CRISPR/Cas9-mediated genome editing induces exon skipping ... · HeLa cells can cause skipping of exon 3, exon 4, or exons 3, 4, and 5 [18]. We also detected infrequent exon skipping](https://img.pdfslide.us/doc/110x75/60db8f117fb86d112c69c947/crisprcas9-mediated-genome-editing-induces-exon-skipping-hela-cells-can-cause.jpg)