Embed Size (px)
Citation preview

The Astrophysical Journal, 770:114 (18pp), 2013 June 20 doi:10.1088/0004-637X/770/2/114C© 2013. The American Astronomical Society. All rights reserved. Printed in the U.S.A.
STELLAR POPULATIONS IN COMPACT GALAXY GROUPS: A MULTI-WAVELENGTH STUDYOF HCGs 16, 22, AND 42, THEIR STAR CLUSTERS, AND DWARF GALAXIES
I. S. Konstantopoulos1,14, A. Maybhate2, J. C. Charlton3, K. Fedotov4,5, P. R. Durrell6, J. S. Mulchaey7, J. English8,T. D. Desjardins4, S. C. Gallagher4, L. M. Walker9, K. E. Johnson9,10, P. Tzanavaris11,12, and C. Gronwall3,13
1 Australian Astronomical Observatory, P.O. Box 915, North Ryde, NSW 1670, Australia; [email protected] Space Telescope Science Institute, 3700 San Martin Drive, Baltimore, MD 21218, USA
3 Department of Astronomy and Astrophysics, The Pennsylvania State University, 525 Davey Lab, University Park, PA 16802, USA4 Department of Physics and Astronomy, The University of Western Ontario, London, ON N6A 3K7, Canada
5 Herzberg Institute of Astrophysics, Victoria, BC V9E 2E7, Canada6 Department of Physics and Astronomy, Youngstown State University, Youngstown, OH 44555, USA
7 Carnegie Observatories, Pasadena, CA 91101, USA8 Department of Physics and Astronomy, University of Manitoba, Winnipeg, Manitoba R3T 2N2, Canada
9 Department of Astronomy, University of Virginia, P.O. Box 3813, Charlottesville, VA 22904, USA10 National Radio Astronomy Observatory, 520 Edgemont Road, Charlottesville, VA 22903, USA
11 Laboratory for X-ray Astrophysics, NASA Goddard Space Flight Center, Greenbelt, MD 20771, USA12 Department of Physics and Astronomy, The Johns Hopkins University, Baltimore, MD 21218, USA
13 Institute for Gravitation and the Cosmos, The Pennsylvania State University, University Park, PA 16802, USAReceived 2013 March 10; accepted 2013 April 17; published 2013 June 3
ABSTRACT
We present a multi-wavelength analysis of three compact galaxy groups, Hickson compact groups (HCGs) 16, 22,and 42, which describe a sequence in terms of gas richness, from space- (Swift, Hubble Space Telescope (HST), andSpitzer) and ground-based (Las Campanas Observatory and Cerro Tololo Inter-American Observatory) imagingand spectroscopy. We study various signs of past interactions including a faint, dusty tidal feature about HCG 16A,which we tentatively age-date at <1 Gyr. This represents the possible detection of a tidal feature at the end of itsphase of optical observability. Our HST images also resolve what were thought to be double nuclei in HCG 16Cand D into multiple, distinct sources, likely to be star clusters. Beyond our phenomenological treatment, we focusprimarily on contrasting the stellar populations across these three groups. The star clusters show a remarkableintermediate-age population in HCG 22, and identify the time at which star formation was quenched in HCG42. We also search for dwarf galaxies at accordant redshifts. The inclusion of 33 members and 27 “associates”(possible members) radically changes group dynamical masses, which in turn may affect previous evolutionaryclassifications. The extended membership paints a picture of relative isolation in HCGs 16 and 22, but shows HCG42 to be part of a larger structure, following a dichotomy expected from recent studies. We conclude that (1) starcluster populations provide an excellent metric of evolutionary state, as they can age-date the past epochs of starformation; and (2) the extended dwarf galaxy population must be considered in assessing the dynamical state of acompact group.
Key words: galaxies: dwarf – galaxies: evolution – galaxies: groups: individual (HCG 16, HCG 22,HCG 42) – galaxies: interactions – galaxies: star clusters: general – intergalactic medium
Online-only material: color figures
1. INTRODUCTION
The classical formulation of a compact group (CG) ofgalaxies defines an assortment of typically three or four denselypacked large galaxies (Hickson 1982; Barton et al. 1996).As such, CGs represent the upper end of the surface/volumedensity distribution in the local universe. The recent adventof large spectroscopic studies and simulations of large-scalestructure have enabled researchers to quantify the surroundingsof CGs, and discover an even division between truly isolatedsystems and those embedded in larger groupings (most notablyMcConnachie et al. 2009; Mendel et al. 2011). Their importancein the context of galaxy evolution therefore becomes evidentwhen considering the possible end states that can arise fromsuch assortments of galaxies. Isolated groups may give rise tofield ellipticals, while embedded groups might be the sites ofgalaxy pre-processing, where spiral galaxies deplete their gas
14 I.S.K. is the recipient of a John Stocker Postdoctoral Fellowship from theScience and Industry Research Fund.
supply and morph into lenticulars before falling into the nearestdeep potential well, and eventually become the ingredients of adry merger.
A number of works have quantified the evolutionary state ofCGs, starting from the cool gas content—a proxy of the availablereservoir for star formation. Verdes-Montenegro et al. (2001)established that CGs are deficient in H i gas when comparedto field galaxies of like morphology, while Johnson et al.(2007) compared the ratio of gas-to-total mass to establish arudimentary evolutionary sequence. In Konstantopoulos et al.(2010), we expanded on this concept by dividing groups intodual, parallel sequences, with one track for groups where gasis contained within the member galaxies (Type A), and anotherfor those groups that feature an intragroup medium (IGM), beit in cold, warm, or hot gas (Type B). The end points of the twosequences differ significantly, in that only the enhanced-IGMsequence should develop an X-ray halo, such as those seenaround massive elliptical galaxies. This is an important feature,as the typically shallow CG potential well cannot build up a hotgas halo, with, perhaps, the exception of the most massive CGs.
1

The Astrophysical Journal, 770:114 (18pp), 2013 June 20 Konstantopoulos et al.
This was supported by Desjardins et al. (2013), who recentlyfound the X-ray emission in several Hickson compact groups(HCGs) to be concentrated mostly around individual galaxies.Collisions between galaxies and the IGM, however, can producean X-ray halo, an effect common among groups with highvelocity dispersions (e.g., in Stephan’s Quintet; Bahcall et al.1984; Sulentic et al. 1995).
One aspect of CGs that has been limited in the past is dwarfgalaxy membership. Since dense environments are likely toprocess dwarfs more efficiently through accretion and infall(Mobasher et al. 2003), the study of dwarfs is potentially atopic of particular importance to CG evolution. Only a fewstudies have touched upon this, such as the statistical work byHunsberger et al. (1998; part of a study of the CG luminosityfunction) and the study of ultracompact dwarf (UCD) formationby Da Rocha et al. (2011). Zabludoff & Mulchaey (1998, 2000)examined the dwarf populations of several loose groups, andincluded HCG 42 in their study. The dwarf galaxy populationof HCG 42 was further enhanced by samples observed by deCarvalho & Coziol (1999) and Carrasco et al. (2006), bringingthe membership to a few dozen potential dwarf members. In ourprevious works on HCGs 7 and 59 we included spectroscopicsamples complete to R ≈ 18, but that only covers a few dwarfgalaxies in each group, e.g., the single detection in HCG 7. Ourincomplete understanding of the CG luminosity function (andtherefore dwarf membership) has potentially adverse effects onvarious measurements. While we routinely use metrics wellsuited to galaxy clusters, such as the velocity dispersion, theirtrue value when derived from three or four elements is highlyuncertain (as concluded by McConnachie et al. 2008).
At the same time, the stellar populations of CGs have beenthe focus of numerous studies. Since star formation and galaxyevolution go hand-in-hand, much that is known about the latterhas come about by studying the colors of CG galaxies (e.g.,infrared colors; Gallagher et al. 2008; Bitsakis et al. 2011;Walker et al. 2012; Cluver et al. 2013) and the properties oftheir star clusters—be it old globular clusters (GCs; Da Rochaet al. 2002), or massive star clusters of young and intermediateage (Palma et al. 2002; Gallagher et al. 2010; Fedotov et al.2011; Konstantopoulos et al. 2010, 2011, 2012). The GCs showmostly regular characteristics, with some groups hosting poorpopulations (NGC 6868; Da Rocha et al. 2002), and young starclusters have been successfully used as chronometers of pastdynamical events in HCG 92 (Stephan’s Quintet; Fedotov et al.2011). While the potential is great, it comes at a great cost, as theHubble Space Telescope (HST) offers the only currently suitableinstrumentation for definitively distinguishing star clusters inwide extragalactic fields from foreground stars and backgroundgalaxies (e.g., Schweizer 2004; Konstantopoulos et al. 2013).Given the propensity of CGs for interactions, intragroup stellarpopulations should also be common. The study by Da Rocha& Mendes de Oliveira (2005) found the intragroup light ofHCG 79 to be consistent with an old population, indicative ofeither ancient interactions or old stars stripped in a recent event.One evolutionary step ahead of intragroup light, in HCG 59 wefound a tidal bridge connecting two galaxies, and roughly datedits emergence to within the past Gyr (Konstantopoulos et al.2012; White et al. 2003).
In recent work, we have pursued an understanding of galaxyevolution in CGs through multi-wavelength studies of individualgroups (Gallagher et al. 2010; Konstantopoulos et al. 2010,2012) and larger samples alike (Hunsberger et al. 1998; Johnsonet al. 2007; Gallagher et al. 2008; Tzanavaris et al. 2010;
Walker et al. 2010, 2012; Desjardins et al. 2013). This workcontinues the series by contrasting the stellar populations ofthree CGs, HCG 16, 22, and 42, in search of evolutionarytrends. We choose these groups as they encompass the fullsequence of gas richness defined in Johnson et al. (2007) andKonstantopoulos et al. (2010): HCG 16 is Type IB, HCG 22is Type IIA, and HCG 42 is Type IIIA (the notation of thisclassification system is outlined in Section 2). We examine thecolors of young and old star clusters, which proxy their ages, totrace ongoing star formation, the recent star formation history,and past merger events. Specifically, we seek a reflection of theevolving evolutionary state of the HCG 16–22–42 sequence inthe star cluster age distribution (see the starburst and interactiondating of Konstantopoulos et al. 2009; Fedotov et al. 2011).In order to establish the star formation history diagnostic mostappropriate to CGs, we compare star cluster colors to broadbandmetrics in the UV, optical, and IR, and stacked wide-field imageswhere we search for tidal features. Finally, we examine the dwarfgalaxy populations by collating past surveys and combiningwith new and previously unpublished spectroscopy. We lookfor an assessment of the importance of including the dwarfs incharacterizations of the stellar populations, and the derivationof dynamical masses.
2. OVERVIEW OF HCGs 16, 22, AND42 AND RELATED LITERATURE
Table 1 gives an overview of the positional, physical, mor-phological, photometric, and nuclear properties of 11 galaxiesin the 3 CGs we study in this paper. The early-type galaxycontent increases along the 16–22–42 sequence and the neu-tral gas content decreases, but other characteristics are not asneatly defined. HCG 16 hosts at least two active galactic nu-clei (AGNs; Turner et al. 2001) and a starburst, while star for-mation and nuclear activity is lower in the two other groups.Regarding the J07/K10 evolutionary type (Johnson et al. 2007;Konstantopoulos et al. 2010), the roman numerals describe de-creasing gas richness (Type I is rich), while the latter discrim-inates between Sequence A of groups with gas contained inindividual galaxies, and Sequence B, containing groups thatshow evidence of an IGM. We note that the A/B type of HCG42 cannot be confidently constrained, as it is uncertain whetherthe diffuse X-ray emission is connected to the IGM, or galaxy42A alone (Desjardins et al. 2013). We refer to this group asType IIIA throughout this paper.
HCG 16 has been studied from several points of view. deCarvalho et al. (1997) updated its dwarf galaxy populationby including three new members, thus increasing the velocitydispersion of the group by ≈65 km s−1 to 400 km s−1. Themerger history of this CG was investigated by de Carvalho &Coziol (1999), who suggest that both group lenticulars, 16Cand 16D, are remnants of recent mergers, as traced by doublespectroscopic nuclear peaks. HCG 16 is described by Belsoleet al. (2003) as a collapsed group at the low-luminosity endof X-ray emitters, while Rich et al. (2010) trace a biconicalpolar outflow in 16D with optical integral-field spectroscopy,which resembles the superwind in M82 (recently revisited byDesjardins et al. 2013). They also detect an intermediate-age(∼400 Myr) A-star population that is rapidly rotating, consistentwith the large sample of lenticular galaxies studied by Emsellemet al. (2011). In a very recent work, Vogt et al. (2013) revisitedthe galactic winds of HCG 16. The HCG 16D wind wascharacterized as symmetric and shock-excited, while the outflowin 16C was found to be asymmetric due to the interaction with
2

The Astrophysical Journal, 770:114 (18pp), 2013 June 20 Konstantopoulos et al.
Table 1HCGs 16, 22, and 42: Positional, Morphological, Photometric, and Nuclear Properties, and Measured Masses
Identifier Coordinates Type mR vR M∗ MH i SFR sSFR Nucleus References(J2000) (mag) (km s−1) (×109 M�) (M�yr−1) (×10−10yr−1)
HCG 16
A: NGC 0835 02 09 24.6 −10 08 09 SBab 12.30 4073 2.65 1.17 5.37 ± 0.62∗ 3.68 ± 0.57 AGN 1, 1, 7, 13B: NGC 0833 02 09 20.8 −10 07 59 Sab 12.65 3864 1.03 0.79 0.33 ± 0.03∗ 0.43 ± 0.07 AGN 1, 1, 7, 13C: NGC 0838 02 09 38.5 −10 08 48 Im 12.82 3851 1.19 3.02 14.38 ± 1.83 21.19 ± 4.10 SB 2, 1, 1, 13D: NGC 0839 02 09 42.9 −10 11 03 Im 13.86 3874 1.03 >4.47 17.06 ± 2.31 30.10 ± 5.80 AGN 3, 5, 6, 13
HCG 22
A: NGC 1199 03 03 38.4 −15 36 48 E2 10.95 2570 2.09 · · · 0.24 ± 0.02 0.21 ± 0.03 A 2, 6, 9, 14B: NGC 1190 03 03 26.1 −15 39 43 Sa 13.64 2618 0.14 · · · 0.03 ± 0.01 0.38 ± 0.07 A 4, 6, 3, 14C: NGC 1189 03 03 24.5 −15 37 24 SBcd 13.19 2544 0.15 <1.35 0.46 ± 0.04 5.64 ± 0.95 E 3, 6, 10, 14
HCG 42
A: NGC 3091 10 00 14.3 −19 38 13 E3 10.31 3964 4.73 4.35 0.44 ± 0.04∗ 0.17 ± 0.03 AGN 3, 6, 9, 14B: NGC 3096 10 00 33.1 −19 39 43 SB0 13.03 4228 0.80 · · · 0.10 ± 0.03 0.23 ± 0.07 A 4, 6, 3, 14C: MCG -03-26-006 10 00 10.3 −19 37 19 E2 12.86 4005 0.86 · · · 0.09 ± 0.02 0.18 ± 0.04 A 4, 6, 11, 14D: PGC 028926 10 00 13.0 −19 40 23 E2 14.73 4042 0.13 · · · 0.01 ± 0.01 0.15 ± 0.07 A 3, 6, 12, 14
Notes. Morphological types from Hickson et al. (1989). Stellar masses, star formation rates (SFR), and specific SFRs (sSFR) are drawn from Tzanavaris et al. (2010),corrected for a known M∗ overestimation factor of 7.4 (P. Tzanavaris 2012, private communication). MH i values from Verdes-Montenegro et al. (2001; individualgalaxies in HCG 16), Price et al. (2000; HCG 22), and Huchtmeier (1994) for the entirety of HCG 42, contained within the quoted HCG 42A beam. Nuclearclassifications of “A” and “E” stand for absorption- and emission-line-dominated spectra. References are given in sequences representing positions, magnitudes, radialvelocities, and nuclear classification: (1) York et al. 2000; (2) Evans et al. 2010; (3) de Carvalho et al. 1997; (4) Skrutskie et al. 2006; (5) Doyle et al. 2005; (6) Hicksonet al. 1989; (7) Ribeiro et al. 1996; (8) Paturel et al. 2003; (9) Huchtmeier 1994; (10) Monnier Ragaigne et al. 2003; (11) Hickson et al. 1992; (12) Carrasco et al.2006; (13) Turner et al. 2001; (14) P. Tzanavaris et al., in preparation. Asterisks (∗) denote SFR values that are potentially contaminated by AGNs.
the H i envelope into which the wind is advancing, and theexcitation mechanism was attributed to a blend of photoinizationand slow shocks.
The GC population of HCG 22A was studied with ground-based optical imaging by Da Rocha et al. (2002), who estimatea specific frequency (number of clusters per unit brightness)of SN = 3.6 ± 1.8, consistent with its morphological type ofE3. The GCs trace a bimodal color distribution with peaks at(B − R)0 = 1.13, 1.42 mag, a common occurrence in early-type galaxies (e.g., Brodie & Strader 2006). Da Rocha et al.(2011) discovered a population of 16 UCD galaxies in HCG 22,and used them to suggest two channels of UCD formation: old,metal-poor star clusters, and stripped dwarf galaxies with highermetallicities and mixed (or young) stellar populations.
As described above, HCG 42 was one of the poor groupsstudied by Zabludoff & Mulchaey (1998, 2000) as part of adwarf galaxy survey. Combined with de Carvalho et al. (1997)and Carrasco et al. (2006), these works have identified dozensof galaxies related to the group. We will be following up on thisaspect with particular interest over the following sections.
3. OBSERVATIONS
The work presented in this paper is based on new and archivaldata from ground- and space-based observatories, which wesummarize in Table 2. We use optical imaging from the LasCampanas Observatory (LCO) DuPont telescope (Direct CCDCamera and Wide Field Imaging CCD Camera) in the B andR bands, taken at the same time as the images presented inKonstantopoulos et al. (2010). We therefore refer the reader tothat paper for details on the observational setup, as well as thedata acquisition and reduction. In the case of HCG 16, the LCOimages are complemented by Sloan Digital Sky Survey (SDSS;York et al. 2000) imaging in the ugriz filter set.
Multi-wavelength imaging comes from the Chandra, Swift,HST, and Spitzer space telescopes. Archival data are drawn
from the Chandra X-ray Center and the NASA/IPAC InfraredScience Archive for post-basic calibration Spitzer imaging inthe four IRAC bands. We make use of the same Swift UV/Optical Telescope (UVOT) data set presented in Tzanavaris et al.(2010; we refer the reader there for details), which includesimages in the w2, m2, and w1 filters (central wavelengths of1928, 2246, and 2600 Å; Poole et al. 2008). HST images fromthe WFPC2 and ACS/WFC cameras were reduced on-the-flyusing the Mikulski Archive for Space Telescopes. WFPC2 datawere then processed with MultiDrizzle to register each chipseparately, before correcting the photometry for charge transferinefficiencies using the prescription of Dolphin (2000). HSTcoverage consisted of multiple pointings, as listed in Table 2.Star formation in HCG 22 was studied through Fabry-Perotdata by Torres-Flores et al. (2009), who found a number of blueregions of the intra-group medium, indicating galaxy-galaxyinteractions in the not-so-distant past.
We also make use of new spectroscopy from Cerro TololoInter-American Observatory (CTIO)-Hydra and previously un-published spectra from the DuPont telescope (Multifiber Spec-trograph and 2D-FRUTTI). The Hydra observations were takenwith a combination of the KPGL2 grating (R ∼ 4400) andGG385 blocking filter, tuned to a central wavelength of 5800 Å,and are described in Konstantopoulos et al. (2010). The Magel-lan spectra were taken on the same observing run as the data usedfor Zabludoff & Mulchaey (1998), so we refer readers there fordetails of the acquisition and reduction. In brief, the wavelengthcoverage extends between 3500 and 6500 Å, at a resolution of∼5–6 Å (3 Å pixel−1 dispersion).
3.1. Star Cluster Selection
The star cluster analysis that will follow in Section 5.1 isbased, for the most part, on WFPC2 images. The exception isthe cluster population of HCG 42A, which makes use of Ad-vanced Camera for Surveys (ACS) data. In this case, we follow
3

The Astrophysical Journal, 770:114 (18pp), 2013 June 20 Konstantopoulos et al.
Table 2Summary of Imaging Observations
Target Instrument Filter Date texp Program ID(s)
HST
HCG 16 WFPC2 F435W 2007 Jul 17 1900 10787. . . . . . F606W 2007 Jul 17 1900 . . .
. . . . . . F814W 2007 Jul 23 1900 . . .
HCG 22 . . . F435W 2007 Sep 21 1900 . . .
. . . . . . F606W 2007 Sep 21 1900 . . .
. . . . . . F814W 2007 Sep 21 1900 . . .
HCG 42 . . . F435W 2007 Nov 13 4200 . . .
. . . . . . F606W 2007 Nov 13 4200 . . .
. . . . . . F814W 2007 Nov 13 4200 . . .
. . . ACS-WFC F435W 2007 Dec 4 1710 . . .
. . . . . . F606W 2007 Dec 6 1230 . . .
. . . . . . F814W 2007 Dec 8 1080 . . .
Swift
HCG 16 UVOT UVW2 2007 Feb 24 4652 –a
. . . . . . UVM2 2007 Feb 24 3894 –
. . . . . . UVW1 2007 Feb 24 2596 –HCG 22 . . . UVW2 2007 Mar 17 3650 –. . . . . . UVM2 2007 Mar 17 3214 –. . . . . . UVW1 2007 Mar 17 2524 –HCG 42 . . . UVW2 2007 Feb 1 3326 –. . . . . . UVM2 2007 Feb 1 3027 –. . . . . . UVW1 2007 Feb 1 2017 –
LCO-100′′
HCG 16 CCD JB 2007 Oct 5 180 –. . . . . . KC-R 2007 Oct 3 120 –HCG 22 . . . JB 2007 Oct 6 120 –. . . . . . KC-R 2007 Oct 4 120 –HCG 42 WFCCD B 2008 May 8 110 –. . . . . . R 2008 May 6 600 –
Spitzer
HCG 16 IRAC 3.6–8.0 μm 2005 Jan 17 27 3596HCG 22 . . . 3.6–8.0 μm 2005 Jan 17 27 . . .
HCG 42 . . . 3.6–8.0 μm 2004 Dec 17 27 . . .
Note. a The Swift observations were taken as a Team Project, and are notassociated with a program ID.
the methodology presented in Konstantopoulos et al. (2010,2012) to select clusters. In brief, we selected star clusters withIRAF-DAOfind15 and filter according to a metric of centralconcentration that is based on point-spread function photom-etry (employing a custom-made function), before applying abrightness cut at MV < −9 mag.
In the case of WFPC2, the lower resolution does not allow forsuch filtering. Instead, we performed a more thorough selectionprocess rather than filtering a long list. First, we divided eachimage by the square root of its median to create a framewith uniform noise. Such a detection image was created foreach individual chip, each pointing, and each filter. We thenperformed an IRAF-DAOfind search and cross-correlated theresulting detection lists, promoting only sources that appearedin two or more lists to the final source catalog. Photometry wasthen performed in each original image. Unfortunately, it was notpossible to further filter through WFPC2 source photometry,so we did so a through visual inspection of all sources withMV < −9 mag. This eliminated the vast majority of background
15 IRAF is distributed by the National Optical Astronomy Observatories,which are operated by the Association of Universities for Research inAstronomy Inc., under cooperative agreement with the National ScienceFoundation.
galaxies, as their surface brightness profiles differ largely fromthose of star clusters. While it is not trivial to quantify theexpected degree of contamination by background galaxies, wenote that spirals are expected to span the entire sequence of starclusters colors (from a few Myr to GC colors), depending ontheir star formation rate (SFR) and history, and dust content. Thiswould preclude regions in color space from being devoid of datapoints. As will be shown in Section 5, we do observe such voids,which suggests the degree of contamination from backgroundgalaxies is low. Not all stars were removed, however, as those arelargely indistinguishable from clusters at the distances studiedand with the WFPC2 image scale. We therefore expect somestellar contamination at the red end of star cluster color space.
The 50% and 90% completeness fractions for our WFPC2 starcluster selection were estimated by generating artificial sourceswith MKSynth (part of the BAOLAB suite; Larsen 1999) andtesting their recovery through the detection method describedabove. We generated a 10 × 10 grid of artificial sources andinserted them into the images of two galaxies per group, inorder to cover varying morphologies. The grid covered bothgalaxy and background, as we wish to assess the observabilityof star clusters throughout these CGs. Our estimates thereforepresent a best-case scenario for spiral and irregular systems,where crowding and variable extinction will further complicatedetection. However, the detection limits should be taken atface value in the case of early-type galaxies, as their smoothprofiles do not inhibit detection. Figure 1 plots the curves,from which we derive [90%, 50%] completeness fractions ofroughly [25, 26] mag in HCGs 16, 22, and [25.5, 26.5] mag inHCG 42. These are all fainter than the brightness cut appliedat MV = −9 mag, therefore we treat our star cluster catalogsas luminosity-limited. It is important in studies of star clusterpopulations to understand the detection limit not only in termsof brightness, but also mass. Since the mass-to-light ratio of asimple stellar population (SSP) evolves with time, the massrequired for a star cluster to be detected will change withits age. Figure 2 investigates this relation by translating thelimiting brightness of a Marigo et al. (2008) model SSP into thecorresponding mass. We estimate completeness over the past[1, 10] Gyr to masses of [1, 5] × 105 M�.
4. PHENOMENOLOGY
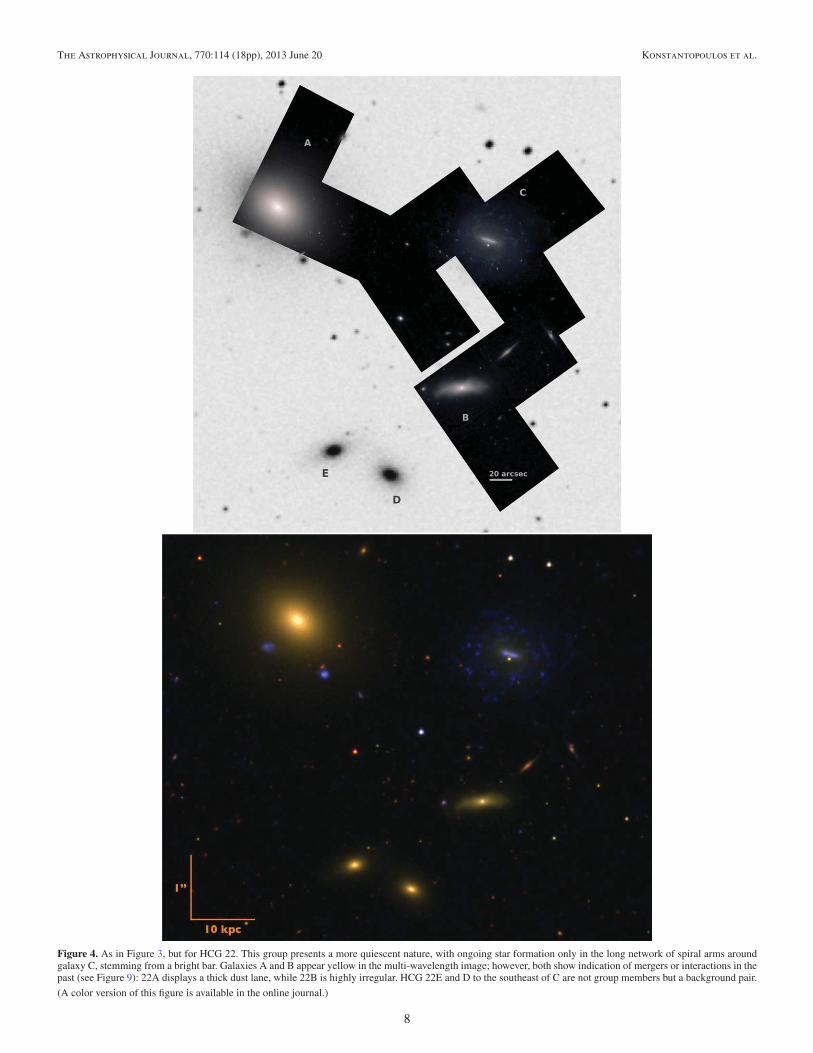
Figures 3–5 show HST imaging (BVI) and color compositesof Swift (UV, blue), LCO (R band, green), and Spitzer (3.6 μm,red) frames, which we use to study the large-scale properties ofthe groups and individual galaxies. Blue emission indicates starformation over the past ≈100 Myr, while older populations shinein red and yellow (photospheres shine in V-band continuum and3.6 μm). Hα emission is covered in the R band, so ongoing starformation will appear purple or pink. Visual inspection showsall galaxies to be consistent with their published morphologicaltypes. We note a lopsided appearance in HCG 16B, highlightedby the isophotes of the high-contrast image of Figure 7. The“patchy” dust distribution of HCG 16C is seen both as red-dening in the optical, and a red/white appearance in the multi-wavelength imaging. We also note the strong bar of HCG 22Cand the low surface brightness of its spiral arms, the onlypart of the image that registers significant UV flux. Finally,we note a “boxy” bulge-disk appearance in HCG 42B, both inthe optical image, and in stellar photospheric emission (R band,3.6 μm). The following sections will visit small-scale features inHCGs 16, 22, and 42.
4

The Astrophysical Journal, 770:114 (18pp), 2013 June 20 Konstantopoulos et al.
Figure 1. Completeness tests for star cluster detections in HCGs 16, 22, and 42. We test two galaxies per group to cover different environments, namely, early- vs.late-type galaxies. I814 is always the limiting filter, and defines the 90% and 50% completeness fractions as roughly 25, 26 mag in HCGs 16, 22, and 25.5, 26.5 magin HCG 42.
(A color version of this figure is available in the online journal.)
4.1. Central Sources in HCG 16C and D
Taking advantage of the high resolution of the HST images, weidentify various bright, compact sources in the central regions ofHCG 16C and D, as shown in Figure 6. The exponential surfacebrightness profile of these sources, as well as their colors, areconsistent with a star clusters, as will be discussed in Section 5.1.In order to understand the structure of these two galaxies weconsider the WFPC2 imaging in the context of the double nucleiproposed for both HCG 16C and D by de Carvalho & Coziol(1999). This report was of the spectroscopic discovery of secondnuclei situated 5′′ west and 7′′ east of the main nuclei of galaxies
16C and D, respectively. These distances are represented bythe dashed blue arcs of Figure 6. The arcs are intersected bystar clusters, which we mark in orange circles of diameter 3′′,the width of the de Carvalho & Coziol spectroscopic aperture.At the ≈30 Mpc distance to HCG 22, the angular separationsbetween the suggested double nuclei correspond to physicaldistances of 1.2 kpc and 1.7 kpc, suggestive of a major mergermorphology akin to the Antennae. This is not the case in thesegalaxies, which instead have morphologies reminiscent of post-interaction systems, such as M82. In addition, the 1.′′5 medianseeing in the de Carvalho & Coziol observations would haveblended the light of many sources in these crowded star-forming
5

The Astrophysical Journal, 770:114 (18pp), 2013 June 20 Konstantopoulos et al.
Figure 2. Conversion of MV = −9 mag into mass over the full evolutionarycourse of a model simple stellar population (Marigo et al. 2008). As a star clusterages it progressively loses stellar material (an effect of stellar evolution), whichresults in an ever decreasing mass-to-light ratio. The mass required for a starcluster to be detected therefore increases over time. In this case, we expect todetect many clusters of moderate mass in their first Gyr of evolution and onlythose globular clusters (age >1 Gyr) more massive than 105 M�. The lines forHCGs 16 and 22 overlap.
(A color version of this figure is available in the online journal.)
inner regions, giving the semblance of a single, bright source,rather than a collection of star clusters. Our high-resolutionimaging do not support the double nucleus scenario of deCarvalho & Coziol (1999) in HCG 16C and D. Finally, it islikely that the AGN-like emission-line ratios discovered bythis previous work represent contamination from shocks in thegalactic wind, which we know to be present from the analysisof Vogt et al. (2013).
4.2. A Tidal Feature about HCG 16A
We make use of our deep, wide-field imaging from LCO tosearch for low surface brightness features in the three groups.We detect a faint tail (3σ–5 σ level with respect to the R-bandbackground) off the eastern side of 16A, shown in Figure 7.The disturbed morphology of 16B and the ring of star formationabout the center of 16A suggest that the two are involved ina tidal interaction. Given that the feature is cospatial with thelarge H i envelope around 16A/16B (Verdes-Montenegro et al.2001; Borthakur et al. 2010), we assume that it contains gas.Tidal features are known to be detectable for no more than∼0.5 Gyr in the optical, after which H i is a more appropriatetracer (Mullan et al. 2011). Therefore, the proposed interactionwas likely a recent one.
We perform photometry on the tail, in order to assess its ageand provenance—did it originate as stripped gas in which starssubsequently formed (e.g., Hibbard et al. 1994; Knierman et al.2003; Werk et al. 2008), or was it a stream of old stars to beginwith (e.g., Gallagher & Parker 2010)? We use archival imagesfrom SDSS, as they cover a broader optical baseline than ourLCO imaging and provide high-quality flat fielding. Figure 8shows the placement of square apertures on the left (orientationhas been altered for illustrative purposes) and optical colorson the right, plotted on top of a Marigo et al. (2008) SSPmodel track. We measure very low fluxes in these apertures(3σ–5 σ above background), hence the following results require
confirmation from deeper imaging.16 The measured colors aremostly representative of an aging population, between 100 Myrand 1 Gyr. We should note that it is difficult to distinguishbetween an aging population with a contribution from redsupergiants, and a highly extinguished coeval population, basedsolely on BVI observations. Box 11, at the tip of the tail, is anexception, as its color is highly suggestive of red supergiantstars (when accounting for the reddening vector). The clumpsat the extremities of tidal tails are often found to outshine theirmain-body counterparts and host more prolonged bursts of starformation (e.g., Mullan et al. 2011). They are also the formationsites of short-lived tidal dwarf galaxies in dynamical models(Bournaud 2010) and H i observations (e.g., Hibbard & vanGorkom 1996), although optical spectroscopy often paints apicture of tail clumps as chaotic, unbound systems (e.g., Tranchoet al. 2012).
The star formation history of this debris feature, as deducedtentatively from Figure 8, characterizes it as an elusive event:an aging tidal tail with little ongoing star formation. Past opticalstudies of tidal debris have favored bright, blue, clumpy star-forming features as they are more readily observable. As a result,optical tails are never observed to contain stellar populationsolder than a few hundred Myr (Trancho et al. 2007, 2012;Bastian et al. 2009; Fedotov et al. 2011). After that stage, theyare usually only observed in radio wavelengths (e.g., Hibbardet al. 2001; Koribalski & Manthey 2005), with ages between0.5–1 Gyr (inferred mostly from dynamical modeling; e.g., Yunet al. 1994). The tail in HCG 16A is faint and smooth, andalso appears to potentially be quite reddened at the AV � 2 maglevel—cf. AV < 0.5 mag across the Mullan et al. (2011) sample.The roughly inferred age of the stellar population in the 16Atail is typical of H i tails, rather than those routinely studied inthe optical. Combining all this information, we suggest that thismight be a rare case of a tidal tail reaching the end of its opticallydetectable phase. Deeper observations are required to confirmthis detection and our interpretation, while another possibilityis that the feature is instead a stellar stream stripped from theearly-type galaxy HCG 16B.
4.3. Other Optical Traits and InfraredSpectral Energy Distributions
All galaxies in HCG 22 display morphological peculiarities.We note a thick equatorial dust lane in galaxy 22A, observedin the past by Sparks et al. (1985), and various low surfacebrightness features in 22B, probably indicative of recent mergersor infall events (Figure 9). The group as a whole does notshow much evidence for star formation away from the faint,extended spiral arms of 22C, which consists of a small, bright barstructure, surrounded by very faint, but orderly and symmetric,spiral arms.
HCG 42 is populated exclusively by early-type galaxies withno deviations from regular morphologies, except perhaps theseemingly “boxy” (bulge/disk) light profile of 42B. The groupis dominated by 42A, which features a high luminosity andstellar mass (see Table 1).
An overall image of normality is conveyed through the IRspectral energy distributions (SEDs) of the individual galaxiesin all three groups, shown in Figure 10. These follow themethodology of Gallagher et al. (2008) and combine 2MASS
16 Toward that end, we recently obtained deep imaging as part of aCanada–France–Hawaii Telescope campaign, which will be presented infuture work.
6

The Astrophysical Journal, 770:114 (18pp), 2013 June 20 Konstantopoulos et al.
Figure 3. Top: HST-BVI imaging of HCG 16, framed in a DSS gray-scale background. The bottom image makes use of Swift-UV, LCO R-band, and Spitzer 3.6 μmframes. Star formation registers blue and cyan colors, while a yellow or red appearance reveals older stellar populations. The star-forming and interacting nature ofHCG 16 is evident in this image: galaxies C and D appear patchy and dusty in the HST image, while galaxy B displays an asymmetric profile, despite its early-typeclassification. Galaxy A shows significant star formation activity in its slender spiral arms.
(A color version of this figure is available in the online journal.)
photometry in the JHK bands (Skrutskie et al. 2006), the fourSpitzer-IRAC bands (3.6, 4.5, 5.8, and 8.0 μm), and 24 μmfrom Spitzer-MIPS. Each plot lists the morphological type of agalaxy next to its identifier, followed by the morphology of theplotted GRASIL model (Silva et al. 1998). We also quote αIRAC(Gallagher et al. 2008), a power-law fit to the 4.5–8.0 part ofthe SED, which serves as a diagnostic of star formation activity:positive values denote quiescent galaxies, while star-formingsystems register negative αIRAC. In previous works (especially
Konstantopoulos et al. 2010), we resorted to customizing thecomponents of each GRASIL model in order to provide anadequate description of CG galaxies. Here, the use of “standard”GRASIL templates is sufficient.
4.4. Gas Content, Cool and Hot
The H i properties of the three groups are summarized inTable 3, where we list MH i, the evolutionary types according tothe Konstantopoulos et al. (2010) and Verdes-Montenegro et al.
7
The Astrophysical Journal, 770:114 (18pp), 2013 June 20 Konstantopoulos et al.
Figure 4. As in Figure 3, but for HCG 22. This group presents a more quiescent nature, with ongoing star formation only in the long network of spiral arms aroundgalaxy C, stemming from a bright bar. Galaxies A and B appear yellow in the multi-wavelength image; however, both show indication of mergers or interactions in thepast (see Figure 9): 22A displays a thick dust lane, while 22B is highly irregular. HCG 22E and D to the southeast of C are not group members but a background pair.
(A color version of this figure is available in the online journal.)
8

The Astrophysical Journal, 770:114 (18pp), 2013 June 20 Konstantopoulos et al.
Figure 5. As in Figure 3, but for HCG 42, which is populated solely by quiescent galaxies. 42B shows a “boxy” bulge/disk morphology, while the smaller system toits west is a dwarf member (see Figure 13). We note no other peculiarities in this system.
(A color version of this figure is available in the online journal.)
(2001) classification schemes, and the MH i deficiency accordingto Verdes-Montenegro et al. (2001; expressed as logarithmicmass in units of M�). The H i morphologies are very different,from the common, extended envelope of HCG 16, to the single
H i-rich galaxy of HCG 22 (22C), to the low overall contentof HCG 42. The Konstantopoulos et al. (2010) scheme buildson the Johnson et al. (2007) ratios of gas-to-dynamical mass(I, II, III trace rich, intermediate, and poor groups) and further
9

The Astrophysical Journal, 770:114 (18pp), 2013 June 20 Konstantopoulos et al.
Figure 6. HST-WFPC2 close-up of HCG 16C and 16D in the F814W band, showing a plethora of star-forming regions. The various markings are meant to relate thisimaging to the double nuclei reported by de Carvalho & Coziol (1999), with circles representing the size of the spectroscopic extraction apertures. We mark the nucleiin green circles, and then draw dashed blue arcs to indicate the suggested separation between the two nuclei (in the direction reported by de Carvalho & Coziol 1999).Orange circles mark star clusters that intersect this arc and are therefore viable candidates for the detections flagged as second nuclei. The high spatial resolution of thisimaging thus argues against the interpretation of the previous work discussed. At the proposed distances from the respective nuclei of 1.2 and 1.7 kpc, the proposedsecond nuclei of HCG 16C and D would give rise to an Antennae-like, major merger appearance, whereas the two galaxies are more reminiscent of post-interactionsystems, such as M82.
(A color version of this figure is available in the online journal.)
Figure 7. Smoothed, co-added LCO images in the B and R bands, presented at high contrast. North is to the top, east to the left, and the field covers a region of≈60 × 40 kpc (or ≈250′′ × 170′′). The contours correspond to the R-band image, and numbers count the sigma level with respect to the background. A tidal featureto the east of galaxy A is detected at the 3σ–5 σ level, while the isophotes of HCG 16B are distorted.
(A color version of this figure is available in the online journal.)
divides groups according to the location of the gas: solelywithin galaxies (Type A) or ones with an IGM detectable inany wavelength (Type B). In summary, HCGs 16, 22, and 42represent Types IB, IIA, and IIIA, respectively.
The properties of the hot gas in the three groups are not quiteas diverse as those of the H i. The detailed analysis of Desjardinset al. (2013) detects no significant hot IGM component in thethree groups, albeit the Chandra data of HCG 16 are perhapstoo shallow to make that assessment. Diffuse X-ray emission is,however, detected around certain galaxies. The region around42A resembles an extended envelope of hot gas, similar inappearance to those found around massive galaxies in clusters(e.g., Ponman et al. 1999). In addition, data from the Survey forIonization in Neutral-Gas Galaxies (Meurer et al. 2006) show
that the hot gas plumes observed in X-rays are coincident withHα emission, as noted by Werk et al. (2010). Finally, Jeltemaet al. (2008) presented some tentative evidence for an X-raybridge connecting 16A and B in Chandra imaging.
5. STELLAR POPULATIONS
5.1. Young- and Intermediate-age Star Cluster Populations
In previous installments of this series, we have used starcluster populations to add to the characterization of CGs. Theyare particularly helpful in accounting for star formation in caseswhere our broadband metrics are contaminated by AGNs (aconsideration in this case; see Table 1). Here, we take advantageof the opportunity to contrast the populations of three groups
10

The Astrophysical Journal, 770:114 (18pp), 2013 June 20 Konstantopoulos et al.
Figure 8. SDSS ugriz photometry of the HCG 16A tidal tail. The left panel shows a contour plot of the r-band SDSS image, with the location of numbered photometricapertures marked in boxes (disk), triangles (tail), and a star for the nucleus. The orientation has been adapted for illustrative purposes (east to the top, north to the right,or a clockwise 90◦ rotation with respect to Figure 3). Given the marginal detection, any deductions are tentative and need to be followed up with deeper imaging. Theright panel shows the u − g vs. r − i colors of these apertures, plotted against Yggdrasil stellar population models representing a single burst population (solid), and acontinuous star formation history (dashed). The numbers on the track denote each age dex, while the cross hair indicates typical photometric errors. When comparedto simple stellar populations, most apertures appear to exhibit a relatively high dust attenuation, as demonstrated by the reddening vector, an unusual trait for tidaldebris. We place the age of the underlying population between ∼100 Myr and ∼1 Gyr with no discernible age-space trends. The clump at the end of the tail is anexception, as its color suggests the presence of red supergiants and hence ongoing star formation. Deeper imaging would better constrain the age of the feature andhence the interaction that created it.
(A color version of this figure is available in the online journal.)
Figure 9. Left: a prominent dust lane can be seen in this HST-F450W image of the inner ≈2 kpc of HCG 22A, possibly the signature of a recent merger. North is tothe top and east to the left of the image, as is the image on the right, where the contrast of the F814W frame has been set to demonstrate the various disturbances inthe optical morphology of HCG 22B. We interpret this as the result of a recent merger (following a series of passages).
(A color version of this figure is available in the online journal.)
representing a three-stage sequence along the Konstantopouloset al. (2010) evolutionary diagram: Types IB, IIA, and IIIA.
This sequence is largely reflected in the star cluster popula-tions displayed in Figure 11. Here, we make use of YggdrasilSSP models, as they incorporate nebular emission and contin-uum transmitted in the B450 and V606 filters.17 Star clusters canbe roughly age-dated through this diagram by comparing theirposition in color space to the SSP track, which evolves from6 Myr to ∼10 Gyr. Specifically, HCG 16 shows evidence of starformation extending to a few Gyr into the past, with much activ-ity over the past Gyr, consistent with star formation in the threelate-type galaxies. It does not, however, show a pronounced GC
17 In Figure 2, the nebular features were not desirable, hence we used theSSPs of Marigo et al. (2008).
clump at ages ∼10 Gyr, as one should expect from the lack ofelliptical galaxies and the low overall masses of the galaxies.
In HCG 22 we detect few young clusters, with most sourcesfound to have ages older than 1 Gyr. This denotes little activityover the past Gyr (centered around the spiral galaxy 22C, asis the H i), and pronounced star formation before that mark.It is therefore evocative of a gas-depleted system, in a fashionsomewhat contrary to its Johnson et al. (2007)/Konstantopouloset al. (2010) type. While it features two early-type galaxiesamong three members, it only shows a weak GC clump. Whilethe specific frequency for GC-rich HCG 22A is consistent withits morphological type (as discussed in Section 2), the GC clumpis rather weak. This is rather interesting, as galaxies are notnormally found to have middle-age-heavy cluster populations
11

The Astrophysical Journal, 770:114 (18pp), 2013 June 20 Konstantopoulos et al.
Figure 10. Infrared spectral energy distributions (SEDs) of HCGs 16, 22, and 42 (left, center, and right). The represented galaxies follow the SEDs of their nominalmorphological types (marked in brackets next to the galaxy identifier), with the exception of HCG 22B, the galaxy highlighted in Figure 9 (right panel). The selectedmodel SEDs are indicated in the bottom right of each panel, with the number in brackets indicating the logarithmic age (yr) of early-type galaxy SEDs, or the inclinationof late types. The numbers below the SED mark the αIRAC diagnostic (Gallagher et al. 2008) of mid-IR activity. This is a power-law fit of the Spitzer-IRAC bands(4.5–8.0 μm), therefore negative values denote activity, and positive ones quiescence.
Table 3HCGs 16, 22, and 42: H i Properties
Identifier log(MH i/M�)a H i Typeb δH ic Structure
(K10) (VM01) log(M�)
HCG 16 14.20 IB 2 +0.41 EnvelopeHCG 22 9.13 IIA 2 +0.55 Single galaxyHCG 42 9.40 IIIAd · · · −0.22 Depleted
Notes.a H i masses from Borthakur et al. (2010; HCG 16), Price et al. (2000; HCG 22),and Huchtmeier (1994; HCG 42).b Classifications by Konstantopoulos et al. (2010) and Verdes-Montenegro et al.(2001).c Deficiency in H i mass, as compared to field galaxies of matched morphologicaltypes. After Borthakur et al. (2010) and Verdes-Montenegro et al. (2001).d The type of HCG 42 is uncertain, as it is not clear whether the diffuse X-raycan be attributed to the IGM or galaxy 42A alone.
(i.e., between 1 and a few Gyr old), hence HCG 22 seems tohave undergone a period of intense star formation in the past(>1 Gyr). The hints of post-merger morphologies in galaxies22A, 22B might offer a clue as to the origin of this notable starcluster population.
At the evolved end of the gas-richness sequence, HCG 42shows little evidence of star formation in the past ∼ Gyr, witha pronounced GC clump, a distribution consistent with its IIIAevolutionary type. In this case, the areas of color space that arevoid are perhaps more interesting than interpreting those thatare full: the absence of star clusters at ages younger than 1 Gyrindicates that star formation was essentially switched off at thatpoint in time. This is when HCG 42 seems to have entereda different phase of evolution, one featuring little conversion ofgas into stars.
In contrast with our previous studies of HCGs 7, 31, and 59(Gallagher et al. 2010; Konstantopoulos et al. 2010, 2012), wefind no large-scale star cluster complexes in these three groups(except perhaps in the spiral arms of HCG 16A). This should beexpected in quiescent HCGs 22 and 42, and possibly explainedby the apparently high dust content in star-forming galaxies 16Cand 16D.
5.2. The Globular Cluster Population of HCG 42A
The old GCs are more difficult to study, due to the brightlimiting magnitude and restricted field coverage of the WFPC2imaging. While HCG 22A (NGC 1199) does harbor a significantGC population (Barkhouse et al. 2001), the number of GCspresent in our WFPC2 data is not large enough to allow a moredetailed study.
We do, however, detect a very large population of GCs inour ACS images of HCG 42A, a massive elliptical galaxy.We alter the source selection cuts of Section 3.1 to allow forthe inclusion of more clusters. This is acceptable here, as GCshave very tightly confined colors. We therefore adopt a limitingmagnitude of V606 = 25.2, or MV = 8.7 mag at the adopteddistance of 59 Mpc. We thus sample the top 15% ± 5% of the GCluminosity function, assuming a luminosity function turnover atMV = −7.2 ± 0.2 mag (e.g., Jordan et al. 2007).
We detect a total of 489 objects with GC-like colors,shown in the color–color diagram of Figure 12 (left). TheB435−V606 colors from the ACS photometry were convertedto Johnson–Cousins B − I colors using the synthetic transfor-mations from Sirianni et al. (2005). These colors were in turnconverted to the metallicity [Fe/H] using the conversion rela-tion from Harris et al. (2006) and gave rise to the metallicitydistribution of Figure 12 (right). The histogram shows a clearbimodal distribution. An analysis according to the KMM metricof Ashman et al. (1994) reveals the peak of the “blue” GC dis-tribution at (B − I )0 = 1.74 mag, or [Fe/H] = −1.2, and thatof the “red” GCs at (B − I )0 = 2.21 mag, or [Fe/H] = +0.1.Related uncertainties are expected to arise from the photometriccalibration and the color-to-[Fe/H] conversion, at the 0.3 dexlevel.
We are also able to extrapolate the total number of GCsin HCG 42A by correcting the number of detections withinthe ACS frame to the nominal area of the entire galaxy. Wederived the radial profile of the GC system in a series ofelliptical annuli with a fixed ε = 0.25. Since our single ACSframe does not cover a background region, we used imagingof HCG 7 (from Konstantopoulos et al. 2010, at a similardistance of 65 Mpc) to estimate background contaminationin each annulus, to the edge of the ACS frame (a majoraxis distance of 3.′7). Based on Poisson errors in the number
12

The Astrophysical Journal, 770:114 (18pp), 2013 June 20 Konstantopoulos et al.
Figure 11. Star cluster candidates in HCGs 16, 22, and 42 (left, WFPC2 filters), and the combined populations of four other groups, shown on the right as a benchmark(ACS filters). The dashed, solid, and dash-dotted lines trace the evolution of Yggdrasil SSP models of [0.4, 1.0, 2.5] Z� (Zackrisson et al. 2011). The model tracksinclude nebular emission transmitted in the F435W and F606W filters at ages �7 Myr. The extinction vector has a length of 1 mag (AV ). Sources aligned with vectorsoriginating on the nebular segment have ages less than ≈7 Myr. The relative dearth of sources in the nebular part of color space, as compared to all HCGs of the rightpanel, diagnoses relatively weak current star cluster formation activity throughout. The three groups display different star formation histories. HCG 16 features manyclusters of supersolar metallicity, while it does not appear to host a distinct population of old globular clusters. This is to be expected, given the low galaxy massesand mainly late-type morphologies. Both HCG 22 and 42 show remarkable populations, dominated by clusters at intermediate and old ages (>1 Gyr), with only veryfew young clusters in HCG 22C. This is probably related to a group-wide era of merger-driven star formation in the past, consistent with the morphological types ofthe galaxies in these two groups, and the various signs of disturbance. From this we diagnose that HCGs 42 and two-thirds of HCG 22 entered a different mode ofevolution (with little conversion of gas to stars) over the past ∼1 Gyr.
(A color version of this figure is available in the online journal.)
Figure 12. Globular clusters in HCG 42. Globular cluster selection (left) and color/metallicity distribution for HCG 42. The brightness cut at m606 < 25 magcorresponds to M606 < −8.8 mag, which is brighter than the peak of the GC luminosity function (e.g., Jordan et al. 2007), which complicates our interpretation. Wefind a bimodal distribution, common among early-type galaxies in clusters but not necessarily those in CGs (e.g., Konstantopoulos et al. 2010, 2012).
(A color version of this figure is available in the online journal.)
counts, and considering background contamination at the levelof 31 ± 11 GCs, we predict a total number of clusters abovethe cutoff magnitude of N
brightGC = 680 ± 63. Adopting a
completeness level of 0.9 ± 0.1 and extrapolating to the entireGC luminosity function, we derive a total GC population ofHCG 42A of NGC = 5030 ± 2140. Combined with the absolutemagnitude of MV = −23.2 mag18 for the host galaxy yieldsa specific frequency SN = 2.6 ± 1.1 (the number of clustersper unit luminosity). All the above properties of HCG 42A, itsmorphology, specific frequency, GC bimodality, and location ofcolor/metallicity peaks, are very similar to those of luminousgalaxies in the cluster environment (e.g., Harris et al. 2006;
18 Based on the integrated R magnitude in Table 1 and assumingV − R = 0.5 mag.
Brodie & Strader 2006; Peng et al. 2006). These attributes couldbe related with HCG 42 being embedded in a larger structure,as will be discussed in the following section.
5.3. Dwarf Galaxies
We now turn our attention to the dwarf galaxy populations ofthe three HCGs. We combine information from the literature andnew Hydra spectroscopy to study a total of 59 dwarf galaxies.More specifically, we incorporate the data sets of de Carvalhoet al. (1997, hereafter dC97), Zabludoff & Mulchaey (2000,ZM00), and Carrasco et al. (2006), albeit for only a limitedprojected area about the group center. It is worth noting thatthe Carrasco et al. catalog builds on the previous ones andextends coverage to faint targets (down to R ≈ 21). We also
13

The Astrophysical Journal, 770:114 (18pp), 2013 June 20 Konstantopoulos et al.
Figure 13. Diagnostic maps (top row) and phase-space diagrams (bottom row) for candidate member galaxies in HCGs 16, 22, and 42 (left, center, and right). Mainmembers are marked with stars and their barycenter as a cross. Lettered circles and yellow boxes mark galaxies that qualify as members and associates (possiblemembers; see Section 5.3 for details). The phase-space diagrams plot the projected distance from the group barycenter against the deviation in velocity, in terms of σ
away from the main member mean. The hashed regions mark the 3σ boundary that qualifies a galaxy as a group member. HCG 16 appears to be a populous group,with seven lesser members in addition to the four main giants. Galaxy X lies at the end of the greater H i cloud that covers the main members (Verdes-Montenegroet al. 2001). HCG 22 shows five member dwarfs and one associate according to our employed diagnostic. The 3σ cut is, however, based on a small number of maingalaxies, hence the associate might in reality be a member. HCG 42 is a relatively rich group, numbering 17 members and 26 associates. The open green boxes markgalaxies studied by Carrasco et al. (2006) and not included in any previous catalog. They cover a fainter part of the luminosity function than Zabludoff & Mulchaey(2000) and de Carvalho et al. (1997), albeit in a limited field of side 50′. The velocity structure appears to place the giants at the end of a large structure, perhaps afilament.
(A color version of this figure is available in the online journal.)
make use of previously unpublished velocity tables from thespectroscopic campaign that provided the basis for the Zabludoff& Mulchaey (1998, 2000) papers on poor groups (referred toas ZM98 throughout this section). Given the inhomogeneityof these collated catalogs, it is challenging to fully assess thecompleteness both in space and brightness. The samples are,however, complete to R ≈ 18 mag, as they draw from theZM00 catalogs (see their Figure 3), conditional on no galaxieshaving been filtered out by the ZM00 selection. Given the meancomoving radial distances to the three groups (based on redshiftsfrom Hickson et al. 1992), this detection limit corresponds toMR = [−15.5,−14.7,−15.9] mag. The Carrasco et al. sampleextends the completeness of the HCG 42 dwarf galaxy catalogto V = 20 mag at the 80% level (MV = −13.9 mag) over alimited central area.
Figure 13 plots all galaxies within 5σ of the velocity dis-persion for each group, derived from giant galaxies only. Thiswas adapted to 10σ for HCG 42 since it is situated in a galaxy-rich region, although we note that the majority of these galaxieslie within the 5σ velocity cut. Given the large error associatedwith deriving a statistical dispersion from so few data points,anything in this 5σ velocity range is considered an “associate,”while we enforce a 3σ criterion for membership. Associatesand members are plotted as orange boxes and blue circles re-
spectively, while the Carrasco et al. (2006) galaxies are plottedas open green boxes, to mark their different completeness leveland spatial coverage. The following sections visit each groupindividually.
5.3.1. HCG 16
HCG 16 is covered by SDSS, so we performed a spectroscopicsearch in a degree-wide area centered on the group barycenter(the mass-weighted mean R.A. and decl.). We allow for aspread of ±5σ about the mean redshift, representing the above-mentioned selection of group associates. The search yields fourgalaxies beside the four group giants, none of which werepreviously known to be associated with HCG 16. Furthermore,the unpublished ZM98 tables list three objects at accordantredshifts, and two galaxies from the dC97 catalog completea set of nine dwarf members down to MR ≈ 18 mag. Theyare distributed about the giant galaxies in a roughly symmetricfashion, inside a projected area of side 0.8 Mpc. Interestingly, allthese dwarfs apart from 16X lie outside the shared H i envelopeof the HCG 16 giants. This might suggest that the gas originatedin the individual giants and was released through interactions.The galaxies are listed in order of decreasing brightness inTable 4, derived from ZM98 photometry in the B-band (exceptthe dC97 objects, where dC97 B-band brightness is listed). We
14

The Astrophysical Journal, 770:114 (18pp), 2013 June 20 Konstantopoulos et al.
Table 4Galaxies at Accordant Redshifts with HCGs 16 and 22
ID Coordinates Brightness vR dBC Morphology
(h m s) (◦ ′ ′′) (mag) (km s−1) (kpc)
HCG 16
X NGC 848 02 10 17.6 −10 19 17.0 13.60 3989 0.23 SBab pecE APMUKS(BJ) B020413.18-104749.8 02 06 38.8 −10 33 23.2 15.56 3830 0.41 · · ·F KUG 0205-104 02 08 17.5 −10 14 21.0 15.78 3869 0.28 · · ·G KUG 0208-103 02 11 21.6 −10 07 16.3 15.89 3846 0.41 · · ·H KUG 0206-105 02 09 06.0 −10 19 13.0 16.35 3971 0.18 ScI KUG 0206-099A 02 09 05.2 −09 42 01.4 16.77 3830 0.41 · · ·J hcg 16–10 02 08 36.8 −09 56 16.6 17.52 4000 0.18 · · ·K SDSS J020836.69-095615.7 02 08 36.7 −09 56 15.8 17.63 4025 0.28 · · ·L SDSS J020919.31-095202.0 02 09 19.3 −09 52 03.3 19.79 3847 0.25 S
HCG 22
F NGC 1209 03 06 03.1 −15 36 41.8 12.84 2690 0.38 E6?G NGC 1188 03 03 43.4 −15 29 04.5 14.12 2698 0.09 SAB0H NGC 1231 03 06 29.3 −15 34 08.4 14.32 2424 0.45 Sc− APMUKS(BJ) B030149.90-153401.7 03 04 10.4 −15 22 22.1 16.55 2991 0.19 · · ·I APMUKS(BJ) B030008.22-151549.8 03 02 29.0 −15 04 05.8 17.19 2743 0.37 · · ·J APMUKS(BJ) B025842.23-155916.7 03 01 02.4 −15 47 27.7 17.29 2913 0.38 · · ·
Notes. Coordinates and radial velocities are drawn from previously unpublished catalogs related to Zabludoff & Mulchaey (1998), apart from: hcg16–10 (de Carvalho et al. 1997; coordinates converted from B1950 to J2000); 16G, I, K, and L (York et al. 2000). We quote SDSS g-band magnitudesfor HCG 16 member galaxies, with the exception of hcg 16–10, which is a B magnitude from de Carvalho et al. (1997). HCG 22 values are POSSphotographic magnitudes (Reid & Djorgovski 1993). dBC is the distance of a dwarf from the group barycenter. The morphologies of some galaxies notin the New General Catalogue were drawn from the catalogs related to Zabludoff & Mulchaey (1998). The majority were not classified, owing to thelimitation of available imaging. In the case of NGC galaxies we refer to de Vaucouleurs et al. (1991).
use the Hickson (1982) naming convention to assign lettersto these galaxies from E to L (assuming completeness to thefaintest member). Incorporating the velocities of these nineobjects increases the dynamical mass of the group by a factorof ≈4.
5.3.2. HCG 22
In HCG 22 the situation is similar, with five members and oneassociate, which we draw from the ZM98 tables. We employ theHickson (1982) lettering scheme for members only. It should benoted here that the dispersion is derived from three velocities,therefore the membership of this galaxy is difficult to assess.The inclusion of just members, or all dwarfs (i.e., members andthe one associate) increase the Mdyn by a factor of 30 or 50,respectively.
5.3.3. HCG 42
The third group, HCG 42, presents an altogether differentimage, with a large number of member and associate galaxiesspread out widely in three dimensions. We consider 34 dwarfsfrom ZM00, 8 from Carrasco et al. (2006), 2 from dC97, and 1from our Hydra redshift survey (see Table 5). These are split into35 associates and 17 members in a relatively small projectedarea of 1 Mpc2. Interestingly, the phase-space distribution ofFigure 13 (right) places the four giant galaxies at the top endof the bright galaxy σ distribution—recall that the Carrascoet al. (2006) systems, marked as green boxes, are fainter thanthe rest. With virtually all other associates at lower redshifts,this could imply that HCG 42 is part of a larger structurethat may extend to the foreground. The substructure echoesthe theoretical prediction of McConnachie et al. (2009) andobservational assessment of Mendel et al. (2011) who find that∼50% of all CGs are embedded in larger structures.
In any case, HCG 42 shows not only a rich population, butalso a far more complex structure than any of the five dwarf
galaxy systems we have studied (those in this paper and previousworks on HCGs 7 and 59; Konstantopoulos et al. 2010, 2012).The redshifts of sources plotted in Figure 13 are arranged in acontinuous distribution, lending support to the interpretation thatHCG 42 is a subset of a larger grouping. This might explain theextreme brightness of 42A, which is more akin to that of a brightcluster galaxy (cf. the optical brightness of M87). In addition,including all associates in an Mdyn calculation increases the massby five orders of magnitude, which confirms their associationnot with HCG 42, but the larger collection of galaxies to whichHCG 42 itself belongs. The inclusion of members only, however,leads to a physically plausible 20 fold increase. This follows onthe previous finding of Rood & Struble (1994) that HCG 42is associated with the NGC 3091 group (LGG 186 in Garcia1993). It was noted as an “intermediate group” by de Carvalhoet al. (1994).
In all, the analysis presented in this section calls for moredetailed studies of the extended membership of CGs and similaraggregates. A study of morphological types is essential in thiscontext, to relate groups to clusters and groupings of variousdensities. In this work, morphological typing was only possiblefor the few galaxies covered in our LCO imaging. Our resultsmight also call for a refinement of the Hickson definition ofCGs, given how unstable the routinely employed metrics are tothe expansion of group membership.
6. SUMMARY
We have presented a multi-wavelength study of the giant anddwarf galaxies that comprise HCGs 16, 22, and 42. Our resultscan be summarized in three categories.
1. Morphological characteristics and indications of past dy-namical events. Starting with an examination of large-scalemorphology, we found a number of noteworthy traits among
15

The Astrophysical Journal, 770:114 (18pp), 2013 June 20 Konstantopoulos et al.
Table 5Galaxies at Accordant Redshifts with HCG 42
ID Coordinates Brightness vR dBC Morphology
(h m s) (◦ ′ ′′) (mag) (km s−1) (kpc)
[ZM00] 0003 10 00 43.3 −20 22 03.6 13.60 3977 0.70 · · ·[ZM00] 0005 09 59 29.0 −19 29 30.7 14.07 3853 0.69 · · ·[ZM00] 0015 10 01 48.3 −19 56 29.7 14.64 4081 0.49 · · ·[ZM00] 0017 09 58 06.3 −19 13 49.6 14.75 4049 0.85 · · ·[ZM00] 0022 10 00 28.2 −19 40 15.9 15.04 3879 0.76 SB0[ZM00] 0029 10 00 38.1 −19 45 40.0 15.30 3766 0.16 dE0N[ZM00] 0033 10 02 04.8 −18 57 22.6 15.57 4212 0.51 · · ·[ZM00] 0034 10 01 00.3 −19 45 12.5 15.67 3980 0.25 S0[ZM00] 0041 09 57 16.1 −19 07 56.1 15.83 3891 0.17 · · ·[ZM00] 0046 09 59 36.9 −19 40 42.7 16.02 4020 0.93 dE[ZM00] 0057 10 02 54.7 −20 04 52.1 16.22 3938 0.67 · · ·[ZM00] 0058 09 58 54.4 −20 12 34.0 16.28 3846 0.82 · · ·[ZM00] 0065 10 01 55.8 −20 08 05.0 16.43 3908 0.85 · · ·[ZM00] 0106 10 00 04.6 −19 36 55.4 16.88 3876 0.23 dE[ZM00] 0143 09 58 23.1 −19 42 19.9 17.23 4287 0.51 S. . ./Irr[ZM00] 0154 10 01 49.9 −19 56 32.0 17.30 3924 0.05 · · ·[ZM00] 0166 09 57 53.7 −19 03 45.0 17.36 3828 0.06 S
[ZM00] 0002 09 57 23.9 −19 21 16.9 12.99 3675 0.07 dE0N[ZM00] 0006 10 01 31.2 −19 32 22.3 14.13 4587 0.05 · · ·[ZM00] 0009 10 00 31.5 −19 11 30.7 14.42 3675 0.36 · · ·[ZM00] 0013 10 01 09.1 −19 26 29.1 14.51 3442 0.69 SBd[ZM00] 0014 09 59 13.9 −19 51 07.8 14.59 3526 0.80 S0[ZM00] 0016 09 57 38.8 −19 30 14.1 14.67 3424 0.47 · · ·[ZM00] 0019 10 01 32.4 −20 23 00.0 14.82 3504 0.31 SBab[ZM00] 0021 09 58 53.1 −19 42 19.1 14.85 3621 0.30 · · ·[ZM00] 0023 10 01 31.4 −20 02 34.9 15.04 3732 0.15 · · ·[ZM00] 0026 09 57 51.8 −19 20 18.9 15.27 3402 0.21 · · ·[ZM00] 0028 09 59 18.7 −19 28 22.6 15.29 3636 0.35 · · ·[ZM00] 0055 09 59 38.5 −18 55 14.3 16.18 3661 0.69 Sbc[ZM00] 0059 10 00 37.7 −19 32 54.7 16.30 3434 0.76 · · ·[ZM00] 0069 10 00 25.0 −19 34 59.4 16.45 3647 0.13 · · ·[ZM00] 0085 09 59 26.5 −19 38 57.4 16.69 3538 0.34 Sb[ZM00] 0094 09 59 44.2 −19 41 10.9 16.78 3613 0.53 · · ·[ZM00] 0136 10 00 03.5 −19 38 24.5 17.14 3748 0.84 ScHydra 0030 10 00 58.0 −19 37 44.3 19.14 3571 0.18 · · ·[C06] 2190 09 59 28.5 −19 43 53.0 18.56 4768 0.34 · · ·[C06] 1089 09 59 27.1 −19 45 16.0 18.69 3614 0.27 · · ·[C06] 0694 10 00 06.4 −19 32 49.0 18.69 5017 0.24 · · ·[C06] 2123 10 00 39.6 −19 27 15.0 19.75 5128 0.23 · · ·[C06] 1345 09 59 18.6 −19 24 38.0 19.81 4509 0.23 · · ·[C06] 2234 09 59 22.7 −19 30 29.0 20.25 3366 0.10 · · ·[C06] 0760 10 01 05.4 −19 33 04.0 20.27 5152 0.22 · · ·[C06] 1869 09 59 40.8 −19 27 57.0 20.70 4846 0.23 · · ·
Notes. Top tier: members, bottom: associates. ZM00 and C06 list the R and V bands, respectively. Hydra 0030photometry is in the R band. Morphologies from de Vaucouleurs et al. (1991), apart from [ZM00] 0046 and[ZM00] 0106, characterized using our LCO images.
11 giant galaxies. HCG 16B is lopsided, perhaps as a re-sult of a recent interaction with 16A. Galaxies 16C and16D present irregular morphologies from the ultraviolet tothe infrared. HCG 16D is known to exhibit X-ray emissionconsistent with the Hα emission detected by Werk et al.(2010) in the form of a supergalactic wind (Rich et al. 2010;Vogt et al. 2013). The “secondary nuclei” reported by deCarvalho & Coziol (1999) are likely to be agglomerates ofstar clusters whose light was blended by the 1.′′5 seeing.
Within the large H i envelope of HCG 16 we also finda tidal tail, extending to the east of 16A. While ourinterpretation needs to be confirmed with deeper imaging,this feature presents a good opportunity to study a debris
feature at the end of its optically detectable phase. Wefind a hint of ongoing star formation at the tip of the tail,while the rest of the feature appears to host a �1 Gyrold stellar population. The existing data do not allow usto discern between different evolutionary scenarios—oldstars stripped in an interaction versus in-situ star formationa long time ago.
All three galaxies in HCG 22 display interesting traits:the equatorial dust ring in 22A and the network of lowsurface brightness features around 22B are consistent withrecent merger or infall events, while the bright central barand extremely faint, loose network of spiral arms of 22Crepresent the only sites of star formation in the system—and
16

The Astrophysical Journal, 770:114 (18pp), 2013 June 20 Konstantopoulos et al.
also where all the H i is situated. The galaxies of HCG 42do not display any diversions from quiescence.
2. Star cluster populations and star formation histories. Theevolutionary sequence mapped out by the three CGs interms of gas richness is reflected in the star clusters.The color distribution of the cluster populations portray a“young” HCG 16 that has yet to develop a large GC popu-lation, as opposed to “old” HCG 42, where the bimodal GCpopulation accounts for the majority of detected sources.There is a distinct lack of young clusters here (<1 Gyr),which temporally marks the quenching of star formation inHCG 42. In between the two groups is HCG 22, which hostsa very unusual stellar population, dominated by clusters ofintermediate age. This reveals that the bulk of star formationactivity happened over the past few Gyr, with little recentactivity, practically none outside the spiral arms of 22C. Toour knowledge, no individual galaxy or grouping has beenfound to host such a markedly intermediate-age popula-tion. This is an observer bias introduced by the preferentialstudy of the young cluster populations of either mergersand highly star-forming systems, or the GC populations ofearly-type galaxies. From their morphologies, we proposethat galaxies 22A and 22B are recent merger remnants. Thestar cluster populations are consistent with this scenario.
The above provides a good demonstration of the utilityof star clusters as chronometers for past star formationevents. Any epoch at which a galaxy exhibits a significantSFR will be recorded by the star clusters, and bursts willregister as “bumps” along the model track (see the analysisof Stephan’s Quintet by Fedotov et al. 2011). Equallyimportant is the dearth or absence of clusters in certainparts of color space, indicating a low or zero SFR, suchas HCG 42. This provides an estimate of the time when asystem entered a mode of galaxy evolution where no moregas is being converted to stars. At this stage, any gas in theIGM can only be redistributed or heated.
3. Dwarf galaxy membership and implications. The infor-mation on dwarf galaxies collected in this study orig-inates from a variety of sources, however, all utilizedcatalogs are complete to R 18 mag, or MR =[−15.5,−14.7,−15.9] mag. This gives us the opportunityto study the bright end of the dwarf galaxy luminosity func-tion and place the three groups in the context of the distinc-tion between isolated and embedded groups (McConnachieet al. 2009; Mendel et al. 2011). HCGs 16 displays a moreor less symmetric spatial distribution of dwarfs, albeit allbut one (HCG 16X) lie outside the H i envelope shared bythe giants. This might indicate that the gas was releasedthrough interactions between the giants. The phase-spacediagram of HCG 42 places it at the end of a filament or othercomplex velocity structure made of ≈50 dwarf galaxies.
We made two cuts in velocity space, at 3σ and 10σ , to sortbetween members and “associates.” This way we were ableto test the applicability of the velocity dispersion, designedto characterize populous galaxy clusters, in studying smallgroups. In other words, what is the meaning of a velocitydispersion derived from only four galaxies? This questionis especially relevant seeing as CGs are not necessarilyexpected to be dynamically relaxed.
Indeed, the inclusion of all “associate” dwarf galaxyvelocities gives rise to a tremendous change in the inferreddynamical properties of the three groups. The dynamicalmasses (Mdyn, which are only truly appropriate for virialized
systems) increase by factors of 4, 50, and a gargantuan 105
for HCGS 16, 22, and 42. In contrast, including only high-confidence members (the 3σ cut) only increases the Mdynby a factor of ∼10 for all three groups. This indicates that,although flawed from a statistical perspective, the velocitydispersion of the group core might provide a reliable metric.More groups need to be studied in order to ascertain thiseventuality.
Another way to examine this effect of dwarfs on the Mdynderivation is in terms of the hierarchy in which a groupis found. While the isolated HCGs 16 and 22 are mildlyaffected by the inclusion of dwarfs and associates, thederivation of Mdyn breaks down for embedded HCG 42.In all, we find that updating the velocity dispersion throughthe careful inclusion of high-confidence dwarf membersvastly upgrades its value by making it a statistically viablemetric.
We thank the anonymous referee for the enthusiastic receptionof our work and for suggestions that improved the manuscript.Funding was provided at PSU by the National Science Foun-dation under award AST-0908984. Support for this work wasprovided by NASA through grant No. HST-GO-10787.15-Afrom the Space Telescope Science Institute which is operatedby AURA, Inc., under NASA contract NAS 5-26555. K.F. andS.C.G. thank the Natural Science and Engineering ResearchCouncil of Canada and the Ontario Early Researcher AwardProgram for support. This paper makes use of publicly avail-able SDSS imaging and spectroscopy. Funding for the creationand distribution of the SDSS Archive has been provided bythe Alfred P. Sloan Foundation, the Participating Institutions,the National Aeronautics and Space Administration, the Na-tional Science Foundation, the U.S. Department of Energy, theJapanese Monbukagakusho, and the Max Planck Society. TheSDSS Web site is http://www.sdss.org/. The SDSS is managedby the Astrophysical Research Consortium (ARC) for the Partic-ipating Institutions. The Participating Institutions are The Uni-versity of Chicago, Fermilab, the Institute for Advanced Study,the Japan Participation Group, The Johns Hopkins University,Los Alamos National Laboratory, the Max-Planck-Institute forAstronomy (MPIA), the Max-Planck-Institute for Astrophysics(MPA), New Mexico State University, Princeton University, theUnited States Naval Observatory, and the University of Wash-ington. This research has made use of the NASA/IPAC Extra-galactic Database (NED) which is operated by the Jet PropulsionLaboratory, California Institute of Technology, under contractwith the National Aeronautics and Space Administration.
REFERENCES
Ashman, K. M., Bird, C. M., & Zepf, S. E. 1994, AJ, 108, 2348Bahcall, N. A., Harris, D. E., & Rood, H. J. 1984, ApJL, 284, L29Barkhouse, W. A., West, M. J., & Bothun, G. D. 2001, ApJ, 562, 679Barton, E., Geller, M., Ramella, M., Marzke, R. O., & da Costa, L. N. 1996, AJ,
112, 871Bastian, N., Trancho, G., Konstantopoulos, I. S., & Miller, B. W. 2009, ApJ,
701, 607Belsole, E., Sauvageot, J.-L., Ponman, T. J., & Bourdin, H. 2003, A&A, 398, 1Bitsakis, T., Charmandaris, V., da Cunha, E., et al. 2011, A&A, 533, A142Borthakur, S., Yun, M. S., & Verdes-Montenegro, L. 2010, ApJ, 710, 385Bournaud, F. 2010, in Proc. ASP Conf. Ser. Vol. 423, Galaxy Wars: Stellar
Populations and Star Formation in Interacting Galaxies, ed. B. Smith, N.Bastian, S. J. U. Higdon, & J. L. Higdon (San Francisco, CA: ASP), 177
Brodie, J. P., & Strader, J. 2006, ARA&A, 44, 193Carrasco, E. R., Mendes de Oliveira, C., & Infante, L. 2006, AJ, 132, 1796Cluver, M. E., Appleton, P. N., Ogle, P., et al. 2013, ApJ, 765, 93
17

The Astrophysical Journal, 770:114 (18pp), 2013 June 20 Konstantopoulos et al.
Da Rocha, C., & Mendes de Oliveira, C. 2005, MNRAS, 364, 1069Da Rocha, C., Mendes de Oliveira, C., Bolte, M., Ziegler, B. L., & Puzia, T. H.
2002, AJ, 123, 690Da Rocha, C., Mieske, S., Georgiev, I. Y., et al. 2011, A&A, 525, A86de Carvalho, R. R., & Coziol, R. 1999, AJ, 117, 1657de Carvalho, R. R., Ribeiro, A. L. B., Capelato, H. V., & Zepf, S. E. 1997, ApJS,
110, 1de Carvalho, R. R., Ribeiro, A. L. B., & Zepf, S. E. 1994, ApJS, 93, 47de Vaucouleurs, G., de Vaucouleurs, A., Corwin, H. G., Jr., et al. 1991, Third
Reference Catalogue of Bright Galaxies (New York: Springer)Desjardins, T. D., Gallagher, S. C., Tzanavaris, P., et al. 2013, ApJ, 763, 121Dolphin, A. E. 2000, PASP, 112, 1397Doyle, M. T., Drinkwater, M. J., Rohde, D. J., et al. 2005, MNRAS, 361, 34Emsellem, E., Cappellari, M., Krajnovic, D., et al. 2011, MNRAS, 414, 888Evans, I. N., Primini, F. A., Glotfelty, K. J., et al. 2010, ApJS, 189, 37Fedotov, K., Gallagher, S. C., Konstantopoulos, I. S., et al. 2011, AJ, 142, 42Gallagher, J. S., III, & Parker, A. 2010, ApJ, 722, 1962Gallagher, S. C., Durrell, P. R., Elmegreen, D. M., et al. 2010, AJ, 139, 545Gallagher, S. C., Johnson, K. E., Hornschemeier, A. E., Charlton, J. C., &
Hibbard, J. E. 2008, ApJ, 673, 730Garcia, A. M. 1993, A&AS, 100, 47Harris, W. E., Whitmore, B. C., Karakla, D., et al. 2006, ApJ, 636, 90Hibbard, J. E., Guhathakurta, P., van Gorkom, J. H., & Schweizer, F. 1994, AJ,
107, 67Hibbard, J. E., & van Gorkom, J. H. 1996, AJ, 111, 655Hibbard, J. E., van Gorkom, J. H., Rupen, M. P., & Schiminovich, D. 2001, in
ASP Conf. Ser. 240, Gas and Galaxy Evolution, ed. J. E. Hibbard, M. Rupen,& J. H. van Gorkom (San Francisco, CA: ASP), 657
Hickson, P. 1982, ApJ, 255, 382Hickson, P., Kindl, E., & Auman, J. R. 1989, ApJS, 70, 687Hickson, P., Mendes de Oliveira, C., Huchra, J. P., & Palumbo, G. G. 1992, ApJ,
399, 353Huchtmeier, W. K. 1994, A&A, 286, 389Hunsberger, S. D., Charlton, J. C., & Zaritsky, D. 1998, ApJ, 505, 536Jeltema, T. E., Binder, B., & Mulchaey, J. S. 2008, ApJ, 679, 1162Johnson, K. E., Hibbard, J. E., Gallagher, S. C., et al. 2007, AJ, 134, 1522Jordan, A., McLaughlin, D. E., Cote, P., et al. 2007, ApJS, 171, 101Knierman, K. A., Gallagher, S. C., Charlton, J. C., et al. 2003, AJ, 126, 1227Konstantopoulos, I. S., Bastian, N., Smith, L. J., et al. 2009, ApJ, 701, 1015Konstantopoulos, I. S., Fedotov, K., Gallagher, S. C., et al. 2011, in Stellar
Clusters & Associations: A RIA Workshop on Gaia, ed. E. J. Navarro, A. T.Gallego Calvente, & M. R. Zapatero Osorio, 133
Konstantopoulos, I. S., Gallagher, S. C., Fedotov, K., et al. 2010, ApJ,723, 197
Konstantopoulos, I. S., Gallagher, S. C., Fedotov, K., et al. 2012, ApJ, 745, 30Konstantopoulos, I. S., Smith, L. J., Adamo, A., et al. 2013, AJ, 145, 137Koribalski, B., & Manthey, E. 2005, MNRAS, 358, 202Larsen, S. S. 1999, A&AS, 139, 393Marigo, P., Girardi, L., Bressan, A., et al. 2008, A&A, 482, 883McConnachie, A. W., Ellison, S. L., & Patton, D. R. 2008, MNRAS, 387, 1281McConnachie, A. W., Patton, D. R., Ellison, S. L., & Simard, L. 2009, MNRAS,
395, 255
Mendel, J. T., Ellison, S. L., Simard, L., Patton, D. R., & McConnachie, A. W.2011, MNRAS, 418, 1409
Meurer, G. R., Hanish, D. J., Ferguson, H. C., et al. 2006, ApJS, 165, 307Mobasher, B., Colless, M., Carter, D., et al. 2003, ApJ, 587, 605Monnier Ragaigne, D., van Driel, W., Schneider, S. E., Balkowski, C., & Jarrett,
T. H. 2003, A&A, 408, 465Mullan, B., Konstantopoulos, I. S., Kepley, A. A., et al. 2011, ApJ, 731, 93Palma, C., Zonak, S. G., Hunsberger, S. D., et al. 2002, AJ, 124, 2425Paturel, G., Theureau, G., Bottinelli, L., et al. 2003, A&A, 412, 57Peng, E. W., Jordan, A., Cote, P., et al. 2006, ApJ, 639, 95Ponman, T. J., Cannon, D. B., & Navarro, J. F. 1999, Natur, 397, 135Poole, T. S., Breeveld, A. A., Page, M. J., et al. 2008, MNRAS, 383, 627Price, R. M., Babic, B., & Jones, K. 2000, in ASP Conf. Ser. 209, IAU Colloq.
174: Small Galaxy Groups, ed. M. J. Valtonen & C. Flynn (San Francisco,CA: ASP), 163
Reid, N., & Djorgovski, S. 1993, in ASP Conf. Ser. 43, Sky Surveys. Protostarsto Protogalaxies, ed. B. T. Soifer (San Francisco, CA: ASP), 125
Ribeiro, A. L. B., de Carvalho, R. R., Coziol, R., Capelato, H. V., & Zepf, S. E.1996, ApJL, 463, L5
Rich, J. A., Dopita, M. A., Kewley, L. J., & Rupke, D. S. N. 2010, ApJ,721, 505
Rood, H. J., & Struble, M. F. 1994, PASP, 106, 413Schweizer, F. 2004, in ASP Conf. Ser. 322, The Formation and Evolution of
Massive Young Star Clusters, ed. H. J. G. L. M. Lamers, L. J. Smith, & A.Nota (San Francisco, CA: ASP), 111
Silva, L., Granato, G. L., Bressan, A., & Danese, L. 1998, ApJ, 509, 103Sirianni, M., Jee, M. J., Benıtez, N., et al. 2005, PASP, 117, 1049Skrutskie, M. F., Cutri, R. M., Stiening, R., et al. 2006, AJ, 131, 1163Sparks, W. B., Wall, J. V., Thorne, D. J., et al. 1985, MNRAS, 217, 87Sulentic, J. W., Pietsch, W., & Arp, H. 1995, A&A, 298, 420Torres-Flores, S., Mendes de Oliveira, C., de Mello, D. F., et al. 2009, A&A,
507, 723Trancho, G., Bastian, N., Schweizer, F., & Miller, B. W. 2007, ApJ, 658, 993Trancho, G., Konstantopoulos, I. S., Bastian, N., et al. 2012, ApJ, 748, 102Turner, M. J. L., Reeves, J. N., Ponman, T. J., et al. 2001, A&A, 365, L110Tzanavaris, P., Hornschemeier, A. E., Gallagher, S. C., et al. 2010, ApJ,
716, 556Verdes-Montenegro, L., Yun, M. S., Williams, B. A., et al. 2001, A&A,
377, 812Vogt, F. P. A., Dopita, M. A., & Kewley, L. J. 2013, ApJ, 768, 151Walker, L. M., Johnson, K. E., Gallagher, S. C., et al. 2010, AJ, 140, 1254Walker, L. M., Johnson, K. E., Gallagher, S. C., et al. 2012, AJ, 143, 69Werk, J. K., Putman, M. E., Meurer, G. R., et al. 2008, ApJ, 678, 888Werk, J. K., Putman, M. E., Meurer, G. R., et al. 2010, AJ, 139, 279White, P. M., Bothun, G., Guerrero, M. A., West, M. J., & Barkhouse, W. A.
2003, ApJ, 585, 739York, D. G., Adelman, J., Anderson, J. E., Jr., et al. 2000, AJ, 120, 1579Yun, M. S., Ho, P. T. P., & Lo, K. Y. 1994, Natur, 372, 530Zabludoff, A. I., & Mulchaey, J. S. 1998, ApJ, 496, 39Zabludoff, A. I., & Mulchaey, J. S. 2000, ApJ, 539, 136Zackrisson, E., Rydberg, C.-E., Schaerer, D., Ostlin, G., & Tuli, M. 2011, ApJ,
740, 13
18