Embed Size (px)
Citation preview
Steel Market Outlook
AM/NS Calvert
Outline
• Economic indicators
• Key steel consuming markets
• Steel consumption trends
• Global steel outlook and raw materials
• CO2 regulations and the steel industry
• Questions
1

2
U.S. Gross Domestic Product (GDP) Real GDP Growth vs. Prior Years 2000-2015, Forecast 2016-2017 Source: U.S. Department of Commerce; IHS November 2016
4.1%
1.0%
1.8%
2.8%
3.8% 3.3%
2.7%
1.8%
-0.3%
-2.8%
2.5%
1.6%
2.2%
1.7%
2.4% 2.4%
1.5%
2.2%
-4.0%
-3.0%
-2.0%
-1.0%
0.0%
1.0%
2.0%
3.0%
4.0%
5.0%
2000
2001
2002
2003
2004
2005
2006
2007
2008
2009
2010
2011
2012
2013
2014
2015
2016
2017
% A
nn
ual
GD
P G
row
th
Real GDP growth has fallen below 2% in each of the last three quarters, measuring 0.9% in Q415, 0.8% in
1Q16 and 1.2% in 2Q16 (advance estimate). Growth in PCE climbed to 4.2% in 2Q16 from 1.6% in 1Q16,
while nonresidential fixed investment growth was negative for the 3rd consecutive quarter as investment fell
in nonresidential structures (-7.9%) and equipment (-3.5%).
2017 full year GDP growth is forecast at 2.2% with growth driven largely by the same sectors as in 2016,
though nonresidential fixed investment and industrial production are expected to make larger contributions,
improving upon their 2016 softness.

3
Industrial Production Index (IP) Percent Change in Index vs. Prior Years 2000-2015, Forecast 2016-2017
Source: U.S. Federal Reserve Board; base year for index 2012: November IHS forecasts.
4.0%
-3.3%
0.2%
1.3%
2.3% 3.2%
2.2% 2.7%
-3.5%
-11.4%
5.7%
3.0% 2.8% 1.9%
3.7%
1.3%
-1.1%
1.1%
-12.0%
-10.0%
-8.0%
-6.0%
-4.0%
-2.0%
0.0%
2.0%
4.0%
6.0%
200
0
200
1
200
2
200
3
200
4
200
5
200
6
200
7
200
8
20
09
201
0
201
1
201
2
201
3
201
4
201
5
201
6
201
7%
An
nu
al
Gro
wth
IP declined by 1.0% in 2Q16, following a 1.8% drop in 1Q16. Mining (which includes crude oil and natural gas
production) declined significantly (-15.9%) during the period. Manufacturing output (NAICS basis) fell 0.8%.
The 2016 forecast for IP is negative as the mining sector will decline further, offsetting marginal gains posted in
manufacturing. Weak global conditions and prior appreciation of the U.S. dollar will limit exports.
IP is seen returning to growth in 2017 at 1.1% as headwinds slowly dissipate for the manufacturing and
upstream energy sectors.

Th
e A
rce
lorM
ittal O
rbit
Steel Consuming Markets

5
Automotive
• Pent-up demand from the recession is exhausted on the retail side of the market. Replacement is now the biggest driver of retail sales.
• The average age of vehicles on the road is now over 11.5 years. The fleet is old and needs to be replaced. This will maintain sales at a high level for the next several years.
• There is still some pent up demand left on the fleet side of the market. Fleet sales are now increasing as a percent of total sales.
• As the housing market improves demand for pickup trucks is improving.
• Low gasoline prices are also increasing demand for trucks.
• Trucks achieved record market share in 2015 at 57%. Through 2016 trucks are running at 61% market share.
• Although the rate of increase will slow as long as demographics & economics remain positive sales will continue to increase, unless there is a change in lifestyle and behavior. There is no peak in sales until we go into a recession.
Source: AM USA Marketing
15
12.6
8.5
11.8 13.1
15.4 16.1
16.9 17.5 17.9 18.1 18.3 18.5
2007 2008 2009 2010 2011 2012 2013 2014 2015 2016 2017 2018 2019
North America Auto Production
(millions of units)
16.1
13.2
10.4 11.6
12.7
14.4 15.6
16.4 17.4 17.3 17.5 17.7 17.9
2007 2008 2009 2010 2011 2012 2013 2014 2015 2016 2017 2018 2019
US Auto Sales (millions of units)

Building construction Some growth in private construction
• Economic conditions continue to support steady improvement in 2016, but not robust recovery.
• The residential construction recovery that began in 2012 should continue its momentum in 2016 & 2017 prompted by improving labor markets, demographics, affordability, and mortgage availability. Homeownership rates remain historically low; however, growth in multifamily construction is expected to slow in 2016.
• The non-residential construction sector weakened in 2015, however market fundamentals suggest return to modest growth across both commercial and institutional sectors in 2016 & 2017.
• Growth in the residential sector should continue to provide a catalyst for growth in several nonresidential segments in 2016 & 2017.
0
500,000
1,000,000
1,500,000
2,000,000
2,500,000
2007 2008 2009 2010 2011 2012 2013 2014 2015 2016
Sq
uare
fo
ota
ge (
00
0)
Residential (1 & 2 family dwellings)
Non-Residential
* Non-building structures (e.g. infrastructure) not included
6 Source: McGraw-Hill (Dodge)*
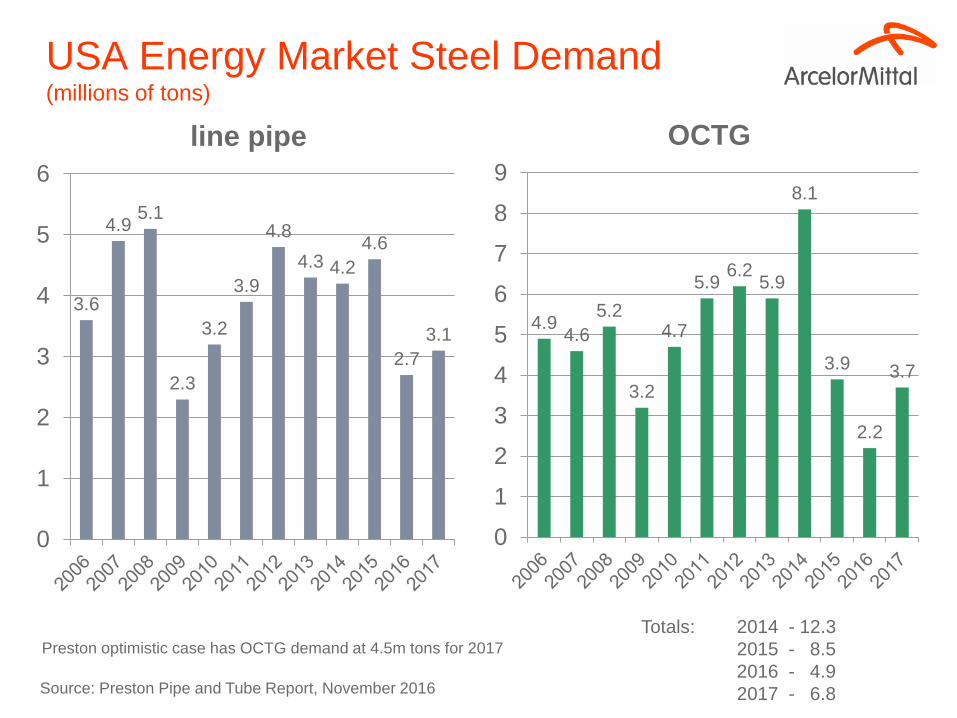
USA Energy Market Steel Demand (millions of tons)
3.6
4.9 5.1
2.3
3.2
3.9
4.8
4.3 4.2
4.6
2.7
3.1
0
1
2
3
4
5
6
line pipe
4.9 4.6
5.2
3.2
4.7
5.9 6.2
5.9
8.1
3.9
2.2
3.7
0
1
2
3
4
5
6
7
8
9
OCTG
Totals: 2014 - 12.3
2015 - 8.5
2016 - 4.9
2017 - 6.8 Source: Preston Pipe and Tube Report, November 2016
Preston optimistic case has OCTG demand at 4.5m tons for 2017
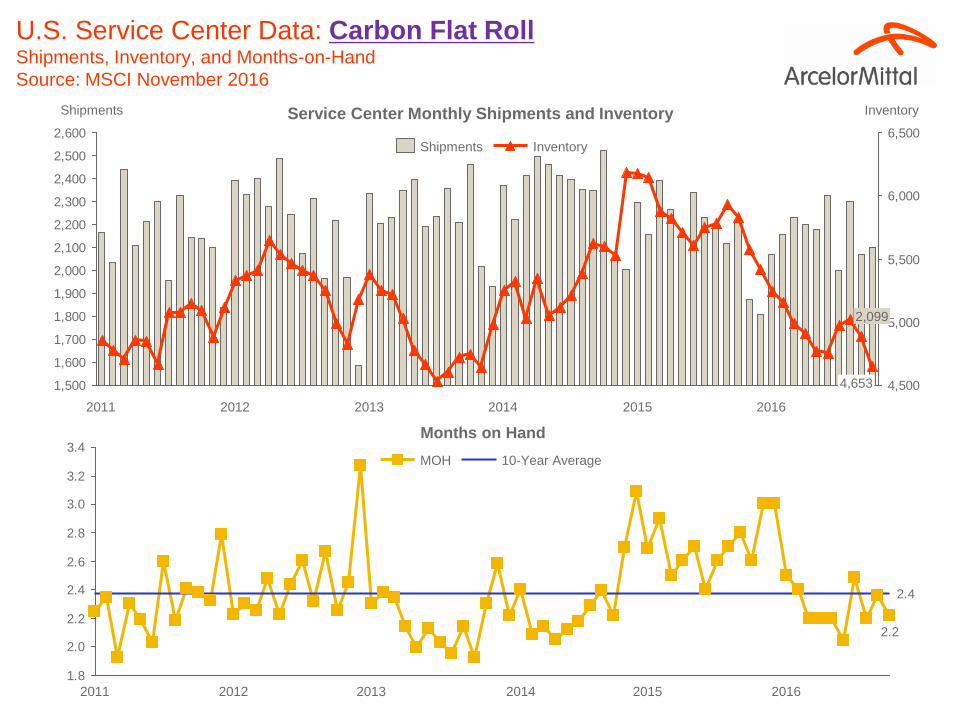
1,500
1,600
1,700
1,800
1,900
2,000
2,100
2,200
2,300
2,400
2,500
2,600
4,500
5,000
5,500
6,000
6,500
2016 2015 2014 2013 2012 2011
2,099
4,653
Inventory Shipments
Service Center Monthly Shipments and Inventory
2.2
2.4
1.8
2.0
2.2
2.4
2.6
2.8
3.0
3.2
3.4
2013 2012 2011 2016 2015 2014
MOH 10-Year Average
Months on Hand
U.S. Service Center Data: Carbon Flat Roll Shipments, Inventory, and Months-on-Hand
Source: MSCI November 2016
Shipments Inventory
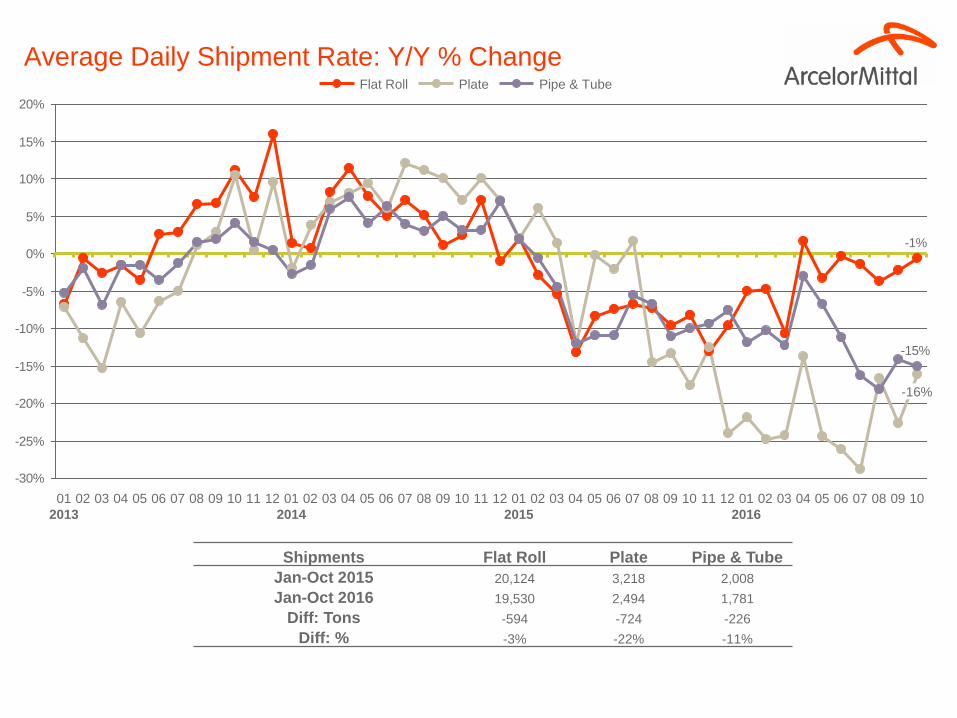
Average Daily Shipment Rate: Y/Y % Change
-1%
-15%
-30%
-25%
-20%
-15%
-10%
-5%
0%
5%
10%
15%
20%
03 11 01
2016
04 02 08 10 07 06 05 09 08 07 06 05 04 03 02 01
2014
12 11 10 09 10 09 08 07 06 05 04 03 02 01
2015
12 11 10 09 12
-16%
08 07 06 05 04 03 02 01
2013
Flat Roll Plate Pipe & Tube
Shipments Flat Roll Plate Pipe & Tube
Jan-Oct 2015 20,124 3,218 2,008
Jan-Oct 2016 19,530 2,494 1,781
Diff: Tons -594 -724 -226
Diff: % -3% -22% -11%
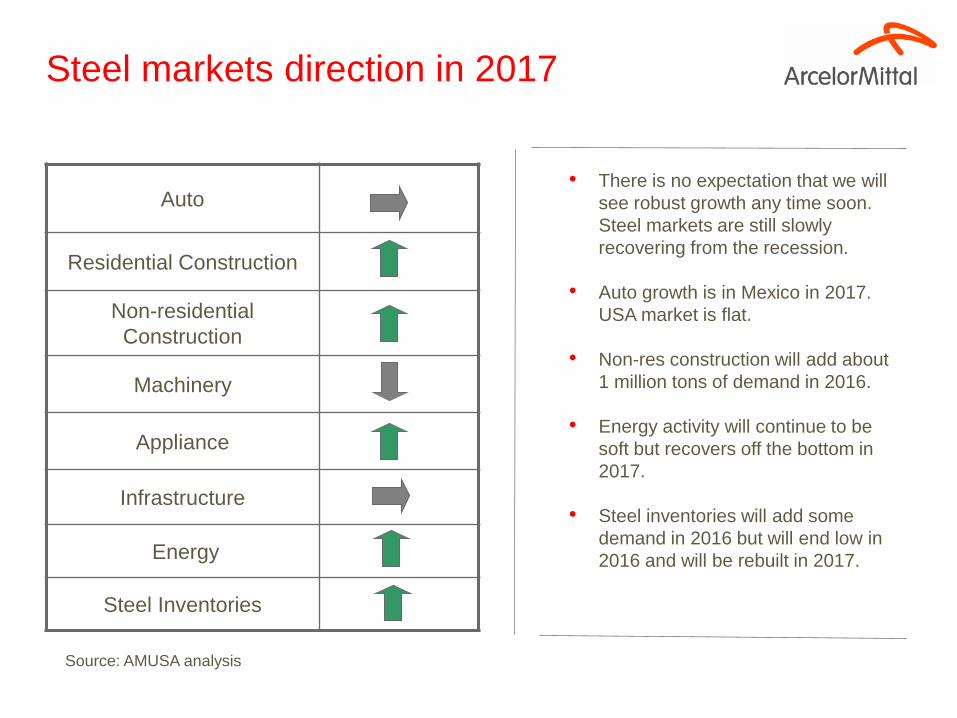
Steel markets direction in 2017
Auto
Residential Construction
Non-residential
Construction
Machinery
Appliance
Infrastructure
Energy
Steel Inventories
Source: AMUSA analysis
• There is no expectation that we will
see robust growth any time soon.
Steel markets are still slowly
recovering from the recession.
• Auto growth is in Mexico in 2017.
USA market is flat.
• Non-res construction will add about
1 million tons of demand in 2016.
• Energy activity will continue to be
soft but recovers off the bottom in
2017.
• Steel inventories will add some
demand in 2016 but will end low in
2016 and will be rebuilt in 2017.
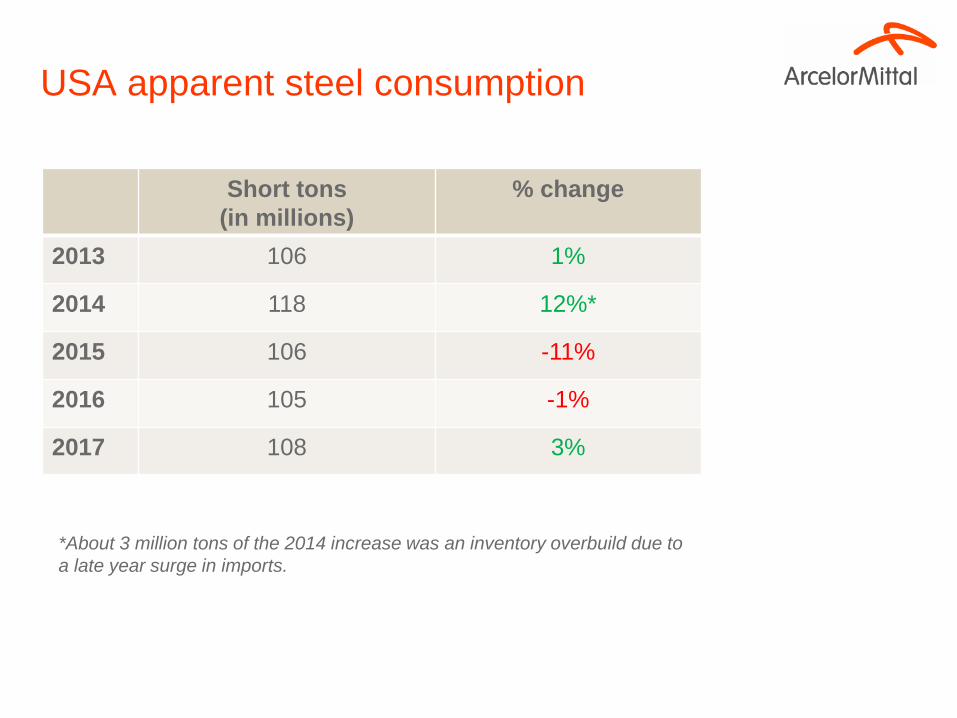
USA apparent steel consumption
Short tons
(in millions)
% change
2013 106 1%
2014 118 12%*
2015 106 -11%
2016 105 -1%
2017 108 3%
*About 3 million tons of the 2014 increase was an inventory overbuild due to
a late year surge in imports.

Th
e A
rce
lorM
ittal O
rbit
Steel Consumption Trends
& Global Markets

Weekly US raw steel production
Capacity utilization
40%
45%
50%
55%
60%
65%
70%
75%
80%
85%
90%
95%
100%
2015 2014 2013 2012 2011 2010
Weekly Utilization
Source: American Iron & Steel Institute
As of 11/19/2016:
67.7%
2016

USA Apparent Steel Consumption million of short tons
0
20
40
60
80
100
120
140
2000 2001 2002 2003 2004 2005 2006 2007 2008 2009 2010 2011 2012 2013 2014 2015 2016 2017
1953 – 22%
1957 – 22%
1973 – 23%
1981 – 27%
2009 – 41%
Drop in ASC in
select recessions
Source: AISI, AM Marketing

USA imports and shipments
15
Imports
market share
2015 Q1 - 34%
Q2 - 30%
Q3 - 27%
Q4 - 26%
2016 Q1 – 25%
Q2 – 23%
Q3 – 26%

Trade Cases
16
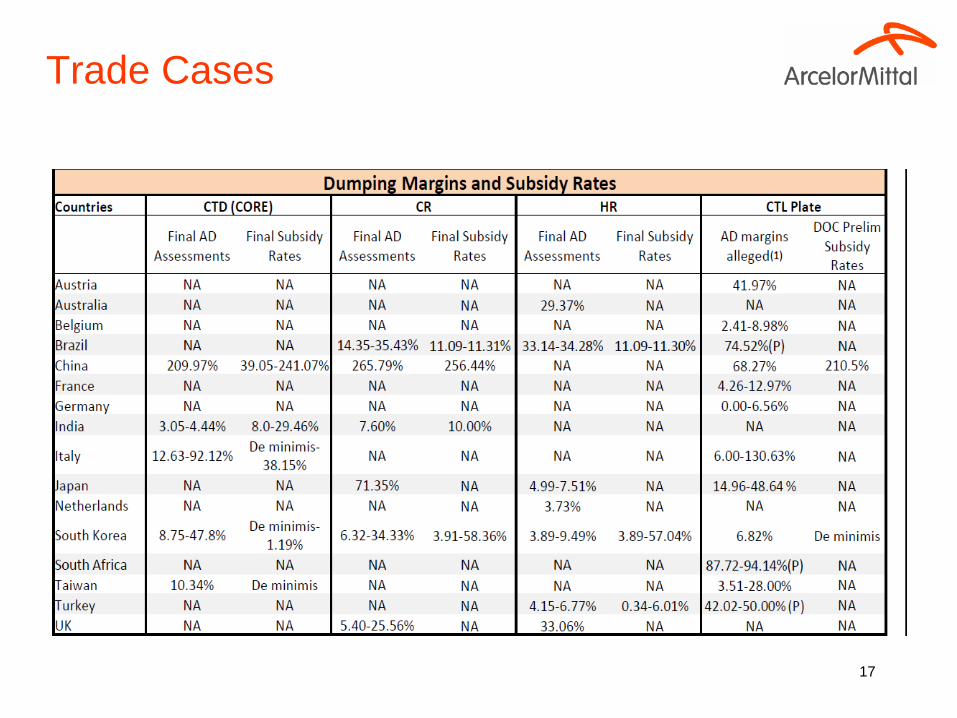
Trade Cases
17
Global Market Outlook & Raw Materials
AM/NS Calvert
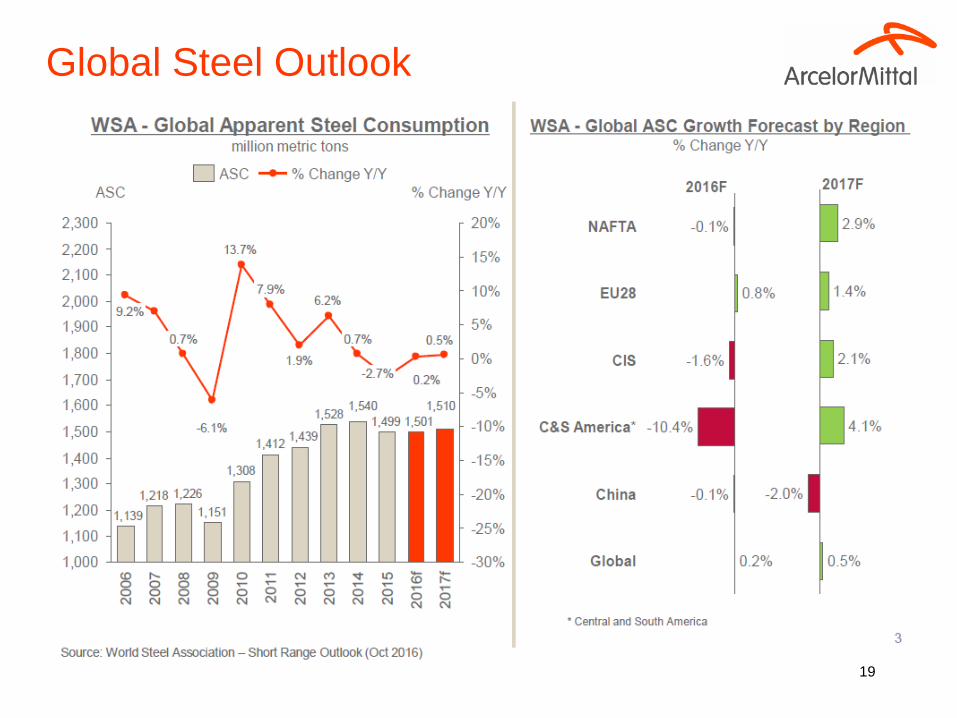
Global Steel Outlook
19

20
Steelmaking Raw Material Input Costs 2009-2015 Averages and November 2016
2009 – June 2012 = SBB, July 2012 - Present = Platts
All charts in $ per metric ton except for Scrap
$235$233$239
$392$403$416
$495
$428
$263
Nov’16 2015 2014 2013 2012 2011 2010 2009 2016
YTD
#1 Busheling Chicago Scrap AMM ($/GT) Platts IODEX 62%CFR China
Metallurgical Coke SBB/Platts Australian Hard Coking Coal CRU/SBB
$71
$56$56
$97
$135$130
$169
$147
$80
MTD
Nov ’16
2015 2014 2013 2012 2011 2010 2009 2016
YTD
$325
$175$145
$195
$258
$444$473$456
$408
MTD
Nov’16
2015 2014 2013 2012 2011 2010 2009 2016
YTD
$298
$127
$88$113
$147
$191
$294
$219
$145
MTD
Nov’16
2015 2014 2013 2012 2011 2010 2009 2016
YTD

Th
e A
rce
lorM
ittal O
rbit
CO2 regulations

Energy Efficiency
14
The industry has reduced energy intensity per ton of steel shipped by 31 percent and CO2 emissions by 36 percent
per ton of steel produced since 1990.
The Steel Industry Improved Its Energy Efficiency by 31% Since 1990
Source: American Iron and Steel Institute
0
2
4
6
8
10
12
14
16
18
1990 1995 2000 2001 2002 2003 2004 2005 2006 2007 2008 2009 2010 2011 2012 2013 2014
M B
TU
/To
n
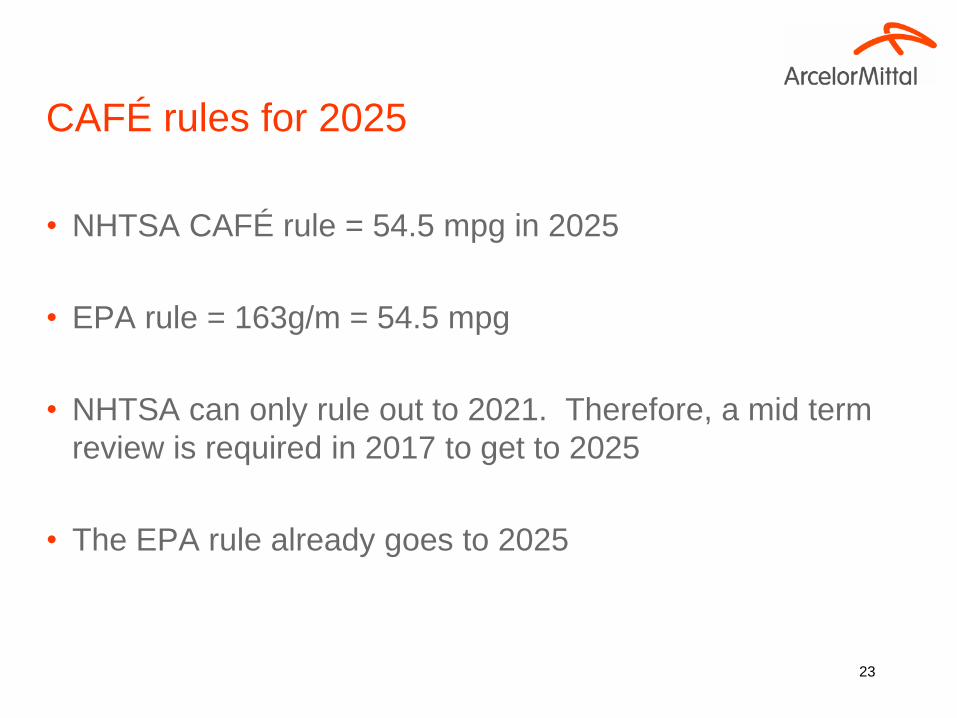
CAFÉ rules for 2025
• NHTSA CAFÉ rule = 54.5 mpg in 2025
• EPA rule = 163g/m = 54.5 mpg
• NHTSA can only rule out to 2021. Therefore, a mid term
review is required in 2017 to get to 2025
• The EPA rule already goes to 2025
23

24
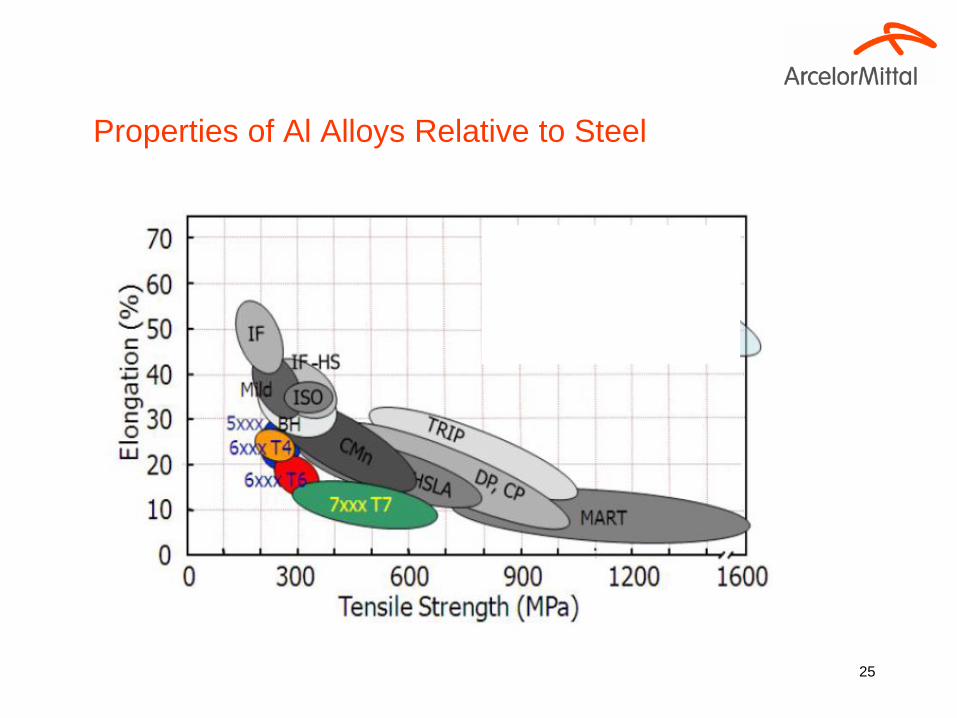
Properties of Al Alloys Relative to Steel
25
Mm
n

CO2 Emissions in Production Phase
26

Questions
27